Article

Integrating Multimodal User-Generated Content (UGC) for Spatial Analysis of Urban Tourism: A Behavior–Cognition–Affect Framework


School of Resources and Environmental Engineering, Wuhan University of Science and Technology, Wuhan 430065, China
*
Author to whom correspondence should be addressed.
Appl. Sci. 2026, 16(9), 4518; https://doi.org/10.3390/app16094518
Submission received: 24 March 2026 / Revised: 23 April 2026 / Accepted: 29 April 2026 / Published: 4 May 2026
(This article belongs to the Special Issue Emerging Spatial Analysis Methods in Geographic Information Systems)

Abstract

To accurately identify characteristics of the tourist experience, optimize tourism management and shape urban tourism brands, this study uses Wuhan as a case and aggregates multimodal user-generated content (UGC) data including tourist reviews, photos and travel vlogs. Based on the “Behavior–Cognition–Affect” framework and the progressive “Region–Route–Site” spatial perspective, this study adopts spatial analysis, image analysis, semantic network analysis, and natural language processing (NLP) to examine tourists’ spatial behavior patterns, visual cognitive preferences, and emotional feedback across urban, attraction, and individual tourist scales. Results show that Wuhan’s tourism presents a “core-periphery” spatial structure, tourists’ visual focus differs significantly across scenic types, and tourists’ emotions are generally positive, with consumption, shopping, and transportation as main negative sources. This study enriches the application of multimodal UGC in tourism geography, providing data to optimize tourism resource allocation and shape urban tourism images.

1. Introduction

With the rapid development of Internet technology and the widespread popularity of social media, profound changes have taken place in the way the public accesses and shares information. As a core product of the Web 2.0 era, user-generated content (UGC) has become one of the most dynamic components of the online information ecosystem [1,2]. Tourism geography has long focused on the spatial laws of tourism phenomena, human–environment relationships, and regional effects [3]. Although its traditional research, based on questionnaire surveys and macro statistical data, has accumulated substantial achievements in analyzing tourist flow characteristics and destination pictures [4], it still has certain limitations in capturing tourists’ micro-experiences and dynamic behaviors.
Early studies mainly used single-modal text reviews to examine destination image, emotions, and satisfaction [5,6,7,8]. For instance, Bai et al. analyzed destination image perception using online textual data [9], while Wang et al. verified the effectiveness of UGC in understanding destination pictures [10]. With increasingly diverse data types, multimodal UGC—including photos, short videos, and travel vlogs—has gained growing attention [11,12].
The “tourist gaze” concept proposed by Urry emphasizes that tourists construct destination perceptions through visual symbols [13]. Visual media convey emotions more intuitively and transcend linguistic barriers compared with text [14,15]. Researchers have further integrated gaze theory with photo coding and semantic analysis to explore tourists’ visual preferences and landscape symbols [16,17], such as Zhang et al., who used deep learning to identify tourist behaviors and perceptions from visual content [18].
In recent years, the deep application of information and communication technology, geographic information system (GIS), and machine learning has driven tourism geography toward more micro-level and dynamic perspectives. Advances in natural language processing (NLP) have promoted research on tourism emotion and topic mining, with traditional models such as latent dirichlet allocation (LDA), support vector machine (SVM), and SnowNLP widely applied in review analysis. For instance, Liu et al. improved emotion evaluation approaches for tourism destinations using big data [19,20], while Blei et al. proposed the LDA model as a foundational method for topic extraction from tourism reviews [21].
Generative AI and large language models (LLMs) have also innovated new paradigms. Studies have shown that LLMs have significant advantages in complex semantic understanding and perform reliably in zero-shot classification scenarios [22,23,24]. Mariani et al. used LLMs to streamline tourism review analysis and verified their advantages in sentiment insight mining [22]. Liu et al. constructed a LLM-enhanced irony detection framework that effectively solves the difficulty of irony recognition in tourism reviews [23].
Despite progress in UGC-based tourism research, several limitations remain. Most studies rely on a single analytical dimension, lacking integrated interpretation of textual, visual, and spatial flow data. They are often constrained by homogeneous data modalities, limited research scales, and insufficient theoretical construction. Moreover, few studies adopt a progressive perspective from macro regions to micro scenes, hindering a systematic portrayal of urban tourism landscapes. Specifically, the same tourist experience can be expressed with different representational emphases across text, images, and videos [25]. Aligning such heterogeneous representations—known as the “modality gap”—has long been a core challenge in multimodal analysis [26]. Recent studies have made progress in establishing semantic correspondences across visual, auditory, and textual elements using statistical, contrastive, attention-based, and LLM-driven alignment strategies [27,28].
Amid rapid tourism development, accurately identifying tourist experience issues, optimizing tourism space and resource allocation, and building distinctive sustainable urban tourism brands have become key challenges for many tourist cities [29,30].
Therefore, this study takes Wuhan City as an example and improves the research framework based on the classic “Cognition-Affect-Behavior” (C-A-B) theory [31]. We collect text, image, and video data from mainstream tourism platforms and social media, and comprehensively use semantic networks, spatial analysis, NLP, and other methods to construct a multimodal UGC research system with a progressive spatial perspective on “Region–Route–Site”. This study aims to reveal tourists’ spatial behavioral patterns, cognitive image, and emotional feedback characteristics in Wuhan, and quantify their movement paths and visual preferences at the attraction scale. Theoretically, it aims to enrich the research methods of multimodal UGC in tourism geography; practically, it provides data support and decision-making references for Wuhan and similar cities to optimize tourism management, precision marketing, and service improvement.

2. Materials and Methods

2.1. Study Area

As a famous national historical and cultural city in China, Wuhan boasts abundant natural and historical cultural resources. It enjoys a superior geographical location and convenient transportation conditions, known as “a city nourished by rivers and connected to nine provinces”. As the central city of central China and a comprehensive transportation hub, Wuhan features a well-developed tertiary industry and strong regional radiation capacity.
In recent years, the cultural and tourism competitiveness of Wuhan has been continuously improving. In 2024, Wuhan received a total of 360 million tourist visits and generated CNY 420 billion in tourism revenue, with year-on-year growth rates of 8.6% and 11.2% respectively. In the first half of 2025, the city’s tourist arrivals and tourism revenue maintained a strong growth momentum, posting year-on-year increases of 12.17% and 16.55% respectively [32,33]. Wuhan is firmly ranked among the top ten popular tourist destinations in China, providing abundant research samples and representing typical cases for studies on urban tourism image and tourist behavior.

2.2. Research Framework

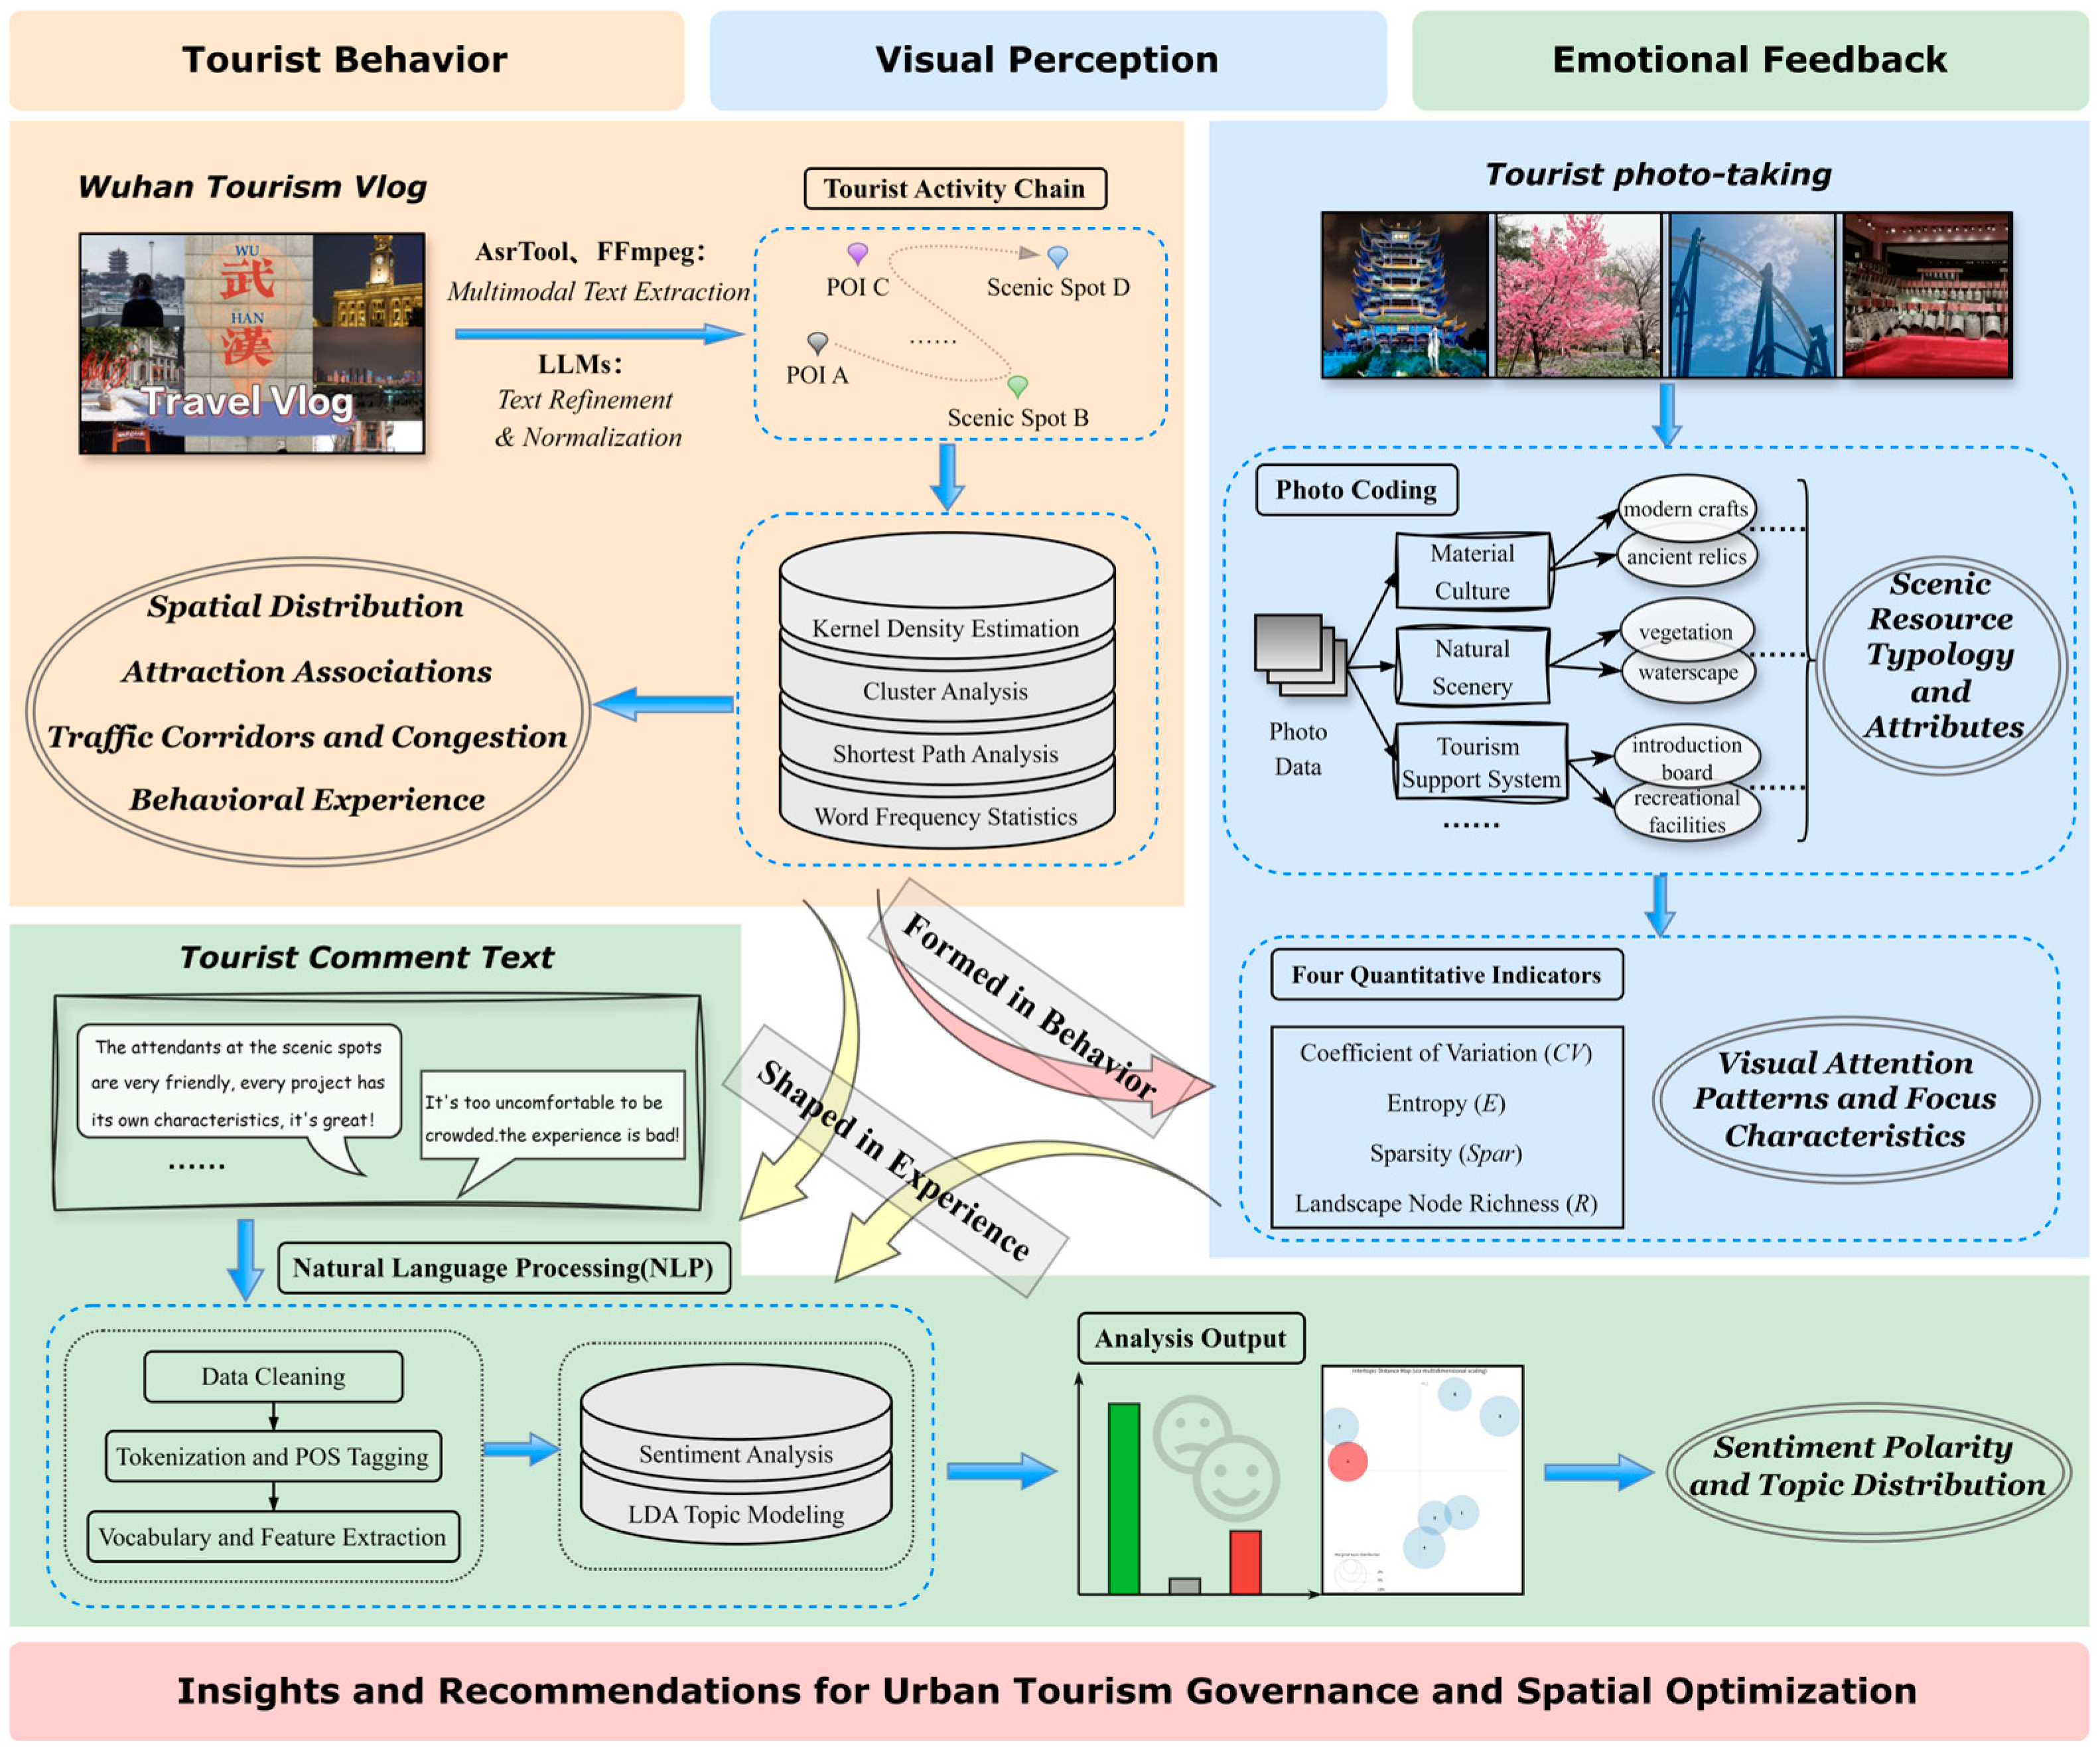
This paper designs a technical route consisting of three modules: data preparation, empirical research, and optimization strategies, as shown in Figure 1.
Primarily, in the data preparation stage, three types of public UGC data—text comments, images, and travel vlogs—are collected from publicly accessible web interfaces of mainstream tourism and social media platforms via non-intrusive access for academic research purposes only.
In the empirical research stage, a progressive spatial analysis framework of “Region–Route–Site” is adopted, where “Region” represents the macro spatial pattern of tourism across the entire Wuhan area, “Route” refers to tourist flow paths and connection strength between core scenic spots, and “Site” denotes the micro-experience scenes of individual representative attractions. Guided by the logical thread of “Behavior–Cognition–Affect”, this study first uses kernel density estimation and shortest path analysis to identify tourist spatial behavior patterns and hotspot distribution characteristics at the regional and route scales. Second, photo coding, semantic network analysis, and landscape quantitative indicators are applied to reveal tourists’ visual cognitive preferences and landscape element combination characteristics at the site scale. Third, SnowNLP sentiment analysis and LDA topic modeling are used to extract tourists’ emotional feedback and key perceptual dimensions from review texts.
Finally, based on the above multi-dimensional and multi-scale results, this study systematically summarizes the research conclusions and puts forward targeted optimization suggestions for urban tourism development and spatial governance.

2.3. Data Sources and Preprocessing

This study takes multimodal UGC (text, images, and videos) as the core data obtained from tourism platforms and social media. These samples are used to mine tourists’ perceptions and behavioral information regarding tourism in Wuhan.

2.3.1. Attraction Review Texts and Photos

First, based on city-scale tourist flow distribution, spatial aggregation, and attraction association results (Section 3.1.1 and Section 3.1.2), this study screens research samples following three principles: core relevance, data availability, and type representativeness, before conducting targeted UGC data collection.
  • Core relevance means selecting attractions that have a significant connection with the overall tourist behavior network, including hotspots of tourist activity, nodes connecting core tour routes, as well as relatively marginal but highly concerned nodes in the activity chain.
  • Data availability requires sufficient and stable review texts and photo data on mainstream tourism platforms to meet the needs of subsequent quantitative analysis.
  • Type representativeness means covering diverse experience types as comprehensively as possible, such as landmarks and historical sites, natural ecology, theme parks, indoor parent–child venues, food markets, campus culture, etc., to reflect the different dimensions of Wuhan’s tourism attractiveness.
According to the above screening principles and supporting evidence, nine attractions of different types listed in Table 1 were finally selected as research objects. Data collection was conducted on the Ctrip (Trip.com Group Limited, Shanghai, China) and Mafengwo (Mafengwo Network Technology Co., Ltd., Beijing, China) platforms using the nine attractions as keywords, covering at least one year of user-generated content, yielding 38,664 original reviews and 23,972 original photos. For text data, duplicate comments were identified and removed using hash functions, and template-based, repetitive, advertising, and suspicious paid reviews were filtered out via rule-based screening, retaining 32,804 valid reviews organized into a structured dataset. For image data, duplicates and highly similar photos were eliminated via VisiPics 1.31 (high-similarity mode), followed by 10% random sampling per attraction, resulting in 2351 visual analysis samples.

2.3.2. Tourist Vlog Videos

Considering platform user scale and data accessibility, this study uses Douyin (TikTok), Bilibili, and Xiaohongshu (Rednote) as video data sources. A search was conducted using the keyword “Wuhan tourism vlog”, and videos were manually filtered according to their relevance to Wuhan tourism. Three categories were excluded:
  • daily life videos of local Wuhan residents;
  • promotional videos from tourism practitioners;
  • compilation videos covering multiple destinations, including Wuhan.
Finally, from an initial set of 457 videos, 349 valid samples were retained (148 from Douyin—ByteDance Inc., Beijing, China; 104 from Bilibili—Bilibili Inc., Shanghai, China; 97 from Xiaohongshu—Xiaohongshu Inc., Shanghai, China). Audio was transcribed using AsrTools (Version 2.8), and subtitle tags were extracted via FFmpeg (Version 5.1). Large language models (LLMs, e.g., the Doubao-Seed-1.6 model) were used to correct transcription errors (e.g., “Li Huangpi Road” miswritten as similar-sounding wrong phrases) and abbreviations in spoken language (e.g., “Provincial Museum” referring to “Hubei Provincial Museum”). This step standardized Points of Interest (POI) names and eliminated potential noise that could interfere with subsequent information extraction and statistical analysis.

2.3.3. Other Data

In addition to the aforementioned UGC data, this study also employs several supplementary datasets to support its analysis and conclusions. Structured POI data for Wuhan (including catering establishments, shopping centers, accommodations, and recreational sites) were separately obtained via the Amap (AutoNavi) Open API (Amap Web Service API v3.0; AutoNavi Software Co., Ltd., Beijing, China). These POI data are used to explore the relationship between the spatial distribution of tourism service facilities and tourist activity intensity.
The vector road network data for Wuhan were derived from OpenStreetMap (OSM), while data on maximum holiday traffic flow and road congestion conditions were collected from Amap and official reports issued by the Wuhan Municipal Transportation Bureau. These datasets collectively provide a foundation for assessing road congestion in tourism contexts and formulating targeted traffic control strategies.

2.4. Research Methods

To systematically analyze tourist behavior, visual cognition, and affective feedback embodied in multimodal UGC across different spatial scales, this study employs a set of targeted research methods corresponding to diverse data types. These methods are applied to examine tourism characteristics at the urban, attraction, and individual tourist scales, thereby providing sufficient support for the research objectives.

2.4.1. Spatial Distribution and Accessibility Analysis

(1)
Kernel Density Estimation (KDE): As the primary spatial method for identifying tourist behavioral patterns at the regional scale, this method visually fits the density distribution of tourist activity points to identify hotspots and aggregation centers of tourist activities, presenting the spatial distribution pattern of tourist points of interest in Wuhan. Its core calculation model is:
f ^ ( x , y ) = 1 n h 2 i = 1 n ω i K ( d i h ) ,
where f ^ ( x , y ) is the density estimate at location ( x , y ) ; n is the number of tourist activity points; h is the bandwidth, also known as the smoothing parameter; ω i is the weight of the i-th point, defaulting to 1; d i is the Euclidean distance between point ( x , y ) and the i-th activity point; K ( x ) is the kernel function.
(2)
Shortest Path Analysis: Combined with Wuhan’s road network data, the Dijkstra algorithm is employed to characterize tourist flow connections at the route scale and identify the minimum weight traffic corridors connecting core scenic spots, thereby revealing the spatial correspondence between scenic spot passenger flow and surrounding road network load. Its minimization objective can be expressed as:
D = a r g   m i n P P e P ω ( e ) ,
where P is the path from the starting point to the destination; P is the set of all feasible paths; ω ( e ) is the weight of edge e (road length is adopted in this study); a r g   m i n denotes the path that minimizes the total weight.

2.4.2. Semantic Network Analysis

Based on graph theory and natural language processing technology, semantic network analysis reveals the semantic associations between entities in text or multimodal data through a graph model composed of “nodes–edges” [34]. In this study, visual content in images is transformed into quantifiable landscape node labels through photo coding, and a landscape element co-occurrence matrix is constructed. Different landscape elements extracted from photo coding are set as nodes, and their co-occurrence relationships within the same photo are defined as edges [35]. The landscape element co-occurrence network diagrams are generated using Ucinet 6 and NetDraw. These results demonstrate the structural associations and combination patterns of landscape elements in captured tourist content across various scenic spots, thereby revealing the visual preferences of tourists and resource characteristics of different attractions.

2.4.3. Quantitative Analysis of Landscape Elements

While landscape element co-occurrence networks can intuitively reflect the structural features of tourists’ visual cognition, they lack support for quantitative comparison. To address this limitation, this study quantifies landscape elements in photos to obtain comparable data and identify differences in visual characteristics across scenic spots. Accordingly, four key indicators are computed after photo coding to facilitate quantitative comparison and in-depth analysis of scenic visual features.
(1)
Coefficient of Variation (CV): The coefficient of variation is used to measure the degree of dispersion of the frequency of landscape elements, reflecting whether tourists’ visual attention is concentrated [36]. A higher CV value indicates that tourists’ shooting content is more concentrated on a few landscape elements; on the contrary, a lower value indicates that attention is relatively evenly distributed.
CV = σ/μ,
where σ is the standard deviation of the frequency of each free node; μ is the average frequency of each free node.
(2)
Entropy (E): This indicator measures the uncertainty and uniformity of landscape element distribution [37], and is adopted in this study to quantify the distribution uniformity of element frequencies in tourist photos. A higher entropy value indicates that the frequency distribution of various landscape elements is more uniform, and the visual content is more abundant and diverse; a lower entropy value indicates that the types of visual content are relatively single.
E = i = 1 n p i · l o g 2 ( p i ) ,
where p i is the proportion of the frequency of the i-th type of free node to the total frequency; n is the total number of free node categories.
(3)
Sparsity (Spar): Sparsity is used to describe the proportion of “non-co-occurrence relationships” in the landscape element co-occurrence matrix, reflecting the tightness of the associations between elements [38]. A higher sparsity indicates weaker co-occurrence relationships between elements and looser visual combinations; on the contrary, a lower value indicates that the elements are closely associated and often appear in fixed combinations.
S p a r =   m 0 / m ,
where   m 0 is the number of zero elements in the matrix; m is the total number of elements in the matrix.
(4)
Landscape Node Richness (R): Defined as the number of independent landscape nodes identified by coding in a single photo, reflecting the element density and framing range of the shooting content [39].
R = j = 1 N K j / N ,
where K j is the number of free nodes coded in the j-th photo; N is the total number of photos of the scenic spot.
These four parameters conduct quantitative analysis of tourists’ visual preferences from four dimensions: the degree of visual attention concentration, content uniformity, tightness of element association, and element density per photo, so as to realize fine comparison and interpretation of the visual characteristics of different scenic spots, and further reveal the visual cognitive differences that shape tourist satisfaction and destination choice.

2.4.4. Sentiment Analysis

Sentiment analysis is an important branch of Natural Language Processing (NLP), which aims to automatically identify and quantify the subjective emotions, attitudes, and value tendencies expressed by users in review texts through text mining technology [40]. In tourism research, sentiment analysis can effectively capture tourists’ real evaluations of scenic spots, services, and urban images, providing data support for tourism resource optimization and precise governance.
As the core method for measuring tourists’ affective responses in this study, the SnowNLP sentiment analysis model is adopted to calculate the sentiment intensity of the text reviews collected from each scenic spot. The output score in the [0,1] interval is linearly mapped to an integer score interval of [−100, 100], which is divided into three types of emotions: positive, neutral, and negative. Among them, scores from −5 to 5 are defined as neutral emotions, indicating no significant emotional tendency or objective expression; scores below −5 are negative emotions, and scores above 5 are positive emotions. The higher the absolute value, the stronger the emotion.

2.4.5. LDA Topic Analysis

Latent Dirichlet Allocation (LDA) is a classic unsupervised probabilistic generative model within NLP, proposed by David M. Blei et al. [21], which is mainly used to mine the potential topic structure in large-scale text data. In model construction, Perplexity and Coherence are the core indicators to determine the optimal number of topics in the model: Perplexity reflects the fitting degree of the model to the text, with a lower value indicating more accurate topic division, and Coherence measures the semantic correlation of keywords within a topic, where a higher value indicates a clearer descriptipn of the topic. Both are often used to determine the number of topics.
The LDA model is further applied to perform topic mining on the same review texts used for sentiment analysis. By extracting core semantic dimensions and high-frequency perception content from tourist reviews, this method identifies key thematic components such as landscape, service, and transportation, so as to reveal tourists’ major perception focuses and satisfaction-related influencing factors [41].

3. Results

This chapter conducts analysis following the logical thread of “Behavior–Cognition–Affect”: first, it parses tourists’ spatial behavior and travel characteristics at the urban scale to understand the overall tourism development pattern; then, it focuses on the scenic spot scale to explore tourists’ visual cognitive preferences and characteristics of landscape resources, grasping the core experience focus; finally, sentiment analysis and topic mining are carried out through review texts to identify the advantages and shortcomings of Wuhan’s tourism experience. These three dimensions are progressive, analyzing the overall picture of Wuhan’s tourism image perception and tourist experience, and providing data support and a logical basis for subsequent conclusion extraction and practical suggestions.

3.1. Tourist Flow and Behavioral Characteristics at the Urban Scale

To analyze tourists’ continuous behavioral trajectories and flow characteristics between scenic spots at the urban scale, this section extracts movement paths and behavioral information from tourists’ self-reported itineraries and experience texts based on Wuhan tourism vlog data, depicting their cross-scenic spot flow patterns and overall behavioral experience.

3.1.1. Tourist Travel Trajectories and Hotspot Distribution

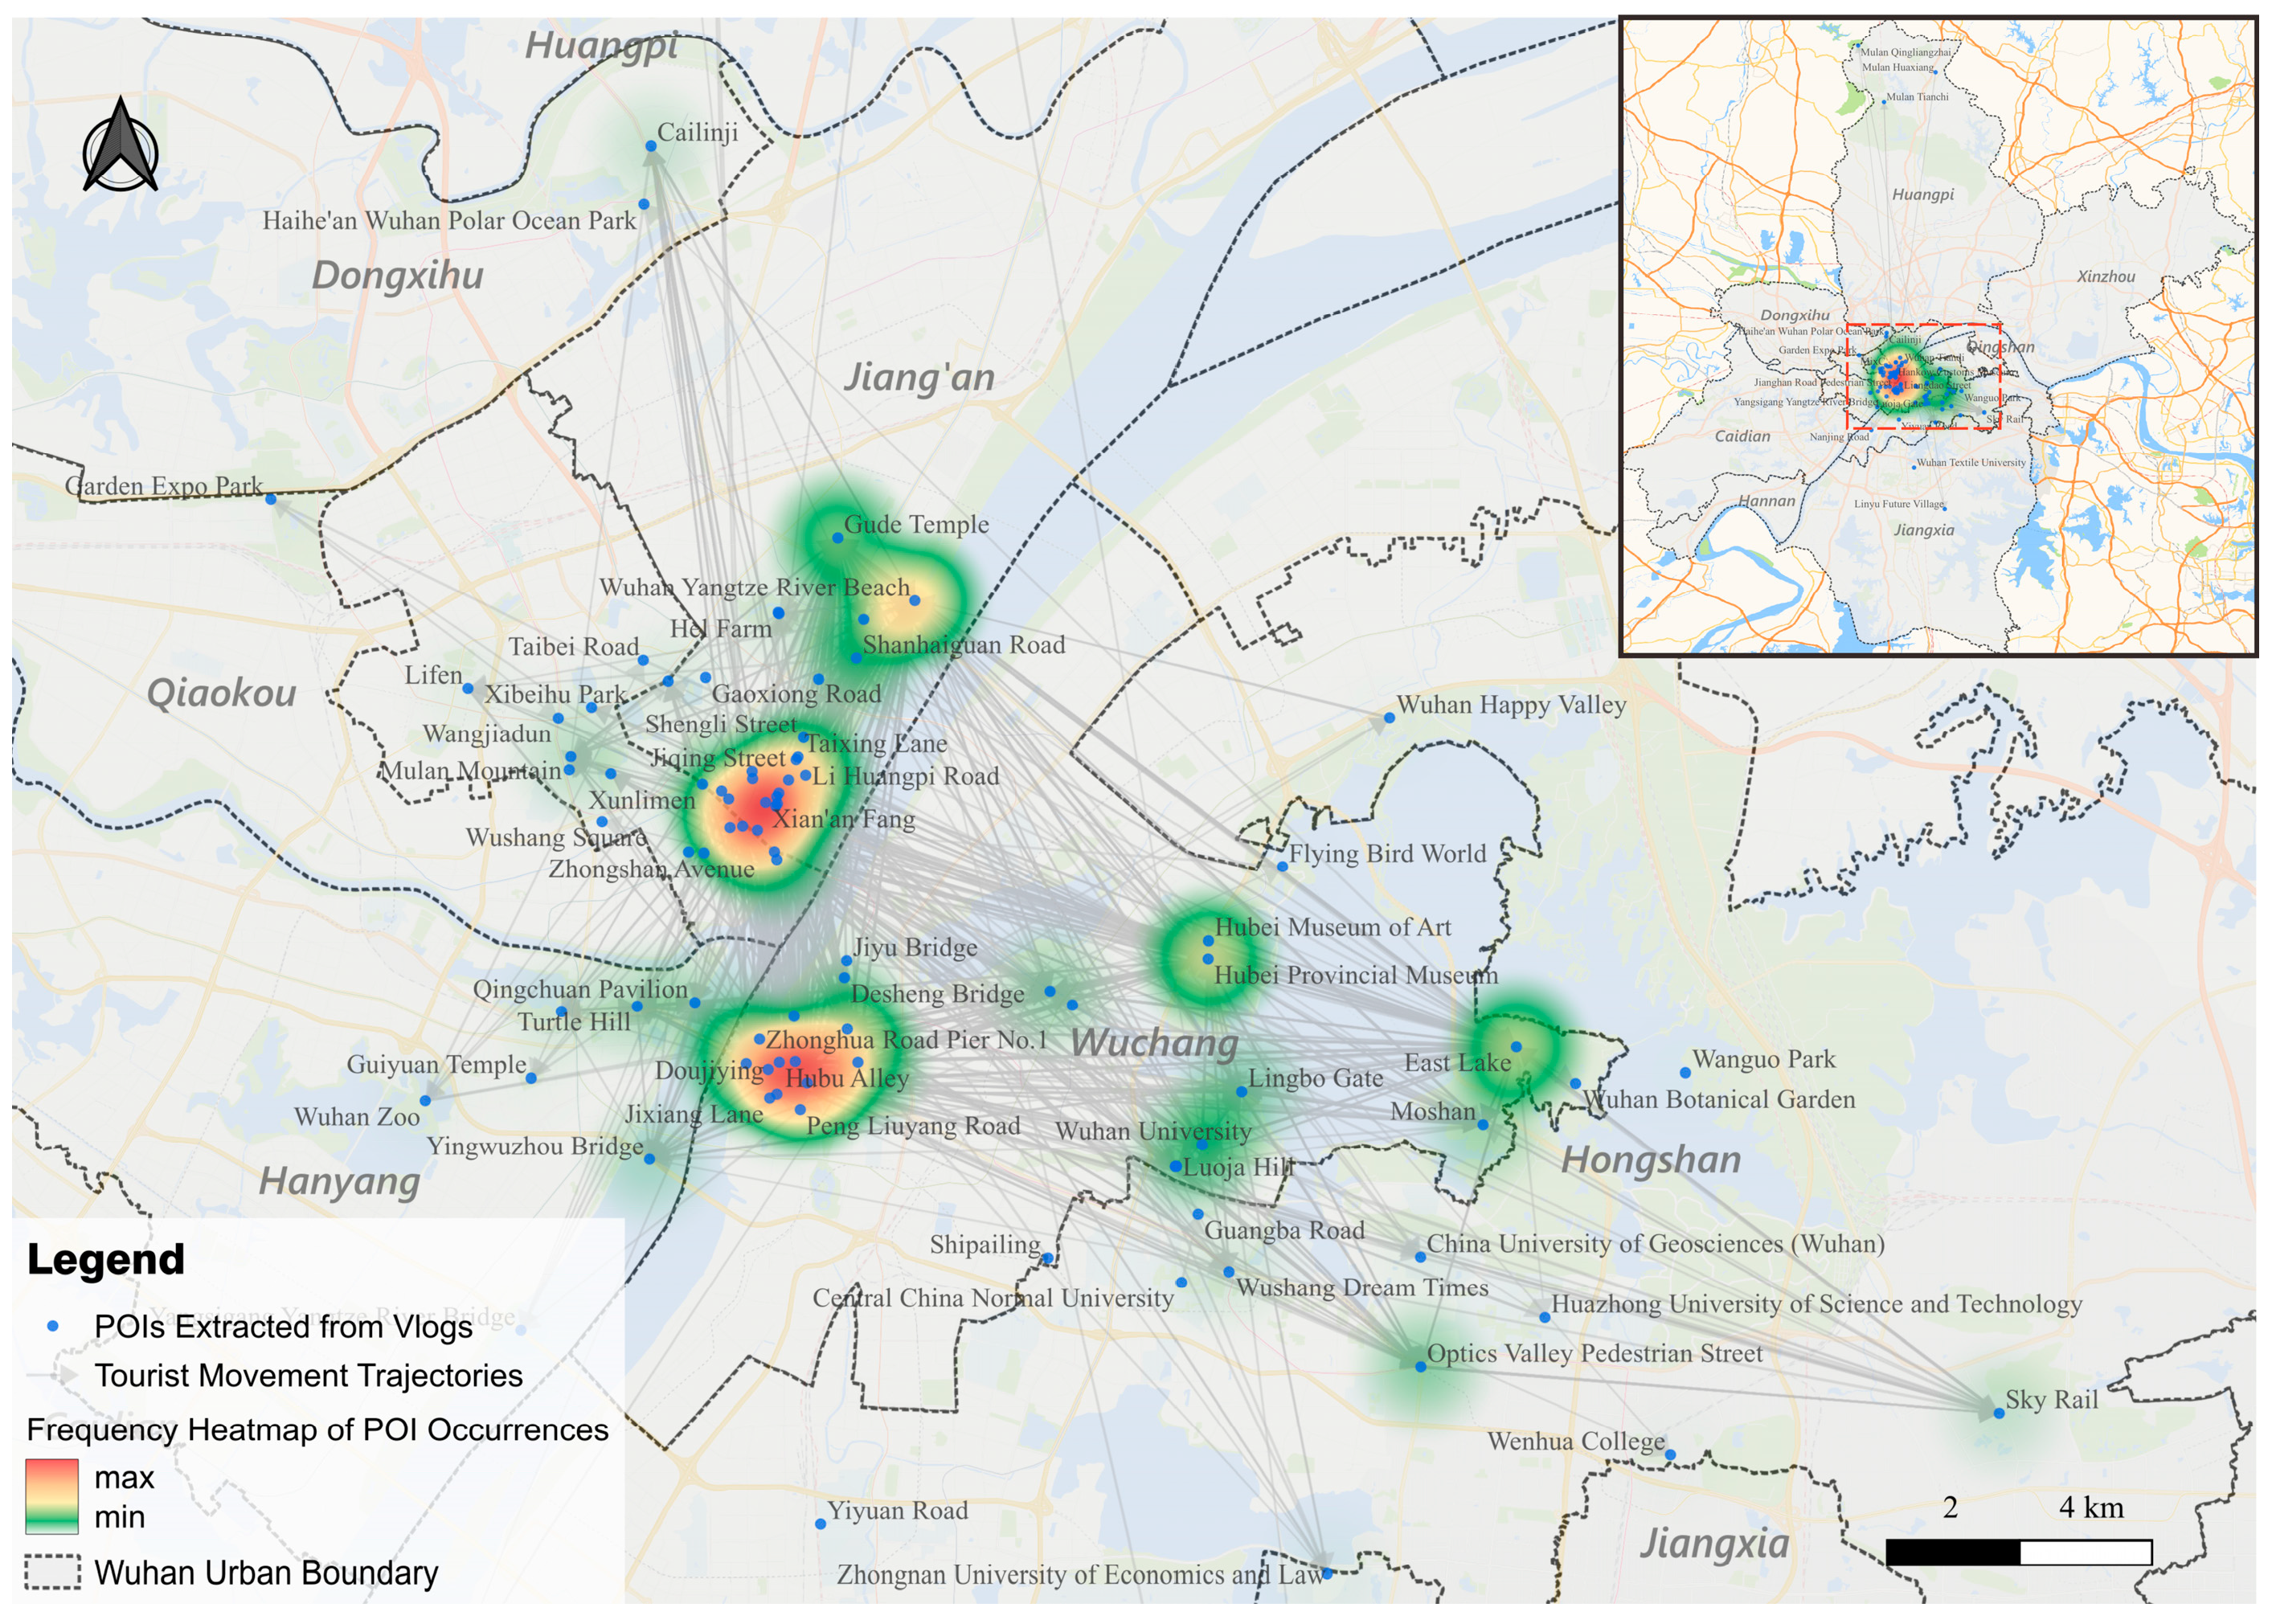
A total of 341 valid tourist activity chains (i.e., continuous path trajectory sequences) were obtained from the collected 349 Wuhan tourism vlogs. On this basis, the frequency of each scenic spot name was counted, and the kernel density estimation method was used to quantify the spatial aggregation characteristics of tourist travel. Visualization was carried out by combining heatmaps and trajectory networks to reveal the spatial distribution pattern of tourist behavior.
As shown in the visualization results of Figure 2, tourist activities in Wuhan present a “core-periphery” spatial structure, highly concentrated in central urban areas such as Jianghan—Jiang’an and Wuchang. The Yellow Crane Tower and Jianghan Road Pedestrian Street are core nodes of passenger flow intersection with dense interwoven trajectory lines, and scenic spots in peripheral areas such as Huangpi and Jiangxia have low occurrence frequency, weak connectivity, and sparse trajectories.
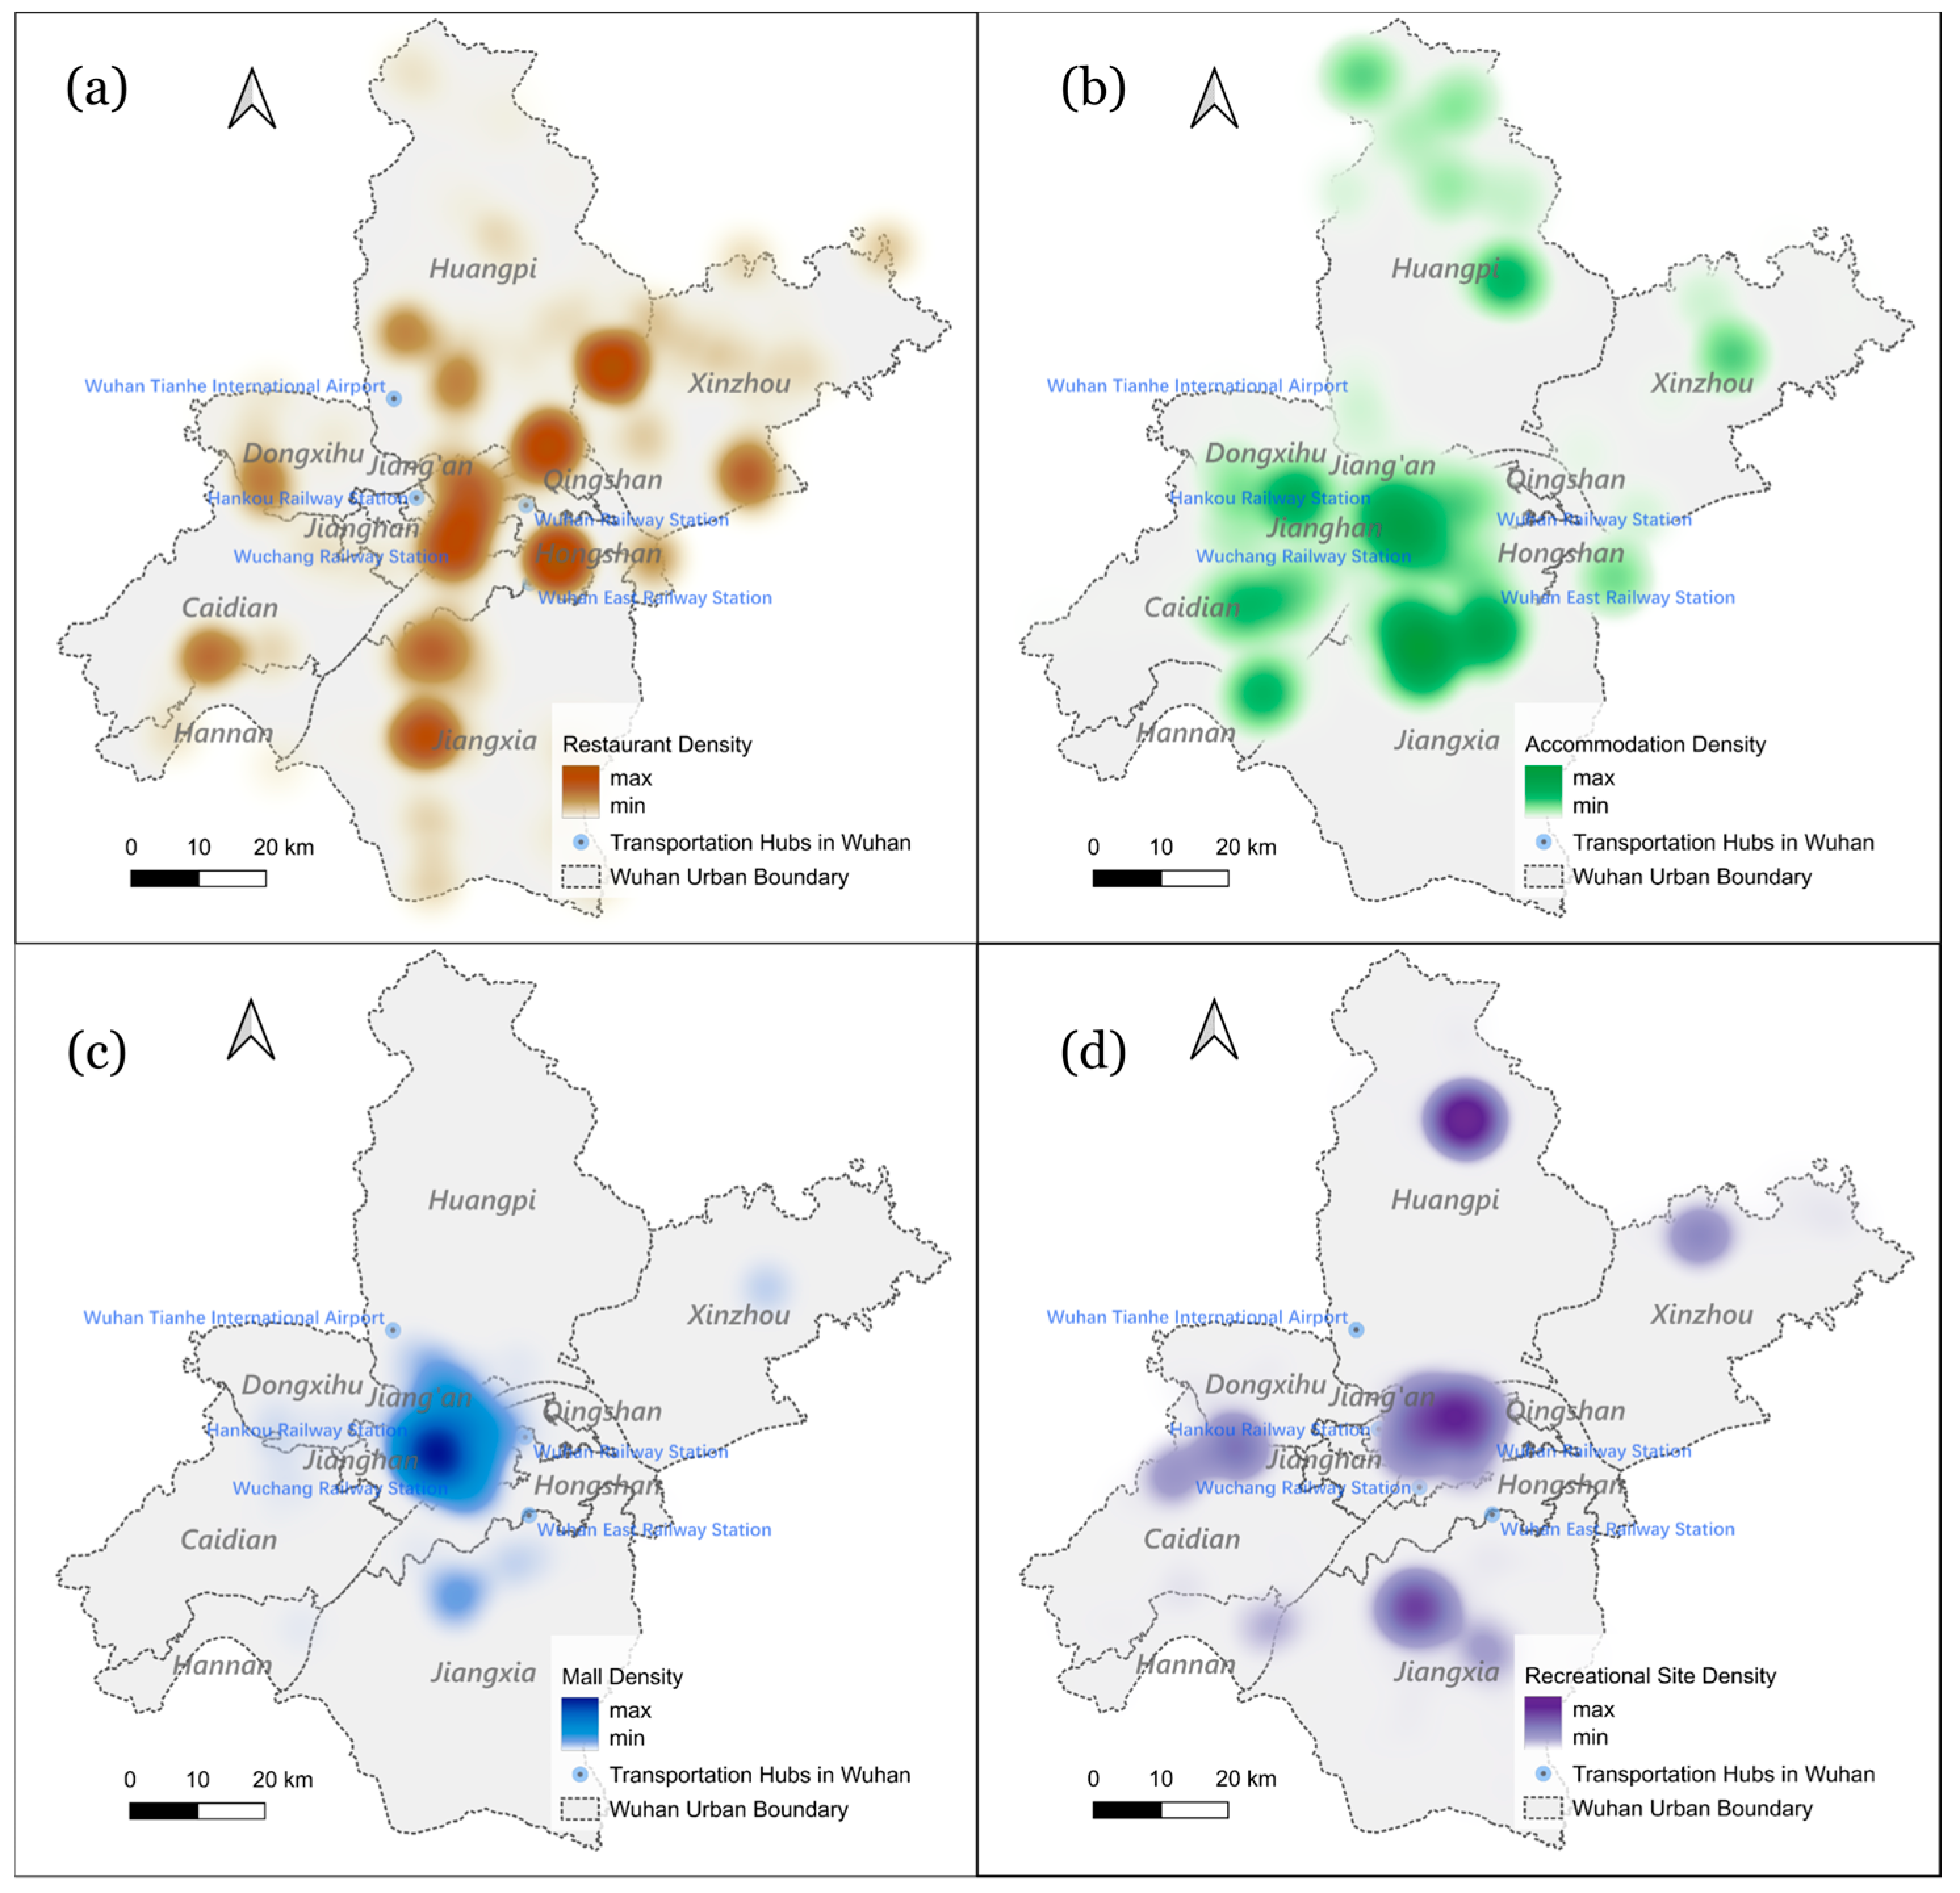
This pattern is closely tied to the uneven distribution of tourism service facilities, as visualized in Figure 3. Four core POI categories (restaurants, accommodations, malls, and recreational sites) were selected to capture tourists’ key travel needs, including dining, lodging, shopping, and leisure. The density of these facilities forms a distinct gradient: the highest concentrations occur in the city center, while peripheral areas have significantly lower coverage.
In Jianghan—Jiang’an and Wuchang, dense restaurant and accommodation networks, commercial complexes, and diverse recreational sites form a comprehensive service ecosystem. This agglomeration meets tourists’ one-stop travel needs, strongly enhancing the central area’s attractiveness. In contrast, peripheral attractions are scattered with inadequate supporting facilities and poor accessibility, discouraging frequent visits and resulting in sparse tourist trajectories.

3.1.2. Association Intensity and Behavioral Flow Between Scenic Spots

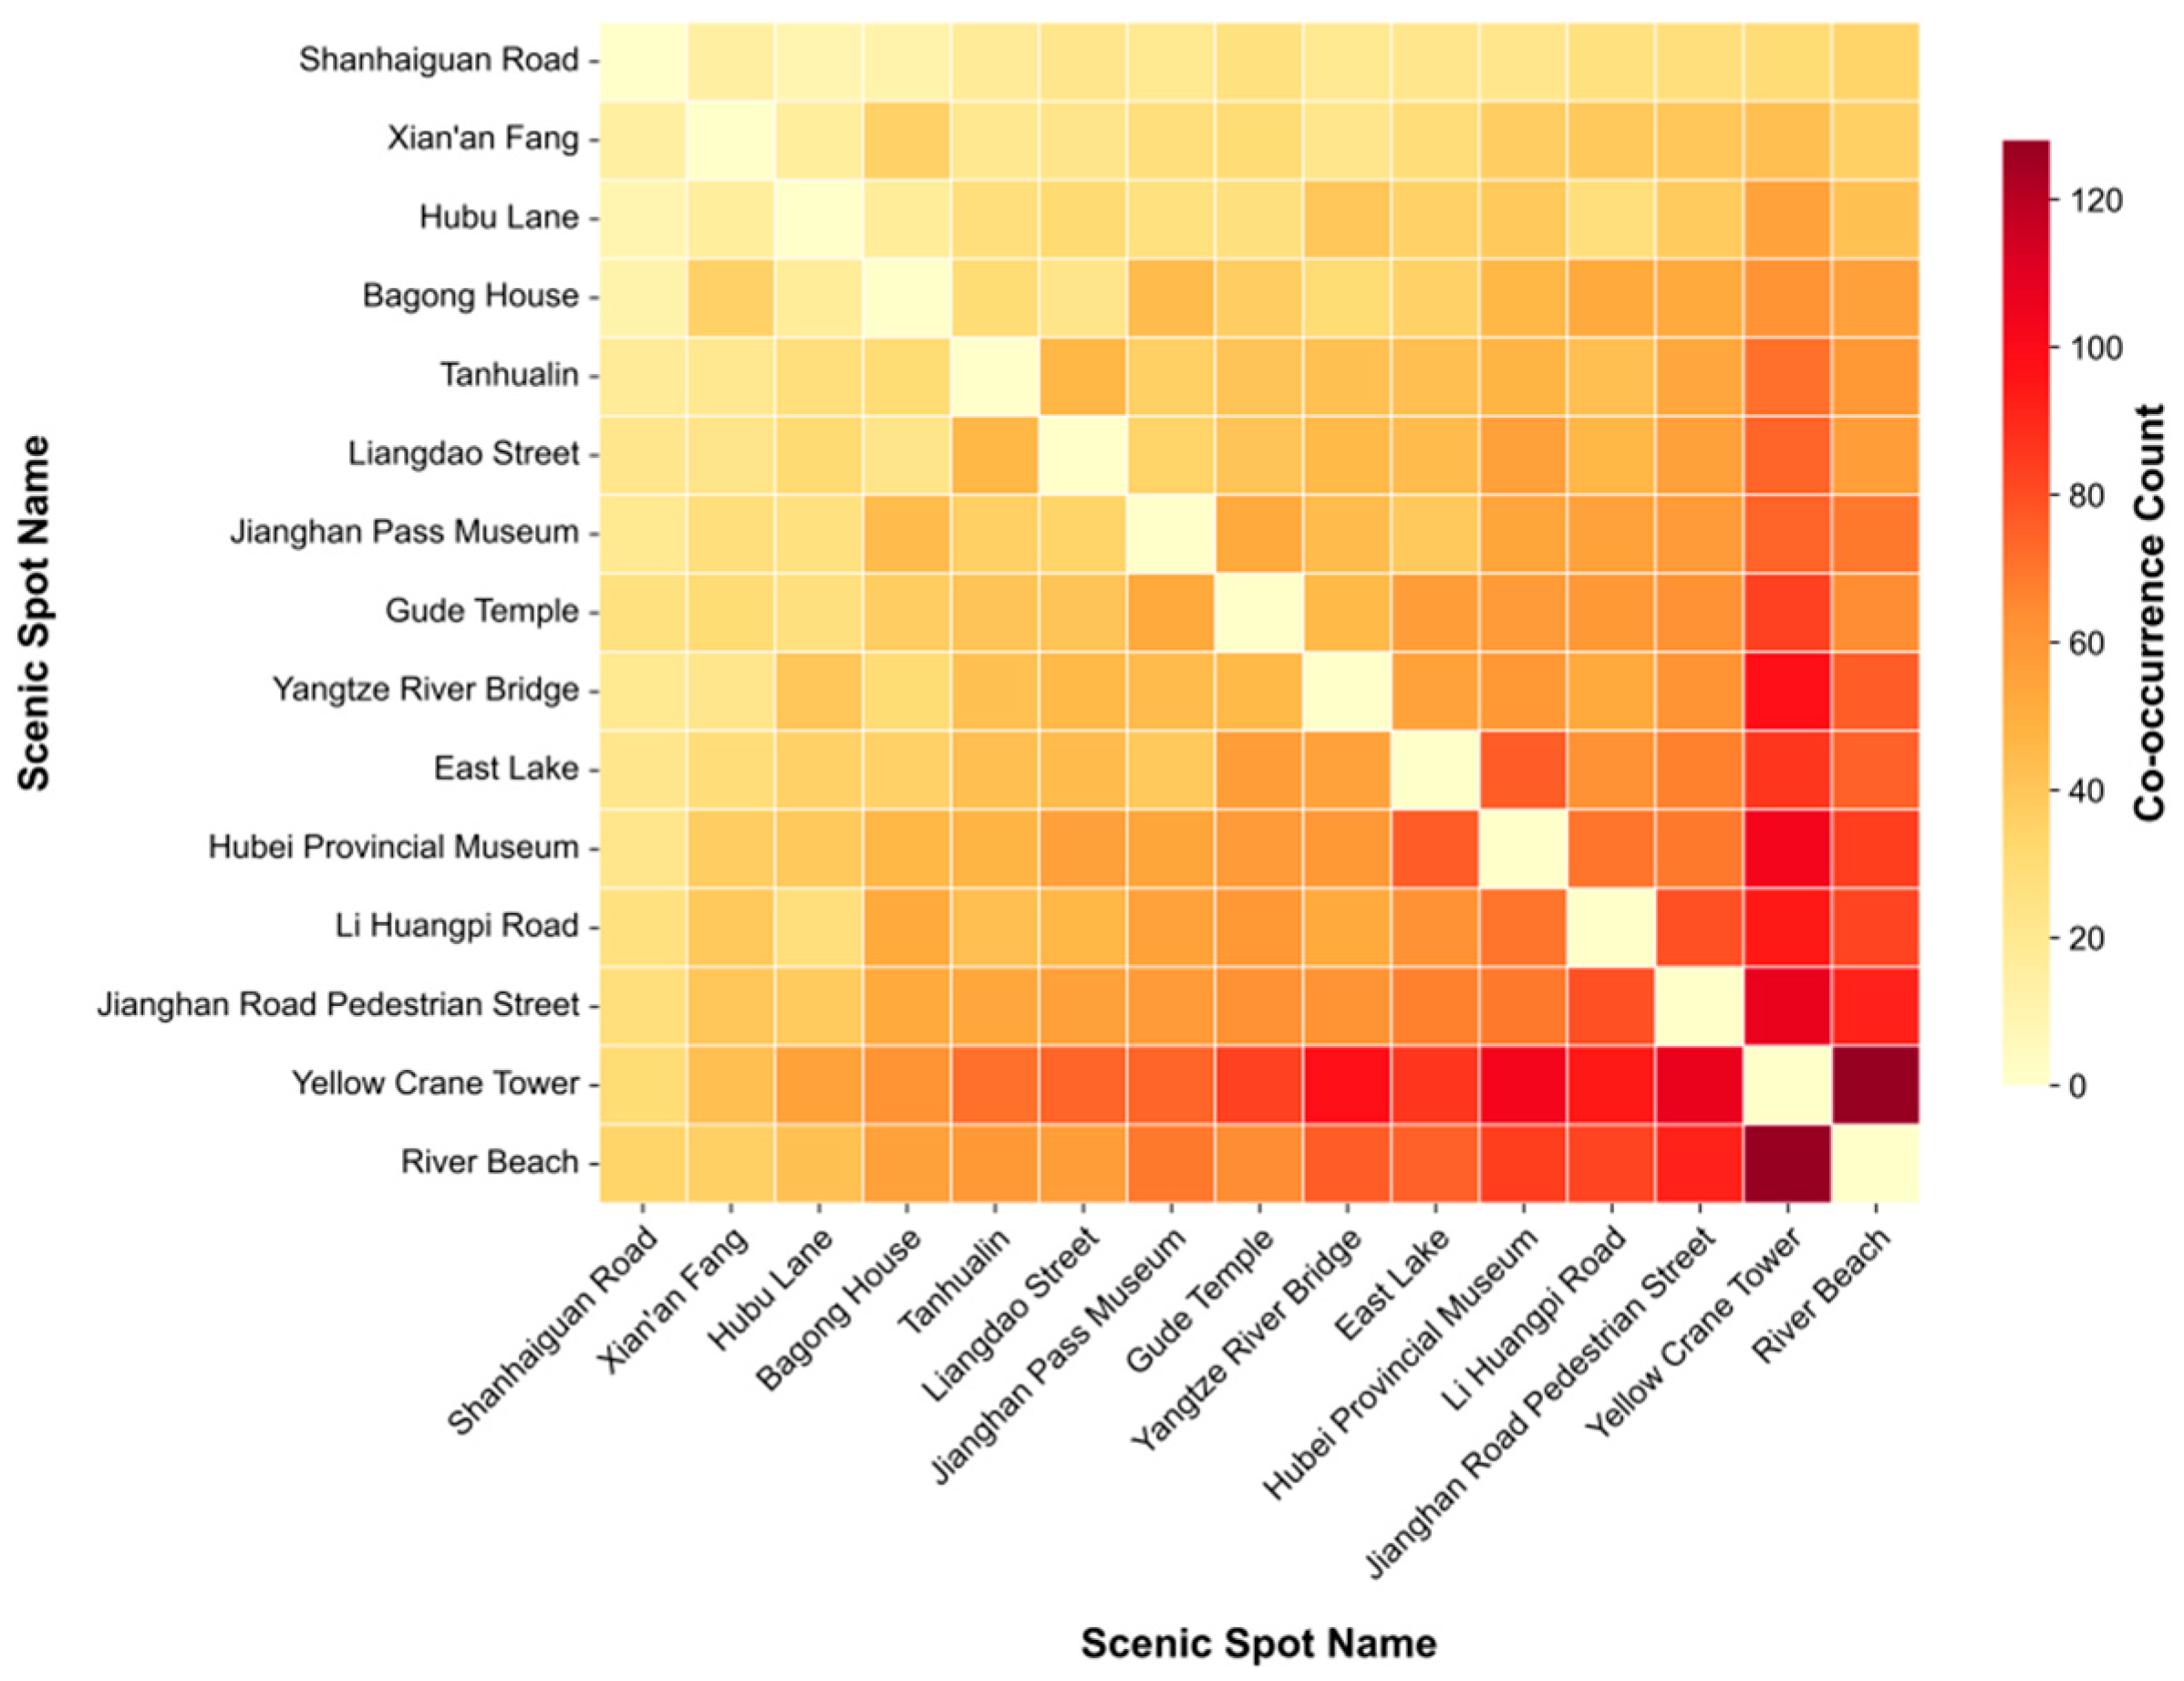
Although tourist activities are highly concentrated in the central urban area, this macro pattern does not reveal the specific connection intensity and flow paths between various scenic spots in the core area. To this end, the co-occurrence frequency of scenic spot names is counted based on tourist activity chain data, the association intensity between each scenic spot is calculated through cluster analysis, and the 15 scenic spots with the highest association degree are selected as the core scenic spots of Wuhan. The association heatmap is used to show the association pattern between each scenic spot (as shown in Figure 4), and its color gradient reflects the co-occurrence frequency of different scenic spot combinations.
Among them, scenic spots in the orange branch, including Yellow Crane Tower Park, River Beach, Jianghan Road Pedestrian Street, and Hubei Provincial Museum, exhibit significantly high association intensity and constitute the core node group most frequently visited in combination in tourist itineraries.
This pattern mainly stems from two factors: first, concerning thematic relevance and functional complementarity, Yellow Crane Tower Park and Hubei Provincial Museum are cultural attractions, while River Beach features leisure sightseeing and Jianghan Road Pedestrian Street focuses on commercial consumption, forming a coherent travel experience. Second, spatial proximity and convenient transportation—all these attractions are concentrated in the central urban area with short distances and easy connections, greatly reducing travel costs and thus improving co-occurrence frequency to form a tightly connected core attraction cluster.
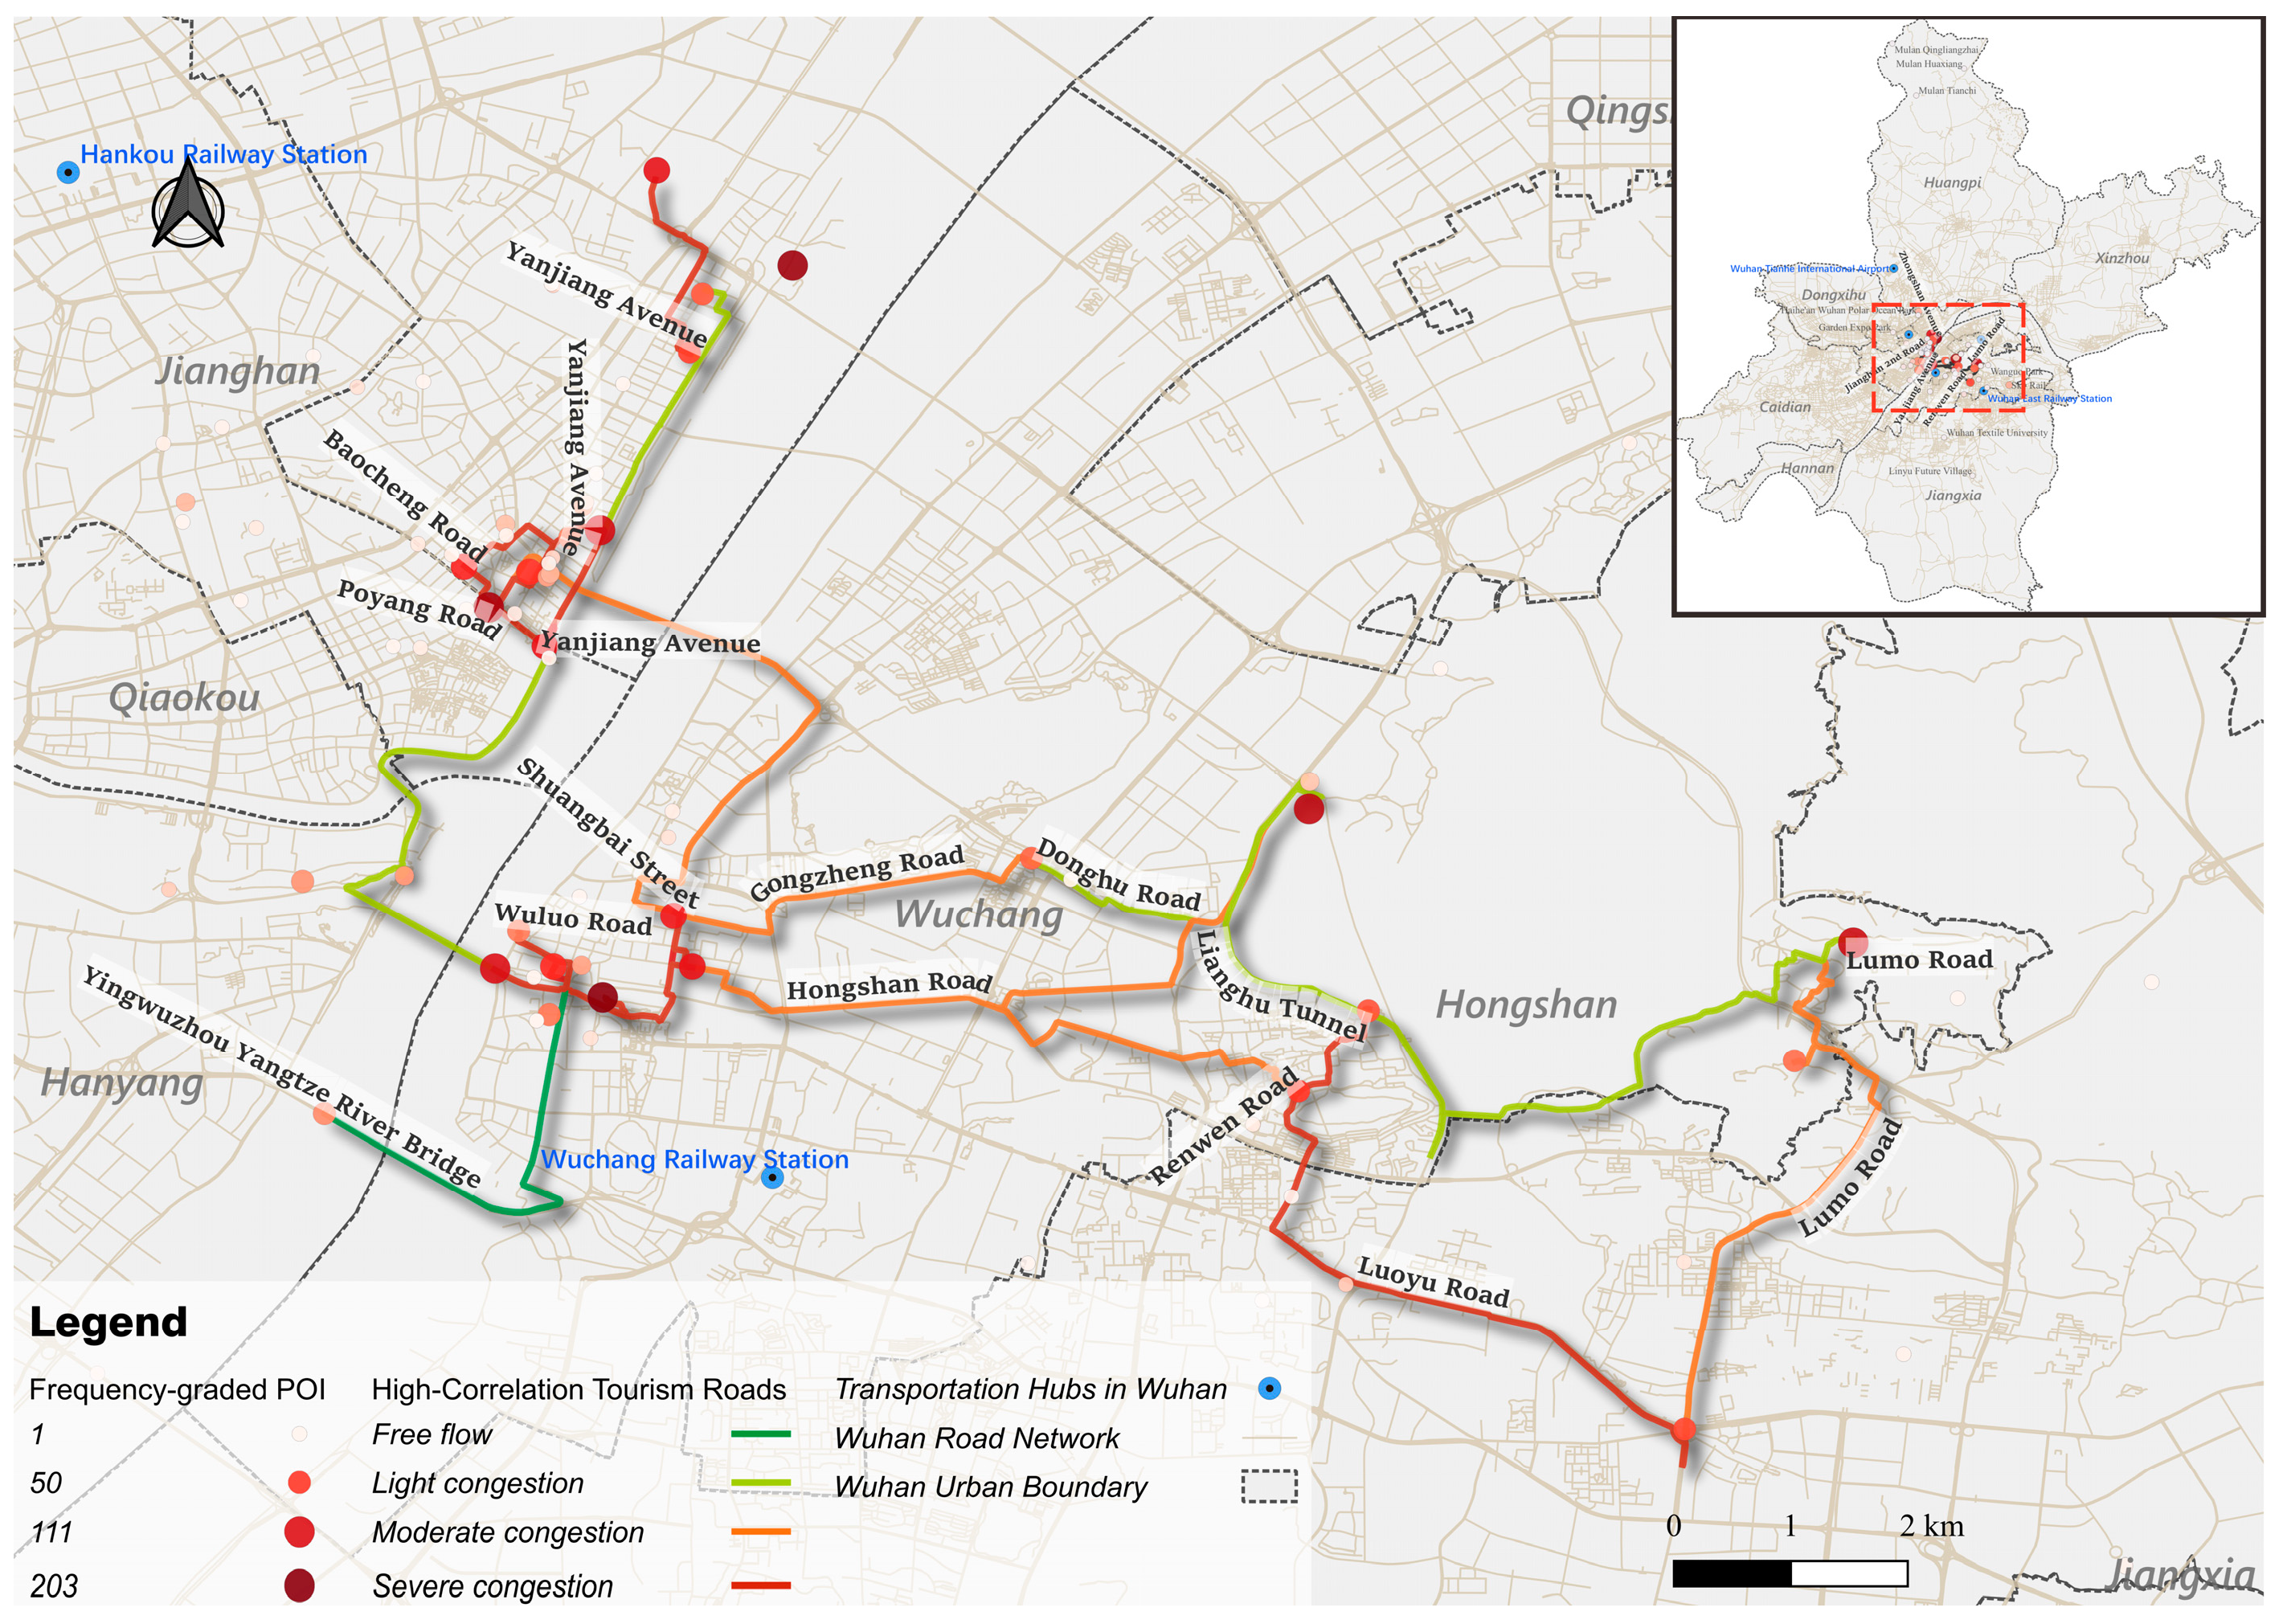
By analyzing tourist travel trajectories and the shortest paths between core attractions, we identified key traffic corridors connecting scenic spots, including Yanjiang Avenue, Jianghan Second Road, Wuhan Yangtze River Tunnel, Jiefang Road, Yanzhi Road, Tan Hualing Road, Huanghelou East Road, Hongshan Road, and East Lake Road. These corridors are close to major transportation hubs such as railway stations.
To reflect traffic conditions under tourism scenarios, we constructed a tourism-oriented congestion index by integrating tourist flow frequency between attractions, road capacity grades (classified as arterial roads, secondary roads, branch roads, and other road grades), and maximum traffic volume. The index was classified into four levels: free flow, slow traffic, congestion, and severe congestion, and visualized on the road network using a color gradient. As shown in Figure 5, roads surrounding core scenic spots (such as Wuluo Road, Luoyu Road, and the middle section of Yanjiang Avenue) exhibit particularly severe congestion on weekends and holidays, placing significant pressure on the road network in the central urban area.
Such congestion is caused by multiple factors. On the one hand, some road sections are narrow and subject to traffic control, resulting in limited traffic capacity. On the other hand, popular attractions are highly concentrated, and many corridors overlap with urban commuting routes, leading to the superposition of tourist flows and daily commuting flows, mixed traffic, and reduced travel efficiency. In addition, the dense distribution of attractions in the core area further intensifies congestion in local road sections where tourist travel demand is concentrated.

3.1.3. Word Frequency Statistics of Behavioral Text

A high-frequency word analysis was conducted on the transcribed text of Wuhan tourism vlogs (Table 2), and multiple dimensions of tourist behavior can be derived from tourists’ words. Among them, “Wuhan”, “delicious”, and “Yellow Crane Tower” rank the top three in word frequency. Combined with semantic categories, the high-frequency words are classified into seven categories: scenic spot names, food, behavioral experience, emotional evaluation, time, transportation, and others (Table 3).
Among them, the category of scenic spot names accounts for the highest proportion (33.076%), including “Yellow Crane Tower”, “East Lake”, “Jianghan Road”, “Yangtze River”, etc. These are all highly representative tourist destinations in Wuhan, serving as key components of Wuhan’s tourism market attractiveness and holding significant representativeness in tourists’ cognition.
Vocabulary related to food accounts for 23.083%. Words such as “hot dry noodles”, “steamed dumplings”, “bean curd skin”, “beef”, and “taste” are closely linked to the high-frequency evaluation “delicious”, reflecting that food culture has become a distinguishable symbol in Wuhan’s tourism attractiveness.
The category of activity experience (13.151%), including words such as “check in”, “take photos”, “queue up”, and “have breakfast”, not only reflects the typical activities and participation methods of tourists at the destination, but also highlights the core position of photo-taking behavior in tourism experience nowadays. It lays a foundation for subsequent analysis of tourists’ visual preferences and confirms the important role of visual expression in the perceptibility and communication power of urban culture.
The category of emotional evaluation accounts for 9.597%, mainly consisting of positive words such as “like” and “good”, conveying tourists’ overall recognition and satisfaction with Wuhan’s tourism experience.
In addition, the other categories of vocabulary cover travel time, transportation methods, and related cultural backgrounds, collectively enriching the specific scenarios and behavioral contexts in tourists’ narratives. These seven categories of high-frequency words not only directly reflect tourists’ actual activities and behaviors, but also spontaneously show the overall image of Wuhan as a tourist destination through language.

3.2. Visual Focus and Resource Characteristics at the Scenic Spot Scale

The aforementioned analysis of tourist flow and behavioral characteristics at the urban scale based on tourism vlogs has identified Wuhan’s core tourist attractions and tourist behavior rules, providing support for further conducting micro-level visual focus and resource characteristic analysis of typical scenic spots. Based on the above results, this study conducts further analysis on the selected nine typical scenic spots.
Nvivo 20 was used to conduct axial coding and naming of the content elements of the sample photos. The coding process is equivalent to breaking down the content in the photos and assigning them to different nodes. Free nodes were classified and integrated into corresponding tree nodes, and finally 11 tree nodes and 45 free nodes were obtained, some of which are shown in Table 4.
Among them, tree nodes serve as parent nodes, belonging to the macro-level classification of landscape types, while free nodes under tree nodes are corresponding child nodes, representing specific micro-level landscape elements. After completing full-scale coding of all research sample photos, a total of 6805 valid landscape nodes were generated, providing basic data support for subsequent analysis.

3.2.1. Preference Analysis of Landscape Elements

Coding frequency statistics can effectively reflect the trends and core characteristics of specific research topics. In this study, this statistical method is used to characterize the occurrence frequency of various landscape elements in photos taken by tourists, and this frequency directly corresponds to tourists’ landscape preference tendencies for major scenic spots in Wuhan. Considering the differences in the number of sample photos among different scenic spots, to ensure the comparability of statistical results, the analysis results are finally presented by the frequency of photo coding.
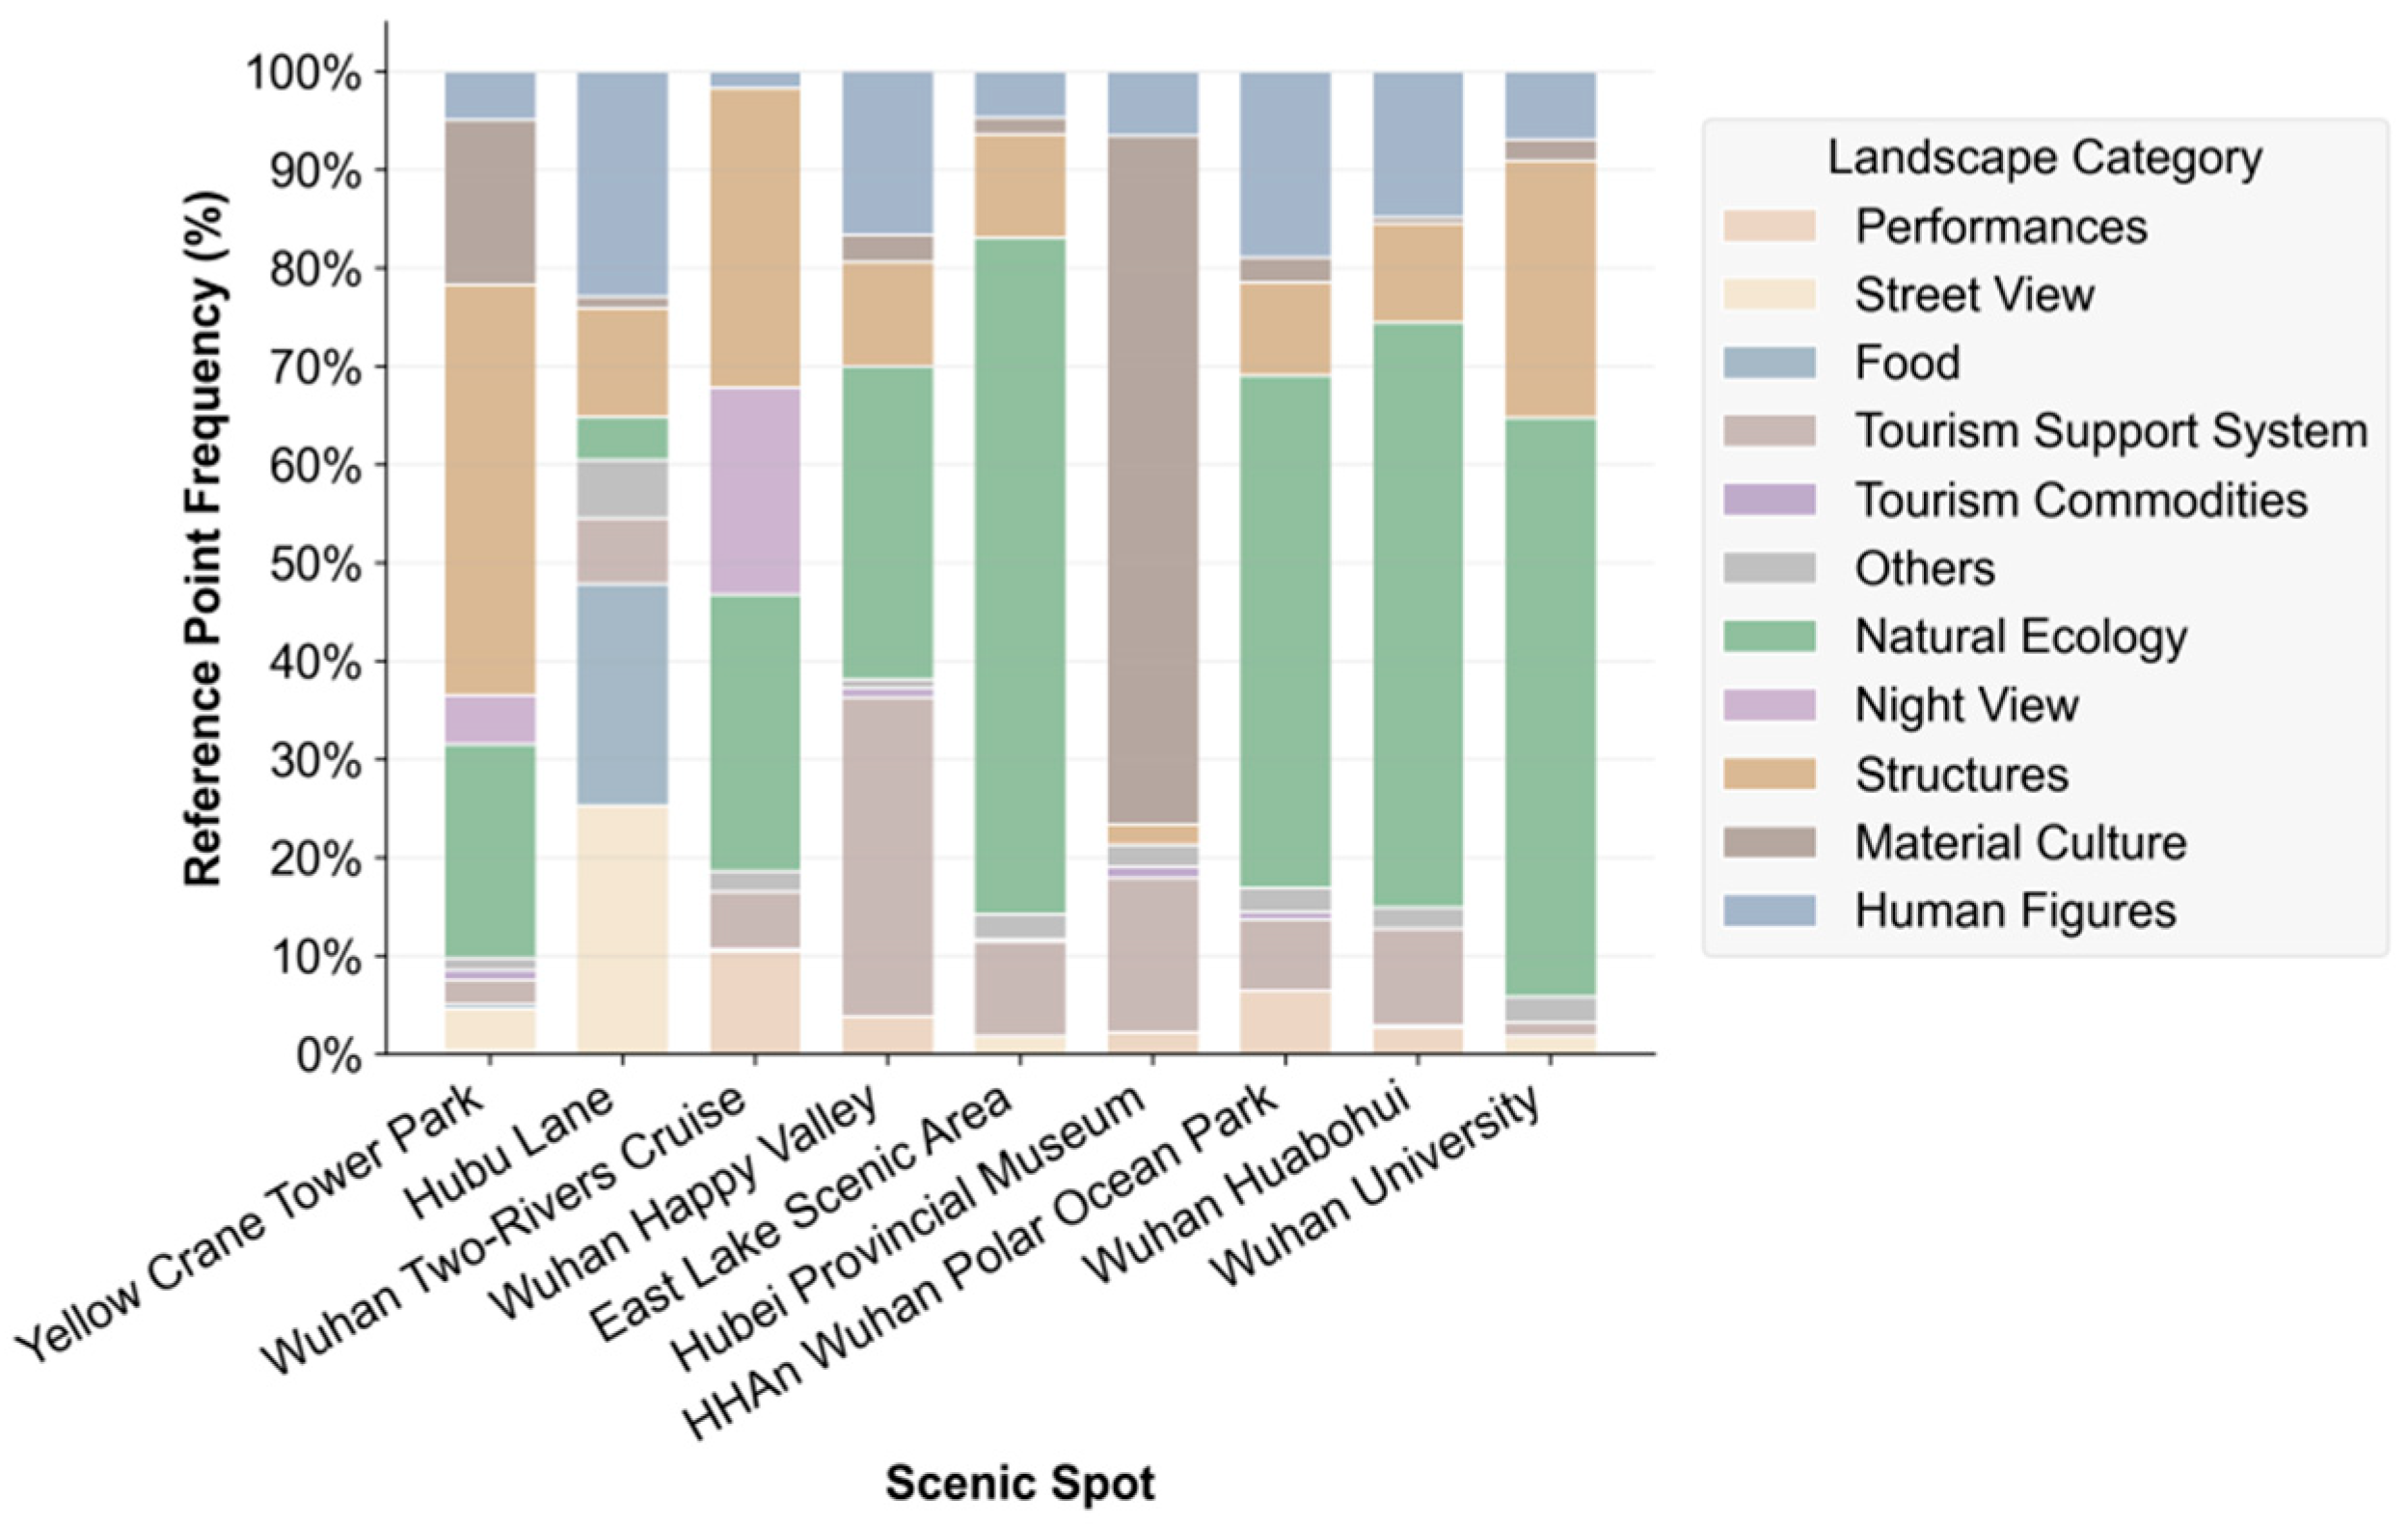
The distribution of landscape preferences in the nine scenic spots in Wuhan presented in Figure 6 show obvious typological characteristics. The resource characteristics of different scenic spots determine the differences in tourists’ visual focus. The coding results are consistent with the public’s subjective empirical cognition of different scenic spot types, confirming the rationality and effectiveness of the coding classification and statistical analysis.
Cultural landmark scenic spots represented by the Yellow Crane Tower and Hubei Provincial Museum both share a historical and cultural dimension but have their own emphases. Nearly 60% of tourists’ attention at the Yellow Crane Tower is concentrated on “buildings and structures” (41.74%) and “material culture” (16.79%), highlighting the focus on the building itself and Chu culture. Meanwhile, the proportion of “material culture” in Hubei Provincial Museum is as high as 70.07%, indicating that the collected historical cultural relics are its core attraction.
Among nature-oriented scenic spots, the proportion of “natural ecology” in East Lake (68.87%), Wuhan University (58.91%), and Huabohui (59.54%) all exceed 50%, but the landscape types are significantly differentiated. East Lake points to ecological resources such as original lake shores and wetland vegetation, which is a direct reflection of tourists’ demand for leisure landscapes in the urban green core, Wuhan University corresponds to campus natural landscapes and Republican-era buildings (26.18%), and Huabohui focuses on artificial flower landscapes.
The shooting content of leisure experience scenic spots is strongly related to their scenes: the proportions of food, street scenes, and figures in Hubu Lane are balanced (20%~25%), together forming a picture of urban life; tourists at Wuhan Happy Valley focus on the tourism support system (32.41%), paying attention to the experience of entertainment facilities; Wuhan Two-Rivers Cruise mainly focuses on buildings, nature and night scenes (20%~30%), and the core shooting objects of HHAn Polar Ocean Park are animals (49.08%), which is consistent with the characteristics of animal display and parent–child travel scenes.

3.2.2. Co-Occurrence Network Analysis of Landscape Elements

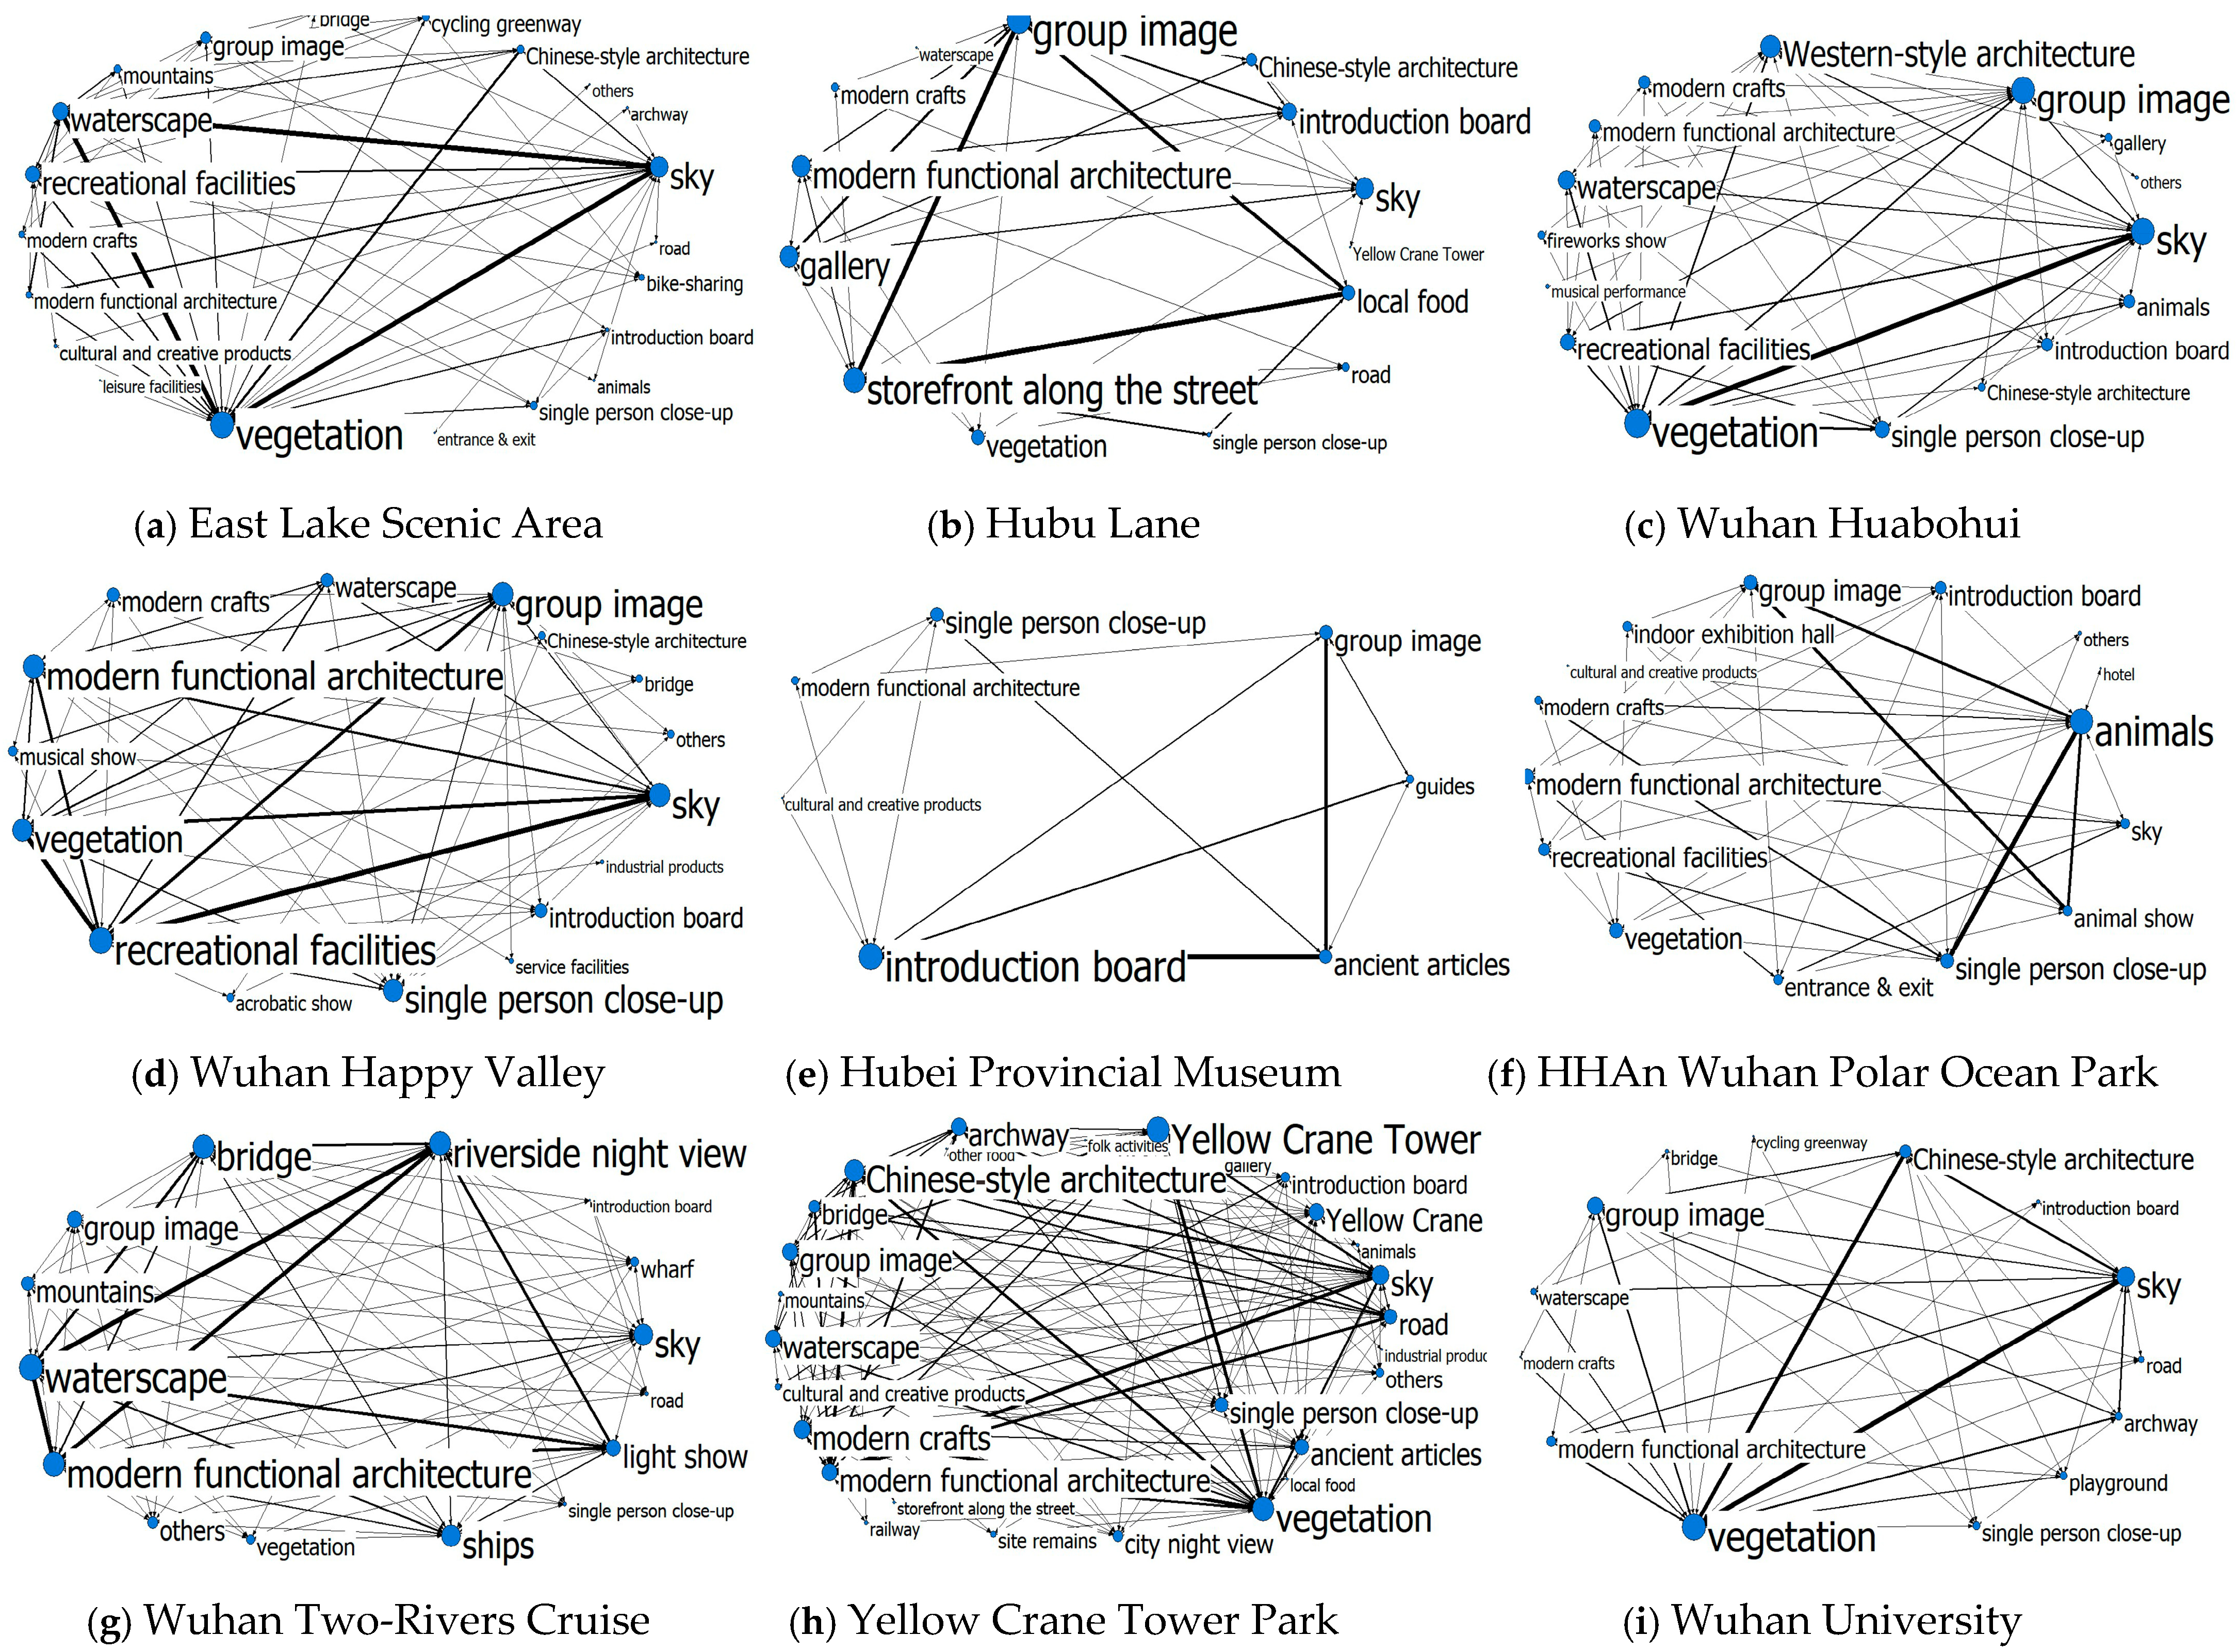
Landscape co-occurrence refers to the phenomenon where two or more landscape elements appear simultaneously in the same visual scene and are perceived by tourists. Figure 7 presents the landscape element co-occurrence network of nine typical scenic spots in Wuhan, where nodes correspond to landscape elements and edges represent co-occurrence associations between elements.
The co-occurrence network structures of different scenic spots are quite distinct. To quantify this difference, four types of dispersion indicators are selected, as shown in Table 5. Among them, the coefficient of variation (CV), entropy (E), sparsity (Spar), and landscape node richness (R) convert the structural differences in the co-occurrence network into quantifiable dispersion characteristics from four dimensions: the concentration of attention on landscape elements, the uniformity of distribution, the tightness of element association, and the density of visual content in photos (Table 5).
From the perspective of quantitative indicators, the visual dispersion characteristics of each scenic spot show different numerical differences due to their visual expression modes.
The two groups of humanistic landmark scenic spots are particularly representative: the Yellow Crane Tower has the highest entropy value (6.594) and the lowest sparsity (0.290), indicating that its landscape element types are rich and often appear in fixed combinations, corresponding to the shooting scenes where buildings, nature and urban features co-occur in a diversified way when viewing from the tower. The Hubei Provincial Museum has an extremely high coefficient of variation (6.134) and the lowest entropy value (2.869), with visual content highly concentrated on cultural relics and their explanation boards, which is consistent with the scenario in which tourists stop to visit and record in cultural venues.
The entropy values of natural and leisure scenic spots such as East Lake, Wuhan University, and Huabohui are all above 5.2, with rich and evenly distributed visual element types. Among them, East Lake has a relatively high coefficient of variation (4.047), with visual focus on natural water bodies. The sparsity of Wuhan University and Huabohui are 0.470 and 0.454 respectively, and the element combination methods are relatively flexible, which is consistent with the diversity of campus humanistic landscapes and flower themes.
Wuhan Two-Rivers Cruise has the lowest coefficient of variation (2.516) and the highest sparsity (0.698), corresponding to the scattered visual attention under the broad river view, with free combination of elements such as lights, buildings, and river water. Hubu Lane has a moderate coefficient of variation (2.811) and entropy value (5.324), with obvious characteristics of diversified street scenes, HHAn Polar Ocean Park has a relatively high coefficient of variation (4.734), with visual focus on animals but flexible combination (Spar = 0.422), and Wuhan Happy Valley has a high entropy value (5.547), with rich visual content.
Additionally, the analysis of landscape node richness (R) further verifies this pattern: scenic spots with broad shooting perspectives such as Wuhan Two-Rivers Cruise exhibit high R values, reflecting diverse visual content. In contrast, venues requiring detailed observations like Hubei Provincial Museum show lower R values, corresponding to close-up shots of specific cultural relics.
Overall, the CV and E of landscape elements show a negative correlation trend. The more focused the visual attention is on a few elements, the lower the richness of the content, which conforms to the basic law of tourists’ visual perception; Spar further reflects the combination mode of visual elements in different scenic spots, while R directly mirrors the framing range and element density corresponding to shooting perspectives.

3.3. Tourist Emotional Feedback and Focus Topic Mining

Tourists’ visual shooting behavior directly reflects the resource characteristics and experience focus of core scenic spots, while review texts are the semantic expression and emotional feedback of tourists’ visual experience and on-site feelings. To further analyze the quality of Wuhan’s tourism experience from the cognitive and emotional dimensions, this study identifies the core dimensions of tourists’ cognition based on the review texts of the above nine typical scenic spots, and combines emotional calculation methods to analyze the emotional tendency and emotional causes of each cognitive topic, so as to interpret the advantages and shortcomings of Wuhan’s tourism experience quality.

3.3.1. Analysis of Overall Emotional Characteristics

To further illustrate the actual corresponding situation of emotional scoring, Table 6 lists the emotional intensity scores of some reviews, from which the specific expression content corresponding to different intensity emotions can be seen.
Based on this method, batch processing and statistics were conducted on the reviews of the nine scenic spots, and the overall emotional tendency distribution of each scenic spot was obtained (Table 7). Overall, tourist feedback for each scenic spot is dominated by positive emotions, with the proportion of positive emotions exceeding 70% for most scenic spots; at the same time, there are certain differences in emotional tendencies among different scenic spots, and the proportion of negative emotions in some scenic spots is more prominent than that in others.

3.3.2. Thematic Sentiment Tendency and Attribution Analysis

There are differences in emotional tendencies among different scenic spots. To further understand the causes of emotions, multi-dimensional thematic analysis was conducted on the scenic spot review texts. Through multiple iterations to calculate the perplexity and topic coherence values corresponding to the number of topics, as the number of topics increases, the overall perplexity of the model shows a downward trend. The downward trend tends to flatten when the number of topics is seven, with a significant marginal diminishing effect; coherence reaches its peak when the number of topics is seven, indicating that the semantic correlation of keywords in each topic is optimal at this level. Considering the variation characteristics of the two core indicators comprehensively, seven is finally determined as the optimal number of topics in this study.
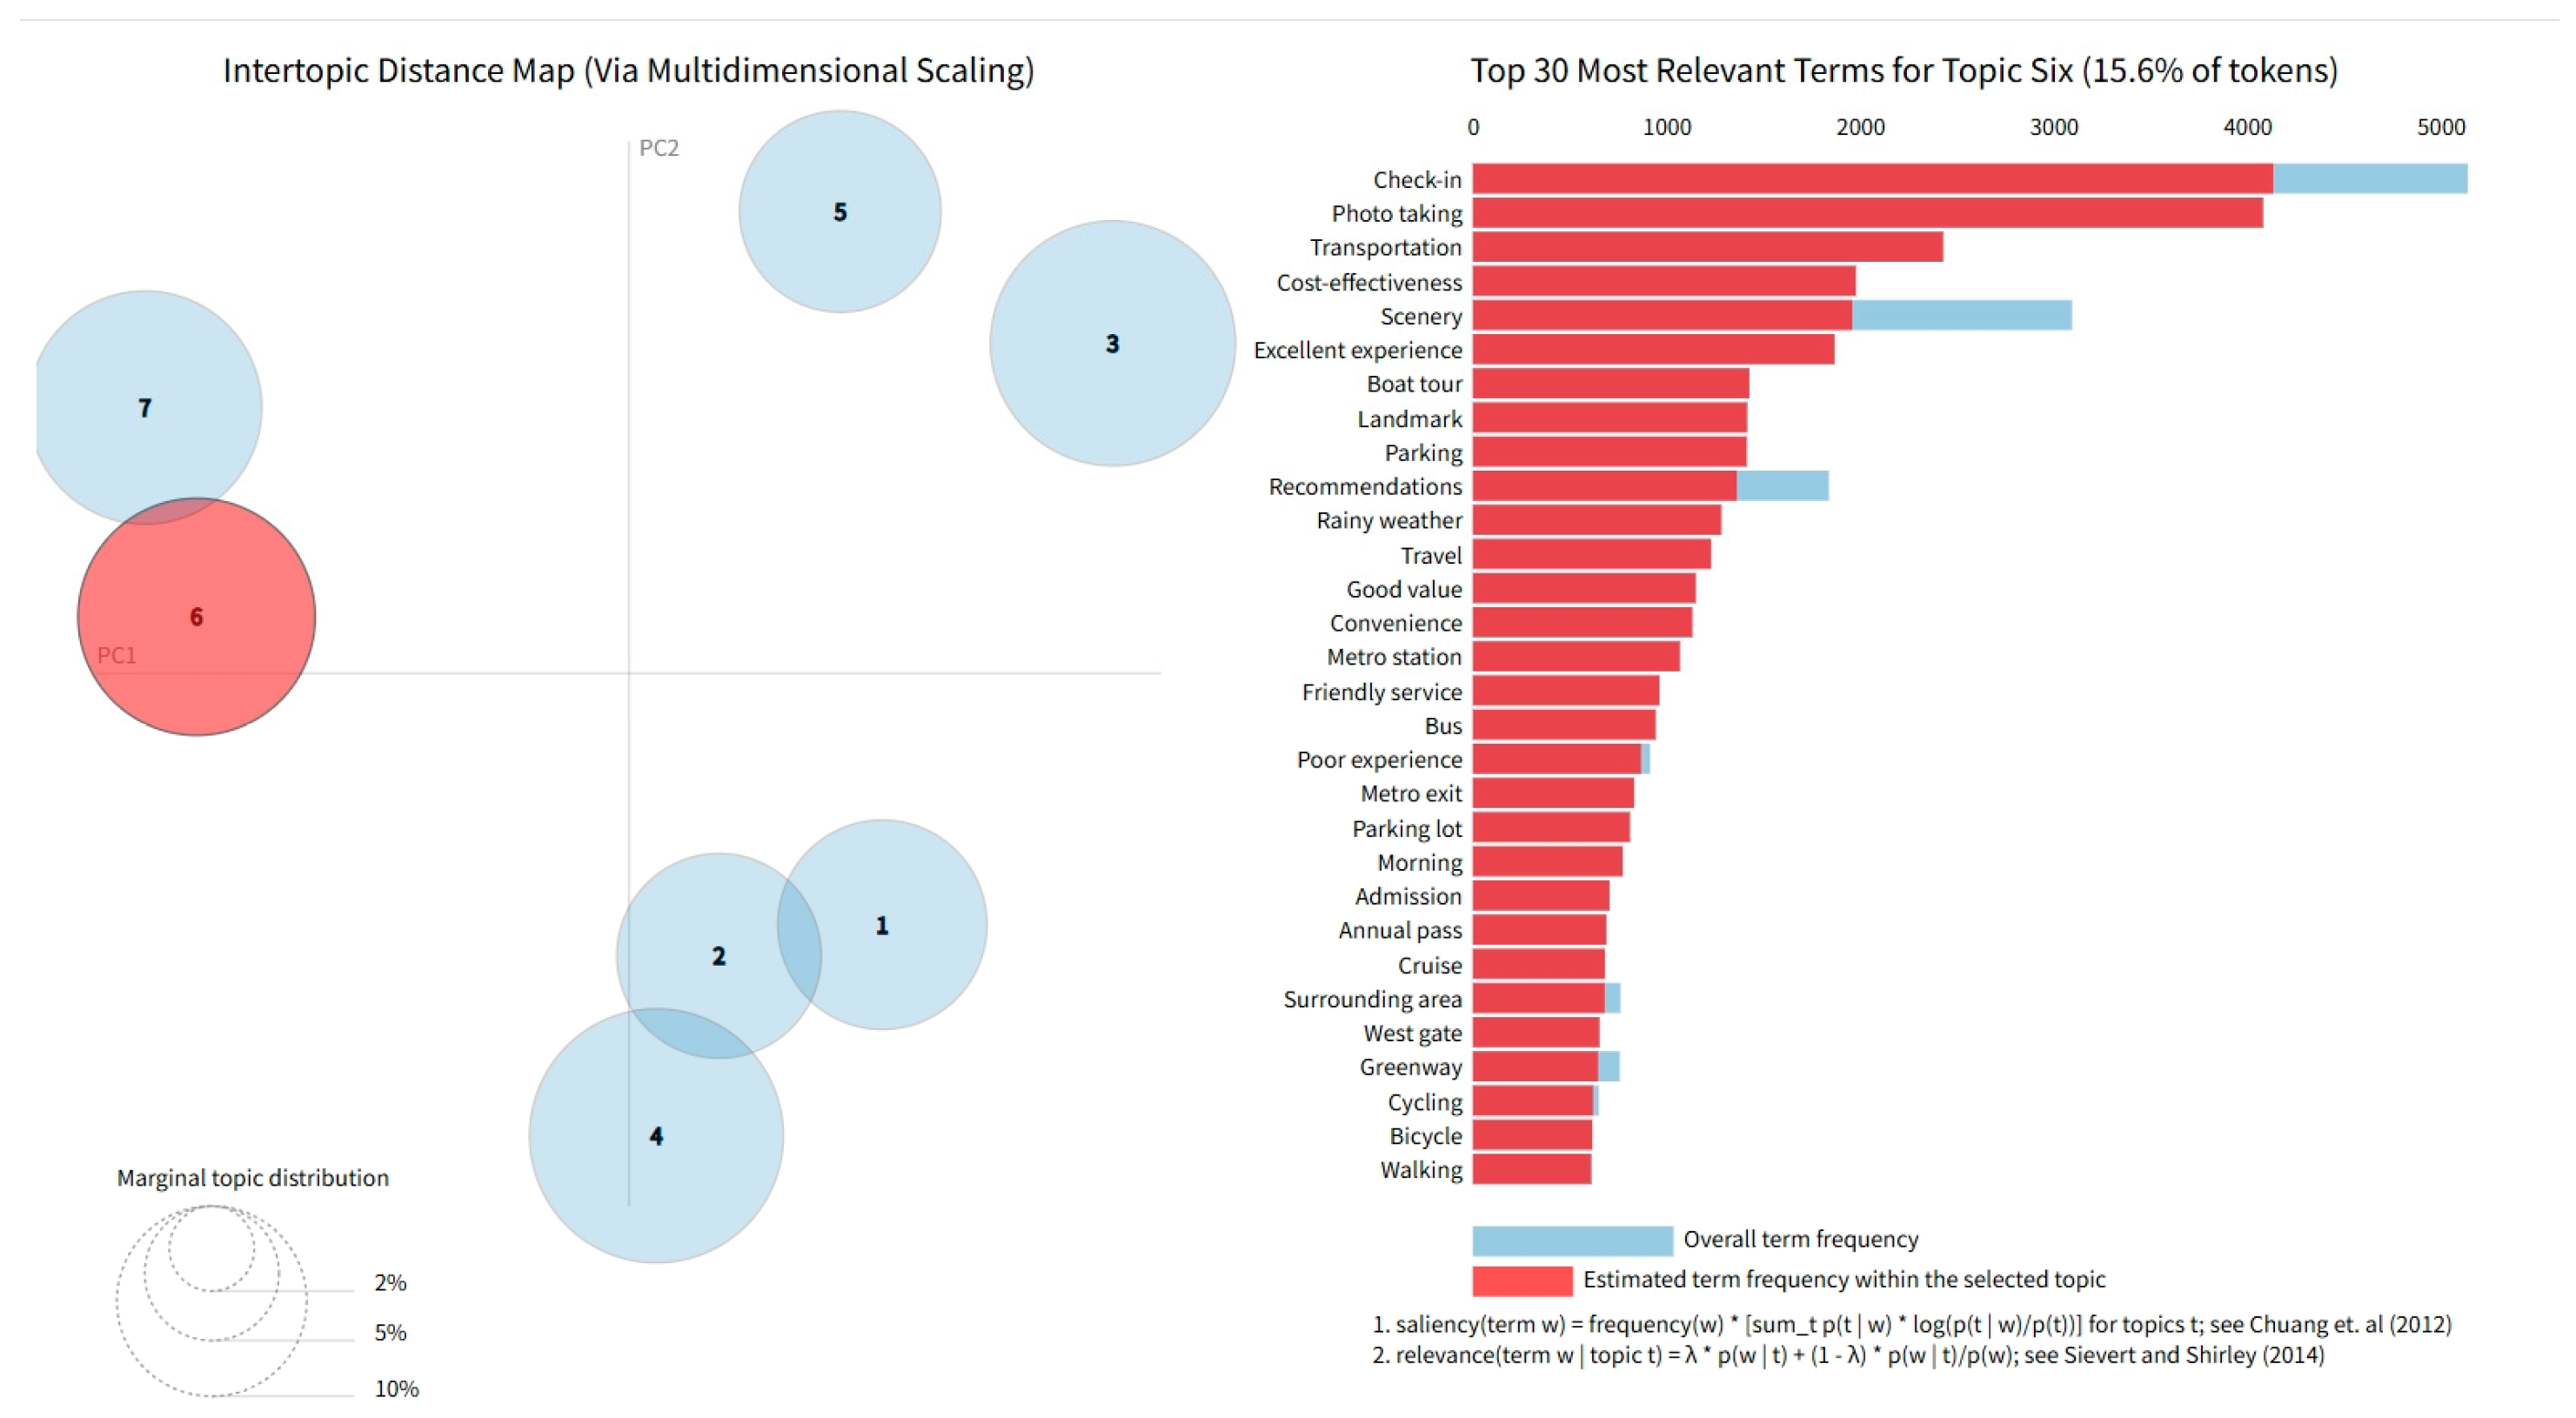
The LDA topic model was further used to conduct cluster analysis on the review texts of typical scenic spots in Wuhan, and seven core topics were extracted(as visualized in Figure 8). Combined with domain background knowledge and daily experience, comprehensive semantic analysis and weight distribution, seven cognitive topics were refined in order: “Experience Service”, “Recreation Activities”, “Supporting Facilities”, “Landscape Features”, “Shopping Consumption”, “Transportation”, and “Night Leisure”, all of which showed a certain degree of differentiation.
Quantitative analysis of the emotional tendency of each cognitive topic shows that the order of the proportion of tourists’ positive emotions is: “Landscape Features (86.31%) > Recreation Activities (84.58%) > Experience Service (80.25%) > Night Leisure (77.36%) > Supporting Facilities (75.82%) > Transportation (72.64%) > Shopping Consumption (68.97%)”, while the order of the proportion of negative emotions is: “Shopping Consumption (11.49%) > Transportation (9.09%) > Supporting Facilities (7.23%) > Experience Service (7.39%) > Night Leisure (6.75%) > Recreation Activities (3.70%) > Landscape Features (2.84%)”. This reverse corresponding relationship reflects the structural differences in tourists’ experience perception of Wuhan. Wuhan’s tourism has advantages in building core attractiveness, but there are still shortcomings in service support and experience guarantee links, which need targeted optimization to improve the overall quality of tourists’ experience.
From the perspective of overall emotional tendency, positive evaluations of Wuhan’s tourism experience dominate. Among them, the proportion of positive evaluations for landscape features and recreation activities is the highest, reflecting tourists’ high recognition of Wuhan’s natural and humanistic landscapes and amusement experiences. From the perspective of negative emotions, the proportion of negative evaluations for shopping and transportation is the highest. The overall negative evaluations can be specifically attributed to the following five aspects:
First, the imbalance of value perception. There is a gap between the ticket prices of some scenic spots and the experience content obtained, with core words including “low cost–performance ratio” and “high price”. For example, Yellow Crane Tower Park is accused of taking climbing for viewing as the main experience, lacking support from core exhibits, and some snacks in Hubu Lane are seen as relatively expensive. In addition, there are phenomena regarding the insufficient transparency of item charges or secondary consumption in individual scenarios.
Second, insufficient traffic control and order maintenance. The ability to control passenger flow during peak periods is weak, with core words including “chaotic management” and “poor passenger flow control”. This is mainly reflected in congestion and long queuing time caused by passenger flow overload, untimely maintenance of some facilities, and imperfect internal navigation systems and traffic jams around the scenic spots.
Third, insufficient experience characteristics. Some scenic spots are mentioned to have a homogenization tendency or insufficient intensity of characteristic experience, with core words including “no characteristics” and “boring”. For example, the commercial form of Hubu Lane is considered by some tourists to be similar to other tourist blocks in China; the attractiveness of Huabohui decreases during the non-flower viewing period, and as a modern reconstructed historical building, the on-site experience of Yellow Crane Tower does not meet with some tourists’ expectations for the historical experience of ancient buildings.
Fourth, poor service quality. Core words include “poor service attitude” and “insufficient explanation service”. Service quality is specifically reflected in the need to improve the service awareness of staff and the accessibility and quality of professional explanation resources.
Finally, poor adaptability to seasonal climates. The experience quality of outdoor scenic spots is significantly affected by seasons and weather, with core words including “strong seasonal restrictions”. For example, flower landscapes have strong seasonality; Wuhan has high temperatures in summer and strong winds on the river surface in winter, and there is a lack of comfortable facilities such as sunshade, wind shelter and rain shelter in outdoor scenic spots.

4. Discussion

4.1. Recommendations

This study depicts spatial hierarchies from three scales: urban, scenic spot, and individual, and integrates multimodal UGC data to improve the research path of tourism image perception. Based on the research conclusions, the following targeted suggestions are proposed around optimizing tourist experience and promoting the sustainable development of Wuhan’s tourism:
  • Control excessive commercialization and highlight local characteristics. The core of sustainable tourism development lies in maintaining regional uniqueness. It is necessary to reasonably control the commercial density of core scenic spots, require clear and transparent pricing of goods and services, and strengthen the overall tourist experience to ensure visitors perceive value for money. Local cultural and creative industries and intangible cultural heritage (ICH) industries should be supported to retain regional features, standardize business operations, and avoid homogenization of business formats.
  • Optimize passenger flow regulation. The unbalanced distribution of tourist flows mainly stems from insufficient publicity and relatively weak attractiveness of peripheral scenic spots. To address unbalanced tourist flow distribution, big data should be used to recommend high-rated, low-congestion alternative scenic spots and roaming routes. Meanwhile, it is necessary to strengthen the promotion of these peripheral attractions and improve their service quality, so as to promote the coordinated development of popular and less-crowded scenic spots and alleviate the contradiction between overcrowding in core areas and underutilization in surrounding areas.
  • Strengthen traffic governance and travel accessibility. Strengthen education on drivers’ traffic etiquette and civility; optimize transport capacity allocation during peak hours to alleviate the difficulty and high cost of hailing vehicles; improve the connectivity between scenic spots and urban traffic, widen surrounding roads, and add parking areas and diversion channels.
  • Improve seasonal service adaptability. Some tourists may feel frustrated because they miss characteristic seasonal landscapes due to inappropriate visiting time. Therefore, scenic spots should release seasonal travel guides and weather prompts to avoid tourists missing the best visiting time caused by information gaps; in addition, add comfortable facilities such as sunshades, wind shelters, and rain shelters to make up for the shortcomings of climate experience in outdoor scenic spots.
  • Implement differentiated operation and management of scenic spots. Tourists’ shooting behavior is an important part of the experience. For humanistic and historical scenic spots with highly focused visual attention, efforts should be made to improve cultural relic interaction and shooting guidance to extend the duration of tourists’ emotional immersion; for natural and leisure scenic spots with diverse visual elements and open viewing angles, it is necessary to protect landscape permeability and viewing facilities; for leisure and entertainment scenic spots, optimize the visual presentation of facilities, create a social communication atmosphere, and promote the transformation from online communication to offline revisits.
  • Strengthen UGC communication empowerment. Explore high-quality visual UGC resources, connect check-in points through thematic narration, promote the upgrading of resource display to emotional connection, and help disseminate the urban image.

4.2. Promotion and Limitations

Although this study takes Wuhan as a case study, its spatial framework and “Behavior–Cognition–Affect” analytical logic are methodologically generalizable. The analysis proceeds progressively from the urban level to the attraction level and then to the individual tourist level, using data-driven and platform-independent techniques. Other cities can adapt this approach by adjusting spatial scales, refining attraction classification, and applying language-specific NLP tools. The identified patterns—core-periphery structure, closely connected attraction clusters, and tourist emotion formation—are widely applicable to similar tourist cities, offering clear implications for planning, traffic organization, and spatial layout.
A common challenge in multimodal analysis is the “modality gap”—semantic discrepancies between text, images, and other data types. Recently, teacher–student knowledge distillation has emerged as a popular machine learning approach to narrow this gap by transferring cross-modal alignment capabilities from large pre-trained teacher models to lightweight student frameworks [44,45].
Distinct from this model-oriented route [46], the present study adopts a human-supervised semantic alignment strategy. This study uses qualitative image coding to match visual features with textual content and employ LLMs to reduce semantic ambiguity across modalities. Guided by a social science perspective, this study prioritizes logical coherence and interpretability over iterative model optimization, focusing on how tourist behavior shapes spatial cognition and further influences emotional experience.
This study still has several directions worthy of in-depth exploration in the future:
First, the authenticity and representativeness of UGC data are constrained. Social platform users are predominantly young and tech-savvy, while middle-aged, elderly, and less digitally engaged tourists are underrepresented. Moreover, UGC is highly subjective and susceptible to distortion due to personal emotions, platform algorithms, and audience effects, which may introduce bias.
Second, temporal analysis remains insufficient. Although we collected one year of data per attraction to account for seasonality, unreliable timestamps and data coverage limitations prevented us from effectively capturing dynamic changes in tourist behavior and emotion across seasons.
Third, methodological constraints exist. The sentiment analysis model lacks accuracy in recognizing internet slang, dialect expressions, and context-dependent texts. Additionally, the absence of comparative analysis, both cross-city and cross-period, limits our ability to highlight the particularity of Wuhan’s tourism or the generalizability of the findings. In addition, traffic-related analysis is restricted by dynamic characteristics: real-time traffic flow and road congestion present obvious temporal and spatial fluctuations, and the static evaluation adopted in this study cannot realize accurate and real-time assessment, with relevant results only serving as a tentative reference for tourism traffic analysis.
Future research should adopt improved data collection methods and more advanced analytical models to enhance the accuracy and generalizability of the findings. Among these, cross-modal semantic alignment techniques and teacher–student knowledge distillation offer promising potential to further automate the alignment process across textual, visual, and auditory modalities, thereby improving the multimodal matching performance within the proposed framework.

5. Conclusions

By integrating multi-source UGC, adopting a progressive “Region–Route–Site” spatial framework and a three-dimensional “Behavior–Cognition–Affect” analytical path, this study addresses the limitations of previous research—namely the over-reliance on single-modal data, the lack of multi-scale spatial integration, and the weak linkage among tourists’ behavior, perception, and emotion throughout the entire travel experience. The findings reveal a clear chain: tourists generate cognitive images during their behavioral experiences, which in turn shape their affective evaluations. The main conclusions are as follows:
  • Behavioral patterns preliminarily outline the overall tourism image of the city. Wuhan’s tourism presents a core-periphery spatial structure: tourist activities are highly concentrated in the central urban area, forming a dense cluster of highly associated attractions such as Yellow Crane Tower, Jianghan Road, and Hubei Provincial Museum. The results indicate that a denser distribution of attractions and service facilities tends to attract more tourists, while tourism development in turn promotes the growth of the local tertiary industry, creating a virtual cycle. At the same time, this spatial agglomeration also reinforces the dissemination and emotional endorsement of iconic symbols such as Yellow Crane Tower and hot dry noodles on social media.
  • Tourists’ perception is formed through behavioral experiences, and visual cognition further differentiates tourist preferences and resource characteristics across different attraction types. Significant differences in visual cognition exist across different scenic spots in Wuhan, which can be roughly divided into three categories: humanistic and historical scenic spots focus on historical buildings and cultural relics; natural scenic spots emphasize open ecological landscape views; leisure and entertainment scenic spots focus on activity scenes and amusement facilities.
  • The formation of tourism destination emotions is a multi-stage cumulative process that runs through various experience touchpoints. Tourists’ emotional feedback can provide targeted directions for experience optimization. Specifically, emotional responses to in-depth cultural experiences and high-quality natural landscapes in Wuhan are positive, whereas consumption-oriented and highly crowded scenic spots in the city tend to generate negative evaluations. These negative emotions are mainly concentrated on price perception, management order, and service quality, thereby highlighting clear priorities for improvement.

Author Contributions

Conceptualization, J.F.; methodology, J.F.; validation, W.X. and W.W.; formal analysis, J.F. and Z.X.; investigation, J.F. and W.L.; resources, W.L.; data curation, J.F. and W.X.; writing—original draft preparation, J.F.; writing—review and editing, J.F. and W.L.; visualization, J.F. and W.L.; supervision, W.L.; project administration, W.L. and W.X.; funding acquisition, W.L. All authors have read and agreed to the published version of the manuscript.

Funding

This research was funded by the Wuhan Key Research and Development Program (Technology Innovation Project), grant number 2024050702030122, titled “Intelligent Collaborative Governance Platform for Urban Tourism Industry Based on Behavior Perception”.

Institutional Review Board Statement

Not applicable.

Informed Consent Statement

Not applicable.

Data Availability Statement

Data supporting the results reported in this article were collected from publicly accessible user-generated content on mainstream tourism and social media platforms. All data were legally and manually gathered under ethical principles, with no violation of user privacy, personal information, or copyright regulations. Data were used exclusively for non-commercial academic research purposes only. Owing to privacy and ethical restrictions, as well as platform terms of service, the raw data are not publicly available. However, data can be made available from the corresponding author upon reasonable request.

Conflicts of Interest

The authors declare no conflicts of interest.

Abbreviations

The following abbreviations are used in this manuscript:
UGCUser-Generated Content
GISGeographic Information System/Science
NLPNatural Language Processing
LDALatent Dirichlet Allocation

References

  1. Liu, Y.; Zhou, X.; Zhang, N. Review of methods and applications for analyzing user-generated content. J. Comput. Appl. 2025, 45, 14–20. [Google Scholar]
  2. Kitsios, F.; Mitsopoulou, E.; Moustaka, E.; Kamariotou, M. User-Generated Content behavior and digital tourism services: A SEM-neural network model for information trust in social networking sites. Int. J. Inf. Manag. Data Insights 2022, 2, 100056. [Google Scholar] [CrossRef] [Scilit]
  3. Lu, L.; Bao, J.; Huang, J.; Zhu, Q.; Mu, C.; Chu, X.; Xu, Y.; Zha, X. Recent Research Progress and Prospects in Tourism Geography of China. J. Geogr. Sci. 2016, 26, 1197–1222. [Google Scholar] [CrossRef] [Scilit]
  4. Bruwer, J.; Pratt, M.A.; Saliba, A.; Hirche, M. Regional destination image perception of tourists within a winescape context. Curr. Issues Tour. 2017, 20, 157–177. [Google Scholar] [CrossRef] [Scilit]
  5. Li, S.; Liu, F.; Zhang, Y.; Zhu, B.; Zhu, H.; Yu, Z. Text mining of User-Generated Content (UGC) for business applications in e-commerce: A systematic review. Mathematics 2022, 10, 3554. [Google Scholar] [CrossRef] [Scilit]
  6. Yuan, X.; Hu, Y. Impact of UGC on Consumer Brand Behaviors. Show Econ. 2024, 12, 99–102. [Google Scholar] [CrossRef]
  7. Rajamma, R.K.; Paswan, A.; Spears, N. User-Generated Content (UGC) misclassification and its effects. J. Consum. Mark. 2020, 37, 125–138. [Google Scholar] [CrossRef] [Scilit]
  8. Dos Santos, M.L.B. The “so-called” UGC: An updated definition of user-generated content in the age of social media. Online Inf. Rev. 2021, 46, 95–113. [Google Scholar] [CrossRef] [Scilit]
  9. Bai, H.; Song, Z.; Liang, S.; Zhang, P.; Zhang, G. Imagery perception analysis and comprehensive attraction evaluation of tourism destinations based on internet text data: Taking Nanjing city as example. Areal Res. Dev. 2023, 42, 89–94. [Google Scholar]
  10. Wang, J.; Li, Y.; Wu, B.; Wang, Y. Tourism destination image based on tourism user generated content on internet. Tour. Rev. 2021, 76, 125–137. [Google Scholar] [CrossRef] [Scilit]
  11. Feng, Y.; Xu, Z.; Wen, Y. Research progress of tourism data mining based on UGC data. Guangxi Sci. 2024, 31, 87–99. [Google Scholar]
  12. Zhu, Y.; Zou, Y.; Chen, L. Analysis of spatial-temporal characteristics of urban tourism flow based on UGC data: Taking Shanghai as an example. Tour. Forum. 2019, 12, 33–41. [Google Scholar]
  13. Urry, J. The Tourist Gaze: Leisure and Travel in Contemporary Societies; Sage Publications: London, UK, 1990. [Google Scholar]
  14. Liu, D. Tourist gaze: From Foucault to Urry. Tour. Trib. 2007, 22, 91–95. [Google Scholar]
  15. Park, E.; Kim, S. Are we doing enough for visual research in tourism? The past, present, and future of tourism studies using photographic images. Int. J. Tour. Res. 2018, 20, 433–441. [Google Scholar] [CrossRef] [Scilit]
  16. Choi, S.; Lehto, X.Y.; Morrison, A.M. Destination image representation on the web: Content analysis of Macau travel related websites. Tour. Manag. 2007, 28, 118–129. [Google Scholar] [CrossRef] [Scilit]
  17. Huang, Y.; Zhao, Z.; Chu, Y.; Zhang, C. The visual representation of tourism destinations in the internet era: Multiple construction and circulation. Tour. Trib. 2015, 30, 91–101. [Google Scholar]
  18. Zhang, K.; Chen, Y.; Li, C. Discovering the tourists’ behaviors and perceptions in a tourism destination by analyzing photos’ visual content with a computer deep learning model: The case of Beijing. Tour. Manag. 2019, 75, 595–608. [Google Scholar] [CrossRef] [Scilit]
  19. Liu, Y.; Bao, J.; Chen, K. Emotional characteristics of Chinese tourists to Australia: A big data-based text analysis. J. Tour. Sport Soc. 2017, 32, 46–58. [Google Scholar]
  20. Liu, Y.; Bao, J.; Zhu, Y. Exploring emotion methods of tourism destination evaluation: A big-data approach. Geogr. Res. 2017, 36, 1091–1105. [Google Scholar]
  21. Blei, D.M.; Ng, A.Y.; Jordan, M.I. Latent dirichlet allocation. J. Mach. Learn. Res. 2003, 3, 993–1022. [Google Scholar]
  22. Guidotti, D.; Pandolfo, L.; Pulina, L. Discovering sentiment insights: Streamlining tourism review analysis with large language models. Inf. Technol. Tour. 2025, 27, 227–261. [Google Scholar] [CrossRef] [Scilit]
  23. Liu, W.; Wu, L.; Zhao, H. Improving sentiment analysis in tourism through LLM-enhanced irony detection. Tour. Manag. 2025, 112, 105272. [Google Scholar] [CrossRef] [Scilit]
  24. Yamanishi, H.; Xiao, L.; Yamasaki, T. TourMLLM: A Retrieval-Augmented Multimodal Large Language Model for Multitask Learning in the Tourism Domain. In Proceedings of the 2025 International Conference on Multimedia Retrieval, Chicago, IL, USA, 30 June–3 July 2025; IEICE Technical Report; Association for Computing Machinery: New York, NY, USA, 2025; pp. 1654–1663. [Google Scholar] [CrossRef] [Scilit]
  25. Calderón-Fajardo, V.; Rodríguez-Rodríguez, I.; Puig-Cabrera, M. From Words to Visuals: A Transformer-Based Multi-Modal Framework for Emotion-Driven Tourism Analytics. Inf. Technol. Tour. 2025, 27, 939–979. [Google Scholar] [CrossRef] [Scilit]
  26. Fang, Y.; Pang, X.Q.; Yu, Q.Y.; Min, F.; Cao, X.M.; Tao, P.; Li, T.R. Alignment in Large Vision-Language Models: A Survey. Inf. Fusion 2026, 133, 104294. [Google Scholar] [CrossRef] [Scilit]
  27. Li, S.; Tang, H. Multimodal Alignment and Fusion: A Survey. arXiv 2024, arXiv:2411.17040. [Google Scholar] [CrossRef] [Scilit]
  28. Baltrusaitis, T.; Ahuja, C.; Morency, L.-P. Multimodal machine learning: A survey and taxonomy. IEEE Trans. Pattern Anal. Mach. Intell. 2018, 41, 423–443. [Google Scholar] [CrossRef] [Scilit] [PubMed]
  29. García-Hernández, M.; Ivars-Baidal, J.; Mendoza de Miguel, S. Overtourism in urban destinations: The myth of smart solutions. Boletín Asoc. Geógrafos Españoles 2019, 83, 1–38. [Google Scholar] [CrossRef] [Scilit]
  30. Koens, K.; Postma, A.; Papp, B. Is overtourism overused? Understanding the impact of overtourism in European cities. Sustainability 2018, 10, 4384. [Google Scholar] [CrossRef] [Scilit]
  31. Baloglu, S.; McCleary, K.W. A model of destination image formation. Ann. Tour. Res. 1999, 26, 868–897. [Google Scholar] [CrossRef] [Scilit]
  32. Xiong, X. Wuhan Accelerates Construction of World-Famous Cultural Tourism Destination. Xinhuanet, 24 September 2025. Available online: https://www.xinhuanet.com/local/20250924/93a29b1691a74becbbe7c98e70f262aa/c.html (accessed on 17 April 2026).
  33. Qu, X. Wuhan, Hubei: Moving from a Major Tourism City to a Strong Tourism City. China Culture Daily, 17 October 2025. Available online: https://www.mct.gov.cn/whzx/qgwhxxlb/hb_7730/202510/t20251017_962805.htm (accessed on 17 April 2026).
  34. Scott, N.; Baggio, R.; Cooper, C. Network Analysis and Tourism: From Theory to Practice; Channel View Publications: Clevedon, UK, 2008. [Google Scholar]
  35. Yuan, C.; Kong, X.; Li, L.; Li, Y. Traditional Village Image Perception Based on Tourist UGC Data: A Case of Chengkan Village. Econ. Geogr. 2020, 40, 203–211. [Google Scholar]
  36. Wang, Q.; Liu, Y.; Li, X.; Zhang, B.; Zhang, C. Evolution characteristics of 24 major cities’ network attention degree of six elements of tourism in China. World Reg. Stud. 2017, 26, 45–55. [Google Scholar]
  37. Shannon, C.E. A mathematical theory of communication. Bell Syst. Tech. J. 1948, 27, 379–423. [Google Scholar] [CrossRef] [Scilit]
  38. Barberán, A.; Bates, S.T.; Casamayor, E.O.; Fierer, N. Using network analysis to explore co-occurrence patterns in soil microbial communities. ISME J. 2012, 6, 343–351. [Google Scholar] [CrossRef] [Scilit] [PubMed]
  39. McGarigal, K.; Marks, B.J. FRAGSTATS: Spatial Pattern Analysis Program for Quantifying Landscape Structure; USDA Forest Service: Salt Lake City, UT, USA, 1995. [Google Scholar]
  40. Jim, J.R.; Talukder, M.A.R.; Malakar, P.; Kabir, M.; Nur, K.; Mridha, M. Recent advancements and challenges of NLP-based sentiment analysis: A state-of-the-art review. Nat. Lang. Process. J. 2024, 6, 100059. [Google Scholar] [CrossRef] [Scilit]
  41. Chen, X.; Li, J.; Han, W.; Liu, S. Urban tourism destination image perception based on LDA integrating social network and emotion analysis: The example of Wuhan. Sustainability 2019, 14, 12. [Google Scholar] [CrossRef] [Scilit]
  42. Chuang, J.; Ramage, D.; Manning, C.; Heer, J. Interpretation and Trust: Designing Model-Driven Visualizations for Text Analysis. In Proceedings of the SIGCHI Conference on Human Factors in Computing Systems (CHI ’12), Austin, TX, USA, 5–10 May 2012; Association for Computing Machinery: New York, NY, USA, 2012; pp. 443–452. [Google Scholar] [CrossRef] [Scilit]
  43. Sievert, C.; Shirley, K.E. LDAvis: A Method for Visualizing and Interpreting Topics. In Proceedings of the Workshop on Interactive Language Learning, Visualization, and Interfaces, Baltimore, MA, USA, 27 June 2014; pp. 63–70. [Google Scholar] [CrossRef] [Scilit]
  44. Hinton, G.; Vinyals, O.; Dean, J. Distilling the Knowledge in a Neural Network. arXiv 2015, arXiv:1503.02531. [Google Scholar] [CrossRef] [Scilit]
  45. Mao, K.; Dai, W.; Guo, Z.; Sun, X.; Xiao, L. A Review of the Evolution and Applications of AI Knowledge Distillation. J. Agric. Big Data 2025, 7, 144–154. [Google Scholar]
  46. Zhang, D.; Wang, F.; Li, B.; Zhao, Z.; Gao, J.; Li, X. KAID: Knowledge-Aware Interactive Distillation for Vision-Language Models. In Proceedings of the 33rd ACM International Conference on Multimedia (MM 2025), Dublin, Ireland, 27–31 October 2025; Association for Computing Machinery: New York, NY, USA, 2025; pp. 3212–3221. [Google Scholar]
Figure 1. Technical route.
Applsci 16 04518 g001
Figure 2. Heatmap of Wuhan attractions and tourist trajectories.
Applsci 16 04518 g002
Figure 3. Spatial distribution pattern of tourism service facilities in Wuhan. (a) Restaurant density distribution. (b) Accommodation density distribution. (c) Mall density distribution. (d) Recreational Site density distribution. The recreational sites in panel (d) are not limited to traditional scenic spots; they also include public leisure spaces and cultural landmarks (e.g., temples, squares, and parks).
Applsci 16 04518 g003
Figure 4. Association heatmap of core attractions in Wuhan.
Applsci 16 04518 g004
Figure 5. Road networks associated with attractions and place names in Wuhan.
Applsci 16 04518 g005
Figure 6. Stacked bar chart of tourist photos by category at major attractions in Wuhan.
Applsci 16 04518 g006
Figure 7. Co-occurrence network of landscape elements at major attractions in Wuhan. (a) East Lake Scenic Area. (b) Hubu Lane. (c) Wuhan Huabohui. (d) Wuhan Happy Valley. (e) Hubei Provincial Museum. (f) HHAn Wuhan Polar Ocean Park. (g) Wuhan Two-Rivers Cruise. (h) Yellow Crane Tower Park. (i) Wuhan University.
Applsci 16 04518 g007
Figure 8. LDA topic analysis bubble chart. The left panel presents the intertopic distance map via multidimensional scaling, where each numbered circle represents a distinct topic (1: Experience service; 2: Supporting facilities; 3: Recreation activities; 4: Landscape features; 5: Shopping consumption; 6: Transportation; 7: Night leisure). The right panel displays the top 30 most relevant terms for Topic 6 (Transportation). Term saliency and relevance calculations follow the methods described in Chuang et al. [42] and Sievert and Shirley [43].
Applsci 16 04518 g008
Table 1. Selection of typical attractions and sample sizes in Wuhan.
RankAttraction NameTypeNumber of Valid ReviewsNumber of Initial Photos Final Photo Samples (10% Random Sampling)
1Yellow Crane Tower ParkHistoric Site59983176310
2Hubei Provincial MuseumChu Culture36373989386
3East Lake Scenic AreaOutdoor Leisure30002757274
4Wuhan Two-Rivers CruiseNight River View48283731370
5HHAn Wuhan Polar Ocean ParkIndoor Parent–Child34903016288
6Wuhan Happy ValleyTheme Park33402534253
7Hubu LaneFood Market24001303129
8Wuhan HuabohuiFlower and& Outing29162228218
9Wuhan UniversityCampus Culture31951238123
Note. All values in the last three columns represent counts (n).
Table 2. Overall statistics of high-frequency words in Wuhan travel vlogs.
RankKeywordFrequencyRankKeywordFrequency
1Wuhan242916Friends226
2Delicious83517Queuing216
3Yellow Crane Tower55618Shumai200
4Hot Dry Noodles42719Morning196
5Breakfast42420Yangtze River185
6Check-in40121Good173
7East Lake36122Li Huangpi Road167
8Like35223Doupi167
9Evening32224Gude Temple166
10Hotel31925Jianghan Road162
11Taste30926Museum157
12Taking Photos29327Afternoon157
13Beef Noodles28428Ferry146
14Hankou25029Characteristic144
15Architecture24630Experience139
Table 3. Categorization of word frequency for tourists’ behavioral dimensions in Wuhan.
RankCategoryFrequencyProportionDimension Keyword
1Scenic Spot
and Location
543533.076%Wuhan, Yellow Crane Tower, East Lake, Hankou, Li Huangpi Road, Gude Temple, Jianghan Road, Museum, River Beach, Yangtze River Bridge, Liangdao Street, Tanhualin, Bagong House, Jianghan Pass, Wuhan University, Hubei Provincial Museum, Jianghan Road Pedestrian Street, Hubu Lane, etc.
2Food and Cuisine379323.083%Delicious, Hot Dry Noodles, Taste, Beef Noodles, Breakfast, Shaomai, Breakfast, Doupi, Carbonated Water, Mouthfeel, Glutinous Rice, Oil Cake, Fried Dough Sticks, Coffee, Takeout, Noodle Nest, Flavor, Three Fresh Bean Skin, Tea Yan Yue Se, Chicken Crown Bun, Lotus Root Soup, etc.
3Activity and Experience216113.151%Check-in, Taking Photos, Queuing, Characteristic, Experience, Feeling, Suitable, Tourism, Travel Guide, Travel, Strolling, Visiting, Itinerary, Reservation, Experience, Challenge, Appreciation, Relaxation, Walking and Eating, etc.
4Emotional Evaluation15779.597%Like, Good, Cute, Beautiful, Comfortable, Happy, Joyful, Romantic, Artistic, Expectation, Fun, Authentic, Wow, Atmosphere, Success, Cheap, Fragrant, Cozy, Wonderful, etc.
5Time12317.491%Evening, Morning, Afternoon, Noon, Tomorrow, Yesterday, Night View, Sunset, Two Days, First Day, Dusk, etc.
6Transportation10436.347%Taxi, Subway, Walking, High-Speed Rail, Ferry, Wharf, Cycling, Bicycle, Subway Station, Train, Bus, Route, Airplane, etc.
7Others11927.254%Friend, Architecture, Weather, History, Culture, Life, Price, Design, School, Story, Plan, Mood, etc.
Table 4. Node coding scheme for tourist photos at scenic spots.
Tree NodeFree NodeReference Point Description
1. Tourism
Support System
1. Information Board; 2. Tourist Map;
3. Hotel; 4. Entertainment Facilities;
5. Rest Facilities
Mainly covers service facilities and venues oriented towards tourists
2. Material Culture1. Ancient Artifacts; 2. Modern Crafts;
3. Historical Sites and Relics
Exhibits, decorative ornaments, and historical relics related to culture and history
3. Natural Scenery1. Vegetation; 2. Mountains;
3. Water Scenery; 4. Sky; 5. Animals
Natural ecological landscapes in the scenic area, such as mountains and rivers, sky, animals and plants, etc.
Note. Partial node coding scheme shown; full classification omitted for brevity.
Table 5. Dispersion metrics of landscape elements by attraction.
RankAttraction NameCVESparR
1Yellow Crane Tower Park4.1496.5940.2901.895
2Hubei Provincial Museum6.1342.8690.2981.151
3East Lake Scenic Area4.0475.6070.3062.157
4Wuhan Two-Rivers Cruise2.5165.4730.6983.635
5HHAn Wuhan Polar Ocean Park4.7344.7860.4221.392
6Wuhan Happy Valley3.0775.5470.4082.186
7Hubu Lane2.8115.3240.3691.961
8Wuhan Huabohui3.1465.4650.4542.188
9Wuhan University2.9115.2400.4702.236
Table 6. Examples of sentiment scores for review texts.
RankComments (Chinese–English Translation)Sentiment
Score
Sentiment
Tendency
1The service staff at the scenic spots are very friendly, and every project has its own unique features. It is wonderful, and there are so many fun activities for kids. I do not want to leave after playing—how can there be such a fun place!73.62Strongly
Positive
2During the summer vacation, tickets for the provincial museum are extremely popular and need to be booked several days in advance.2.2Neutral
3It is not necessary to go unless you have to; the cost–performance ratio is too low.−6.4Slightly
Negative
4It is extremely uncomfortable being packed with people. It took an hour to go upstairs; the corridor was full of people, reeking of carbon dioxide, and completely airless. I almost passed out, and it is very dangerous—stampede incidents are likely to happen. I will never go to Yellow Crane Tower during holidays again. I have no mood to appreciate it at all, and it is not suitable to go in bad weather either. The photos do not look good, they are hazy. Overall, the experience is terrible!−61.98Strongly
Negative
Table 7. Distribution of sentiment tendency by attraction.
Attraction NamePosition EmotionNeutral EmotionNegative Emotion
Wuhan Huabohui85.56%11.35%3.09%
Wuhan Happy Valley85.48%11.68%2.84%
East Lake Scenic Area83.95%9.30%6.75%
Hubei Provincial Museum83.04%14.19%2.77%
HHAn Wuhan Polar Ocean Park82.92%14.79%2.29%
Wuhan University82.25%15.81%1.94%
Wuhan Two-Rivers Cruise78.56%15.65%5.79%
Yellow Crane Tower Park71.91%18.21%9.88%
Hubu Lane65.25%18.71%16.04%
Disclaimer/Publisher’s Note: The statements, opinions and data contained in all publications are solely those of the individual author(s) and contributor(s) and not of MDPI and/or the editor(s). MDPI and/or the editor(s) disclaim responsibility for any injury to people or property resulting from any ideas, methods, instructions or products referred to in the content.