Article

Conventional and AI-Assisted Topology-Driven Workflows for Injection-Molded Lightweight Structures: A Quantitative Case Study


by
Maurice Schulz
1,*,
Zhikun Yang
1,
Justus Losse
1,
Alexander Brunner
1,
Zhichao Qu
2 and
Christian Lauter
1
1
Department for Lightweight Design and Fiber-Reinforced Plastics, PHWT Institute, PHWT University of Applied Sciences Vechta/Diepholz, Am Campus 2, 49356 Diepholz, Germany
2
Sino-German Technological Faculty, Qingdao University of Science and Technology, No. 99 Songling Rd., Qingdao 260061, China
*
Author to whom correspondence should be addressed.
Appl. Sci. 2026, 16(9), 4196; https://doi.org/10.3390/app16094196
Submission received: 23 March 2026 / Revised: 21 April 2026 / Accepted: 23 April 2026 / Published: 24 April 2026
(This article belongs to the Section Mechanical Engineering)

Featured Application

The presented workflows target engineering teams developing load-bearing, injection-molded lightweight components, for example, in automotive applications. The automated, AI-assisted process can be used to generate and evaluate large numbers of topology-optimized design variants under realistic manufacturing constraints and to identify promising regions of the design space in early development stages. The quantitative comparison with the conventional workflow, including break-even and scaling behavior, provides a practical basis for deciding when investments in workflow automation and surrogate modeling are beneficial. The described workflow architecture and metrics can serve as a template for implementing and benchmarking similar CAE automation strategies in industrial environments.

Abstract

The increasing availability of automated development workflows and data-driven methods raises the question of when approaches based on artificial intelligence (AI) provide potential benefits over established engineer-driven workflows in lightweight structural design. This paper presents a quantitative comparison between a conventional engineer-driven process and an AI-assisted, automated workflow for an injection-molded component with fixed installation space, identical boundary conditions, and manufacturing constraints. In the conventional process, topology optimization is followed by manual CAD reconstruction and iterative finite element analysis. In the AI-assisted process, an automated workflow generates many design variants that are simulated and used to train a regression-based surrogate model for rapid exploration of the design space. The conventional workflow yields a manufacturable structure with a high stiffness-to-mass ratio and controlled stresses, whereas the geometry selected from the surrogate model’s prediction shows reduced stiffness, higher stress peaks, and manufacturability issues. The analysis of the best-performing design identified ex post within the training data, rather than directly by the surrogate, illustrates the potential of the automated workflow but also highlights insufficient predictive accuracy for locally stress-sensitive quantities. On the process level, the AI-assisted workflow exhibits clear scaling advantages and a distinct break-even point in terms of development effort, suggesting that such methods are currently best suited as complementary tools for early-stage design space exploration. The quantitative effort values and the break-even point, however, are case-specific and should be interpreted as order-of-magnitude indicators rather than universally valid thresholds.

1. Introduction

Engineering product development, particularly in the automotive sector, has been undergoing profound change in recent years [1,2]. Electrified powertrains, stricter lightweight design targets, increasing functional integration and a growing number of product variants lead to a significant rise in system and development complexity [3]. Under these conditions, conventional and predominantly sequential development processes are increasingly reaching both organizational and methodological limits [4], while development departments are expected to deliver robust designs in shorter time frames and under tighter cost and sustainability constraints [5].
In parallel, the digitalization of engineering processes continues to progress. Classical, simulation- and experience-based engineering methods are increasingly complemented by data-driven approaches and partially automated workflows. Mass reduction, cost optimization and shortened development cycles are key objectives in structural lightweight design [6] and have stimulated growing industrial interest in the use of artificial intelligence (AI), surrogate models and workflow automation [7,8]. At the same time, systematic and quantitatively grounded evidence on when AI-assisted development approaches provide tangible advantages over established engineer-driven methods, and where their current methodological limits lie, is still scarce and partly controversially discussed [9].
Lightweight structures are a central lever for increasing energy efficiency and reducing emissions, especially in automotive engineering [10,11]. Plastic materials and fiber-reinforced composites are widely used for load-bearing, supporting and guiding functions [12] due to their low density, high design freedom and suitability for economical series production [13,14,15]. Injection molding is a key manufacturing process for such components. When plastic parts are used in load-bearing functions, however, additional challenges arise. Besides fulfilling structural mechanical requirements, manufacturing-related constraints such as permissible wall thickness ranges, the avoidance of undercuts and critical cores, restrictions on weld lines and sink marks, and the definition of a clear demolding direction must be satisfied. These constraints not only govern the geometric design of the component but also directly affect process stability, part quality and the achievable mechanical performance of injection-molded structures [16].
Topology optimization has become an established tool to support structural lightweight design [17,18]. Its goal is to determine an optimal material distribution within a given design space for a specified objective, typically minimizing compliance or maximizing stiffness under mass or volume constraints [19]. The resulting designs are usually represented as complex, discretized material distributions that identify load paths but are not directly manufacturable, especially under injection-molding-specific constraints [20]. In industrial development processes, topology optimization is therefore typically followed by a manual reconstruction phase. Engineers interpret the optimization results, define rib structures and cross-sections, harmonize wall thicknesses and radii, and incorporate manufacturing guidelines. Finite element analysis (FEA) is used iteratively to validate and refine the reconstructed geometries with respect to displacements, stresses and global stiffness [21]. This iterative cycle of topology optimization, manual CAD reconstruction and numerical validation forms the core of many conventional, engineer-driven development workflows in structural design [22].
In contrast, data-driven approaches aim to learn physical relationships between parameters and responses from observed data rather than deriving them explicitly from governing mechanical equations [23]. Artificial neural networks and other machine learning models can be trained as surrogate models to approximate nonlinear mappings between geometric or process parameters and resulting quantities such as mass, stiffness or displacement. Once trained on a sufficiently rich dataset, such surrogates can be used to rapidly predict the structural response for new parameter combinations and thereby enable fast design space exploration [24]. A key challenge, however, lies in the prediction of locally stress-sensitive quantities and in assessing manufacturability [25]. Local stress peaks are strongly influenced by fine-scale geometric effects, notches and mesh-related details, which are only partially captured by a small number of scalar input parameters [26]. Recent work has therefore explored more specialized surrogate strategies for stress-sensitive structural responses, including neural-network-based local stress evaluation in stress-constrained topology optimization and neural-network-assisted postprocessing of topology-optimized structures after CAD reconstruction [27,28]. In addition, classical AI models have no inherent knowledge of manufacturing rules and cannot directly evaluate whether a design is suitable for injection molding [29]. In parallel, manufacturing-aware topology optimization increasingly incorporates explicit process-related constraints directly into the optimization stage in order to improve downstream manufacturability [30]. These limitations are central when interpreting the potential and current boundaries of AI-assisted workflows in structural lightweight design and contribute to diverging views on the extent to which AI can replace or meaningfully complement classical engineering methods [31].
Against this background, there is a lack of quantitative studies that compare conventional, engineer-driven workflows and AI-assisted, automated workflows under identical boundary conditions for realistic lightweight structures. In particular, systematic insights into break-even behavior and scaling effects in terms of development effort, as well as into the practical limitations of surrogate models in such settings, are still missing.
The present work addresses this gap by performing a quantitative case study on a representative load-bearing plastic component. A conventional, topology-driven development process and an AI-assisted, largely automated workflow are applied to the same design problem defined by a fixed installation space, identical loading conditions, a uniform material and injection-molding-specific manufacturing constraints. The study addresses the following research questions:
  • RQ1. Under which conditions does an AI-assisted, largely automated topology-driven workflow become more efficient than a conventional, engineer-driven process in terms of overall development effort?
  • RQ2. How does the mechanical performance and manufacturability of designs obtained from an AI-assisted workflow compare to those obtained from a conventional workflow under identical boundary conditions?
  • RQ3. What are the current limitations of a regression-based surrogate model in a realistic structural design scenario?
The main contributions of this paper are threefold:
  • A reproducible, largely automated workflow architecture is implemented and documented that integrates topology optimization, geometry reconstruction, finite element analysis, and data logging within a single orchestration framework, explicitly reflecting injection-molding–related manufacturing constraints for a realistic load-bearing component.
  • A quantitative, process-level comparison is carried out between a conventional engineer-driven development route and the AI-assisted workflow, including a break-even analysis of development effort and an assessment of how each approach scales with the number of variants. Such a detailed effort and scalability comparison for topology-driven design of injection-molded structures has not been reported in the literature so far.
  • The predictive capabilities and limitations of a regression-based neural-network surrogate model for stiffness- and stress-related quantities in this topology-driven setting are evaluated empirically, with a particular focus on stress-distribution metrics. This provides a nuanced picture of when surrogate-based selection can reliably guide design decisions and where detailed FEA remains indispensable.
On this basis, the paper derives a realistic assessment of the role that AI-assisted methods can currently play in structural lightweight design and identifies scenarios in which hybrid processes combining conventional and data-driven approaches appear particularly promising.

2. Materials and Methods

This section describes the methodological framework used to compare the conventional and AI-assisted development processes. It introduces the investigated case study and its boundary conditions, outlines both development workflows, and defines the evaluation metrics and comparison procedure on the product and process levels. The level of detail is chosen to enable reproducibility of the study and to provide a transparent basis for interpreting the subsequent results.

2.1. Case Study, Installation Space, and Boundary Conditions

The case study considers a lightweight plastic load-bearing component whose boundary conditions are representative of typical automotive applications. The component is fully contained within a predefined installation space, with the outer contour and installation position fixed by the vehicle architecture. Consequently, the available design freedom is restricted to the internal material distribution. This type of component is particularly suitable for comparing automated and conventional development workflows, as the external geometry is fixed while the internal material distribution offers substantial optimization potential. This ensures a controlled comparison under identical geometric, mechanical and manufacturing constraints.
The CAD and finite element models of the reference component are shown in Figure 1, while the objectives, design freedoms and constraints defining the optimization problem are summarized in Table 1.
Figure 1 illustrates the installation space, support surfaces and load introduction. Two support surfaces constrain the structure; in the finite element model, translational displacements in all three spatial directions are restricted at these locations. The load is applied as a static axial tensile force of 10 kN over a defined load application area, resulting in a directed stress path between the load introduction and the bearing points. The initial mass of the filled installation space amounts to 2.48 kg. In all simulations, the component is assumed to be made from polyamide 6 (PA6), which is a typical engineering thermoplastic used in automotive lightweight applications.
The objective is to develop a structure within the given installation space that provides high stiffness and sufficient structural safety at a minimized mass. Manufacturing constraints relevant to injection molding are considered equally important boundary conditions. These include a permissible wall thickness range of 1.5–4.5 mm, a defined demolding direction without undercuts and a tooling concept that allows a two-part injection mold without critical cores [16,32]. Based on these uniform boundary conditions, both a conventional and an AI-assisted development process are carried out in their entirety and subsequently compared in a systematic manner.

2.2. Conventional Topology-Driven Development Process

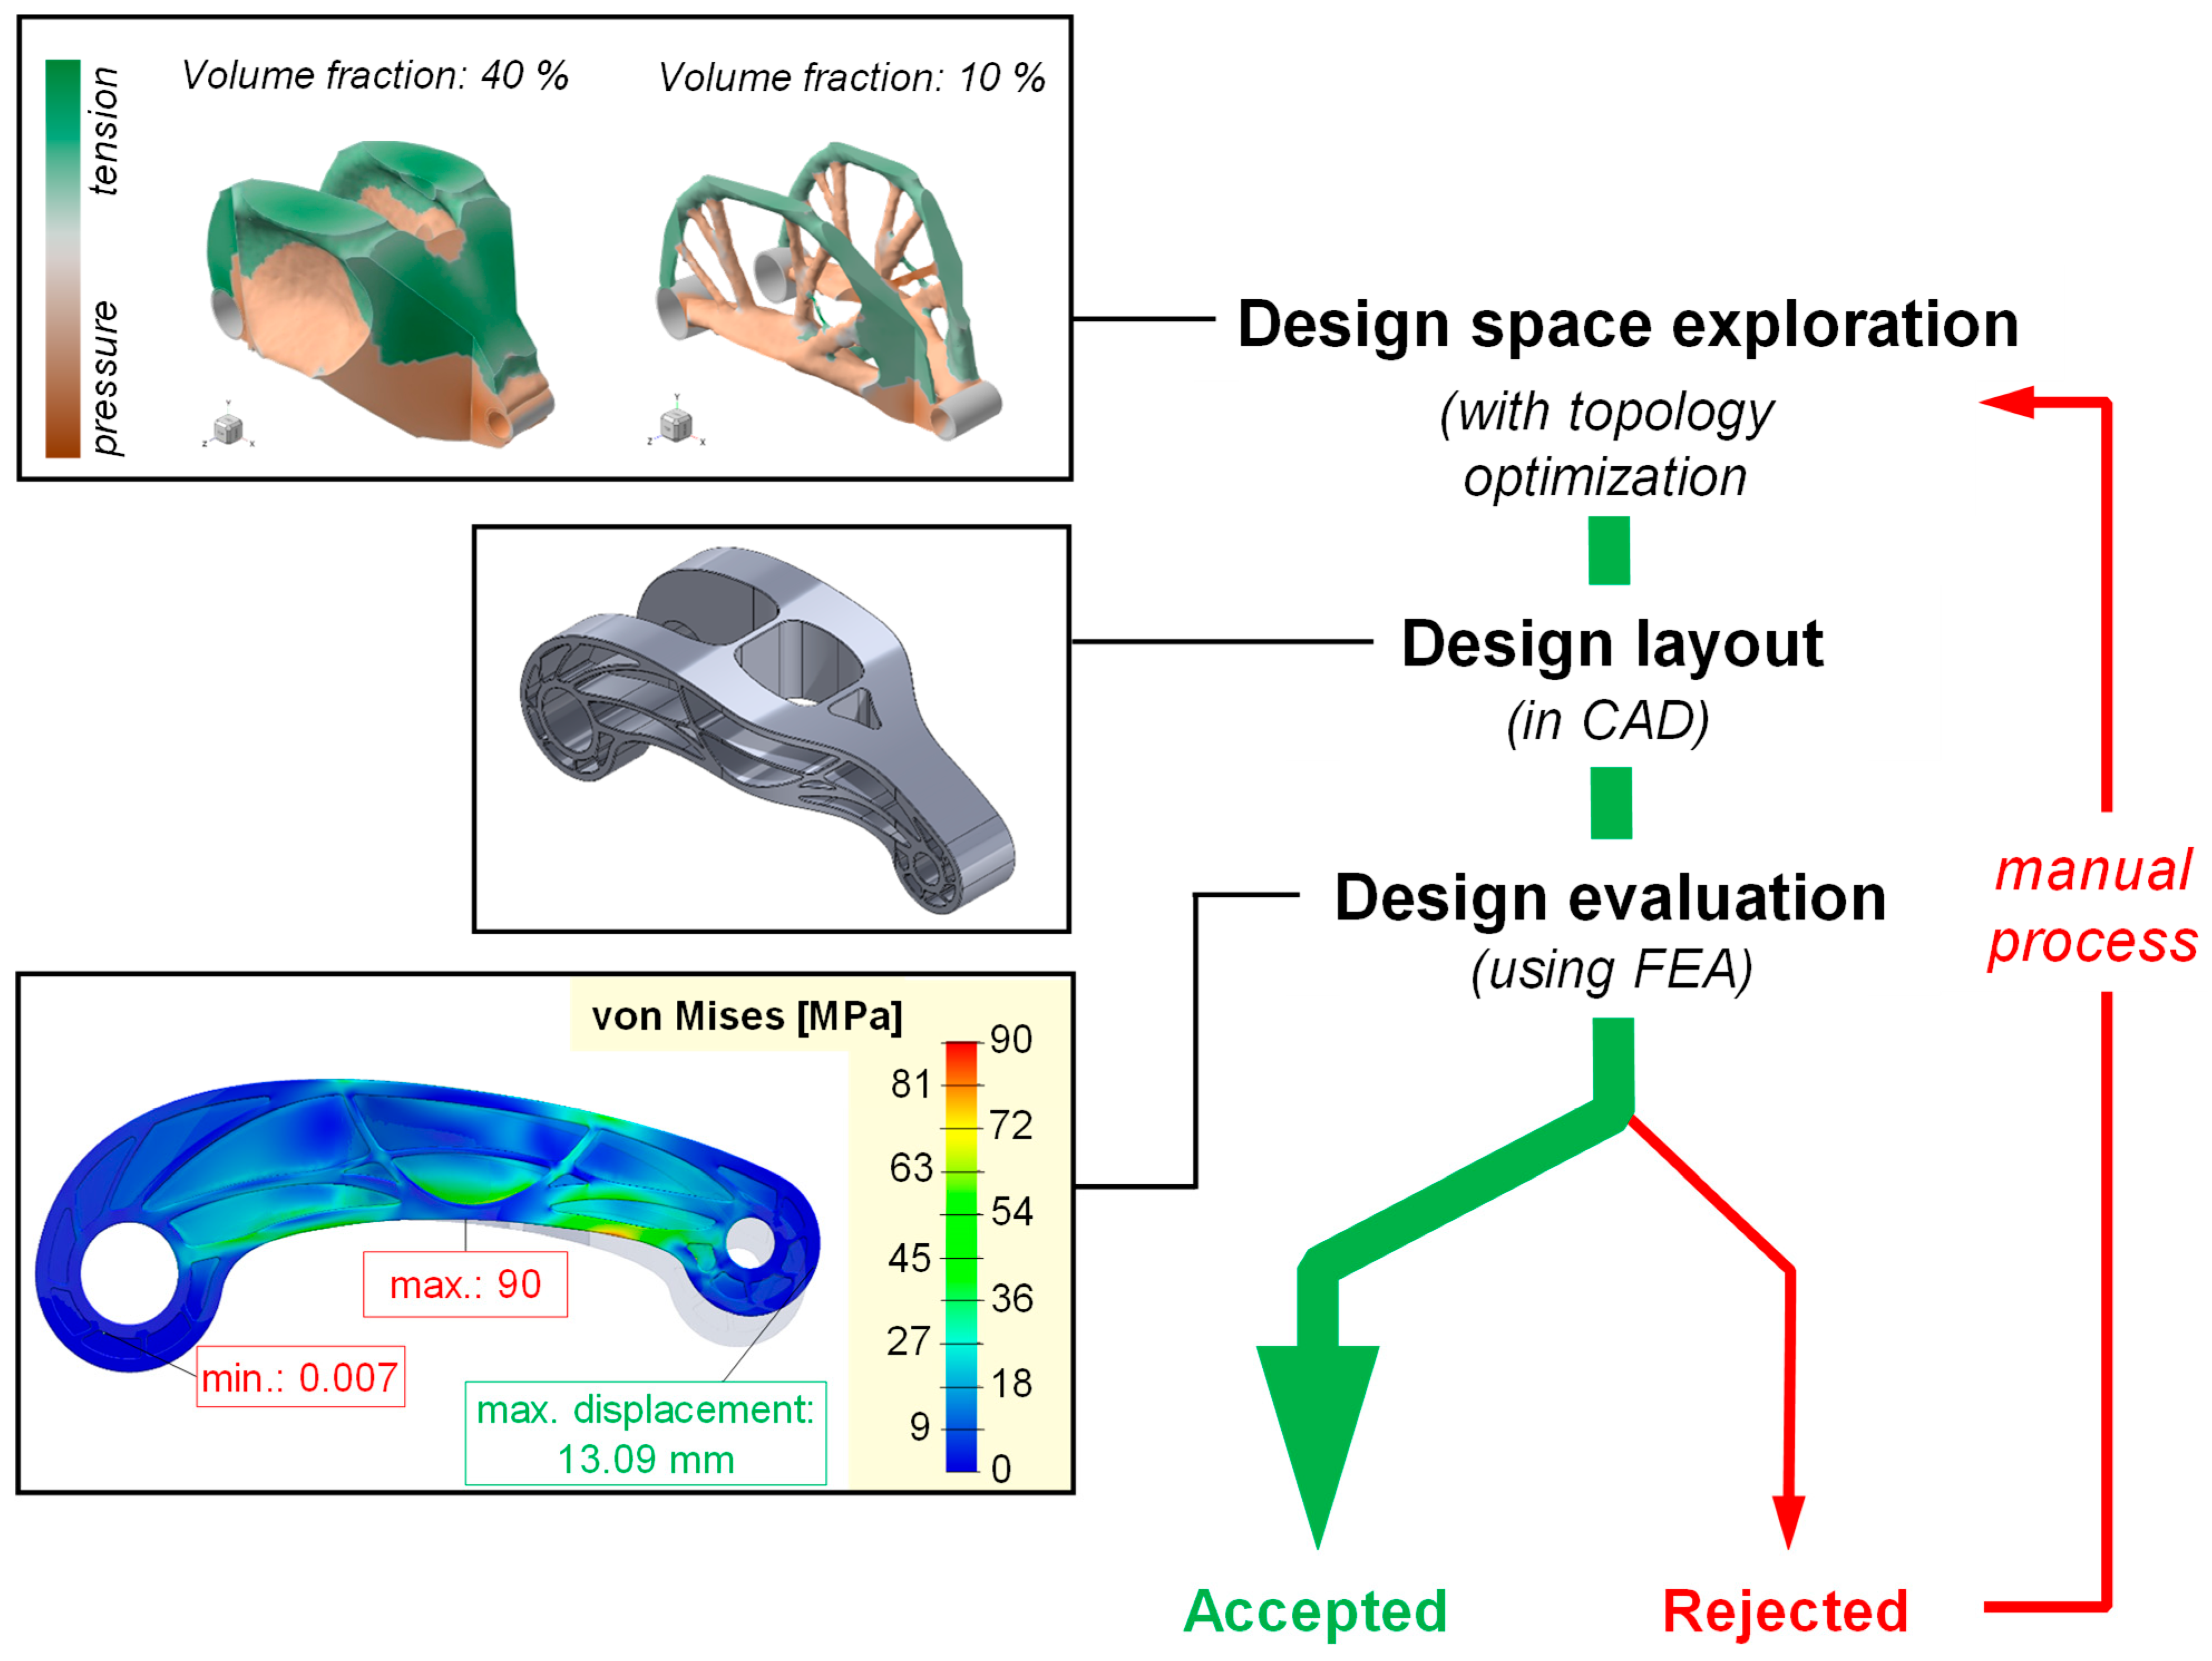
The conventional development process serves as the engineer-driven reference workflow. It combines topology optimization, manual CAD reconstruction and iterative finite element analysis (FEA) under the boundary conditions defined in Section 2.1. Figure 2 presents a schematic overview of the process together with the key sub-process steps involved in the development of the investigated component.
The process begins with topology optimization, which is used to derive an initial material distribution within the given installation space that provides high stiffness while reducing material usage. The optimization is performed for several volume fractions, resulting in material layouts corresponding to different volume levels. These results are typically geometrically complex and characterized by pronounced local variations in material distribution [20].
The subsequent manual reconstruction represents the most effort-intensive sub-process within the conventional workflow. The objective of this step is to obtain a geometry that reflects the load-bearing paths suggested by topology optimization while ensuring robust and reproducible manufacturability, as described by Stangl and Wartzack [33]. Achieving this requires careful interpretation of the topology optimization results to identify load-bearing ribs and highly stressed regions, as well as the consistent application of manufacturing guidelines for injection molding. During this phase, rib structures are defined, wall thicknesses are harmonized, radii are adjusted, and potential stress concentrations are mitigated through geometric design measures.
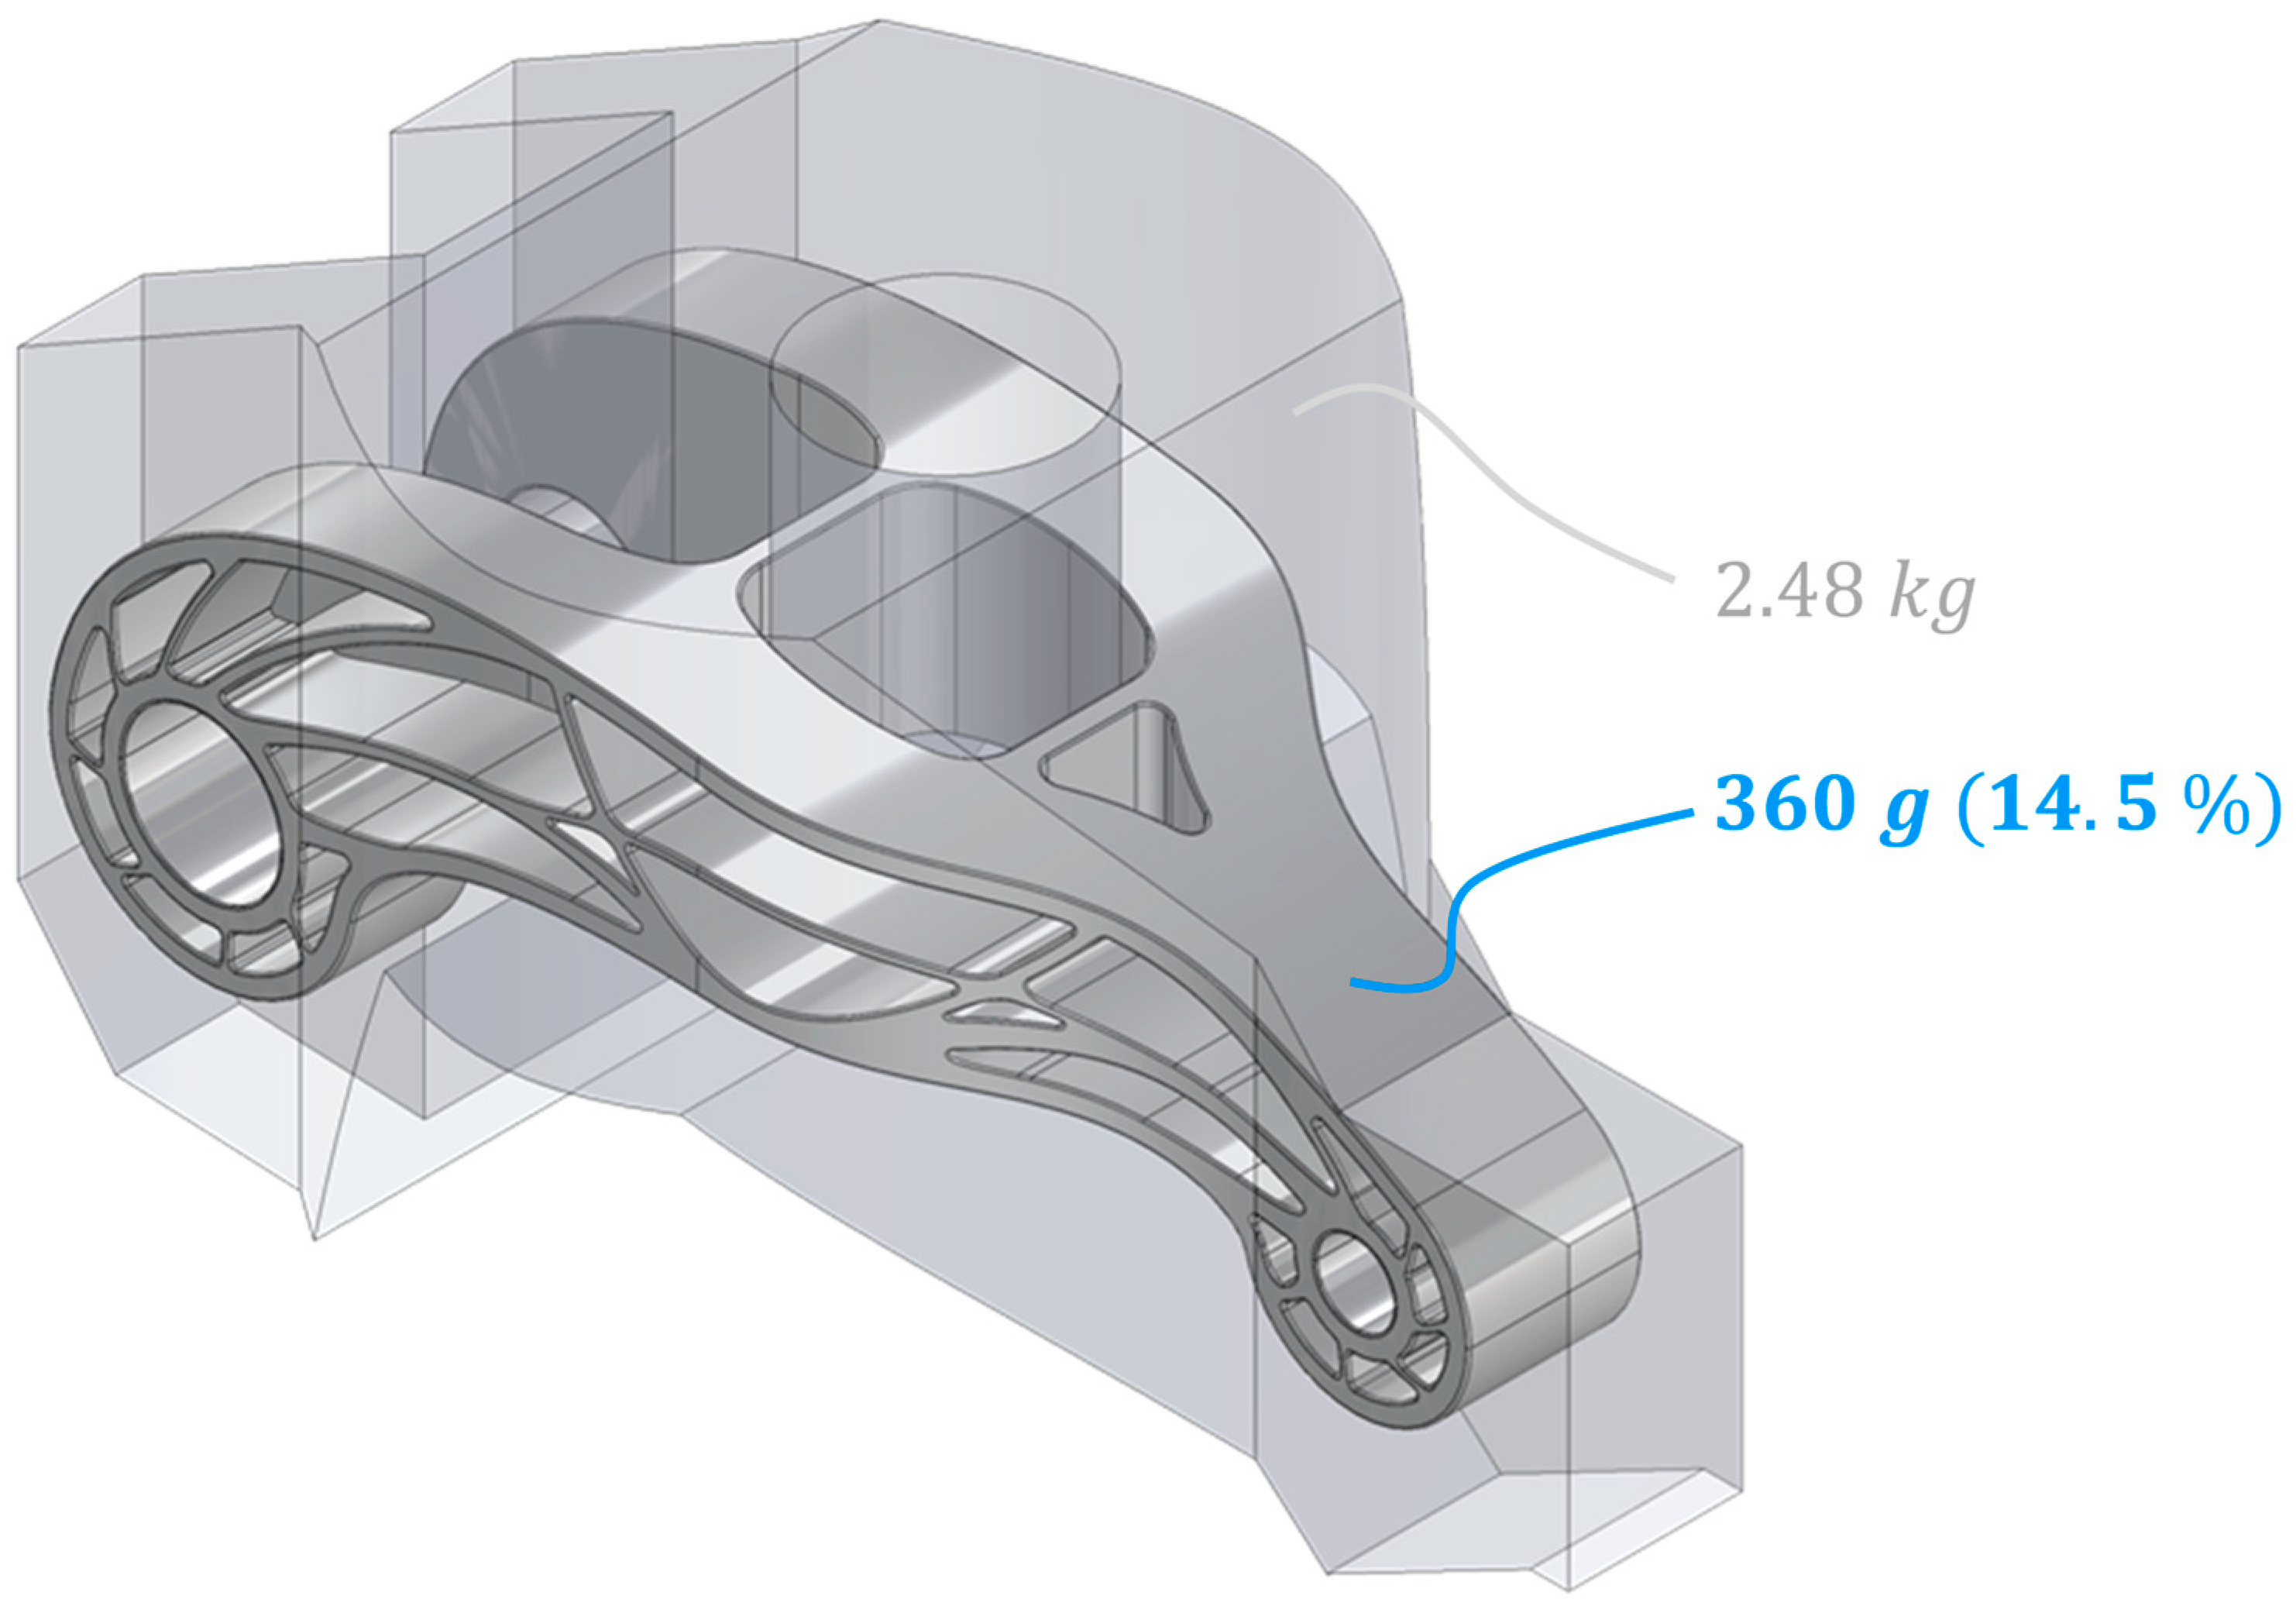
Once a reconstructed geometry is generated, it is evaluated through FEA to determine displacements, stresses and global stiffness. The resulting performance indicators serve as feedback for further geometric refinement. This iterative loop of reconstruction and analysis is continued until no substantial improvements can be achieved with respect to the defined targets, namely, reducing peak von Mises stresses to acceptable levels, ensuring sufficiently high stiffness and achieving a manufacturable geometry without undercuts or critical wall-thickness variations. In practice, the process was terminated once two consecutive iterations yielded no meaningful improvement (typically below 5%) in stiffness or stress behavior and no further manufacturability issues were identified. The final design thus represents an engineer-defined equilibrium between mechanical performance and injection-molding suitability. Figure 3 illustrates the final ribbed structure resulting from the conventional development process. The mass of this structure is approximately 360 g, corresponding to about 14.5% of the initial mass.

2.3. AI-Assisted Automated Workflow and Dataset Generation

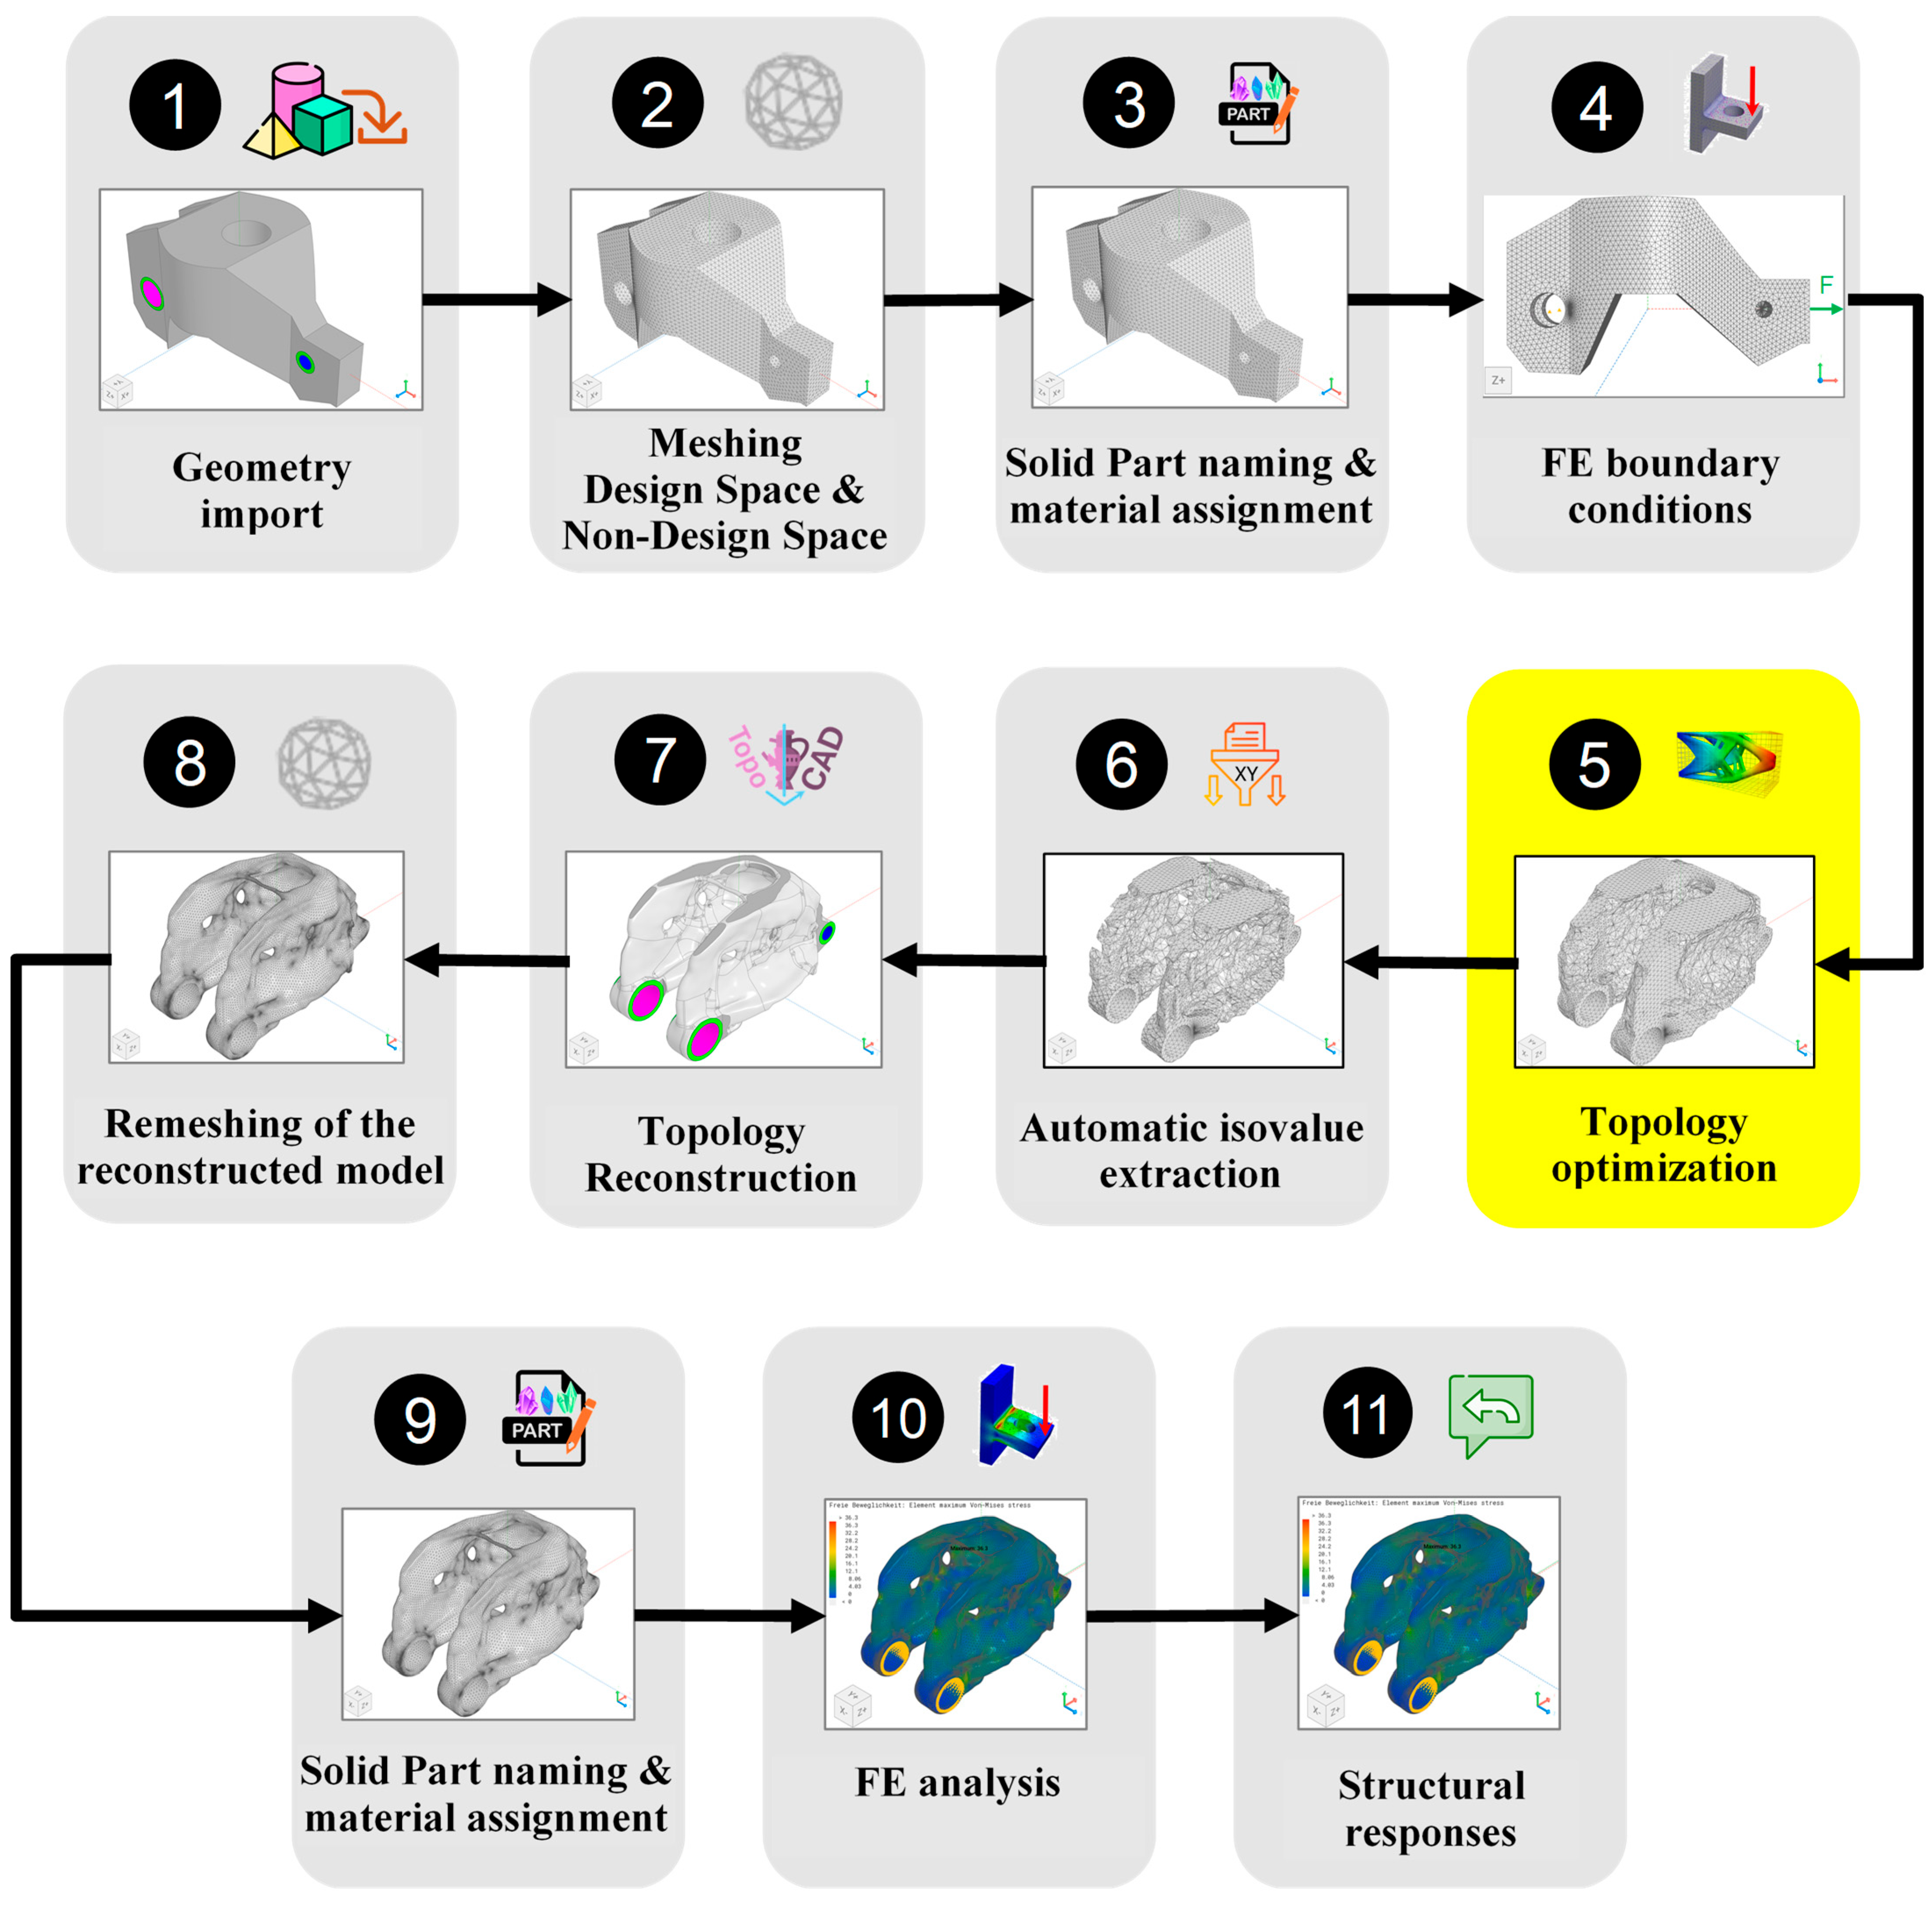
The second development path is based on the consistent automation of the entire design, simulation and evaluation process. The automated workflow is implemented using the orchestration platform Synera (Version 24.11 Legendary Loki) and integrates topology optimization, geometry reconstruction and FEA in a fully automated process chain. Figure 4 presents a schematic overview of the workflow.
The automated workflow covers all steps from the transfer of the installation space to meshing and topology optimization, followed by the transfer of the optimization results back into a CAD model, the remeshing of the reconstructed geometry and the final FEA. Only the subsequent interpretation and final selection of surrogate-predicted parameter combinations for validation were performed manually. The process chain is designed such that all sub-steps can be reliably controlled and automatically repeated using defined numerical input parameters. Although the workflow is implemented using Synera, it is not tied to a specific software environment; the methodology can, in principle, be transferred to comparable automation and orchestration platforms.
At a conceptual level, the AI-assisted approach investigated in this study consists of two distinct elements: first, the general idea of surrogate-based exploration of the design space using automatically generated simulation data; and second, the specific technical implementation used here, i.e., a Synera-based workflow including a particular topology-result reconstruction and remeshing pipeline. This distinction is important for the interpretation of the results. Poor predictive performance of the surrogate model, especially for stress-sensitive quantities, mainly reflects limitations of the chosen surrogate formulation and input parametrization, whereas deficits in manufacturability and geometric quality of the final AI-generated designs are influenced to a significant extent by the specific reconstruction workflow and its current constraint transfer.
Within this workflow, topology optimization represents the most influential step with respect to the resulting component geometry, as the generated mesh forms the basis for the subsequent reconstruction. The employed solver (Altair OptiStruct, Version 2025.1) provides a wide range of configuration options that directly affect geometry formation. A key advantage of this optimization environment is that most options are available as numerical input parameters or can be converted into such parameters without loss of information. In the context of the development conditions and manufacturing constraints considered in this study (see Table 1), parameters such as minimum and maximum wall thickness, maximum target mass, the feasibility of a two-part injection mold and the allowance or prevention of through-holes in the drawing direction are of particular importance, as they directly influence both the topology optimization results and subsequent manufacturability.
At the same time, the structural responses obtained from the final FEA can be fully described by numerical quantities. These include displacements, stresses and derived characteristic values such as mass-specific stiffness, stress-related safety factors and indicators describing the homogeneity of the stress field. Consequently, each complete execution of the workflow yields a set of numerical input parameters for topology optimization and corresponding numerical structural responses from the FEA. When the workflow is iterated systematically with varying input parameters, a consistent dataset of parameter–response pairs is obtained and automatically stored in tabular form (Table 2).
This dataset is used to train a regression-based artificial neural network whose purpose is to approximate the functional relationships between topology optimization parameters and resulting mechanical properties. The trained model can subsequently be employed to predict favorable parameter configurations without requiring a full finite element analysis for each individual variant.
The parameter space defined in Table 2 comprises 234,484 possible parameter combinations. To explore this space efficiently while generating a robust dataset for AI training, the automated workflow is executed repeatedly using a random search strategy over the discrete parameter space. This approach enables robust coverage of highly nonlinear parameter–response relationships with a limited simulation budget. Bergstra and Bengio [34] show that random grid search significantly reduces computational effort compared to a full grid search, while providing more uniform parameter-space coverage than purely random sampling.
In total, 1211 distinct design models were generated, fully simulated and evaluated. This corresponds to sampling roughly 0.5% of the discrete parameter space. This number reflects the available computational budget as well as diminishing returns observed during further sampling, i.e., additional variants did not meaningfully improve parameter-space coverage; together with the learning-curve analysis reported in Section 4.1, this suggests that further uniform sampling in the same five-dimensional space would be expected to yield only marginal gains in surrogate performance.
In addition to these valid runs, two classes of excluded workflow executions were observed. First, 1736 parameter combinations were terminated almost immediately by rule-based pre-check logic because they were logically invalid (for example, because the minimum wall-thickness parameter exceeded the maximum wall-thickness parameter). These cases therefore represent inadmissible regions of the sampled parameter space rather than downstream numerical failures of the full workflow. Second, 600 runs progressed through substantial parts of the automated process chain but failed downstream during topology-result reconstruction or subsequent meshing for final FEA. In these cases, either the topology-derived mesh geometry could not be converted robustly into a CAD solid by the available reconstruction routes, or the reconstructed CAD geometry could not be meshed reliably for structural validation. The resulting dataset therefore contains only physically valid parameter–response pairs.
Prior to training, all input parameters were standardized using z-normalization (mean 0, standard deviation 1) to ensure numerically stable and scale-invariant optimization. The target variables were standardized accordingly so that output quantities of different magnitudes were weighted equally during training. The dataset was randomly split into training and validation subsets, with 80% of the data used for training and 20% reserved for independent validation on previously unseen data. This division is common in the training of neural networks [35].
Following the approach described by Garnett [36], hyperparameters were determined using Bayesian optimization, which iteratively searches a predefined hyperparameter space to maximize model performance on the validation dataset. Model performance was evaluated using standard regression metrics, in particular, the coefficient of determination R 2 and the mean squared error M S E . While R 2 quantifies the proportion of variance explained by the model, M S E measures the average squared deviation between predicted and reference values, with lower values indicating higher prediction accuracy [37].
In the present study, Bayesian optimization was performed on the 80% training subset using 5-fold cross-validation. For each sampled hyperparameter configuration, an MLPRegressor was trained and evaluated separately for each target variable, and the mean R2 value averaged over all folds, and all outputs was used as the optimization score. The Bayesian search space comprised a learning rate in the range of 10−5 to 10−2 on a logarithmic scale, a batch size parametrized on a log2 scale from 24 to 28 (i.e., 16–256), 300–1000 epochs, 1–4 hidden layers, and 32–512 neurons per hidden layer. Unless explicitly optimized, the default settings of scikit-learn’s MLPRegressor were retained, i.e., a ReLU activation function, the Adam optimizer, and L2 regularization with α = 0.0001. In addition, early stopping was enabled with an internal validation fraction of 0.2, and the random seed was fixed to 42. Thus, cross-validation was employed during hyperparameter tuning, whereas the 20% validation subset remained untouched at this stage. After the best hyperparameter configuration had been identified, the final multi-output network was retrained from scratch on the training subset and subsequently evaluated on the fixed 20% hold-out validation subset. The configuration yielding the best overall performance (see Table 3) was selected as the final network architecture.
As shown in Table 3, the network achieves very good predictive quality for global quantities such as mass and stiffness-to-mass ratio, with R 2 values above 0.9 on both training and validation data. The stress-related safety factor S is predicted with moderate accuracy (validation R2 = 0.722), whereas the stress standard deviation σ S remains poorly predictable, with a validation R2 value close to zero. Such a low value indicates no meaningful correlation between predictions and ground truth for σ S . Consequently, the present surrogate model can support early-stage screening with respect to mass, stiffness-to-mass ratio and, with caution, the global safety factor, but it cannot be considered reliable for stress-distribution-related quantities such as σ S . However, these values refer to the original single hold-out split used in the training workflow. To assess robustness with respect to data partitioning, the final network architecture with fixed hyperparameters was additionally re-evaluated by 5-fold cross-validation over the full dataset; the resulting mean validation R2 and MSE values and their standard deviations are reported in Appendix B (Table A3). This additional analysis shows that split-robust predictive performance is lower, particularly for stress-related outputs.
To further elucidate whether the observed limitations of the surrogate, particularly for σ S , are primarily caused by the limited dataset size or by the chosen parametrization, an additional learning-curve analysis is presented in Section 4.1.
Once training is completed, the neural network can be used to evaluate new, previously unsimulated parameter combinations across the full parameter space without requiring a full finite element analysis for each variant. This enables rapid identification of a surrogate-predicted candidate configuration, which was defined as the parameter combination that maximizes the mass-specific stiffness under an upper mass limit (component mass of the conventional design), while considering the predicted global safety factor. Because the surrogate provides deterministic point predictions only and no calibrated predictive uncertainty or confidence intervals, this candidate configuration must be interpreted as a preliminary screening result rather than as a confidence-qualified optimum. It was therefore subsequently transferred back into the automated workflow and validated by full finite element analysis. Stress-distribution-related quantities ( σ S ) were not treated as reliable decision criteria due to their poor predictive quality. The parameter configuration predicted by the AI model is summarized in Table 4 together with the corresponding predicted structural responses.
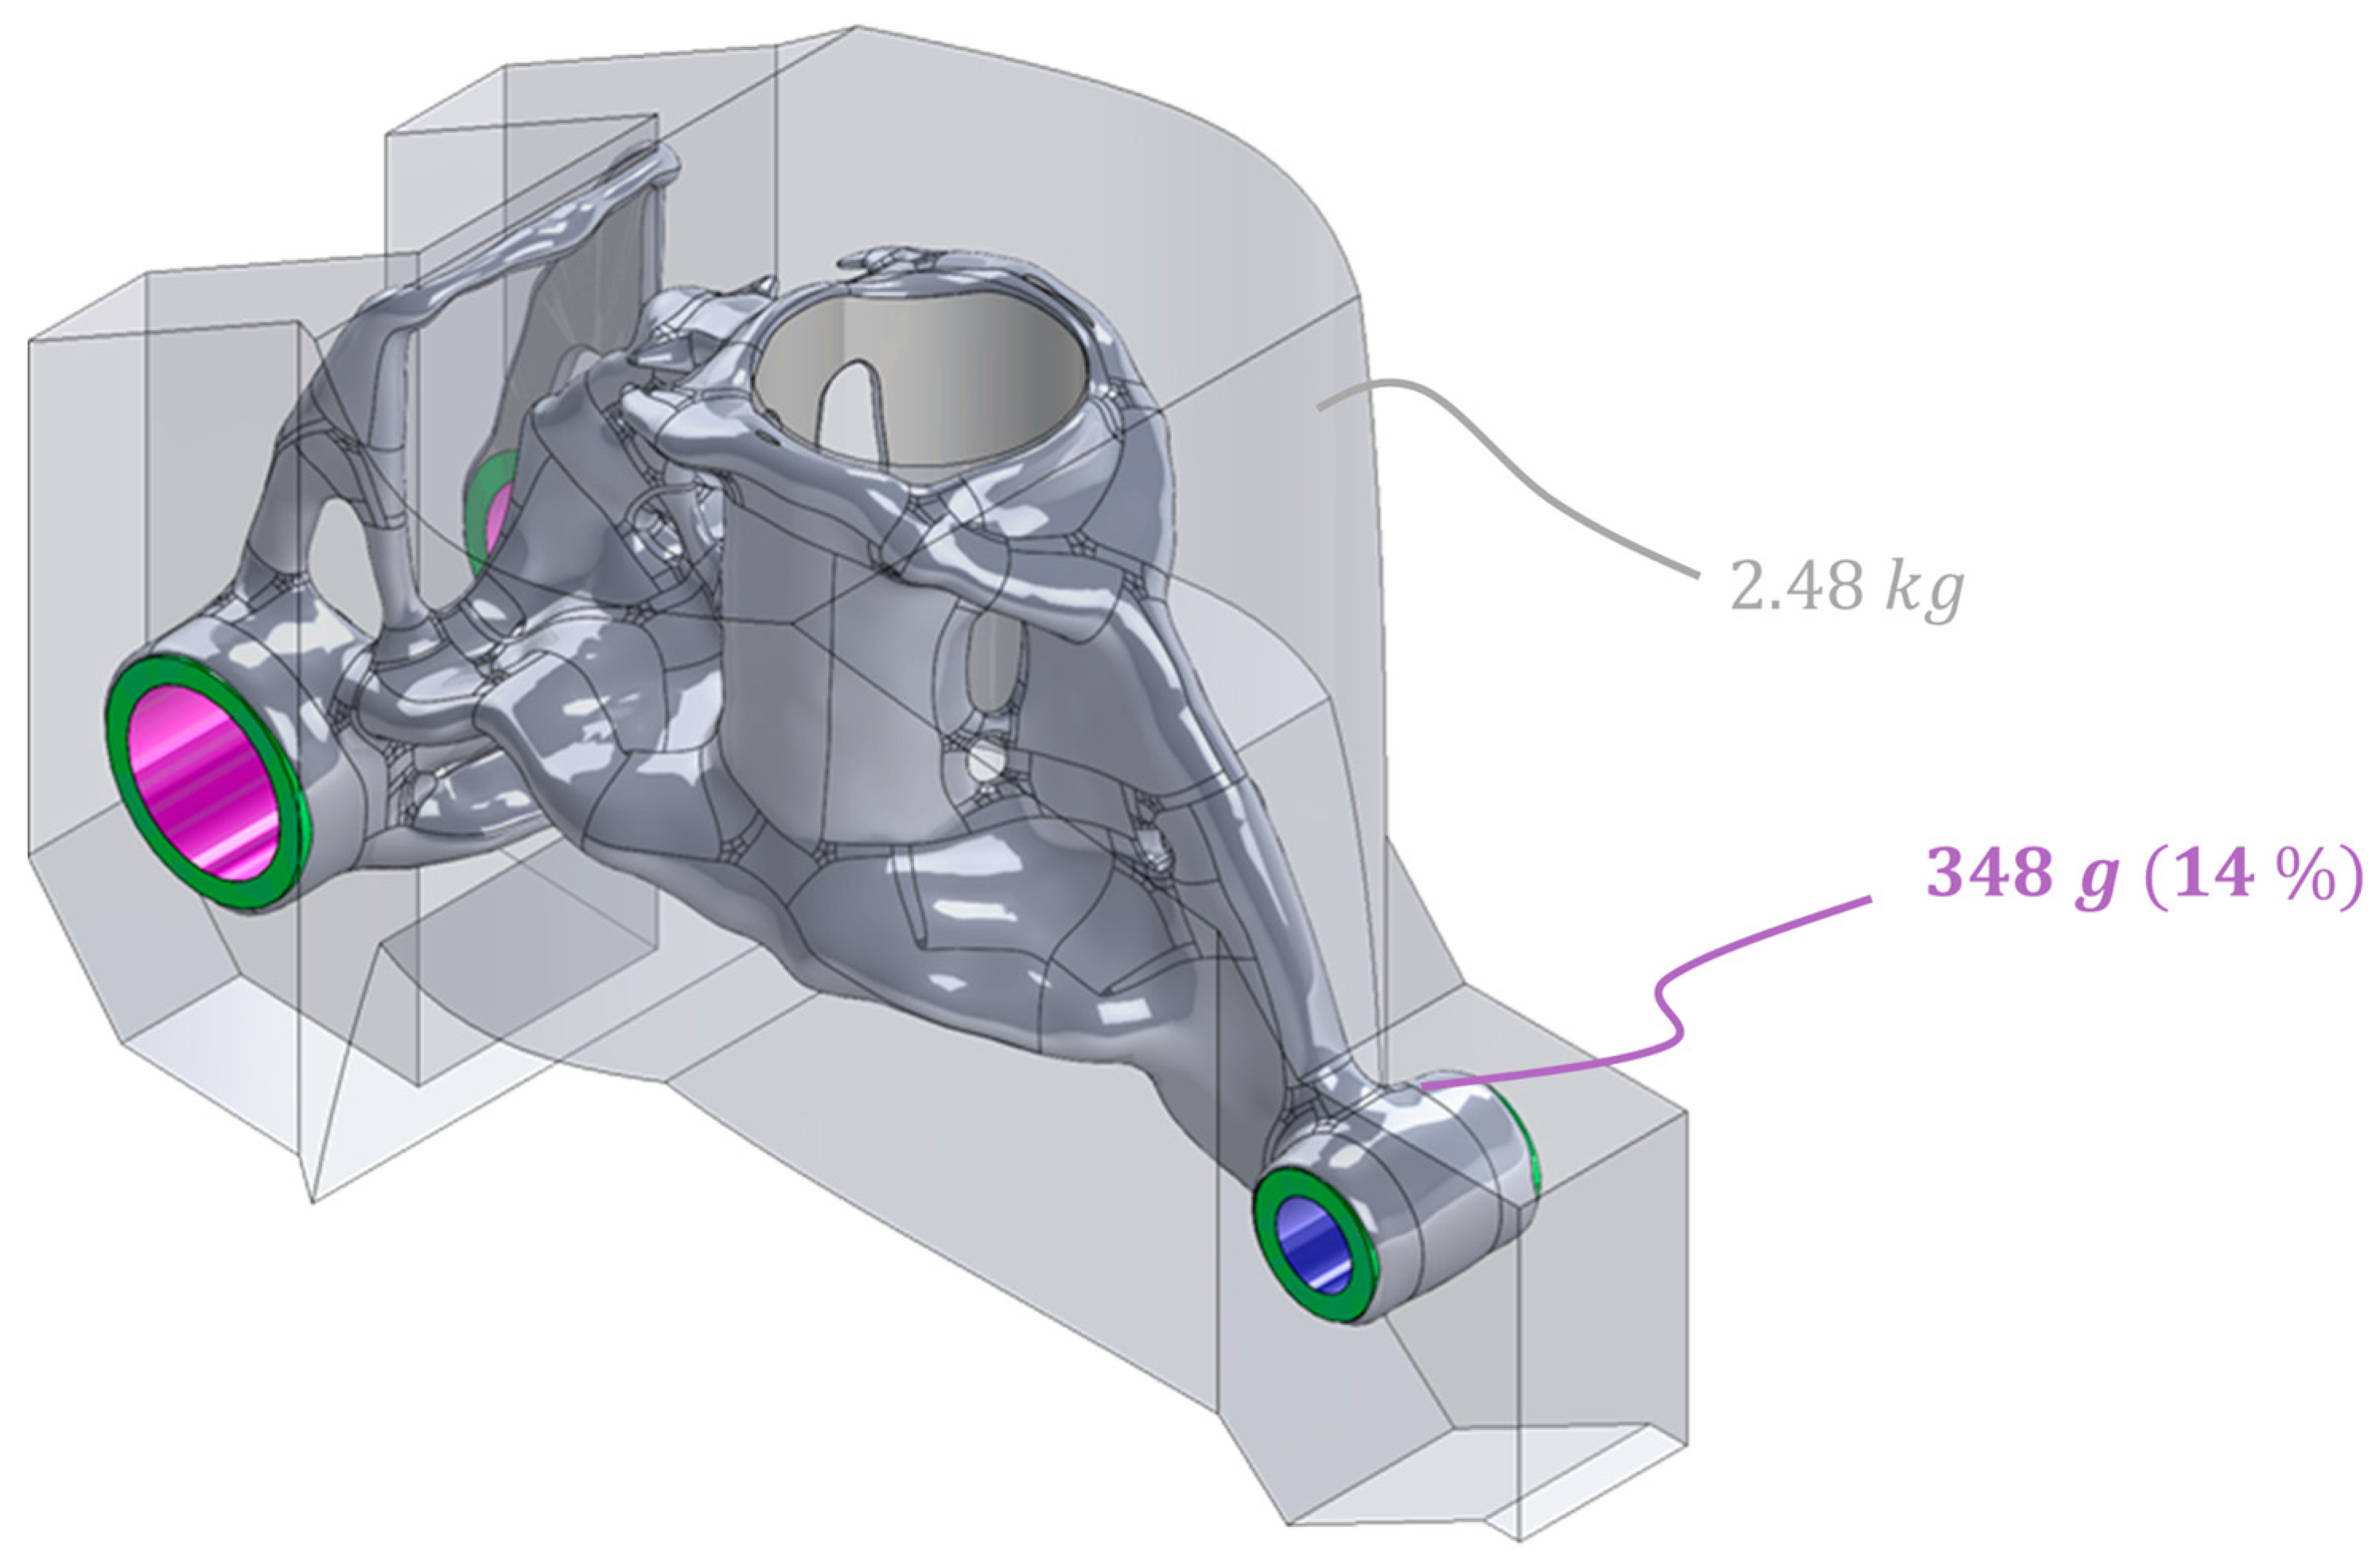
This predicted parameter set is subsequently fed back into the automated workflow to generate a final geometry, which is then validated using finite element analysis. The resulting structure is shown in Figure 5 in comparison to the fully filled installation space and has a mass of approximately 14% of the original reference model.

2.4. Evaluation Metrics and Comparison Procedure

Several aspects are considered in order to compare the two development processes. At the process level, the quantitative criteria include the required development time, the number of evaluated design variants, and the degree of automation. These values were obtained from logged workflow runtimes, documented manual effort, and the repeatable execution of the automated process. Qualitative aspects, such as the dependence on expert knowledge, were assessed comparatively based on the characteristics of both workflows and the engineering interventions they require.
On the product level, the comparison focuses on a set of mechanical performance indicators. For stress evaluation, not only the maximum von Mises equivalent stress S m a x is considered, but also the distribution of stresses within the component. To characterize the stress field, the mean stress S ¯ , the standard deviation σ S , and the coefficient of variation C V , S are evaluated. C V , S is defined as
C V , S = σ S / S ¯ .
The mean stress S ¯ represents the average stress level in the component, σ S quantifies the dispersion of stresses throughout the volume, and the coefficient of variation C V , S serves as a dimensionless measure of the relative inhomogeneity of the stress field.
While clear numerical values can be obtained for classical finite element analyses, manufacturability is assessed in this study by combining qualitative evaluation with a simple wall-thickness-based indicator. Local wall thicknesses were measured at 20 representative positions on four common section locations (five points each) of the two final geometries; at each position, thickness was defined as the shortest distance between opposite bounding surfaces of the respective wall or rib segment. Based on these measurements, the mean wall thickness t ¯ , the descriptive standard deviation σ t , the coefficient of variation C V , t ( = σ t / t ¯ ), and the share of measurements within the permissible wall-thickness range of 1.5–4.5 mm was determined. The central question is whether the generated structures can be realized in an economically viable manner and whether they exhibit typical manufacturing-related issues such as undercuts, enclosed cavities, or excessive wall thickness variations.

3. Results

This section presents the results obtained from the comparison of the conventional and the AI-assisted development approaches. The analysis is structured into a process-level comparison, focusing on development effort and scalability, followed by a product-level evaluation of the resulting structures with respect to mechanical performance and manufacturability. The results provide the basis for the subsequent discussion.

3.1. Process-Level Comparison

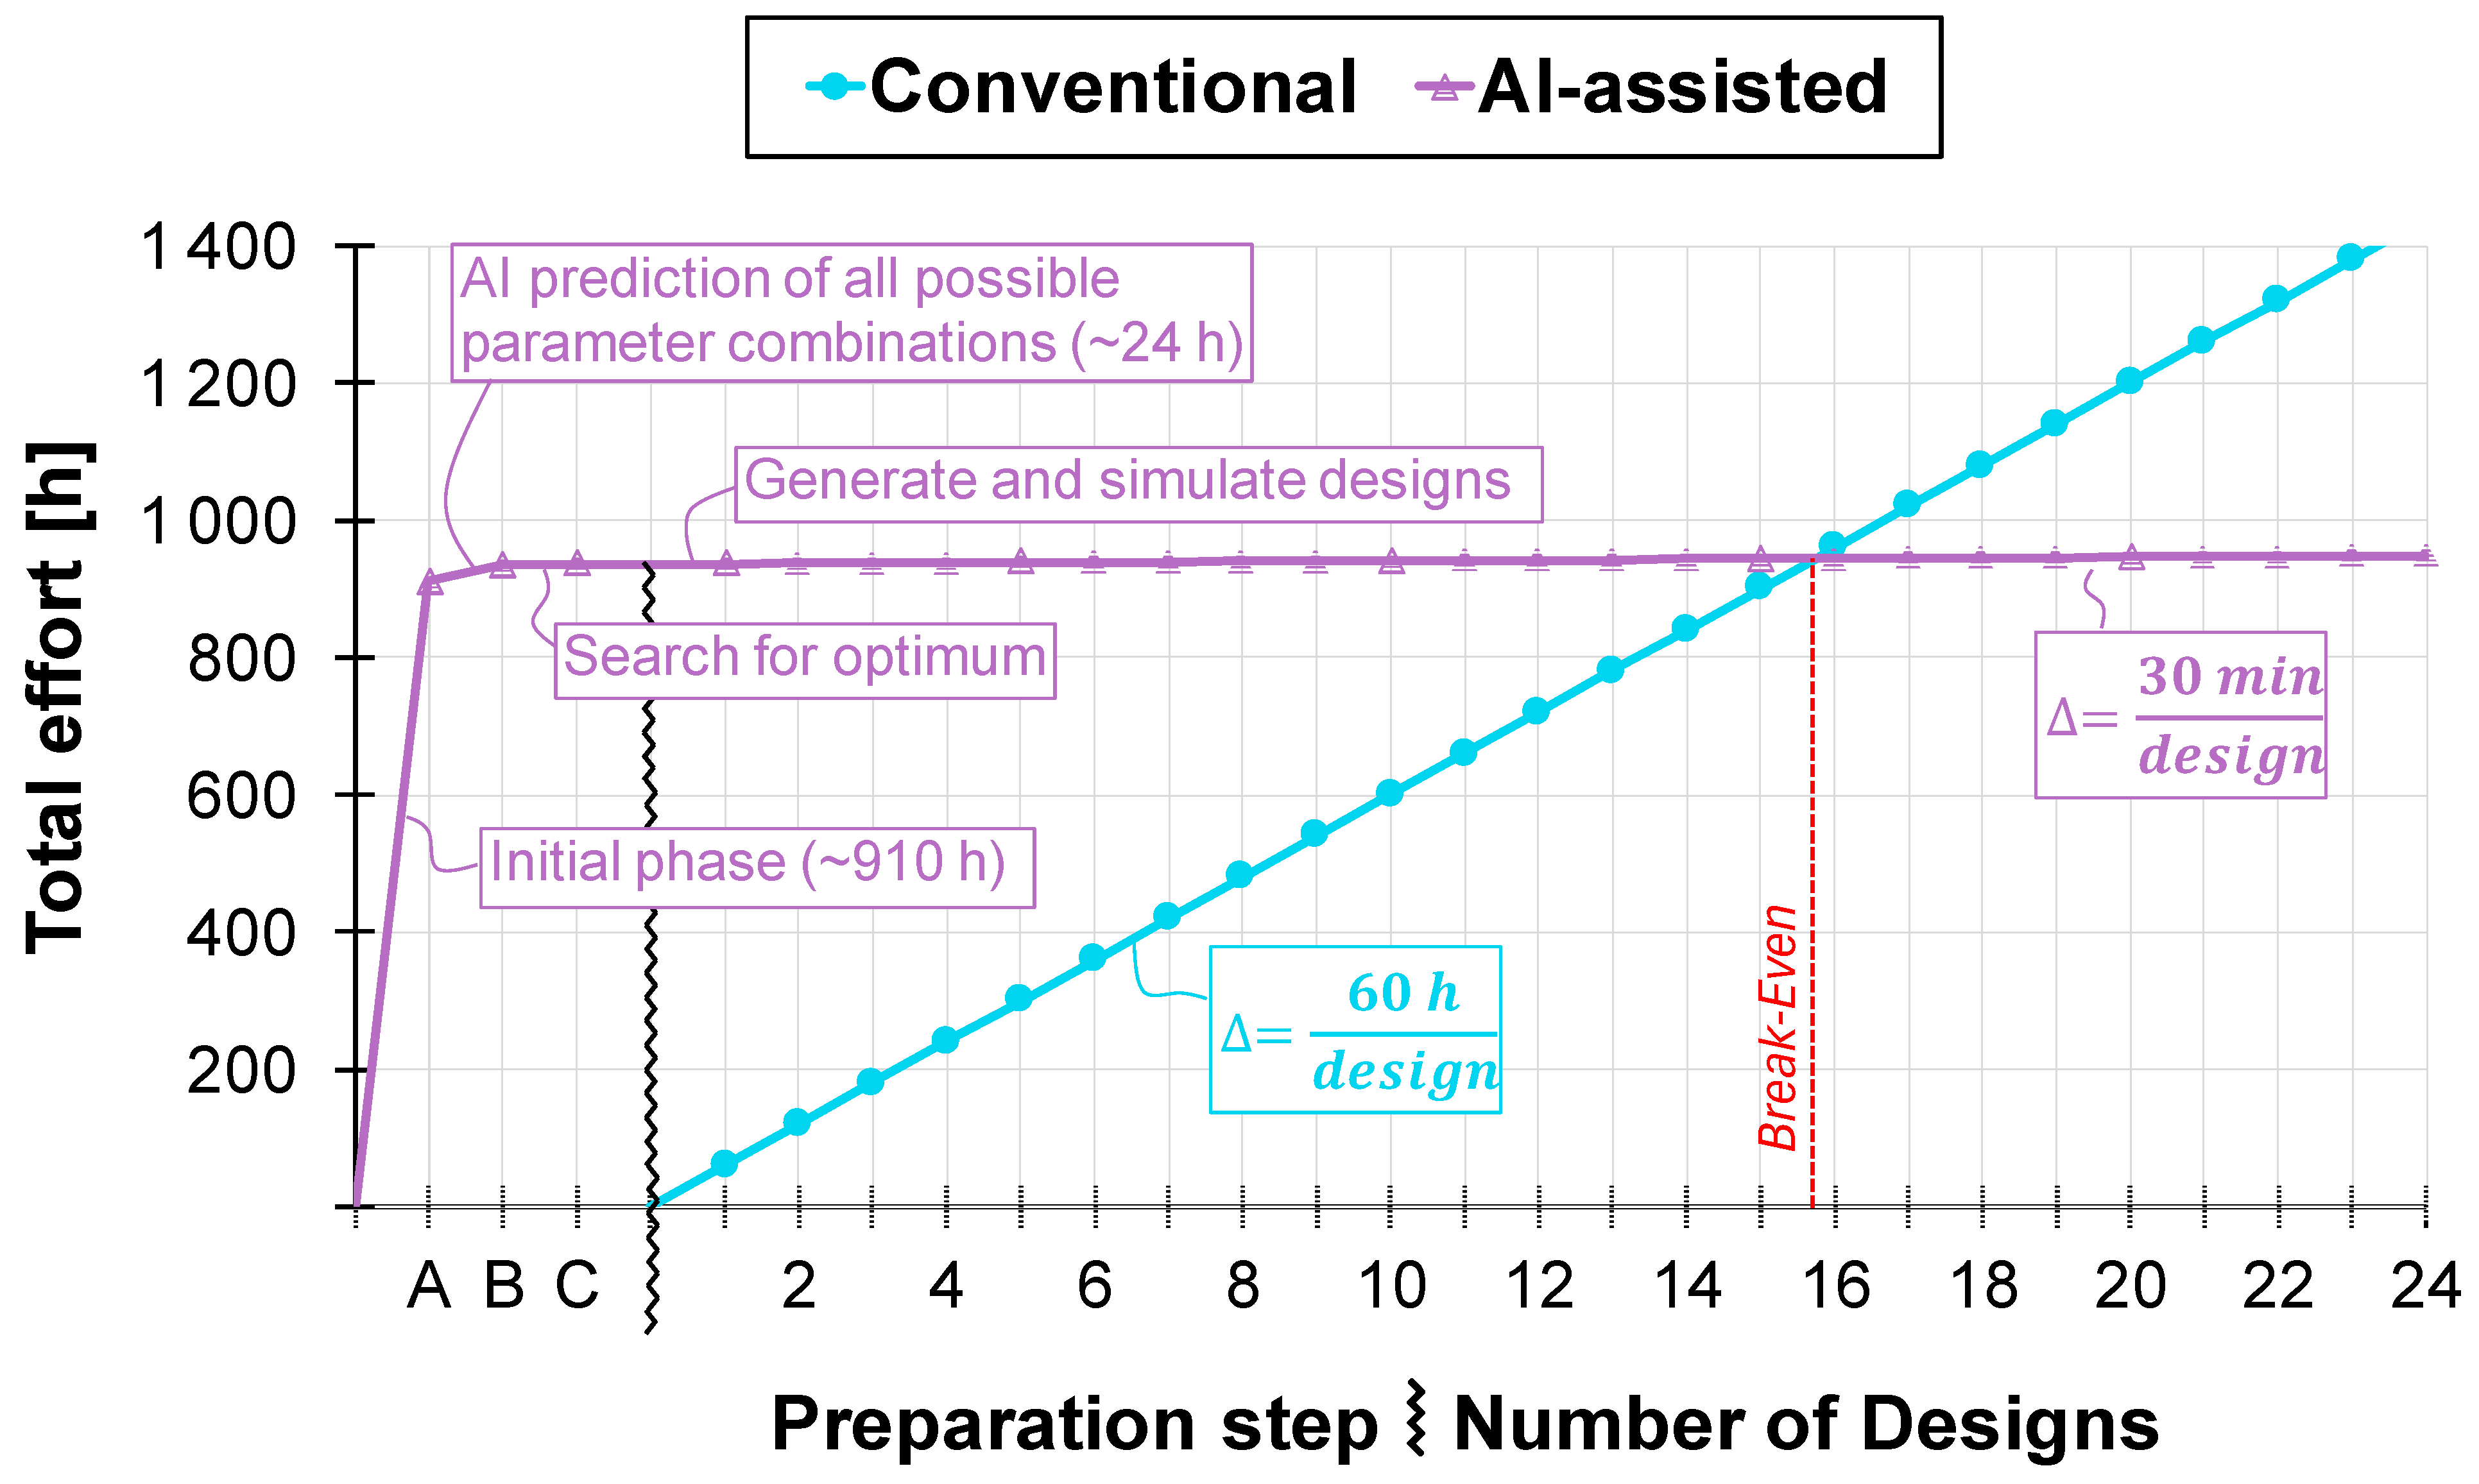
The comparison of the two development approaches reveals fundamentally different mechanisms of effort generation and scalability at the process level. The conventional approach follows a knowledge-based, sequential iteration process [18]. Topology optimization primarily serves as a means of identifying load-appropriate material distributions, which are subsequently transformed into a production-ready component geometry through manual CAD reconstruction and repeated finite element validation. Each additional design variant requires further design intervention, complete remodeling and renewed FE analysis. Consequently, the required effort increases approximately linearly with the number of evaluated variants. In both workflows, development effort is defined as the sum of engineering and computational time (person-hours plus recorded workflow runtimes). For the investigated structure, a total effort of approximately 60 h was documented for the development of a single conventional design. This effort is largely characterized by iterative cycles of evaluation, geometric modification and repeated simulation.
In contrast, the AI-assisted development process follows a data-driven, exploratory approach that initially requires substantial preparatory effort. This includes the development and validation of automated workflows as well as the generation and preprocessing of the training dataset (Section 2.3). The corresponding initial effort was estimated at approximately 910 h for the present study (excluding familiarization with Synera). Included activity blocks are listed in Appendix A (Table A2), i.e., implementation and debugging of the automated process chain, integration of topology optimization and FEA, and generation and preprocessing of the 1211 simulated training samples, as well as surrogate model setup and training. Unlike the conventional approach, this effort is not variant-specific but incurred only once. Subsequently, the regression-based surrogate model can be trained with comparatively low additional effort and used to predict the structural responses for a large number of parameter combinations (approximately 24 h of pure computing time). Algorithmic screening of the parameter space then enables efficient identification of promising configurations. Based on these predictions, variants with selected parameter combinations can be generated, evaluated and stored automatically. For the fully automated design process including simulation, the average computational time amounts to approximately 30 min per variant, depending on the available hardware resources.
Figure 6 compares the overall required development time of both approaches, while a more detailed breakdown of the documented development effort for both workflows is provided in Appendix A (Table A1 and Table A2).
For the process-level comparison, the total development effort is represented as a simple linear function of the number of investigated variants N. For the conventional workflow, the effort is approximated as
T c o n v N = T c o n v , i n i t + N · t c o n v , v a r ,
where T c o n v , i n i t 0 h and t c o n v , v a r 60 h/variant, based on logged effort for the case study. For the AI-assisted workflow, the effort is described as
T A I N = T A I , i n i t + T A I , p r e d i c t + T A I , s e a r c h + N · t A I , v a r ,
with T A I , i n i t 910 h (combined engineering and computing time) for implementing and debugging the automated process chain and generating training data, T A I , p r e d i c t 24 h for predicting the responses of all parameter combinations, T A I , s e a r c h 2 h for identifying the optimal parameter combinations based on the predictions and t A I , v a r 0.5 h/additional variant, reflecting the marginal effort to configure and evaluate further runs.
Equating Equations (2) and (3) yields the break-even point N B E between the two approaches
N B E = T A I , i n i t + T A I , p r e d i c t + T A I , s e a r c h T c o n v , i n i t t c o n v , v a r t A I , v a r .
For the present case, the break-even point lies at approximately N B E 16 variants.
This illustrates that the conventional approach is more efficient when only a limited number of variants are required, whereas the AI-assisted workflow offers clear advantages for broad parameter studies and early-stage variant exploration. The efficiency gain primarily relates to the marginal effort per additional variant: once the workflow and training dataset have been established, the variant-specific effort decreases significantly, enabling the investigation of large design spaces with limited additional time expenditure. For isolated cases involving only a few variants, however, the conventional process remains superior in terms of development time.
Beyond pure time expenditure, reproducibility represents a further key procedural difference. In the conventional approach, geometric decisions are strongly influenced by engineering experience, such that the resulting component depends on the designer and their interpretation of topology optimization results and stress distributions. In contrast, the automated workflow is deterministic once parametrized: identical input parameters lead to identical mesh generation, reconstruction results and structural responses. This enables consistent repetition and quantitative evaluation of variant studies, which form the basis for subsequent AI training and prediction.

3.2. Product-Level Comparison

This section compares the resulting structures obtained from both development approaches at the product level. The evaluation is structured into an assessment of mechanical performance and a separate analysis addressing manufacturing-related aspects.
In the following, we distinguish between three designs: (i) the conventional reference design, (ii) the AI-assisted design, i.e., the geometry reconstructed from the surrogate-predicted candidate configuration (Table 4), and (iii) the best design from training data, i.e., the best-performing sample identified retrospectively within the simulated training dataset based on the true FEA responses. The latter is used only as an upper-bound reference and is not the actual output of the surrogate-based predictive workflow.

3.2.1. Technical Characteristics

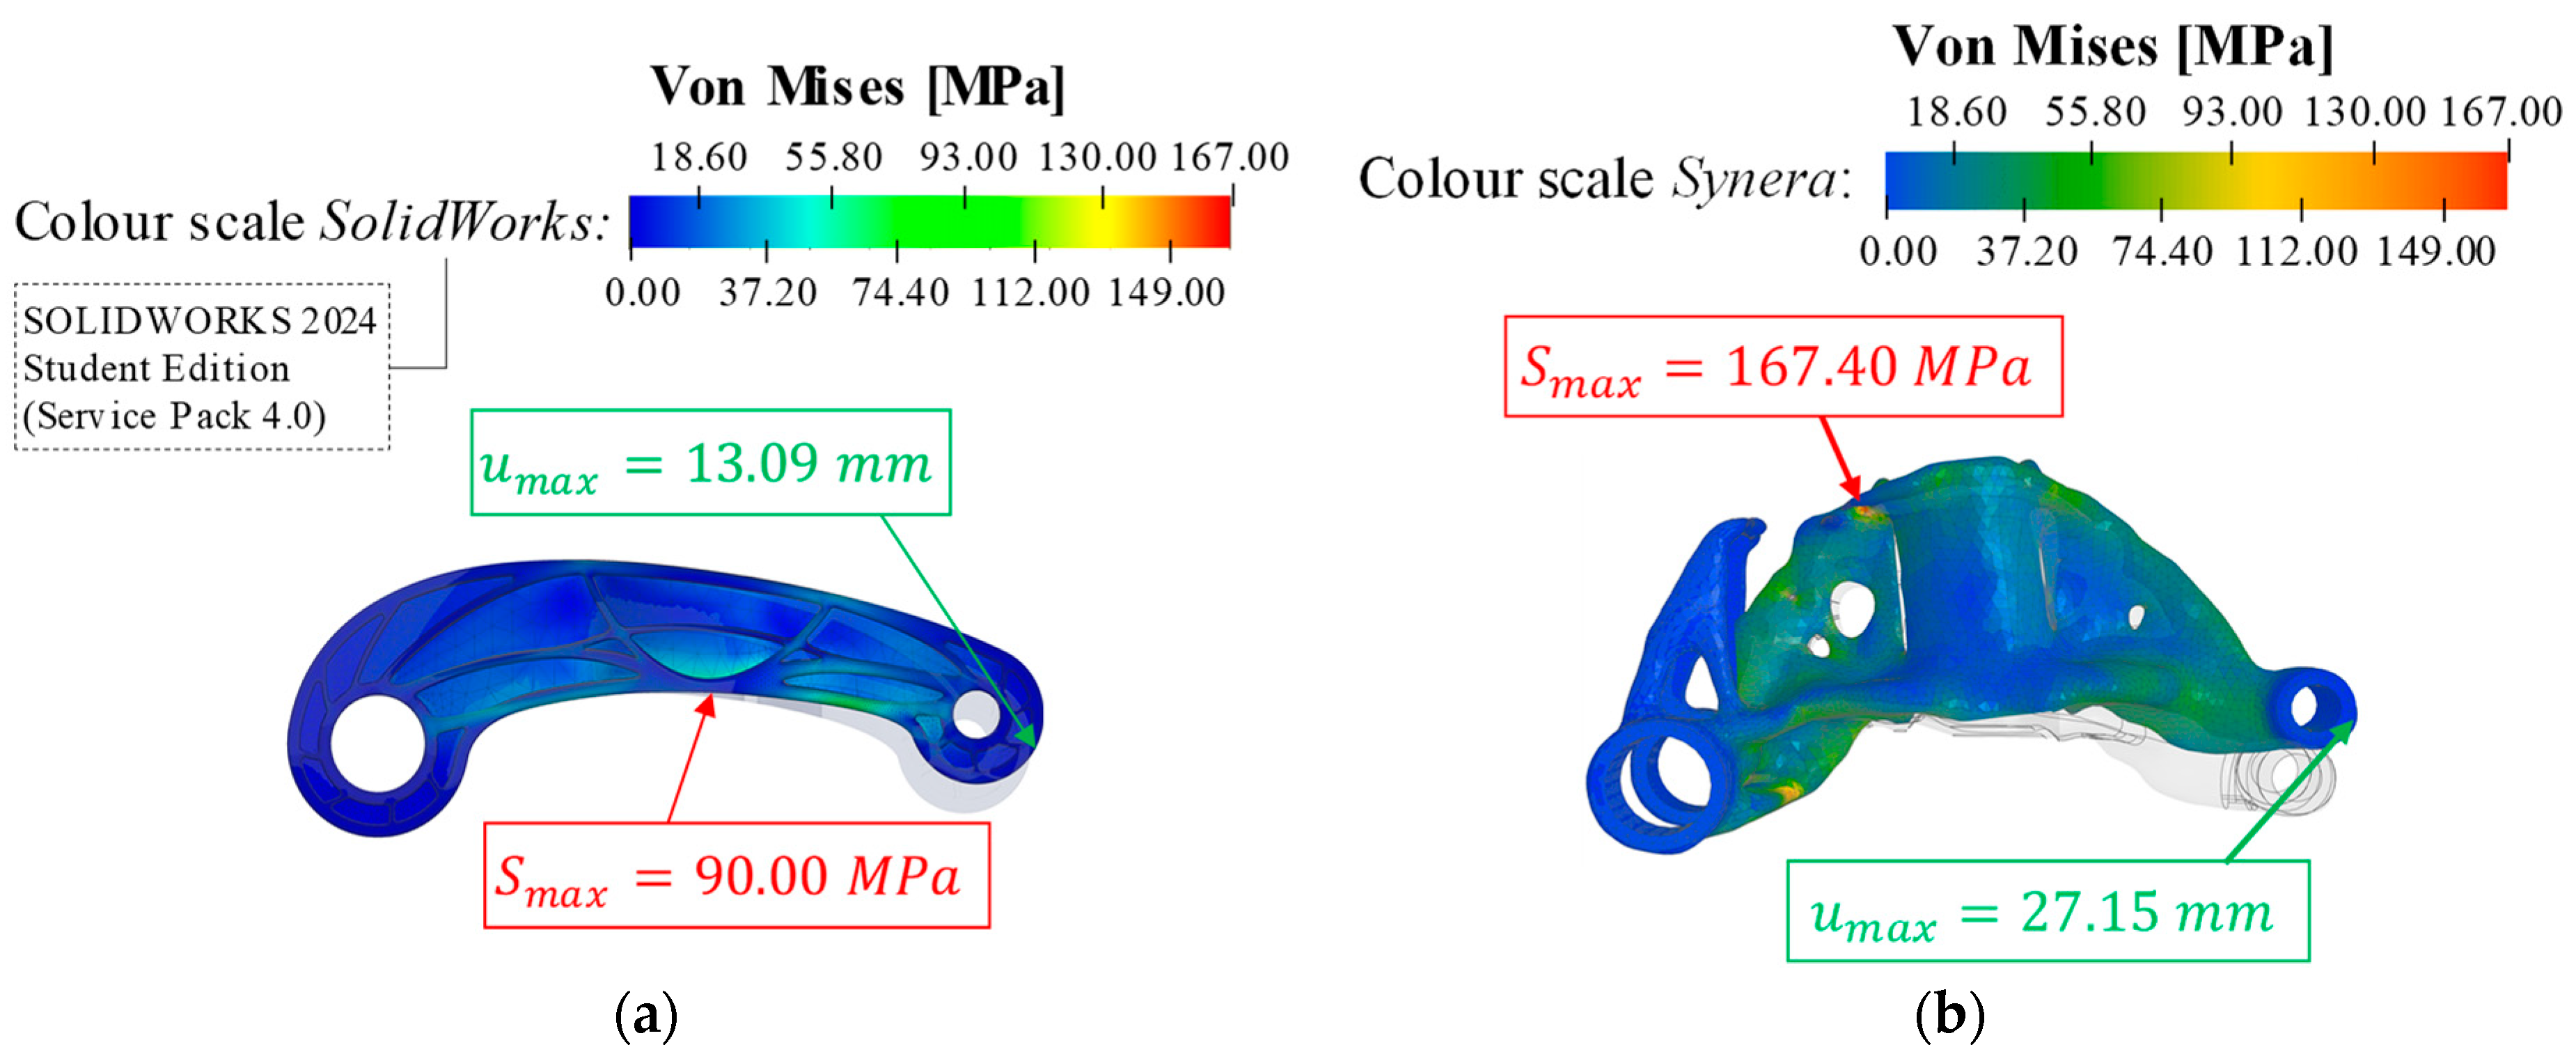
The technical characteristics of the final structures are compared under identical boundary conditions (polyamide 6 (PA6), axial tensile force of 10 kN). The evaluation is based on mass, stiffness and stress-related performance indicators. In addition to the conventionally developed design and the AI-assisted design reconstructed from the surrogate model prediction, the best-performing design from the training dataset is also considered. This ensures that the theoretical potential of the automated workflow is not underestimated, while simultaneously allowing limitations arising from the AI prediction step to be identified clearly. Figure 7 visualizes the FEA results while Table 5 summarizes the resulting displacements, von Mises equivalent stresses and key performance characteristics of the investigated designs.
The conventionally developed design has a mass of 360.11 g and exhibits a maximum displacement of 13.09 mm under load, resulting in an overall stiffness of 763.94 N/mm. In relation to the mass, this corresponds to a mass-specific stiffness K m of 2.12 N/mmg. The maximum von Mises stress reaches 90.00 MPa, thereby fully utilizing the assumed yield strength (σy) of PA6 and resulting in a stress-related safety factor of S = 1.00 . Within the simplified single-load-case framework of this study, this is acceptable as a comparative reference value, but it does not by itself constitute a sufficient release criterion for a production component. With respect to stress distribution, the design exhibits a mean stress S ¯ = 11.10   M P a , a standard deviation σ S = 12.50   M P a , and a coefficient of variation C V , S = 1.13 .
The design reconstructed from the surrogate-predicted candidate configuration is slightly lighter, with a mass of 348.36 g, but shows a significantly lower mechanical performance compared to the conventional reference. The maximum displacement increases to 27.15 mm, while stiffness decreases to 368.28 N/mm. Consequently, the mass-specific stiffness is reduced to K m = 1.06   N / m m g , corresponding to approximately 50% of the conventional reference value. The deformation pattern indicates insufficient vertical stiffening. The stress state is critical: the maximum von Mises stress reaches 167.44 MPa, which substantially exceeds the assumed material yield strength, resulting in a safety factor of S = 0.53 and indicating structural failure under the considered load case. Although the stress homogeneity indicators ( S ¯ = 18.70   M P a , σ S = 15.45   M P a , and C V , S = 0.82 ) appear more favorable at first glance, they must be interpreted with caution. These values do not primarily reflect improved material utilization, but rather a lack of local safety reserves and an overall elevated stress level. In manual design, highly stressed support and load introduction regions are deliberately designed with additional safety margins, which are absent in the final AI-assisted design. The poor stress prediction becomes particularly evident in the stress standard deviation: while the surrogate predicts σ S 95.9   M P a for the AI-selected parameter set (Table 4), the subsequent FEA of the reconstructed geometry yields σ S = 15.45   M P a (Table 5), i.e., a difference of roughly a factor of six.
To classify the performance level that can, in principle, be achieved using the data-driven approach, the best-performing design from the training dataset is also examined. This design exhibits a maximum displacement of 12.77 mm at a mass of 350.56 g, corresponding to a stiffness of 782.79 N/mm and the highest mass-specific stiffness within the comparison ( K m = 2.23   N / m m g ). At the same time, the maximum von Mises stress amounts to 76.82 MPa, resulting in a safety factor of S = 1.17 . The stress homogeneity indicators are also most favorable for this design ( S ¯ = 13.43   M P a , σ S = 9.83   M P a , and C V , S = 0.73 ), indicating a more evenly distributed stress field. However, this observation must be interpreted in conjunction with the local safety situation.
Overall, the comparison of technical properties shows that the AI-assisted development process, in its present implementation, does not achieve the mechanical performance level of the conventional design. Nevertheless, the best-performing design from the training dataset clearly demonstrates that the automated workflow has the potential to match or even exceed conventional solutions in global performance indicators such as the stiffness-to-mass ratio, and also in locally stress-sensitive quantities. The shortcomings of the final AI-assisted design should therefore be interpreted not as a fundamental limitation of the automated approach, but rather as a consequence of the still insufficient predictive accuracy of the surrogate model, particularly with respect to stress-distribution-related quantities such as σ S .
A plausible explanation for the discrepancy between the best-performing training design and the design reconstructed based on AI prediction lies in the limited predictive capability for stress-sensitive quantities. Local stress peaks are strongly influenced by fine-scale geometric details and mesh-related effects, such as local constrictions, smoothing effects, or mesh resolution [26], which are not explicitly represented in the input parameter space. In addition, the best-performing training design may be regarded as a statistical outlier within the overall sample, representing an individual realization with exceptionally favorable properties. This highlights the need to further stabilize AI predictions through larger datasets and, where appropriate, extended feature representations.

3.2.2. Manufacturability and Economic Efficiency

In addition to technical performance, manufacturability represents an independent evaluation criterion of equal importance within the scope of the study, as the investigated load-bearing structure is intended as an injection-molded plastic component for near-series applications. Manufacturability is therefore not understood merely as the fundamental feasibility of production, but as the economically robust realization within a series-capable injection molding process. For injection-molded lightweight structures, constant wall thicknesses within defined limits, clear demolding directions without undercuts and the avoidance of filigree, cycle-determining cores are particularly important. These factors directly influence tool complexity and investment costs, as well as process stability and cycle time in series production [32].
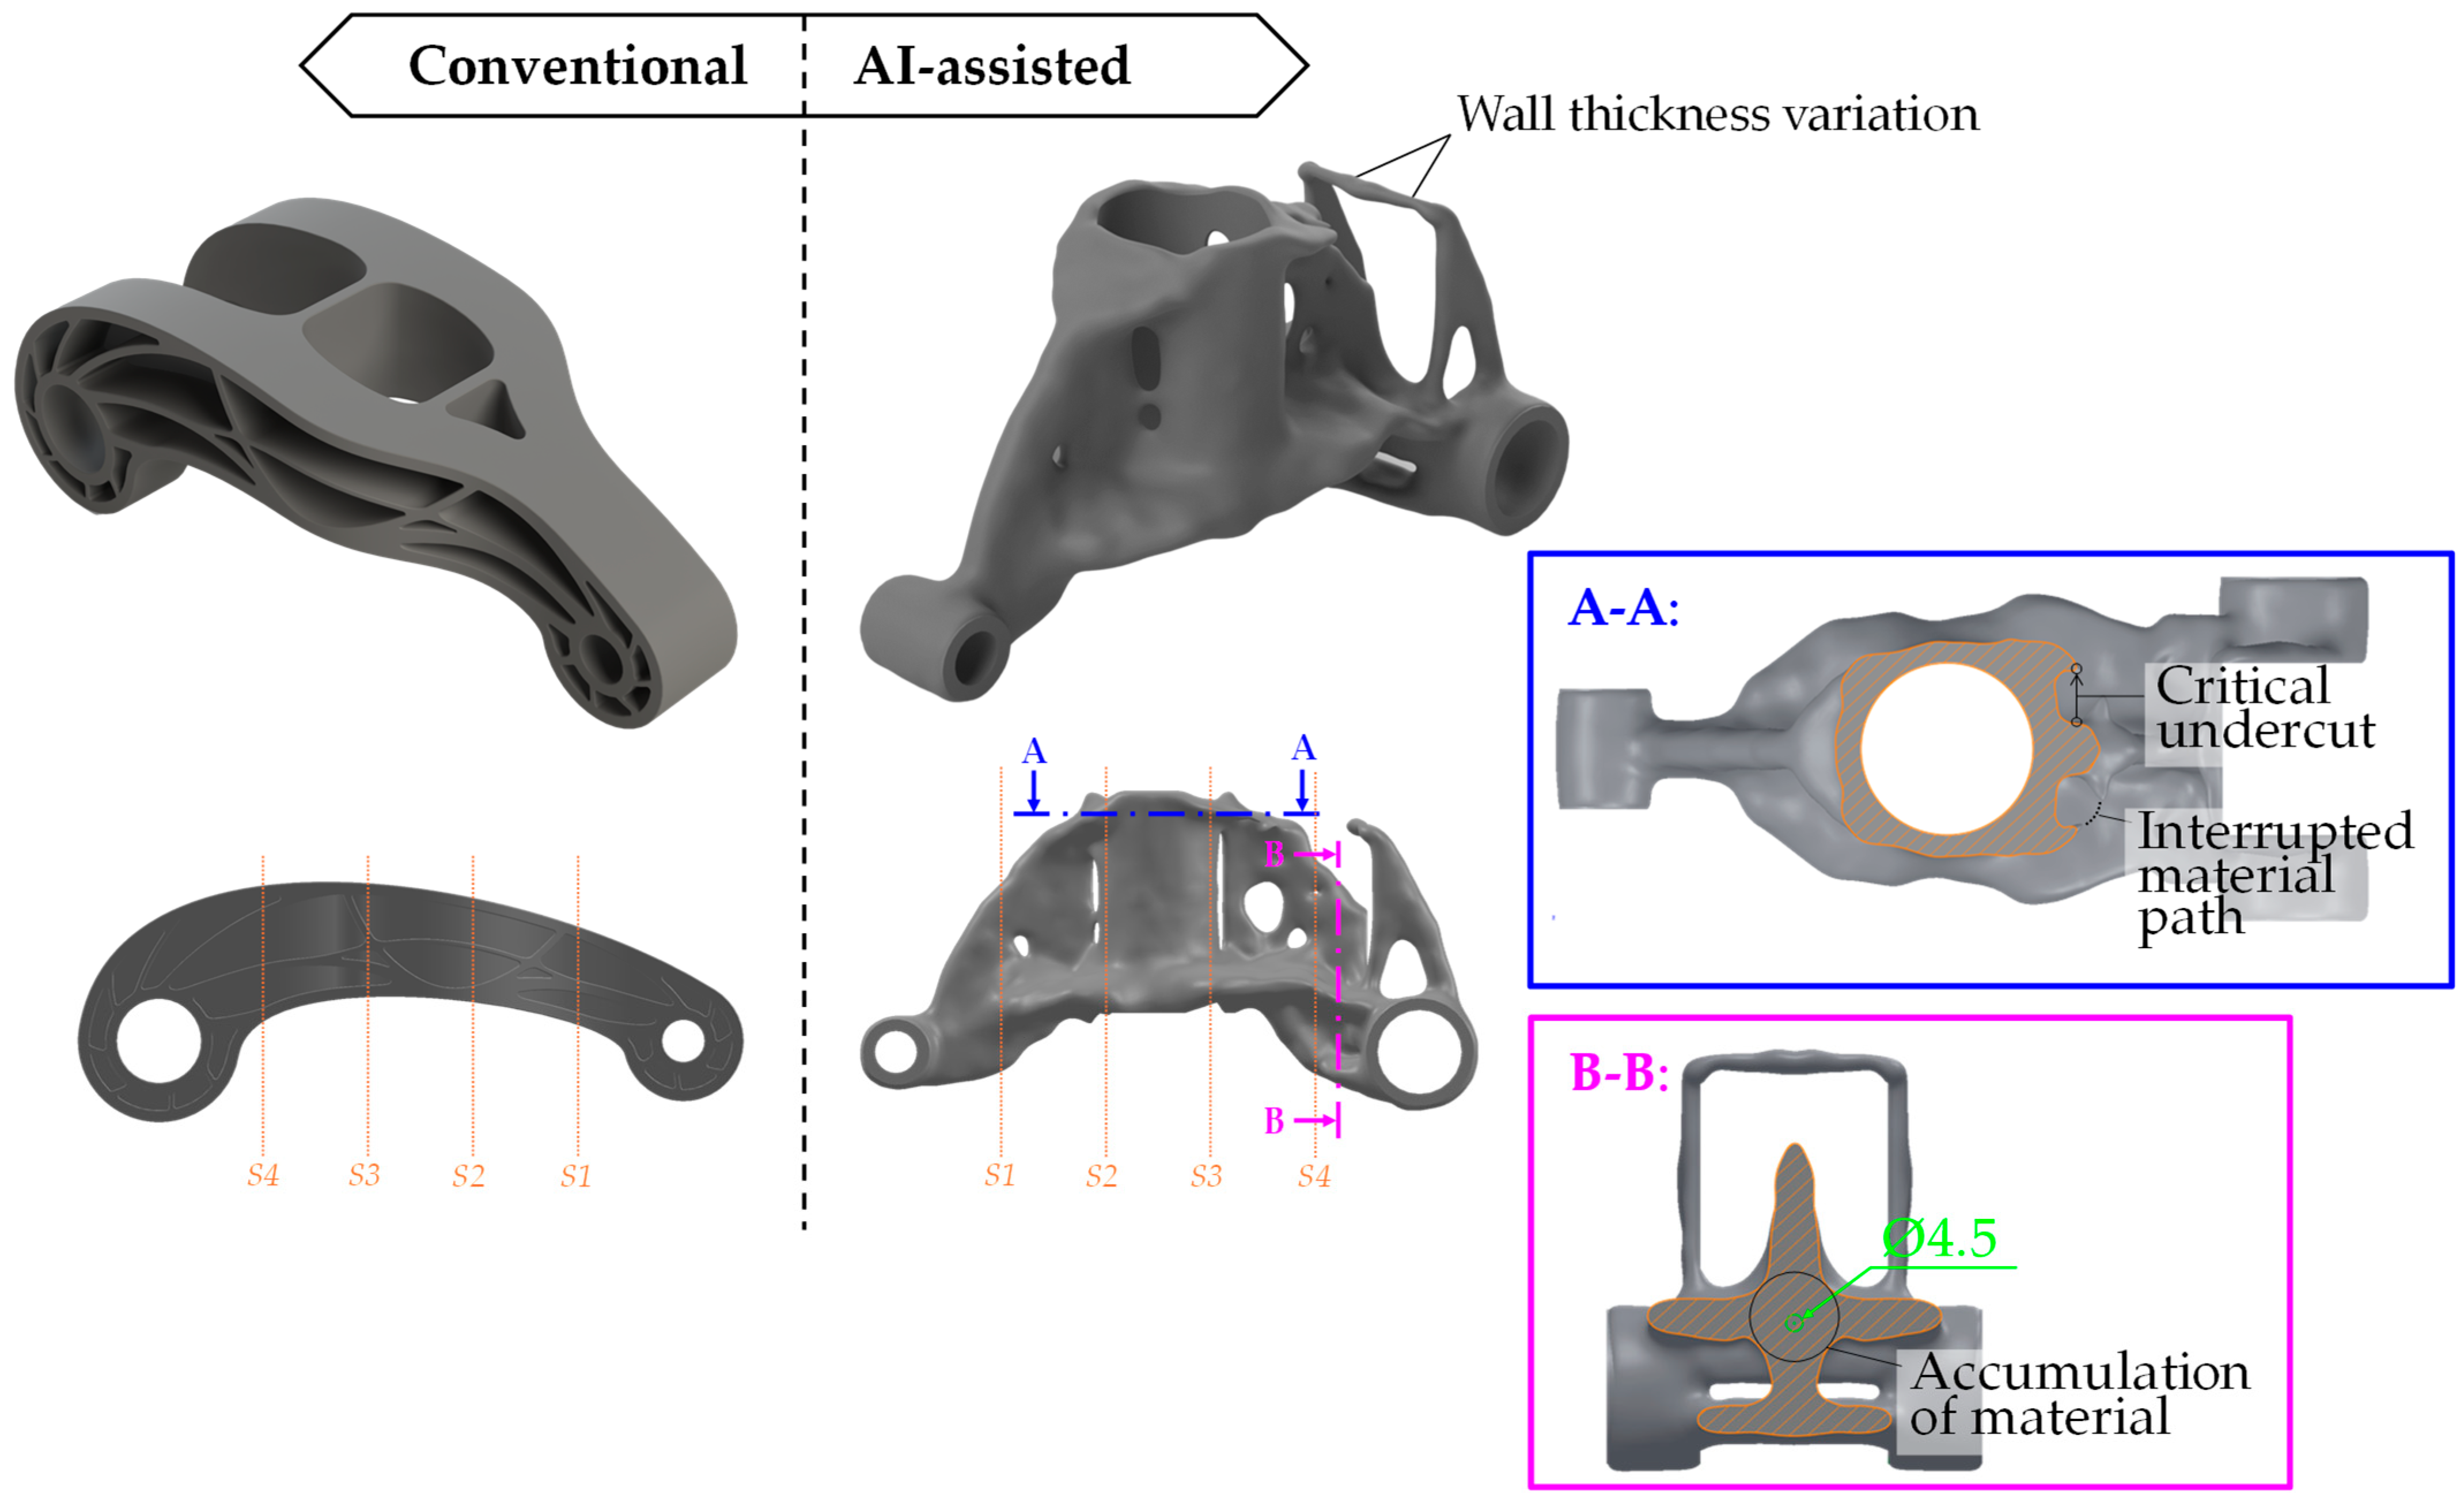
Figure 8 provides a direct visual comparison of the conventional and AI-assisted designs from a manufacturability perspective.
The section views A–A and B–B shown in Figure 8 illustrate representative local manufacturability issues. To complement this qualitative comparison, Table 6 reports simple wall-thickness-based manufacturability indicators for both final designs, based on measurements taken at the four common section locations S1–S4 indicated in the side views.
The conventionally developed design, shown in Figure 8, fulfills these requirements to a high degree. Through the manual transfer of topology optimization results into a ribbed CAD geometry, demoldability and tool logic were explicitly considered from the outset. The structure exhibits a clear demolding direction and can plausibly be realized using a two-part injection mold. Wall thicknesses are harmonized and were designed to comply with injection-molding requirements; local exceedances of the permissible range occur mainly at structural junctions and transition radii, while ribs and transitions are smooth and continuous from a functional perspective. This reduces notch-sensitive regions and promotes uniform filling and cooling conditions, thereby minimizing sink marks, shrinkage-related defects and warpage. From an economic perspective, this results in a mold of moderate complexity and enables reliable series production with predictably stable cycle times. This qualitative impression is supported by the wall-thickness measurements in Table 6: the conventional design shows a comparatively low wall-thickness variation ( C V , t = 0.238 ), and 75% of the sampled wall thicknesses lie within the permissible range of 1.5–4.5 mm.
In contrast, the AI-assisted design shown in Figure 8, which was reconstructed based on the surrogate model prediction, exhibits significant manufacturability limitations. This is also reflected quantitatively: the AI-assisted design exhibits a higher mean wall thickness ( t ¯ = 8.551   m m ) and a higher wall-thickness variation ( C V , t   =   0.340 ). Most notably, none of the sampled wall thicknesses lies within the permissible range of 1.5–4.5 mm ( P 1.5 4.5 = 0 % ). Although injection molding-related constraints were numerically integrated into the topology optimization, they could not be transferred reliably into an injection molding-compatible CAD geometry during the automated reconstruction step. The resulting structure is characterized by inhomogeneous wall thicknesses and locally massive regions. In addition, several geometric sections lack a clear demolding direction and exhibit undercuts, while interrupted material paths are also present. In an industrial injection molding context, such features would either require a substantially more complex mold incorporating additional slides and cores, or would prevent production altogether in the present form. Both scenarios significantly reduce economic efficiency: mold costs and technical risks increase, process stability deteriorates, and cycle-determining core and solid regions lead to extended cycle times and higher unit costs.
Overall, these observations confirm that while the automated workflow efficiently generates large numbers of design variants, it does not yet, in its current implementation, reliably meet the geometric and economic requirements for mold-compatible and series-ready component designs. These manufacturability deficits should therefore be attributed primarily to the current Synera-based reconstruction workflow and its constraint transfer, rather than to the general idea of AI-assisted or data-driven design-space exploration itself.

3.3. Summary of Comparison Results

The comparison of the two development approaches reveals complementary strengths. The conventional process results in a functionally harmonious structure that is suitable for injection molding and exhibits a high level of mechanical performance with locally robust stress conditions. This quality of results is achieved through a highly manual, engineering-driven process, the required effort of which increases almost linearly with each additional design variant. Consequently, the conventional approach is particularly advantageous when only a limited number of variants are considered and the primary objective is the development of a single, well-defined final design.
The AI-assisted approach demonstrates its primary strengths at the process level. Following a one-time initial effort for workflow development, data generation and model training, it enables fast, reproducible and systematic exploration of large parameter and variant spaces. The marginal effort per additional variant is significantly reduced, allowing broad-based parameter studies and early-stage variant investigations to be conducted with comparatively little additional time expenditure.
At the product level, the design reconstructed based on the AI prediction deviates from the conventional reference in the present implementation, particularly with respect to stiffness, stress levels and suitability for injection molding. To further contextualize these findings, the best-performing design from the generated training dataset was additionally evaluated. This design serves to illustrate the performance level that can, in principle, be achieved within the explored parameter space, without being constrained by the predictive limitations of the surrogate model.

4. Discussion

This section discusses the results presented in Section 3 with a focus on their methodological and practical implications. The findings are interpreted at both the product level and the process level in order to identify strengths, limitations and suitable application scenarios for each development approach. The discussion is structured along the research questions formulated in the introduction, addressing product-level performance and surrogate model limitations (RQ2 and RQ3) as well as process-level efficiency and scaling effects (RQ1).

4.1. Product- and Model-Related Results

The comparison of the resulting load-bearing structures indicates that the conventionally developed design exhibits overall more robust mechanical behavior than the AI-assisted approach. This can primarily be attributed to the engineer-led interpretation of the topology optimization results, in which local safety margins are deliberately introduced, and manufacturing constraints are consistently incorporated during the geometry transfer (Section 3.2). With respect to RQ2, this explains why the conventional design achieves a favorable combination of stiffness, stress level and manufacturability under the given boundary conditions.
Although the reconstructed design based on AI predictions achieves a comparable reduction in mass, it shows a less balanced mechanical response. The observed stress peaks indicate that locally critical load paths and transition regions are not captured with sufficient accuracy by the employed surrogate model. This finding should not be interpreted as a fundamental limitation of automated development approaches, but rather as a consequence of the currently limited predictive capability of the surrogate model for locally stress-sensitive structural quantities and of the specific implementation choices made in the present workflow (RQ3).
In this context, the evaluation of the dataset-optimal design, i.e., the best design from training data identified retrospectively within the simulated dataset, is particularly informative (Section 3.2.1). This design demonstrates that the automated workflow is, in principle, capable of producing high-performance structures with favorable stiffness-to-mass ratios and acceptable stress levels. However, this dataset-optimal design is not the final AI-predicted output of the surrogate-based workflow, but a solution selected ex post using the ground-truth FEA responses. It therefore serves as an upper bound on what the current automated process chain could deliver under perfect selection, rather than as the realized output of the predictive surrogate model in this study. The observed gap between the AI-predicted design and the dataset-optimal design thus directly reflects the limited ranking and selection capability of the surrogate, especially for stress-sensitive quantities. This underlines the need to clearly distinguish between the potential of the automated workflow architecture and the limitations of the specific AI model used in the present case.
More generally, the present results should be interpreted on two levels. On the one hand, the study reveals limitations of the specific surrogate formulation used here, i.e., a feed-forward neural network trained on a small set of solver-level topology-optimization parameters. These limitations primarily affect the prediction of stress-sensitive quantities and the ranking of candidate designs. On the other hand, the study also reveals limitations of the specific Synera-based implementation, in particular the automated reconstruction of topology-optimization results into CAD-compatible geometries and the transfer of manufacturing constraints through this reconstruction step. Accordingly, the poor final performance of the AI-generated design must not be interpreted as a general failure of AI-assisted design-space exploration. Rather, it results from the combination of (i) limited surrogate fidelity for stress-related targets and (ii) implementation-specific weaknesses of the current reconstruction workflow.
The regression-based model performs well for global quantities such as mass and stiffness-to-mass ratio and reaches moderate predictive quality for the global safety factor, but exhibits substantial limitations for the standard deviation of stress (see Table 3). While the validation R2 for S reaches 0.722, the validation R2 for σ S is only 0.0362, indicating no meaningful correlation between predictions and ground truth for this quantity.
The additional 5-fold cross-validation reported in Appendix B (Table A3) shows that the single hold-out metrics in Table 3 are somewhat optimistic with respect to split robustness. Across folds, the surrogate achieves only moderate mean validation performance for mass (R2 = 0.6285 ± 0.1058) and stiffness-to-mass ratio K m (R2 = 0.5989 ± 0.0894), lower performance for the safety factor S (R2 = 0.4894 ± 0.0590), and no meaningful predictive capability for the stress standard deviation σ S (R2 = −0.4848 ± 0.9830). The better values reported in Table 3 therefore reflect the original hold-out split of the selected model and should not be interpreted as split-independent estimates of generalization performance.
This selectively constrains its usefulness for safety-critical design decisions and directly addresses the question raised in RQ3. It is important to note that the surrogate input space in the present study is deliberately restricted to solver-level topology optimization parameters (e.g., wall thickness bounds, target mass, and mold-related settings) rather than detailed geometric descriptors of the resulting structures. This choice reflects how engineering teams are likely to parametrize such workflows in practice when starting from existing topology optimization tools and a fixed installation space. It greatly simplifies automation and keeps the workflow generic, but it also limits the surrogate’s ability to capture fine-scale geometric features that drive local stress peaks. Consequently, the observed performance gap for stress-sensitive quantities should be interpreted not only as a limitation of the specific neural-network model but also as a result of this intentionally coarse-grained parametrization. In practical terms, this means that the surrogate in its current form can support early-stage screening of broad trends in mass and stiffness-related performance and, with caution, the global safety factor S , but its predictive robustness is limited, and it must not be used to assess stress-distribution-related quantities such as σ S or to replace high-fidelity finite element analyses in stress-critical design decisions.
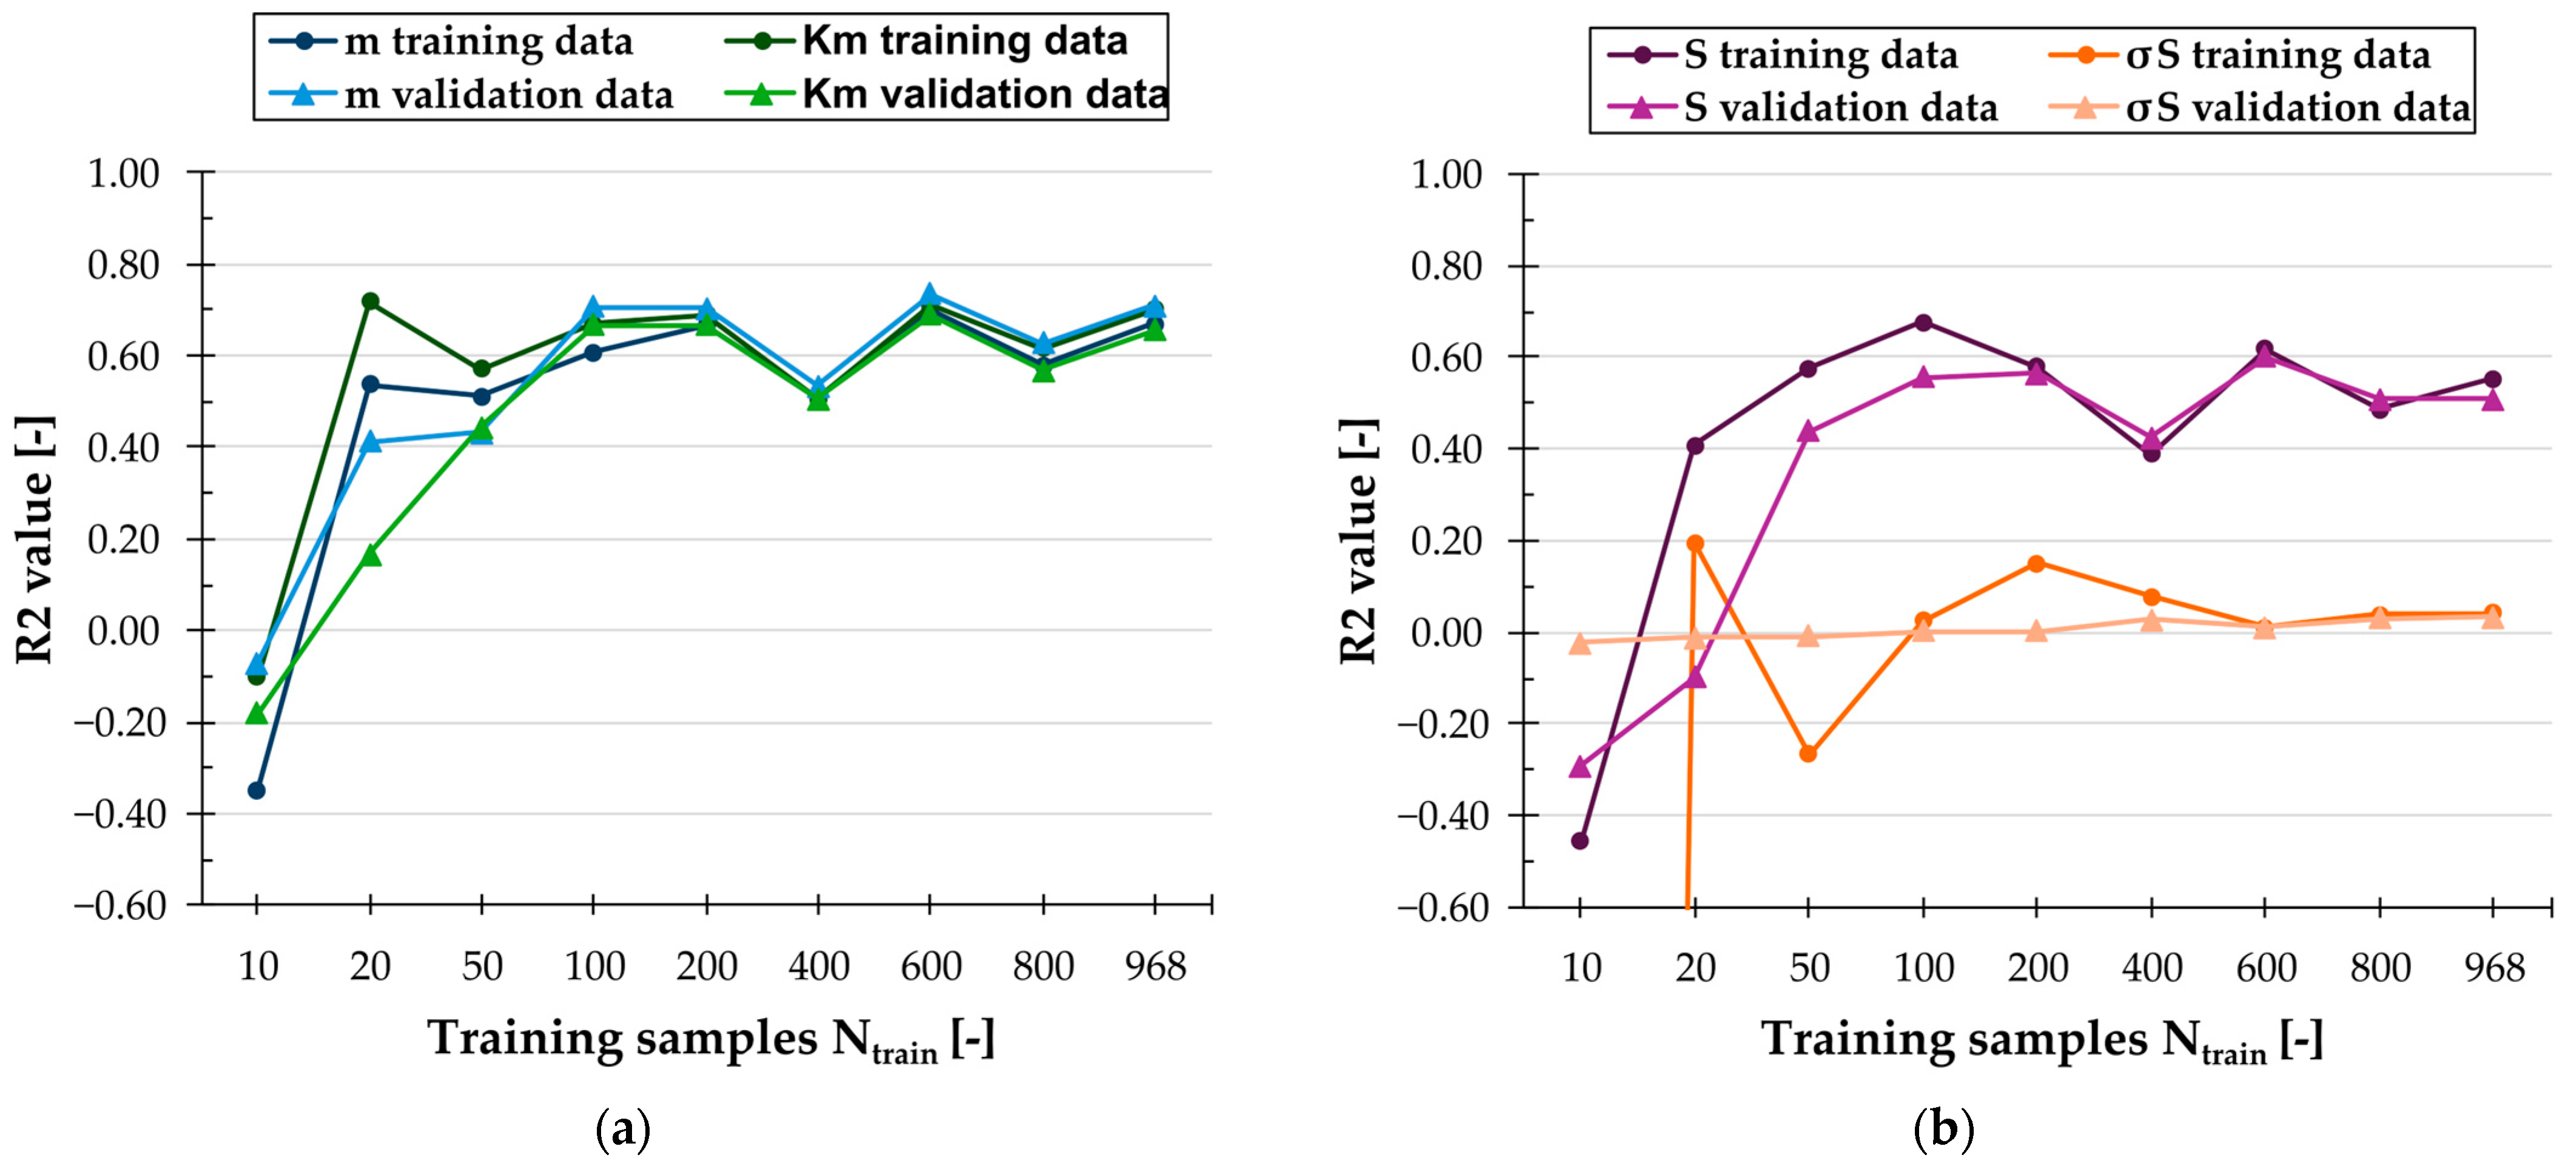
To distinguish more clearly between the effects of dataset size and parametrization on surrogate performance, a dedicated learning-curve analysis of the neural network was additionally carried out. The complete dataset of 1211 samples was standardized using separate StandardScalers for inputs and outputs and split into 80% training and 20% validation, as described in Section 2.3. Using the neural network architecture and hyperparameters of the final surrogate (Table 3), the network was retrained from scratch on nested subsets of the training data with N t r a i n   =   10 ,   20 ,   50 ,   100 ,   200 ,   400 ,   600 ,   800   a n d   968 samples, respectively, where each larger subset contained all samples of the previous one plus additional samples. For each N t r a i n , mean squared error and R2 were computed on both the training and validation sets for all four outputs ( m , K m , S and σ S ). Figure 9 summarises the resulting training and validation R2 values as a function of N t r a i n .
For the global quantities mass and K m , the validation R2 increases rapidly when N t r a i n is raised from 10 to roughly 100–200 samples and then fluctuates around values of approximately 0.6–0.7 for larger training sets. The validation R2 for the stress-related safety factor S also improves substantially with increasing training size and reaches a moderate performance level. This indicates that a few hundred samples are sufficient to obtain a reasonably accurate surrogate for the global responses, and that adding further samples only yields moderate and somewhat noisy improvements. In sharp contrast, the validation R2 for the stress standard deviation σ S remains close to zero for all investigated training set sizes, with values fluctuating between about −0.02 and +0.03, and the corresponding training R2 is also very low compared to the other outputs. Even when almost one thousand training samples are used, the surrogate is therefore unable to capture the variance of σ S . This confirms that, in the present workflow, the bottleneck for σ S is the coarse solver-level parametrization and the strongly local nature of the stresses, rather than an insufficient sampling density in the five-dimensional parameter space. Given that the 1211 simulated designs correspond to only about 0.5% of the 234,484 possible parameter combinations, the learning curves indicate that, for the present coarse solver-level parametrization, further uniform sampling of the remaining combinations would be expected to yield at most marginal improvements for the global responses and essentially no improvement for σ S .

4.2. Process-Level Aspects and Scaling Effects

In addition to differences in product performance, clear distinctions emerge at the process level, directly related to RQ1. The conventional development process follows a knowledge-based and iterative logic, enabling a high degree of control over local design decisions, but offering limited scalability (Section 3.1). The required development effort increases approximately linearly with the number of investigated variants, since each additional design requires renewed manual reconstruction and simulation. This makes the conventional approach particularly suitable when the number of variants is small and the focus lies on a single, well-defined final design.
In contrast, the AI-assisted workflow involves substantial initial effort associated with the setup of the automated process, data generation and surrogate model training. This effort, however, is largely independent of the number of variants evaluated in subsequent stages. Once the initial phase has been completed, the marginal effort per additional variant decreases significantly, enabling efficient exploration of large design spaces. The identified break-even point at approximately 16 evaluated variants (Section 3.1) therefore illustrates that the efficiency advantage of the AI-assisted approach should primarily be understood as a scaling effect rather than a universal improvement in all development scenarios.
To assess the robustness of this break-even point with respect to uncertainties in the underlying effort estimates, we performed a simple sensitivity analysis. Varying the initial automation effort T A I , i n i t by ±25% (i.e., between 682.5 and 1137.5 h) and the effort per variant in the conventional process t c o n v , v a r by the same percentage (i.e., between 45 and 75 h/variant) shifts the break-even from approximately 16 variants to a range of about 10–27 variants. These results confirm that the precise numerical value of “16 variants” is not more than an order-of-magnitude indicator: depending on engineer expertise, component complexity and available hardware, the actual cross-over point for a given organization could plausibly fall anywhere in the range of roughly one to a few dozen variants.
From a procedural perspective, a clear differentiation between the two approaches emerges. The conventional development process is particularly well suited for a limited number of targeted design iterations, where detailed engineering control and direct manufacturability considerations are paramount. In contrast, the AI-assisted workflow offers significant advantages for extensive variant studies and for application in early development phases, where large parameter spaces must be screened, and promising regions identified under time and resource constraints.
Overall, these observations suggest that the two approaches should not be viewed as direct competitors, but as complementary tools within a broader development strategy. For small variant numbers and late-stage design refinement, the conventional engineer-driven process remains the method of choice. For large-scale parameter studies and early-stage exploration, the AI-assisted workflow provides clear process-level benefits, provided that its product-level limitations, especially regarding stress-sensitive quantities, are explicitly taken into account.

4.3. Limitations and Scope of Applicability

The present study is based on a single, yet representative, load-bearing plastic component. While the conditions are typical for many automotive lightweight applications, they inevitably limit the generality of the quantitative results. In particular, the absolute effort values, the location of the break-even point, and the relative performance of the investigated designs can be expected to change for different component topologies, loading scenarios, materials, and manufacturing constraints. Consequently, the reported break-even value of 16 variants should be regarded as a case-specific, order-of-magnitude estimate rather than a generally valid threshold.
In addition, a single class of surrogate model, a fully connected feed-forward neural network, was investigated, and the input space was restricted to a small set of solver-level topology optimization parameters. Alternative model architectures (for example, graph- or image-based networks operating directly on mesh or voxel data), richer feature representations, and larger or more diverse training datasets may substantially improve the prediction of stress-related quantities; such extensions are not considered here and therefore fall outside the scope of the present analysis. Moreover, the surrogate model used in this study provides point predictions only and does not include a calibrated uncertainty model. The surrogate-based ranking of parameter configurations should therefore be interpreted as an exploratory screening step rather than as uncertainty-aware optimization.
With regard to workflow robustness, the excluded runs comprised both rule-based rejections of logically invalid parameter combinations and downstream failures during reconstruction or CAD meshing for final FEA. However, the detailed distribution of these downstream failures across the admissible parameter space was not analyzed systematically and therefore remains a limitation of the present study.
The manufacturability assessment in this study combines qualitative evaluation with a simple wall-thickness-based indicator, which improves the objectivity of the comparison. However, this does not yet constitute a full numerical manufacturability model, and explicit metrics for demoldability, tool complexity, or cycle time are still not included.
Within these limitations, the study provides a consistent, quantitatively supported picture of how a conventional engineer-driven workflow and an AI-assisted automated workflow behave under identical boundary conditions. The insights are most directly applicable to similar CAE-intensive structural design tasks with fixed installation spaces and strong manufacturing constraints, and they should be extrapolated to other domains only with appropriate caution.

5. Conclusions and Future Work

This study compared a conventional, topology-driven development process with an AI-assisted, largely automated workflow for the design of injection-moldable lightweight structures under identical boundary conditions. Both approaches were applied to the same installation space, material and load case, and both had to comply with injection-molding-specific manufacturing constraints.
On the process level, the results show that the two workflows follow fundamentally different logics. The conventional process requires comparatively low upfront effort but scales poorly: every additional design variant demands manual CAD work and renewed simulation, so total effort increases approximately linearly with the number of variants. The AI-assisted workflow, by contrast, entails a substantial one-time effort for automation, data generation and surrogate model training, but once this initial phase is completed, additional variants can be generated and evaluated with very low marginal effort. For the investigated case, this leads to a clear break-even point at around 16 evaluated variants, beyond which the AI-assisted approach becomes more efficient. Its main strength therefore lies in the scalable exploration of large design and parameter spaces rather than in the development of isolated individual solutions. In the present case, the fully automated workflow becomes attractive once on the order of a dozen or more variants must be evaluated under fixed boundary conditions. However, this break-even point is case-specific and should be interpreted as an order-of-magnitude indicator for comparable CAE-intensive development tasks rather than as a universal threshold, as it will shift with component complexity, organizational context, and the maturity of the automation infrastructure.
On the product level, the conventionally developed design currently yields the more robust component. It combines high mass-specific stiffness with controlled stress levels and good manufacturability in terms of wall thickness, demoldability and tool complexity. The design reconstructed from the surrogate model prediction, in contrast, exhibits lower stiffness, locally critical stresses and several geometric features that are problematic from an injection-molding perspective. At the same time, the best-performing design within the generated training dataset demonstrates that the automated workflow is, in principle, capable of producing structures that match or even slightly exceed the conventional reference in terms of stiffness-to-mass ratio and stress distribution. The gap between this internal optimum and the final AI-based design highlights that the current bottleneck is not the general idea of AI-assisted design-space exploration itself, but the combination of limited surrogate fidelity for stress-sensitive targets and implementation-specific weaknesses of the present reconstruction and constraint-transfer workflow.
The analysis of model performance confirms this interpretation. The regression-based neural network achieves good hold-out predictive quality for global quantities such as mass and stiffness-to-mass ratio and moderate hold-out predictive quality for the global safety factor S , but its accuracy deteriorates markedly for stress-sensitive metrics, particularly those describing the dispersion and inhomogeneity of the stress field. At the same time, the additional 5-fold cross-validation shows that these single-split results are somewhat optimistic with respect to split robustness: across folds, predictive performance is only moderate for mass and stiffness-to-mass ratio, lower for the safety factor, and poor for σ S . The additional learning-curve study (Section 4.1) further showed that increasing the dataset size from 10 to 968 samples does not materially improve the prediction of σ S , whereas the accuracy for the global quantities and, to a lesser extent, the safety factor saturates once a few hundred samples are used, underlining that the present solver-level parametrisation rather than data volume limits the surrogate’s capability for stress-related targets. As a result, the model is well suited for guiding mass and stiffness optimization in early-stage design space exploration and can, with caution, support the assessment of broad safety-related trends, but cannot yet replace detailed finite element analyses when local stress conditions, stress distributions, and structural safety are critical. Improving prediction quality for stress-related quantities will require richer and more expressive feature representations, larger and more diverse datasets, potentially physics-informed learning strategies, and alternative surrogate architectures tailored to stress-related targets.
Taken together, these findings suggest that AI-assisted workflows are most effective when they are used to complement, rather than to replace, conventional engineering processes. The automated workflow is particularly valuable for systematically exploring large variant spaces, identifying promising regions of the parameter space and supporting decisions in early development phases. The conventional, engineer-led workflow remains essential for the final design and validation of production-ready components, especially where manufacturability and local safety margins must be guaranteed. These findings should therefore not be interpreted as evidence against the use of AI-assisted workflows in structural design, but rather as a cautionary note with respect to their current limitations in stress-critical applications.
Future work should therefore focus on three directions. First, surrogate models need to be enhanced for stress-sensitive quantities by extending the feature space, improving data quality and incorporating physical prior knowledge where appropriate. Second, manufacturing constraints should be integrated more directly and explicitly into automated workflows, not only as constraints in topology optimization, but also as dedicated evaluation metrics. This includes the development of explicit manufacturability and economic efficiency indicators, such as demoldability metrics, undercut ratios, measures of tooling complexity or proxies for cycle time, which can be incorporated as additional targets or constraints in AI-assisted design processes. Third, the methodology should be extended to more complex material systems such as fiber-reinforced plastics, where anisotropy and nonlinear effects increase modelling complexity but also offer considerable potential for data-driven approaches.
In the longer term, these developments point towards hybrid digital development environments in which AI-assisted variant exploration and data-driven modelling are tightly coupled with classical engineering methods to leverage the strengths of both worlds. Realizing such environments in practice will require close collaboration between experts in automation, numerical mechanics and machine learning, particularly in application domains such as automotive lightweight design.

Author Contributions

Conceptualization, M.S.; methodology, M.S., A.B. and C.L.; software, M.S. and Z.Y.; validation, M.S., Z.Y., J.L. and A.B.; formal analysis, M.S., Z.Y. and J.L.; investigation, M.S. and C.L.; resources, Z.Y. and C.L.; data curation, M.S.; writing—original draft preparation, M.S.; writing—review and editing, M.S., Z.Y., J.L., A.B., Z.Q. and C.L.; visualization, M.S. and A.B.; supervision, C.L. and Z.Q.; project administration, C.L.; funding acquisition, C.L. All authors have read and agreed to the published version of the manuscript.

Funding

This research received no external funding.

Institutional Review Board Statement

Not applicable.

Informed Consent Statement

Not applicable.

Data Availability Statement

The data presented in this study are available on reasonable request from the corresponding author. The data are not publicly available due to the large size of the simulation datasets and the use of proprietary CAD and FEA file formats, which cannot be hosted in a public repository by the authors.

Acknowledgments

The authors gratefully acknowledge Fares Seddik (Synera GmbH, Bremen, Germany) for his continuous technical support and constructive input during the implementation of the automated workflow in the Synera environment. During the preparation of this manuscript, the authors used innoGPT (Inno KI GmbH, Vechta, Germany, https://www.innogpt.de/, utilized model: GPT 5.1) to support language editing and the restructuring of sections. The authors have reviewed and edited the output and take full responsibility for the content of this publication.

Conflicts of Interest

The authors declare no conflicts of interest.

Correction Statement

This article has been republished with a minor correction to an author’s ORCID. This change does not affect the scientific content of the article.

Abbreviations

The following abbreviations are used in this manuscript:
AIArtificial Intelligence
CADComputer-Aided Design
CAEComputer-Aided Engineering
CVCoefficient of variation
FEFinite element
FEAFinite element analysis
MSEMean squared error
PA6Polyamide 6
σyYield strength

Appendix A. Detailed Breakdown of Development Effort

This appendix provides a detailed breakdown of the documented development effort for the conventional and AI-assisted workflows used in the case study (Table A1 and Table A2).
Table A1. Detailed breakdown of the time required for individual steps of the conventional development workflow.
StepTime per StepNumber/
Iterations
Total Time
Topology optimizations (2 runs) including preparation2 h24 h
Interpretation of topology results and translation
into design language
3 h13 h
Base design in side view2 h12 h
FEA-based stress analyses and design adaptations
(side view)
Analysis: 30 min
adaption: 1 h
5 iterations7.5 h
Base design in top view and intersection with side view3 h13 h
FEA-based stress analyses and design adaptations
(top view)
Analysis: 0.5 h
adaption: 1 h
8 iterations12 h
Hollowing and placement of webs5 h15 h
FE analysis (principal stress paths)1 h11 h
Creation of basic rib geometry5 h15 h
FEA and adaptation of rib thicknesses to stress
distribution
Analysis: 0.5 h
adaption: 0.5 h
5 iterations5 h
FEA and smoothing of local stress peaks (notches)Analysis: 0.5 h
adaption: 0.5 h
10 iterations10 h
Rounding of outer edges and final FE analysisRounding: 10 min
FEA: 1 h
11.17 h
Extraction and statistical evaluation of nodal stressesExport: 6 min
evaluation: 0.5 h
10.6 h
Total time required ≈60 h
Table A2. Detailed breakdown of the time required for individual steps of the AI-assisted development workflow.
StepTime per StepComment
Initial familiarization and preparation
Familiarization with Synera80 hBasic understanding for workflow creation
Process flowchart1 hConceptual planning of
workflow structure
Creation of individual steps/workflows
Geometry import2 h
Meshing of design space and non-design space4 h
Solid part naming and material assignment2 h
FE modeling4 h
Topology optimization4 h
Automatic isovalue extraction10 h
Reconstruction20 h
Remeshing0.5 h
FE analysis2 h
Response extraction3 hTarget quantities such as stiffness or stress
AI integration and automation
Analysis of suitable integration points for AI6 h
Linking and automating workflows5 h
Design study for training data generation
1211 valid designs at 30 min each≈605.5 h
600 invalid designs at 20 min each200 hDownstream reconstruction or meshing failures after substantial workflow execution
1736 invalid designs at 5 s each≈2.4 hRule-based rejection of logically invalid parameter combinations before topology optimization start
Training data preparation and AI training
Setup of workflow for data preparation2 h
Technical data preparation0.1 h
Adaption and familiarization with AI training workflow5 hBased on existing template
AI training1 hData input and runtime
Prediction workflow and selection phase
Familiarization and adaption of prediction workflow1 h
Design study (234,484 designs evaluated automatically)24 happrox. 0.37 s/design
Extended selection and validation
Filter workflows (e.g., filtering design with best stiffness)Setup: 2 h
execution: 2 min
Workflow: algorithmic search for best designs (overall property profile)1 h
Validation2 hVia automated workflow
Total time required≈990 hIncl. familiarization with Synera
Automated time per design≈0.37 s234,484 designs in approx. 24 h

Appendix B. Cross-Validation-Based Robustness Assessment of the Final Surrogate Model

This appendix complements the original 80/20 hold-out evaluation of the selected final surrogate model reported in Table 3 by assessing the robustness of the predictive performance with respect to data partitioning. For this purpose, the final network architecture and fixed hyperparameters selected in Section 2.3 were additionally re-evaluated by 5-fold cross-validation over the full dataset.
In each fold, the input and output standardization was fitted on the respective training fold only in order to avoid data leakage. The multi-output neural network was then retrained from scratch and evaluated on the corresponding validation fold. For each output variable, the mean validation R2 and mean validation MSE as well as their standard deviations across the five folds were determined. The results are shown in Table A3.
Table A3. Five-fold cross-validation results for the final neural-network architecture.
OutputMean Validation
R2
Standard Deviation of R2Mean Validation MSEStandard Deviation of MSE
Mass m 0.62850.10580.36590.0967
Stiffness-to-mass ratio K m 0.59890.08940.39760.0869
Stress-related safety factor S 0.48940.05900.50990.1065
Stress standard deviation σ S −0.48480.98301.19811.1765

References

  1. Eigner, M. Disruptive Veränderungen in der Automobilindustrie bedingen neue Entwicklungsprozesse. Z. Für Wirtsch. Fabr. 2023, 118, 4–9. [Google Scholar] [CrossRef] [Scilit]
  2. Goswami, P. The Software-Defined Vehicle and Its Engineering Evolution: Balancing Issues and Challenges in a New Paradigm of Product Development; SAE Research Report EPR2024007; SAE International: Warrendale, PA, USA, 2024. [Google Scholar] [CrossRef] [Scilit]
  3. Kriebel, S.; Richenhagen, J.; Schulze, C.; Moyses, V.; Orth, P.; Pischinger, S.; Greifenberg, T.; Rumpe, B. Mastering the future: Agile model-based system design for BMW’s electrified next generation platform. In Proceedings of the 18th Internationales Stuttgarter Symposium; Bargende, M., Reuss, H.-C., Wiedemann, J., Eds.; Springer: Wiesbaden, Germany, 2018; pp. 1365–1376. ISBN 978-3-658-21193-6. [Google Scholar] [CrossRef] [Scilit]
  4. Roy, D.; Balszun, M.; Heurung, T.; Chakraborty, S.; Naik, A. Waterfall is too slow, let’s go Agile. In Proceedings of the IEEE/ACM International Conference on Computer-Aided Design (ICCAD ‘18), San Diego, CA, USA, 5–8 November 2018; Bahar, I., Ed.; ACM: New York, NY, USA, 2018; pp. 1–7. ISBN 9781450359504. [Google Scholar] [CrossRef] [Scilit]
  5. Kaluza, A.; Kleemann, S.; Fröhlich, T.; Herrmann, C.; Vietor, T. Concurrent Design & Life Cycle Engineering in Automotive Lightweight Component Development. Procedia CIRP 2017, 66, 16–21. [Google Scholar] [CrossRef] [Scilit]
  6. Wang, J.; Li, Y.; Hu, G.; Yang, M. Lightweight Research in Engineering: A Review. Appl. Sci. 2019, 9, 5322. [Google Scholar] [CrossRef] [Scilit]
  7. Kömm, L.; Sattler, S.; Seidler, A.; Paetzold-Byhain, K. Feasibility study on time saving potentials of automated workflows in the early design stage of bus body structures. In DS 125: Proceedings of the 34th Symposium Design for X (DFX2023), Radebeul, Germany, 14–15 September 2023; Krause, D., Paetzold-Byhain, K., Wartzack, S., Eds.; The Design Society: Glasgow, UK, 2023; pp. 65–74. [Google Scholar] [CrossRef] [Scilit]
  8. Trummer, R. KI in der Produktentwicklung: Die Große Expertenumfrage. Digital Engineering Magazin. 17 October 2024. Available online: https://www.digital-engineering-magazin.de/ki-in-der-produktentwicklung-die-grosse-expertenumfrage-a-4ec9025905d4d81b0d53d1561338011d/ (accessed on 30 December 2024).
  9. Ambadekar, P.K.; Ambadekar, S.; Choudhari, C.M.; Patil, S.A.; Gawande, S.H. Artificial intelligence and its relevance in mechanical engineering from Industry 4.0 perspective. Aust. J. Mech. Eng. 2025, 23, 110–130. [Google Scholar] [CrossRef] [Scilit]
  10. Zywietz, M.; Boegle, A. Efficiency and attitude: On the relationship between lightweight structures and sustainability. In Proceedings of the IASS 2024 Symposium: Redefining the Art of Structural Design, Zurich, Switzerland, 26–30 August 2024; Block, P., Boller, G., DeWolf, C., Pauli, J., Kaufmann, W., Eds.; International Association for Shell and Spatial Structures (IASS): Madrid, Spain, 2024; pp. 1–9. [Google Scholar]
  11. Berjoza, D.; Jurgena, I.; Millers, R. Effect of electric vehicle mass change on energy consumption and the range. Agron. Res. 2024, 22, 1089–1097. [Google Scholar] [CrossRef]
  12. Friedrich, H.E.; Müller, G. (Eds.) Werkstoffe und Bauweisen in der Fahrzeugtechnik; Springer: Berlin/Heidelberg, Germany, 2024; ISBN 978-3-662-65268-8. [Google Scholar] [CrossRef] [Scilit]
  13. Zhang, W.; Xu, J. Advanced lightweight materials for Automobiles: A review. Mater. Des. 2022, 221, 110994. [Google Scholar] [CrossRef] [Scilit]
  14. Modler, N.; Winkler, A.; Filippatos, A.; Weck, D.; Dannemann, M. Function-integrative Lightweight Engineering—Design Methods and Applications. Chem. Ing. Tech. 2020, 92, 949–959. [Google Scholar] [CrossRef] [Scilit]
  15. Wang, J.; Martin-Doñate, C.; Cui, H.; Liang, Y.; Li, H. Editorial: Injection molding of polymeric and composite materials. Front. Mater. 2025, 11, 1534575. [Google Scholar] [CrossRef] [Scilit]
  16. Jaroschek, C. Injection Molding for Practitioners; Carl Hanser Verlag GmbH & Co. KG: Munich, Germany, 2024; ISBN 978-1-56990-178-6. [Google Scholar] [CrossRef] [Scilit]
  17. Hoffmann, M. Topologieoptimierung in der Produktentwicklung Einführung—Anwendungsmöglichkeiten—Zukunftsperspektive. Konstruktionspraxis. 2007. Available online: https://www.konstruktionspraxis.vogel.de/topologieoptimierung-in-der-produktentwicklung-einfuehrung--anwendungsmoeglichkeiten-zukunftsperspektive-a-114084/ (accessed on 6 January 2025).
  18. Krause, D.; Schwenke, J.; Gumpinger, T.; Plaumann, B. Leichtbau. In Handbuch Konstruktion; Rieg, F., Steinhilper, R., Eds.; Carl Hanser Verlag GmbH & Co. KG: Munich, Germany, 2018; pp. 485–507. ISBN 978-3-446-45224-4. [Google Scholar] [CrossRef] [Scilit]
  19. Lange, F. Prozessgerechte Topologieoptimierung für die Additive Fertigung; Springer: Berlin/Heidelberg, Germany, 2021; ISBN 978-3-662-63132-4. [Google Scholar] [CrossRef] [Scilit]
  20. Latifi Rostami, S.A.; Kolahdooz, A.; Chung, H.; Shi, M.; Zhang, J. Robust topology optimization of continuum structures with smooth boundaries using moving morphable components. Struct. Multidisc. Optim. 2023, 66, 121. [Google Scholar] [CrossRef] [Scilit]
  21. Roith, B.; Neidnicht, M.; Rieg, F. Finite-Elemente-Analyse. In Handbuch Konstruktion; Rieg, F., Steinhilper, R., Eds.; Carl Hanser Verlag GmbH & Co. KG: Munich, Germany, 2018; pp. 933–959. ISBN 978-3-446-45224-4. [Google Scholar] [CrossRef] [Scilit]
  22. Mujumdar, P.; Maheswari, J.U. Design iteration in construction projects—Review and directions. Alex. Eng. J. 2018, 57, 321–329. [Google Scholar] [CrossRef] [Scilit]
  23. Montáns, F.J.; Chinesta, F.; Gómez-Bombarelli, R.; Kutz, J.N. Data-driven modeling and learning in science and engineering. Comptes Rendus Mécanique 2019, 347, 845–855. [Google Scholar] [CrossRef] [Scilit]
  24. Chavali, V.A.P.; Deshmukh, A.A.; Ambekar, A.G. Artificial Neural Network. In Neural Network Modelling of Microstrip Antennas; Chavali, V.A.P., Deshmukh, A.A., Ambekar, A.G., Eds.; Springer Nature: Singapore, 2025; pp. 1–7. ISBN 978-981-96-9430-3. [Google Scholar] [CrossRef] [Scilit]
  25. Wu, J.; Du, C.; Dillenburger, B.; Kraus, M. Fast Prediction of Stress Distribution: A GNN-based surrogate model for unstructured mesh FEA. In Proceedings of the IASS 2024 Symposium: Redefining the Art of Structural Design, Zurich, Switzerland, 26–30 August 2024; Block, P., Boller, G., DeWolf, C., Pauli, J., Kaufmann, W., Eds.; International Association for Shell and Spatial Structures (IASS): Madrid, Spain, 2024; Available online: https://www.research-collection.ethz.ch/items/d1503ae0-bde1-4199-aec2-1f67448e8943#:~:text=Abstract,stress%20distribution%20for%20unseen%20cases. (accessed on 5 February 2026).
  26. Milella, P.P. Fatigue and Corrosion in Metals; Springer: Milan, Italy, 2013; ISBN 978-88-470-2335-2. [Google Scholar] [CrossRef] [Scilit]
  27. Persia, J.T.; Sung, M.K.; Lee, S.; Burns, D.E. Neural network-based surrogate model in postprocessing of topology optimized structures. Neural Comput. Appl. 2025, 37, 8845–8867. [Google Scholar] [CrossRef] [Scilit] [PubMed]
  28. Black, N.; Najafi, A. Stress-constrained optimization of multiscale structures with parameterized microarchitectures using machine learning. Struct. Multidisc. Optim. 2024, 67, 102. [Google Scholar] [CrossRef] [Scilit]
  29. Wang, Z.; Yan, X.; Melkote, S.; Rosen, D. McGAN: Generating manufacturable designs by embedding manufacturing rules into conditional generative adversarial network. Adv. Eng. Inform. 2025, 64, 103074. [Google Scholar] [CrossRef] [Scilit]
  30. Domínguez-Domínguez, G.; Justo, X.; Matey, L.M. Integration of manufacturing constraints into topology optimization algorithms for long fibre reinforced plastic components. Int. J. Adv. Manuf. Technol. 2025. [Google Scholar] [CrossRef] [Scilit]
  31. Málaga-Chuquitaype, C. Machine Learning in Structural Design: An Opinionated Review. Front. Built Environ. 2022, 8, 815717. [Google Scholar] [CrossRef] [Scilit]
  32. Kazmer, D.O. Injection Mold Design Engineering, 2nd ed.; Carl Hanser Verlag GmbH & Co. KG: Munich, Germany, 2016; ISBN 978-1-56990-570-8. [Google Scholar] [CrossRef] [Scilit]
  33. Stangl, T.; Wartzack, S. Feature-based interpretation and reconstruction of structural topology optimization results. In Proceedings of the 20th International Conference on Engineering Design (ICED15), Volume 6: Design Methods and Tools—Part 2, Milan, Italy, 27–30 July 2015; Weber, C., Husung, S., Cantamessa, M., Cascini, G., Marjanovic, D., Bordegoni, M., Eds.; The Design Society: Glasgow, UK, 2015; pp. 235–244. ISBN 978-1-904670-75-9. Available online: https://api.semanticscholar.org/CorpusID:59031649 (accessed on 30 November 2025).
  34. Bergstra, J.; Bengio, Y. Random search for hyper-parameter optimization. J. Mach. Learn. Res. 2012, 13, 281–305. [Google Scholar]
  35. Bahdanau, D.; Domingue, J.; Garg, N.; Otsuka, M.; Pepin, B.; Popien, P.; Rayner, E.; Shepard, P.; Song, K.-B.; Sun, Z.; et al. Machine Learning Basics. In Deep Learning; Goodfellow, I., Bengio, Y., Courville, A., Eds.; MIT Press: Cambridge, MA, USA, 2016; pp. 98–165. ISBN 978-0-262-03561-3. Available online: http://www.deeplearningbook.org (accessed on 9 December 2025).
  36. Garnett, R. Bayesian Optimization; Cambridge University Press: Cambridge, UK, 2023; ISBN 9781108348973. [Google Scholar] [CrossRef] [Scilit]
  37. Rein, R. Model Evaluation in Machine Learning Applications. In Artificial Intelligence and Machine Learning in Sports Science; Memmert, D., Ed.; Springer: Berlin/Heidelberg, Germany, 2025; pp. 41–54. ISBN 978-3-662-70154-6. [Google Scholar] [CrossRef] [Scilit]
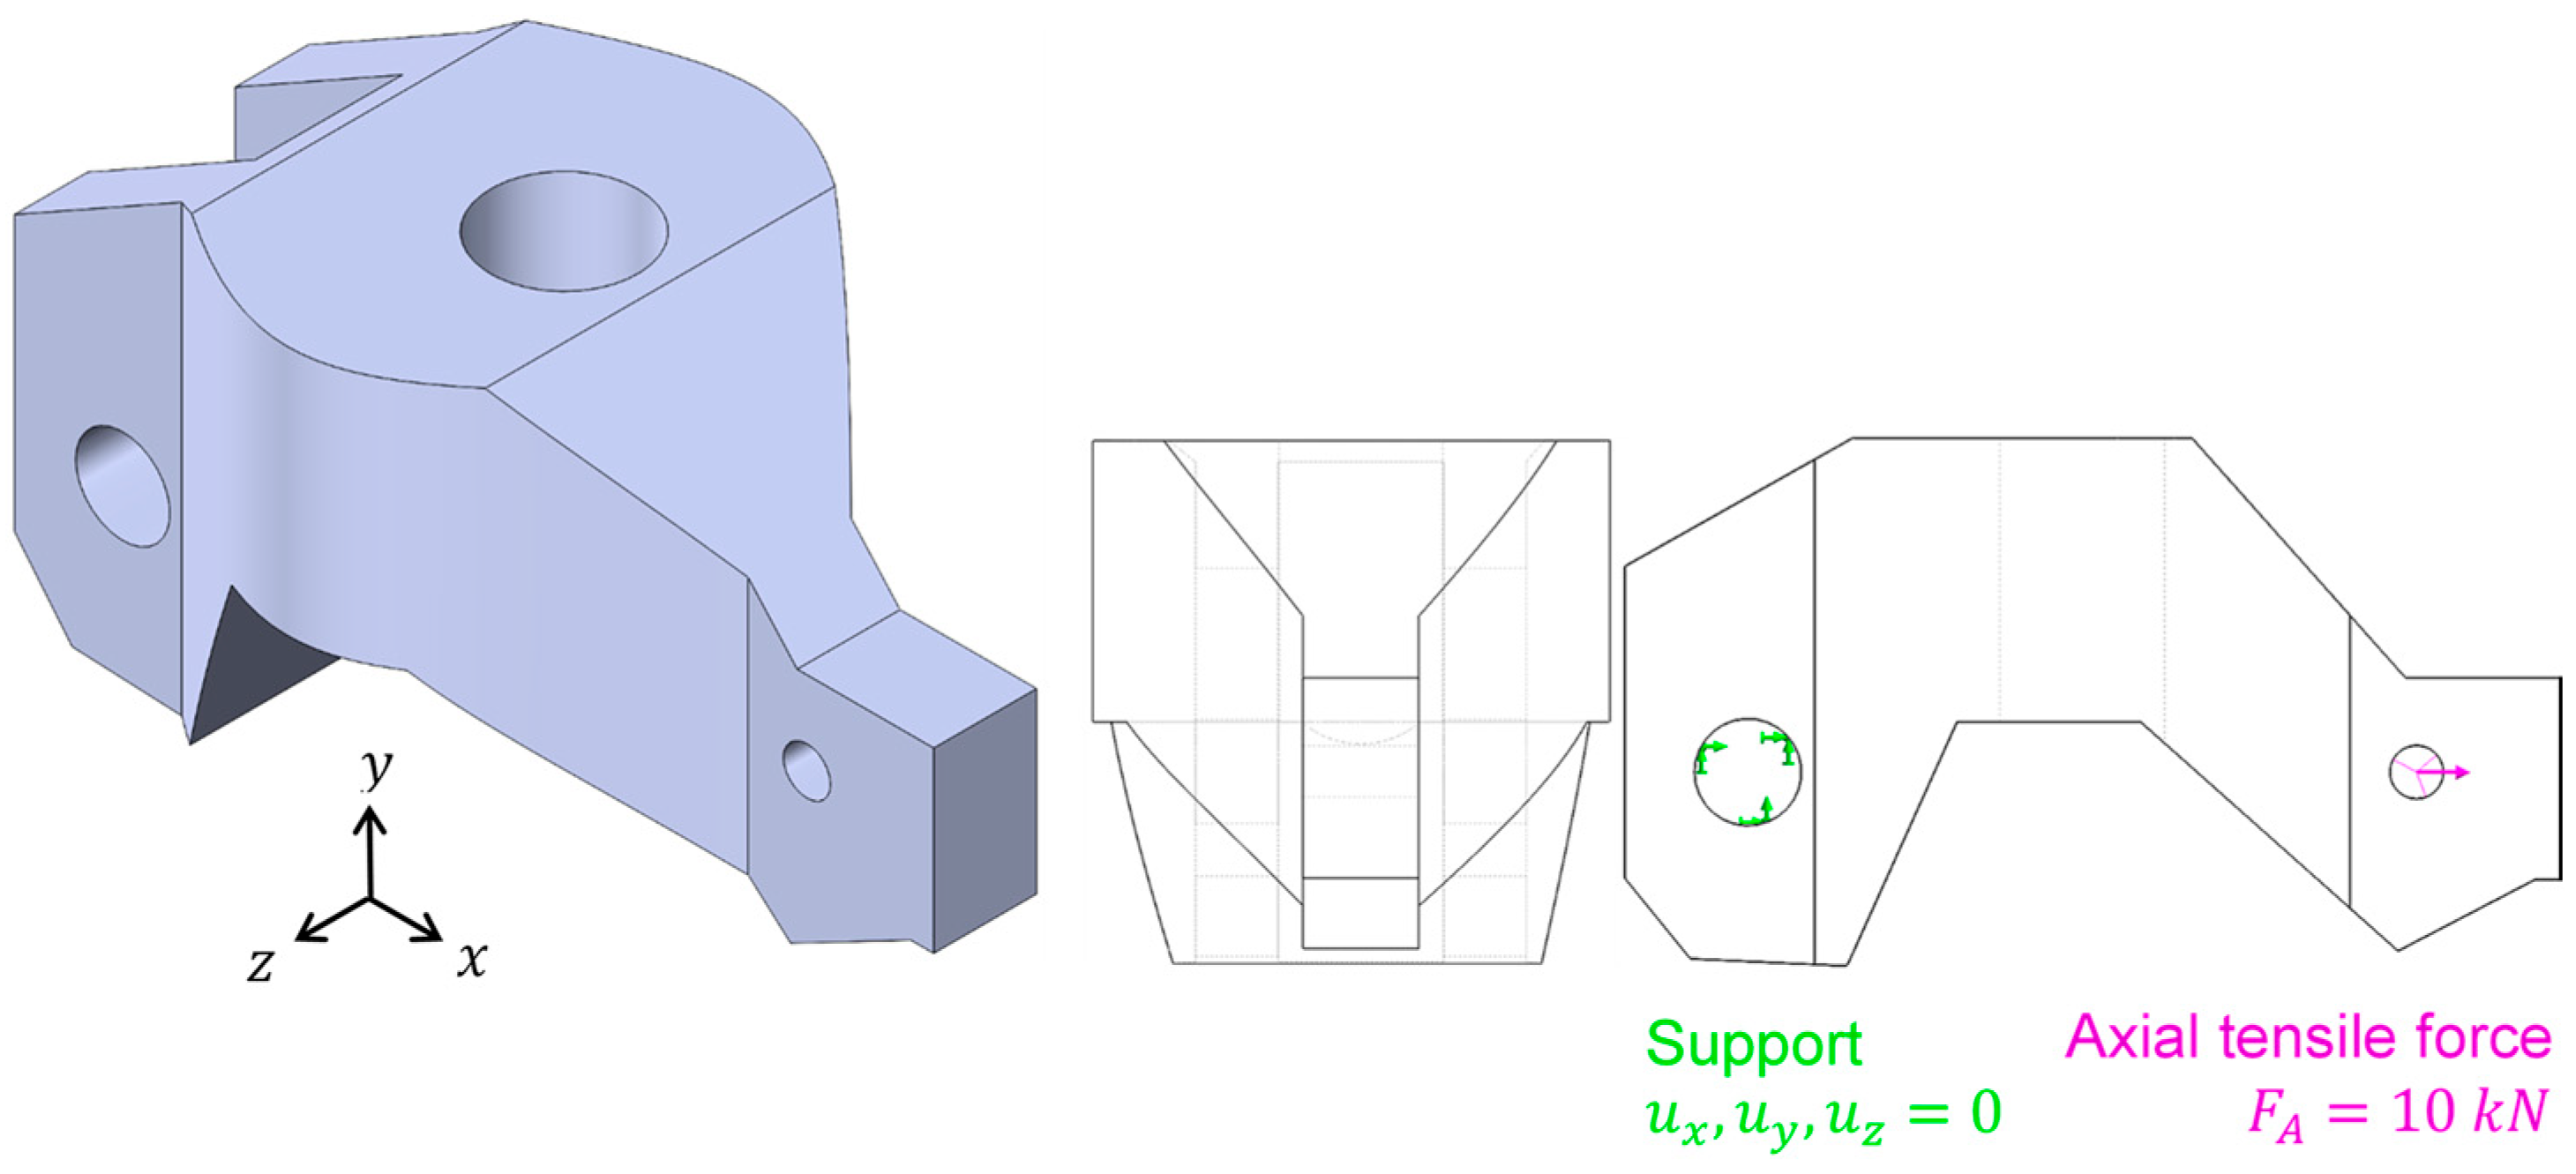
Figure 1. CAD and FE model of the reference component.
Applsci 16 04196 g001
Figure 2. Conventional development process for the load-bearing structure.
Applsci 16 04196 g002
Figure 3. Final design obtained from the conventional development process compared to the fully filled installation space.
Applsci 16 04196 g003
Figure 4. Automated workflow for topology optimization, geometry reconstruction, and structural evaluation using finite element analysis.
Applsci 16 04196 g004
Figure 5. Final design obtained from the AI-assisted development process compared to the fully filled installation space.
Applsci 16 04196 g005
Figure 6. Comparison of the time required for both development approaches. Total effort refers to the sum of engineering time and computational time.
Applsci 16 04196 g006
Figure 7. FEA results for the final design of (a) the conventional development approach; (b) the AI-assisted development approach.
Applsci 16 04196 g007
Figure 8. Comparison of the conventional and AI-assisted designs from a manufacturability perspective. The upper row shows rendered isometric views of both designs, while the lower row provides side views. For the AI-assisted design, the side view includes the section locations A–A and B–B, whose corresponding cross-sections are shown on the right. The side views of both designs also indicate the four common section locations S1–S4 used for the quantitative wall-thickness measurements reported in Table 6.
Applsci 16 04196 g008
Figure 9. Learning-curve analysis of the surrogate model. Training and validation R2 as a function of the number of training samples N t r a i n for (a) mass m and stiffness-to-mass ratio K m and (b) the stress-based safety factor S and the stress standard deviation σ S .
Applsci 16 04196 g009
Table 1. Optimization problem formulation for the development of the lightweight structure.
Design AspectSubcategorySpecification
Objectives Minimize mass
Maximize stiffness-to-mass ratio
Achieve a homogeneous stress distribution
Design freedoms Topology
Outer contours
Cross-sections
Rib geometry
Wall thicknesses
Connection points
Notches
ConstraintsInstallation spaceRestricted according to CAD reference model
Fixed load and support locations
Minimum wall thickness at load introduction: 2 mm
MaterialPlastic: polyamide 6 (PA6)
ManufacturingInjection molding guidelines
Wall thicknesses between 1.5 and 4.5 mm
Defined demolding direction
Avoid small cores that determine the cycle (length/diameter ≤ 4)
No undercuts
Draft angles neglected for comparison
Analysis conditionsAccording to FE model
Static axial tensile force F A = 10   k N
Table 2. Topology optimization parameters and corresponding structural response variables.
ParametersUnitMin. ValueMax. ValueIncrement
Minimum wall thicknessmm1.54.50.1
Maximum wall thicknessmm1.54.50.1
Split draw (two-part injection mold)-0 (“no”)1 (“yes”)1
No hole (no through holes in the drawing direction)-0 (“no”)1 (“yes”)1
Target mass (upper bound)g10070010
ResponsesUnit
Mass m g
Maximum displacement u m a x mm
Stiffness K N/mm
Stiffness-to-mass ratio K m N/mmg
Maximum von Mises equivalent stress S m a x MPa
Stress-related safety factor S -
Stress mean value S ¯ MPa
Stress standard deviation σ S MPa
Coefficient of variation C V -
Table 3. Hyperparameters and predictive performance of the trained artificial neural network.
Hyperparameters
Learning Rate
[-]
Batch Size
[-]
Epochs
[-]
Layers
[-]
Neurons per Layer
[-]
Activation FunctionOptimizerL2 Regularization Parameter α [-]Early StoppingInternal Validation Fraction [-]Random Seed
[-]
1.33 × 10−42238122106ReLUAdam1 × 10−4Yes0.242
Network performance R 2
(training data)
[-]
R 2
(validation data)
[-]
M S E
(training data)
[-]
M S E
(validation data)
[-]
Mass m 0.98410.9790.01570.0216
Stiffness-to-mass ratio K m 0.91620.91240.08410.0863
Stress-related safety factor S 0.69460.7220.31210.2526
Stress standard deviation σ S *0.05810.03620.49942.7583
* The stress standard deviation σ S exhibits a very low validation R2 value (below 0.1), indicating no meaningful correlation between inputs and predictions. It is therefore not used as a decision criterion during surrogate-based candidate selection.
Table 4. Surrogate-predicted candidate configuration and corresponding structural responses.
ParametersValueUnit
Minimum wall thickness2.7mm
Maximum wall thickness3.6mm
Split draw0-
No hole1-
Target mass270g
Predicted ResponsesValueUnit
Mass m 353.032g
Stiffness-to-mass ratio K m 1.246N/mmg
Stress-related safety factor S 0.451-
Stress standard deviation σ S 95.881MPa
Table 5. Summary of the technical characteristics of the investigated designs.
CharacteristicValue (Design-Specific)
SymbolNameUnitConventionalAI-Assisted
(Reconstructed
According
to AI Prediction)
Best Design from Training Data *
(Generated for AI Training)
m Massg360.11348.36350.56
u m a x Maximum displacementmm13.0927.1512.77
K StiffnessN/mm763.94368.28782.79
K m Stiffness-to-mass ratioN/mmg2.121.062.23
S m a x Maximum von Mises equivalent stressMPa90.00167.4476.82
S Stress-related safety factor
(PA6; σ y = 90   M P a )
-1.000.531.17
S ¯ Stress mean valueMPa11.1018.7013.43
σ S Stress standard deviationMPa12.5015.459.83
C V , S Coefficient of variation-1.130.820.73
* selected ex post from the simulated training dataset based on true FEA responses; not obtained by surrogate prediction.
Table 6. Quantitative manufacturability indicators based on local wall-thickness measurements.
CharacteristicSymbolUnitConventionalAI-Assisted
Number of measurements n -2020
Mean wall thickness t ¯ mm4.2068.551
Standard deviation of wall thickness σ t mm1.0012.907
Coefficient of variation in wall thickness C V , t -0.2380.340
Share within permissible wall-thickness range (1.5–4.5 mm) P 1.5 4.5 %750
Disclaimer/Publisher’s Note: The statements, opinions and data contained in all publications are solely those of the individual author(s) and contributor(s) and not of MDPI and/or the editor(s). MDPI and/or the editor(s) disclaim responsibility for any injury to people or property resulting from any ideas, methods, instructions or products referred to in the content.