Article

Novel Spatiotemporally Dependent Diffusion Coefficient Models for PM Removal by Passive Air Purifiers: A Theoretical and Experimental Study

1
China Academy of Safety Science and Technology, Beijing 100012, China
2
NHC Key Laboratory for Engineering Control of Dust Hazard, Beijing 100012, China
3
School of Aerospace Engineering, Tsinghua University, Beijing 100084, China
*
Author to whom correspondence should be addressed.
Appl. Sci. 2026, 16(8), 3824; https://doi.org/10.3390/app16083824
Submission received: 5 March 2026 / Revised: 9 April 2026 / Accepted: 10 April 2026 / Published: 14 April 2026

Abstract

Fine particulate matter (PM)-induced pollution is one of the major causes of indoor air quality deterioration. Passive air purification technologies offer advantages of structural simplicity and low energy consumption, yet their spatiotemporal mass transfer characteristics remain poorly understood. This study presents a theoretical and experimental investigation of PM spatiotemporal mass transfer under the sink effect induced by an electro-convective passive air purifier. The apparent mass transfer coefficient (Dapp) and PM concentration prediction models based on Fick’s second law were established, and then the space-and-time-dependent mass transfer coefficient (Dst) was determined by using the Boltzmann–Matano method. The results revealed that the absolute values of Dst quantified local migration intensity, while its sign provided directional information unattainable from conventional averaged parameters. The logarithmic values of Dapp showed a consistent logarithmic relationship with distance at fixed time windows, and the validated prediction model maintained errors within ±15%, enabling accurate reconstruction of full-field concentration distributions from limited measurement points. The complementary nature of these two coefficients offers a comprehensive evaluation framework. This work advances both the theoretical understanding and practical application of passive air purification technology, offering new tools for indoor PM exposure control and purifier performance optimization.

1. Introduction

PM, particularly particles with an aerodynamic diameter of ≤2.5 μm (PM2.5) and ≤10 μm (PM10), is now widely recognized as a major threat to indoor air quality and public health [1,2,3]. These particles readily act as carriers for hazardous substances including fungi, bacteria, and viruses [4,5,6,7]. Long-term exposure to high PM concentrations has been linked to a range of adverse health outcomes, affecting diseases of the respiratory, cardiovascular, and neurological systems [8,9,10,11,12,13]. Therefore, effective reduction in indoor PM concentrations remains an urgent priority.
Indoor PM arises from both outdoor infiltration and indoor emissions, such as combustion, cooking, and resuspension of settled dust. In densely populated and poorly ventilated environments, such as urban residences, offices, and transportation hubs, PM tends to rapidly accumulate, leading to sustained exposure risks even in the absence of obvious pollution events. To mitigate indoor PM pollution, various air purification technologies have been adopted, with high-efficiency particulate air (HEPA) filters and electrostatic precipitators (ESPs) being the most prevalent [14,15,16,17,18,19,20,21,22,23,24]. Nevertheless, both technologies depend on fan-driven active airflow and thus share inherent limitations. These include relatively high energy consumption, appreciable operational noise, periodic maintenance requirements, and, in certain applications, the need for complex ductwork. Such drawbacks may diminish user acceptance [25] and compromise the long-term sustainability of these technologies, especially in residential and commercial settings.
Consequently, fanless or passively driven air purification technologies have attracted sustained interest as promising alternatives. These systems rely on passive mechanisms, such as gravitational sedimentation, electrostatic deposition, or diffusion, to remove airborne PM, and thus theoretically offer distinct benefits, including structural simplicity, low energy consumption, and near-silent operation [26,27,28]. Wang et al. [29] and Peng et al. [30] developed an electro-convective air purifier that integrates a particle collection unit and leverages electrohydrodynamic flow to enhance PM removal. While previous studies have clarified the time-dependent mass transfer behavior of PM under electro-convective effects [31,32] and established the mass transfer coefficient as a key metric for PM migration capability [33,34], the existing body of work has largely emphasized temporal dynamics. However, the influence of spatial position on PM mass transfer remains underexplored, and a quantitative framework for describing spatiotemporal mass transfer capacity has yet to be established. The Boltzmann–Matano method addresses this by introducing a variable that combines distance and time to transform Fick’s second law into an ordinary differential equation, removing the assumption of a constant diffusion coefficient, and has been applied in fields such as material science [35].
Moreover, current PM concentration monitoring predominantly relies on single-point measurements [28,36]. Assessing full-space purification performance typically necessitates repeated measurements at multiple locations and time points, or the deployment of several costly high-precision monitors; both approaches increase experimental complexity and evaluation cost. Therefore, a systematic investigation into the spatiotemporal mass transfer mechanisms of PM in passive air purifiers, complemented by the development of corresponding theoretical prediction models, is of considerable importance.
Therefore, the present study investigates an electro-convective air purification device. From a spatiotemporal mass transfer perspective, we systematically develop spatial distribution models for both the Dst and Dapp. These models enable quantitative characterization of the concentration evolution and mass transfer direction of particles across different size fractions under the sink effect. Using the Boltzmann–Matano method, we derive an analytical expression for the spatiotemporal dependence of the mass transfer coefficient and establish a PM concentration prediction model with spatial resolution. The outcomes of this study constitute a comprehensive evaluation framework for passive purification technologies that integrates mass transfer capacity, migration direction, and spatial distribution. This work thus refines the theoretical framework of PM mass transfer under the sink effect and provides theoretical guidance for indoor PM exposure control and the performance optimization of passive air purifiers.

2. Materials and Methods

2.1. Experimental Setup

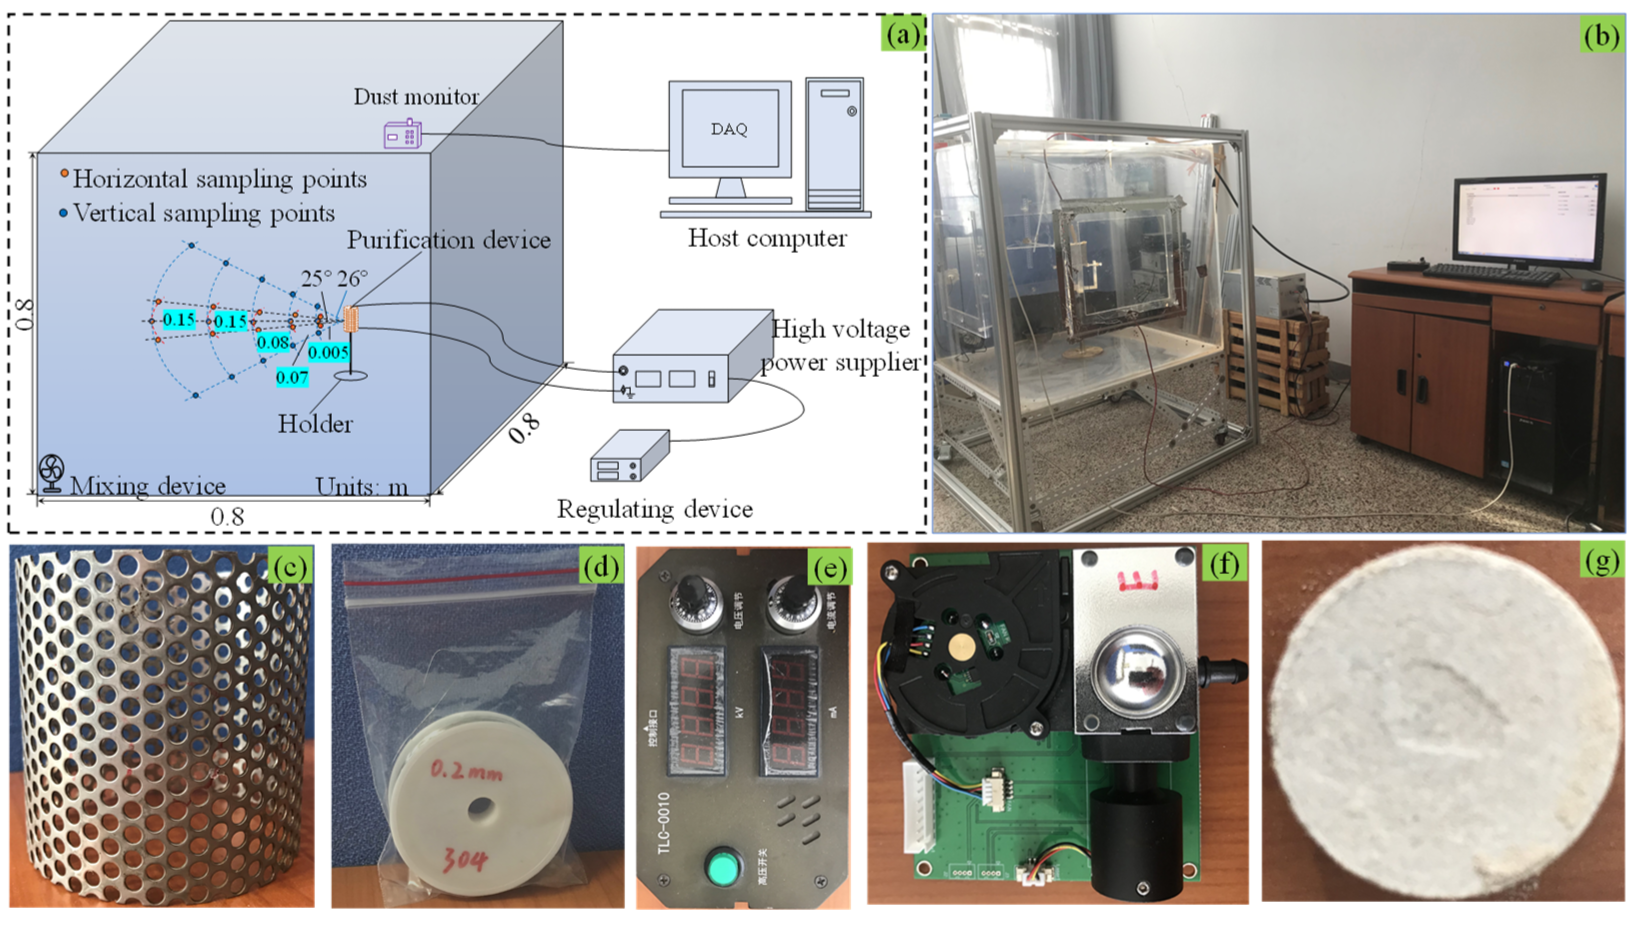
Figure 1a shows the schematic diagram of the experimental setup. The experimental system was mainly composed of the closed chamber, PM purification device, high-voltage power supply system, and data measurement system. The tests were conducted in a closed chamber made of polymethyl methacrylate (PMMA), which had a length of 0.8 m, a width of 0.8 m, and a height of 0.8 m. Its photo of the real object is shown in Figure 1b. The PM purification device consisted of collecting and discharge electrodes. The collecting electrode was a thin cylinder with a radius of 0.04 m, a height of 0.08 m, and a porosity of 40.31%, and it was connected to the ground (Figure 1c). The discharge electrode had a diameter of 2 × 10⁻⁴ m and a length of 0.08 m (Figure 1d), which was installed in the center of the cylinder and was connected to a −100 ~ 0 kV adjustable high-voltage direct-current (HVDC) power supply (type: TM6010, TESLAMAN, Dalian, China). Both collecting and discharge electrodes were made of 304 stainless steel. The PM purification device was fixed at the center of the side face of the closed chamber. The regulating device (type: TLC-0010, TESLAMAN, China) was used to control the magnitude of voltage (Figure 1e). The dust monitor (type: PM3006S, CUBIC, Wuhan, China) was used to record the change in PM concentration at different sampling points, and the maximum data update frequency of the dust monitor was 1 s (Figure 1f). The detectable PM concentration range of the dust monitor was 0–30 mg/m3 with a maximum error of 20%. In addition, the dust monitor was calibrated and instrument agreement among multiple dust monitors is 80% and above. The sampling points were located in the directions of 0°, +12.5°, and −12.5° on the horizontal plane, and the directions of 0°, +13.0°, and −13.0° on the vertical plane. The two planes were centered on the purification device. The distances of the sampling points from the collecting electrode were 0.005, 0.075, 0.155, 0.305, and 0.455 m, respectively (Figure 1a). The mixing device was used to fully mix PM with the air to make PM uniformly distributed in the closed chamber. In addition, the PM environment was simulated in the chamber by burning the smoke cake (Figure 1g) with tetramethrin content greater than or equal to 1.8%.

2.2. Experimental Methods and Data Pre-Processing

The experimental procedure was as follows: Firstly, five dust monitors of the same make and model were placed at different sampling points in the same direction, and they were connected to the upper computer. The smoke cake was then burnt to produce PM with a certain concentration in the confined space, and the mixing device was turned on to fully mix the PM with the air. The mixing device (a small axial fan) was turned off to make a uniform distribution of PM after letting it rest for a certain time. Then, the dust monitors were turned on to measure PM concentration until PM concentration did not change substantially. After continued sampling for another 120 s, the purification device was started to simulate the point-sink effect of PM until the end of sampling. Finally, the purification device and dust monitors were turned off and the experimental data were saved and collated for further analyses. The above steps were repeated until all the PM concentration data in each direction were collected. For each direction, the five sampling points at different distances were measured simultaneously using separate dust monitors, and different directions were tested in successive runs.
In our experiments, in consideration of the requirement of purification effect and sampling time, the applied voltage and the current of the purification device were controlled at 25 kV and 0.25 mA, respectively. Then, a certain intensity of electromagnetic fluid field was generated between the discharge and collecting electrodes. Due to the effect of the electrohydrodynamic flow, the PM entering the purification device could be sufficiently charged in a short time, and it could be subjected to fluid-dependent exerting forces (here collectively referred to as fluid forces), such as drag force, additional mass force, Bassett force, and so on [37]. Under the combined action of Coulomb force and fluid forces, they could continuously migrate to the collecting electrode to be detained and adsorbed. As a result, a more stable low-concentration region was created. The sampling data of dust monitors was updated every 5 s. As the closer to the purification device, the greater the concentration gradient, the sampling points near the purification device were set more densely. Moreover, the environmental temperature and humidity were relatively stable in each set of tests, which were about 20 °C and 40%, respectively.
Considering the inherent errors between each measuring instrument, the data measured by each dust monitor before the purification device started to work could have a certain difference. This could increase the misjudgment probability in the analysis of PM mass transfer patterns. Therefore, pre-processing of the measured data was required. The initial concentration at each sampling point was the average value of PM concentration obtained by each dust monitor for 120 s before the purification device was turned on, and the measured results after the purification device was turned on were normalized for the subsequent analysis. Furthermore, to eliminate the accidental error, the PM concentration corresponding to a specific distance in the horizontal and vertical planes was expressed as the average value among the sampling points of the same distance in three directions. In this work, the sampling data in the horizontal plane were used as the analysis data, while those in the vertical plane were used as the validation data. Moreover, the removal proportion of PM with a certain size was defined as follows:
η ( d p ) = 1 c t ( d p ) c 0 ( d p )
where η (dp) is the removal proportion of PM with the diameter at dp μm; ct (dp) is PM concentration of dp μm at time t; and c0 (dp) is the initial PM concentration of dp μm.

3. Results and Analysis

3.1. Spatial and Temporal Profiles of Normalized PM Concentration

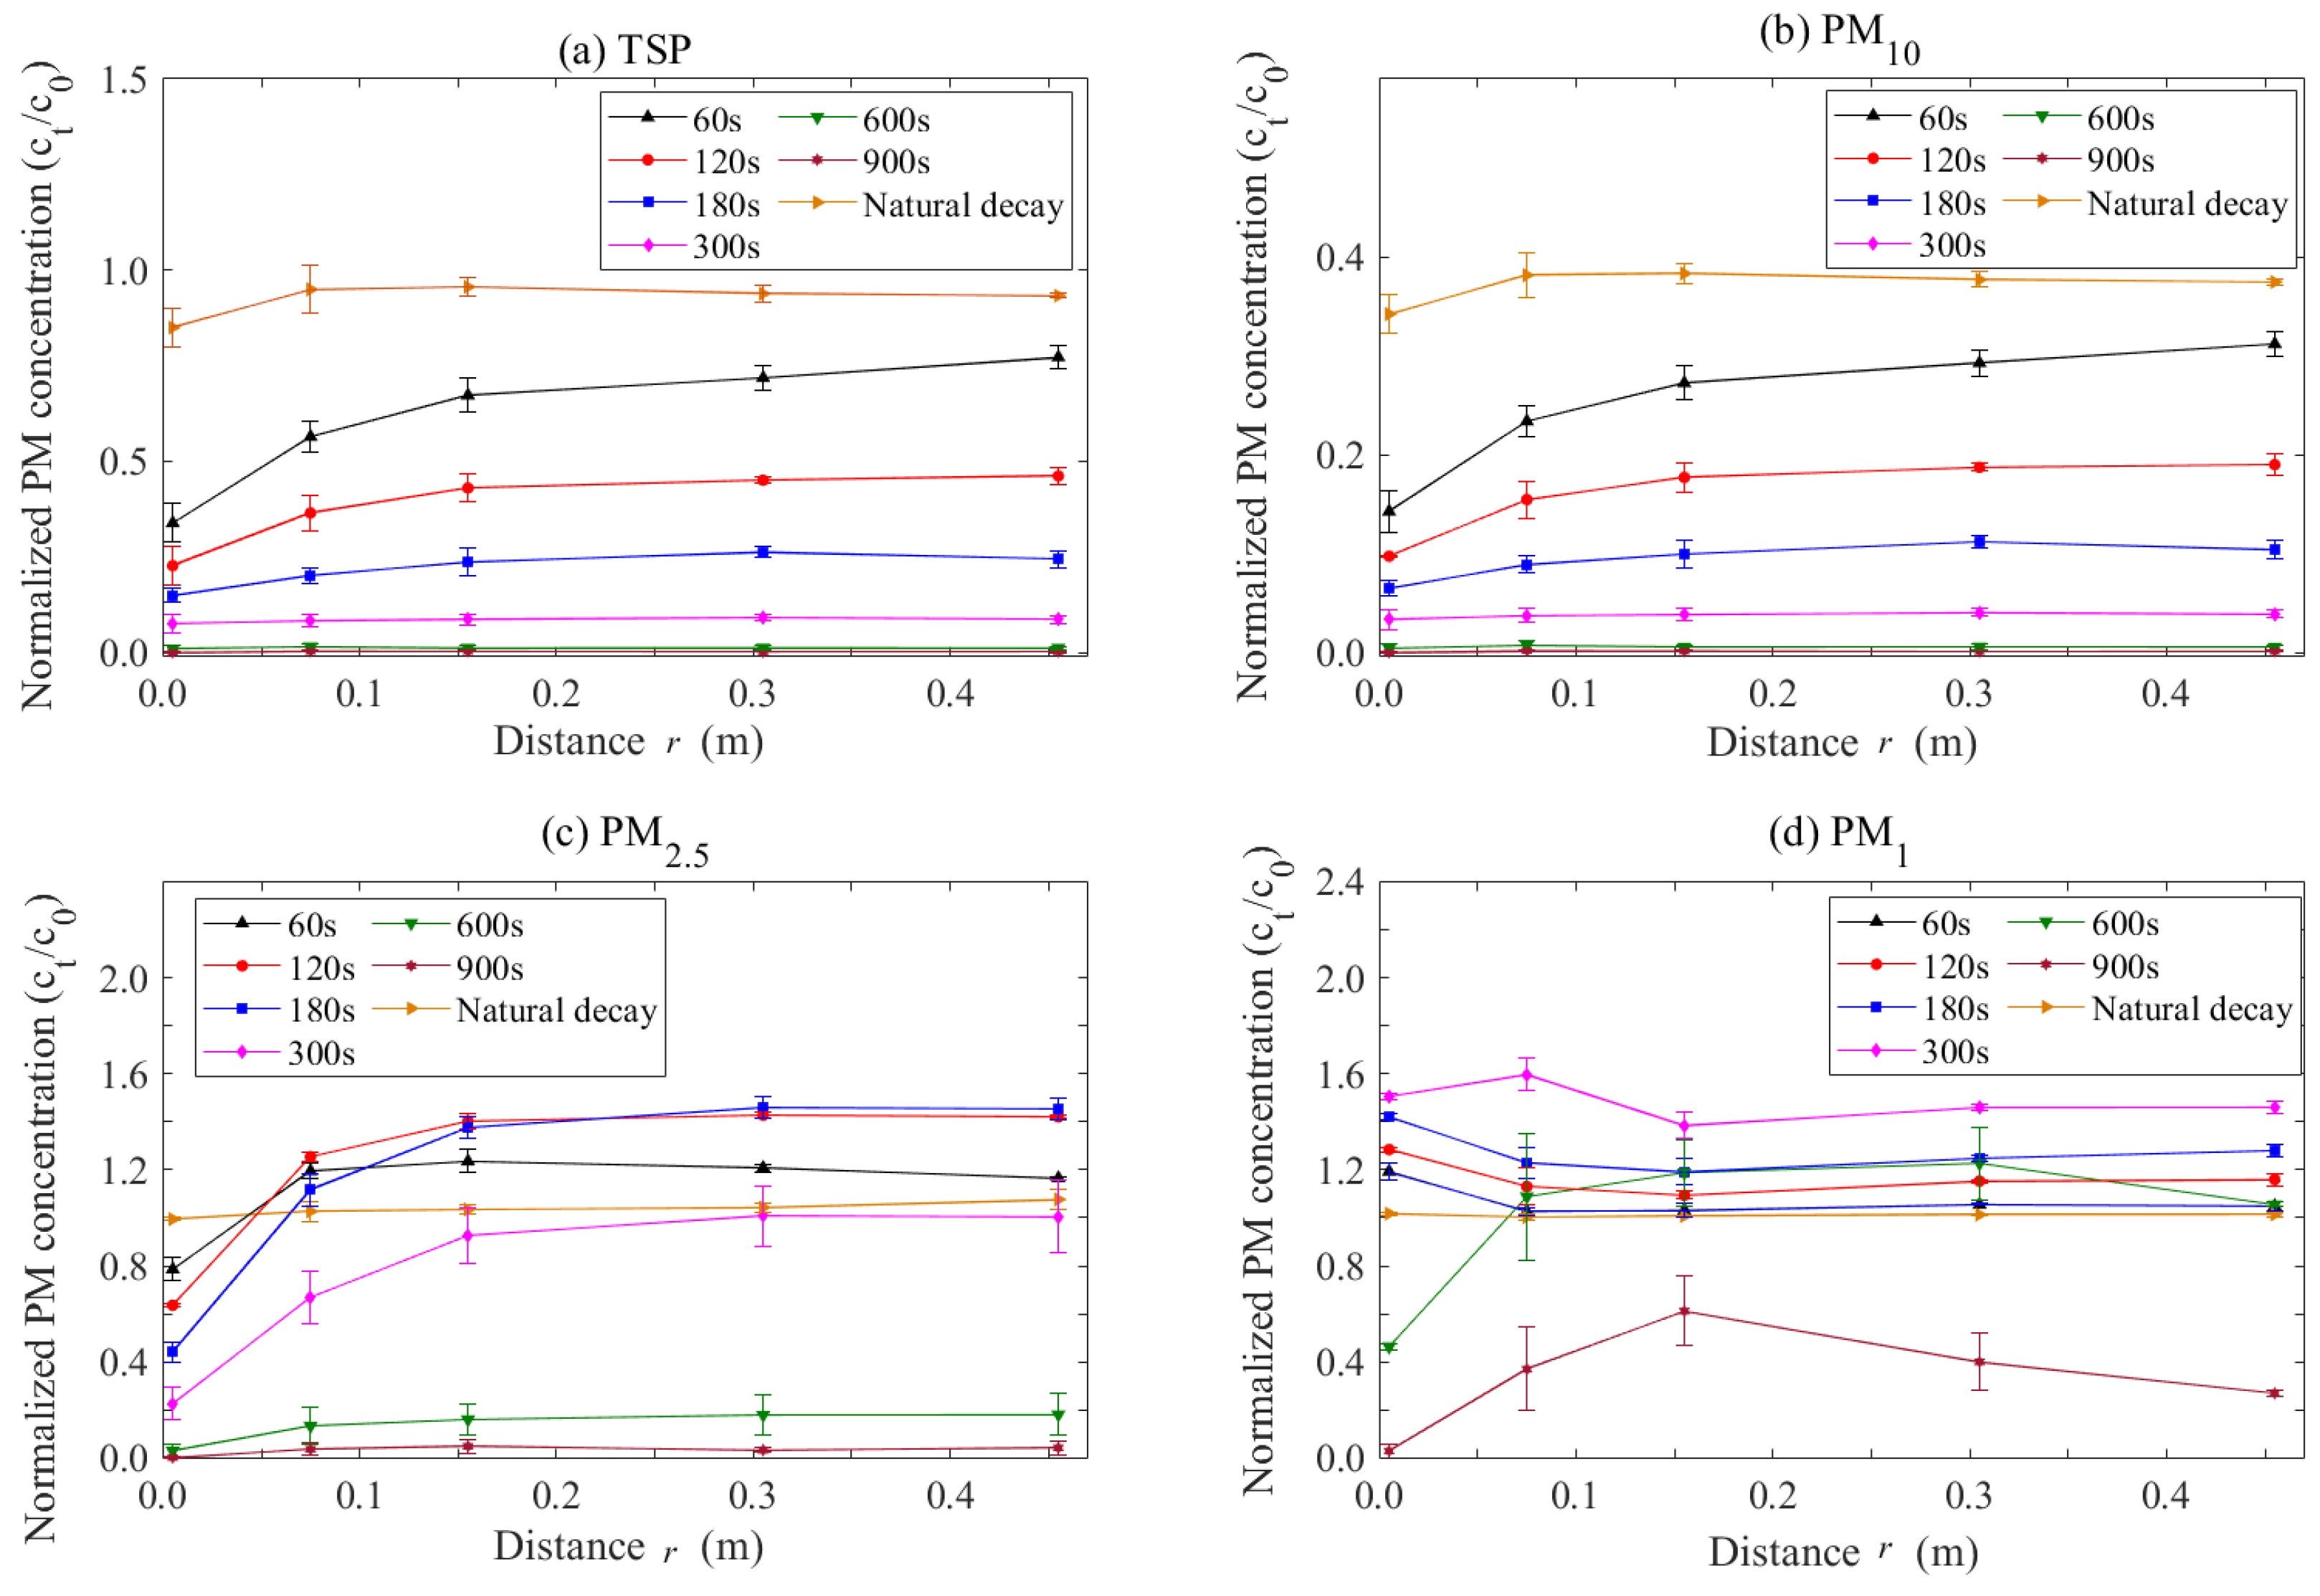
Figure 2 shows the varying patterns of PM concentration with distance for different particle size fractions at 60, 120, 180, 300, 600, and 900 s. The PM was classified into four size particle fractions, including total suspended particulates (TSP), PM10 (with an aerodynamic diameter ≤ 10 μm), PM2.5 (with an aerodynamic diameter ≤ 2.5 μm), and PM1 (with an aerodynamic diameter ≤ 1 μm). For ease of description, these four particle size ranges were divided into large-scale (TSP and PM10), meso-scale (PM2.5), and micro-scale (PM1). PM concentration at each distance was the average value of three sampling point measurements at this distance. Taking TSP concentration as a benchmark, the initial concentration in the space was controlled at 20–22 mg/m3. The total purification time was 900 s. Moreover, the natural decay was measured in separate experiments at the same sampling point over the full 900 s period.
As shown in Figure 2, without the purification device operation, PM concentration was primarily unchanged within 900 s. This meant that the number of removed PM was very low owing to wall attachment by diffusion effect and gravitational sedimentation. The removal proportions of large-, meso-, and micro-scale PM were larger than 99%, 90%, and 39%, respectively, compared to the initial value of 900 s when the purification device was in operation. This showed that the method can also be used to effectively remove indoor PM. In addition, the error bars represent the standard deviations for measurements taken from three independent experiments, indicating that the uncertainty is small enough to allow for further analysis. For meso- and micro-scale PM, their concentrations increased up to 1.2–1.7 times the initial value before decreasing, which agreed with other similar studies [32,38]. The number of meso- and micro-scale PM could increase by the breakup of the agglomerated PM [32] and the evaporation phenomenon caused by a large temperature gradient between the smoke and the environment [38]. In addition, large- and micro-scale PM could experience more destruction and regeneration processes, respectively, while meso-scale PM experienced both processes.
For large-scale PM, with the increase in distance, there was a significant increasing trend, and after the distance was greater than 0.155 m, the increase in PM concentration was slowed down. A similar pattern could be observed for meso-scale PM. The variation in micro-scale PM concentration over time and distance was more complex. In the first 180 s, the patterns of variation with the distance of PM concentration were similar to each other. PM concentration gradually decreased following the peak value (1.2–1.4 times the initial value) near the purification device and reached a valley value (1–1.2 times the initial value) at 0.075 m and 0.155 m. At 300 s, PM concentration reached the peak value (1.6 times the initial value) and valley value (1.4 times the initial value) at 0.075 m and 0.155 m, respectively, exhibiting a trend of first increasing, then decreasing, and then increasing again with distance. As shown by the spatial variation in micro-scale PM concentration, it was different with meso- and large-scale PM. In addition to the breakup of the agglomerated PM and the evaporation phenomenon of large-scale PM, the perturbation of electrohydrodynamic flow egress from the purification device was also not negligible, and the smaller the particle size, the greater the impact.

3.2. The Dapp of PM

3.2.1. Determination of Dapp

To capture the overall mass transfer capacity of the purifier for practical applications, we introduce the apparent mass transfer coefficient Dapp, which treats the mass transfer process as a one-dimensional diffusion problem with an effective constant coefficient. Building on the spatiotemporal concentration profiles presented in Section 3.1, PM concentrations of different size fractions showed strong spatial and temporal correlation and non-stationary characteristics. This process could be reduced to mass transfer in a one-dimensional semi-infinite medium, with a PM concentration gradient extending radially from the collecting electrode:
c t = 1 r 2 r D r 2 c r
where c is PM concentration; t represents time; D is the mass transfer coefficient of PM; and r is the distance from the collecting electrode.
D is assumed to be a constant Dapp. For ease of calculation, an approximate mathematical solution of Equation (2), which contains not only the relationship between relevant parameters and the research subject but also the model correction factor, could be given as follows [32]:
c r , t = c 0 e r f r 2 D a p p t
where c (r, t) is PM concentration; Dapp is the apparent mass transfer coefficient of the PM considered to space distance and mass transfer time, (m2/s); and erf(.) is the error function, e r f ε = 2 π 0 ε e z 2 d z .
Therefore:
D a p p = 1 4 t r e r f 1 ( c ( r , t ) c 0 ) 2
For a given r, t, and c0, one can determine Dapp by using Equation (4) with the measured PM concentration.
Significantly, the regeneration process of PM1 and PM2.5 concentrations cannot yield a reasonable Dapp according to Equation (4) [32]. Hence, the initial values of PM1 and PM2.5 concentrations were replaced with their respective largest values in the calculation of Dapp. This replacement is justified because Equation (3) assumes a monotonic decay from the initial concentration, yielding a positive Dapp that physically represents mass transfer capacity. However, as shown in Figure 2c,d, PM1 and PM2.5 concentrations first increase (due to agglomerate breakup and evaporation) before decreasing. If the true initial concentration were used, the non-monotonic behavior would lead to a negative Dapp, which is physically meaningless. Taking the peak concentration as the effective initial condition restricts the calculation to the subsequent monotonic decay phase, thereby producing a positive and interpretable Dapp. This approach is consistent with our previous work [32].
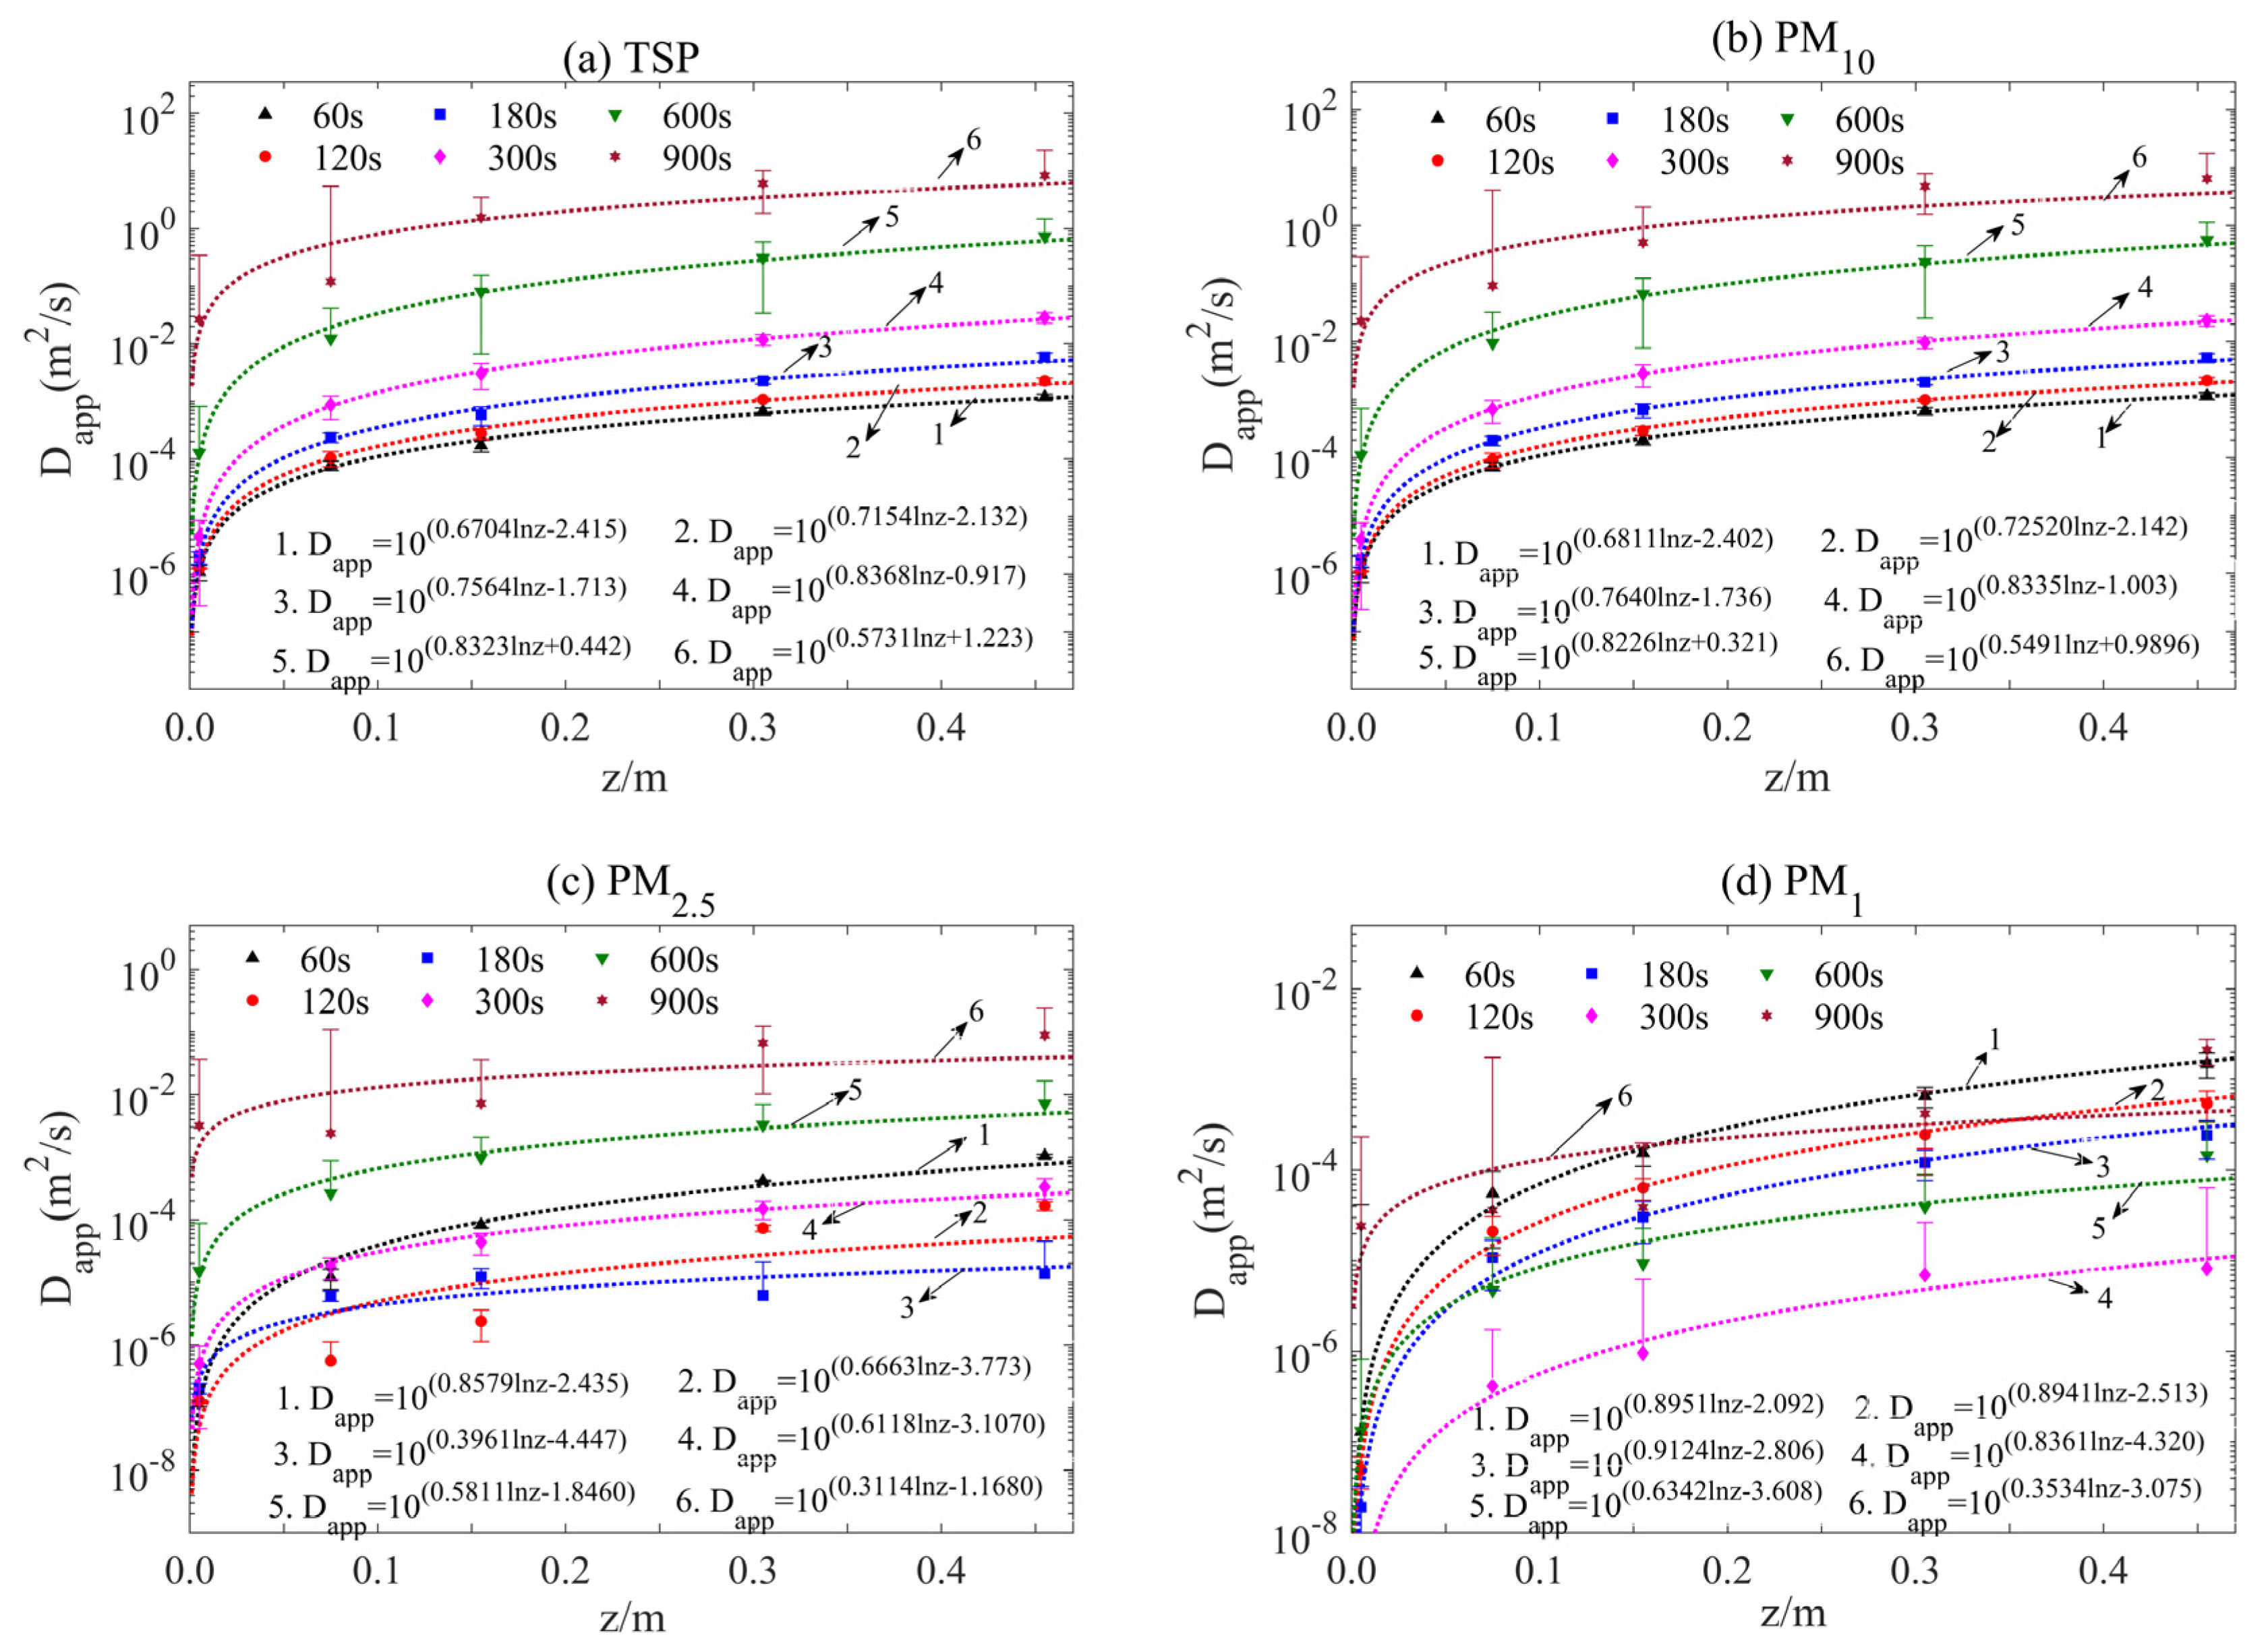
Figure 3 plotted the fitting curves of Dapp with time and distance for PM with different size fractions. It can be seen from Figure 3 that the Dapp of large-scale PM presented an increasing trend with both time and distance. From the perspective of spatial variation, the Dapp of meso- and micro-scale PM was similar to that of large-scale PM. However, in the time domain, they reached valley value at 120–180 and 300 s, respectively, and then gradually increased again. The Dapp of micro-scale PM started to increase steeply later than that of meso-scale PM.
From the fitting results in Figure 3, the logarithmic values of Dapp at fixed times all showed a logarithmic function relationship with distance, i.e.:
D a p p = 10 ( a ln r + b )
where a and b are constants. The values for a and b were determined by the least-squares non-linear approximation method.
Substituting Equation (5) into Equation (3) can be written as follows:
c r , t = c 0 e r f r 2 10 ( a ln r + b ) t
Given c0, Equation (6) can be used to predict PM concentration profiles at a fixed time under the action of the point sink. However, it is noteworthy that the errors of the values of a and b obtained were larger when the mass transfer time reached 900 s. This is because the purification efficiency of both large- and meso-scale PM was greater than 95%, while the variation in micro-scale PM concentration was complicated.

3.2.2. Robustness of PM Concentration Prediction Model

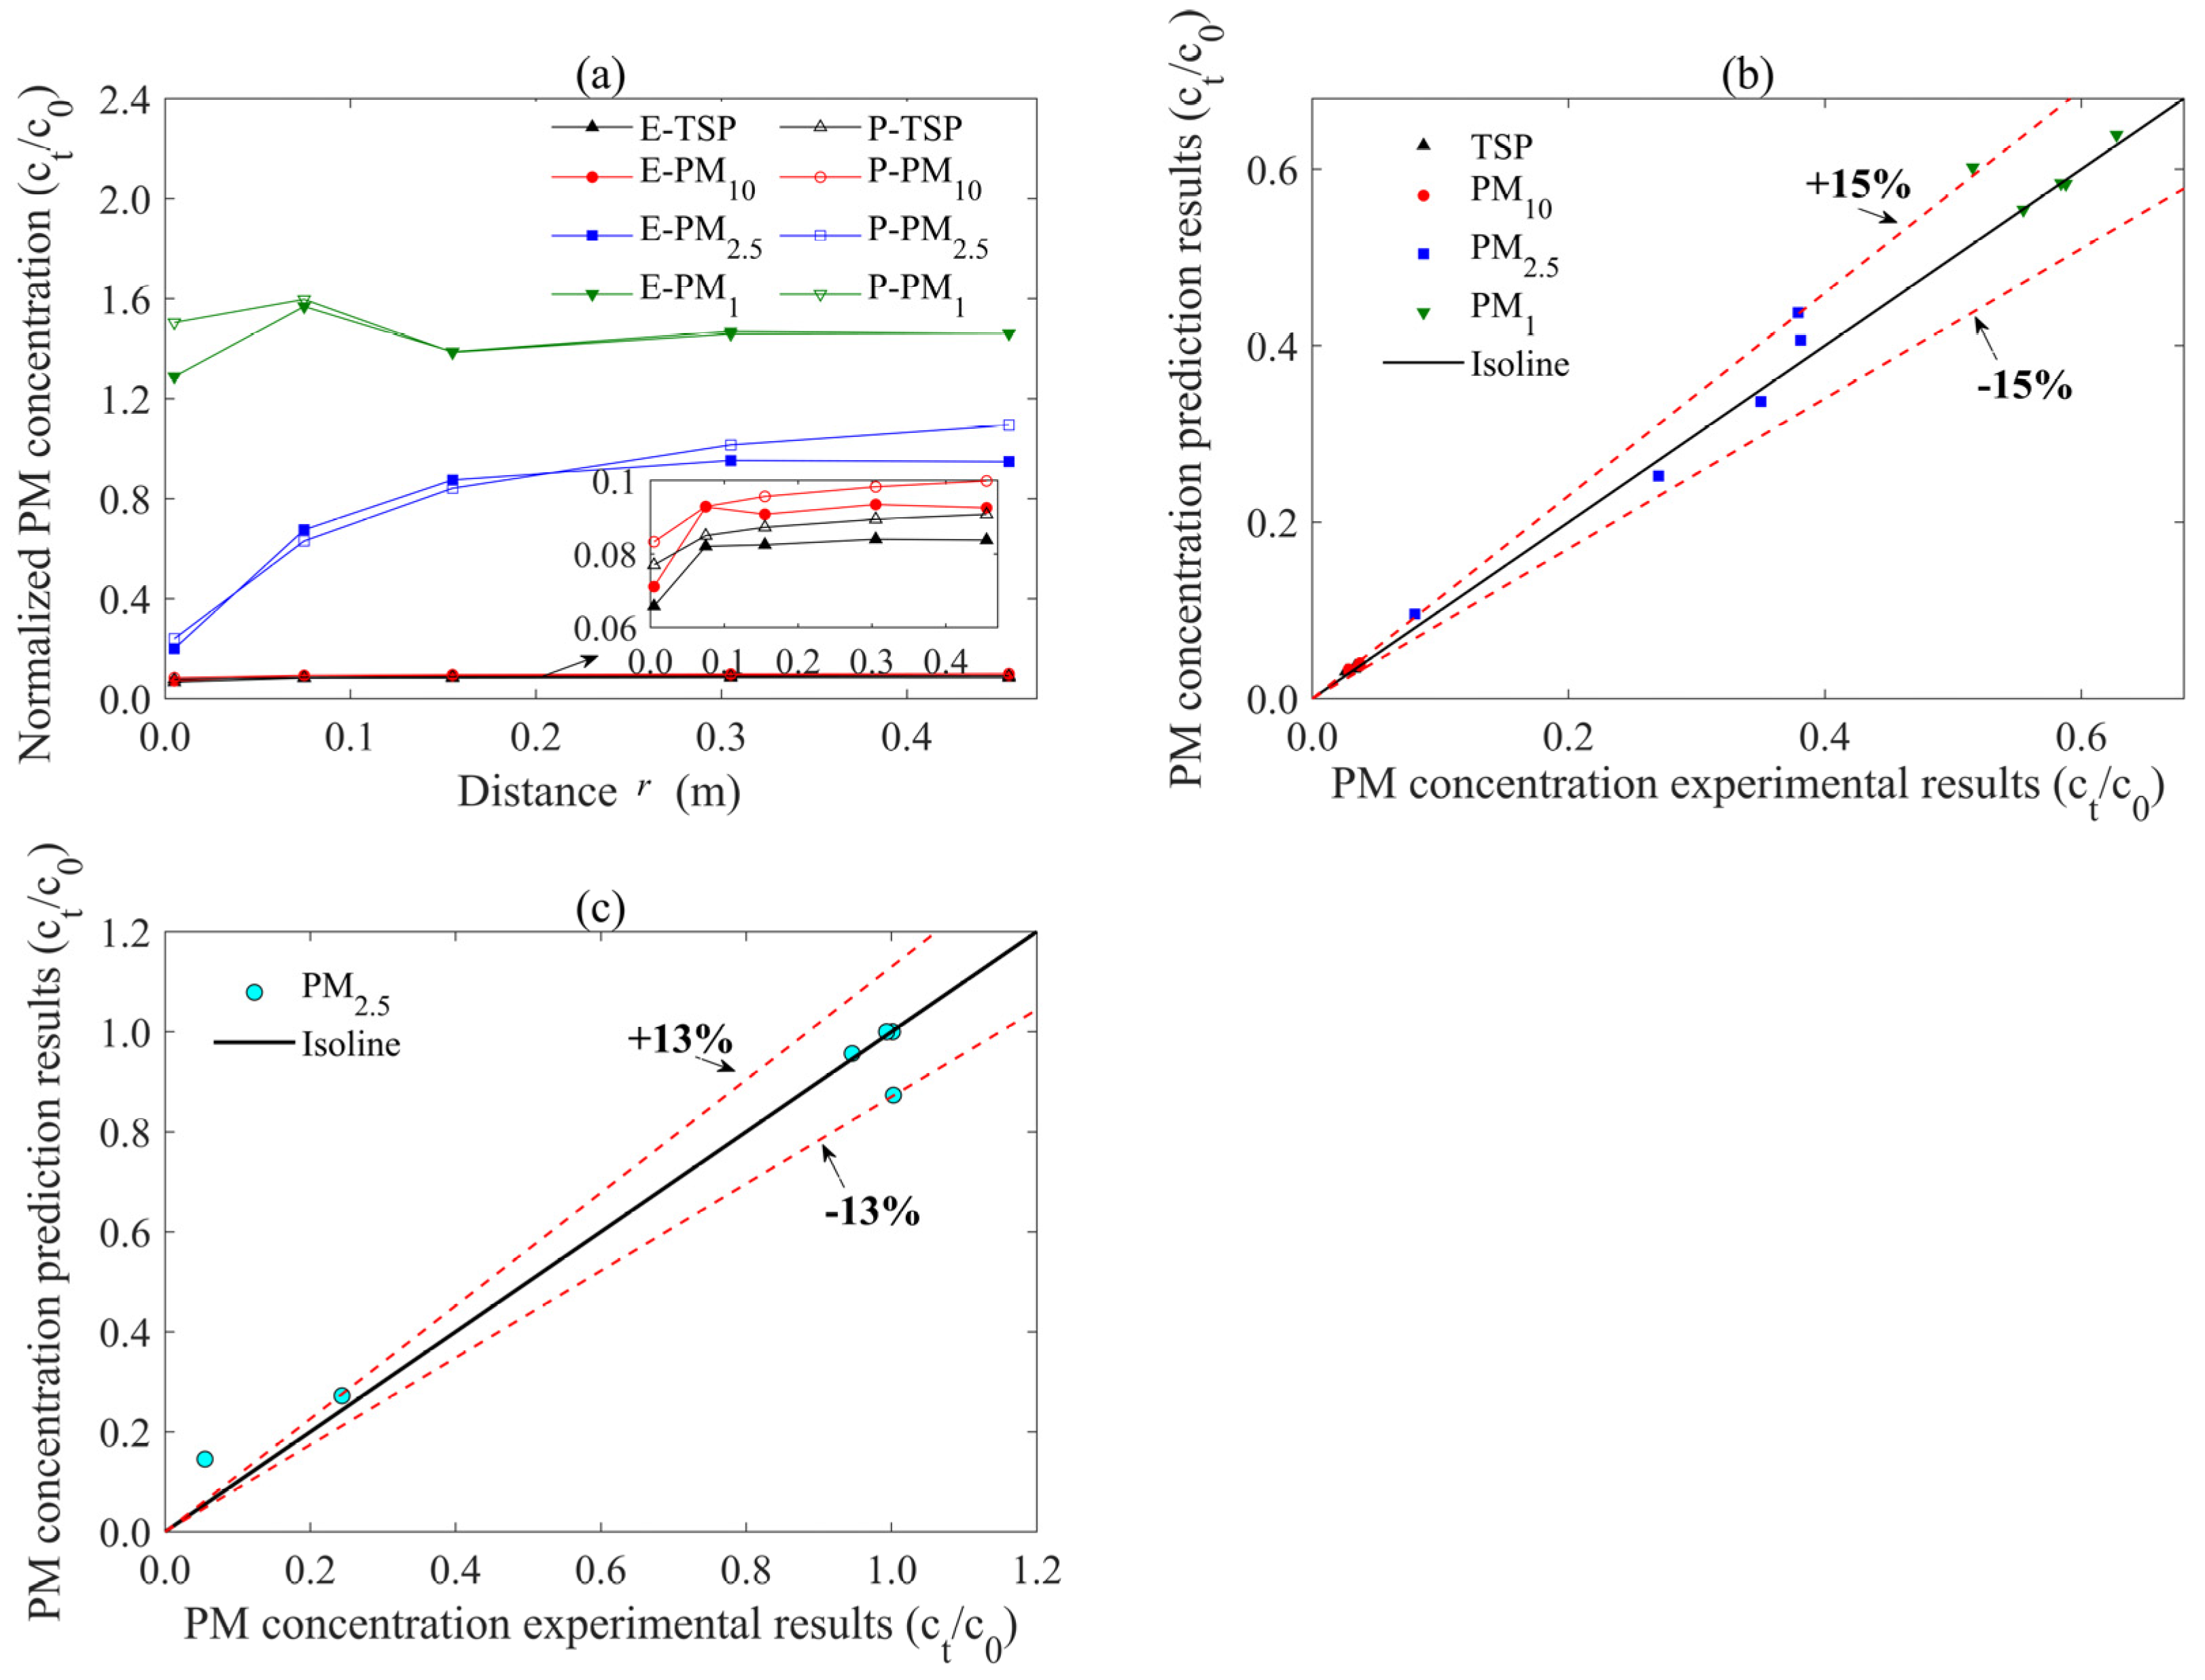
Based on Equation (6), the variation in PM concentration with a distance of 300 s for different particle sizes was predicted and compared with the actual measurement results in the vertical plane, as shown in Figure 4a,b, where “E” and “P” represent the experimental results and predicted results, respectively. As can be seen from Figure 4a,b, the coincidence degree between the predicted results and the experimental results of the vertical plane was high, and the error could be controlled within ±15%. This indicated that the PM concentration prediction model had good stability. In addition, this also reflected that the point sink process of particles could be well simulated in terms of this experimental method. The essential difference from the time-dependent mass transfer model given by Wei et al. [32] was that this model mainly considered the spatial evolution of PM concentration and could better show the distribution of PM concentration gradient at different time windows.
Likewise, PM2.5 concentration at 60, 120, 180, 300, 600, and 900 s under the experimental conditions used by Wang et al. [29] was predicted by using Equation (2) and compared with the experimental results, as shown in Figure 4c. It can be seen that the predicted results of PM2.5 concentration were also in good agreement with the experimental results, and the maximum absolute relative error between the predicted and experimental results was approximately 13%. It is worth noting that the actual measurement results given by Wang et al. [29] were in the horizontal plane rather than the vertical plane. Therefore, the error (13%) is smaller. In addition, the experimental model and space, operating parameters, and particle size distribution used by Wang et al. [29] were quite different from those used in this paper, resulting in some deviation when PM2.5 concentration decreased greatly. Therefore, it is necessary to further study the influence of the above factors on the mass transfer coefficient of PM and modify the prediction model of PM concentration. This indicated that the PM concentration prediction model had good serviceability.

3.3. Temporal and Spatial Mass Transfer Mechanism of PM

3.3.1. The Dst of PM

The concentration profile analysis in Section 3.1 revealed that PM exhibits strong spatiotemporal dependence, with distinct behaviors across different particle size fractions. While previous studies have established the time-dependent nature of PM mass transfer [32], the spatial dimension of this process remains insufficiently characterized. To address this gap, the mass transfer coefficient must be considered as a function of both time and space, in contrast to the constant Dapp discussed in Section 3.2. Fick’s second law can then be expressed as follows:
c t = 1 r 2 r D s t r 2 c r
where Dst is the temporal and spatial mass transfer coefficient.
The B-M method can be used to calculate Dst, which could transform the above inhomogeneous equation into a solvable homogeneous differential equation, where conditions were simplified by the Boltzmann variable λ = r/t1/2 [35], as given by:
λ 2 t c λ = 1 r 2 t λ D s t r 2 c λ
After integrating between 0 and c (r, t) and using appropriate simplifications, Dst can be expressed in terms of the PM profile parameters as follows:
D s t = 1 2 r 2 t 0 c ( r , t ) r 3 d c d r d c c ( r , t )
The concentration profiles of large- and meso-scale PM at fixed time intervals were approximately fitted to an equation of the following form according to the fitting results:
c = m ln r + n
where m and n are constants. Values for m and n were determined by the least-squares non-linear approximation technique. However, due to the intricate relationship between micro-scale PM concentration and distance at fixed times, the piecewise fitting method was used and the integration interval was correspondingly adjusted to obtain a more reasonable m and n.

3.3.2. Temporal and Spatial Mass Transfer Processes of PM

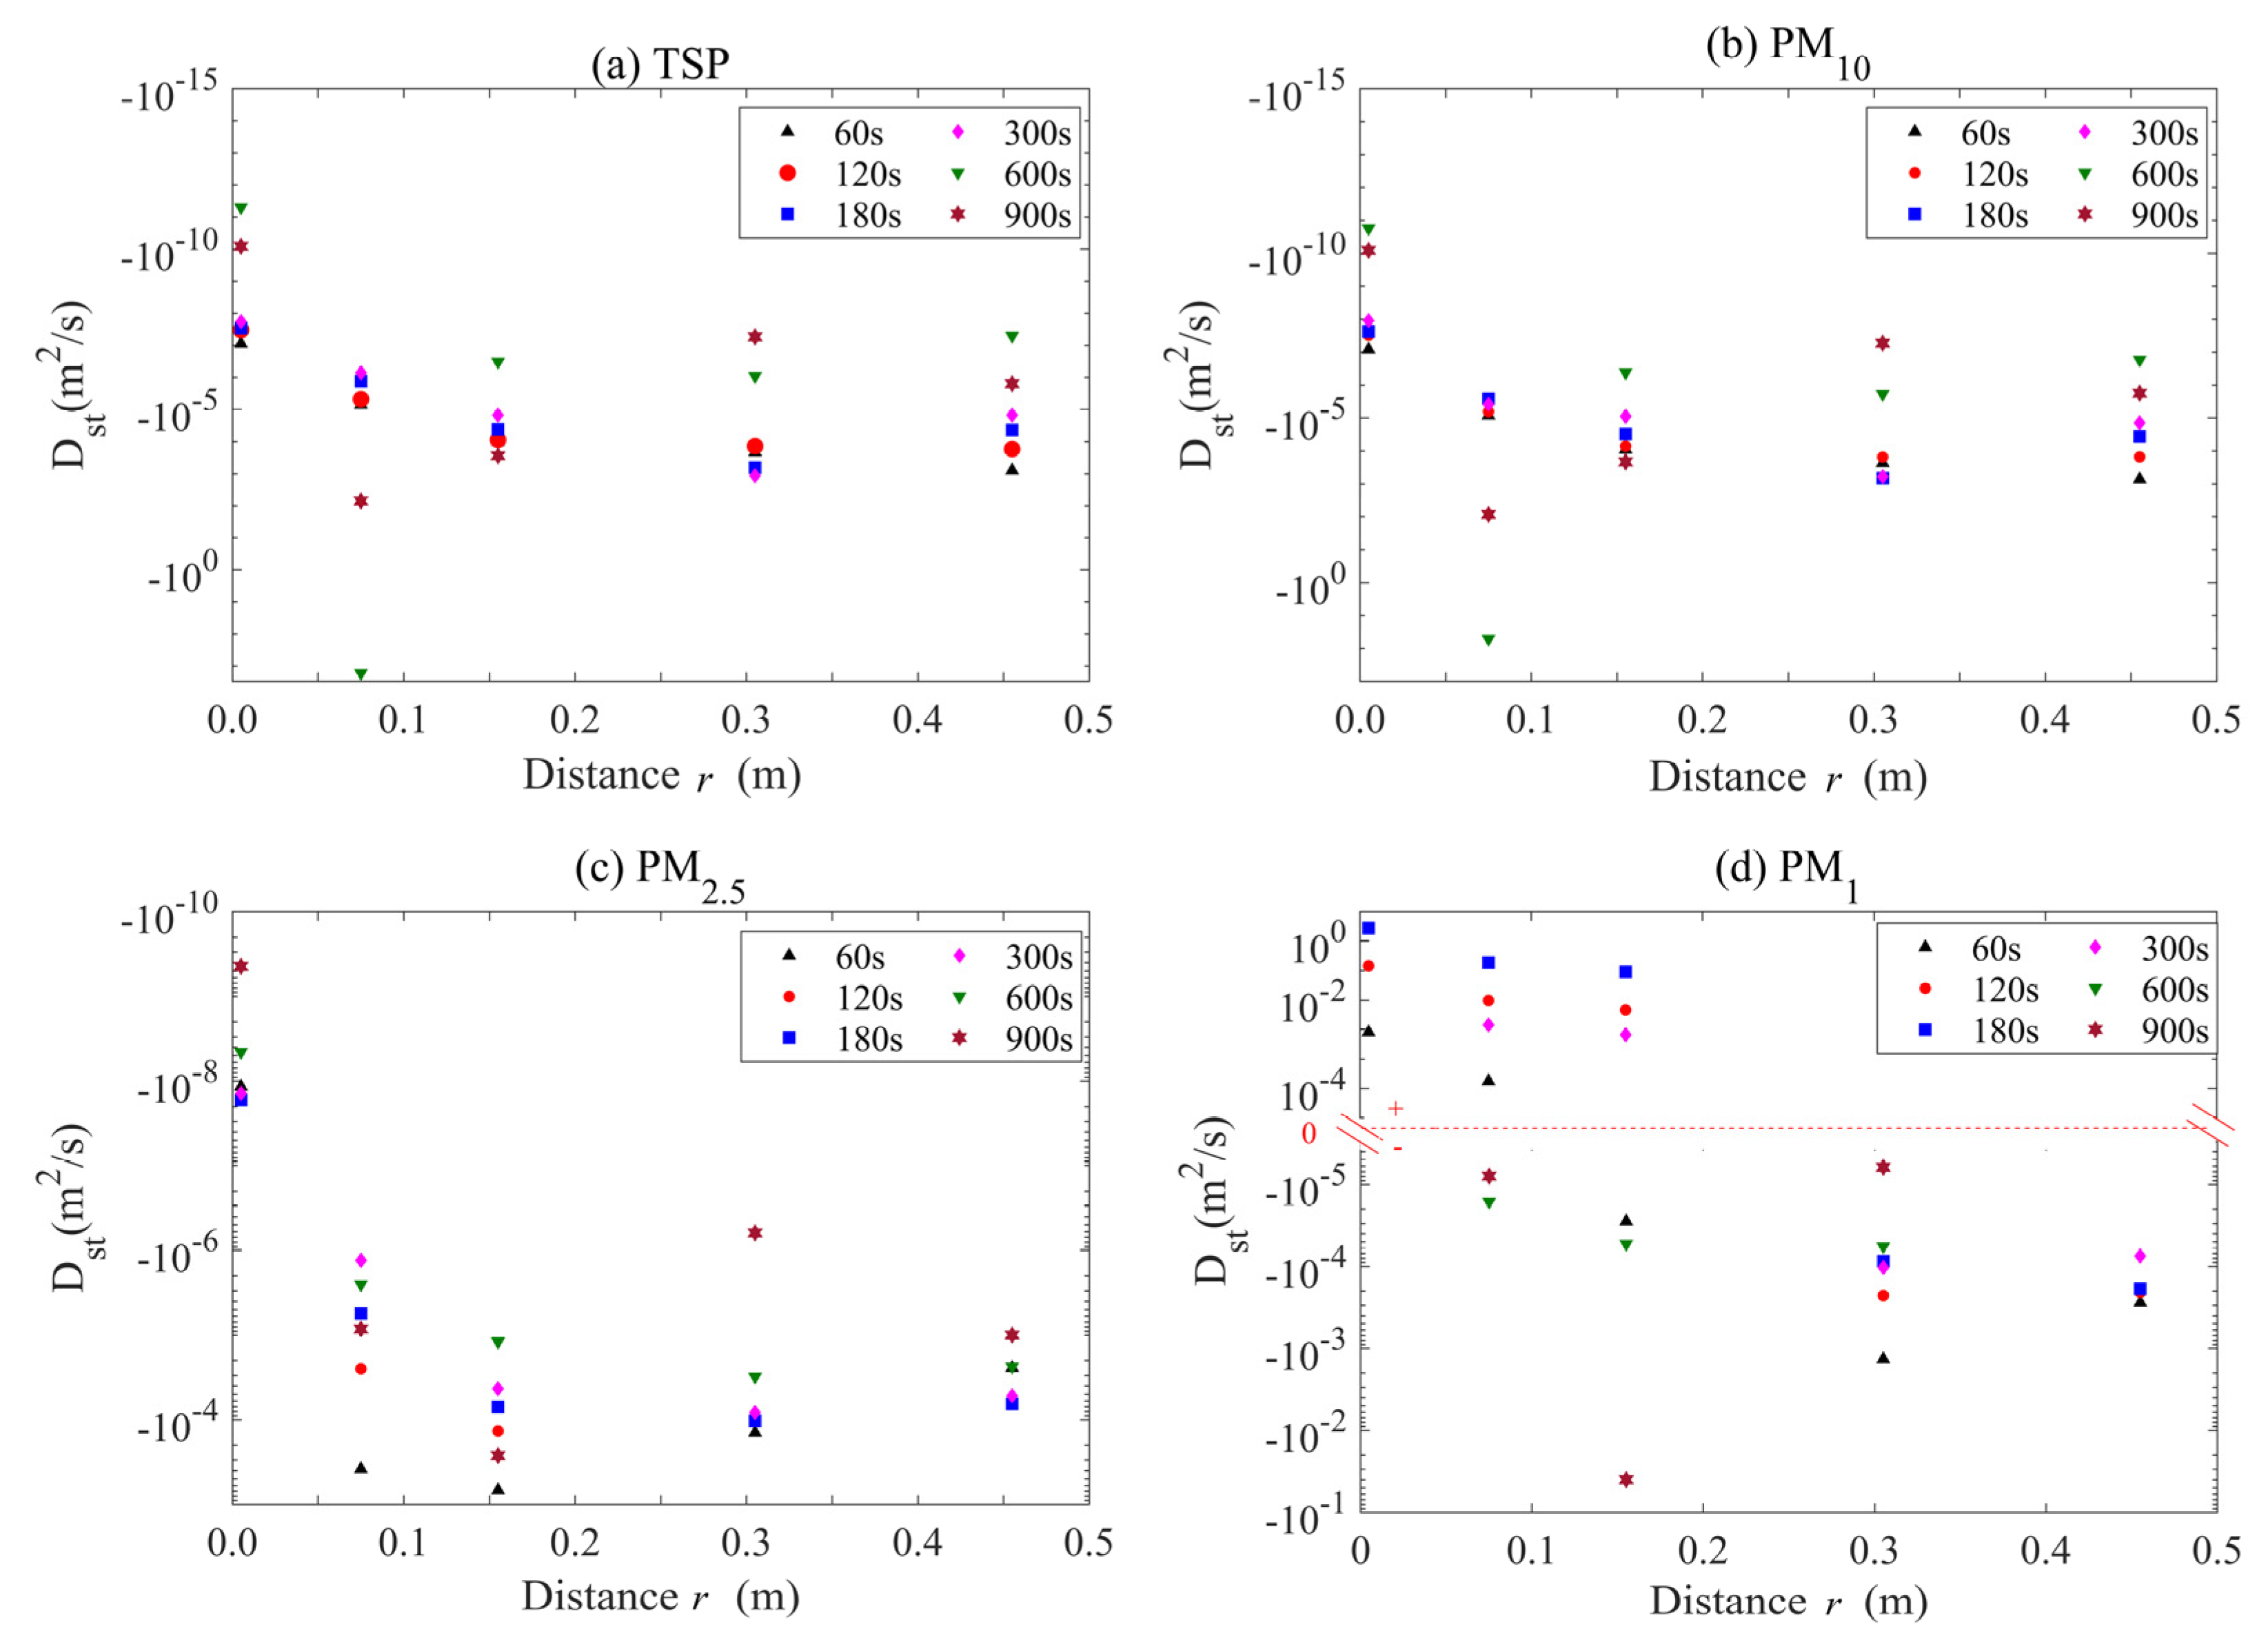
Dst could resolve and quantify the temporal and spatial mass transfer processes of PM under the action of the point sink from another perspective. According to Equation (9), the value of Dst could be calculated, as shown in Figure 5.
It can be seen from Figure 5 that the values of Dst for large- and meso-scale PM were lower than 0 (Figure 5a–c), while Dst of micro-scale PM contained both negative and positive values (Figure 5d). The negative and positive Dst indicated that PM migrated towards and away from the purification device, respectively. The absolute values of Dst for large- and meso-scale PM had a decreasing trend with increasing distance and time. At the same time window, large- and meso-scale PM concentrations showed monotonic concentration gradients with distance; hence, PM mainly migrated towards the purification device at the macroscopic level. And the greater distance from the purification device, the smaller the concentration gradient, resulting in a weaker migration capability. Moreover, PM concentration declined with the extension of time, and then the interaction effect between PM with different size fractions was progressively weakened. For micro-scale PM, the variation in the concentration gradient was also more complicated because of the strong fluctuation in PM concentration with distance at different times. This led to more positive Dst at distances less than 0.155 m. Be that as it may, the absolute value of Dst for micro-scale PM also had a decreasing trend with increasing distance and time.
According to Equation (9), Dst was a function of the PM concentration gradient. The larger the PM concentration gradient, the greater the interaction effect among PM with different size fractions. With the continued operation of the purification device, the lower the PM concentration, the smaller the PM concentration gradient, and then the smaller the PM mass transfer capability towards the purification device, resulting in a smaller absolute value of Dst. However, it is worth noticing that when the PM concentration near the purification device or at the middle distance reached the peak value, the corresponding PM concentration gradient in the space could change, and the local reverse mass transfer process of PM could occur. On this occasion, the sign of (dr/dc)c(r,t) in Equation (9) could change from a positive to a negative value and the calculation results of Dst were larger than 0. Therefore, PM migrating towards the purification device was dominant when Dst was lower than 0. Conversely, PM migrating away from the purification device was dominant. Furthermore, because the absolute value of Dst predominantly showed downward trends with increasing time, combined with spatial and temporal profiles of PM concentration, the corresponding threshold of Dst could be set to determine the removal proportion of PM. For example, benchmarked by the value of Dst at 900 s, the removal proportions of large- and meso-scale PM could reach 95% and above when the measurement result of Dst was greater than the threshold, while micro-scale PM migrating towards the purification device was already dominant.

3.4. Comparative Analysis and Engineering Implications of Dapp and Dst

Dapp serves as an important indicator for quantifying the mass transfer progress of particulate matter under the sink effect, exhibiting a temporal cumulative effect. A greater reduction in PM concentration corresponds to a larger Dapp value, and its temporal variation effectively captures the regeneration processes of meso- and micro-scale PM. In contrast, Dst primarily reflects the real-time mass transfer capacity of PM toward the purification device, demonstrating distinct transient characteristics. A larger absolute value of Dst indicates stronger PM migration capability, i.e., faster deposition velocity, while the sign of Dst reveals the migration direction of PM. Consequently, Dst offers advantages over Dapp in elucidating the detailed mechanisms of PM mass transfer. In general, combining Dapp and Dst enables a more comprehensive quantitative assessment of the PM mass transfer process under the sink effect, clarifying both the mass transfer progress and the migration capacity of PM.
Beyond their theoretical distinctions, these two coefficients provide complementary and practically valuable perspectives for evaluating and optimizing real-world air purifiers:
(1) Dapp functions as a lumped parameter for global performance prediction. Its core engineering value lies in its ability to transform a complex, spatially distributed purification process into a measurable intrinsic characteristic of the purifier itself. Building on our previous work that established the time-dependent nature of Dapp [32], the present study further reveals its spatial dependence, enabling a more complete characterization of the mass transfer process. This intrinsic parameter offers two significant practical advantages.
Dapp enables cost-effective and rapid performance assessment by substantially reducing sensor requirements. As demonstrated by the validated concentration prediction model, once Dapp is determined from measurements at a few strategically selected locations, the full spatiotemporal concentration field can be accurately reconstructed. This capability directly addresses a major challenge in current indoor air quality assessment: traditional approaches rely on multiple measurement points or several high-precision instruments, resulting in substantial equipment costs and extended testing periods. By leveraging the predictive power of Dapp, engineers can obtain a complete picture of purifier performance across the entire space with minimal instrumentation, significantly reducing both equipment costs and testing time.
Moreover, as an intrinsic parameter, Dapp possesses theoretical potential for scalability across different test chamber sizes. Since Dapp reflects the inherent mass transfer characteristics of the purifier, once determined in a specific test chamber, it could theoretically be used in conjunction with the validated concentration prediction model to estimate the purifier’s performance in spaces of other dimensions. If further validated, this characteristic could provide a theoretical tool for addressing the current lack of uniformity in international standards regarding test chamber volumes and clean air delivery rate (CADR) classifications. For instance, Chinese standard GB/T 18801-2022, Korean standard SPS-KACA002-132:2021, and other international standards prescribe markedly different test chamber volumes [39]. Establishing Dapp-based correlations between different chamber sizes could potentially provide a scientific basis for international standardization and cross-regional product certification. Naturally, realizing this potential requires future comparative studies across test chambers of various volumes for further validation and calibration.
(2) In contrast to the global perspective offered by Dapp, Dst serves as a high-resolution diagnostic tool. Its absolute value quantifies instantaneous local migration intensity, while its sign reveals the direction of particle movement. The observation of positive Dst values for ultrafine particles (PM1) in the near-field region represents a finding of significant engineering consequence, directly indicating the existence of a reverse migration zone where the device may inadvertently act as a source of particles. This insight, unattainable from Dapp alone, provides clear directives for targeted engineering optimization. By analyzing the spatial and temporal extent of these positive Dst regions, designers can identify root causes—such as intense local turbulence leading to agglomerate breakup—and implement countermeasures including modifying electrode geometry or adjusting operational strategies to enhance ultrafine particle capture.
Together, Dapp and Dst constitute a comprehensive evaluation framework: Dapp enables efficient, scalable performance prediction for standardization and cost-effective research and development, while Dst provides the detailed mechanistic diagnosis necessary for precision design improvements. This dual-parameter approach advances both the theoretical understanding and practical application of passive air purification technology.
From a design perspective, these findings translate directly into engineering actions: Dapp can serve as a benchmarking metric for comparing prototypes without full-scale testing; the validated prediction model allows for performance evaluation using only 2–3 strategically placed sensors; and the sign of Dst pinpoints reverse-migration zones (e.g., near-field PM1), guiding targeted geometry or voltage adjustments. These concrete implications bridge the gap between theory and real-world purifier optimization.

3.5. Limitations and Future Research Directions

While the proposed spatiotemporal mass transfer framework and the dual-coefficient (Dapp and Dst) evaluation method offer significant advantages, such as rapid particle charging, real-time monitoring, and low energy consumption, several limitations of the present study should be acknowledged. These limitations also point to directions for future research.
First, the electro-convective passive air purifier operates at a relatively high DC voltage (25 kV in this study). Although the current is low (0.25 mA), the high-voltage requirement may raise safety concerns and limit the device’s applicability in certain indoor environments (e.g., homes with children or sensitive electronic equipment). Future work should explore the use of lower-voltage or pulsed-power configurations, as well as advanced insulation designs, to reduce voltage requirements while maintaining removal efficiency.
Second, purification performance relies on electrohydrodynamic flow induced by the discharge electrode. This flow can be perturbed by external air movement (e.g., ventilation, drafts, human activity), which may alter the spatial distribution of PM mass transfer. The present experiments were conducted in a sealed chamber with no external airflow. To better simulate real-world conditions, future studies should examine system performance under controlled airflow velocities and directions, as well as in the presence of obstacles or occupants.
Third, the PM source used in this study was a commercial smoke cake, which generates particles with a specific composition and size distribution. Real indoor PM originates from multiple sources, including cooking, candle burning, dust resuspension, and outdoor infiltration. These sources differ in chemical composition, hygroscopicity, and morphology, all of which can affect charging and mass transfer behavior. Therefore, follow-up investigations should incorporate a broader range of PM sources, such as cooking fumes, environmental tobacco smoke, and road dust, to validate the generalizability of the proposed models.
Fourth, the experiments were carried out under stable temperature (≈20 °C) and humidity (≈40%). Variations in temperature and humidity can influence particle charging efficiency, Brownian diffusion, and electrohydrodynamic flow patterns. Consequently, future research should systematically vary these environmental parameters to quantify their effects on Dapp and Dst, and if necessary, develop correction factors or extended models.
Finally, although we have demonstrated the robustness of the PM concentration prediction model under the present conditions, its scalability to different chamber sizes and room geometries remains to be validated. As noted in Section 3.4, Dapp is theoretically an intrinsic parameter of the purifier; however, cross-scale validation across chambers of various volumes is needed before it can be used for standardization purposes. Comparative experiments in chambers of different sizes, as well as in full-scale rooms, are recommended.
In addition, the electro-convective device operates at a high DC voltage (25 kV), which may generate reactive species such as ozone via corona discharge. While the present study focuses on PM removal and did not quantitatively measure these species, investigating ozone generation is identified as a key direction for our future research.
Addressing these limitations will not only improve the practical applicability of the electro-convective passive air purifier but also refine the spatiotemporal mass transfer theory for PM control in diverse indoor environments.

4. Conclusions

This study investigated the spatiotemporal mass transfer mechanisms of particulate matter (PM) under the sink effect induced by an electro-convective passive air purifier. By combining theoretical analysis with laboratory-scale experiments, Dapp and Dst were established and systematically analyzed. The main conclusions are as follows:
(1) The concentration profiles of PM with different size fractions exhibited distinct spatiotemporal characteristics under the sink effect. For large-scale (TSP, PM10) and meso-scale (PM2.5) particles, concentrations increased monotonically with distance from the purifier, maintaining a consistent concentration gradient. In contrast, micro-scale (PM1) particles displayed a non-linear concentration-distance relationship. Temporally, large-scale PM and meso-scale PM near the purification device showed monotonic decay throughout the process, while micro-scale PM and meso-scale PM at other locations experienced an initial increase followed by a decrease.
(2) The apparent mass transfer coefficient Dapp was derived from Fick’s second law and served as the basis for establishing a spatiotemporal PM concentration prediction model. The logarithmic values of Dapp exhibited a logarithmic functional relationship with distance at fixed time intervals. The validated prediction model demonstrated strong robustness, with errors consistently within ±15%, enabling clear visualization of spatial concentration gradient distributions. This capability offers significant practical value for reducing sensor requirements in indoor air quality monitoring, as full-field concentration distributions can be accurately reconstructed from measurements at only 2–3 strategically positioned monitoring points, substantially lowering equipment costs and testing time. Furthermore, as an intrinsic parameter of the purifier, Dapp possesses theoretical potential for scalability across different test chamber sizes, which may contribute to future harmonization of international standards for air cleaner performance evaluation.
(3) Dst was determined using the Boltzmann–Matano method, providing deeper insight into the local instantaneous mass transfer dynamics. The absolute value of Dst quantifies the local migration intensity, while its sign indicates the migration direction—negative values represent migration toward the purifier, and positive values indicate migration away from it. For large- and meso-scale particles, Dst remained negative throughout the experimental domain, confirming globally effective capture. Notably, positive Dst values were observed for micro-scale PM1 in the near-field region, directly revealing the existence of a reverse migration zone where the device may inadvertently act as a particle source. This finding provides a clear directive for targeted engineering optimization, such as modifying electrode geometry or adjusting operational strategies to enhance ultrafine particle capture.
(4) Combining Dapp and Dst enables a comprehensive evaluation framework for passive air purification technology. Dapp supports efficient, scalable performance prediction for standardization and cost-effective research and development, while Dst provides the detailed mechanistic diagnosis necessary for precision design improvements. Together, they refine the theoretical framework of PM mass transfer under the sink effect and advance both the scientific understanding and practical application of passive air purification systems.

Author Contributions

Conceptualization, Z.L. and T.W.; methodology, B.Y.; formal analysis, X.L.; investigation, X.P.; writing—original draft preparation, Z.L.; writing—review and editing, T.W.; funding acquisition, T.W. All authors have read and agreed to the published version of the manuscript.

Funding

This work was supported by the National Natural Science Foundations of China (grant Nos. 52504258, 12532011).

Institutional Review Board Statement

Not applicable.

Informed Consent Statement

Not applicable.

Data Availability Statement

Data is contained within the article. The original contributions presented in this study are included in the article. Further inquiries can be directed to the corresponding author.

Conflicts of Interest

The authors declare that they have no known competing financial interests or personal relationships that could have appeared to influence the work reported in this paper.

Abbreviations

The following abbreviations are used in this manuscript:
PMParticulate matter
PM2.5Particles with an aerodynamic diameter of ≤2.5 μm
PM10Particles with an aerodynamic diameter of ≤10 μm
TSPTotal suspended particulates
B-MBoltzmann–Matano
DappApparent mass transfer coefficient
DstSpace-and-time-dependent mass transfer coefficient
HEPAHigh-efficiency particulate air filters
ESPsElectrostatic precipitators
CADRClean air delivery rate
PMMAPolymethyl methacrylate methacrylic acid

References

  1. Wu, X.; Chen, Y.; Guo, J.I.; Wang, G.; Gong, Y. Spatial concentration, impact factors and prevention-control measures of PM2.5 pollution in China. Nat. Hazards 2017, 86, 393–410. [Google Scholar] [CrossRef]
  2. Yu, M.F.; Zhu, Y.; Lin, C.J.; Wang, S.X.; Xing, J.; Jang, C.; Huang, J.Z.; Huang, J.Y.; Jin, J.B.; Yu, L. Effects of air pollution control measures on air quality improvement in Guangzhou, China. J. Environ. Manag. 2019, 244, 127–137. [Google Scholar] [CrossRef]
  3. China’s State Council, Action Plan for Air Pollution Prevention and Control. 2013. Available online: https://www.mee.gov.cn/ywgz/zcghtjdd/sthjghjh/201811/t20181129_676555.shtml (accessed on 1 April 2026).
  4. Badeenezhad, A.; Baghapour, M.A.; Azhdarpoor, A.; Keshavarz, M.; Amrane, A.; Goudarzi, G.; Hoseini, M. The effects of short-term exposure to selected heavy metals carried by airborne fine particles on neural biomarkers during dust storms. Hum. Ecol. Risk Assess. Int. J. 2020, 27, 1309–1323. [Google Scholar] [CrossRef]
  5. Zhang, X.; Zhang, K.; Lv, W.; Liu, B.; Aikawa, M.; Wang, J. Characteristics and risk assessments of heavy metals in fine and coarse particles in an industrial area of central China. Ecotoxicol. Environ. Saf. 2019, 179, 1–8. [Google Scholar] [CrossRef]
  6. Wang, S.; Liu, W.; Li, J.; Sun, H.; Qian, Y.; Ding, L.; Ma, H.; Li, J. Seasonal variation characteristics of bacteria and fungi in PM2.5 in typical basin cities of Xi’an and Linfen, China. Atmosphere 2021, 12, 809. [Google Scholar] [CrossRef]
  7. Du, P.; Du, R.; Ren, W.; Lu, Z.; Zhang, Y.; Fu, P. Variations of bacteria and fungi in PM2.5 in Beijing, China. Atmos. Environ. 2018, 172, 55–64. [Google Scholar] [CrossRef]
  8. Colaco, M.; Duarte, A.; Zuzarte, M.; Costa, B.F.O.; Borges, O. Airborne environmental fine particles induce intense inflammatory response regardless of the absence of heavy metal elements. Ecotoxicol. Environ. Saf. 2020, 195, 110500. [Google Scholar] [CrossRef] [PubMed]
  9. Wu, F.; Kong, S.; Yan, Q.; Wang, W.; Liu, H.; Wu, J.; Zheng, H.; Zheng, S.; Cheng, Y.; Niu, Z.; et al. Sub-type source profiles of fine particles for fugitive dust and accumulative health risks of heavy metals: A case study in a fast-developing city of China. Environ. Sci. Pollut. Res. Int. 2020, 27, 16554–16573. [Google Scholar] [CrossRef]
  10. Hsiao, T.C.; Cheng, P.C.; Chi, K.H.; Wang, H.Y.; Pan, S.Y.; Kao, C.; Lee, Y.L.; Kuo, H.P.; Chung, K.F.; Chuang, H.C. Interactions of chemical components in ambient PM2.5 with influenza viruses. J. Hazard. Mater. 2022, 423, 127243. [Google Scholar] [CrossRef]
  11. Zhao, X.L.; Jiang, G.G.; Song, Z.L.; Touseef, B.; Zhao, X.Y.; Huang, Y.Y.; Guo, M.; Bharti, B. Concentrations of heavy metals in PM2.5 and health risk assessment around Chinese New Year in Dalian, China. Open Geosci. 2021, 13, 1366–1374. [Google Scholar] [CrossRef]
  12. Long, C.M.; Suh, H.H.; Catalano, P.J.; Koutrakis, P. Using time- and size-resolved particulate data to quantify indoor penetration and deposition behavior. Environ. Sci. Technol. 2001, 35, 2089–2099. [Google Scholar] [CrossRef]
  13. State of Global Air Report; Health Effects Institute: Boston, MA, USA, 2024.
  14. Mo, J.H.; Tian, E.Z.; Pan, J. New electrostatic precipitator with dielectric coatings to efficiently and safely remove sub-micro particles in the building environment. Sustain. Cities Soc. 2020, 55, 102063. [Google Scholar] [CrossRef]
  15. Feng, Z.; Long, Z.; Yu, T. Filtration characteristics of fibrous filter following an electrostatic precipitator. J. Electrost. 2016, 83, 52–62. [Google Scholar] [CrossRef]
  16. Liu, G.; Xiao, M.; Zhang, X.; Gal, C.; Chen, X.; Liu, L.; Pan, S.; Wu, J.S.; Tang, L.; Clements-Croome, D. A review of air filtration technologies for sustainable and healthy building ventilation. Sustain. Cities Soc. 2017, 32, 375–396. [Google Scholar] [CrossRef]
  17. Siegel, J.A. Primary and secondary consequences of indoor air cleaners. Indoor Air 2016, 26, 88–96. [Google Scholar] [CrossRef] [PubMed]
  18. Zhang, Y.; Mo, J.; Li, Y.; Sundell, J.; Wargocki, P.; Zhang, J.; Little, J.; Corsi, R.; Deng, Q.; Leung, M.; et al. Can commonly used fan-driven air cleaning technologies improve indoor air quality? A literature review. Atmos. Environ. 2011, 45, 4329–4343. [Google Scholar] [CrossRef] [PubMed]
  19. Kolarž, P.; Ilić, A.Ž.; Janković, M.; Janićijević, A.; Trbovich, A.M. Estimating aerosol particle removal in indoor air by ion-enhanced deposition. J. Aerosol Sci. 2023, 173, 106199. [Google Scholar] [CrossRef]
  20. Lee, S.U.; Lee, J.Y.; Lee, S.H.; Jeon, G.W. A sustainable water vortex-based air purification for indoor air quality. Build. Environ. 2023, 243, 110610. [Google Scholar] [CrossRef]
  21. Braun, K.; Eaves, E.; Giambri, C.; Chapman, D.; Heavner, H.; Woodward, J.; Nagel, J.; Gipson, K. Reducing electrical energy consumption of AHU fans through the integration of variable frequency drives. In 2016 Systems and Information Engineering Design Symposium (SIEDS); IEEE: New York, NY, USA, 2016; pp. 61–65. [Google Scholar]
  22. Kumar, P.; Arora, K.; Chanana, I.; Kulshreshtha, S.; Thakur, V.; Choi, K. Comparative study on conventional and microalgae-based air purifiers: Paving the way for sustainable green spaces. J. Environ. Chem. Eng. 2023, 11, 111046. [Google Scholar] [CrossRef]
  23. Howard-Reed, C.; Wallace, L.A.; Emmerich, S.J. Effect of ventilation systems and air filters on decay rates of particles produced by indoor sources in an occupied townhouse. Atmos. Environ. 2003, 37, 5295–5306. [Google Scholar] [CrossRef]
  24. Mizuno, A. Electrostatic precipitation. IEEE Trans. Dielectr. Electr. Insul. 2000, 7, 615–624. [Google Scholar] [CrossRef]
  25. Kim, J.S.; Jeong, U.C.; Kim, D.W.; Han, S.Y.; Oh, J.E. Optimization of sirocco fan blade to reduce noise of air purifier using a metamodel and evolutionary algorithm. Appl. Acoust. 2015, 89, 254–266. [Google Scholar] [CrossRef]
  26. Daniels, S.L. On the ionization of air for removal of noxious effluvia. IEEE Trans. Plasma Sci. 2002, 30, 1471–1481. [Google Scholar] [CrossRef]
  27. Grinshpun, S.A.; Mainelis, G.; Trunov, M.; Adhikari, A.; Reponen, T.; Willeke, K. Evaluation of Ionic Air Purifiers for reducing an Aerosol Exposure in Confined Indoor Spaces. Indoor Air 2005, 15, 235–245. [Google Scholar] [CrossRef] [PubMed]
  28. Shiue, A.; Hu, S.; Tu, M. Particles removal by negative ionic air purifier in cleanroom. Aerosol Air Qual. Res. 2011, 11, 179–186. [Google Scholar] [CrossRef]
  29. Wang, L.Z.; Niu, H.T.; Peng, N.N.; Shen, X. Primary research on haze removal method based on diffusion and relative motion. Environ. Eng. 2015, 33, 75–79 + 83. [Google Scholar]
  30. Peng, N.N.; Liu, Z.F.; Wang, L.Z. Experimental study of submicron particles’ motion in the effect of particle-sink. Chin. J. Theor. Appl. Mech. 2017, 49, 289–298. [Google Scholar]
  31. Wei, T.; Yang, S.; Yang, X.; Wang, L. Investigation and practical application of particle sink technology for haze removal: Pilot-scale testing. Powder Technol. 2022, 402, 117333. [Google Scholar] [CrossRef]
  32. Wei, T.; Yang, S.; Yang, X.; Wang, L. Theoretical and experimental investigations of time-dependent mass transfer mechanism of fine particulate matter under the sink effect. Sep. Purif. Technol. 2022, 292, 121027. [Google Scholar] [CrossRef]
  33. Lai, A.C.; Nazaroff, W.W. Modeling indoor particle deposition from turbulent flow onto smooth surfaces. J. Aerosol Sci. 2000, 31, 463–476. [Google Scholar] [CrossRef]
  34. Lai, A.C.K. Particle deposition indoors: A review. Indoor Air 2002, 12, 211–214. [Google Scholar] [CrossRef]
  35. Tumidajski, P.J.; Chan, G.W. Boltzmann-Matano analysis of chloride diffusion into blended cement concrete. J. Mater. Civ. Eng. 1996, 8, 195–200. [Google Scholar] [CrossRef]
  36. Jung, S.; Ahn, Y.; Lee, Y.; Lee, J. Removal characteristics and distribution of indoor tobacco smoke particles using a room air cleaner. Korean J. Chem. Eng. 2013, 30, 351–356. [Google Scholar] [CrossRef]
  37. Pan, X.; Zhang, Z.; Cui, L.; Zhang, Q.; Ma, C. Influence of heat exchange on the motion characteristics and mechanical behavior of fine particles in an electrostatic precipitator. Powder Technol. 2020, 373, 347–356. [Google Scholar] [CrossRef]
  38. Chen, B.T.; Namenyi, J.; Yeh, H.C.; Mauderly, J.L.; Cuddihy, R.G. Physical Characterization of Cigarette Smoke Aerosol Generated from a Walton Smoke Machine. Aerosol Sci. Technol. 1990, 12, 364–375. [Google Scholar] [CrossRef]
  39. Fan, Y.Y.; Liu, J.J.; Zhao, L.; Wang, C.H.; Moon, D.; Song, S. Study on the test accuracy of the high-air-volume purifier under different test chamber volumes. J. Clean. Prod. 2024, 448, 141684. [Google Scholar] [CrossRef]
Figure 1. Schematic diagram of the experimental setup and the key materials: (a) schematic diagram of the experimental setup, (b) picture of the closed chamber, (c) collecting electrode, (d) discharge electrode, (e) regulating device, (f) dust monitor, (g) smoke cake.
Applsci 16 03824 g001
Figure 2. Spatial and temporal profiles of normalized PM concentration of different size fractions: (a) TSP, (b) PM10, (c) PM2.5, (d) PM1.
Applsci 16 03824 g002
Figure 3. Dapp of PM of different size fractions changes at different times and positions: (a) TSP, (b) PM10, (c) PM2.5, (d) PM1.
Applsci 16 03824 g003
Figure 4. Comparison of the prediction results of PM obtained from Equation (2), with the experimental results: (a) comparison between the prediction results and experimental results of the vertical plane, (b) error analysis of the prediction results versus experimental results of the vertical plane, (c) error analysis of the prediction results versus experimental results presented in the work of Wang et al. [29].
Applsci 16 03824 g004
Figure 5. Dst of PM of different size fractions changes at different times and positions: (a) TSP, (b) PM10, (c) PM2.5, (d) PM1.
Applsci 16 03824 g005
Disclaimer/Publisher’s Note: The statements, opinions and data contained in all publications are solely those of the individual author(s) and contributor(s) and not of MDPI and/or the editor(s). MDPI and/or the editor(s) disclaim responsibility for any injury to people or property resulting from any ideas, methods, instructions or products referred to in the content.