Article

Comprehensive Assessment of Pesticide Residues in Fruits and Vegetables from Apulia and Basilicata (Southern Italy, 2022–2025) and Related Risk Evaluation

by
Ines Della Rovere
,
Rosalia Zianni
*,
Francesco Paolo Casamassima
,
Anna Maria Accettulli
,
Anna Calitri
,
Francesca Catano
and
Valeria Nardelli
Laboratorio Diossine, PCB e Pesticidi, Istituto Zooprofilattico Sperimentale della Puglia e della Basilicata, Via Manfredonia 20, 71121 Foggia, Italy
*
Author to whom correspondence should be addressed.
Appl. Sci. 2026, 16(7), 3454; https://doi.org/10.3390/app16073454
Submission received: 18 March 2026 / Revised: 26 March 2026 / Accepted: 30 March 2026 / Published: 2 April 2026

Featured Application

This study describes the application of combining two analytical workflows, i.e., Gas Chromatography coupled to Triple Quadrupole Mass Spectrometry (GC-QqQ-MS/MS) and Ultra-High-Performance Liquid Chromatography coupled to Heated Electrospray Ionization-Quadrupole Orbitrap Mass Spectrometry (UHPLC-HESI-Q-Orbitrap-MS), for high-throughput monitoring of pesticide residues in fruit and vegetable samples. This combined approach allowed the determination of over 290 pesticides, including complex isomers like alpha-cypermethrin and isobaric species, ensuring EU compliance. It supports the official control of pesticide residues in food, as established by the Italian Ministry of Health, and the EU Farm to Fork Strategy for sustainable farming and consumer protection. Furthermore, this approach provided a comprehensive dietary risk assessment and an accurate evaluation of consumer exposure.

Abstract

In this study, a comprehensive assessment of pesticide residues in fruits, vegetables, and derived products collected between 2022 and 2025 within the Apulia and Basilicata regions (Southern Italy) is reported. The analytical workflow combined QuEChERS extraction with Gas Chromatography coupled to Triple Quadrupole Mass Spectrometry (GC-QqQ-MS/MS) and Ultra-High-Performance Liquid Chromatography coupled to Heated Electrospray Ionization-Quadrupole Orbitrap Mass Spectrometry (UHPLC-HESI-Q-Orbitrap-MS). A total of 198 samples were analyzed, including fruits (51%), vegetables (35%), and processed products (14%). Approximately 60% of the samples originated from large-scale distribution networks (EU and non-EU imports), while 40% were derived from local production in Apulia and Basilicata. Validation parameters for both methods met the SANTE/11312/2021 and Commission Implementing Regulation (EU) 2021/808 performance requirements. Results showed that 76.8% of samples were free of quantifiable pesticides, while 23.2% contained residues below EU maximum limits, confirming high compliance and effective regional agronomic management in Apulia and Basilicata. The estimated daily intake and chronic hazard index values were below 100%, across all population groups, confirming the absence of chronic dietary risk. The integration of GC-QqQ-MS/MS and UHPLC-HESI-Q-Orbitrap-MS platforms ensured comprehensive chemical coverage and high selectivity, providing an effective regional surveillance model aligned with EU “Farm to Fork” food safety purposes.

1. Introduction

The World Health Organization recommends a minimum daily intake of 400 g of fruits and vegetables (FVs), typically defined as at least five servings per day, to reduce the risk of non-communicable diseases, including neurodegenerative conditions, cardiovascular diseases and stroke [1,2,3]. FVs are therefore cornerstones of a healthy diet because they are rich in flavonoids and other bioactive compounds with anti-inflammatory, antioxidant, and anti-proliferative properties, which may help prevent diseases and health disorders [4]. Evidence from cohort studies shows that adequate consumption of FVs, together with other healthy foods, reduces all-cause mortality and promotes overall health [5].
Europe is both a major producer and consumer of FVs, yet the sector is heavily dependent on plant-protection products, such as pesticides, to secure crop yields and post-harvest quality. Pesticides are natural or synthetic compounds used to prevent, control, and eliminate insects, weeds, and pests that affect the plant’s growth and quality. These substances include several chemical classes, such as carbamates, neonicotinoids, organophosphates, organochlorines, pyrethroids, classified according to their action modality, chemical structure, hazards, and application [6]. Unfortunately, pesticides are biologically active and environmental persistent chemicals that can have harmful effects on both human health and ecosystems [7]. Pesticide exposure has been associated neurological, psychological, immune, and behavioral dysfunctions, with serious symptoms such as tremors, memory loss, mood disturbances, genotoxicity, and blood disorders [8]. Moreover, they are recognized endocrine disruptors, responsible for hormonal imbalances and infertility [9], long-term and/or repeated exposure has been associated with increased risks of cancer, neurotoxicity, mutagenicity, teratogenicity, and other chronic toxicities [10,11]. Pesticides are a critical food safety concern, as trace amounts may remain on or within food products after application, posing health risks through chronic dietary exposure. The danger is amplified when multiple residues coexist in a single commodity inducing the so-called “cocktail effect”, increasing the probability of cumulative or synergistic effects via ingestion, inhalation, or dermal absorption [12,13].
The regulatory framework of European Commission (EC) for pesticide residues is among the most rigorous in the world, with maximum residue levels (MRLs) established for more than 500 pesticides across over 350 food matrices [14]. These legal limits are periodically updated and revised based on the scientific opinions of the European Food Safety Authority (EFSA), as well as new data and emerging public health risks [15,16]. European Union (EU) member states are required to carry out official monitoring and ensure compliance with the MRLs by sampling food products. In accordance with Article 31 of Regulation (EC) No 2005/396 [14], the results of these official controls are reported annually to EFSA to ensure consumer protection and a harmonized risk assessment. The main objective is not only to safeguard public health but also to promote sustainable agricultural practices at the same time, in accordance with the EU’s “Farm to Fork” strategy, which aims to reduce pesticide risk by 50% by 2030 [17]. In 2023 [18], 98% of the 132, 793 samples analyzed in EU national official checks complied with the MRLs, while non-compliance percentages were markedly higher for imported products, underscoring the need for the enhanced border controls and constant surveillance. The new Implementing Regulation (EU) No. 2024/989 [19] introduces a three-year monitoring cycle (2025–2027) for commonly consumed commodities, including also fruit and vegetables. Under EU Regulation 2017/625 [20], Italy implements the official control plan for pesticide residues, adopted by the Ministry of Health and implemented at regional level, to ensure compliance with MRLs and to assess dietary exposure across different commodity groups, as well as plant-based plants.
Within the framework of Regulation (EC) No. 2004/882 [21], the European Union Reference Laboratories (EURLs) were established to ensure high-quality and harmonized analytical testing across Member States, thereby contributing to EU risk assessment and management. In this context, the EURL for pesticide residues in FVs (EURL-FV) annually organizes the European Union Proficiency Tests (EUPT-FV) for multiresidue pesticide analysis, involving National Reference Laboratories and Official Laboratories (OfLs) from all EU countries [22], following the EU guidance document SANTE/11312/2021v2026 [23]. This guidance, which replaces the previous versions, in particular SANTE/11312/2021-v1 and -v2 [24,25] and will be fully implemented by 01/01/2026, sets the performance requirements for pesticide analysis. Validation criteria include recoveries of 70–120% and relative repeatability standard deviation (RSDr) ≤ 20% for initial validation. For routine monitoring, a wider recovery range of 60–140% (mean ± 2RSDr) is acceptable, and the limit of quantitation (LOQ) must meet or be below the reporting limit, which depends on the substance, matrix, and MRL.
The high-throughput analytical workflows based on quick, easy, cheap, effective, rugged and safe (QuEChERS) extraction method combined with gas chromatography (GC) or liquid chromatography (LC), both coupled to tandem mass spectrometry (MS/MS), represent the most widely used approaches for multi-residue analysis. The combined use of GC-MS/MS and LC-MS/MS is often required due to the diverse physicochemical properties of pesticides. GC is particularly suited for analysis of volatile and semi-volatile compounds, such as organochlorines and pyrethroids [26], whereas LC is more appropriate for thermally labile and polar compounds, including carbamates, neonicotinoids, and organophosphates [27,28].
In this study, pesticide residues in FVs sample were determined using Gas Chromatography coupled to Triple Quadrupole Mass Spectrometry (GC-QqQ-MS) and Ultra-High-Performance Liquid Chromatography coupled to Heated Electrospray Ionization-Quadrupole Orbitrap Mass Spectrometry (UHPLC-HESI-Q-Orbitrap-MS). The investigated compounds covered a broad range of chemical classes, including organophosphates, carbamates, pyrethroids, neonicotinoids, amides (such as carboxamides and benzamides), strobilurins, triazoles and imidazoles, benzimidazoles, pyridines and pyrimidines, triazines, phenylureas, dicarboximides, phenylamides, diamides (anthranilamides and nicotinamides), morpholines and piperidines, sulfonylureas, macrocyclic lactones (avermectins and spinosyns), and organochlorine compounds (Tables S1 and S2). A comprehensive multiresidue analytical method was validated for both chromatographic approaches to allow the simultaneous determination of pesticides, through the evaluation of linearity, selectivity, limits of detection (LOD) and LOQ, recovery, precision, and measurement uncertainty. Subsequently, in the context of the official checks and research activities, pesticide contamination levels were assessed in a total of 198 samples of both Italian and foreign origin, collected and analyzed between 2022 and 2025. These included 101 fruit samples (51%), 69 vegetable samples (35%), and 28 processed product samples (14%). Dietary risk assessment, including the evaluation of estimated daily intake and hazard index, was also performed to verify potential chronic exposure across all population groups (Table S3). Given the number of samples and their geographical distribution, this study represents a regional surveillance activity carried out by our OfL for the multiresidue determination of pesticides in FVs samples, at the Istituto Zooprofilattico Sperimentale della Puglia e della Basilicata (IZSPB). In particular, the results provide valuable insight into the current state of pesticide residues contamination in the Apulia and Basilicata regions (Southern Italy), contributing to the broader national monitoring framework.

2. Materials and Methods

2.1. Chemicals

Ammonium formate (NH4HCO2), methanol (MeOH) and acetonitrile (ACN), all LC/MS grade, together with toluene (GC/MS grade) were supplied from Carlo Erba Reagents (Cornaredo, Milan, Italy). Formic acid (HCOOH, 98–100% purity) was provided from Merck Life Science S.r.l. (Darmstadt, Germany). Isooctane was purchased from Panreac Química S.L.U. (Castellar del Vallès, Barcelona, Spain). Deionized water (H2O, 18.2 MΩ/cm) was produced with a Milli-Q purification system (Millipore, Milan, Italy). Certified mix standard solutions (100 mg L−1 in ACN, toluene or isooctane), containing all the pesticides reported in Tables S1 and S2, were purchased from Lab Instruments S.r.l. (Castellana Grotte, Bari, Italy). Both multi-component mixtures and individual standard solutions were used, covering a total of 292 pesticide species. Working standard solutions were prepared at concentrations of 5.0, 0.500, 0.250, 0.100, 0.05 and 0.010 mg L−1, by appropriate dilution of the corresponding stock solutions in toluene for GC analysis and at concentrations of 1.0, 0.500, 0.250, 0.100, 0.050 and 0.01 mg L−1 in ACN for LC analysis. All stock and working standard solutions were stored at −18 ± 3 °C in amber glass vials and allowed to equilibrate to room temperature before use. Polychlorinated biphenyl (PCB) 209 (purity > 98.6%; 10 mg L−1 in isooctane, Lab Instruments S.r.l., Castellana Grotte, BA, Italy) was used as an internal standard in GC-MS analysis and added to pesticide standard calibration solutions as well in the sample, to a final concentration of 0.100 mg kg−1. Matrix-matched calibration (MMC) curves were prepared using the most appropriate blank matrices for each sample type, following the grouping of commodities according to the SANTE/11312/2021-v1 and -v2 [24,25] to ensure accurate quantification. The blank matrices used for MMC curves and to determine recovery % were selected among samples previously analyzed and confirmed to be free of quantifiable pesticide residues. For FV commodities and various oil samples, the corresponding pesticide-free matrix was used directly. For tomato-based processed commodities, a pesticide-free fresh tomato matrix was used. For GC analysis, MMC curves were prepared at concentrations of 0.250, 0.100, 0.075, 0.050, 0.025, 0.010 and 0.005 mg kg−1, while for LC analysis, concentrations ranged from 0.150, 0.125, 0.100, 0.075, 0.050, 0.025, 0.010, 0.005 and 0.001 mg kg−1. The considered ranges for MMC curves were selected considering the framework of European legislation for pesticides residues in FVs samples and then they were used for the validation method, analyzing each level in triplicate.

2.2. Sampling and Sample Preparation

All extraction procedures were developed and carried out using a TX4 Digital vortex mixer (Velp Scientifica, Usmate Velate, Italy), a BKC-DL5M centrifuge (BiobaseMeihua Trading Co., Ltd., Jinan, China) and an automated solvent evaporation system TurboVap® II (Biotage AB, Uppsala, Sweden).
The QuEChERS approach, involving extraction with ACN and partitioning with salt solutions, was used as the sample preparation technique. Specifically, following extraction salts QuEChERS QuE-Lab® EN15662 Citrate LLE Tube and purification salts QuE-Lab® EN15662 PSA/C18 dSPE Tube, QuE-Lab® EN15662 PSA dSPE Tube, QuE-Lab® EN15662 PSA/GCB+ dSPE Tube, and QuE-Lab® EN15662 PSA/GCB dSPE were used, in compliance with UNI EN 15,662 [29]. All materials were supplied by Lab Instruments S.r.l. (Castellana Grotte, BA, Italy).
All samples were collected from both analytical official controls and research activities performed by OfL of IZSPB. A total of 101 fruit samples were analyzed during the study period. Specifically, 12 samples were collected in 2022, 35 in 2023, 33 in 2024, and 21 in 2025. A total of 69 vegetable samples were collected throughout the monitoring period: 7 in 2022, 25 in 2023, 20 in 2024, and 17 in 2025. Regarding processed commodities, including edible oils and tomato derivatives, accounted for 28 samples overall, distributed as follows: no processed samples were collected in 2022, while 12 were analyzed in 2023, 12 in 2024, and 4 in 2025. The detailed distribution of samples by product type and year is presented in Table S3. The sampling plan was defined annually by the competent regional authorities according to regulatory priorities, commodity seasonality, and available resources under Regulation (EU) 2017/625 [20], and was therefore not modifiable by the laboratory. The progressive increase in the number of samples over four years also reflects the analytical scope extension resulting from to the validation and accreditation of additional pesticide/matrix combinations, so commodities previously excluded have gradually become accessible for analysis.
Approximately 60% of the samples came from large-scale distribution, including both EU and non-EU products, while the remaining 40% came from locally sourced raw materials deriving from national and regional production chains. These local products represent commodities with complete Italian supply chains, ensuring traceability from farm to market and enabling comparison of compliance between domestic and imported products.
For each fruit and vegetable matrix, the corresponding protocol described in UNI EN 15662 [29] was applied, taking into account the matrix-specific characteristics. Briefly, an appropriate amount of homogenized sample was weighed into 50 mL polypropylene tubes, and 10 mL of ACN was added. For some FVs samples, the addition of water was required. The solution was vortexed for 10 min and then centrifuged at 3500× g for 10 min at 4 °C. Subsequently, QuE-Lab® EN15662 extraction salts were added, the mixture was vortexed again for 10 min and centrifuged under the same conditions. After extraction, 6 mL of the supernatant was purified using the appropriate purification salts. The tube was vortexed for 10 min and centrifuged at 3500× g for 10 min at 4 °C. For GC-QqQ-MS analyses, 4 mL of the clear supernatant was evaporated under a gentle stream of nitrogen at 45 °C. The dry residue was then dissolved in 1 mL of a PCB 209 solution at a concentration of 0.100 mg kg−1 in isooctane and injected into the GC-MS/MS system. For LC-MS analyses, 4 mL of clear supernatant was diluted 70:30 (v/v) with H2O and then analyzed. This dilution was applied to minimize matrix effects [30]. During the 2022–2025 period, our laboratory participated in EUPTs-FV for different matrices, specifically kiwi (EUPT-FV27, 2025), banana (EUPT-FV26, 2024), melon (EUPT-FV25, 2023), and tomato (EUPT-FV24, 2022). All sample analyses were performed in triplicate, and pesticide concentrations were determined by interpolation from the corresponding external MMC curves.

2.3. Gas Chromatography Coupled to Triple Quadrupole Mass Spectrometry (GC-QqQ-MS/MS) Analysis

GC-QqQ-MS/MS analyses were performed on a Thermo Scientific TSQ EVO 8000 GC system equipped with a triple quadrupole mass spectrometer (Thermo Fisher Scientific, Waltham, MA, USA). The temperature of the ion source and transfer-line were 260 °C and 250 °C, respectively. GC analysis was carried out in the monitoring reaction mode. The presence of at least two significant MS/MS transitions was used to identify analytes. For each pesticide, the m/z values for the MS/MS transitions have been fixed based on what was reported in the official European documents [23]. The selected diagnostic ions are shown in Table S1. The chromatographic separations were performed using the capillary column Rxi-5ms (30 m × 0.25 mmID × 0.25 μm) from RESTEK Pure Chromatography (Bellefonte, PA, USA). A sample volume of 1.5 μL was injected by programmed temperature vaporizing in splitless mode. The injector temperature started at 70 °C and after 0.05 min ramped to 260 °C at a rate of 5 °C s−1. After 1 min, a cleaning step of 5 min at 320 °C was applied. The oven temperature was initially set at 70 °C for 1.0 min and then increased to 150 °C at a rate 30 °C min−1 and to 260 °C at 6 °C min−1; a final temperature of 290 °C, reached up at a rate of 20 °C min−1, was kept for 5.0 min with a total run time of 28.0 min. The flow rate of the carrier gas (Helium, 99.999%, pressure-pulse mode: 30 psi for 1 min) was 1.0 mL min−1. Data acquisition and processing were carried out using TraceFinder EFS 4.1 SP1 software (Thermo Fisher Scientific, Waltham, MA, USA).

2.4. Ultra-High-Performance Liquid Chromatography Coupled to Heated Electrospray Ionization-Quadrupole Orbitrap Mass Spectrometry (UHPLC-HESI-Q-Orbitrap-MS) Analysis

An UHPLC Ultimate 3000 system equipped with a binary pump and a WPS-3000 TSL autosampler (Thermo Fisher Scientific, Waltham, MA, USA) was used for this study. FV extracts were separated using a core–shell Kinetex® EVO C18 column (2.1 × 100 mm, 2.6 µm, 100 Å) coupled with an EVO C18 security guard column (2.1 × 2 mm, sub-2 µm; Phenomenex, Torrance, CA, USA). The column compartment was maintained at 40 °C, and the flow rate was set to 0.250 mL min−1. A binary gradient elution was performed using H2O as the mobile phase A and MeOH as mobile phase B, both containing 4 mM NH4HCO2 and 0.1% HCOOH. The gradient program was as follows: 0–0.5 min, 5% B; 0.5–8.0 min, linear increase from 5% to 99% B; 8.0–11.0 min, held at 99% B; 11.0–11.5 min, return to 5% B; 11.5–16.0 min, column washing and re-equilibration. The total run time, including re-equilibration, was 16 min. The sample tray was maintained at 15 °C, and the injection volume was 5 µL. A Q-Exactive Focus Orbitrap Mass Spectrometer (Thermo Fisher Scientific, Waltham, MA, USA) equipped with a heated electro-spray ionization (HESI) source was used for the detection of all pesticides. All MS experiments were performed in positive ion mode. The source parameters were as follows: spray voltage of 3.5 kV, the temperature of capillary was set at 300 °C. The parameters of the HESI interface and of the ion optics of the Q-Exactive spectrometer were set as follows: sheath gas flow rate, 35 Arb; auxiliary gas flow rate, 10 Arb; sweep gas, 0 Arb; spray voltage, 3.50 kV; capillary temperature, 300 °C; S-lens RF level, 50 a.u.; aux gas heater temperature, 250 °C. The Orbitrap mass analyzer operated in Data Dependent Acquisition (TOP 3) at a resolving power of 70.000 in full scan (scan range: 60–900 m/z; automatic gain control target: 1 × 10⁶) and at a resolution of 17.500 in MS2 scan (automatic gain control target: 2 × 10⁵). HCD fragmentation was carried out with stepped normalized collision energy in the range of 2–65, maximum injection time at 80 ms, precursor isolation window at 1.2 m/z and dynamic exclusion at 4.0 s. Table S2 provides the inclusion list with a mass accuracy of 3 ppm, reporting the selected m/z values of adducted ions for the targeted pesticides. LC-MS data acquisition was performed using Xcalibur 4.1, while data processing and analysis were carried out using FreeStyle 1.6 and TraceFinder EFS 4.1 SP1 software (Thermo Fisher Scientific, Waltham, MA, USA).

2.5. GC-QqQ-MS/MS and UHPLC-HESI-Q-Orbitrap-MS Methods Validation and Quality Control

The OfL of the IZSPB is ISO/IEC 17025 [31]-certified for the analysis of pesticide residues in foodstuffs, including FVs samples, using both GC-QqQ-MS/MS and UHPLC-HESI-Q-Orbitrap-MS systems. A total of 96 pesticide residues were included in the GC-QqQ-MS/MS method (Table S1), whereas 262 compounds were detected in the UHPLC-HESI-Q-Orbitrap-MS method (Table S2). Among them, 66 pesticides were common to both analytical platforms, confirming that the two techniques provide partially overlapping but highly complementary coverage. The two analytical methods were validated according to the requirements of the previous versions of the SANTE/11312/2021 [24,25]. The following validation parameters were evaluated as key criteria: the linearity of MMC curves, selectivity, precision, percentage recoveries, the LOD and LOQ values. The coefficients of determination (R2 values) of the MMC curves were used to assess linearity. The significance of the slope (b) of the regression line obtained from each MMC curve was verified at α = 0.05 using a t-test. Student’s t was calculated as the ratio sb/b, where sb was the standard deviation of the slope b of MMC curves, obtained for each of the studied pesticide. Selectivity was ensured by using specific SRM transitions and labeled standards for GC-MS analyses, and by employing accurate mass detection and characteristic fragment ions for UHPLC-HESI-Q-Orbitrap-MS, with both approaches verified through analyses of spiked matrices. The absence of significant interferences in the maximum tolerance range of ±0.15 min for analyte retention times compared to a spiked sample was verified. The specificity tests for both methods were carried out on a wide range of sample items, including fruits with and without peel, small fruits and berries, tomatoes, stone fruits, citrus fruits and melons, as well as vegetables such as cucumbers, carrots, sweet peppers, courgettis, beans with pods, and leafy greens like spinach. Accuracy, expressed as percentage recovery, and precision, expressed as the relative standard deviation (RSDr), were determined by analyzing spiked samples at three concentration levels (0.005, 0.010, and 0.015 mg kg−1), with each procedure repeated six times for representative items of different commodities, including both high- and medium-water-content matrices. LODs and LOQs were calculated as LOD = 3.3 × sa/b and LOQ = 10 × sa/b, where sa is the standard deviation of the MMC curve intercept. Quality control was ensured through the use of blank matrices, MMC curves, and spiked quality assurance (QA) materials analyzed with each batch. QA materials were prepared by adding known concentrations of target pesticides to pesticide-free blanks, yielding recoveries between 70% and 120%, with RSDr below 20% and an expanded uncertainty ≤ 25%. Instrumental performance and procedural reliability were monitored through retention time checks, standard concentration verification (±20%), and duplicate analyses.

2.6. Risk Exposure

Chronic (long-term) dietary exposure to pesticides was assessed by integrating fruit and vegetables consumption data with the pesticide residue concentrations measured in the study area during the current monitoring program conducted between 2022 and 2025. The reference data on the average daily consumption of these two commodity groups, i.e., fruit and vegetables, by the Italian population were obtained from the IV SCAI 2017–2020 report [32]. The IV SCAI (Studio sui Consumi Alimentari in Italia), conducted by CREA (Consiglio per la ricerca in agricoltura e l’analisi dell’economia agraria), between June 2017 and January 2020, represents the most recent national survey aimed at assessing the nutritional status and food consumption habits of the Italian population. This survey was carried out within the European framework EU Menu, following the harmonized methodologies recommended by the EFSA for food consumption data across the Member States of the European Union [33,34]. According to EFSA’s EU Menu guidelines for exposure assessment, the population was divided into six age groups for the children and adult survey, i.e., infants (3–11 months), toddlers (1–2 years), other children (3–9 years), adolescents (10–17 years), adults (18–64 years), and elderly (65–74 years) [34]. The contribution of FVs to the total diet, as reported by the IV SCAI 2017–2020 survey, together with the default body weights defined according to EFSA harmonized values and used for exposure calculations, are summarized in Table S4 [33,35]. The estimated daily intake (EDI, mg kg−1 per day) for the two commodities, was calculated according to Equation (1), i.e., by multiplying the measured pesticide concentration (Ci, mg kg−1) by the food consumption rate (c, kg day−1) and dividing by the consumer’s body weight for each age group [36,37].
E D I = C i m g   k g 1 ×   c   ( k g   d a y 1 ) b o d y   w e i g h t   ( k g )
chronic dietary exposure risk (%ADI) expressing the hazard quotient, was obtained as the ratio between EDI and the corresponding Acceptable Daily Intake (ADI, mg kg−1 per body weight) sourced from the EU Pesticides [38,39], as reported in Equation (2).
% A D I = E D I   A D I × 100
Fruits and vegetables are considered safe for consumption if their %ADI is below 100%, while an %ADI exceeding 100% indicates a potential health risk. The %ADI are summed up to give a chronic hazard index (cHI, %) to estimate the cumulative risk (cocktail effect) when more pesticides are present in the same sample:
c H I = % A D I
When cHI is >100%; the food involved should be considered as a risk to the consumers, while values below 100 indicate that it is acceptable [40]. Although this approach assumes dose additivity and does not account for possible interactions among compounds, it represents the first-tier method recommended by EFSA for cumulative dietary risk assessment [41].
Moreover, the maximum daily consumption (MDC, kg day−1) of each food commodity was estimated [42]. The MDC represents the quantity of a specific fruit or vegetable that can be consumed daily (Table S4) by an individual without exceeding the ADI, considering the cumulative pesticide exposure expressed by the cHI. This parameter was calculated (Equation (4)) separately for each population age group (infants, toddlers, other children, adolescents, adults, and elderly), considering the specific consumption rates of fruits and vegetables reported in the IV SCAI 2017–2020 survey [32] for each commodity in which more than one pesticide residue was detected:
M D C   k g   d a y 1 = c   ( k g   d a y 1 ) c H I
MDC values provide a useful tool for dietary guidance and public health management, translating the risk assessment into concrete consumption recommendations for different population group.

3. Results

3.1. Validation of GC-QqQ-MS/MS and UHPLC-HESI-Q-Orbitrap-MS Methods

The validation parameters for GC-QqQ-MS/MS and UHPLC-HESI-Q-Orbitrap-MS, shown in Tables S5 and S6, respectively, met the acceptance criteria requirements described in SANTE/11312/2021 [24,25] and in Commission Implementing Regulation (EU) 2021/808 [43].
For the GC-QqQ-MS/MS method, which was applied to apple matrices, R2 values ranged between 0.981 and 0.999, demonstrating good linearity across the calibration range for all analytes. LODs and LOQs were typically lower than 0.005 mg kg−1 and 0.015 mg kg−1, respectively, ensuring adequate sensitivity for trace-level pesticide determination in compliance with current EU regulatory limits. The t sb/b values were consistently below 0.12, confirming good method robustness and repeatability. Mean recoveries were within the 70–120% acceptability range recommended by the guidance document for almost all compounds, while RSDr were mostly below 20%, indicating good precision (Table S5). Moreover, this GC-QqQ-MS/MS method delivered excellent performance for alpha-cypermethrin, a key isomer of cypermethrin, a synthetic type II pyrethroid insecticide with the ISO common name (RS)-α-cyano-3-phenoxybenzyl (1RS,3RS;1RS,3SR)-3-(2,2-dichlorovinyl)-2,2-dimethylcyclopropanecarboxylate.
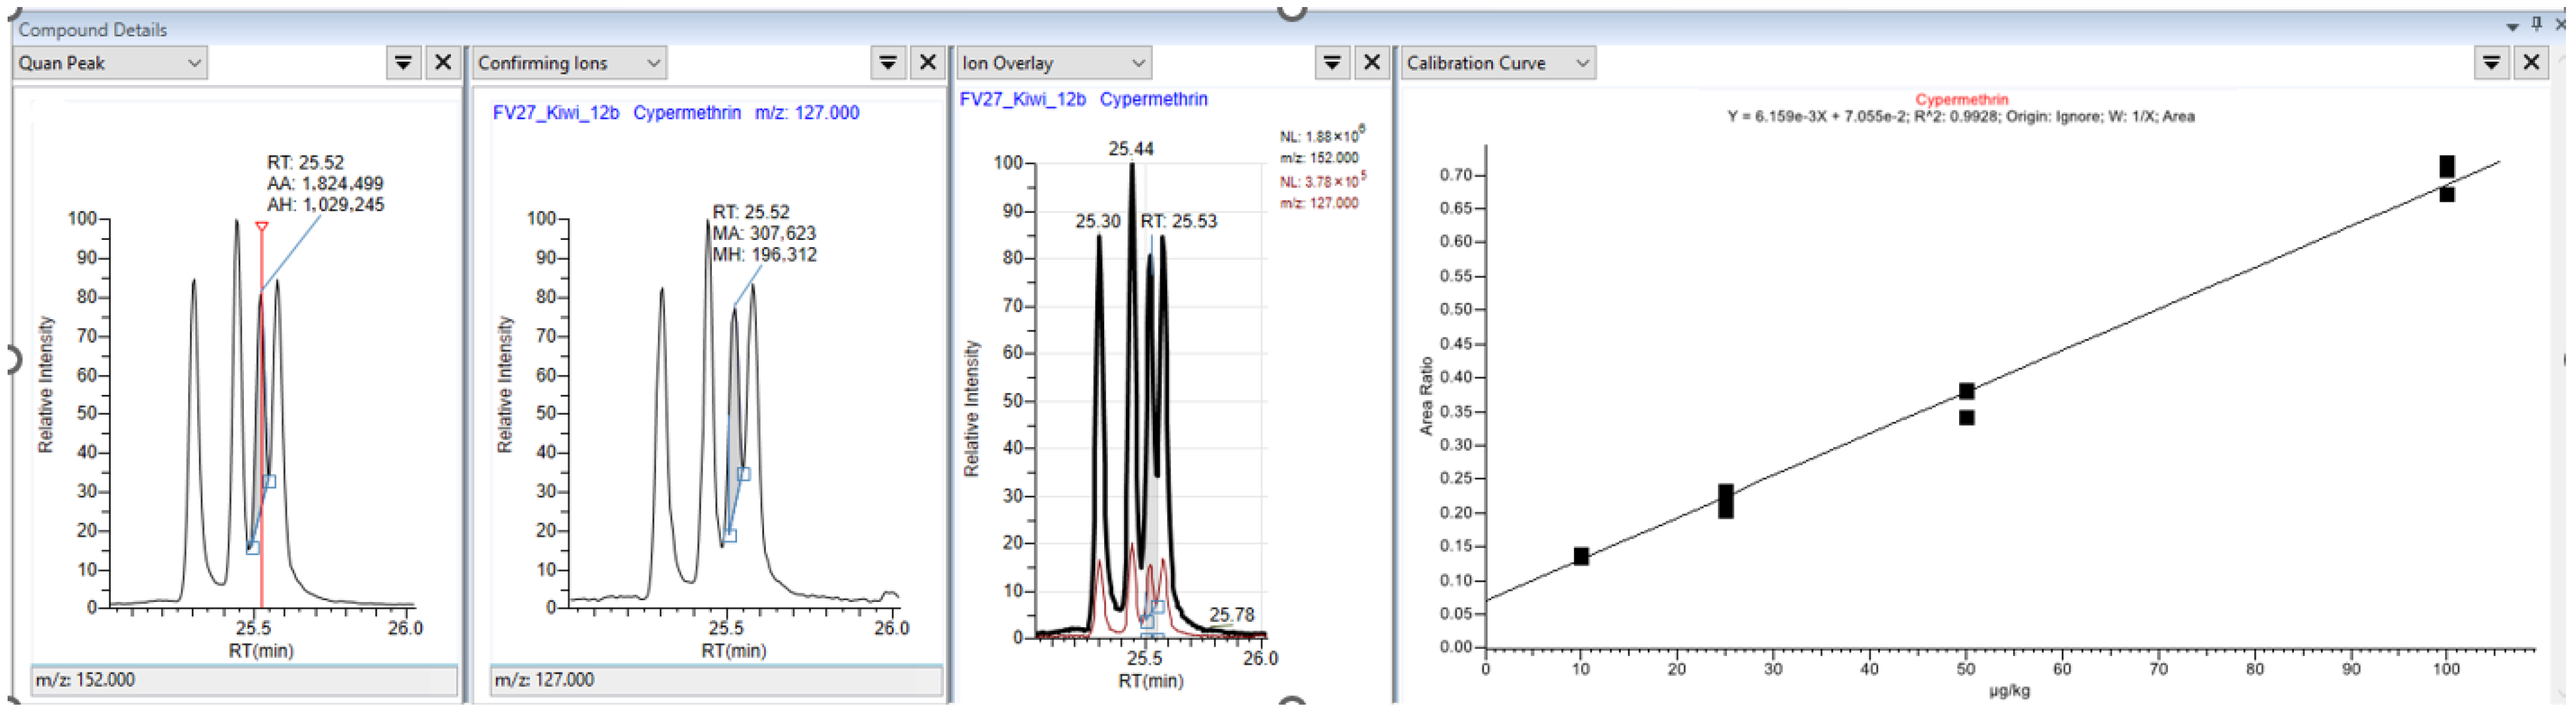
Cypermethrin exhibits pronounced stereochemical complexity due to the presence of three stereogenic carbon centers, resulting in eight optical isomers arranged into four pairs of diastereomers. These isomers differ markedly in their biological activity and toxicological potency, and selected isomeric compositions are marketed as distinct active substances under individual ISO common names, including alpha-, beta-, theta-, and zeta-cypermethrin [44]. Alpha-cypermethrin, consisting of two of the four cis-isomers of cypermethrin, is a recognized environmental pollutant, moderately persistent in soil and toxic to mammals (WHO Class II-III), and a known irritant [45,46]. According to Regulation (EC) No 396/2005, the EC mandated EFSA to evaluate MRLs for alpha-cypermethrin and to review existing MRLs for cypermethrin based on toxicological reference values [47]. The technical mixture of cypermethrin consists of four enantiomeric pairs, yielding four diastereomeric peaks, with the last two often co-eluting (Figure S1). Although chiral liquid chromatography can effectively separate the enantiomers within each pair [48], such approaches remain highly specific and are not easily applicable in routine methods for multiresidue analysis, where maintaining comprehensive coverage and analytical throughput is essential. In this study, the cypermethrin isomers were successfully separated overcoming co-elution issues, allowing accurate quantification of alpha-cypermethrin at trace levels, with a LOD of 0.0053 mg kg−1, a LOQ of 0.0159 mg kg−1, and a recovery of 87.3% with a RSDr of 11.6%. Figure 1 shows the chromatographic separation of the four cypermethrin isomers in the EUPT-FV27 proficiency test sample, with the third peak corresponding to alpha-cypermethrin. The peak overlap shows as this isomer is resolved from co-eluting compounds demonstrating the method’s selectivity and accuracy at trace levels. The method’s reliability for alpha-cypermethrin was confirmed by z-score of 0.4 in EUPT-FV27, where this compound was included for the first time as a voluntary target pesticide in a fruit matrix.
Similarly, the UHPLC-HESI-Q-Orbitrap-MS validation parameters demonstrated satisfactory linearity, with R2 values above 0.982 for all the 262 tested compounds (Table S6). The LODs ranged from 0.001 to 0.034 mg kg−1, and LOQs from 0.003 to 0.085 mg kg−1, confirming the high sensitivity of the high-resolution mass spectrometry platform. Recovery values were generally within 70–120%, with RSDr < 20% for most analytes, supporting method accuracy and repeatability. The obtained t sb/b values (<0.05 for the majority of analytes) further support the robustness of calibration models.
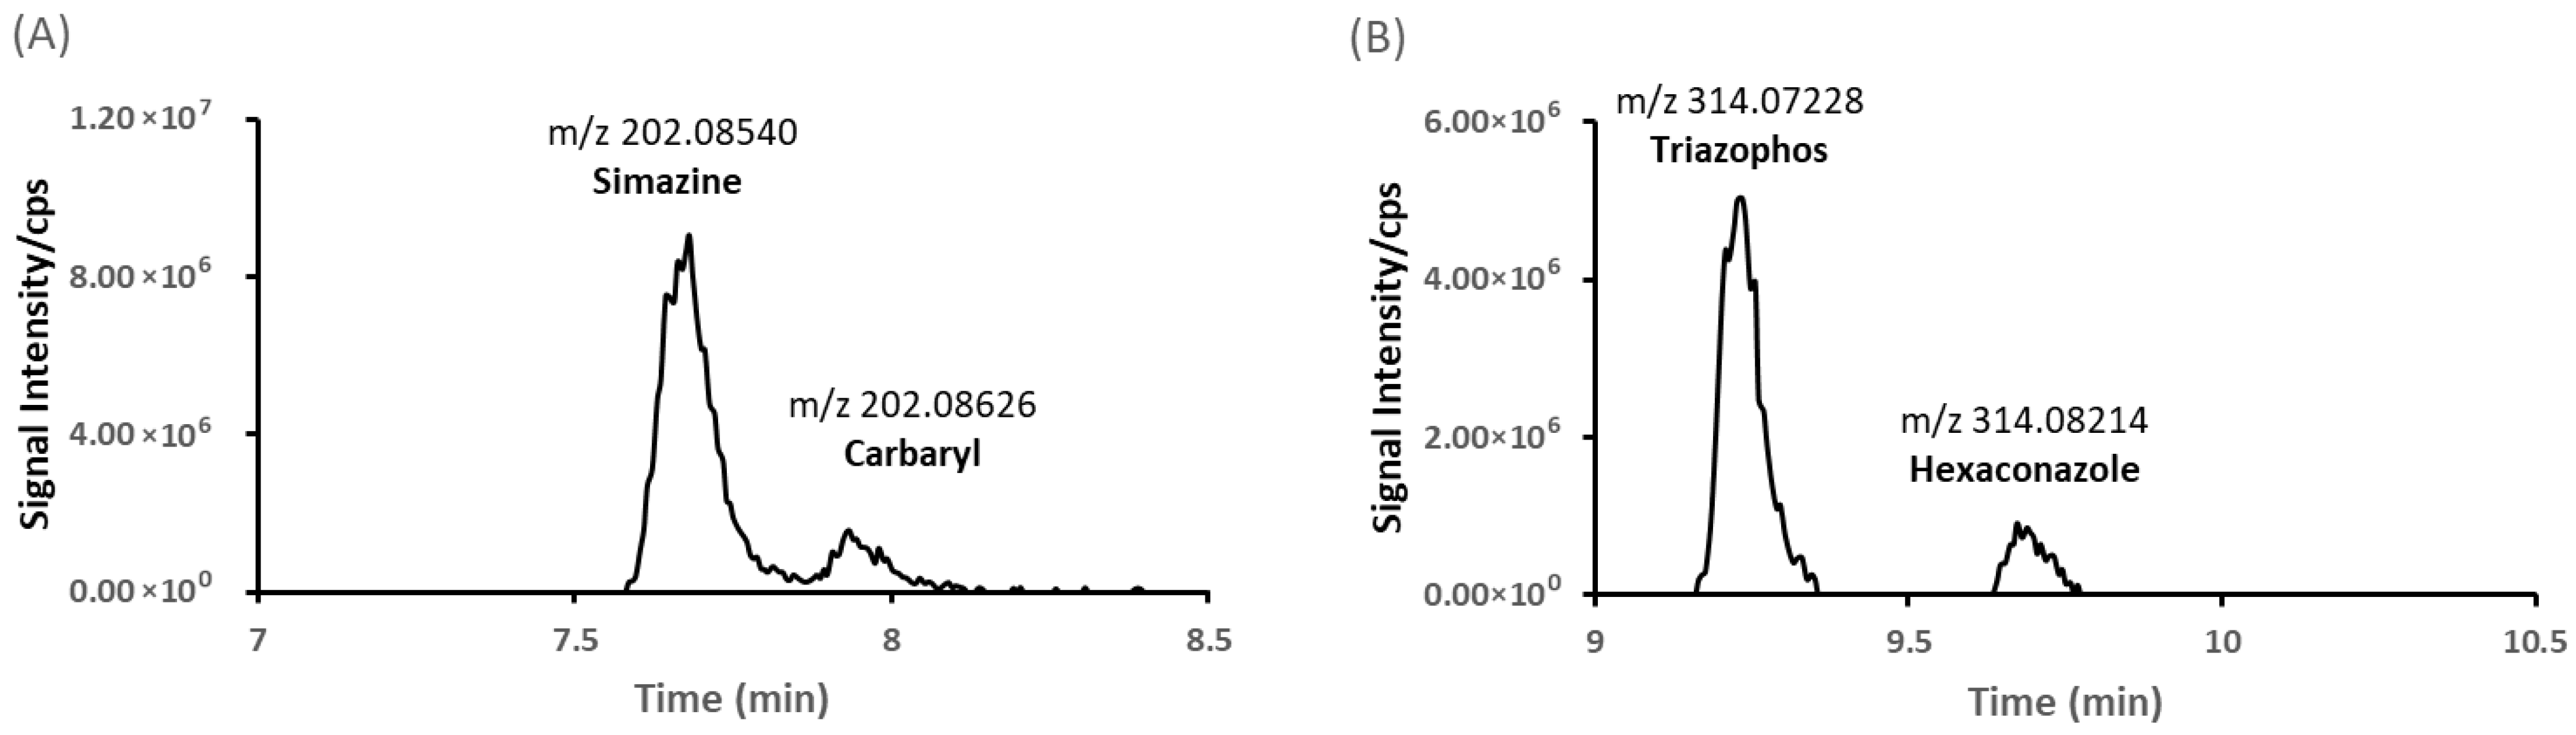
High-performance chromatography, combined with the high mass accuracy of the Orbitrap analyzer, was essential for resolving isobaric pesticides and enabling reliable multi-target analysis [49]. As reported in Table S2, several compounds exhibited isobaric or quasi-isobaric behavior, characterized by identical or very close accurate-mass values (Δm < 5 mDa). Typical examples include enantiomeric or stereoisomeric pairs such as cis/trans-Bromuconazole and Fenvalerate/Esfenvalerate, as well as purely isobaric species such as Simazine/Carbaryl (m/z 202.08540; m/z 202.08626) and Triazophos/Hexaconazole (m/z 314.07228; m/z 314.08214). Figure 2 shows the extracted ion chromatograms of the isobaric species, namely m/z 202.08540 for Simazine and m/z 202.08626 for Carbaryl, and m/z 314.07228 for Triazophos and m/z 314.08214 for Hexaconazole, obtained by UHPLC-HESI-Q-Orbitrap-MS analysis in a spiked banana sample at 0.010 mg kg−1. These compounds cannot be distinguished by exact-mass detection alone and therefore require chromatographic separation for unambiguous identification. The high resolving power of the Orbitrap and the optimized retention-time alignment ensured accurate discrimination, as evidenced by the absence of overlapping peaks (Figure 2).
The reliability of both methods was further confirmed by |z-scores| ≤ 2.0 obtained in the four EUPTs-FV, all of which were evaluated positively (Figure 1 and Figure S2). Ongoing validation and the progressive inclusion of additional pesticides between 2022 and 2025 gradually expanded the method’s scope, increasing coverage from less than 40% of the target pesticide list in EUPT-FV24 to more than 90% in EUPT-FV27, including all mandatory pesticides.

3.1.1. Monitoring 2022–2025

During the 2022–2025 monitoring period, a total of 198 samples were analyzed, including 101 fruits (51%), 69 vegetables (35%), and 28 processed products (14%). The sampled commodities mainly reflected frequently consumed fruit and vegetable products in Southern Italy. Fruit samples mainly included tomatoes, strawberries, apples, bananas and kiwis, whereas vegetable samples consisted primarily of cabbages, courgettis, sweet peppers, cucumbers and turnips. Among all analyzed samples, 76.8% showed no quantifiable residues (<LOQ), while 23.2% (46 samples) contained detectable pesticide residues below the MRLs, established by Regulation (EC) No. 2005/396 [14], as reported in Table 1. However, quantifiable residues (concentrations ≥ LOQ) were detected in a limited number of samples, with pesticide contamination observed in 29 of 101 fruit (28.7% of the total) and 17 of 69 vegetable samples, while all 28 processed items were free of detectable residues. Among the contaminated samples, 30 contained only a single pesticide residue, while multiple residues were found in the remaining 16 samples, predominantly in fruits (13 samples with more than two pesticides) compared to vegetables (3 samples with more than two pesticides). Commodities with multiple residues included fruits such as strawberries, cherries, tomatoes, apricots, peaches, and apples, and in vegetables including peppers, cucumbers, courgettis, and cauliflowers.
Among fungicides, Azoxystrobin (a strobilurin) was the most frequent, detected in 13 samples across fruits (e.g., strawberries, bananas, tomatoes) and vegetables (e.g., carrots, sweet peppers, turnips, cauliflowers), with levels ranging from 0.04 ± 0.001 mg kg−1 to 1.083 ± 0.274 mg kg−1. Difenoconazole (triazole) appeared in 12 samples, including pears (0.0103 ± 0.0005 mg kg−1) and cauliflowers (0.562 ± 0.239 mg kg−1), showing generally higher concentrations in vegetables than fruits (e.g., spinach, sweet peppers, cauliflower, and carrots). Boscalid (SDHI fungicide) was detected in 11 samples, ranging from 0.012 ± 0.003 to 0.290 ± 0.128 mg kg−1. Cyprodinil (anilinopyrimidine fungicide) occurred in 8 samples, ranging from 0.016 ± 0.0003 mg kg−1 in pears to 0.132 ± 0.062 mg kg−1 in courgettis. Tebuconazole (triazole fungicide) was detected in 7 fruit samples: strawberries (0.013 mg kg−1), apples (0.053 mg kg−1), apricots (0.013 mg kg−1), peaches (0.036 mg kg−1), and plums (0.017 mg kg−1).
A particularly notable finding was the detection of Dieldrin in two cucumber samples of Italian origin, locally produced, analyzed in 2025 (0.013 ± 0.001 mg kg−1 and 0.004 ± 0.001 mg kg−1). In the first sample, Dieldrin was detected at 0.013 ± 0.001 mg kg−1, within the default MRL of 0.02 mg kg−1, while heptachlor epoxide, cis- (0.010 ± 0.001 mg kg−1), was at the default MRL of 0.01 mg kg−1. Dieldrin is a chlorinated cyclodiene insecticide belonging to the organochlorine class, whose agricultural use has been prohibited in the EU since the early 1990s under Council Directive 79/117/EEC and subsequently confirmed as a persistent organic pollutant under the Stockholm Convention, to which the EU is a signatory party [50,51]. Similarly, Heptachlor and its metabolites, i.e., Heptachlor Epoxide, cis- and trans- are listed among the twelve initial POPs subject to global elimination. Both compounds are characterized by high environmental persistence, lipophilicity, and bioaccumulation potential in food chains, and are recognized as probable human carcinogens by the International Agency for Research on Cancer. Given their banned status, no ADI has been established for either substance by EFSA or the EU Pesticides Database. Nevertheless, MRLs are defined in food commodities under Regulation (EC) No. 396/2005 [14]. In particular, the MRL for the sum of aldrin and dieldrin (expressed as dieldrin) in cucumber is set at 0.02 mg kg−1, while the MRL for the sum of heptachlor and heptachlor epoxides (expressed as heptachlor) corresponds to the default value of 0.01 mg kg−1. These detections are most plausibly attributable to the long-term persistence of legacy organochlorine residues in agricultural soils that were previously treated with these compounds, rather than to any recent deliberate application, since both substances have been banned for decades. Indeed, Dieldrin can persist in soil for several years, and can be taken up by root vegetables and cucurbits from contaminated soils [52]. Nevertheless, other sources, such as cross-contamination or unverified origin, cannot be entirely excluded in the absence of confirmatory soil or source analysis.
In Table 1, it can be highlighted the slight increase in 2024 coincides with an expansion in the number of matrices analyzed, especially within imported commodities. In contrast, local produce consistently exhibited higher compliance rates (>97%), confirming the effectiveness of regional good agricultural practices. Across all investigated commodities, the results indicated adherence to good agricultural practices across EU-Italy and extra-EU origins like Albania, Türkiye, Ecuador, and Moldova.
Moreover, the findings align with the most commonly employed pesticides in fruit and vegetable cultivation [38,53], reflecting prevailing patterns in the use of fungicides and insecticides. Stone fruits (peaches, apricots, cherries) and berries showed highest contamination frequency, vegetables like cauliflowers (Azoxystrobin/Difenoconazole) and peppers (multi-residues) reflected intensive fungicide use. Fungicides were the most represented category, followed by insecticides and herbicides. The predominance of fungicides reflects their extensive use in high-humidity environments and post-harvest protection, particularly in strawberries, tomatoes, and kiwis. Notably, organophosphates and pyrethroids remained among the most frequently encountered insecticides [53], though at concentrations well below MRLs.

3.1.2. Dietary Exposure and Risk Assessment

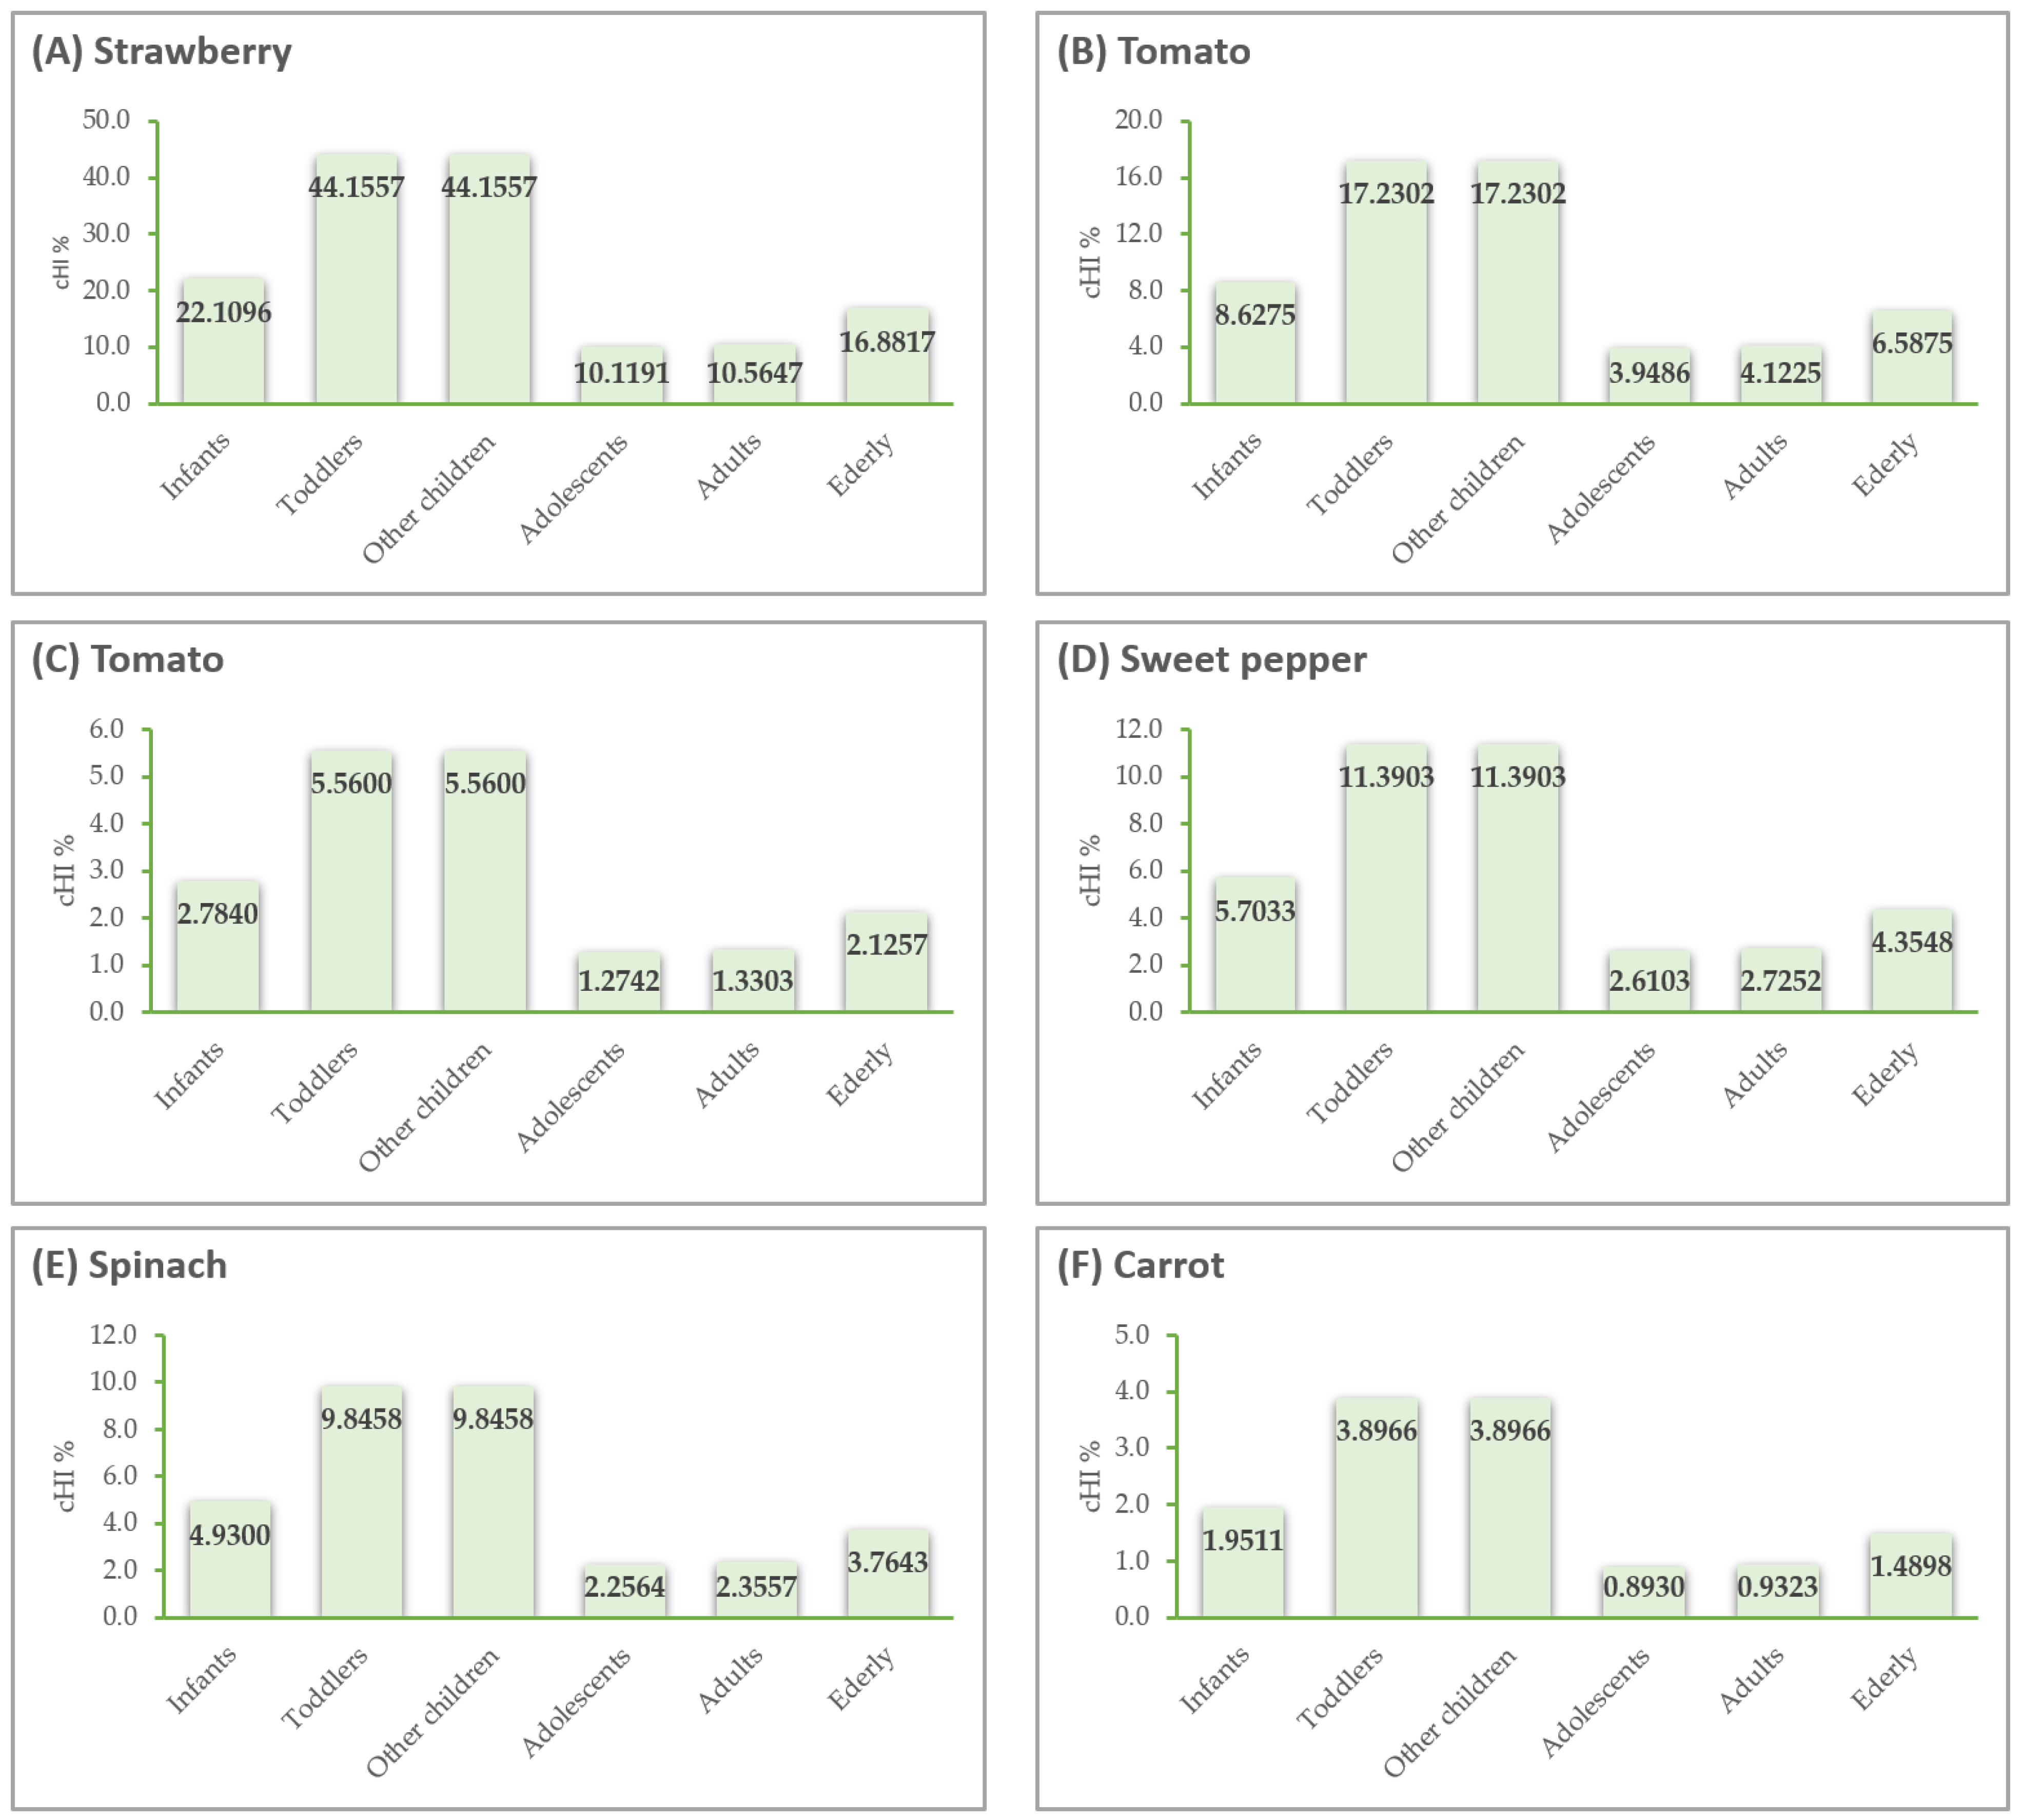
Most of the analyzed samples showed no quantifiable pesticide residues; therefore, the dietary exposure assessment was performed considering only those active substances detected at concentrations above their LOQs but below the MRLs (Table 1). The EDI (Table S7), %ADI (Table 2), and cHI (Table S8 and Figure 3, Figures S3 and S4) were calculated according to Equations (1)–(3). These calculations integrated the mean residue concentrations with the food consumption data from the IV SCAI 2017–2020 survey (see Table S4 for demographic and consumption details). The EDI values for both fruit and vegetable products remained well below the corresponding ADI thresholds (Table S7), indicating negligible chronic exposure across all population groups in this study, based on the obtained outcomes. Moreover, the %ADI values reported in Table 2 were consistently low across all demographic groups, with most pesticide/commodity combinations remaining well below 10% and none exceeding the maximum threshold of 100%, confirming that chronic dietary exposure remained below toxicological reference levels for all population categories. However, as expected from the relationship between food consumption rates and body weights, toddlers and other children consistently exhibited the highest %ADI values across all the combinations, followed by infants, adolescents, adults, and the elderly. This pattern reflects the higher relative food intake per unit of body weights in younger age groups and aligns with established risk assessment principles. Among fruit samples, the highest %ADI values were observed for Cypermethrin in cherries (11.82% in toddlers and other children; 5.92% in infants), Boscalid in peach (8.40% in toddlers and other children), and Boscalid in apricot (6.02% in toddlers and other children). Notably, two cases exhibited relatively elevated %ADI values. Difenoconazole in strawberry reached 43.67% of the ADI in toddlers and other children, with values ranging from 10.45% to 21.87% in other age groups, while Difenoconazole in tomato reached 15.99% in toddlers and other children (8.00% in infants). Among vegetables, Difenoconazole in cauliflower represented the single highest %ADI value recorded in the entire dataset, reaching 65.10% in toddlers and other children and 32.60% in infants, while Azoxystrobin in cauliflower reached 6.27% in the same age group. The cHI values reported in Table S8 integrate the simultaneous exposure to multiple pesticide residues co-occurring in the same commodity, thereby providing a more comprehensive estimate of cumulative risk. For most samples and demographic groups, cHI values were below 20%, indicating negligible combined risk. However, several multi-residue combinations yielded cHI values substantially above 15% up to 44%, predominantly in the youngest age groups. The most critical scenario involved the strawberry sample with the highest %ADI values, co-contaminated with Difenoconazole, Boscalid, and Azoxystrobin, producing cHI values of 44.16% in toddlers and other children, 22.11% in infants, and ranging from 10.56% to 16.88% in other age groups, as shown in Figure 3A. Similarly, tomato with Boscalid and Difenoconazole yielded cHI values of 17.23% in toddlers and other children and 8.63% in infants (Figure 3B). Among vegetables, sweet pepper contaminated with Difenoconazole, Metconazole, and Tebuconazole showed cHI values of 11.39% (toddlers and other children) and 5.70% (infants) (Figure 3D), while spinach with Difenoconazole and Deltamethrin reached 9.85% and 4.93% in the same groups, respectively (Figure 3E). The higher %ADI and cHI values associated with Difenoconazole are primarily due to its frequent use as a systemic triazole fungicide [54,55] and its relatively low ADI (0.01) compared with the measured residue concentrations, making it the main contributor in all case. The MDC values reported in Table S9, calculated according to Equation (4), permitted to translate the cumulative risk estimates into practical consumption thresholds, expressing the maximum daily quantity of each commodity that can be consumed without exceeding the ADI given the detected multi-residue contamination. For all vegetable samples (sweet pepper, spinach, and carrot), MDC values were largely and consistently above the average daily vegetable intake across all six-age group [32,35], confirming a wide safety margin for these commodities regardless of the population category considered. Among fruit samples, the pattern was more articulated. The strawberry sample co-contaminated with Difenoconazole, Boscalid, and Azoxystrobin, the tomato sample containing Boscalid and Difenoconazole, the three tomato samples, apricot (Boscalid and Tebuconazole), apple (Cypermethrin, Boscalid, Tebuconazole, and Pendimethalin) and cherry (Cypermethrin and Cyprodinil) showed MDC values below the average daily fruit intake [32,35] across all six age groups, warranting specific attention. For peach (Difenoconazole and Tebuconazole) and plum (Metconazole and Tebuconazole), MDC values fell below the average intake in infants, toddlers, other children, and the elderly, while adequate margins were observed in adolescent and adult groups. Strawberry (Difenoconazole, Boscalid, and Deltamethrin), cherry (Cypermethrin and Deltamethrin), and pear (Cyprodinil and Difenoconazole) showed MDC values below the average intake only in infants, toddlers, and other children, with safe thresholds for the other age groups.

4. Discussion

The combination of the two analytical workflows ensured comprehensive chemical coverage across the broad spectrum of pesticide classes under investigation, including volatile and semi-volatile organochlorines and pyrethroids (best suited for GC analysis) and thermally labile, polar compounds such as neonicotinoids and carbamates (more appropriately determined by LC-based approaches) [26,27,28]. The successful chromatographic resolution of alpha-cypermethrin isomers, obtained in GC-QqQ-MS/MS and confirmed by z-score = 0.1 in EUPT-FV27, further demonstrates the selectivity of the validated multi-residue method. The high-resolution mass accuracy of the Orbitrap analyzer proved essential for the unambiguous discrimination of isobaric and quasi-isobaric species, including Simazine/Carbaryl (Δm = 0.86 mDa) and Triazophos/Hexaconazole (Δm = 9.86 mDa) [49]. The results of the four-year monitoring program (2022–2025), conducted on a large set of fruit, vegetable, and processed product samples from Apulia and Basilicata, indicate a high level of compliance with European pesticide legislation. The proportion of samples containing no quantifiable residues (76.8%) is consistent with the most recent EFSA European monitoring data, which reported compliance rates above 98% for samples analyzed in the EU coordinated control programs [18]. The complete absence of MRL exceedances across all analyzed commodities confirms the effectiveness of the regional analytical surveillance framework and its alignment with the objectives of the official controls. The progressive expansion of methods scope across the monitoring period, from less than 40% of target pesticides covered in EUPT-FV24 to more than 90% in EUPT-FV27, including all mandatory substances, reflects the continuous improvement strategy adopted by the OfL of IZSPB according to SANTE/11312/2021 requirements [23,24,25].
The fungicide class dominated the residue profile throughout the monitoring period, with Azoxystrobin, Difenoconazole, Boscalid, Cyprodinil, and Tebuconazole accounting for the majority of detections across both fruit and vegetable matrices. This pattern is consistent with previous monitoring studies conducted in Italy and other European countries, reflecting the intensive use of broad-spectrum fungicides, particularly for commodities highly susceptible to fungal pathogens, such as strawberries, tomatoes, stone fruits, and leafy vegetables, under the humid Mediterranean climatic conditions typical of Southern Italy [38,53,54,56]. In particular, similar residue profiles dominated by fungicides have been reported in recent regional surveillance studies conducted in other Italian regions and European countries, including Sicily (Southern Italy) and Romania, where Azoxystrobin, Boscalid, and Difenoconazole were likewise among the most frequently detected active substances [38,53]. The detection of pyrethroid insecticides such as Cypermethrin and Deltamethrin, predominantly in stone fruits and berries is equally coherent with established crop protection practices, as these active substances are routinely applied to control lepidopteran and hemipteran pests during fruit development [56]. Anyway, the presence of all detected residues at concentrations below the respective MRLs, and in several cases at levels approaching the LOQ, suggests correct adherence to pre-harvest intervals and recommended application dosages by agricultural operators in the region.
A geographically relevant observation concerns the slightly higher frequency of quantifiable residues in imported commodities (approximately 60% of the total sample set) compared with locally produced items, which exhibited compliance rates exceeding 97%. This finding aligns with EFSA’s annual reports highlighting the comparatively higher non-compliance rates in products of extra-EU origin [18], and underscores the importance of reinforced import controls under Regulation (EU) 2017/625 [20]. Therefore, the high compliance rate of products from Apulia and Basilicata, reflects the efficiency of regional agronomic management and targeted pesticide use within a well-regulated national framework.
Regarding dietary exposure, the EDI (Table S7) values calculated for both fruit- and vegetable-based commodities across all demographic groups were consistently well below the respective ADI thresholds, confirming the absence of chronic risk attributable to individual active substances. The %ADI values remained below 10% for the vast majority of pesticide/commodity combinations, with the notable exceptions of Difenoconazole, as single residue, in cauliflower (up to 65.10% in toddlers and other children) and in strawberry (up to 43.67%) and tomato (up to 15.99%), and of Cypermethrin in cherry (up to 11.82%) and Boscalid in peach (up to 8.40%) in the same age groups (Table 2). Toddlers and other children consistently exhibited the highest exposure, a result expected from the relationship between relative food intake and body weights that is well established in deterministic dietary risk assessment frameworks [34,35]. The cHI values (Table S8), which integrate the simultaneous co-occurrence of multiple residues in the same commodity, remained below 20% for the majority of multi-residue samples. Elevated cHI values were observed for some samples: strawberry contaminated with Difenoconazole, Boscalid, and Azoxystrobin (cHI up to 44.16% in toddlers), tomato with Boscalid and Difenoconazole (cHI up to 17.23%), sweet pepper with Difenoconazole, Metconazole, and Tebuconazole (cHI up to 11.39), and spinach with Difenoconazole and Deltamethrin (cHI up to 9.85%) (Figure 3). In all cases, Difenoconazole was the dominant contributor to cumulative risk, driven by its comparatively low ADI (0.01 mg kg−1 bw·day) relative to the detected residue concentrations. However, these values must be interpreted within the conservative framework of the deterministic assessment methodology, which relies on mean residue concentrations and average food consumption data and therefore tends to overestimate actual consumer exposure [40]. Furthermore, all residue concentrations underlying the cHI calculations were below the legally established MRLs, and all %ADI and cHI values remained below the safety threshold of 100%, confirming the absence of unacceptable chronic risk from both cumulative exposure and individual substances across all population groups.
Moreover, the MDC (Table S9) values are an additional tool for estimating dietary risk in practical in relation to actual dietary habits. For all vegetable commodities, MDC values exceeded the average daily vegetable intake by a wide margin across every age group, confirming the absence of concern for sweet pepper, spinach, and carrot even under the conservative deterministic framework applied. Among fruit samples, the comparison with average consumption data revealed a more critical scenario than considering individual cHI values. The combinations in specific samples, i.e., strawberry (Difenoconazole, Boscalid, and Azoxystrobin), tomato (Boscalid and Difenoconazole), tomato (Azoxystrobin and Difenoconazole), tomato (Boscalid and Cyprodinil) and apricot (Boscalid and Tebuconazole), cherry (Cypermethrin and Cyprodinil), showed MDC values below the average fruit intake across all six demographic groups, identifying them as combinations where typical consumption habits would theoretically exceed the safe threshold regardless of age. Apple with four co-occurring residues presented a similar pattern, with MDC below average intake in all groups. For peach (Difenoconazole and Tebuconazole) and plum, safe thresholds were exceeded in infants, toddlers, other children, and the elderly, while adequate values were maintained only in adolescents and adults. These findings reinforce the need for continued and targeted monitoring of the most critical commodity/residue combinations, with Difenoconazole as the dominant pesticides of concern given its low ADI relative to the detected residue concentrations. Finally, the relatively limited number of samples and their distribution by year and product type do not allow for a statistically analysis of temporal trends, which was therefore not carried out in this study. A larger sample set, more evenly distributed across future monitoring cycles, would strengthen the interpretation of annual patterns of pesticide residue occurrence.

5. Conclusions

This study provides a comprehensive four-year assessment (2022–2025) of pesticide residues contamination in fruits, vegetables, and processed products from Apulia and Basilicata (Southern Italy), contributing to the national monitoring framework and aligned with the EU Farm to Fork strategy.
The analytical approach, combining QuEChERS extraction with GC-QqQ-MS/MS and UHPLC-HESI-Q-Orbitrap-MS, proved highly effective for the simultaneous determination of over 290 pesticides across diverse chemical classes, including the unambiguous resolution of isobaric species and stereoisomers such as alpha-cypermethrin. Method performance consistently met SANTE/11312/2021 requirements, as confirmed by satisfactory z-scores in four consecutive EUPT-FV proficiency tests.
Of the 198 samples analyzed, 76.8% contained no quantifiable pesticide residues, and all 46 samples with detectable residues were fully compliant with the MRLs established by Regulation (EC) No. 396/2005. The residue profile was dominated by fungicides, primarily Azoxystrobin, Difenoconazole, Boscalid, Cyprodinil, and Tebuconazole, reflecting their widespread use for fruit and vegetable production under Southern Italian agroclimatic conditions. Local produce showed compliance rates exceeding 97%, while imported commodities exhibited a slightly higher frequency of detectable residues, underscoring the continued importance of rigorous import controls. Anyway, the limited number of samples and their distribution across years and product types do not allow an analysis of temporal trends.
The dietary exposure assessment confirmed that, under chronic exposure conditions, individual EDI values were well below the respective ADIs for all demographic groups considered. Even in samples with co-occurring multiple residues, the cHI remained below the safety threshold of 100%, indicating no unacceptable cumulative dietary risk. Toddlers and other children consistently represented the most exposed subgroup due to their higher relative food consumption per unit body weight; elevated cHI values were specifically associated with Difenoconazole as the dominant contributor in strawberry, tomato, cauliflower, and spinach samples. The MDC analysis confirmed that vegetable samples had safe consumption thresholds above average intake, whereas most multi-residue fruit samples showed MDC values below average intake. The most restrictive MDC values were observed for infants and toddlers. These results highlight priority commodities and age groups for future monitoring. These findings do not indicate a health concern under current exposure scenarios, but reinforce the need for continued and targeted monitoring of this active substance in the most susceptible population groups and high-risk commodity/residue combinations.
Overall, the results confirm the safety of fruits and vegetables marketed in Southern Italy and validate the regional surveillance model adopted by the OfL of IZSPB as an effective tool for consumer protection and regulatory compliance within the EU food safety framework. Finally, future monitoring should include larger, more evenly distributed sample sets and incorporate acute risk assessment to better evaluate consumer exposure.

Supplementary Materials

The following supporting information can be downloaded at: https://www.mdpi.com/article/10.3390/app16073454/s1.

Author Contributions

Conceptualization, I.D.R., V.N. and R.Z.; Methodology, I.D.R. and R.Z.; Software, F.P.C., I.D.R. and R.Z.; Validation I.D.R., V.N. and R.Z.; Formal Analysis, A.C., A.M.A., F.C., I.D.R. and R.Z.; Investigation, I.D.R. and R.Z.; Resources, V.N.; Data Curation, I.D.R. and R.Z.; Writing—Original Draft Preparation, I.D.R., V.N. and R.Z.; Writing—Review and Editing, R.Z.; Visualization, F.P.C. and V.N.; Supervision, V.N. All authors have read and agreed to the published version of the manuscript.

Funding

This research received no external funding.

Institutional Review Board Statement

Not applicable.

Informed Consent Statement

Not applicable.

Data Availability Statement

The original contributions presented in this study are included in the article/Supplementary Materials; further inquiries can be directed to the corresponding author.

Conflicts of Interest

The authors declare no conflicts of interest.

References

  1. Healthy Diet. Available online: https://www.who.int/news-room/fact-sheets/detail/healthy-diet (accessed on 7 July 2025).
  2. World Health Organization. Diet, Nutrition and the Prevention of Chronic Diseases: Report of a Joint WHO/FAO Expert Consultation; World Health Organization: Geneva, Switzerland, 2003; ISBN 978-92-4-120916-8. [Google Scholar]
  3. Woodside, J.V.; Nugent, A.P.; Moore, R.E.; McKinley, M.C. Fruit and Vegetable Consumption as a Preventative Strategy for Non-Communicable Diseases. Proc. Nutr. Soc. 2023, 82, 186–199. [Google Scholar] [CrossRef]
  4. Zheng, X.; Zhang, X.; Zeng, F. Biological Functions and Health Benefits of Flavonoids in Fruits and Vegetables: A Contemporary Review. Foods 2025, 14, 155. [Google Scholar] [CrossRef]
  5. Devirgiliis, C.; Guberti, E.; Mistura, L.; Raffo, A. Effect of Fruit and Vegetable Consumption on Human Health: An Update of the Literature. Foods 2024, 13, 3149. [Google Scholar] [CrossRef]
  6. Garud, A.; Pawar, S.; Patil, M.S.; Kale, S.R.; Patil, S. A Scientific Review of Pesticides: Classification, Toxicity, Health Effects, Sustainability, and Environmental Impact. Cureus 2024, 16, e67945. [Google Scholar] [CrossRef] [PubMed]
  7. Pathak, V.M.; Verma, V.K.; Rawat, B.S.; Kaur, B.; Babu, N.; Sharma, A.; Dewali, S.; Yadav, M.; Kumari, R.; Singh, S.; et al. Current Status of Pesticide Effects on Environment, Human Health and It’s Eco-Friendly Management as Bioremediation: A Comprehensive Review. Front. Microbiol. 2022, 13, 962619. [Google Scholar] [CrossRef]
  8. Dardiotis, E.; Skouras, P.; Varvarelis, O.-P.; Aloizou, A.-M.; Hernández, A.F.; Liampas, I.; Rikos, D.; Dastamani, M.; Golokhvast, K.S.; Bogdanos, D.P.; et al. Pesticides and Tremor: An Overview of Association, Mechanisms and Confounders. Environ. Res. 2023, 229, 115442. [Google Scholar] [CrossRef] [PubMed]
  9. Uwamahoro, C.; Jo, J.-H.; Jang, S.-I.; Jung, E.-J.; Lee, W.-J.; Bae, J.-W.; Kwon, W.-S. Assessing the Risks of Pesticide Exposure: Implications for Endocrine Disruption and Male Fertility. Int. J. Mol. Sci. 2024, 25, 6945. [Google Scholar] [CrossRef]
  10. Botnaru, A.A.; Lupu, A.; Morariu, P.C.; Jităreanu, A.; Nedelcu, A.H.; Morariu, B.A.; Anton, E.; Di Gioia, M.L.; Lupu, V.V.; Dragostin, O.M.; et al. Neurotoxic Effects of Pesticides: Implications for Neurodegenerative and Neurobehavioral Disorders. J. Xenobiotics 2025, 15, 83. [Google Scholar] [CrossRef]
  11. Melanda, V.S.; Galiciolli, M.E.A.; Lima, L.S.; Figueiredo, B.C.; Oliveira, C.S. Impact of Pesticides on Cancer and Congenital Malformation: A Systematic Review. Toxics 2022, 10, 676. [Google Scholar] [CrossRef] [PubMed]
  12. Damalas, C.A.; Koutroubas, S.D. Farmers’ Exposure to Pesticides: Toxicity Types and Ways of Prevention. Toxics 2016, 4, 1. [Google Scholar] [CrossRef]
  13. Shang, N.; Yang, Y.; Xiao, Y.; Wu, Y.; Li, K.; Jiang, X.; Sanganyado, E.; Zhang, Q.; Xia, X. Exposure Levels and Health Implications of Fungicides, Neonicotinoid Insecticides, Triazine Herbicides and Their Associated Metabolites in Pregnant Women and Men. Environ. Pollut. 2024, 342, 123069. [Google Scholar] [CrossRef] [PubMed]
  14. Regulation (EC) No 396/2005 of the European Parliament and of the Council of 23 February 2005 on Maximum Residue Levels of Pesticides in or on Food and Feed of Plant and Animal Origin and Amending Council Directive 91/414/EEC (Text with EEA Relevance). 2025. Available online: https://eur-lex.europa.eu/eli/reg/2005/396/oj/eng (accessed on 8 January 2026).
  15. The 2023 European Union Report on Pesticide Residues in Food|EFSA. Available online: https://www.efsa.europa.eu/en/efsajournal/pub/9398 (accessed on 7 July 2025).
  16. Buttinelli, R.; Zhu, X. Reducing Chemical Fertilisers under the European Union’s Farm to Fork Strategy: Implications for Italian Processing Tomatoes. J. Clean. Prod. 2025, 520, 146070. [Google Scholar] [CrossRef]
  17. European Commission; Directorate General for Health and Food Safety; Arcadia International. Development of Future Scenarios for Sustainable Pesticide Use and Achievement of Pesticide-Use and Risk-Reduction Targets Announced in the Farm to Fork and Biodiversity Strategies by 2030; Publications Office: Luxembourg, 2022. [Google Scholar]
  18. European Food Safety Authority (EFSA); Josheski, M.; Marchese, E.; Pastor, P.M. National Summary Reports on Pesticide Residue Analyses Performed in 2023. EFSA Support. Publ. 2025, 22, 9320E. [Google Scholar] [CrossRef]
  19. Regolamento di Esecuzione (UE) 2024/989 della Commissione, del 2 Aprile 2024, Relativo a un Programma Coordinato di Controllo Pluriennale dell’Unione per il 2025, il 2026 e il 2027, Destinato a Garantire il Rispetto dei Livelli Massimi di Residui di Antiparassitari e a Valutare l’esposizione dei Consumatori ai Residui di Antiparassitari nei e sui Prodotti Alimentari di Origine Vegetale e Animale e che Abroga il Regolamento di Esecuzione (UE) 2023/731. 2024. Available online: https://eur-lex.europa.eu/legal-content/IT/ALL/?uri=CELEX:32024R0989 (accessed on 8 January 2026).
  20. Regulation—EU—2017/625—EN—EUR-Lex. Available online: https://eur-lex.europa.eu/eli/reg/2017/625/oj/eng (accessed on 7 July 2025).
  21. European Union. Regulation (EC) No 882/2004 of the European Parliament and of the Council of 29 April 2004 on Official Controls Performed to Ensure the Verification of Compliance with Feed and Food Law, Animal Health and Animal Welfare Rules. Off. J. Eur. Union 2004, 165, 1–141. [Google Scholar]
  22. Ferrer, C.; Lozano, A.; Uclés, S.; Valverde, A.; Fernández-Alba, A.R. European Union Proficiency Tests for Pesticide Residues in Fruit and Vegetables from 2009 to 2016: Overview of the Results and Main Achievements. Food Control 2017, 82, 101–113. [Google Scholar] [CrossRef]
  23. European Commission. SANTE/11312/2021 V2026—Guidance Document on Analytical Quality Control and Method Validation Procedures for Pesticide Residues Analysis in Food and Feed; European Commission: Brussels, Belgium, 2026. [Google Scholar]
  24. European Commission; Directorate-General for Health and Food Safety (SANTE). Sante/11312/2021—Analytical Quality Control and Method Validation Procedures for Pesticide Residues Analysis in Food and Feed. v.1; European Commission (DG Sante): Brussels, Belgium, 2022. [Google Scholar]
  25. European Commission; Directorate-General for Health and Food Safety (SANTE). Sante/11312/2021—Analytical Quality Control and Method Validation Procedures for Pesticide Residues Analysis in Food and Feed. v.2; European Commission (DG SANTE): Brussels, Belgium, 2024. [Google Scholar]
  26. Nardelli, V.; D’Amico, V.; Ingegno, M.; Della Rovere, I.; Iammarino, M.; Casamassima, F.; Calitri, A.; Nardiello, D.; Li, D.; Quinto, M. Pesticides Contamination of Cereals and Legumes: Monitoring of Samples Marketed in Italy as a Contribution to Risk Assessment. Appl. Sci. 2021, 11, 7283. [Google Scholar] [CrossRef]
  27. Rajski, Ł.; Del Mar Gómez Ramos, M.; Fernández-Alba, A.R. Evaluation of MS2 Workflows in LC-Q-Orbitrap for Pesticide Multi-Residue Methods in Fruits and Vegetables. Anal. Bioanal. Chem. 2017, 409, 5389–5400. [Google Scholar] [CrossRef]
  28. Wang, J.; Chow, W.; Wong, J.W.; Leung, D.; Chang, J.; Li, M. Non-Target Data Acquisition for Target Analysis (nDATA) of 845 Pesticide Residues in Fruits and Vegetables Using UHPLC/ESI Q-Orbitrap. Anal. Bioanal. Chem. 2019, 411, 1421–1431. [Google Scholar] [CrossRef] [PubMed]
  29. UNI EN 15662:2018; UNI Ente Italiano Di Normazione. UNI: Rome, Italy, 2018. Available online: https://store.uni.com/uni-en-15662-2018 (accessed on 9 January 2026).
  30. Ferrer, C.; Lozano, A.; Agüera, A.; Girón, A.J.; Fernández-Alba, A.R. Overcoming Matrix Effects Using the Dilution Approach in Multiresidue Methods for Fruits and Vegetables. J. Chromatogr. A 2011, 1218, 7634–7639. [Google Scholar] [CrossRef]
  31. ISO/IEC 17025; Testing and Calibration Laboratories. ISO: Geneva, Switzerland, 2017.
  32. Mistura, L.; Donne, C.L.; D’Addezio, L.; Ferrari, M.; Comendador, F.J.; Piccinelli, R.; Martone, D.; Sette, S.; Catasta, G.; Turrini, A. The Italian IV SCAI Dietary Survey: Main Results on Food Consumption. Nutr. Metab. Cardiovasc. Dis. 2025, 35, 103863. [Google Scholar] [CrossRef] [PubMed]
  33. Ioannidou, S.; Horváth, Z.; Arcella, D. Harmonised Collection of National Food Consumption Data in Europe. Food Policy 2020, 96, 101908. [Google Scholar] [CrossRef]
  34. European Food Safety Authority. Guidance on the EU Menu Methodology. EFSA J. 2014, 12, 3944. [Google Scholar] [CrossRef]
  35. Le Donne, C.; Ferrari, M.; Mistura, L.; D’Addezio, L.; Comendador Azcarraga, F.J.; Martone, D.; Piccinelli, R.; Sette, S.; Catasta, G.; Turrini, A. The National Food Consumption Survey IV SCAI: Nutrient Intakes and Related Dietary Sources in Italy. Nutrients 2026, 18, 88. [Google Scholar] [CrossRef]
  36. Malhat, F.; Abdel-Megeed, M.; Saber, E.; Shokr, S.A.S.; Eissa, F. Pesticide Residues in Fruits from Egyptian Markets: Detection, Compliance, Co-Occurrence, and Health Risk Assessment. J. Food Compos. Anal. 2025, 145, 107842. [Google Scholar] [CrossRef]
  37. Szpyrka, E.; Kurdziel, A.; Matyaszek, A.; Podbielska, M.; Rupar, J.; Słowik-Borowiec, M. Evaluation of Pesticide Residues in Fruits and Vegetables from the Region of South-Eastern Poland. Food Control 2015, 48, 137–142. [Google Scholar] [CrossRef]
  38. Orecchio, S.; Amorello, D.; Arrabito, G.D.; Barreca, S.; Di Gaudio, F.; Orecchio, S. Quantification of Pesticide Residues in Fruits and Vegetables Sampled in Sicily (Italy) and Assessment of Health Risks. J. Food Compos. Anal. 2026, 149, 108573. [Google Scholar] [CrossRef]
  39. European Commission. EU Pesticides Database—Active Substances; European Commission: Brussels, Belgium, 2026. [Google Scholar]
  40. Gad Alla, S.A.; Loutfy, N.M.; Shendy, A.H.; Ahmed, M.T. Hazard Index, a Tool for a Long Term Risk Assessment of Pesticide Residues in Some Commodities, a Pilot Study. Regul. Toxicol. Pharmacol. 2015, 73, 985–991. [Google Scholar] [CrossRef]
  41. Göbölös, B.; Sebők, R.E.; Szabó, G.; Tóth, G.; Szoboszlay, S.; Kriszt, B.; Kaszab, E.; Háhn, J. The Cocktail Effects on the Acute Cytotoxicity of Pesticides and Pharmaceuticals Frequently Detected in the Environment. Toxics 2024, 12, 189. [Google Scholar] [CrossRef] [PubMed]
  42. French Agency for Food, Environmental and Occupational Health & Safety (ANSES); France, Regulated Products Assessment Department, Residues and Food Safety Unit; Chatzidimitriou, E.; Mienne, A.; Pierlot, S.; Noel, L.; Sarda, X. Assessment of Combined Risk to Pesticide Residues through Dietary Exposure. EFSA J. 2019, 17, e170910. [Google Scholar] [CrossRef] [PubMed]
  43. European Commission. Commission Implementing Regulation (EU) 2021/808 of 22 March 2021 on the Performance of Analytical Methods for Residues of Pharmacologically Active Substances Used in Food-Producing Animals and on the Interpretation of Results as Well as on the Methods to Be Used for Sampling and Repealing Decisions 2002/657/EC and 98/179/EC; European Commission: Brussels, Belgium, 2021. [Google Scholar]
  44. Wenio, I.; Kwiatkowski, D.; Derewiaka, D.; Bartosiewicz, I. Evaluation of Chromatographic Separation, with a Focus on LC-MS/MS, for the Determination of Stereoisomeric Cypermethrin and Other Synthetic Pyrethroids in Apples. Appl. Sci. 2026, 16, 846. [Google Scholar] [CrossRef]
  45. Ghazouani, L.; Feriani, A.; Mufti, A.; Tir, M.; Baaziz, I.; Mansour, H.B.; Mnafgui, K. Toxic Effect of Alpha Cypermethrin, an Environmental Pollutant, on Myocardial Tissue in Male Wistar Rats. Environ. Sci. Pollut. Res. 2020, 27, 5709–5717. [Google Scholar] [CrossRef] [PubMed]
  46. European Food Safety Authority (EFSA). Statement on MRLs for Alpha-Cypermethrin and Screening of the Existing EU MRLs for Cypermethrin. EFSA J. 2025, 23, e9386. [Google Scholar] [CrossRef]
  47. European Food Safety Authority (EFSA); Bellisai, G.; Bernasconi, G.; Binaglia, M.; Brancato, A.; Cabrera, L.C.; Castellan, I.; Castoldi, A.F.; Chiusolo, A.; Crivellente, F.; et al. Review of the Existing Maximum Residue Levels for Cypermethrins According to Article 12 of Regulation (EC) No 396/2005. EFSA J. 2023, 21, e07800. [Google Scholar] [CrossRef] [PubMed]
  48. Ihadadene, S.; Gherdaoui, D.; Tazerouti, F.; Mouni, L.; Assadi, A.A. Effect of Chemically Bonded Stationary Phases, Mobile Phase Composition and Chemical Structure Analytes on Six Synthetic Insecticides Chiral Resolution in High-Performance Liquid Chromatography. Euro-Mediterr. J. Environ. Integr. 2025, 10, 4447–4465. [Google Scholar] [CrossRef]
  49. Frenich, A.G.; Romero-González, R.; del Mar Aguilera-Luiz, M. Comprehensive Analysis of Toxics (Pesticides, Veterinary Drugs and Mycotoxins) in Food by UHPLC-MS. TrAC Trends Anal. Chem. 2014, 63, 158–169. [Google Scholar] [CrossRef]
  50. Stockholm Convention on Persistent Organic Pollutants (POPs). In Encyclopedia of Corporate Social Responsibility; Idowu, S.O., Capaldi, N., Zu, L., Gupta, A.D., Eds.; Springer: Berlin/Heidelberg, Germany, 2013; p. 2336. ISBN 978-3-642-28035-1. [Google Scholar]
  51. Affholder, M.-C.; Mench, M.; Gombert-Courvoisier, S.; Cohen, G.J.V. Dieldrin Accumulation, Distribution in Plant Parts and Phytoextraction Potential for Several Plant Species and Cucurbita pepo Varieties. Sci. Total Environ. 2024, 931, 172968. [Google Scholar] [CrossRef] [PubMed]
  52. Pang, S.; Lin, Z.; Li, J.; Zhang, Y.; Mishra, S.; Bhatt, P.; Chen, S. Microbial Degradation of Aldrin and Dieldrin: Mechanisms and Biochemical Pathways. Front. Microbiol. 2022, 13, 713375. [Google Scholar] [CrossRef]
  53. Popescu (Stegarus), D.I.; Nasture, A.-M.; Niculescu, V.-C.; Oprita (Cioara), C.M.; Șuțan (Ionescu), N.A. Pesticide Surveillance in Fruits and Vegetables from Romanian Supply: A Data-Driven Approach. J. Xenobiotics 2025, 15, 104. [Google Scholar] [CrossRef]
  54. Zubrod, J.P.; Bundschuh, M.; Arts, G.; Brühl, C.A.; Imfeld, G.; Knäbel, A.; Payraudeau, S.; Rasmussen, J.J.; Rohr, J.; Scharmüller, A.; et al. Fungicides: An Overlooked Pesticide Class? Environ. Sci. Technol. 2019, 53, 3347–3365. [Google Scholar] [CrossRef]
  55. Zheng, M.; Deng, Y.; Zhou, Y.; Liu, R.; Liu, Y.; Wang, H.; Zhu, W.; Zhou, Z.; Diao, J. Multifaceted Effects of Difenoconazole in Tomato Fruit Ripening: Physiology, Flavour and Nutritional Quality. Plant Physiol. Biochem. 2023, 194, 223–235. [Google Scholar] [CrossRef] [PubMed]
  56. Łozowicka, B.; Kaczyński, P.; Jankowska, M.; Rutkowska, E.; Iwaniuk, P.; Konecki, R.; Rogowska, W.; Zhagyparova, A.; Absatarova, D.; Łuniewski, S.; et al. Evaluation of Broad-Spectrum Pesticides Based on Unified Multi-Analytical Procedure in Fruits and Vegetables for Acute Health Risk Assessment. Foods 2025, 14, 2528. [Google Scholar] [CrossRef] [PubMed]
Figure 1. Alpha-cypermethrin measured in the EUPT-FV27 sample (mean concentration: 0.025 mg kg−1; z-score: 0.1), showing relative quantifier and qualifier ion peaks, and chromatographic resolution. The grey peak corresponds to alpha-cypemethrin. Quantification was performed by interpolation of an MMC curve prepared in blank kiwi sample (0.010–0.100 mg kg−1) using GC-QqQ-MS/MS.
Applsci 16 03454 g001
Figure 2. The extracted ion chromatograms of the isobaric species, namely (A) m/z 202.08540 for Simazine and m/z 202.08626 for Carbaryl, and (B) m/z 314.07228 for Triazophos and m/z 314.08214 for Hexaconazole, obtained by UHPLC-HESI-Q-Orbitrap-MS analysis of a spiked banana sample at 0.010 mg kg−1.
Applsci 16 03454 g002
Figure 3. Chronic Hazard Index (cHI, %) for fruit and vegetable samples with multiple pesticide residues detected in 2025.
Applsci 16 03454 g003
Table 1. Pesticides residue determination in commodities analyzed from 2022 to 2025 by means of GC-QqQ-MS and UHPLC-HESI-Q-Orbitrap-MS analysis.
CommoditiesDetected Pesticide ResiduesAmount (mg kg−1) ±
Uncertainty (mg kg−1) a
MRL (mg kg−1) bOriginADI c (mg kg−1 bw·Day)
Year 2022
StrawberryTebuconazole0.013 ± 0.0030.02Extra EU—Albania0.03
BananaAzoxystrobin0.051 ± 0.0042.0Extra EU—Ecuador0.2
Apple *Cypermethrin0.011 ± 0.0031.0EU—Italy0.005
Boscalid0.025 ± 0.0052.0EU—Italy0.04
Tebuconazole0.053 ± 0.0140.3EU—Italy0.03
Pendimethalin0.009 ± 0.0010.05EU—Italy0.125
Year 2023
Pear *Cyprodinil0.0106 ± 0.00032.0EU—Italy0.03
Difenoconazole0.0103 ± 0.00050.8EU—Italy0.01
StrawberryTebuconazole0.013 ± 0.0010.02Extra EU—Albania0.03
CarrotAzoxystrobin0.0108 ± 0.00091.0EU—Italy0.2
Tomato *Boscalid0.008 ± 0.0013.0Extra EU—Albania0.04
Cyprodinil0.009 ± 0.0021.5Extra EU—Albania0.03
Strawberry *Difenoconazole0.010 ± 0.0012.0Extra EU—Albania0.01
Boscalid0.024 ± 0.0036.0Extra EU—Albania0.04
Deltamethrin0.006 ± 0.0010.2Extra EU—Albania0.01
ApricotCyprodinil0.068 ± 0.0102.0Extra EU—Türkiye0.03
CherryCypermethrin0.051 ± 0.0042.0Extra EU—Türkiye0.005
CourgettiCyprodinil0.069 ± 0.0060.5Extra EU—Albania0.03
TomatoDifenoconazole0.006 ± 0.00032.0EU—Italy0.01
Year 2024
Table grapesCyprodinil0.087 ± 0.0053.0Extra EU—Moldova0.03
Apricot *Boscalid0.208 ± 0.0065.0EU—Italy0.04
Tebuconazole0.013 ± 0.0010.6EU—Italy0.03
Cherry *Cypermethrin0.032 ± 0.0022.0Extra EU—Türkiye0.005
Cyprodinil0.015 ± 0.0012.0Extra EU—Türkiye0.03
ApricotBoscalid0.016 ± 0.0075.0EU—Italy0.04
CourgettiAzoxystrobin0.013 ± 0.0021.0EU—Italy0.2
BananaAzoxystrobin0.004 ± 0.0012.0Extra EU—Ecuador0.2
Peach *Difenoconazole0.013 ± 0.0020.5EU—Italy0.01
Tebuconazole0.036 ± 0.0020.6EU—Italy0.03
StrawberryBoscalid0.004 ± 0.0026.0EU—Italy0.04
Sweet pepperAzoxystrobin0.083 ± 0.0213.0EU—Italy0.2
Sweet pepper *Difenoconazole0.013 ± 0.0070.9Extra EU—Albania0.01
Metconazole0.007 ± 0.0010.02Extra EU—Albania0.01
Tebuconazole0.007 ± 0.0010.6Extra EU—Albania0.03
Peach *Cypermethrin0.039 ± 0.0032.0EU—Italy0.005
Deltamethrin0.019 ± 0.0090.15EU—Italy0.01
Boscalid0.290 ± 0.1285.0EU—Italy0.04
CourgettiCyprodinil0.132 ± 0.0620.5EU—Italy0.03
Beans with podsDeltamethrin0.040 ± 0.0190.2EU—Italy0.01
CourgettiAzoxystrobin0.021 ± 0.0061.0EU—Italy0.2
TurnipsAzoxystrobin0.106 ± 0.0031.0EU—Italy0.2
TomatoAzoxystrobin0.012 ± 0.0013.0EU—Italy0.2
CauliflowerAzoxystrobin1.083 ± 0.2745.0EU—Italy0.2
Cherry *Cypermethrin0.004 ± 0.0012.0Extra EU—Türkiye0.005
Deltamethrin0.007 ± 0.0010.1Extra EU—Türkiye0.01
Plum *Metconazole0.017 ± 0.0010.02EU—Italy0.01
Tebuconazole0.017 ± 0.0021.0EU—Italy0.03
KiwiMalathion0.009 ± 0.0020.02Extra EU—Türkiye0.03
CauliflowerDifenoconazole0.562 ± 0.2390.2EU—Italy0.01
Sweet pepperAzoxystrobin0.006 ± 0.0013.0EU—Italy0.2
Year 2025
Strawberry *Difenoconazole0.377 ± 0.0802.0Extra EU—Albania0.01
Boscalid0.006 ± 0.0016.0Extra EU—Albania0.04
Azoxystrobin0.054 ± 0.00410.0Extra EU—Albania0.2
FennelCyprodinil0.090 ± 0.0080.1EU—Italy0.03
Tomato *Boscalid0.043 ± 0.0053.0EU—Italy0.04
Difenoconazole0.138 ± 0.0162.0EU—Italy0.01
Spinach *Difenoconazole0.078 ± 0.0083.0EU—Italy0.01
Deltamethrin0.007 ± 0.0010.01EU—Italy0.01
PeachBoscalid0.018 ± 0.0055.0EU—Italy0.04
PeachBoscalid0.012 ± 0.0035.0EU—Italy0.04
Cucumber *Dieldrin0.013 ± 0.0030.02EU—ItalyNot applicable
Heptachlor Epoxide, Cis-0.010 ± 0.0010.01EU—ItalyNot applicable
BananaAzoxystrobin0.030 ± 0.0072.0EU—Italy0.2
Tomato *Azoxystrobin0.040 ± 0.0103.0EU—Italy0.2
Difenoconazole0.028 ± 0.0082.0Extra EU—Costa Rica0.01
TomatoDifenoconazole0.055 ± 0.0152.0Extra EU—Albania0.01
Carrot *Difenoconazole0.031 ± 0.0070.4Extra EU—Albania0.01
Pendimethalin0.033 ± 0.0030.7EU—Italy0.125
CucumberDieldrin0.004 ± 0.0010.02EU—ItalyNot applicable
a Average of two extracted samples and acquired in triplicate ± measurement uncertainty; b https://ec.europa.eu/food/plant/pesticides/eu-pesticides-database/start/screen/products (accessed on 8 January 2026); c Acceptable Daily Intake (ADI) https://ec.europa.eu/food/plant/pesticides/eu-pesticides-database/start/screen/active-substances (accessed on 8 January 2026); * Samples containing more than one pesticide residue.
Table 2. Chronic dietary exposure risk (%ADI) was obtained as the ratio between EDI (Table S7) and the corresponding Acceptable Daily Intake (ADI, mg kg−1 body weights sourced from the EU Pesticides [38,39].
CommoditiesPesticide Residue%ADI Infants%ADI Toddlers%ADI Other Children%ADI Adolescents%ADI Adults%ADI Elderly
Fruit samples
StrawberryTebuconazole0.250.500.500.120.120.19
BananaAzoxystrobin0.150.300.300.070.070.11
AppleCypermethrin1.282.552.550.580.610.97
AppleBoscalid0.360.720.720.170.170.28
AppleTebuconazole1.022.052.050.470.490.78
ApplePendimethalin0.040.080.080.020.020.03
PearsCyprodinil0.200.410.410.090.100.16
PearsDifenoconazole0.601.191.190.270.290.46
StrawberryTebuconazole0.250.500.500.120.120.19
TomatoBoscalid0.120.230.230.050.060.09
TomatoCyprodinil0.521.041.040.240.250.40
StrawberryDifenoconazole0.150.290.290.070.070.11
StrawberryBoscalid1.392.782.780.640.671.06
StrawberryDeltamethrin0.120.230.230.050.060.09
ApricotCyprodinil1.312.632.630.600.631.00
CherrieCypermethrin5.9211.8211.822.712.834.52
TomatoDifenoconazole0.350.700.700.160.170.27
Table grapesCyprodinil1.683.363.360.770.801.28
ApricotBoscalid3.026.026.021.381.442.30
ApricotTebuconazole0.250.500.500.120.120.19
CherrieCypermethrin3.717.417.411.701.772.83
CherrieCyprodinil0.290.580.580.130.140.22
ApricotBoscalid0.230.460.460.110.110.18
BananaAzoxystrobin0.010.020.020.010.010.01
PeachDifenoconazole0.751.511.510.350.360.58
PeachTebuconazole0.701.391.390.320.330.53
StrawberryBoscalid0.060.120.120.030.030.04
PeachCypermethrin4.529.049.042.072.163.45
PeachDeltamethrin1.102.202.200.500.530.84
PeachBoscalid4.218.408.401.922.013.21
TomatoAzoxystrobin0.030.070.070.020.020.03
CherrieCypermethrin0.460.930.930.210.220.35
CherrieDeltamethrin0.410.810.810.190.190.31
PlumMetconazole0.991.971.970.450.470.75
PlumTebuconazole0.330.660.660.150.160.25
KiwiMalathion0.170.350.350.080.080.13
StrawberryDifenoconazole21.8743.6743.6710.0110.4516.70
StrawberryBoscalid0.090.170.170.040.040.07
StrawberryAzoxystrobin0.160.310.310.070.070.12
TomatoBoscalid0.621.251.250.290.300.48
TomatoDifenoconazole8.0015.9915.993.663.826.11
PeachBoscalid0.260.520.520.120.120.20
PeachBoscalid0.170.350.350.080.080.13
BananaAzoxystrobin0.090.170.170.040.040.07
TomatoAzoxystrobin1.162.322.320.530.550.89
TomatoDifenoconazole1.623.243.240.740.781.24
TomatoDifenoconazole3.196.376.371.461.522.44
Vegetable samples
CarrotAzoxystrobin0.030.060.060.010.020.02
CourgettiCyprodinil1.332.662.660.610.641.02
CourgettiAzoxystrobin0.040.080.080.020.020.03
Sweet pepperAzoxystrobin0.240.480.480.110.120.18
Sweet pepperDifenoconazole0.751.511.510.350.360.58
Sweet pepperMetconazole0.410.810.810.190.190.31
Sweet pepperTebuconazole0.140.270.270.060.060.10
CourgettiCyprodinil2.555.105.101.171.221.95
Beans with podsDeltamethrin2.324.634.631.061.111.77
CourgettiAzoxystrobin0.060.120.120.030.030.05
TurnipsAzoxystrobin0.310.610.610.140.150.23
CauliflowerAzoxystrobin3.146.276.271.441.502.40
CauliflowerDifenoconazole32.6065.1065.1014.9215.5824.89
Sweet pepperAzoxystrobin0.020.030.030.010.010.01
FennelCyprodinil1.743.483.480.800.831.33
SpinachDifenoconazole4.529.049.042.072.163.45
SpinachDeltamethrin0.410.810.810.190.190.31
CarrotDifenoconazole1.803.593.590.820.861.37
CarrotPendimethalin0.150.310.310.070.070.12
Disclaimer/Publisher’s Note: The statements, opinions and data contained in all publications are solely those of the individual author(s) and contributor(s) and not of MDPI and/or the editor(s). MDPI and/or the editor(s) disclaim responsibility for any injury to people or property resulting from any ideas, methods, instructions or products referred to in the content.