New Fault Diagnosis Strategy Based on KGLRT Chart for Monitoring Chemical Processes


Abstract
1. Introduction
- Detection: Identifying abnormal behavior in the process that may result from equipment faults, mechanical wear, or major disturbances during operation.
- Isolation: Determining the precise location or source of the detected fault within the system.
- Assessment: Evaluating the magnitude and consequences of the fault on the process performance.
2. Review of KPCA and RR-KPCA
2.1. Principle of KPCA
2.2. Principle of Reduced-Rank KPCA
- If the kernel matrix has full rank, indicating that the projected data in the feature space are linearly independent, the new observation is added to the reduced data matrix.
- If the kernel matrix does not have full rank, indicating linear dependencies in the projected data in the feature space, the reduced data matrix remains unchanged, and the kernel matrix is reverted to its previous state.
2.3. Fault Detection Index
- Offline Phase: This stage focuses on building an implicit KPCA model of the process, as well as determining the detection index and its confidence threshold under normal operating conditions.
- Online Phase: During this stage, the detection index is computed for each new observation to assess whether the process is operating normally or if a fault has occurred.
2.3.1. Quadratic Prediction Error (Q)
2.3.2. Kernel Generalized Likelihood Ratio Test
3. Proposed RBC-KGLRT Method
3.1. Principle
3.2. Mathematical Formulation
4. Application to the Tennessee Eastman Process (TEP)
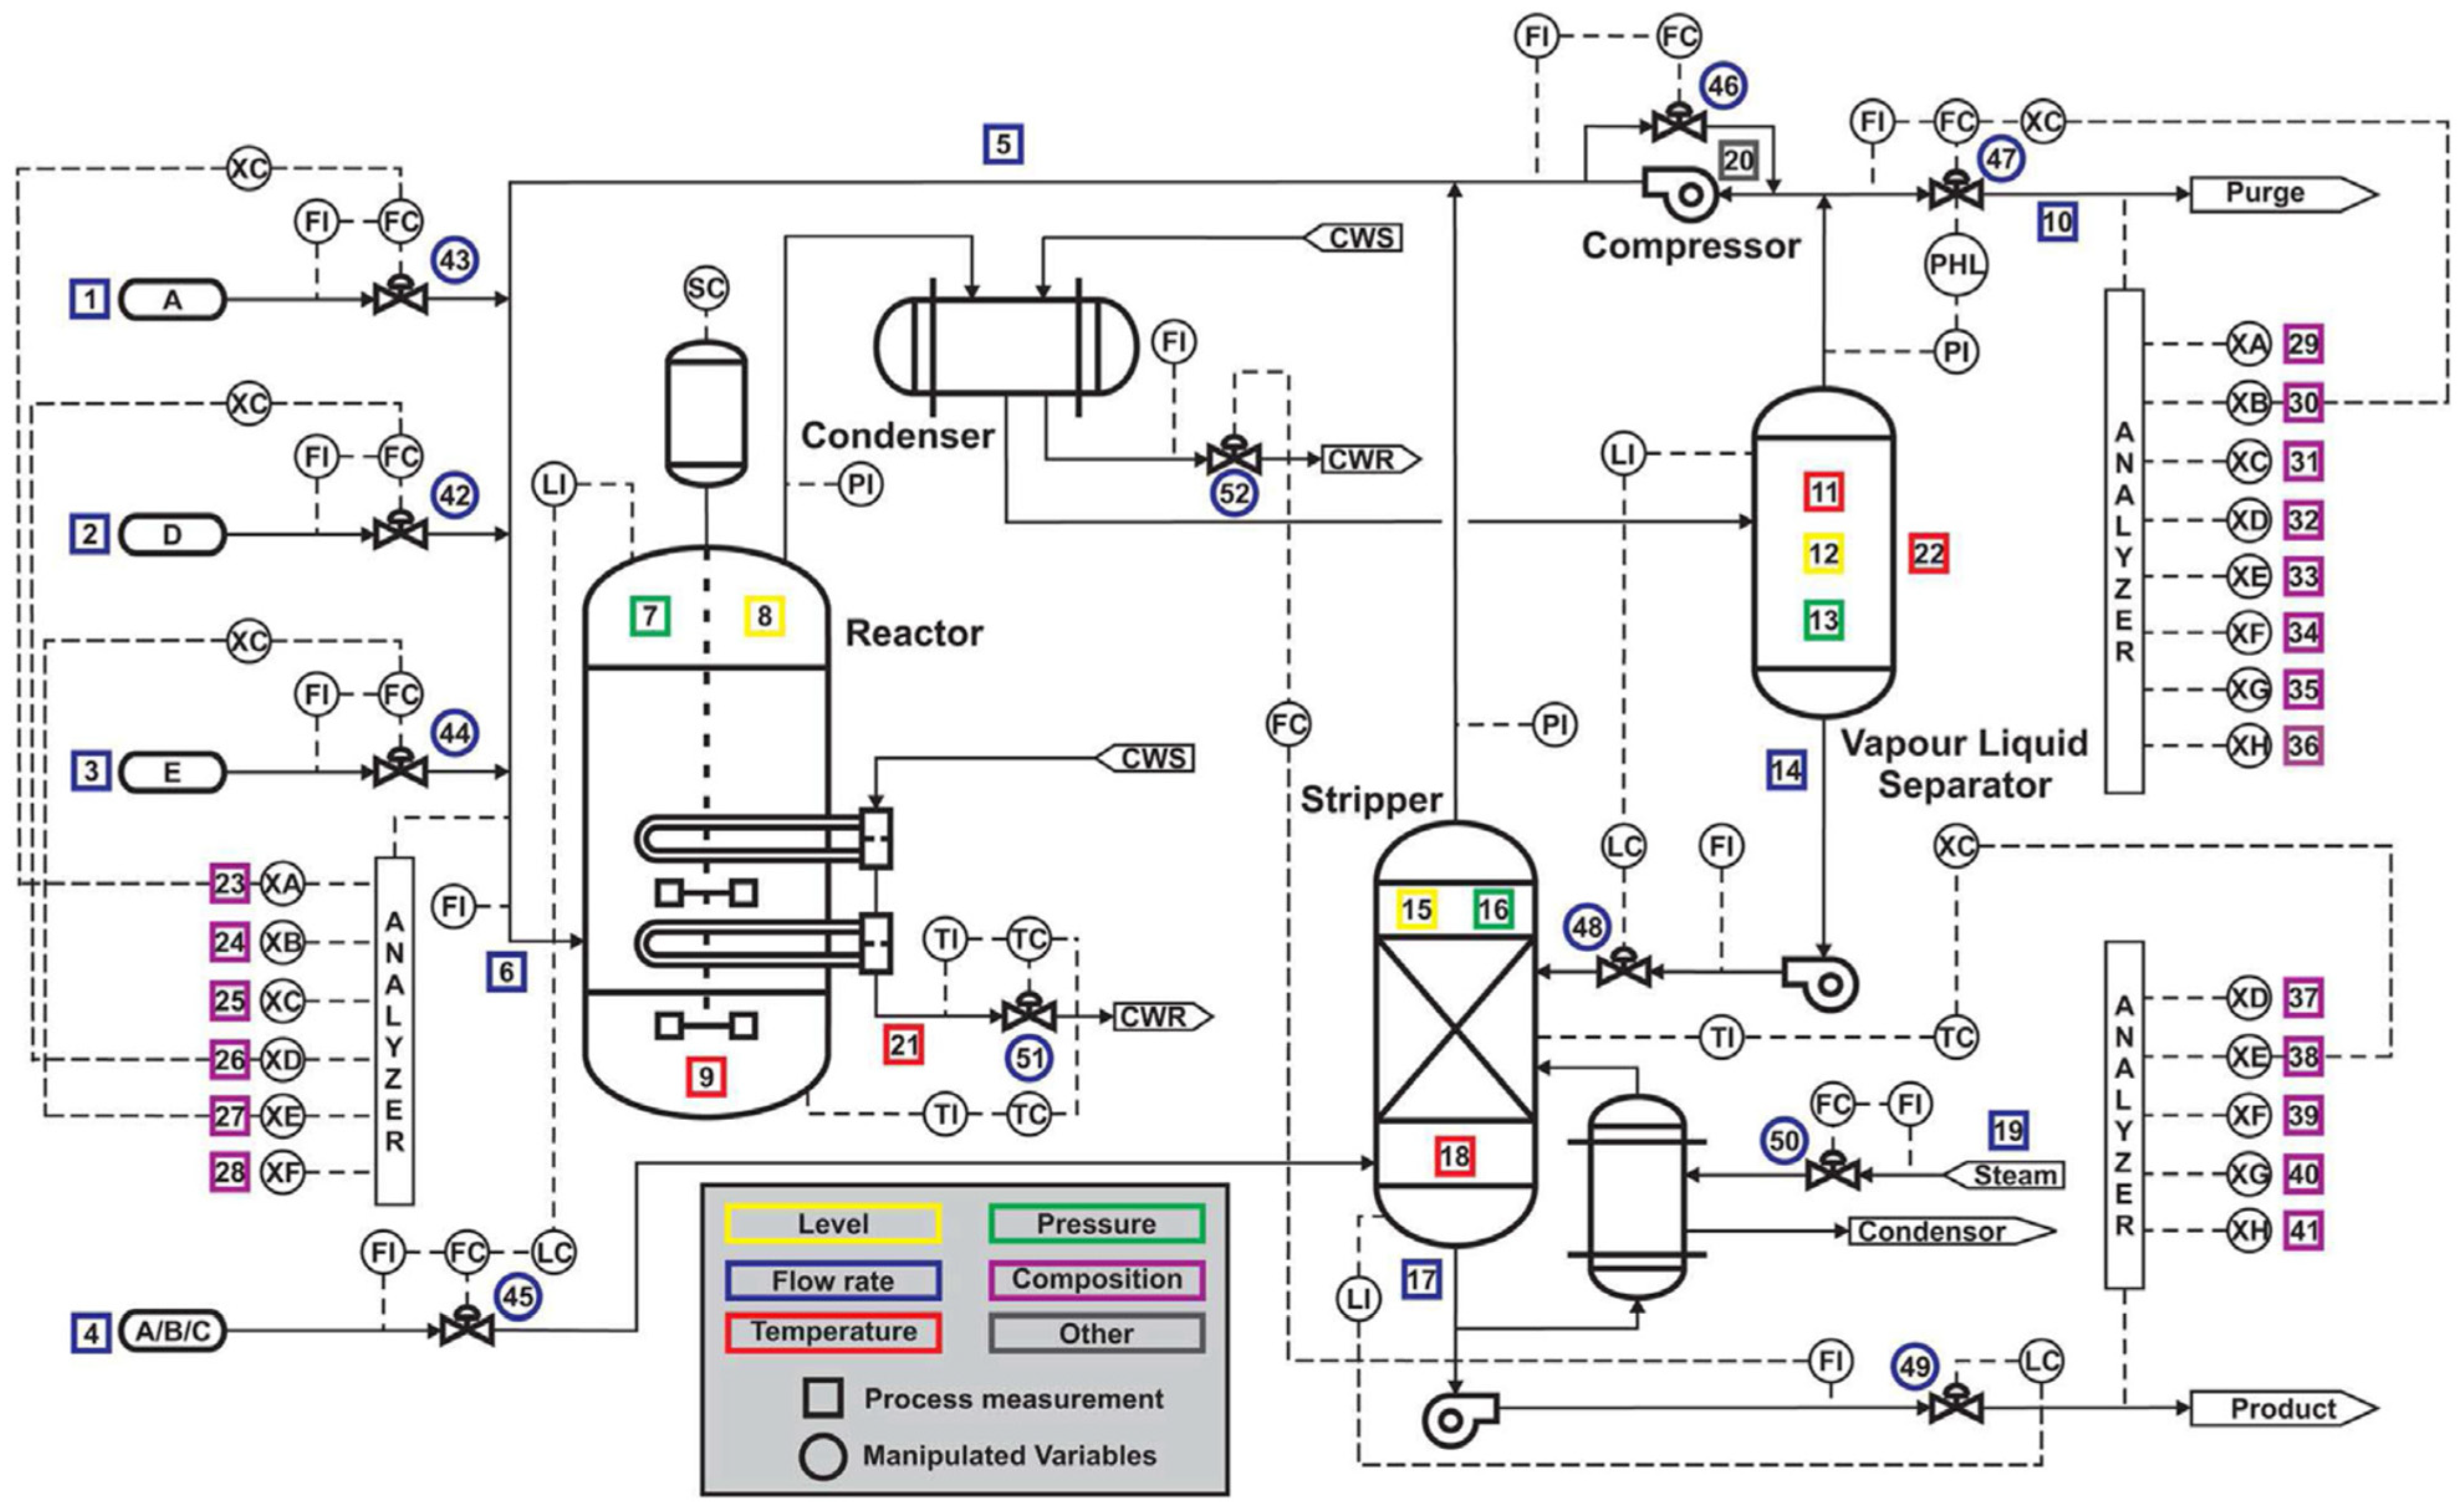
Description of TEP
- ▪
- Reactor: The core unit where the chemical reactions take place.
- ▪
- Condenser: Cools the effluent stream from the reactor.
- ▪
- Separator: Separates the liquid and gas phases of the cooled effluent.
- ▪
- Stripper: Purifies the liquid product by removing impurities.
- ▪
- Recycle Compressor: Recycles unreacted gases back into the reactor for further processing.
- Training Data: The training set is usually composed of data collected during periods of normal operation (fault-free conditions). These data are used to characterize the nominal behavior of the process, allowing faults to be detected as deviations from this baseline. The training data are often generated from simulations running for a fixed duration, such as 25 h, with samples taken at regular intervals (every 3 min).
- Test Data: The test set includes both fault-free and faulty data, often generated from simulations running for a longer duration, such as 48 h. The faulty data represent various process faults introduced at specific times. The test data are kept completely separate from the training data.
- ✓
- The false alarm rate “FAR” is calculated as follows:
- ✓
- The good detection rate “GDR” is calculated as follows:
- ✓
- The good localization rate “GLR” is typically calculated using the following formula:
- ✓
- Average convergence time “TC”.
- ✓
- Minimal computing time allowed for fault detection “CT”.
5. Discussion
6. Conclusions
Author Contributions
Funding
Institutional Review Board Statement
Informed Consent Statement
Data Availability Statement
Conflicts of Interest
Abbreviations
| KPCA | Kernel Principal Component Analysis |
| RBC | Reconstruction Based Contribution |
| KGLRT | Kernel Generalized Likelihood Ratio Test |
| RR-KPCA | Reduced Rank KPCA |
| RR-KGLRT | Reduced Rank KPCA based on Kernel Generalized Likelihood Ratio Test |
| Q | Squared Prediction error |
| RBC-KGLRT | Reconstruction Based Contribution based on Kernel Generalized Likelihood Ratio Test |
| RBC-RRKPCA | Reconstruction Based Contribution based on Q index combining with RR-KPCA method |
References
- Babak, V.; Zaporozhets, A.; Zvaritch, V.; Scherbak, L.; Myslovych, M.; Kuts, Y. Models and measures in theory and practice of manufacturing processes. IFAC-Pap. 2022, 55, 1956–1961. [Google Scholar] [CrossRef]
- Wang, J.; Zhou, Z.; Li, Z.; Du, S. A novel fault detection scheme based on mutual k-nearest neighbor method: Application on the industrial processes with outliers. Processes 2022, 10, 497. [Google Scholar] [CrossRef]
- Ziane, A.; Mekhilef, S.; Dabou, R.; Sahouane, N.; Necaibia, A.; Rouabhia, A.; Izem, T.A. Online fault detection in grid-connected PV system using nonlinear multivariate statistical analysis. Electr. Eng. 2026, 108, 107. [Google Scholar] [CrossRef]
- Gravanis, G.; Dragogias, I.; Papakiriakos, K.; Ziogou, C.; Diamantaras, K. Fault detection and diagnosis for non-linear processes empowered by dynamic neural networks. Comput. Chem. Eng. 2022, 156, 107531. [Google Scholar] [CrossRef]
- Lahdhiri, H.; Elaissi, I.; Taouali, O.; Harakat, M.F.; Messaoud, H. Nonlinear process monitoring based on new reduced Rank-KPCA method. Stoch. Environ. Res. Risk Assess. 2017, 32, 1833–1848. [Google Scholar] [CrossRef]
- Wang, Q.; Liu, Y.B.; He, X.; Liu, S.Y.; Liu, J.H. Fault diagnosis of bearing based on KPCA and KNN method. Adv. Mater. Res. 2014, 986, 1491–1496. [Google Scholar] [CrossRef]
- Zhang, Y.; Ma, C. Fault diagnosis of nonlinear processes using multiscale KPCA and multiscale KPLS. Chem. Eng. Sci. 2011, 66, 64–72. [Google Scholar] [CrossRef]
- Fazai, R.; Taouali, O.; Harkat, M.F.; Nasreddine, B. A new fault detection method for nonlinear process monitoring. Int. J. Adv. Manuf. Technol. 2016, 87, 3425–3436. [Google Scholar] [CrossRef]
- Fezai, R.; Mansouri, M.; Trabelsi, M.; Hajji, M.; Nounou, H.; Nounou, M. Online reduced kernel GLRT technique for improved fault detection in photovoltaic systems. Energy 2019, 179, 1133–1154. [Google Scholar] [CrossRef]
- Cho, J.-H.; Lee, J.-M.; Choi, S.W.; Lee, D.; Lee, I.-B. Fault identification for process monitoring using kernel principal component analysis. Chem. Eng. Sci. 2005, 60, 279–288. [Google Scholar] [CrossRef]
- Shen, J.; Xu, F. Method of fault feature selection and fusion based on poll mode and optimized weighted KPCA for bearings. Measurement 2022, 194, 110950. [Google Scholar] [CrossRef]
- Zhang, Q.; Li, P.; Lang, X.; Mia, A. Improved dynamic kernel principal component analysis for fault detection. Measurement 2020, 158, 107738. [Google Scholar] [CrossRef]
- Lang, C.I.; Sun, F.K.; Lawler, B.; Dillon, J.; Al Dujaili, A.; Ruth, J.; Boning, D.S. One class process anomaly detection using kernel density estimation methods. IEEE Trans. Semicond. Manuf. 2022, 35, 457–469. [Google Scholar] [CrossRef]
- Samuel, R.T.; Cao, Y. Nonlinear process fault detection and identification using kernel PCA and kernel density estimation. Syst. Sci. Control. Eng. 2016, 4, 165–174. [Google Scholar] [CrossRef]
- Harkat, M.F.; Mansouri, M.; Nounou, M.; Nounou, H. Enhanced data validation strategy of air quality monitoring network. Environ. Res. 2018, 160, 183–194. [Google Scholar] [CrossRef] [PubMed]
- Lahdhiri, H.; Taouali, O. Reduced Rank KPCA based on GLRT chart for sensor fault detection in nonlinear chemical process. Measurement 2021, 169, 108342. [Google Scholar] [CrossRef]
- Gertler, J.; McAvoy, T. Principal Component Analysis and Parity Relations—A Strong Duality; IFAC Conference SAFEPROCESS: Hull, UK, 1997; pp. 837–842. [Google Scholar]
- Harkat, M.-F.; Mourot, G.; Ragot, J. An improved PCA scheme for sensor FDI: Application to an air quality monitoring network. J. Process Control 2006, 16, 625–634. [Google Scholar] [CrossRef]
- Hamrouni, I.; Lahdhiri, H.; Abdellafou, K.B.; Aljuhani, A.; Taouali, O.; Bouzrara, K. Anomaly Detection and Localization for Process Security Based on the Multivariate Statistical Method. Math. Probl. Eng. 2022, 2022, 5580774. [Google Scholar] [CrossRef]
- Fazai, R.; Abdellafou, K.B.; Said, M.; Taouali, O. Online fault detection and isolation of an AIR quality monitoring network based on machine learning and metaheuristic methods. Int. J. Adv. Manuf. Technol. 2018, 99, 2789–2802. [Google Scholar] [CrossRef]
- Lahdhiri, H.; Said, M.; Abdellafou, K.B.; Taouali, O.; Harkat, M.F. Supervised process monitoring and fault diagnosis based on machine learning methods. Int. J. Adv. Manuf. Technol. 2019, 102, 2321–2337. [Google Scholar] [CrossRef]
- Gharahbagheri, H.; Imtiaz, S.A.; Khan, F. Root cause diagnosis of process fault using KPCA and Bayesian network. Ind. Eng. Chem. Res. 2017, 56, 2054–2070. [Google Scholar] [CrossRef]
- Cui, P.; Li, J.; Wang, G. Improved kernel principal component analysis for fault detection. Expert Syst. Appl. 2008, 34, 1210–1219. [Google Scholar] [CrossRef]
- Yang, J.; Jin, Z.; Yang, J.-Y.; Zhang, D.; Frangi, A.F. Essence of kernel Fisher discriminant: KPCA plus LDA. Pattern Recognit. 2004, 37, 2097–2100. [Google Scholar] [CrossRef]
- Jafari, N.; Lopes, A.M. Fault Detection and Identification with Kernel Principal Component Analysis and Long Short-Term Memory Artificial Neural Network Combined Method. Axioms 2023, 12, 583. [Google Scholar] [CrossRef]
- Wang, H.; Peng, M.J.; Yu, Y.; Saeed, H.; Hao, C.M.; Liu, Y.K. Fault identification and diagnosis based on KPCA and similarity clustering for nuclear power plants. Ann. Nucl. Energy 2021, 150, 107786. [Google Scholar] [CrossRef]
- Sinaga, K.P.; Hussain, I.; Yang, M.-S. Entropy K-means clustering with feature reduction under unknown number of clusters. IEEE Access 2021, 9, 67736–67751. [Google Scholar] [CrossRef]
- Ni, J.; Zhang, C.; Yang, S.X. An adaptive approach based on KPCA and SVM for real-time fault diagnosis of HVCBs. IEEE Trans. Power Deliv. 2011, 26, 1960–1971. [Google Scholar] [CrossRef]
- Honeine, P. Analyzing sparse dictionaries for online learning with kernels. IEEE Trans. Signal Process. 2015, 63, 6343–6353. [Google Scholar] [CrossRef]
- Alcala, C.F.; Qin, S.J. Reconstruction-based contribution for process monitoring with kernel principal component analysis. Ind. Eng. Chem. Res. 2010, 49, 7849–7857. [Google Scholar] [CrossRef]
- Alcala, C.F. Fault Diagnosis with Reconstruction Based Contributions for Statistical Process Monitoring. Ph.D. Thesis, L’école USC Université de California de Sud, Los Angeles, CA, USA, 2011. [Google Scholar]
- Lahdhiri, H.; Aljuhani, A.; Abdellafou, K.B.; Taouali, O. An Improved Fault Diagnosis Strategy for Process Monitoring Using Reconstruction Based Contributions. IEEE Access 2021, 9, 79520–79533. [Google Scholar] [CrossRef]
- Mansouri, M.; Nounou, M.; Nounou, H.; Karim, N. Kernel PCA-based GLRT for nonlinear fault detection of chemical processes. J. Loss Prev. Process Ind. 2016, 40, 334–347. [Google Scholar] [CrossRef]
- Lee, J.M.; Yoo, C.; Lee, I.B. Fault detection of batch processes using multiway kernel principal component analysis. Comput. Chem. Eng. 2004, 28, 1837–1847. [Google Scholar] [CrossRef]
- Hu, Q.; Qin, A.; Zhang, Q.; He, J.; Sun, G. Fault diagnosis based on weighted extreme learning machine with wavelet packet decomposition and KPCA. IEEE Sens. J. 2018, 18, 8472–8483. [Google Scholar] [CrossRef]
- Chen, Z.; Zhao, W.; Shen, P.; Wang, C.; Jiang, Y. A fault diagnosis method for ultrasonic flow meters based on KPCA-CLSSA-SVM. Processes 2024, 12, 809. [Google Scholar] [CrossRef]
- Valle, S.; Li, W.; Qin, S.J. Selection of the number of principal components: The variance of the reconstruction error criterion with a comparison to other methods. Ind. Eng. Chem. Res. 1999, 38, 4389–4401. [Google Scholar] [CrossRef]
- Zeng, L.; Long, W.; Li, Y. A Novel Method for Gas Turbine Condition Monitoring Based on KPCA and Analysis of Statistics T2 and SPE. Processes 2019, 7, 124. [Google Scholar] [CrossRef]
- Choi, S.; Changkyu, L.; Lee, J.; Park, L.; Lee, I. Fault detection and identification of nonlinear processes based on kernel PCA. Chemom. Intell. Lab. Syst. 2005, 75, 55–67. [Google Scholar] [CrossRef]
- Sheriff, M.Z.; Mansouri, M.; Karim, M.N.; Nounou, H.; Nounou, M. Fault detection using multiscale PCA-based moving window GLRT. J. Process Control 2017, 54, 47–64. [Google Scholar] [CrossRef]
- Harrou, F.; Nounou, M.N.; Nounou, H.N.; Madakyaru, M. Statistical fault detection using PCA-based GLR hypothesis testing. J. Loss Prev. Process Ind. 2013, 26, 129–139. [Google Scholar] [CrossRef]
- Fezai, R.; Mansouri, M.; Abodayeh, K.; Nounou, H.; Nounou, M.; Messaoud, H. Partial kernel PCA-based GLRT for fault diagnosis of nonlinear processes. J. Intell. Fuzzy Syst. 2020, 38, 4829–4843. [Google Scholar] [CrossRef]
- Zhu, J.; Shi, H.; Song, B.; Tan, S.; Tao, Y. Deep neural network based recursive feature learning for nonlinear dynamic process monitoring. Can. J. Chem. Eng. 2020, 98, 919–933. [Google Scholar] [CrossRef]
- Lee, G.; Han, C.; Yoon, E.S. Multiple-fault diagnosis of the Tennessee Eastman process based on system decomposition and dynamic PLS. Ind. Eng. Chem. Res. 2004, 43, 8037–8048. [Google Scholar] [CrossRef]
- Ma, L.; Dong, J.; Peng, K. A novel key performance indicator oriented hierarchical monitoring and propagation path identification framework for complex industrial processes. ISA Trans. 2020, 96, 1–13. [Google Scholar] [CrossRef] [PubMed]
- Bolboacă, R.; Haller, P.; Genge, B. Feature analysis and ensemble-based fault detection techniques for nonlinear systems. Neural Comput. Appl. 2025, 37, 10465–10489. [Google Scholar] [CrossRef]
- Kaib, M.T.H.; Kouadri, A.; Harkat, M.F.; Bensmail, A.; Mansouri, M. Improving kernel PCA-based algorithm for fault detection in nonlinear industrial process through fractal dimension. Process Saf. Environ. Prot. 2023, 179, 525–536. [Google Scholar] [CrossRef]
- Shahzad, F.; Huang, Z.; Memon, W. Process Monitoring Using Kernel PCA and Kernel Density Estimation-Based SSGLR Method for Nonlinear Fault Detection. Appl. Sci. 2022, 12, 2981. [Google Scholar] [CrossRef]



| Variables | Description |
|---|---|
| x1 | A Feed (Stream 1) |
| x2 | D Feed (Stream 2) |
| x3 | E Feed (Stream 3) |
| x4 | Total Feed (Stream 4) |
| x5 | Recycle Flow (Stream 8) |
| x6 | Reactor Feed Rate (Stream 6) |
| x7 | Reactor Pressure |
| x8 | Reactor Level |
| x9 | Reactor Temperature |
| x10 | Purge Rate (Stream 9) |
| x11 | Product Sep Temp |
| x12 | Product Sep Level |
| x13 | Product Sep Pressure |
| x14 | Product Sep Underflow (Stream 10) |
| x15 | Stripper level |
| x16 | Stripper Pressure |
| x17 | Stripper Underflow (Stream 11) |
| x18 | Stripper Temperature |
| x19 | Stripper Steam Flow |
| x20 | Compressor Work |
| x21 | Reactor Cooling Water Temperature |
| x22 | Separator Cooling Water Temperature |
| Fault Number | Description | Type |
|---|---|---|
| IDV (6) | A feed loss | Step |
| IDV (11) | Reactor cooling water inlet temperature | Random variation |
| IDV (14) | Reactor cooling water | Sticking |
| RBC-KPCA Based on Q Index | RBC-RRKPCA Based on Q Index | RBC-KGLRT Based on KPCA | RBC-KGLRT Based on RRKPCA | |||||||||
|---|---|---|---|---|---|---|---|---|---|---|---|---|
| FAR | GDR | CT(s) | FAR | GDR | CT(s) | FAR | GDR | CT(s) | FAR | GDR | CT(s) | |
| IDV (6) | 6.25 | 100 | 2.53 | 32.14 | 100 | 1.11 | 1.33 | 100 | 2.03 | 0.44 | 100 | 0.97 |
| IDV (11) | 12.05 | 65.07 | 2.76 | 39.7 | 89.17 | 0.94 | 6.25 | 91.49 | 2.56 | 3.57 | 95 | 0.86 |
| IDV (14) | 10.26 | 100 | 2.23 | 41.07 | 100 | 0.94 | 4.91 | 99.87 | 1.79 | 3.57 | 100 | 0.84 |
| IDV (6) | IDV (11) | IDV (14) | ||||
|---|---|---|---|---|---|---|
| GLR | TC | GLR | TC | GLR | TC | |
| RBC-KPCA based on Q index | 99.58 | 0.117 | 99.48 | 0.107 | 99.47 | 0.109 |
| RBC-RRKPCA based on Q index | 100 | 0.022 | 99.22 | 0.005 | 99.48 | 0.07 |
| RBC-KGLRT based on KPCA | 100 | 0.117 | 99.48 | 0.103 | 99.74 | 0.106 |
| RBC-KGLRT based on RRKPCA | 100 | 0.006 | 100 | 0.004 | 99.87 | 0.006 |
Disclaimer/Publisher’s Note: The statements, opinions and data contained in all publications are solely those of the individual author(s) and contributor(s) and not of MDPI and/or the editor(s). MDPI and/or the editor(s) disclaim responsibility for any injury to people or property resulting from any ideas, methods, instructions or products referred to in the content. |
© 2026 by the authors. Licensee MDPI, Basel, Switzerland. This article is an open access article distributed under the terms and conditions of the Creative Commons Attribution (CC BY) license.
Share and Cite
Lahdhiri, H.; Hamrouni, I.; Taouali, O.; Alshehri, A.; Aloufi, E. New Fault Diagnosis Strategy Based on KGLRT Chart for Monitoring Chemical Processes. Appl. Sci. 2026, 16, 3334. https://doi.org/10.3390/app16073334
Lahdhiri H, Hamrouni I, Taouali O, Alshehri A, Aloufi E. New Fault Diagnosis Strategy Based on KGLRT Chart for Monitoring Chemical Processes. Applied Sciences. 2026; 16(7):3334. https://doi.org/10.3390/app16073334
Chicago/Turabian StyleLahdhiri, Hajer, Imen Hamrouni, Okba Taouali, Ali Alshehri, and Esam Aloufi. 2026. "New Fault Diagnosis Strategy Based on KGLRT Chart for Monitoring Chemical Processes" Applied Sciences 16, no. 7: 3334. https://doi.org/10.3390/app16073334
APA StyleLahdhiri, H., Hamrouni, I., Taouali, O., Alshehri, A., & Aloufi, E. (2026). New Fault Diagnosis Strategy Based on KGLRT Chart for Monitoring Chemical Processes. Applied Sciences, 16(7), 3334. https://doi.org/10.3390/app16073334