1. Introduction
The digital visualization of three-dimensional space has transformed teaching, communication, and understanding in disciplines that involve complex environments. Within this context, virtual tours have emerged as a versatile and accessible tool for exploring real or digitally modelled spaces, enabling active and immersive learning experiences. Current approaches range from 360° photographic environments to fully modelled 3D simulations developed with game engines, offering different levels of realism and interactivity [
1]. In educational and communicative contexts, virtual reality (VR) further expands this potential by allowing users to “enter” simulated spaces, thereby enhancing spatial perception, supporting decision-making, and fostering empathy toward real working or intervention conditions in fields such as architecture, landscape studies, and healthcare [
2,
3]. These applications have proven especially relevant in museum education, virtual field trips, and the exploration of inaccessible or hazardous environments.
Virtual tours not only reproduce existing spaces but also function as experimental environments in which interaction, perception, and learning variables can be systematically examined. In healthcare education, this capability allows for the recreation of restricted areas (such as operating rooms or intensive care units) for training purposes, without compromising real-world safety or requiring physical occupation of the space. Empirical research has consistently demonstrated the pedagogical benefits of virtual tours across various educational levels. A systematic review by Hamilton [
4] found that immersive VR was pedagogically superior to lower-immersion alternatives in most studies analyzed. In science and field-based education, virtual tours have been shown to improve motivation, learning retention, accessibility, and contextualized understanding, while also enabling experiences in inaccessible or unsafe environments [
5,
6]. Similar benefits have been reported in engineering and history education, where immersive environments support spatial understanding and critical analysis [
7,
8]. In healthcare training, their value is especially clear, as they provide safe access to restricted clinical spaces; prior research also suggests that immersive formats can improve enjoyment and perceived ease of use, even when objective learning gains are not always significantly higher [
9]. Overall, virtual tours offer important advantages in accessibility, realism, motivation, safety, and cost-efficiency, although their adoption still faces practical and technical constraints [
10].
Virtual tours can be developed using different technological approaches. One of the most accessible is 360° spherical photography, which allows complete environments to be captured quickly and realistically. When linked through specialized software or integrated into platforms such as Unity, these images create navigable experiences with high visual realism, although movement is usually limited to transitions between fixed viewpoints. Their main advantage lies in their accessibility, as they can be displayed efficiently on desktop computers, mobile devices, and virtual reality headsets [
11].
By contrast, fully modelled 3D environments require a digital modelling process (often based on BIM tools, scanning, or photogrammetry) and subsequent implementation in graphical engines such as Unity or Unreal Engine. This approach enables continuous navigation, object manipulation, and richer forms of interaction, which can support more complex educational simulations [
12]. However, it also involves greater development effort and higher technical demands.
One of the key design decisions in educational virtual tours is the choice between 360° panoramic photography and fully modelled 3D environments. This choice involves trade-offs in realism, interactivity, production time, technical complexity, and pedagogical effectiveness. Comparative research suggests that 360° environments are generally faster and less costly to develop, while still achieving learning outcomes comparable to, and in some cases better than, those of 3D-modelled environments [
13]. Other studies highlight that spherical images offer practical advantages such as full-scene capture and lower data-collection demands, whereas fully modelled 3D environments require more specialized tools, skills, and production effort [
14,
15]. From an educational perspective, the choice depends on the learning objective: 360° photography is especially useful for the faithful exploration of real spaces, while 3D modelling is better suited to situations requiring interaction, manipulation, or a deeper understanding of spatial relationships [
13,
14,
15].
The distinction between these two approaches extends beyond capture techniques and relates directly to the level of immersion experienced by the user. The literature differentiates between low-immersion environments (typically displayed on flat computer screens) and high-immersion environments delivered through virtual reality devices that occupy the entire field of view and enable head and body tracking [
2]. This distinction is fundamental, as immersion and presence constitute key variables in understanding how users cognitively and emotionally engage with digital learning environments, and are key determinants of user experience (UX) and learning-related perceptions [
5,
12].
Research on virtual environments has demonstrated that the type of representation influences not only spatial perception but also the cognitive processes associated with learning. Previous studies conducted in natural and urban settings have shown that 3D environments developed using game engines generate higher levels of motivation and flow compared to static visualizations [
12]. Conversely, 360° photographic environments facilitate immediate identification with real-world settings, enhancing their applicability in heritage education and dissemination contexts [
11]. These approaches should therefore not be considered mutually exclusive, but rather complementary, depending on pedagogical and communicative objectives.
The research presented in this article is situated at the intersection of these lines of inquiry and proposes a systematic comparison of four visualization modalities applied to the same hospital environment: (1) a 360° photo-based virtual tour viewed on a desktop computer (low immersion); (2) a 360° photo-based tour experienced using Meta Quest 2 head-mounted displays (high immersion); (3) a 3D environment modelled in Revit and viewed on a desktop computer; and (4) the same 3D model experienced through Meta Quest 2 devices. This experimental design enables an analysis of how the combination of capture technology (360° photography vs. 3D modelling) and visualization device (PC vs. VR) influences subjective user experience, perceived learning, and physical comfort.
The application of these technologies to hospital environments is of particular relevance. Surgical spaces are restricted areas governed by strict sterility and safety protocols, where in-person training activities are often difficult to conduct. Virtual tours offer an effective alternative for training in spatial orientation, procedural preparation, and familiarization with technical equipment, without interfering with clinical activity. Moreover, they provide an opportunity to examine how immersion and cognitive load affect the learning of complex tasks, an issue of particular importance in healthcare and technical education.
The comparison between 3D environments and 360° photographic tours in a hospital context also provides a relevant methodological contribution, as it allows for an evaluation of the extent to which visual fidelity and navigational freedom influence spatial understanding and the sense of presence. While 360-based environments offer photorealistic representations of existing spaces, 3D models enable direct interaction with objects and the simulation of actions, potentially fostering deeper cognitive engagement. Identifying which combination of variables produces a more effective learning experience is essential for guiding the design of future educational applications in healthcare, engineering, and heritage contexts.
In summary, virtual tours are no longer a technological novelty but a mature educational tool with expanding applications across healthcare, engineering, architecture, geography, art, and heritage studies. Based on the literature reviewed above, educational virtual tours appear to offer substantial pedagogical value, particularly when they provide access to complex or otherwise inaccessible environments. Previous studies suggest that both the level of immersion and the type of representation may influence users’ sense of presence, engagement, usability, and learning-related perceptions. However, there is still limited evidence on how these two factors jointly shape user experience in comparable educational virtual tours. In particular, it remains unclear whether the benefits observed in immersive virtual reality are primarily associated with the visualization device, with the representational format of the environment, or with the interaction between both variables. To address this gap, the present study formulates the following research questions (RQ).
RQ1. To what extent does the visualization device (desktop PC vs. immersive VR) affect user experience in educational virtual tours?
RQ2. To what extent does the representation format (360° photographs vs. 3D models) affect user experience in educational virtual tours?
RQ3. How do visualization device and representation format influence perceived learning in educational virtual tours?
RQ4. Are there differences in physical comfort and adverse effects across visualization devices and representation formats?
These research questions are addressed through a within-subject design comparing four virtual tour modalities: 360° photographs on a desktop PC, 360° photographs in immersive VR, 3D models on a desktop PC, and 3D models in immersive VR. User experience is evaluated through the adapted QUXiVE questionnaire, which includes dimensions related to presence, engagement, immersion, flow, usability, emotion, judgment, physical consequences, and perceived learning.
2. Methodology
2.1. Participants
The research involved a sample of 89 first-year undergraduate engineering students from the University of La Laguna. Following an initial data screening, 84 responses were deemed valid, while five were excluded due to incomplete data or recording errors. Participants’ ages ranged from 18 to 22 years, and they reported no significant prior experience with virtual reality environments. This sample was selected because the main objective of the study was to compare user experience across visualization formats and display modes, rather than to assess domain-specific clinical knowledge. In this sense, participants without specialized healthcare training were considered suitable for evaluating general experiential dimensions such as immersion, presence, usability, engagement, and physical effects, while also reducing potential bias associated with prior familiarity with operating-room procedures. Participation was strictly voluntary and anonymous. Prior to participation, all students were informed about the objectives and procedures of the study, and verbal consent to participate was obtained.
2.2. Design and Development of the Virtual Environments
The study utilized two distinct virtual environments representing a hospital operating room and its adjacent areas: one based on 360° spherical photography and another on three-dimensional (3D) modeling. Both environments were developed to facilitate a comparative analysis between the visual realism inherent in photographic capture and the interactive flexibility afforded by fully modeled 3D spaces.
For the 360° photographic tour, spherical images were captured using an Insta360 X4 camera (Arashi Vision Inc., Shenzhen, China) at the facilities of the Hospital Universitario Nuestra Señora de La Candelaria (Tenerife, Spain), operating under the appropriate institutional authorization. The image dataset was processed and assembled within the Unity 3D engine using the commercial asset ‘Vour’, a cost-effective tool that facilitates the creation of interactive tours via navigation nodes (hotspots). The final application was exported utilizing the WebXR standard, enabling deployment on both personal computers (low-immersion environments) and Meta Quest 2 headsets (high-immersion environments; Meta Platforms Inc., Menlo Park, CA, USA). The scenes incorporate interactive waypoints allowing virtual locomotion between the corridor, pre-operating room, scrub area, operating room, utility room, and waiting room. This tour can be accessed at:
https://quirofanovr.jls.name/ (accessed on 10 March 2026).
Conversely, the fully 3D environment was constructed by integrating various digital modeling tools. Autodesk Revit was employed for the architectural and structural modeling of the facility, while Autodesk Fusion was used to recreate specialized medical equipment (such as the portable radiology unit). Additionally, commercial 3D assets were integrated to supply the surgical furniture and instrumentation. Subsequently, the complete environment was imported into Unity 3D, where textures, colliders, lighting, and shadows were configured. The model underwent extensive optimization to minimize file size and ensure optimal performance and framerates across both WebGL builds (for desktop browser execution) and native APK formats (for direct installation on Meta Quest 2 headsets). This environment is accessible at:
https://quirofano2.jls.name/ (accessed on 10 March 2026).
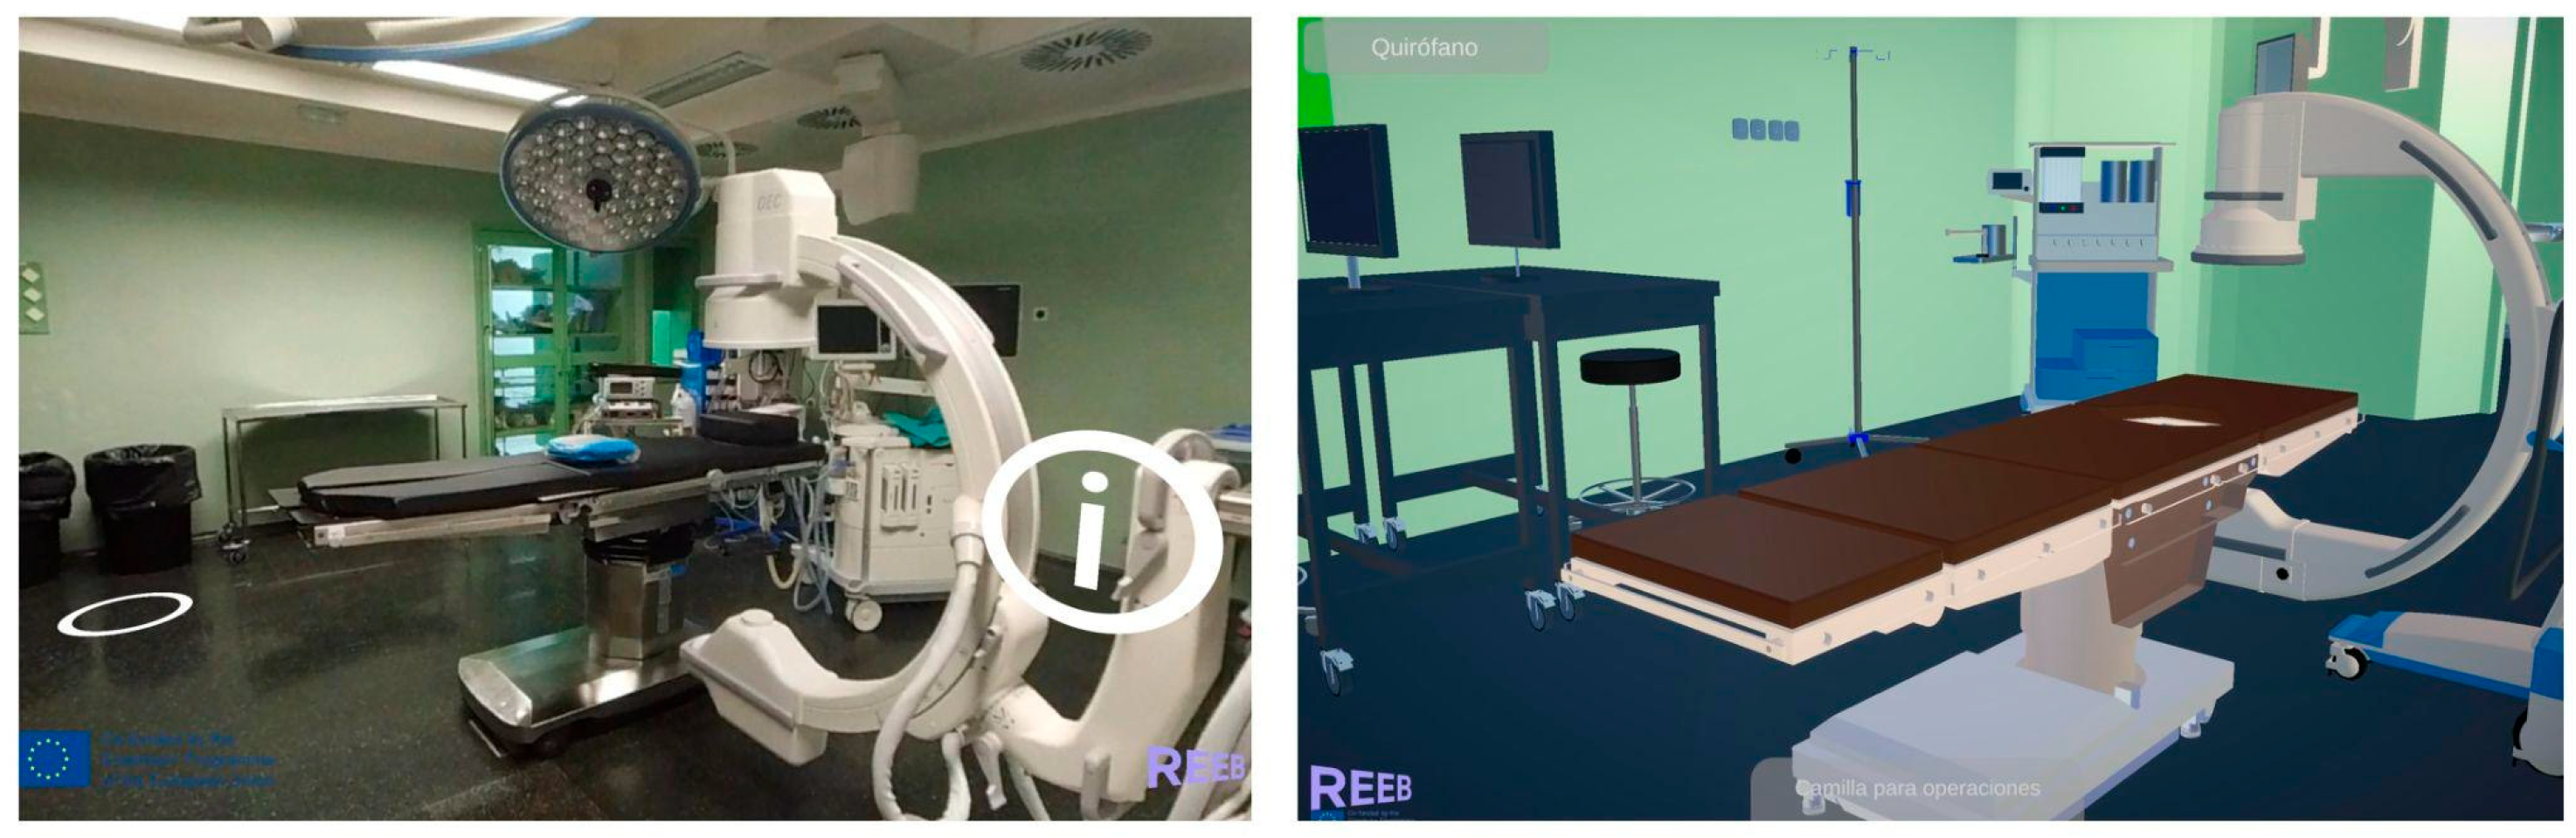
From a visual perspective, the 360° photographic environment delivers an exceptionally high level of realism, accurately reflecting the real-world lighting, reflections, and textures of the physical operating room. In contrast, the 3D model presents a more schematic aesthetic, as illustrated in
Figure 1. This figure provides a direct visual comparison between the two representation formats used in the study. As can be observed, the 360° environment offers greater photorealism and fidelity to the real operating room, whereas the 3D-modelled environment presents a more schematic appearance but allows greater spatial abstraction and interactive flexibility.
2.3. Hardware and Software
Desktop visualization was performed on classroom PCs running Windows 10 and equipped with 24-inch Full HD monitors, keyboards, and mice. The immersive conditions were experienced using Meta Quest 2 headsets with Touch controllers. All virtual environments were developed in Unity 3D 2022. The 360° photographic tour was deployed through WebXR both on desktop PCs and on Meta Quest 2. The 3D environment was executed as a WebGL build on desktop PCs and as a native APK on Meta Quest 2. The VR experiences were conducted in a standing position under instructor supervision. No audio was used in any of the four experimental conditions.
2.4. User Experience Measurement
Several validated self-report instruments have been used to assess user experience in virtual environments, focusing on constructs such as presence, usability, immersion, engagement, and satisfaction. Among the most widely used are the Igroup Presence Questionnaire (IPQ) [
16,
17], the User Experience Questionnaire (UEQ) [
18], the QUXiVE framework developed by Tcha-Tokey [
19,
20], and the Multimodal Presence Scale (MPS) [
21,
22]. Recent reviews have highlighted both the diversity of available VR assessment tools and the importance of selecting instruments that are psychometrically robust and appropriate to the specific research context [
23]. In the present study, user experience was assessed using an adapted version of QUXiVE [
19,
20], as it provides a multidimensional evaluation well suited to comparing the four experimental conditions examined here.
As recommended by the original authors [
19,
20], the questionnaire was adapted to the specific characteristics of the hospital virtual tours. The final version consisted of 19 items organized into nine dimensions: presence, engagement, immersion, flow, usability, emotion, judgment, physical consequences, and perceived learning. All items were rated on a 10-point Likert scale ranging from 1 (strongly disagree) to 10 (strongly agree). The distribution of items across dimensions was as follows—presence (items 1–4), engagement (items 5–6), immersion (items 7–9), flow (item 10), usability (item 11), emotion (items 12–13), judgment (items 14–16), physical consequences (items 17–18), and perceived learning (item 19)—as shown in
Table 1. The adapted version preserved the original structure of the instrument while selecting the items most relevant to the characteristics of the virtual tours evaluated in this study.
As the main aim of the study was to compare user experience across four visualization conditions, the adapted QUXiVE was used as a concise multidimensional instrument for broad subjective assessment. This decision was also motivated by the within-subject design, in which each participant experienced four virtual tours and completed four questionnaires; therefore, keeping the instrument brief was important to reduce fatigue and avoid overburdening participants. Accordingly, some dimensions were represented by a limited number of items and were interpreted as indicative subjective ratings rather than exhaustive measures of the underlying constructs. In particular, the perceived learning item should be understood as a general indicator of perceived educational usefulness, rather than as a measure of healthcare-specific learning or actual learning outcomes.
2.5. Procedure
Data collection took place during practical laboratory sessions conducted over two consecutive days. Students were organized into groups of approximately twenty participants. In each session, participants first explored the desktop-based modalities (360° photographic tour and 3D model) and then the immersive modalities using Meta Quest 2 headsets. Each virtual tour lasted approximately five minutes, and the QUXiVE questionnaire was completed immediately after each experience. Due to hardware availability constraints, the VR conditions were carried out in pairs, while the remaining students completed complementary tasks as they waited for their turn. A small number of participants who were unable to complete the VR tours during their assigned session finished them the following week in the same laboratory setting and time slot. Overall, each group required approximately one hour to complete the four visualization modalities.
Before starting the experiment, all participants received the same verbal instructions regarding navigation, device use, and questionnaire completion after each condition. The immersive sessions with Meta Quest 2 were conducted in a standing position and under continuous instructor supervision. All sessions took place in a controlled laboratory environment with neutral lighting and no external noise. The instructor ensured correct equipment operation, controller calibration, and the resolution of technical issues related to WebXR connectivity, lens adjustment, battery management, and device synchronization. No audio was used in any of the conditions.
To support comparability across conditions, all four modalities represented the same hospital environment and maintained equivalent spatial content and navigational purpose, varying only in representation format (360° photography vs. 3D modelling) and display mode (desktop PC vs. immersive VR).
2.6. Data Analysis
For each participant and experimental condition, scores were calculated for all QUXiVE dimensions. In the case of multi-item dimensions, the score was obtained as the mean of the corresponding items; single-item dimensions were analyzed using the original item score. Descriptive statistics (mean and standard deviation) were computed for each dimension under the four experimental conditions. Internal consistency of the adapted questionnaire was assessed using Cronbach’s alpha.
Given the within-subject 2 × 2 design of the study, inferential analyses were conducted using two-way repeated-measures analyses of variance (ANOVA), with two within-subject factors: display mode (desktop PC vs. immersive VR) and representation format (360° photographs vs. 3D models). This analysis was performed separately for each dependent variable and tested the main effect of display mode, the main effect of representation format, and the interaction between both factors.
When interaction effects were significant, follow-up pairwise comparisons were planned to clarify the direction of the observed differences. Effect sizes were reported using partial eta squared (ηp2). Statistical significance was set at p < 0.05. Because the presentation order was not counterbalanced, the effect associated with display mode was interpreted with caution, as it may have been partially influenced by familiarization or fatigue effects.
2.7. AI-Assisted Writing Support
After data collection and statistical analyses had been completed by the authors, ChatGPT (OpenAI, GPT-5.2 Thinking) was used as a language-support tool to improve the wording and clarity of the methodological description and to refine the presentation of the statistical analyses. The authors generated the primary data, defined the methodology, verified the final analyses, and made all final decisions regarding the content of the manuscript.
3. Results
Following data screening, 84 valid cases were retained from a total of 89 participants, corresponding to a response rate of 94.3%. Each participant completed the four visualization conditions (360° photographs on a desktop PC, 360° photographs in immersive VR, 3D models on a desktop PC, and 3D models in immersive VR) and completed the adapted QUXiVE questionnaire immediately after each experience. To examine the internal consistency of the instrument, Cronbach’s alpha was calculated for each condition. The values obtained indicated adequate to high reliability in all cases: α = 0.77 for the 360° photographic tour on a desktop PC, α = 0.85 for the 360° photographic tour in Meta Quest 2, α = 0.88 for the 3D environment on a desktop PC, and α = 0.82 for the 3D environment in Meta Quest 2.
Table 2 presents the mean scores for each QUXiVE subscale in the four experimental conditions. Descriptively, the highest values were generally observed in the 3D model experienced through Meta Quest 2, whereas the lowest scores were concentrated in the desktop conditions. Usability remained high across all four modalities, while perceived learning also showed high mean scores in every condition. Presence and immersion reached their highest mean values in the 3D environment experienced through Meta Quest 2. The desktop conditions, although showing lower scores in immersion and flow, maintained high mean values in usability and perceived learning.
To test the effects of display mode and representation format, a series of two-way repeated-measures ANOVAs were conducted for each QUXiVE dimension, with display mode (desktop PC vs. immersive VR) and representation format (360° photographs vs. 3D models) as within-subject factors. The results of these analyses are summarized in
Table 3.
A significant main effect of display mode was found for presence, F(1,83) = 13.53, p = 0.0004, ηp2 = 0.140; engagement, F(1,83) = 26.90, p < 0.001, ηp2 = 0.245; immersion, F(1,83) = 301.73, p < 0.001, ηp2 = 0.784; flow, F(1,83) = 158.63, p < 0.001, ηp2 = 0.657; emotion, F(1,83) = 111.44, p < 0.001, ηp2 = 0.573; judgment, F(1,83) = 62.26, p < 0.001, ηp2 = 0.429; physical consequences, F(1,83) = 60.55, p < 0.001, ηp2 = 0.422; and perceived learning, F(1,83) = 36.60, p < 0.001, ηp2 = 0.306. No significant main effect of display mode was found for usability, F(1,83) = 1.22, p = 0.273.
A significant main effect of representation format was observed for presence, F(1,83) = 9.73, p = 0.0025, ηp2 = 0.105; emotion, F(1,83) = 5.79, p = 0.018, ηp2 = 0.065; and perceived learning, F(1,83) = 6.22, p = 0.015, ηp2 = 0.070. No significant main effect of representation format was found for engagement, flow, immersion, usability, judgment, or physical consequences.
No significant interaction effects between display mode and representation format were found for any of the analyzed dimensions (p > 0.05 in all cases). This indicates that the effect of immersive VR was generally consistent across both types of virtual environments, without evidence that the impact of display mode depended strongly on whether the tour was based on 360° photography or 3D modelling.
Overall, the inferential analysis indicates that display mode was the factor with the strongest and most consistent effect on subjective user experience. Compared with a desktop PC, immersive VR was associated with higher ratings in presence, engagement, immersion, flow, emotion, judgment, and perceived learning, although it was also associated with higher physical-consequence scores. By contrast, the effect of representation format was more limited, although 3D environments obtained significantly higher scores than 360° environments in presence, emotion, and perceived learning. Usability remained stable across all four conditions, with no significant differences attributable to either display mode or representation format.
4. Discussion
The results of this study support the relevance of virtual environments as tools for familiarization with complex indoor spaces such as hospital operating rooms. More specifically, the inferential analysis indicates that display mode was the factor with the strongest and most consistent effect on subjective user experience. Compared with desktop visualization, immersive VR produced significantly higher scores in presence, engagement, immersion, flow, emotion, judgment, and perceived learning, although it was also associated with higher scores in physical consequences. This pattern is consistent with previous studies [
2,
12,
24], which have shown that greater technological immersion tends to intensify cognitive and affective involvement in educational virtual environments. An additional factor that may have influenced the immersive-VR ratings is the limited prior experience with head-mounted displays reported by the participants. In novice users, some of the higher scores in dimensions such as emotion, engagement, or immersion may reflect a novelty or “wow effect” associated with the technology itself, rather than only the educational characteristics of the virtual tour. Recent work has also shown that stereoscopic properties in VR may affect behavioral performance in some tasks and populations, suggesting that immersive experience should be understood as the combined result of multiple perceptual and sensorimotor factors [
25]. At the same time, the increase observed in physical-consequence scores is also in line with the literature warning that immersive systems may enhance presence and engagement while also increasing discomfort or cybersickness in some users [
2,
12].
These differences may be related not only to the general distinction between desktop and immersive visualization, but also to specific constituent features of VR. In immersive head-mounted displays, stereoscopic depth cues, wider field-of-view occupation, and visuomotor coupling between head movements and visual updating may contribute to a stronger sense of spatial presence and embodied engagement. At the same time, these same characteristics may also increase cognitive and perceptual demands, which could help explain the higher physical-consequence scores observed in the immersive conditions. From this perspective, the benefits of immersive VR should be understood not as a single undifferentiated effect, but as the combined result of several perceptual, motor, and affective components that shape the overall user experience.
With regard to representation format, the results were more nuanced. The 3D-modelled environments obtained significantly higher scores than the 360° photographic environments in presence, emotion, and perceived learning, whereas no significant differences were found for engagement, immersion, flow, usability, judgment, or physical consequences. These findings suggest that representation format does influence some aspects of the experience, but to a lesser extent than display mode. In this sense, the results are compatible with previous work showing that interactive 3D environments may support richer exploration and stronger involvement with spatial content [
12,
26], while 360° tours remain highly effective as realistic and accessible tools for virtual exploration in educational contexts such as heritage or geography [
1,
11].
An important finding is that no significant interaction was found between display mode and representation format in any of the analyzed dimensions. This indicates that the positive effect associated with immersive VR was generally similar in both 360° and 3D conditions, rather than being strongly dependent on the representational format. Therefore, although the 3D model experienced through Meta Quest 2 reached the highest descriptive means in several subscales, the statistical results do not support interpreting this specific combination as uniquely superior. Instead, the findings suggest that immersive display enhances user experience across both types of virtual tours, while 3D representation provides additional but more limited advantages in selected dimensions.
The results concerning usability are also noteworthy. Despite the substantial differences observed in immersion-related dimensions, usability remained high and statistically stable across all four conditions. This finding is consistent with the work of Tcha-Tokey et al. [
19], which emphasizes the role of interface clarity and interaction naturalness in shaping the overall experience. In practical terms, this suggests that both desktop and immersive versions of the virtual tours were successfully implemented from an interaction standpoint, allowing users to complete the experiences without major usability barriers.
The perceived-learning results should be interpreted with particular caution. Although this dimension showed significantly higher ratings in immersive VR and in 3D environments, it was measured through a single item referring to the perceived usefulness of the environment for disseminating and learning practical content. Consequently, it should be understood as a general indicator of perceived educational usefulness rather than as evidence of actual learning gains. This interpretation is especially important in the present study, since the participants were engineering students rather than healthcare trainees. For this reason, the findings are more informative about comparative user experience and general educational appraisal than about domain-specific healthcare learning.
From an applied perspective, the findings support the educational value of both approaches, but for partly different reasons. Immersive VR appears particularly effective in intensifying presence, emotional engagement, and experiential involvement, whereas 3D modelling may offer added value when spatial exploration and interactive freedom are educationally relevant. At the same time, 360° photographic environments remain a practical and visually realistic alternative, especially in contexts where rapid development, scalability, and low technical complexity are priorities. In this sense, the results suggest that the choice between 360° photography and 3D modelling should depend not only on technological possibilities, but also on pedagogical goals, available infrastructure, and production resources.
These conclusions also have implications for educational practice. The development process showed that 360° tours are generally easier and faster to produce, making them more accessible for instructors who wish to create realistic virtual visits with limited technical support. By contrast, 3D-modelled environments require a more complex production workflow, but may provide additional pedagogical possibilities when active spatial exploration is a priority. Rather than treating both approaches as competing solutions, the present findings support understanding them as complementary resources within a broader ecosystem of immersive learning.
5. Conclusions
This study provides a direct response to the research questions formulated in the Introduction. Regarding RQ1, the results indicate that display mode had the strongest and most consistent effect on subjective user experience, with immersive virtual reality being associated with higher ratings in presence, immersion, emotion, and perceived educational usefulness. Regarding RQ2, representation format also influenced user experience, although its effect was more limited; in general, 3D-modelled environments showed some advantages over 360° photographic tours in selected dimensions. Concerning RQ3, both display mode and representation format affected the perceived-learning item, which in this study was interpreted as a general indicator of perceived educational usefulness. Finally, in relation to RQ4, immersive VR was also associated with higher physical-consequence scores, indicating that the benefits of immersion should be considered together with possible discomfort effects.
From an applied perspective, immersive virtual reality appears to enhance user engagement and experiential intensity, while 3D-modelled environments may provide additional advantages in terms of spatial freedom and active exploration. At the same time, 360° photo-based tours remain a rapid, cost-effective, and visually realistic alternative for large-scale educational projects. Taken together, these findings support the value of virtual tours as a flexible resource in higher education, particularly in contexts where physical access to real environments is limited.
However, these results should be interpreted in light of several limitations. First, the order of presentation was not counterbalanced, as participants completed the desktop conditions before the immersive VR conditions for logistical reasons; therefore, order, familiarization, or fatigue effects cannot be completely ruled out. Second, the sample consisted of first-year engineering students, which was appropriate for comparing general user experience across formats and devices, but limits the direct generalization of the findings to healthcare-specific educational contexts. Third, the evaluation relied exclusively on self-report data collected through an adapted 19-item version of QUXiVE. Because the questionnaire had to be completed four times by each participant, some dimensions were represented by a limited number of items and should therefore be interpreted as brief subjective indicators rather than exhaustive measures of the underlying constructs. In particular, the perceived learning item should be understood as a general indicator of perceived educational usefulness, not as a measure of actual learning outcomes.
Future research should address these limitations by counterbalancing the exposure order, including participants from healthcare disciplines and other academic backgrounds, and incorporating objective measures such as task performance, error rates, cognitive load, eye tracking, or physiological indicators. It would also be valuable to examine longer exposure times and additional design variables, including locomotion techniques, interaction mechanics, and levels of realism. Future research could also examine the educational potential of 360° stereoscopic panoramas, particularly as a way of combining the visual realism of panoramic images with a stronger perception of depth in immersive viewing conditions. Practical implementation issues such as WebXR deployment and headset management in authentic educational settings should also be considered.



 ,
,