Environmental Trade-Offs in Phosphorus Recovery: A Comparative LCA of Pyrolysis and Hydrothermal Carbonization of Poultry Manure


Abstract
1. Introduction
2. Materials and Methods
2.1. Goal and Scope Definition
- Functional Unit
- System Boundaries
2.2. Life Cycle Inventory (LCI) Analysis
2.2.1. Data Collection and Assumptions
2.2.2. Scale-Up Framework
2.3. Life Cycle Impact Assessment (LCIA)
3. Results
3.1. Impact Assessment Results for Pyrolysis Scenario
3.2. Impact Assessment Results for HTC Scenario
3.3. Uncertainty Analysis
4. Discussion
5. Conclusions
- Substitution of single-use mineral acids (H2SO4) with regenerable acids (H3PO4) or waste acids, as exemplified by the Ecophos model.
- Optimizing P-distribution in solid/liquid phases to reduce chemical consumption per functional unit.
- Utilizing the residual solid by-product as an energy source to increase the system’s carbon credit.
Author Contributions
Funding
Institutional Review Board Statement
Informed Consent Statement
Data Availability Statement
Conflicts of Interest
References
- Ogwu, M.C.; Patterson, M.E.; Senchak, P.A. Phosphorus mining and bioavailability for plant acquisition: Environmental sustainability perspectives. Environ. Monit. Assess. 2025, 197, 572. [Google Scholar] [CrossRef] [Scilit]
- European Commission. Critical Raw Materials for the EU: Report of the Ad Hoc Working Group on Defining Critical Raw Materials; European Commission: Brussels, Belgium, 2014. [Google Scholar]
- Brownlie, W.J.; Alexander, P.; Cordell, D.; Maslin, M.; Metson, G.S.; Sutton, M.A.; Spears, B.M. National phosphorus planning for food and environmental security. Curr. Opin. Biotechnol. 2024, 90, 103226. [Google Scholar] [CrossRef] [Scilit] [PubMed]
- Rashmi, I.; Biswas, A.K.; Ramkrishana, V.R.P. Phosphorus management in agriculture: A review. Agric. Rev. 2014, 35, 261–270. [Google Scholar] [CrossRef] [Scilit]
- Cordell, D.; Drangert, J.-O.; White, S. The story of phosphorus: Global food security and food for thought. Glob. Environ. Change 2009, 19, 292–305. [Google Scholar] [CrossRef] [Scilit]
- Lee, S.; Kim, J.; Byun, J.; Joo, J.; Lee, Y.; Kim, T.; Hwangbo, S.; Han, J.; Kim, S.-K.; Lee, J. Environmentally-viable utilization of chicken litter as energy recovery and electrode production: A machine learning approach. Appl. Energy 2023, 350, 121782. [Google Scholar] [CrossRef] [Scilit]
- Fahimi, A.; Massa, M.; Mousa, E.; Ye, G.; Predeanu, G.; Olgun, H.; Mousavinezhad, S.; Vahidi, E.; Valentim, B.; Białecka, B.; et al. Enhancing phosphorus recovery from poultry litter ash through microwave-assisted thermochemical treatment for improving its solubility. J. Environ. Manag. 2025, 379, 124802. [Google Scholar] [CrossRef] [Scilit]
- Christensen, M.L.; Cvitanich, C.; Quist-Jensen, C.A.; Thau, M.; Malmgren-Hansen, B. Precipitation and recovery of phosphorus from the wastewater hydrolysis tank. Sci. Total Environ. 2022, 813, 151875. [Google Scholar] [CrossRef] [Scilit]
- Topçu, N.S.; Duman, G.; Olgun, H.; Yanık, J. Evaluation of poultry manure: Combination of phosphorus recovery and activated carbon production. ACS Omega 2022, 7, 20666–20676. [Google Scholar] [CrossRef] [Scilit]
- Ekpo, U.; Ross, A.B.; Camargo-Valero, M.A.; Fletcher, L.A. Influence of pH on hydrothermal treatment of swine manure: Impact on extraction of nitrogen and phosphorus in process water. Bioresour. Technol. 2016, 214, 637–644. [Google Scholar] [CrossRef] [Scilit] [PubMed]
- Qaramaleki, S.V.; Villamil, J.A.; Mohedano, A.F.; Coronella, C.J. Factors affecting solubilization of phosphorus and nitrogen through hydrothermal carbonization of animal manure. ACS Sustain. Chem. Eng. 2020, 8, 12061–12072. [Google Scholar] [CrossRef] [Scilit]
- Pradel, M.; Aissani, L. Environmental impacts of phosphorus recovery from a “product” Life Cycle Assessment perspective: Allocating burdens of wastewater treatment in the production of sludge-based phosphate fertilizers. Sci. Total Environ. 2019, 656, 55–69. [Google Scholar] [CrossRef] [Scilit]
- Amann, A.; Remy, C.; Smol, M. Environmental impacts of phosphorus recovery from municipal wastewater: Comparative LCA of phosphorus recovery technologies. Resour. Conserv. Recycl. 2018, 130, 127–139. [Google Scholar] [CrossRef] [Scilit]
- Abdolrezayi, A.; Puricelli, S.; Dolci, G.; Turolla, A.; Canziani, R.; Rigamonti, L. Phosphorus recovery from sewage sludge ash: Life cycle inventory and critical review of LCA case studies. J. Environ. Manag. 2025, 389, 125620. [Google Scholar] [CrossRef] [Scilit]
- Smol, M.; Kulczycka, J.; Lelek, Ł.; Gorazda, K.; Wzorek, Z. Life Cycle Assessment (LCA) of the integrated technology for the phosphorus recovery from sewage sludge ash (SSA) and fertilizers production. Arch. Environ. Prot. 2020, 46, 42–52. [Google Scholar] [CrossRef] [Scilit]
- Linderholm, K.; Tillman, A.-M.; Mattsson, J.E. Life cycle assessment of phosphorus alternatives for Swedish agriculture. Resour. Conserv. Recycl. 2012, 66, 27–39. [Google Scholar] [CrossRef] [Scilit]
- Behjat, M.; Svanström, M.; Peters, G. Environmental assessment of phosphorus recovery from dairy sludge: A comparative LCA study. Waste Manag. 2024, 187, 50–60. [Google Scholar] [CrossRef] [Scilit]
- Bora, R.R.; Lei, M.; Tester, J.W.; Lehmann, J.; You, F. Life Cycle Assessment and Technoeconomic Analysis of Thermochemical Conversion Technologies Applied to Poultry Litter with Energy and Nutrient Recovery. ACS Sustain. Chem. Eng. 2020, 8, 8436–8447. [Google Scholar] [CrossRef] [Scilit]
- Preuss, N.B.; You, F. Comparative Life Cycle Analysis of Poultry Manure Management Technologies. Chem. Eng. Trans. 2023, 103, 97–102. [Google Scholar] [CrossRef]
- Zhao, N.; Lehmann, J.; You, F. Poultry Waste Valorization via Pyrolysis Technologies: Economic and Environmental Life Cycle Optimization for Sustainable Bioenergy Systems. ACS Sustain. Chem. Eng. 2020, 8, 4633–4646. [Google Scholar] [CrossRef] [Scilit]
- ISO 14040:2006; Environmental Management—Life Cycle Assessment—Principles and Framework. International Organization for Standardization: Geneva, Switzerland, 2006.
- Piccinno, F.; Hischier, R.; Seeger, S.; Som, C. From laboratory to industrial scale: A framework for chemical processes in life cycle assessment. J. Clean. Prod. 2016, 135, 1085–1097. [Google Scholar] [CrossRef] [Scilit]
- Mujumdar, A.S. (Ed.) Handbook of Industrial Drying, 4th ed.; CRC Press: Boca Raton, FL, USA, 2014. [Google Scholar] [CrossRef] [Scilit]
- Towler, G.; Sinnott, R. Chemical Engineering Design: Principles, Practice and Economics of Plant and Process Design; Butterworth-Heinemann: Oxford, UK, 2012. [Google Scholar]
- Perry, R.H.; Green, D.W. Perry’s Chemical Engineers’ Handbook, 8th ed.; McGraw-Hill: New York, NY, USA, 2008. [Google Scholar]
- Goel, S.; Kansal, A.; Pfister, S. Sourcing phosphorus for agriculture: Life cycle assessment of three options for India. Resour. Conserv. Recycl. 2021, 174, 105750. [Google Scholar] [CrossRef] [Scilit]
- Fonseca, S.; Gómez, A.; Rincón Prat, S.L. Comparative Life Cycle Assessment of Pyrolysis and Hydrothermal Carbonization for Sewage Sludge Treatment in Colombia. Sustainability 2026, 18, 254. [Google Scholar] [CrossRef] [Scilit]
- Havukainen, J.; Uusitalo, V.; Koistinen, K.; Liikanen, M.; Horttanainen, M. Carbon footprint evaluation of biofertilizers. Int. J. Sustain. Dev. Plan. 2018, 13, 1050–1060. [Google Scholar] [CrossRef] [Scilit]
- Gong, H.; Guo, Y.; Wu, J.; Wu, H.; Nkebiwe, P.M.; Pu, Z.; Feng, G.; Jiao, X. Synergies in sustainable phosphorus use and greenhouse gas emissions mitigation in China: Perspectives from the entire supply chain from fertilizer production to agricultural use. Sci. Total Environ. 2022, 838, 155997. [Google Scholar] [CrossRef] [Scilit]
- Lam, K.L.; Solon, K.; Jia, M.; Volcke, E.I.P.; van der Hoek, J.P. Life cycle environmental impacts of wastewater-derived phosphorus products: An agricultural end-user perspective. Environ. Sci. Technol. 2022, 56, 10289–10298. [Google Scholar] [CrossRef] [Scilit]
- Mayer, F.; Bhandari, R.; Gath, S.A. Life cycle assessment of prospective sewage sludge treatment paths in Germany. J. Environ. Manag. 2021, 290, 112557. [Google Scholar] [CrossRef] [Scilit] [PubMed]
- Ravi, R.; Beyers, M.; Bruun, S.; Meers, E. Life cycle assessment of struvite recovery and wastewater sludge end-use: A Flemish illustration. Resour. Conserv. Recycl. 2022, 182, 106325. [Google Scholar] [CrossRef] [Scilit] [PubMed]
- Pradel, M.; Lippi, M.; Daumer, M.-L.; Aissani, L. Environmental performances of production and land application of sludge-based phosphate fertilizers—A life cycle assessment case study. Environ. Sci. Pollut. Res. 2020, 27, 2054–2070. [Google Scholar] [CrossRef] [Scilit] [PubMed]
- Mirabi, M.; Javan, K.; Darestani, M.; Karrabi, M. Integrating Circular Economy and Life Cycle Assessment in Virtual Water Management: A Case Study of Food Consumption Across Economic Classes in Iran. Sustainability 2025, 17, 2743. [Google Scholar] [CrossRef] [Scilit]



| Parameter | Value/Assumption | Reference |
|---|---|---|
| Scale-up Methodology | Bottom-up Approach | [22] |
| Initial Moisture Content | 25% (wet basis) | Experimental/Field Data [9] |
| Drying Thermal Efficiency | 70% | [23] |
| Latent Heat of Water | 2260 kJ/kg | Thermodynamic Constant |
| Specific Heat Biomass | 1.6 kJ/kg °C | [24] |
| Reactor Efficiency | 85% (Electric heating) | [25] |
| Acid Consumption (Leaching) | Stoichiometric + 10% excess | Based on lab optimization (0.1 M) [9] |
| Neutralization Agent | NaOH (Stoichiometric) | Chemical calculation |
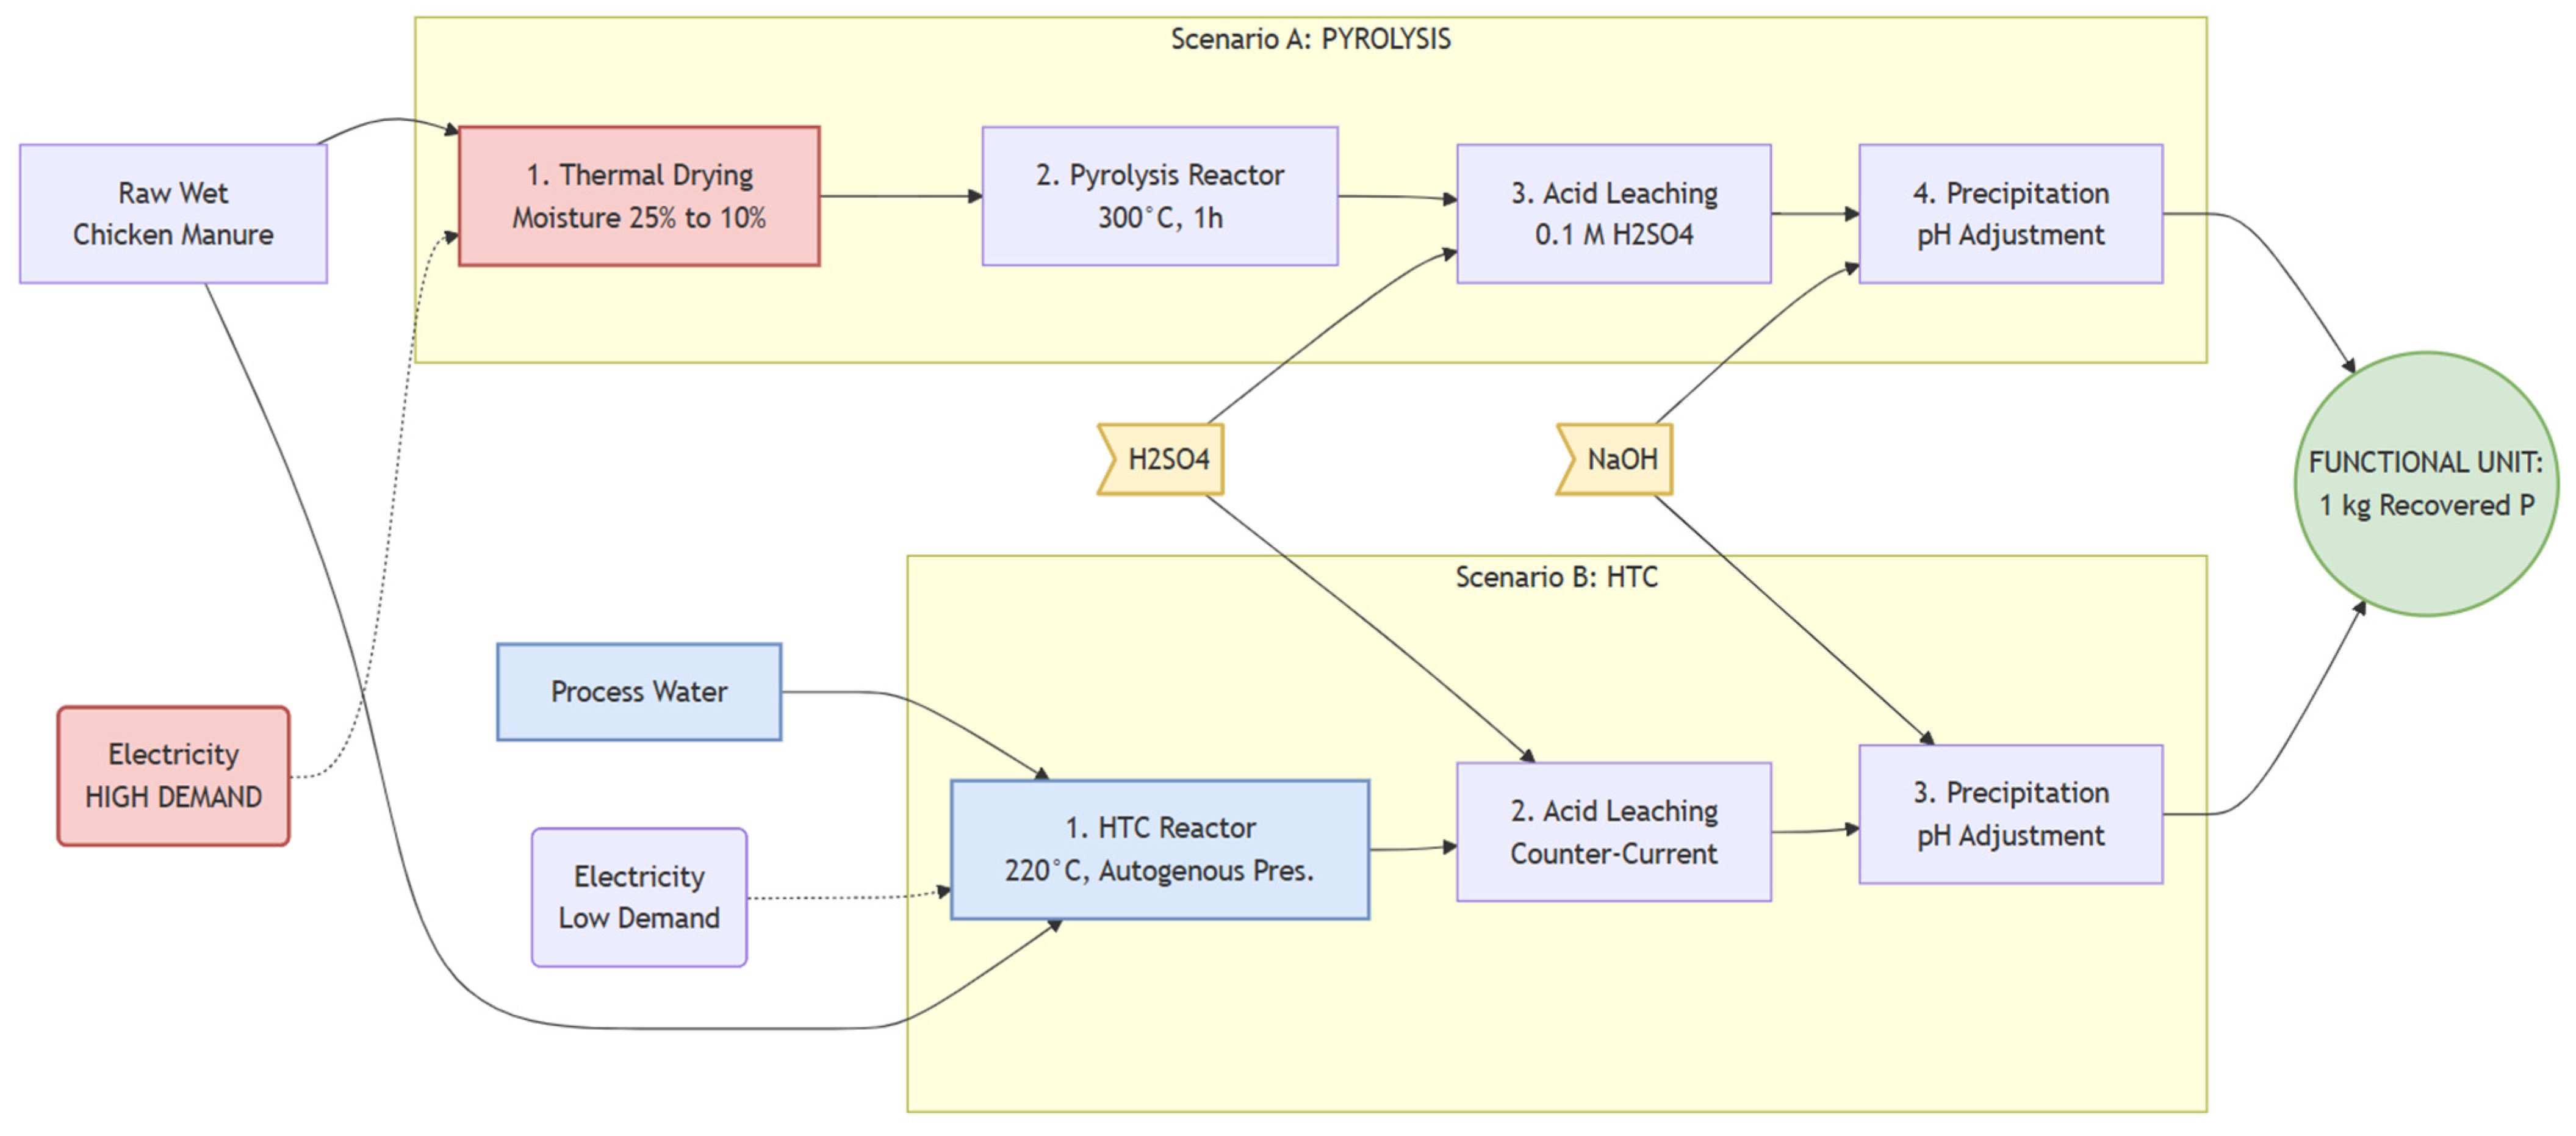
| Parameter/Variable | Unit | Pyrolysis (PYR) | HTC | Data Source/Calculation Method |
|---|---|---|---|---|
| A. Process performance assumptions | ||||
| Process temperature | °C | 300 | 220 | [9] |
| Leaching (recovery) efficiency | % | 90 | 95 | [9] |
| P content | % | 1.8 | 2.1 | Assumption |
| Solid Yield | % | 65% | 55% | [9] |
| B. Functional unit calculation (1 kg P recovered) | ||||
| Target output | kg P | 1.0 | 1.0 | Functional unit |
| Required solid product | kg | 62.6 | 48.4 | Formula: 1/P Content × Leaching Efficiency |
| Required feedstock (manure) | kg | 94.9 | 88 | Formula: Required Char Mass/Solid Yield |
| Added water for HTC process | 50 L | Moisture of the feedstock (52%) | ||
| C. Energy modeling assumptions | ||||
| Feedstock moisture content | % | 25 | 25 | Initial moisture content |
| Target moisture after drying | % | <10 | Not applicable | Drying required for pyrolysis; unnecessary for HTC |
| Dryer thermal efficiency | % | 70 | – | [23] |
| Reactor/furnace efficiency | % | 85 | 85 | [25] |
| D. Life cycle inventory inputs (SimaPro) | ||||
| Total electricity consumption | kWh | 39.5 Drying Energy Reactor Energy | 25.9 | Thermodynamic estimation |
| Sulfuric acid (H2SO4) | kg | 6.1 | 4.7 | Stoichiometric consumption proportional to processed solid mass |
| Sodium hydroxide (NaOH) | kg | 5.0 | 3.9 | pH neutralization requirement |
| Process water (tap water) | m3 | 0.90 | 1.95 | Liquid-to-solid ratio (L/S = 10) during leaching and washing |
| OUTPUTS | ||||
| Gas Emission (Water Vapor) | kg | 186.3 | - |
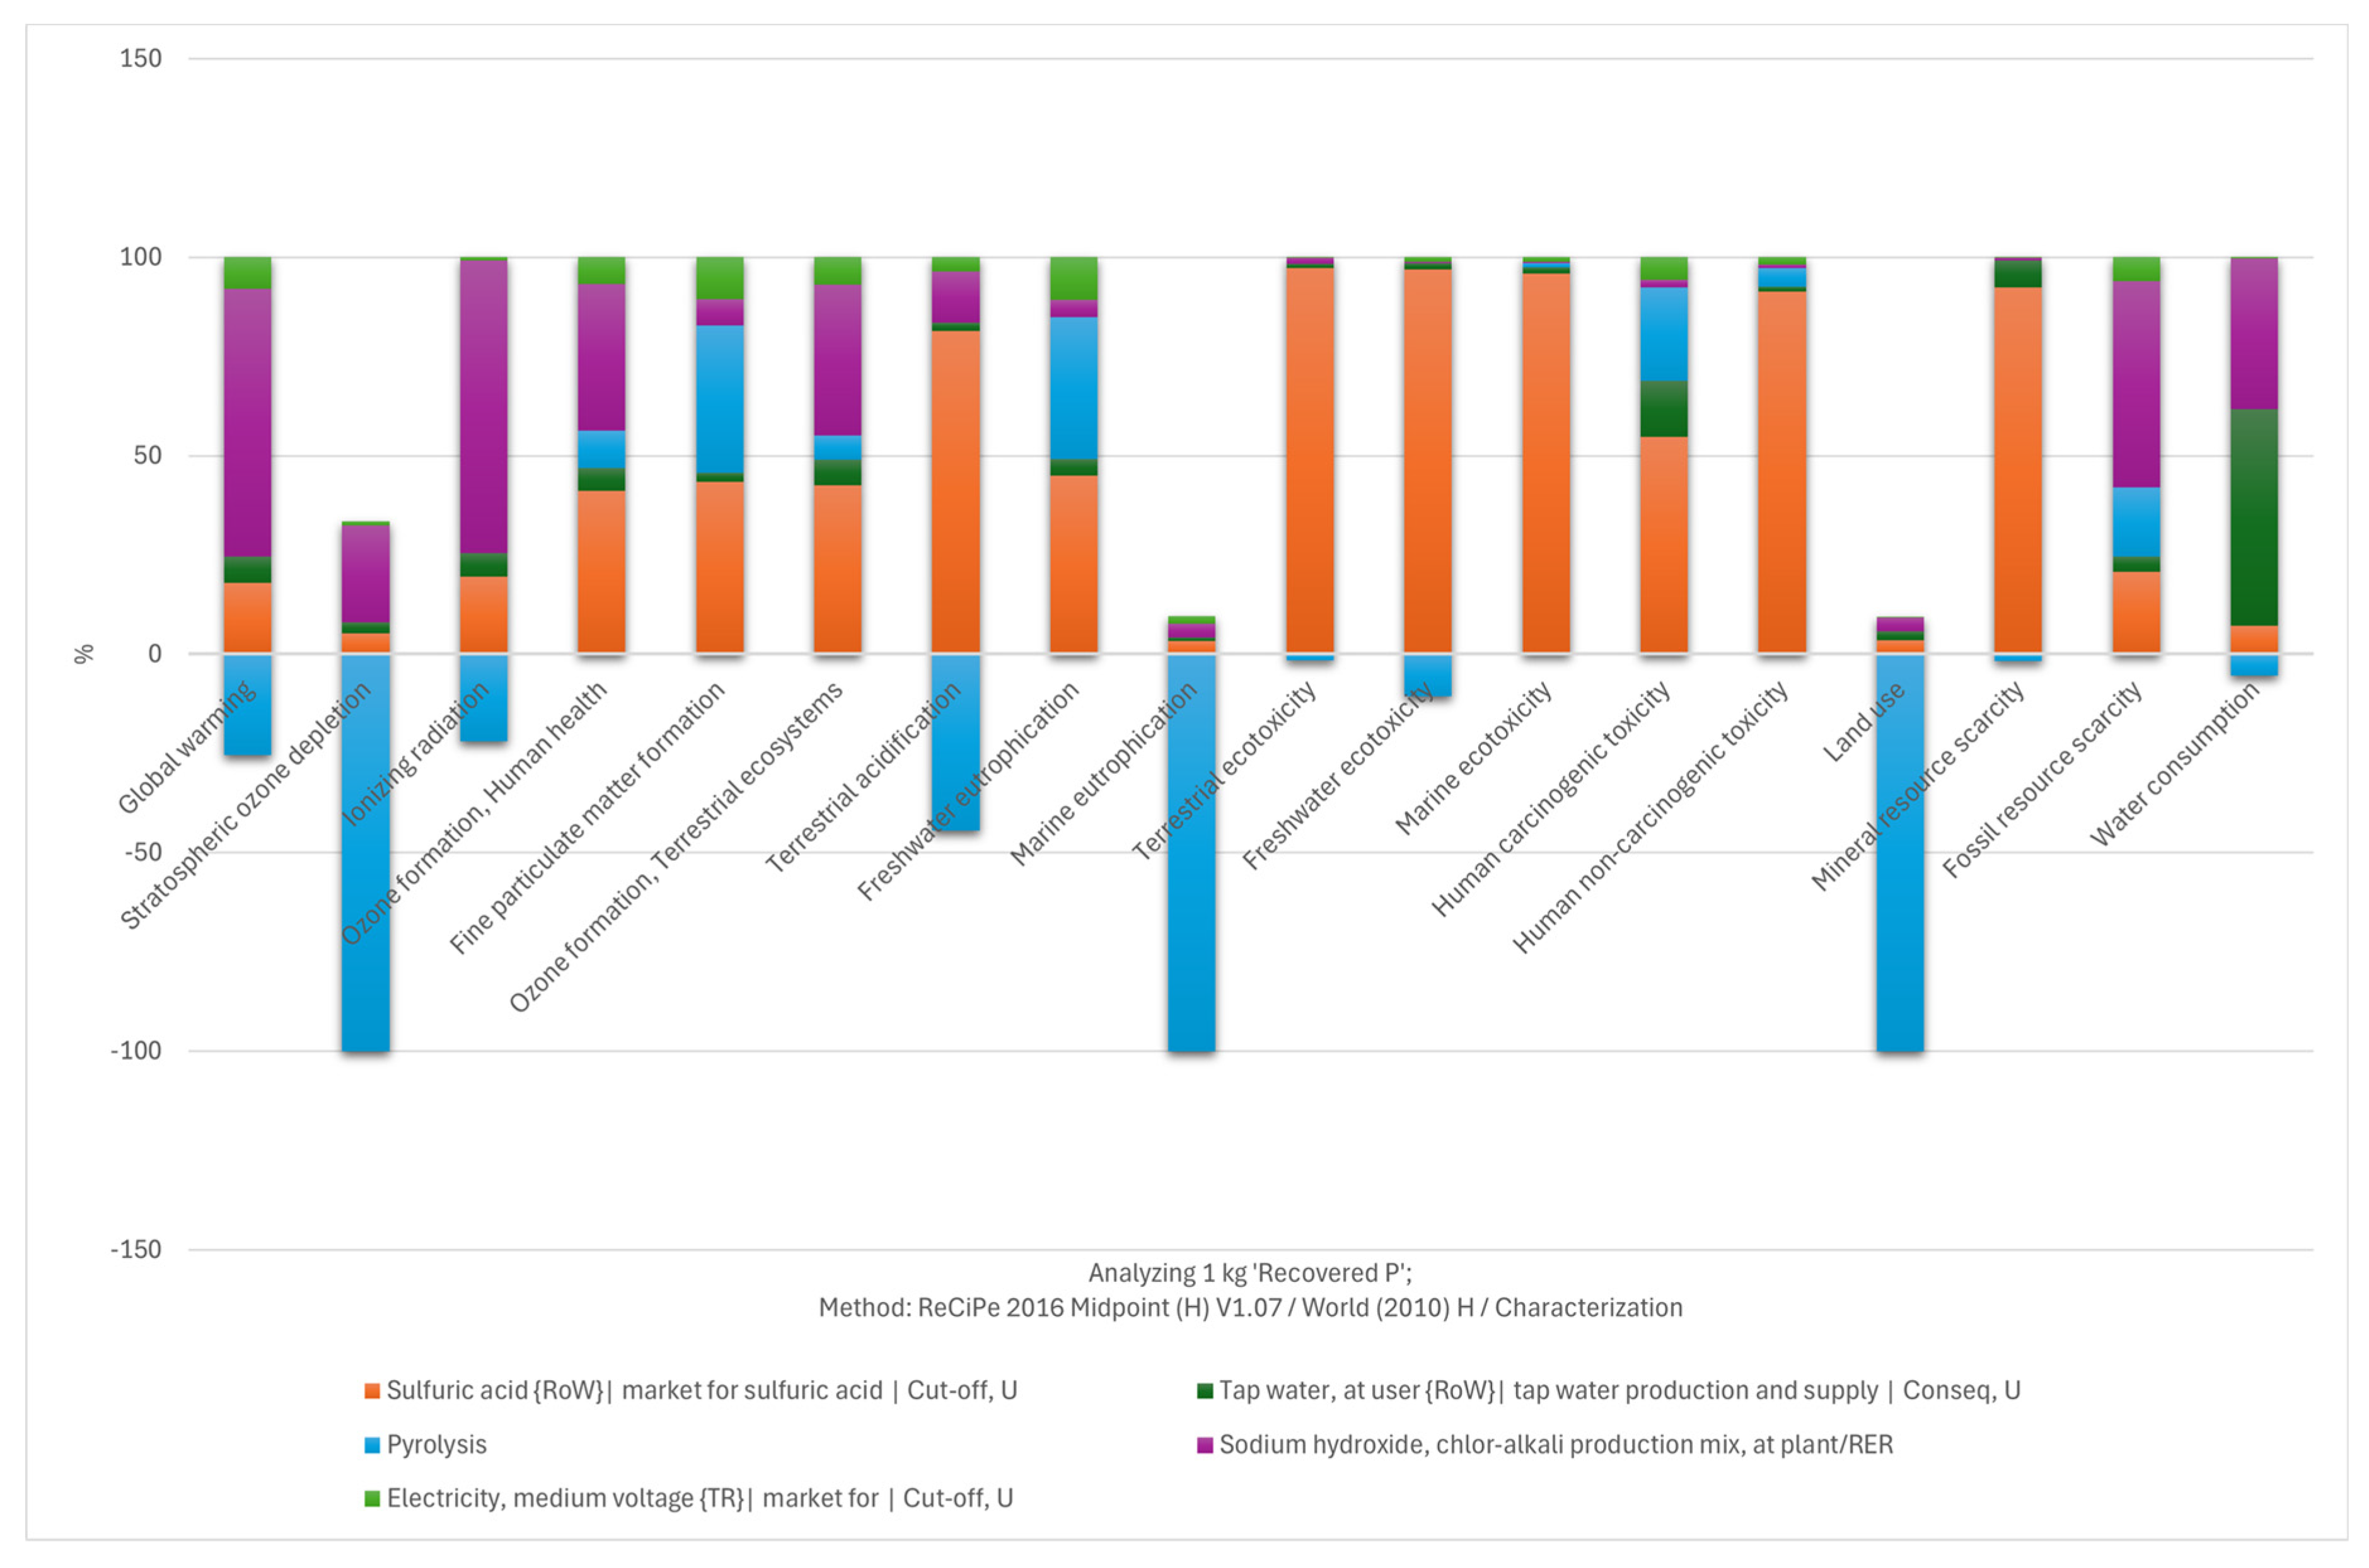
| Impact Category | Unit | Total | Sulfuric Acid (RoW) | Tap Water (RoW) | Pyrolysis | Sodium Hydroxide (Chlor-Alkali) | Electricity (TR, Medium Voltage) |
|---|---|---|---|---|---|---|---|
| Global warming | kg CO2 eq. | 6.00 | 1.00 | 0.526 | −0.507 | 4.35 | 0.632 |
| Stratospheric ozone depletion | kg CFC-11 eq. | 6.5 × 10⁻⁷ | 6.71 × 10⁻⁷ | 4.91 × 10⁻⁷ | −4.32 × 10⁻⁶ | 3.62 × 10⁻⁶ | 1.85 × 10⁻⁷ |
| Ionizing radiation | kBq Co-60 eq. | 0.366 | 0.0665 | 0.0292 | −0.0255 | 0.291 | 0.0043 |
| Ozone formation, human health | kg NOx eq. | 0.0157 | 0.0062 | 0.00124 | 0.000409 | 0.00646 | 0.00144 |
| Fine particulate matter formation | kg PM2.5 eq. | 0.0262 | 0.0141 | 0.000997 | 0.00384 | 0.00243 | 0.00487 |
| Ozone formation, terrestrial ecosystems | kg NOx eq. | 0.0158 | 0.0063 | 0.00132 | 0.000236 | 0.00551 | 0.00145 |
| Terrestrial acidification | kg SO2 eq. | 0.0493 | 0.0451 | 0.00161 | −0.00842 | 0.00825 | 0.00283 |
| Freshwater eutrophication | kg P eq. | 0.00355 | 0.00193 | 0.000254 | 0.000487 | 0.000221 | 0.000652 |
| Marine eutrophication | kg N eq. | −0.000342 | 5.11 × 10⁻⁵ | 1.78 × 10⁻⁵ | −0.00051 | 5.92 × 10⁻⁵ | 4.02 × 10⁻⁵ |
| Terrestrial ecotoxicity | kg 1,4-DCB eq. | 161 | 156 | 2.28 | −0.893 | 2.88 | 0.425 |
| Freshwater ecotoxicity | kg 1,4-DCB eq. | 1.39 | 1.39 | 0.0317 | −0.0525 | 0.00518 | 0.0231 |
| Marine ecotoxicity | kg 1,4-DCB eq. | 1.89 | 1.81 | 0.0415 | 0.00507 | 0.00774 | 0.0311 |
| Human carcinogenic toxicity | kg 1,4-DCB eq. | 0.462 | 0.273 | 0.0999 | 0.0374 | 0.0116 | 0.0400 |
| Human non-carcinogenic toxicity | kg 1,4-DCB eq. | 28.4 | 26.4 | 0.506 | 0.426 | 0.294 | 0.751 |
| Land use | m2 a crop eq. | −0.63 | 0.0942 | 0.0904 | −0.934 | 0.115 | 0.00463 |
| Mineral resource scarcity | kg Cu eq. | 0.10 | 0.0907 | 0.00927 | −0.000595 | 0.000743 | 0.000276 |
| Fossil resource scarcity | kg oil eq. | 1.90 | 0.392 | 0.103 | 0.103 | 1.14 | 0.160 |
| Water consumption | m3 | 1.49 | 0.0838 | 0.907 | −0.0219 | 0.518 | 0.0046 |
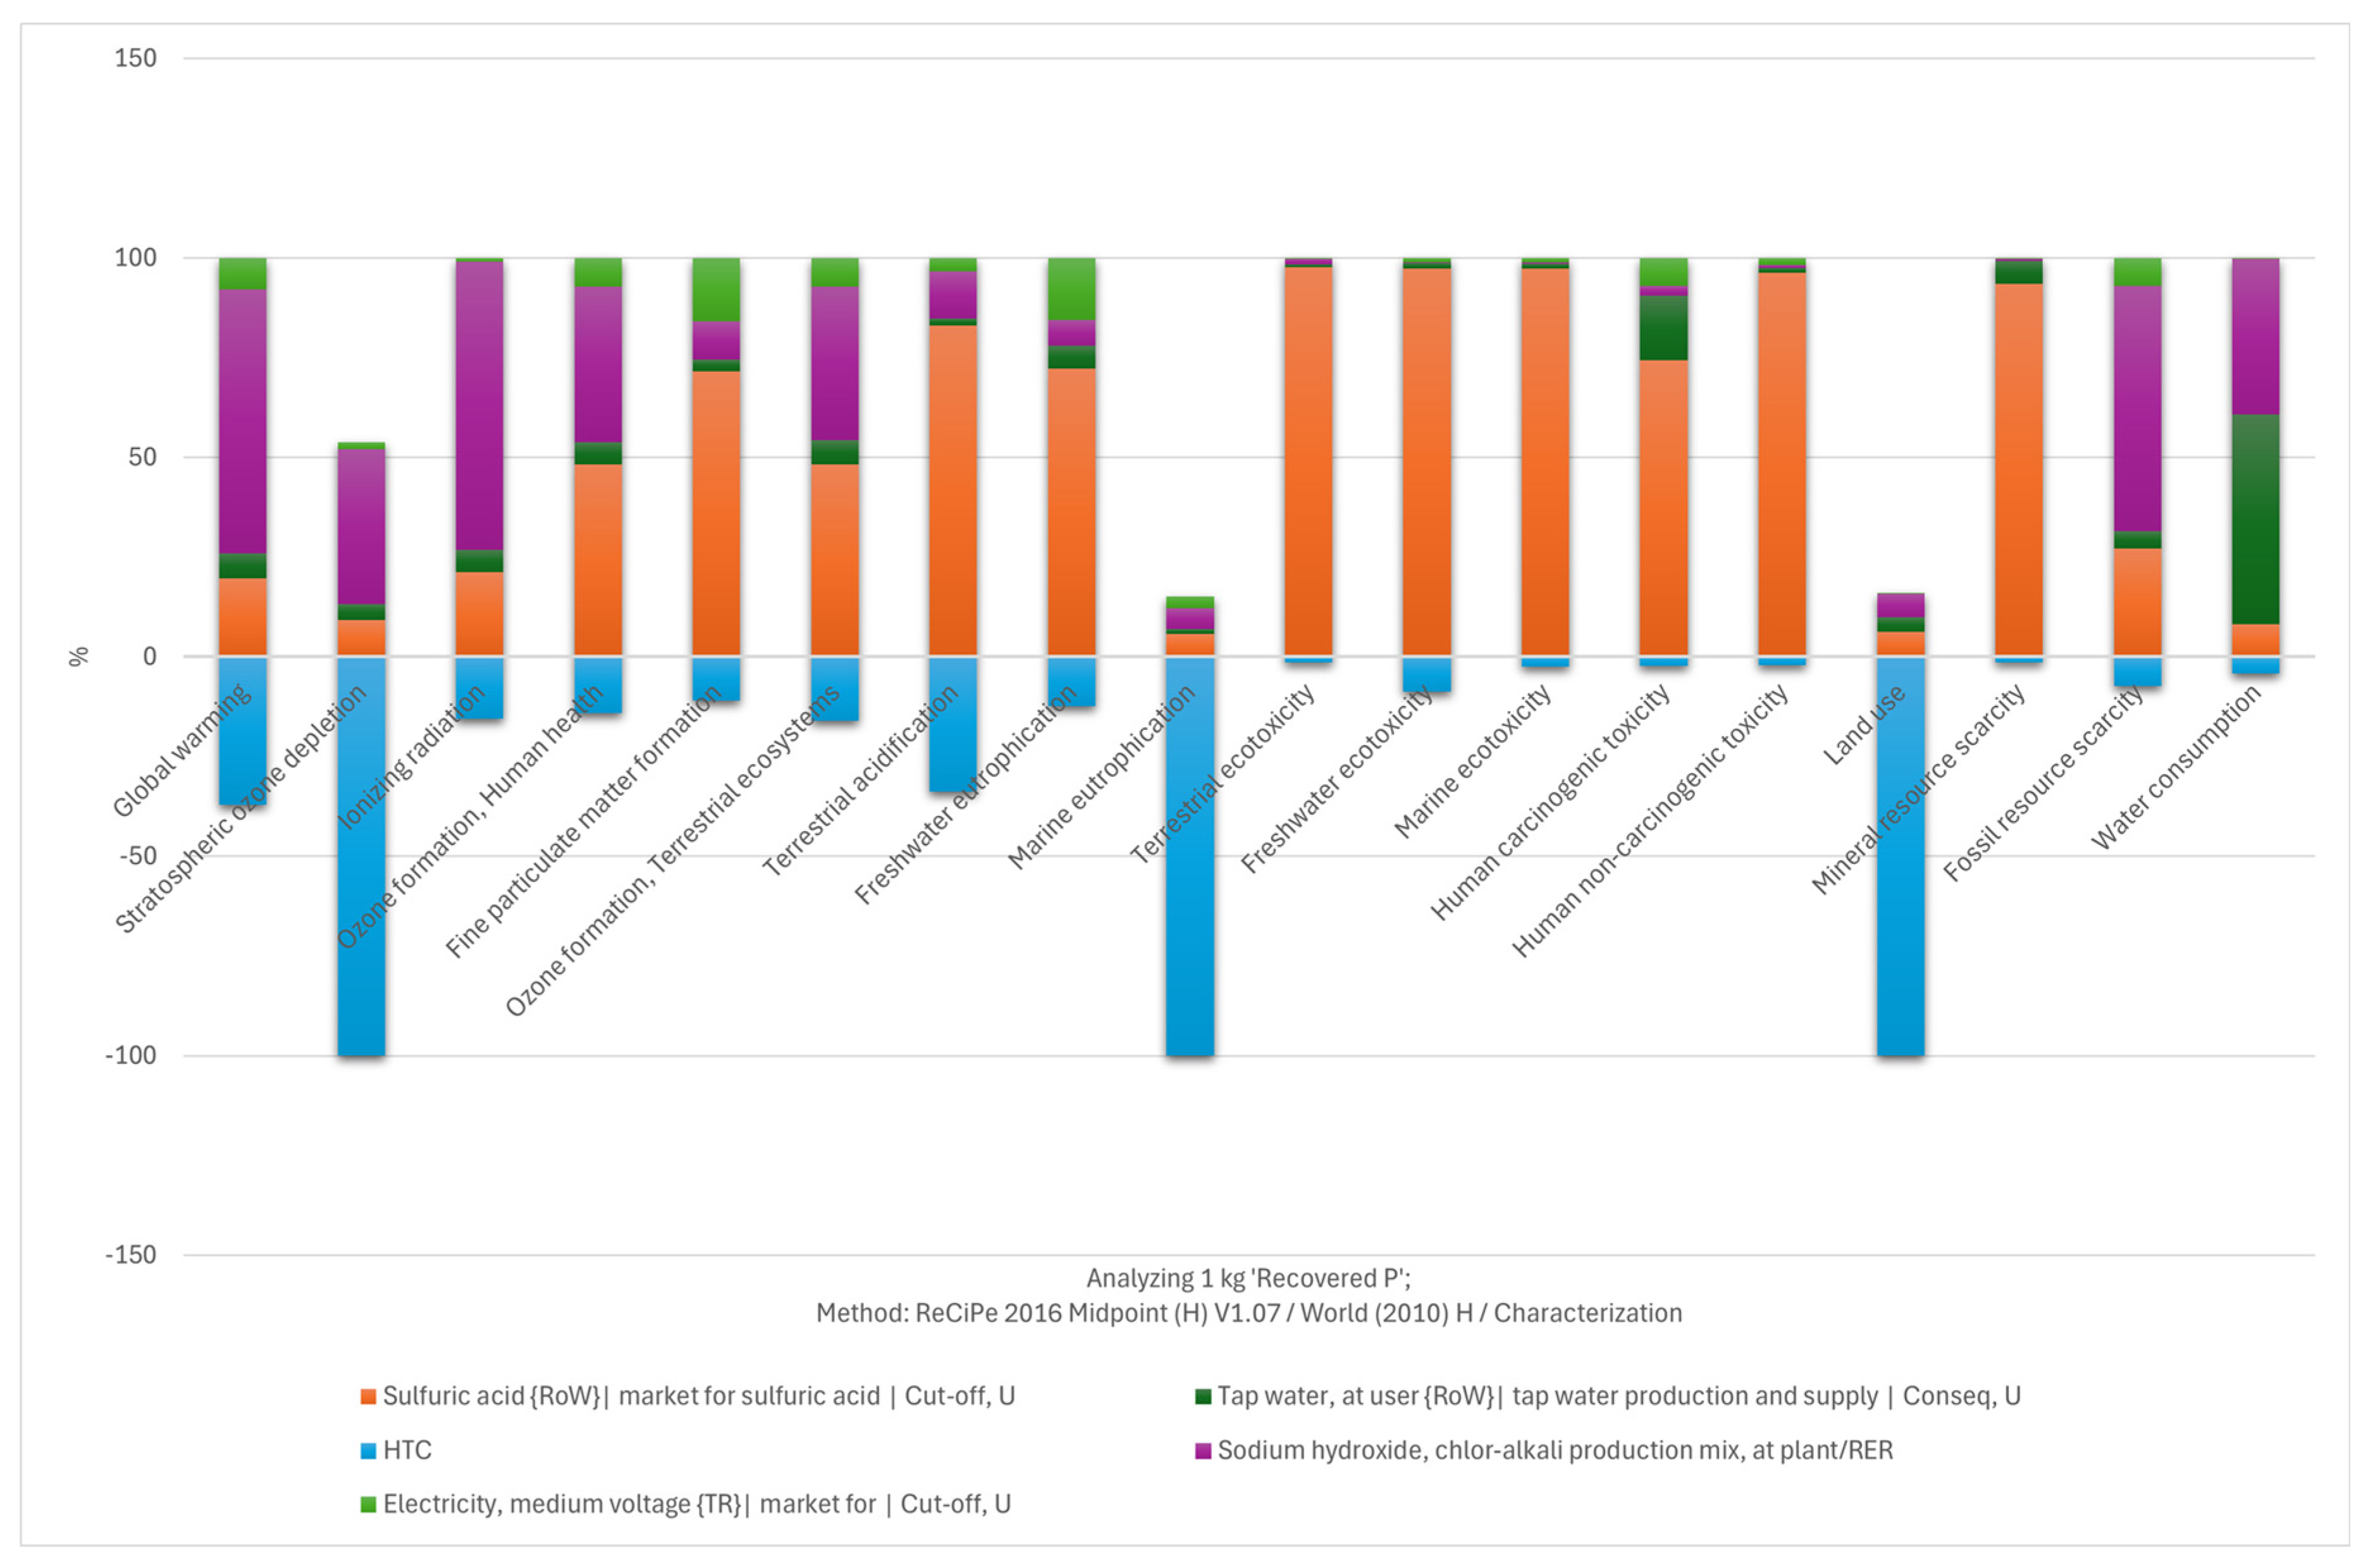
| Impact Category | Unit | Total | Sulfuric Acid (RoW) | Tap Water (RoW) | HTC | Sodium Hydroxide (Chlor-Alkali) | Electricity (Medium Voltage, TR) |
|---|---|---|---|---|---|---|---|
| Global warming | kg CO2 eq. | 4.18 | 0.773 | 0.103 | −1.26 | 3.39 | 1.17 |
| Stratospheric ozone depletion | kg CFC-11 eq. | −1.59 × 10⁻⁶ | 5.17 × 10⁻⁷ | 9.60 × 10⁻⁸ | −5.37 × 10⁻⁶ | 2.83 × 10⁻⁶ | 3.42 × 10⁻⁷ |
| Ionizing radiation | kBq Co-60 eq. | 0.257 | 0.0512 | 0.00571 | −0.0350 | 0.227 | 0.00796 |
| Ozone formation, human health | kg NOx eq. | 0.0117 | 0.00477 | 0.000242 | −0.000992 | 0.00504 | 0.00267 |
| Fine particulate matter formation | kg PM2.5 eq. | 0.0216 | 0.0109 | 0.000195 | −0.000393 | 0.00190 | 0.00901 |
| Ozone formation, terrestrial ecosystems | kg NOx eq. | 0.0117 | 0.00486 | 0.000258 | −0.00121 | 0.00507 | 0.00269 |
| Terrestrial acidification | kg SO2 eq. | 0.0337 | 0.0347 | 0.000315 | −0.0130 | 0.00644 | 0.00524 |
| Freshwater eutrophication | kg P eq. | 0.00283 | 0.00149 | 4.97 × 10⁻⁵ | −8.38 × 10⁻⁵ | 0.000173 | 0.00121 |
| Marine eutrophication | kg N eq. | −0.000489 | 3.93 × 10⁻⁵ | 3.48 × 10⁻⁶ | −0.000653 | 4.62 × 10⁻⁵ | 7.43 × 10⁻⁵ |
| Terrestrial ecotoxicity | kg 1,4-DCB eq. | 122 | 120 | 0.445 | −1.51 | 2.25 | 0.787 |
| Freshwater ecotoxicity | kg 1,4-DCB eq. | 1.03 | 1.07 | 0.00619 | −0.0867 | 0.00404 | 0.0428 |
| Marine ecotoxicity | kg 1,4-DCB eq. | 1.44 | 1.39 | 0.00812 | −0.0258 | 0.00603 | 0.0575 |
| Human carcinogenic toxicity | kg 1,4-DCB eq. | 0.317 | 0.211 | 0.0195 | 0.00385 | 0.00904 | 0.0740 |
| Human non-carcinogenic toxicity | kg 1,4-DCB eq. | 21.8 | 20.4 | 0.0989 | −0.259 | 0.229 | 1.39 |
| Land use | m2 a crop eq. | −0.936 | 0.0726 | 0.0177 | −1.12 | 0.0897 | 0.00857 |
| Mineral resource scarcity | kg Cu eq. | 0.0718 | 0.0699 | 0.00181 | −0.000997 | 0.000580 | 0.000511 |
| Fossil resource scarcity | kg oil eq. | 1.47 | 0.302 | 0.0202 | −0.0396 | 0.889 | 0.295 |
| Water consumption | m3 | 0.623 | 0.0646 | 0.177 | −0.0310 | 0.404 | 0.00851 |
| Production Route/Technology | GWP Impact kg CO2 Eq |
|---|---|
| HTC (This study) | 4.18 |
| Pyrolysis (This study) | 6.00 |
| Reference (Mineral Fertilizer) | |
| Mineral P (EU Standard—BAT) [27] | 3.10 |
| Mineral P (Global/China Average) [28] | 16.30 |
| Commercial Name/Method | Recovered Technology | Carbon Footprint (GWP) (kg CO2-Eq/kg P) | Reference | |
|---|---|---|---|---|
| Mineral P Production (China) | Conventional (Mineral Fertilizer) | 16.3 (Production Only) | High emissions due to coal-based energy and mining. | [29] |
| Sludge Acid Leaching | Wet Chemical (Sludge) | >89.0 | Low yields of P recovery associated with a low P concentration of sludge and need for large amounts of energy and reactants. | [12] |
| Liquid phase | Crystallization (Liquid Phase) | −1.4 to −0.5 | Recovery from liquid phase-low energy | [13,30] |
| Sewage sludge | MEPHREC, AquaReci | 0.7 to 8.7 | Acid usage | [13] |
| Sewage sludge ash | RecoPhos, EcoPhos | −5.2 to −2.4 | High potential for P recovery | [13] |
| EU Standard Fertilizer | Conventional (Mineral) | 3.1 | Optimized plants in Europe (BAT) | [28] |
| Mineral P | Variation in data on TSP | −1 to 4.8 | - | [16] |
| HTC | Thermochemical (Thermochemical- Acid Leaching) | 4.18 | Higher emission due to chemical consumption | This Study |
| Pyrolysis | Thermochemical (Thermochemical- Acid Leaching) | 6.00 | Higher emission due to chemical consumption | This Study |
| Scenario/Technology | Acidification (AP) | Eutrophication (EP) | Human Toxicity | Notes | Reference |
|---|---|---|---|---|---|
| Direct Land App. | 8.3 × 10⁻² kg SO2-eq | 3.1 × 10⁻² kg N-eq (Marine) −5.7 × 10⁻² kg P-eq (Freshwater) | 4.0 × 10² kg 1,4-DCB | Land application has the highest toxicity and acidification | [30] |
| Incineration | 2.0 × 10⁻² kg SO2-eq | 3.0 × 10⁻² kg N-eq | 1.3 × 10² kg 1,4-DCB | Incineration reduces toxicity by 60–70% | |
| HTC + Incineration | 1.7 × 10⁻² kg SO2-eq (Best) | 2.7 × 10⁻² kg N-eq | 1.3 × 10² kg 1,4-DCB | HTC is the most balanced method for acidification and eutrophication | |
| Pyrolysis + Incineration | 4.1 × 10⁻² kg SO2-eq | 3.0 × 10⁻² kg N-eq | 1.2 × 10² kg 1,4-DCB | Pyrolysis has the lowest toxicity, but energy load increases acidification | |
| Cement Kiln (Current) | −0.10 kg SO2-eq | - | −22 kg 1,4-DCB | Positive effect due to coal substitution credit | [31] |
| Land Application | 0.30 kg SO2-eq | - | 210 kg 1,4-DCB | High toxicity due to zinc and copper | |
| Mono-Incineration | 0.12 kg SO2-eq | - | 43 kg 1,4-DCB | Moderate impact level | |
| Struvite (Crystal) | - | - | 1.36 × 10³ CTUh | Struvite crystallization significantly reduces toxicity | [32] |
| BioAcid (Acidification) | - | - | 2.23 × 10³ CTUh | Chemical use does not reduce toxicity | |
| Incineration | 42 g SO2-eq | - | - | [13] | |
| Gifhorn (Sludge Acid) | 95.7 g SO2-eq | - | - | Acid use increases acidification | |
| EcoPhos (Ash Acid) | 1.1 g SO2-eq | - | - | Ash processing credits eliminate acidification load | |
| Struvite (Liquid Phase) | 38 g SO2-eq | - | - | Low energy and chemical requirements | |
| HTC | 0.0337 kg SO2 eq | −0.000342 kg N-eq (Marine) 0.00283 kg P-eq (Freshwater) | 0.317 kg 1,4-DCB eq | Low impact compared to direct application credits | This study |
| Pyrolysis | 0.0493 kg SO2 eq | −0.000489 kg N-eq (Marine) 0.00355 P-eq (Freshwater) | 0.462 kg 1,4-DCB eq | Low impact compared to direct application credits | This study |
Disclaimer/Publisher’s Note: The statements, opinions and data contained in all publications are solely those of the individual author(s) and contributor(s) and not of MDPI and/or the editor(s). MDPI and/or the editor(s) disclaim responsibility for any injury to people or property resulting from any ideas, methods, instructions or products referred to in the content. |
© 2026 by the authors. Licensee MDPI, Basel, Switzerland. This article is an open access article distributed under the terms and conditions of the Creative Commons Attribution (CC BY) license.
Share and Cite
Özel, C.; Kara, A.Z.; Kalkan, S.T. Environmental Trade-Offs in Phosphorus Recovery: A Comparative LCA of Pyrolysis and Hydrothermal Carbonization of Poultry Manure. Appl. Sci. 2026, 16, 2938. https://doi.org/10.3390/app16062938
Özel C, Kara AZ, Kalkan ST. Environmental Trade-Offs in Phosphorus Recovery: A Comparative LCA of Pyrolysis and Hydrothermal Carbonization of Poultry Manure. Applied Sciences. 2026; 16(6):2938. https://doi.org/10.3390/app16062938
Chicago/Turabian StyleÖzel, Cansu, Aybüke Zeynep Kara, and Sıdıka Tuğçe Kalkan. 2026. "Environmental Trade-Offs in Phosphorus Recovery: A Comparative LCA of Pyrolysis and Hydrothermal Carbonization of Poultry Manure" Applied Sciences 16, no. 6: 2938. https://doi.org/10.3390/app16062938
APA StyleÖzel, C., Kara, A. Z., & Kalkan, S. T. (2026). Environmental Trade-Offs in Phosphorus Recovery: A Comparative LCA of Pyrolysis and Hydrothermal Carbonization of Poultry Manure. Applied Sciences, 16(6), 2938. https://doi.org/10.3390/app16062938