Article

A Study on Equivalent Elastic Properties of Crumb Rubber Concrete Based on a Mesoscale Numerical Homogenization Method


1
School of Civil Engineering, Tianjin University, Tianjin 300350, China
2
China Coal Tianjin Design Engineering Co., Ltd., Tianjin 300120, China
3
Hebei Technology Innovation Center of Pipeline, Tunnel and Crossing Engineering, Langfang 065000, China
4
China Petroleum Natural Gas Pipeline Engineering Co., Ltd., Langfang 065000, China
*
Author to whom correspondence should be addressed.
Appl. Sci. 2026, 16(6), 2936; https://doi.org/10.3390/app16062936
Submission received: 4 February 2026 / Revised: 15 March 2026 / Accepted: 16 March 2026 / Published: 18 March 2026

Abstract

Crumb rubber concrete (CRC), as a heterogeneous multiphase composite material composed of coarse aggregate, rubber particles, cement mortar, pores, and other constituents, is frequently regarded as a homogeneous material in engineering applications. This study employs numerical homogenization to compute equivalent mechanical parameters for CRC. By establishing a two-dimensional parametric random aggregate model combined with Monte Carlo simulations and finite element computations, it systematically analyzes the influence of rubber content (0%, 5%, 10%, 15%) and specimen size (50–150 mm) on CRC’s macroscopic equivalent elastic modulus. The research reveals that stable homogenization results, usable as macroscopic equivalent material parameters, are attained when the Representative Volume Element (RVE) size of the CRC model is ≥5 times the maximum aggregate particle size (dₘₐₓ). The equivalent modulus E decreases rapidly initially with increasing size, followed by a decelerated decline toward stabilization. A predictive model based on the fitted formula ln Eᵣ = kᵣ ln L + bᵣ (where Eᵣ denotes reduced modulus) enables elastic modulus prediction for large-scale components up to 600 mm. This study elucidates the macro-mesoscopic linkage mechanism governing CRC’s equivalent elastic parameters, providing a theoretical foundation for engineering structural design.

1. Introduction

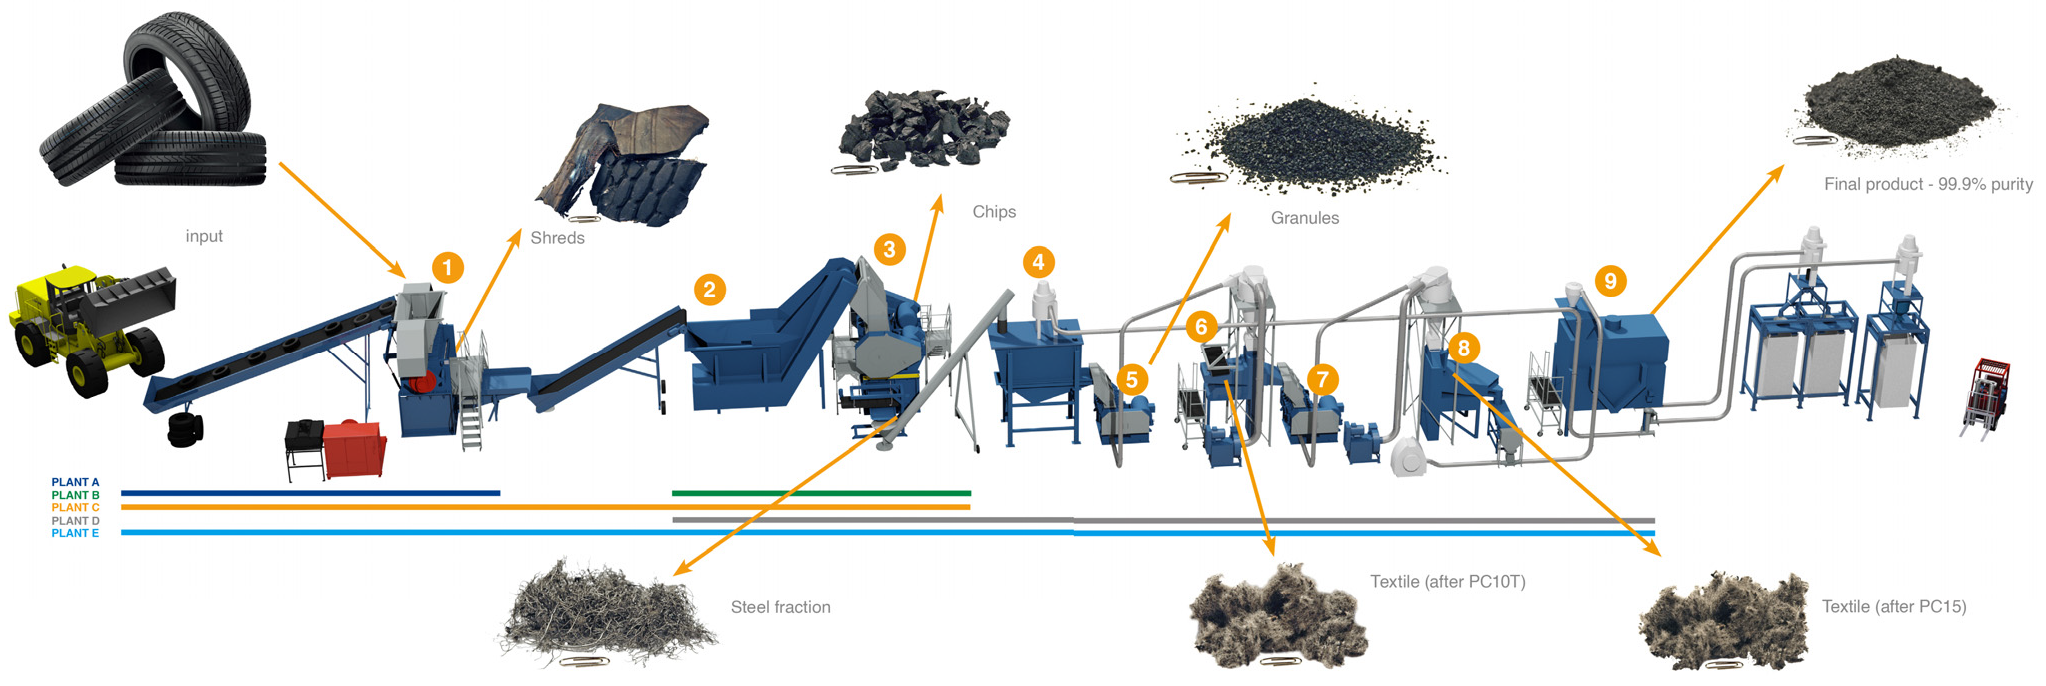
Crumb rubber concrete (CRC) is a novel cement-based composite where waste rubber particles partially replace fine aggregates, introducing flexible components into conventional concrete to enhance its performance [1,2,3]. Rubber particles enhance concrete durability via elastomeric deformation and energy-dissipating regulatory effects [4,5]. Rubber particles could act as a microspring in concrete with fiber-like properties, mitigating cracking and strengthening fatigue performance [6]. The addition of rubber particles also has a significant effect on the creep and impact energy of concrete [7]. The rubber aggregates are sourced from recycled materials such as tires [8], conveyor belts, hoses, and industrial rubber products. Figure 1 illustrates the recycling process of waste tires. Incorporating recycled tire-derived crumb rubber into concrete not only supports ecological balance [9] (CRC is referred to as “green concrete” [10]) but also offers economic benefits [11,12].
CRC, as a heterogeneous multiphase composite, consists of coarse aggregates, rubber particles, cement mortar, and pores [13]. Despite its mesoscopic heterogeneity in material properties and spatial distribution among phases, CRC is often homogenized as an equivalent homogeneous material with macroscopic parameters in engineering applications. The homogenization method [14] derives macroscopic equivalent mechanical parameters (elastic modulus [15], Poisson’s ratio) from mesoscopic heterogeneous material structures.
In concrete structural design, macroscopic elastic parameters are critical. The elastic modulus is essential for controlling structural deformation [16] and ensuring safety. While the conventional concrete elastic modulus is estimated through empirical formulas based on compressive strength [17,18], this approach is invalid for CRC due to its complex composition. Experimental methods are typically required, but their high cost and time demands make mesoscale homogenization a valuable alternative [19]. This method enables the mechanistic analysis of CRC’s macroscopic behavior from its mesoscopic constituents, significantly promoting CRC’s practical adoption.
Homogenization methods for composite materials like concrete primarily include analytical and numerical approaches. Analytical homogenization methods estimate elastic parameter bounds through theoretical models, such as Voigt [20], Reuss [21], Hill [22], and Hashin–Shtrikman [23] bounds. Widely applied analytical methods also include self-consistent schemes [24], Mori-Tanaka [25], and Christensen models [26]. Most analytical methods assume inclusions with simple geometries, failing to address concrete’s complex mesostructure or size-gradient effects.
Numerical homogenization based on finite element methods has been extensively adopted for novel composites [27,28,29,30,31,32]. For concrete, selecting representative volume elements (RVEs) sized 3–5 times the maximum aggregate diameter [32,33,34,35] yields stable homogenized results as macroscopic equivalent parameters. Given these considerations, numerical homogenization is recommended for CRC’s intricate mesoscale models.
Recent advancements in mesoscale finite element modeling have significantly enhanced the understanding of CRC and closely related cementitious composites. Several studies have developed sophisticated numerical homogenization frameworks to predict the mechanical behavior of CRC, demonstrating strong predictive capabilities. For instance, Duarte et al. [36] developed an image-processing and XFEM-coupled procedure to effectively characterize the mechanical properties of rubberized concrete. Qi et al. [2] recently combined CT in situ uniaxial compression tests with mesoscale numerical modeling to accurately capture the mechanical and fracture properties of CRC. Building upon such frameworks, more recent research has utilized advanced 3D and complex mesoscale models to evaluate various mechanical properties, including the indirect tensile and flexural strengths of crumb rubber mortar [37], as well as the fatigue damage accumulation using cohesive zone models [38]. When validated against experimental compressive and flexural data, these advanced mesoscale models generally achieve predictive accuracies within a 5–8% error margin. However, while these highly detailed 3D and multiscale models establish a robust foundation for predicting mechanical properties, their substantial computational cost often limits their application in iterative design or large-scale structural analysis.
To address this gap, the current study proposes a 2D Monte Carlo homogenization approach. By statistically representing the random distribution of rubber particles and aggregates, this 2D framework significantly reduces computational overhead while maintaining high predictive accuracy, thereby offering a novel and highly practical balance between computational efficiency and precision for modeling CRC. Through extensive finite element model calculations, a statistical analysis was conducted on the homogenization macro-laws of CRC.

2. Mesoscale Finite Element Models of CRC

2.1. Random Aggregate Model

The random aggregate model was proposed by Z. M. Wang et al. [39,40]. The Fuller gradation curve is employed to determine the quantity and distribution of aggregates. Using the Monte Carlo method, the spatial positions, shapes, and sizes of aggregates are randomly determined to generate a random aggregate structure. Subsequently, finite element meshes are mapped onto this structure, with different material properties assigned to corresponding elements. This approach characterizes the mechanical characteristics of concrete’s mesoscopic components and enables numerical computational analysis.

2.1.1. Generation of Random Aggregates

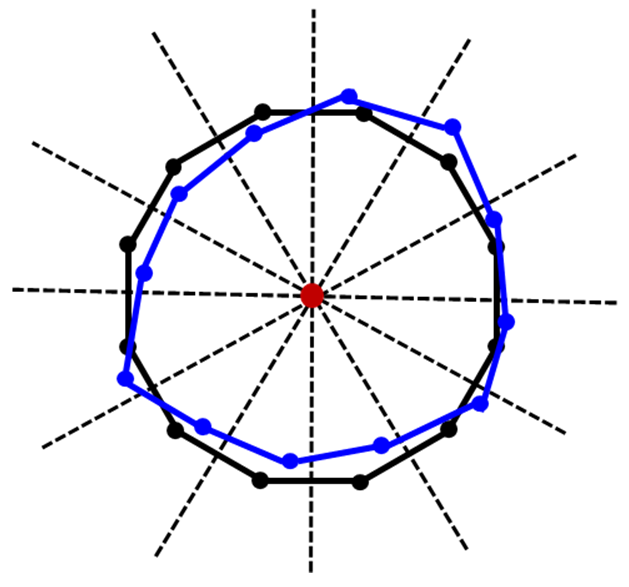
The continuously graded aggregate is closer to natural aggregates in characteristics and is the most commonly used gradation in engineering applications. In the two-dimensional mesoscale numerical model, randomly shaped aggregates ranging from hexagons to dodecagons are employed. For any point Pn in the model, the vertex coordinates of the corresponding polygonal aggregates are generated using Equation (1). Figure 2 illustrates the generation schematic of a random dodecagonal aggregate.
{ r n = r n 0 + d r × random ( 0,1 ) ,   d r [ 0.5 D , 0.5 D ] θ n = θ n 0 + d θ × random ( 0,1 ) ,   d θ [ 2 π / m , 2 π / m ]
where rn0 and θn0 are the initial parameters of the aggregate, D is the control particle size, dr represents the fluctuation range of the radius, dθ denotes the fluctuation range of the angle, and random(0,1) indicates generating a uniformly distributed random number within the interval (0,1). It should be noted that although the random generation creates realistic variability in particle morphology, exact statistical matching of angularity to real aggregates was not performed. Compared to fracture behavior, the macroscopic elastic modulus is less sensitive to local aggregate morphology [14,41].

2.1.2. Determination of Aggregate Quantity

The concrete aggregate discussed here primarily considers coarse aggregate, which refers to particles with a size range of 5–25 mm. Fine aggregate smaller than 5 mm is accounted for as part of the mortar matrix. To achieve optimal structural density in concrete, the proportions of particles with varying sizes in a continuous gradation are determined by the Fuller gradation curve. Its mathematical expression is provided in Equation (2):
P ( D ) = 100 D / D m a x
where P(D) represents the cumulative volume fraction of aggregate particles passing through a sieve aperture with diameter D, and Dmax denotes the maximum aggregate particle size. Based on the mix proportions of CRC with different rubber contents presented in the paper, the calculated 3D mesoscale aggregate gradation is shown in Table 1.
For spherical or rounded aggregates like pebbles and gravel, Walraven [42] derived the probability (as shown in Equation (3)) that any point on a two-dimensional cross-section of the specimen contains an aggregate with diameter D < D0, by converting the three-dimensional gradation curve using the Fuller gradation formula.
P c ( D < D 0 ) = P k [ 1.065 ( D 0 D m a x ) 0.5 0.053 ( D 0 D m a x ) 4 0.012 ( D 0 D m a x ) 6 0.0045 ( D 0 D m a x ) 8 0.0025 ( D 0 D m a x ) 10 ]
where Pk represents the volume proportion of aggregate in the total concrete volume, Dmax is the maximum particle size of the aggregate, D0 denotes the particle size of graded aggregate, and Pc is the probability of occurrence of particles with different aggregate gradations in the cross-section. Based on the mix proportions of CRC with different rubber contents, the two-dimensional mesoscale aggregate gradation was calculated and is summarized in Table 2. In generating the two-dimensional model, the area fraction of the total placed aggregates relative to the total RVE area was calculated and found to be consistent with the target three-dimensional volume fraction, with an error margin of less than 2%, thereby confirming statistical consistency. While the Walraven equations bridge the geometric grading gap, two-dimensional plane stress/strain assumptions differ from true three-dimensional confinement, leading to slight deviations in stiffness predictions. Specifically, two-dimensional plane strain approximations typically yield slightly higher matrix compliance than three-dimensional models due to the lack of out-of-plane aggregate confinement.

2.1.3. Random Placement of Aggregates

After the aggregates have been generated according to the particle gradation, the random placement of aggregates begins. The placement starts with large-sized aggregates followed by small-sized ones. During this process, aggregates must satisfy the following conditions: they must remain within the boundaries of the model, subsequently placed aggregates must not overlap with previously placed ones (the centroid of the new aggregate is not located within any existing aggregate, and none of the vertices of the new aggregate fall within any existing polygonal aggregates). A minimum spacing of 0.5 mm must be maintained between any two aggregates. Constraint serves a dual purpose: physically, it represents the minimum allowable thickness of the mortar matrix between adjacent aggregates; numerically, it is a necessary meshing safeguard to prevent severe mesh distortion and singularity issues that occur when rigid inclusions are placed too closely in finite element models. Through iterative placement cycles, the random aggregate model is ultimately generated.

2.2. Mesoscale Parameterization Model Generation

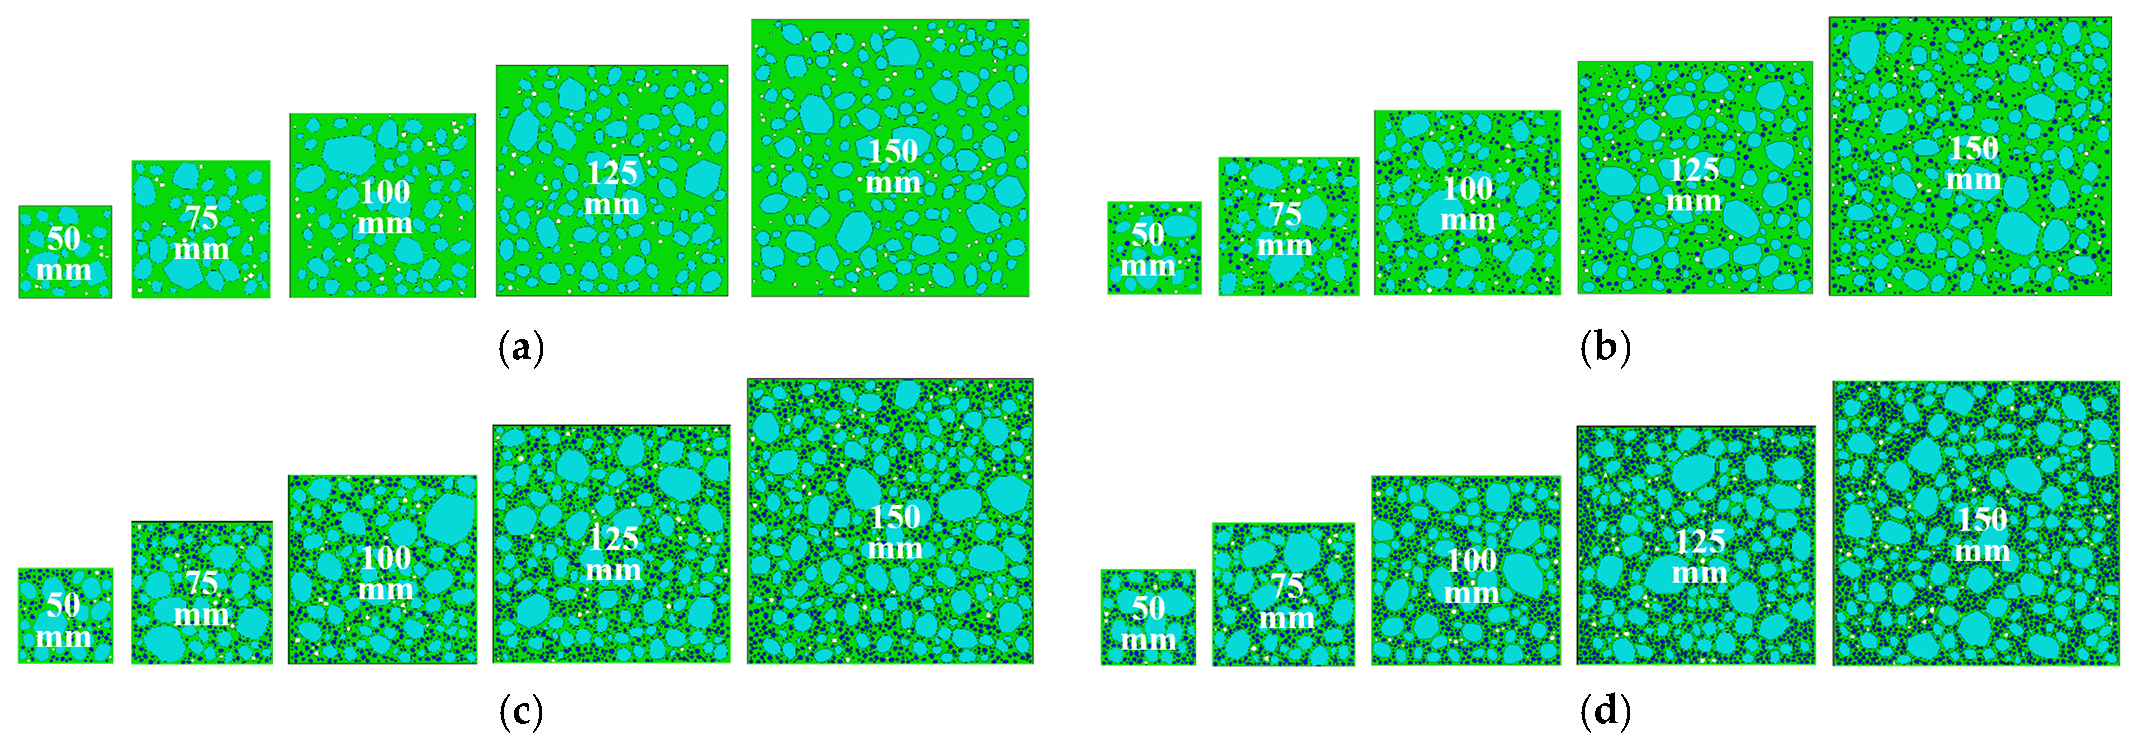
Based on the random aggregate method described in Section 2.1 and the two-dimensional aggregate gradation of CRC obtained from Table 2, three-dimensional thin-plate random aggregate mesoscale models (Figure 3) were generated considering different specimen sizes (with side lengths of 50 mm, 75 mm, 100 mm, 125 mm, and 150 mm) and various rubber contents (0%, 5%, 10%, and 15%). The thin plate has a thickness of 0.25 mm, which can be used purely to satisfy the ABAQUS 3D plugin requirements, and out-of-plane constraints were applied to simulate plane strain conditions.
It should be noted that the current mesoscale model omits the Interfacial Transition Zone (ITZ) between the coarse aggregate/rubber particles and the mortar matrix. Because the ITZ typically exhibits higher porosity and lower stiffness, assuming a perfect bond may slightly overestimate the homogenized macroscopic elastic modulus. Future iterations of this model will explore multi-phase ITZ integration.

3. Methodology of Mesoscale Numerical Homogenization

3.1. Basic Principles

The homogenization method is an analytical approach proposed for periodic microscopic structures, which can not only analyze the macroscale properties of materials but also reflect the structural characteristics of the mesoscale. It establishes a multi-scale analysis framework connecting macroscale and mesoscale. The numerical homogenization method is applied at the mesoscale to estimate the macroscale equivalent material parameters of CRC. In this method, six displacement load cases with appropriate boundary conditions are applied to the representative volume element (RVE), where the RVE model adopts a multiphase material model at the mesoscale. For the numerical homogenization method, the general constitutive relationship of heterogeneous materials can be expressed as follows [17]:
σ i j = C i j k l H ε i j
where C i j k l H is the homogenized stiffness matrix, σ i j and ε i j are the volume-averaged stress and strain tensors of the RVE, respectively. These average stresses and strains can be derived from the local stresses and strains of the constituent elements as follows:
σ i j = 1 | V | [ V m σ i j m ( x , y ) d V m + V a σ i j a ( x , y ) d V a ]
ε i j = 1 | V | [ V m ε i j m ( x , y ) d V m + V a ε i j a ( x , y ) d V a ]
where V is the volume of the RVE, while Vm and Va correspond to the volumes of the mortar phase and aggregate phase, respectively.
To determine the homogenized stiffness matrix in Equation (4), Kinematic Uniform Boundary Conditions (KUBCs) are applied to the RVE. The three-dimensional model has dimensions lx, ly, and lz along the x, y, and z axes, respectively. The strain components of the RVE are expressed as (ε11, ε22, ε33, γ12, γ23, γ13).
For normal loading conditions, boundary conditions are applied to two opposite surfaces of the RVE, while the other two directions remain free, as shown in Equations (7)–(9).
u | x = 0 = 0 ,   a n d   u | x = l x = l x ε 11
v | y = 0 = 0 ,   a n d   v | y = l y = l y ε 22
w | z = 0 = 0 ,   a n d   w | z = l z = l z ε 33
where u, v, and w denote the displacements along the x-, y-, and z-axes, respectively.
Under tangential loading conditions, the boundary conditions for the RVE are given by Equations (10)–(12).
v | x = 0 = v | x = l x = 0 ,       w | x = 0 = w | x = l x = 0 ,       w | z = 0 = w | z = l z = 0 , w | y = 0 = w | y = l y = 0 ,       u | y = 0 = 0     a n d   u | y = l y = l y γ 12
u | x = 0 = u | x = l x = 0 ,       u | y = 0 = u | y = l y = 0 ,       w | y = 0 = w | y = l y = 0 , u | z = 0 = u | z = l z = 0 ,       v | z = 0 = 0     a n d   v | z = l z = l z γ 23
v | x = 0 = v | x = l x = 0 ,       w | x = 0 = w | x = l x = 0 ,       v | y = 0 = v | y = l y = 0 , v | z = 0 = v | z = l z = 0 ,       u | z = 0 = 0     a n d   u | z = l z = l z γ 13
For a two-dimensional model with dimensions lx and ly in the x- and y-axis directions, respectively, the strain of the RVE is expressed as (ε11, ε22, γ12). Three types of boundary conditions are applied to the RVE, as shown in Equations (13)–(15).
u | x = 0 = 0   a n d   u | x = l x = l x ε 11 ,     v | y = 0 = v | y = l y = 0
v | y = 0 = 0   a n d   v | y = l y = l y ε 22 ,     u | x = 0 = u | x = l x = 0
u | y = 0 = 0   a n d   u | y = l y = l y γ 12 ,     v | x = 0 = v | x = l x = 0
Based on the homogenized stiffness matrix C i j k l H obtained from the two-dimensional model, its inverse matrix—the equivalent compliance matrix S—is calculated (Equation (16)). Subsequently, the homogenized equivalent elastic moduli E11 and E22, Poisson’s ratio μ12, and shear modulus G12 are computed, as shown in Equation (17).
S = [ S 11 S 12 0 S 21 S 22 0 0 0 S 66 ]
E 11 = 1 S 11 ,     E 22 = 1 S 22 ,   μ 12 = S 12 S 11 = S 21 S 22 ,   G 12 = 1 S 66

3.2. Calculation Process and Parameter Selection

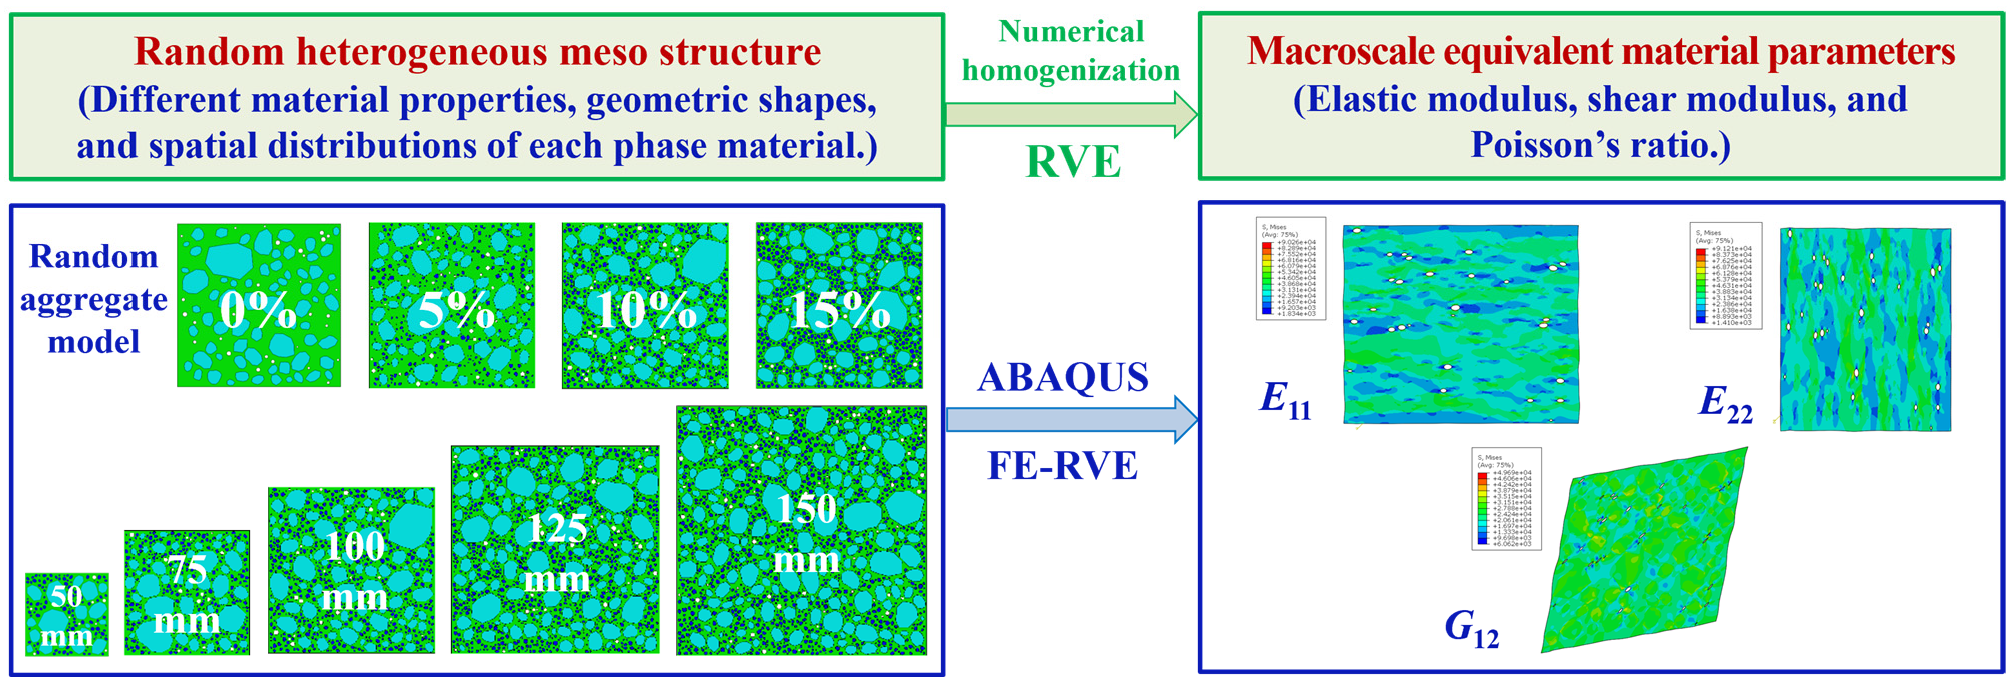
In the finite element calculations of this study, the Monte Carlo simulation method was employed to compute the numerically homogenized equivalent mechanical property parameters. Based on the random aggregate mesoscale finite element model of CRC established in Section 2.2, the FE-RVE plugin included with ABAQUS 2022 was utilized to conduct a large number of finite element computations. This process yielded homogenized equivalent parameters, including elastic moduli E11 and E22, Poisson’s ratio μ12, and shear modulus G12. The results were analyzed and presented in Figure 4.
The material parameters adopted in the mesoscale model of this study are as follows [2,3]: the coarse aggregate has an elastic modulus Ea = 7.0 × 10⁴ MPa, density ρa = 2.7 × 10³ kg/m3, and Poisson’s ratio 0.2; the cement mortar matrix has an elastic modulus Em = 2.5 × 10⁴ MPa, density ρm = 2.2 × 10³ kg/m3, and Poisson’s ratio 0.2; and the rubber particles have an elastic modulus Er = 80.0 MPa, density ρr = 1.05 × 10³ kg/m3, and Poisson’s ratio 0.48. These parameters were selected based on previous numerical simulations and micro-scale experiments, ensuring that they are representative of the typical stiffness differences in CRC.
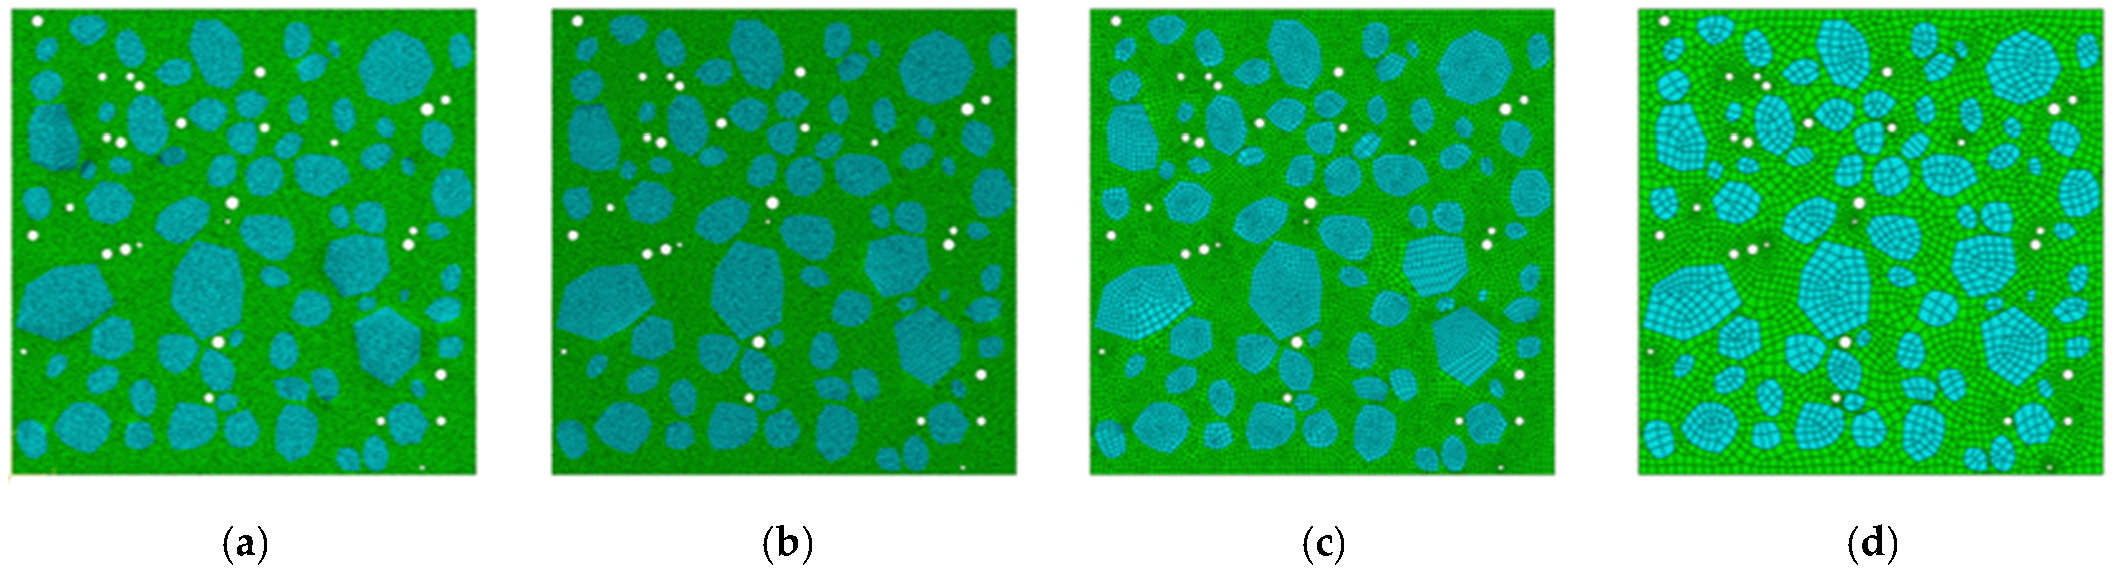
Before conducting extensive finite element computations, a mesh convergence analysis of the homogenization method was performed here. A 100 mm-edge-length mesoscale model with 0% rubber content was selected to compare the precision impacts of different mesh sizes on computational results. The 0% rubber model was chosen for the convergence study because the highest stiffness differential (aggregate vs. mortar) generally dictates the strictest mesh requirements. As shown in Figure 5, models with mesh sizes of 0.25 mm, 0.5 mm, 1 mm, and 2 mm were simulated using C3D6 and C3D8R element types. Following the simulation workflow illustrated in Figure 4, the equivalent elastic parameters of these four models were obtained (Table 3). Using the equivalent elastic modulus E0 calculated from the 0.25 mm mesh model as the reference value, the relative error was defined as |(EE0)/E0|, where E = (E11 + E22)/2. Based on the results, the 0.5 mm mesh model was selected for subsequent calculations, demonstrating a relatively small error (0.083%) while maintaining moderate computational requirements with 47,058 elements, thus ensuring reasonable computational efficiency.

4. Results and Discussion

Monte Carlo simulation [43] was employed to calculate the homogenized elastic parameters. Based on the micromechanical model established in Section 2.2, this section involved RVE calculations for four rubber contents (0%, 5%, 10%, 15%) and five model dimensions (with side lengths of 50 mm, 75 mm, 100 mm, 125 mm, and 150 mm, respectively). A total of 100 × 4 × 5 = 2000 numerical mesoscale models were computed (note: dynamic random seeds were used to ensure the geometric and statistical independence of every realization), yielding the homogenized stiffness matrix C i j k l H for each mesoscale model. Subsequently, statistical analyses of the homogenized elastic parameters were conducted, including calculations of mean values, standard deviations (SDs), and coefficients of variation (CoV).

4.1. Anisotropy Ratio of Mesoscale Models

For the homogenized stiffness matrix C i j k l H shown in Equation (1), its expanded expression can be derived as Equation (18):
C i j k l H = [ C 11 C 12 C 13 C 22 C 23 C 33 C 14 C 15 C 16 C 24 C 25 C 26 C 34 C 35 C 36 S y y m . C 44 C 45 C 46 C 55 C 56 C 66 ]
The formula for the elastic anisotropy ratio A [31] in the mesoscale model of CRC is given below:
A = C 66 / C
here C′ is the elastic shear stiffness modulus, where the shear constant C′ = (C11C12)/2. C11, C12, and C66 are elements of the homogenized stiffness matrix C i j k l H in Equation (18). In the calculations, the average values were taken from RVE models with identical rubber content and model size. Table 4 presents the calculation results of elastic anisotropy ratios for each mesoscale model.
The value of the elastic anisotropy ratio A being closer to 1 indicates higher material homogeneity, while a value equal to 1 corresponds to an isotropic material. As shown by the computational results in Table 4, the mesoscale models can be approximately considered isotropic. Therefore, the equivalent elastic modulus of the models can be simplified as E = (E11 + E22)/2. When the rubber content remains constant, a larger model size leads to a higher elastic anisotropy ratio A. Conversely, for models of the same size, a higher rubber content results in a lower elastic anisotropy ratio A. In conclusion, the heterogeneity of the model increases with smaller dimensions and higher rubber content.

4.2. Homogenization Elastic Parameter Analysis

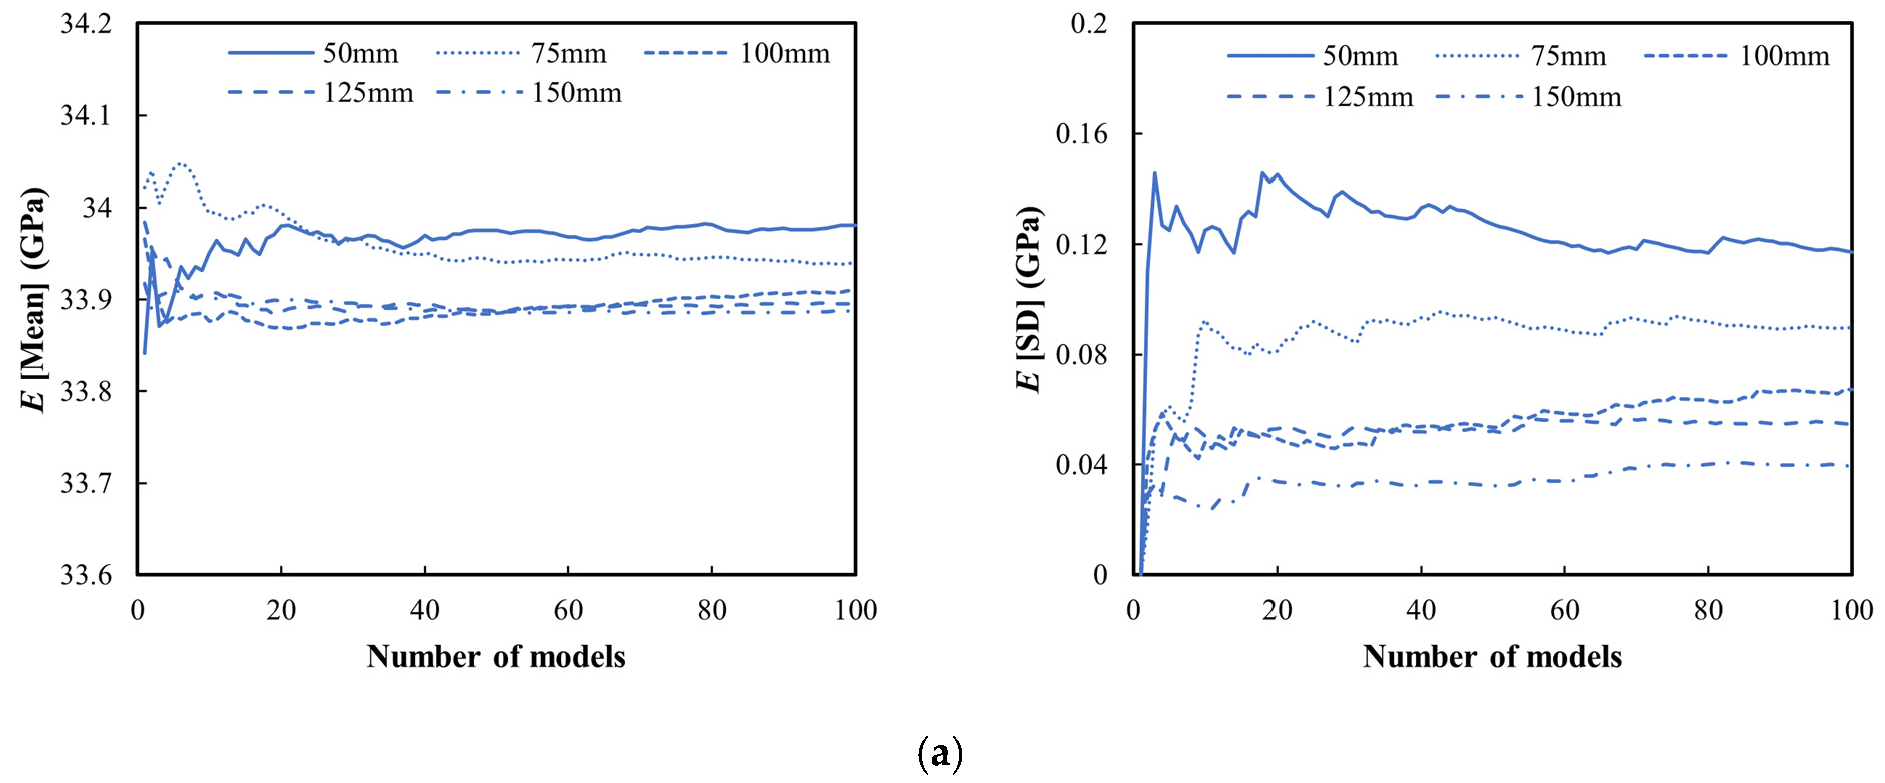
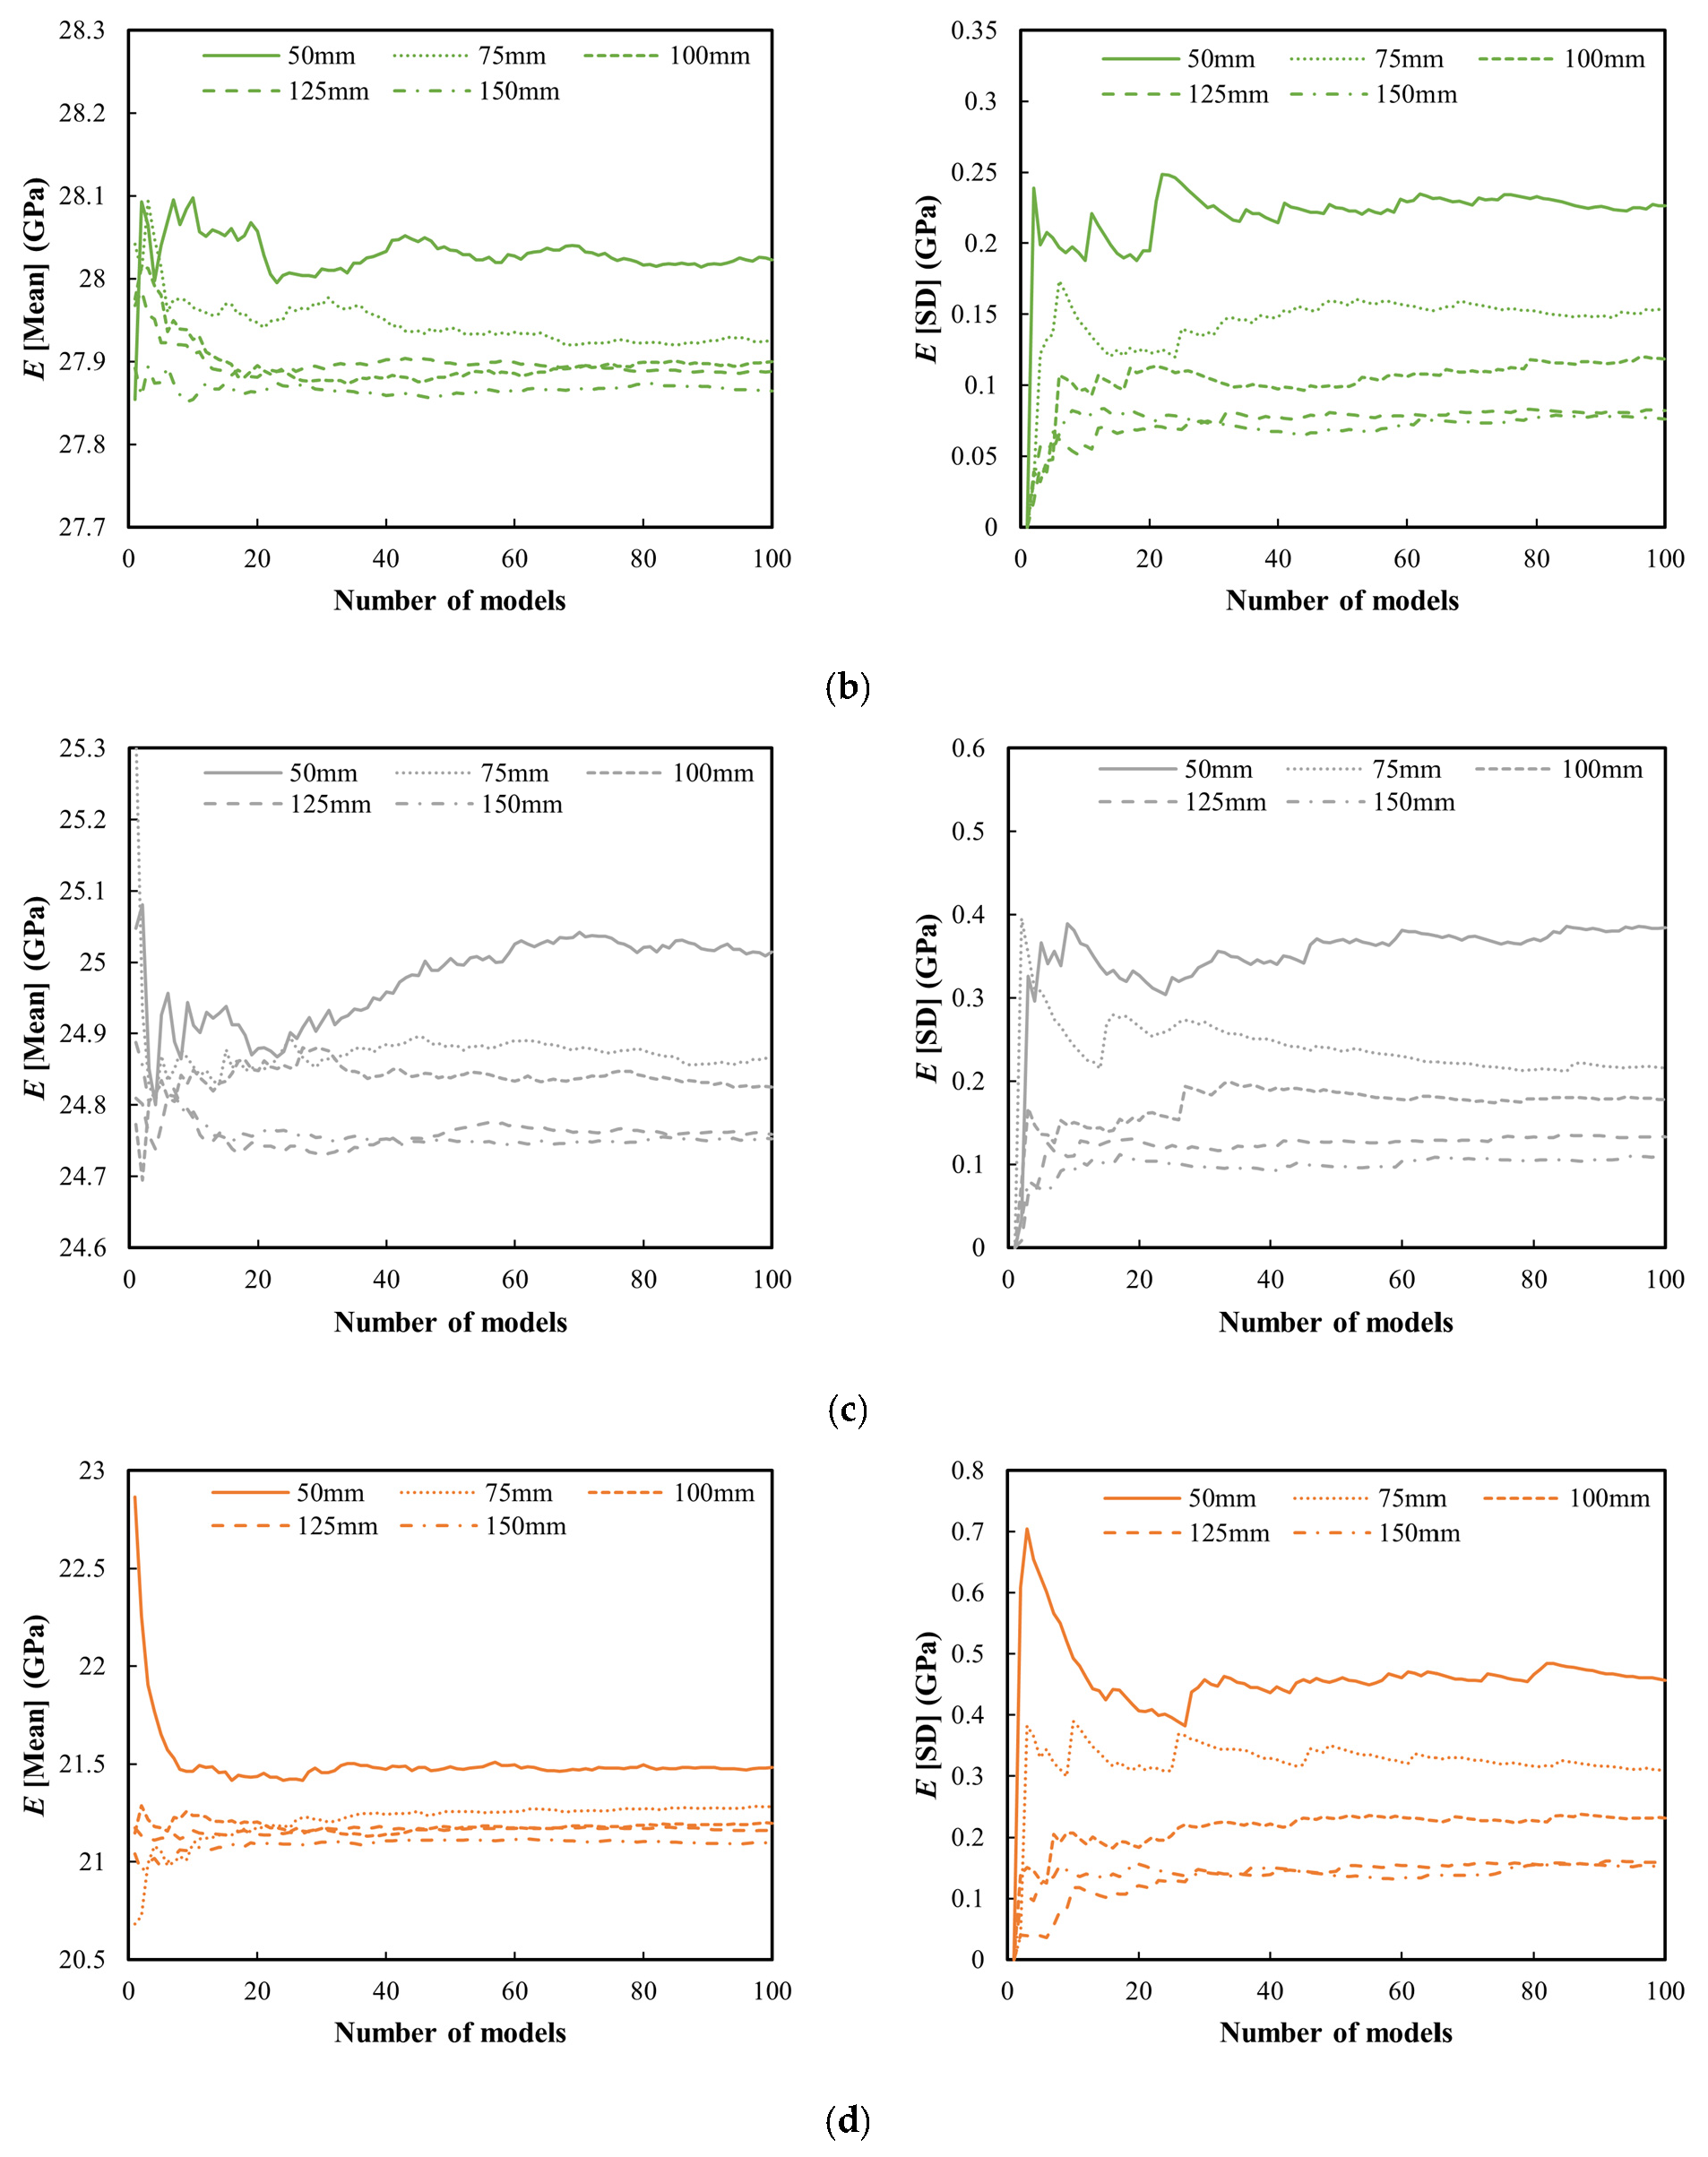
Figure 6 illustrates the influence of the sample size in the Monte Carlo simulation on the homogenized elastic modulus E and its standard deviation. The simulation results demonstrate that both the mean value and standard deviation of the elastic modulus E achieve statistical convergence when the number of computational models reaches 100. Similar conclusions apply to the shear modulus G and Poisson’s ratio μ.
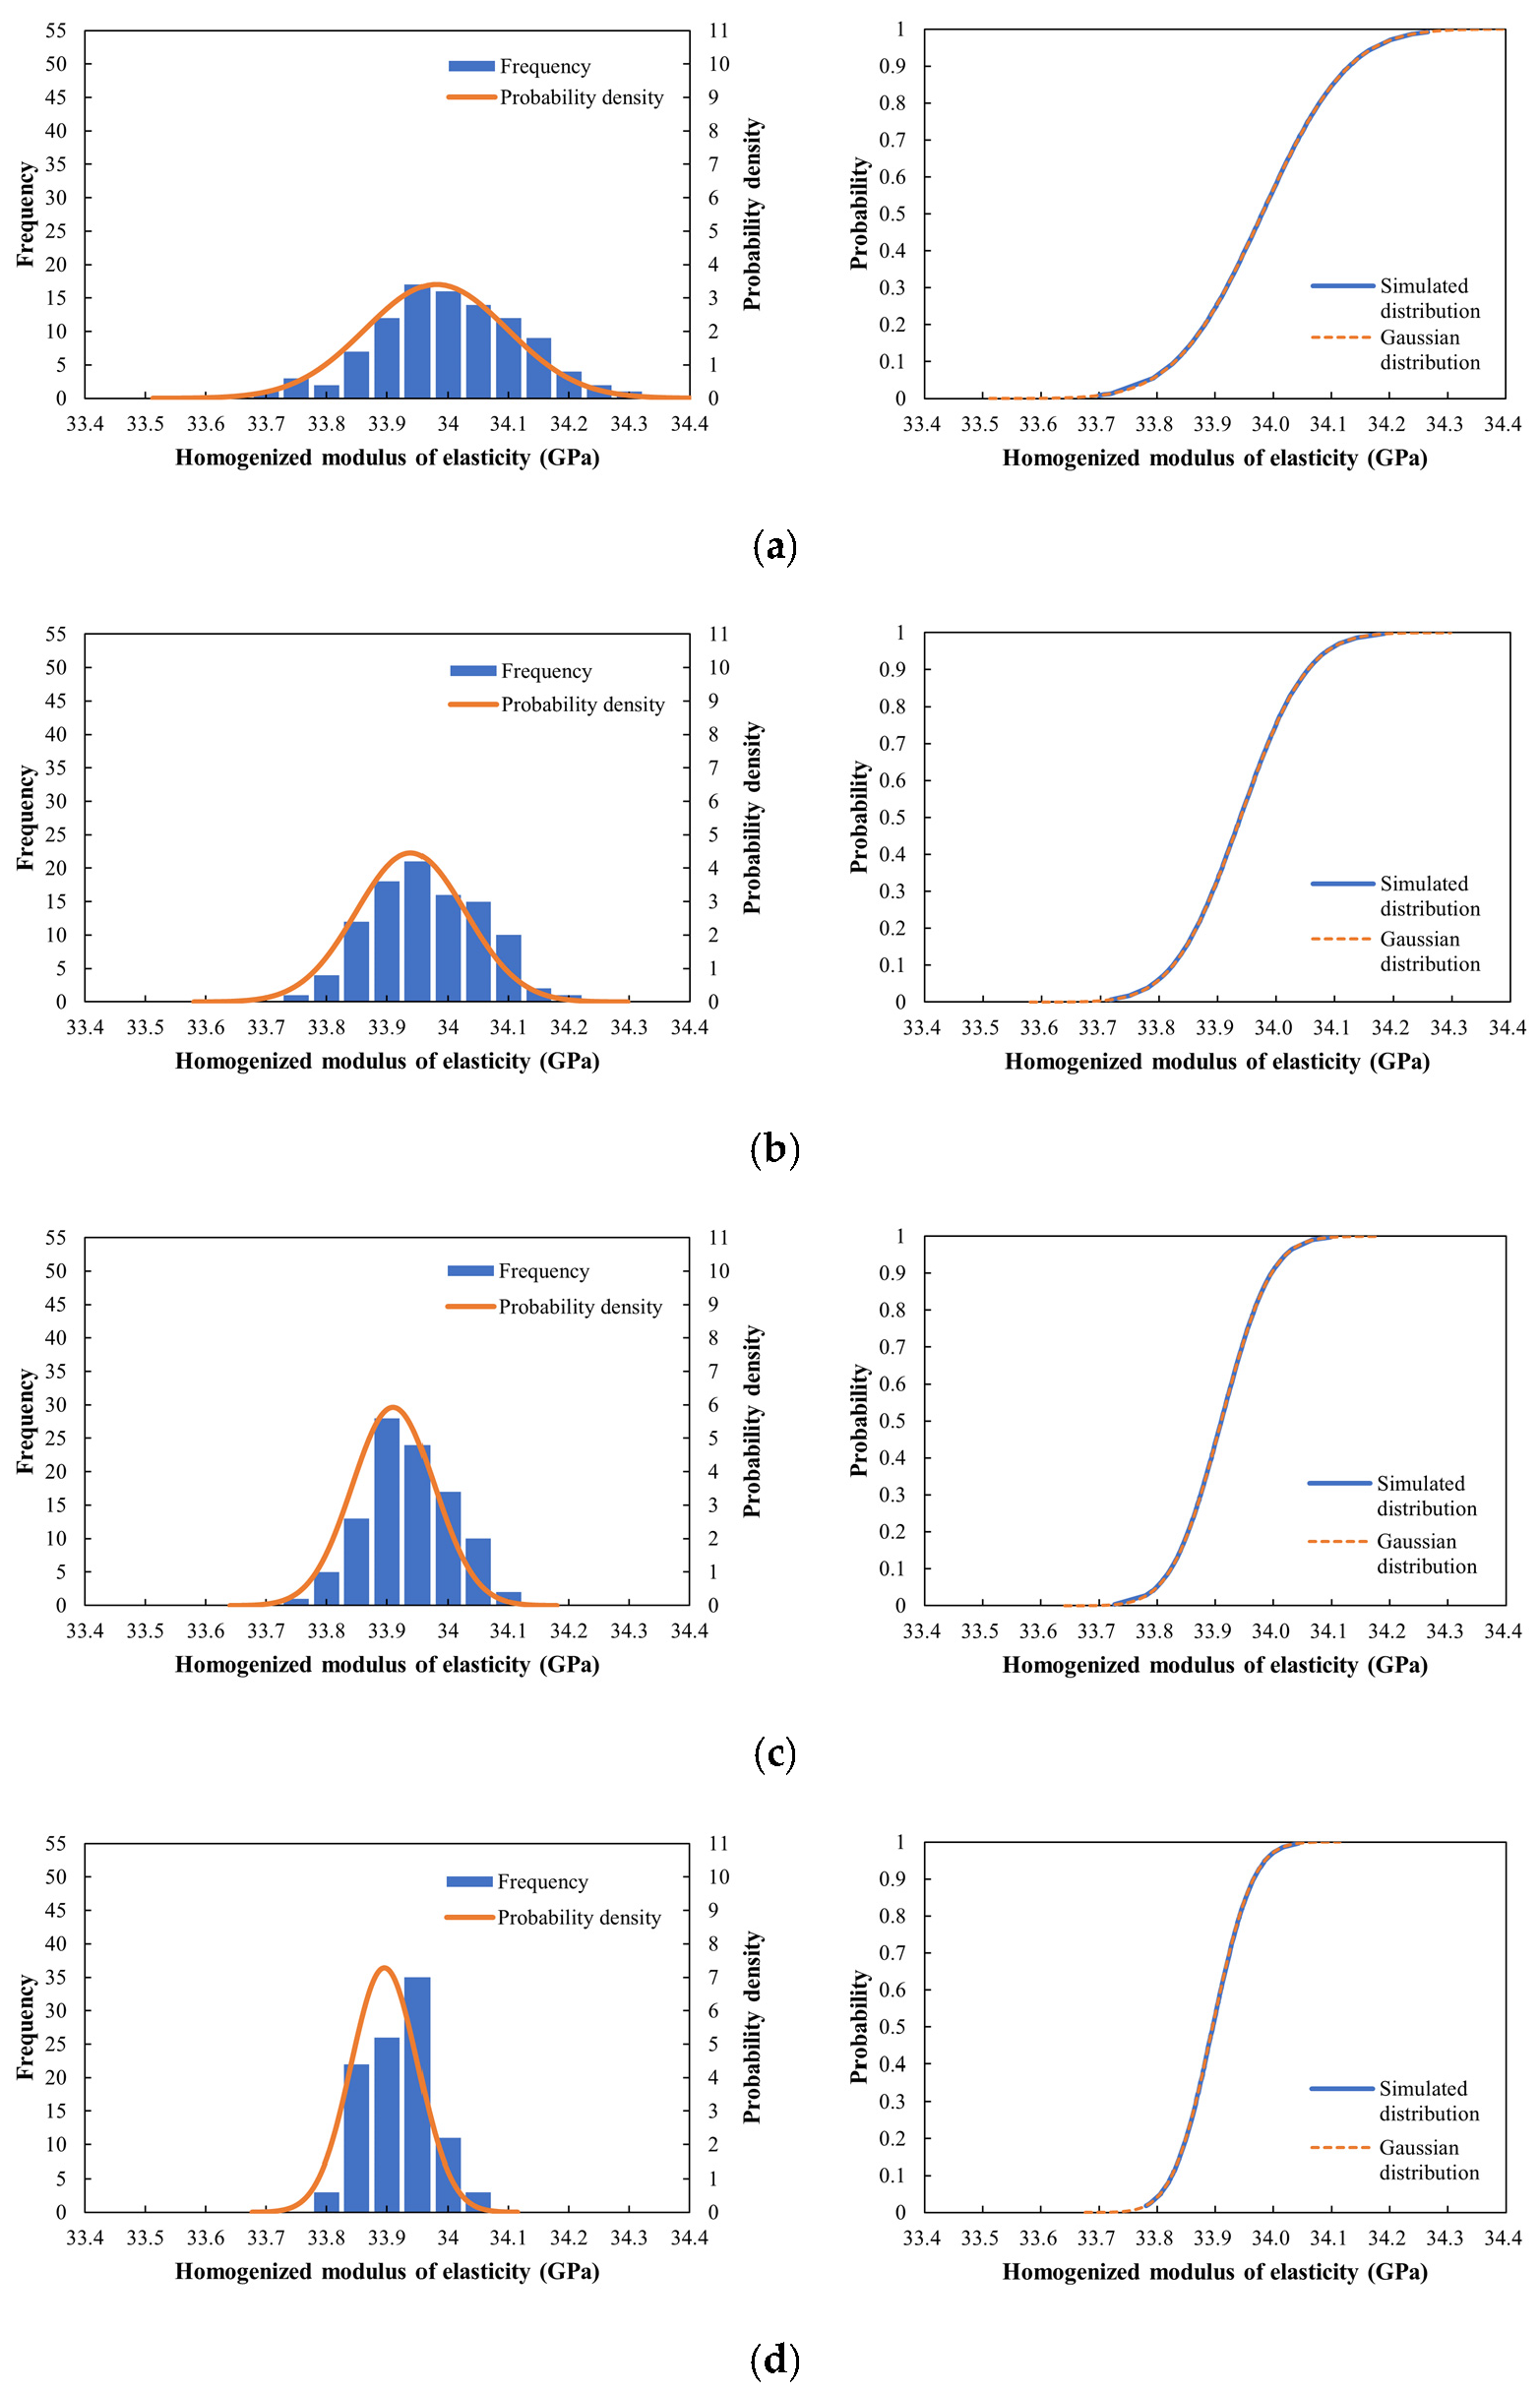
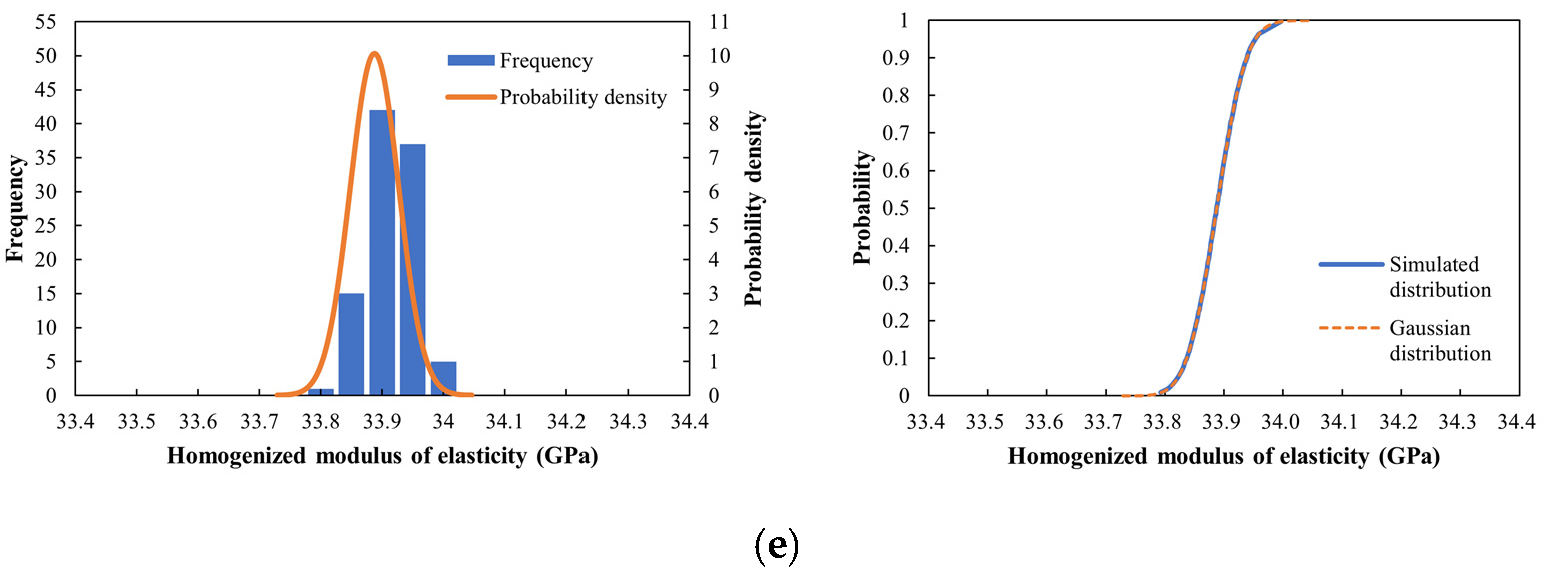
Taking the mesoscale model with 0% rubber content as an example, a statistical analysis of the distribution of the homogenized elastic modulus E was conducted. As shown in Figure 7, the cumulative probability distribution of the simulation results closely coincided with the Gaussian distribution curve corresponding to the same mean and standard deviation. This indicates that the probability density distribution of the homogenized elastic modulus E conforms to a Gaussian distribution. Kolmogorov–Smirnov goodness-of-fit tests were conducted on the generated E value distributions. The resulting p-values for all sample sets were greater than 0.05, failing to reject the null hypothesis. Under the same rubber content, as the model size increased, the standard deviation gradually decreased, and the corresponding data points became more concentrated. The same conclusions were observed for the shear modulus G and Poisson’s ratio μ.
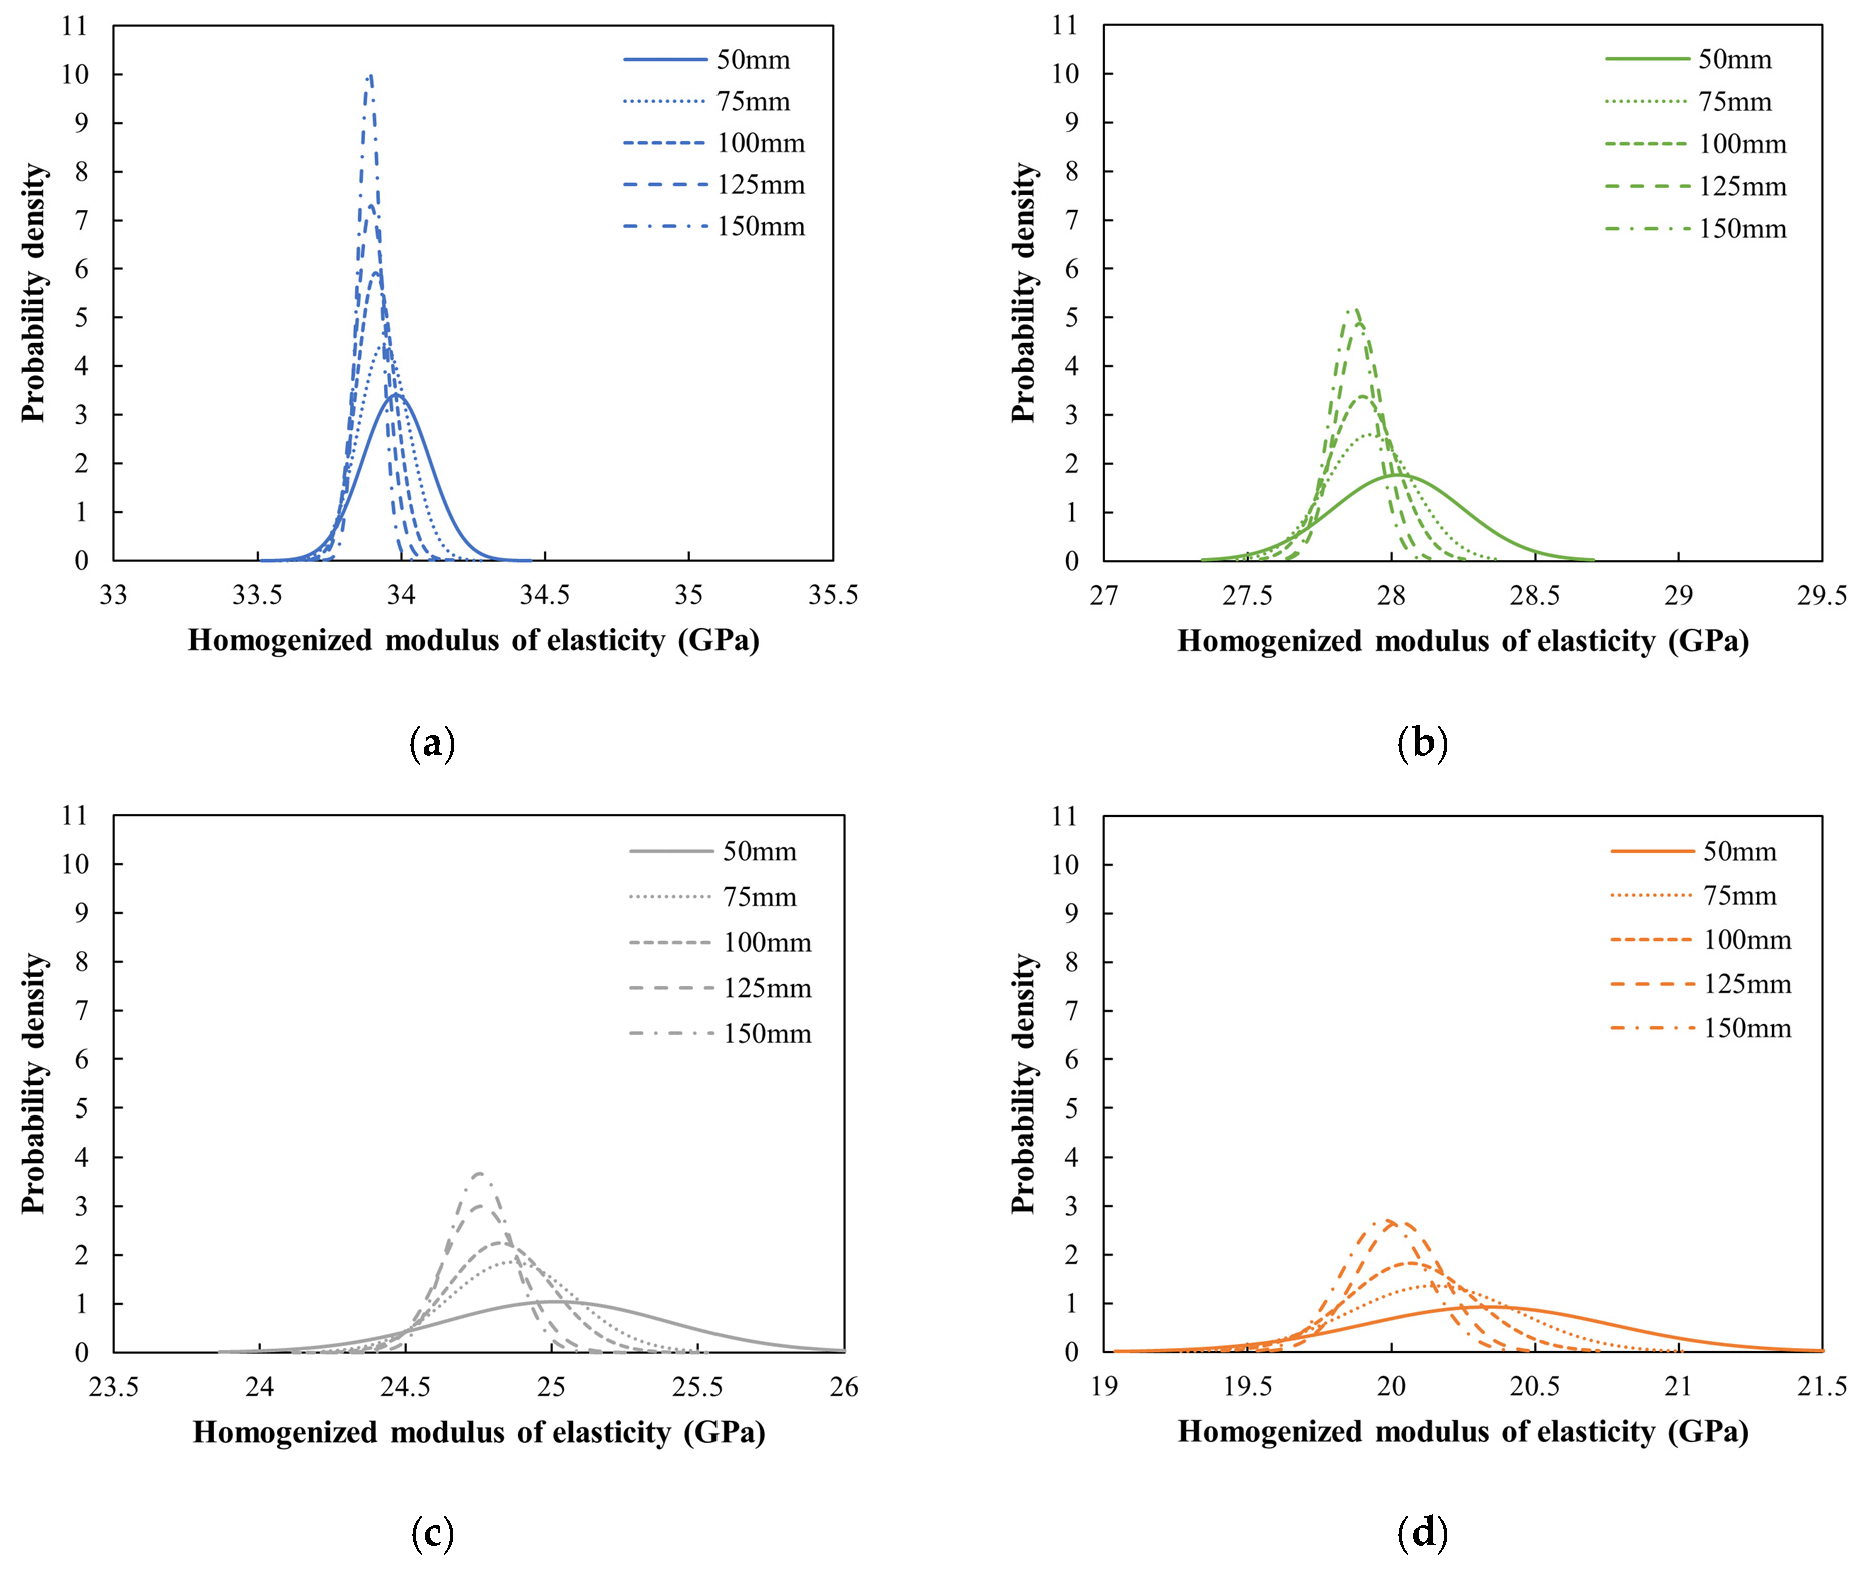
The Gaussian distribution curves of models with different sizes in Figure 7 can be combined and displayed to obtain Figure 8. As clearly shown in Figure 8, with the increase in rubber content, the probability density distribution curve of the homogenized elastic modulus becomes flatter, and the standard deviation significantly increases, indicating a more dispersed distribution of the simulated homogenized elastic modulus E. Similar conclusions can be drawn for the shear modulus G and Poisson’s ratio μ.
The simulation results of the 2000 models in this section were statistically calculated according to rubber contents and side length dimensions, and the outcomes are summarized in Table 5. The decreasing trend of the simulated statistical values of the elastic modulus E (0–18%–27–41%) with the increase in rubber content from 0% to 15% is generally consistent with the experimental results (33.72 GPa [0%]–27.90 GPa [17%]–21.83 GPa [35%]–14.45 GPa [57%]) obtained by our research group [44]. The mixed proportion of CRC used in the experiment [44] is consistent with that of the mesoscale numerical model in this paper. The elastic modulus of CRC specimens with rubber content of 0%, 5%, 10%, and 15% was determined using standard uniaxial compression test methods. As shown in the statistical data in Table 5, the homogenized macroscale performance parameters—elastic modulus E and shear modulus G—exhibit a significant decreasing trend with increasing rubber content, while Poisson’s ratio μ demonstrates an upward trend.

4.3. The Influence of Model Size and Rubber Content

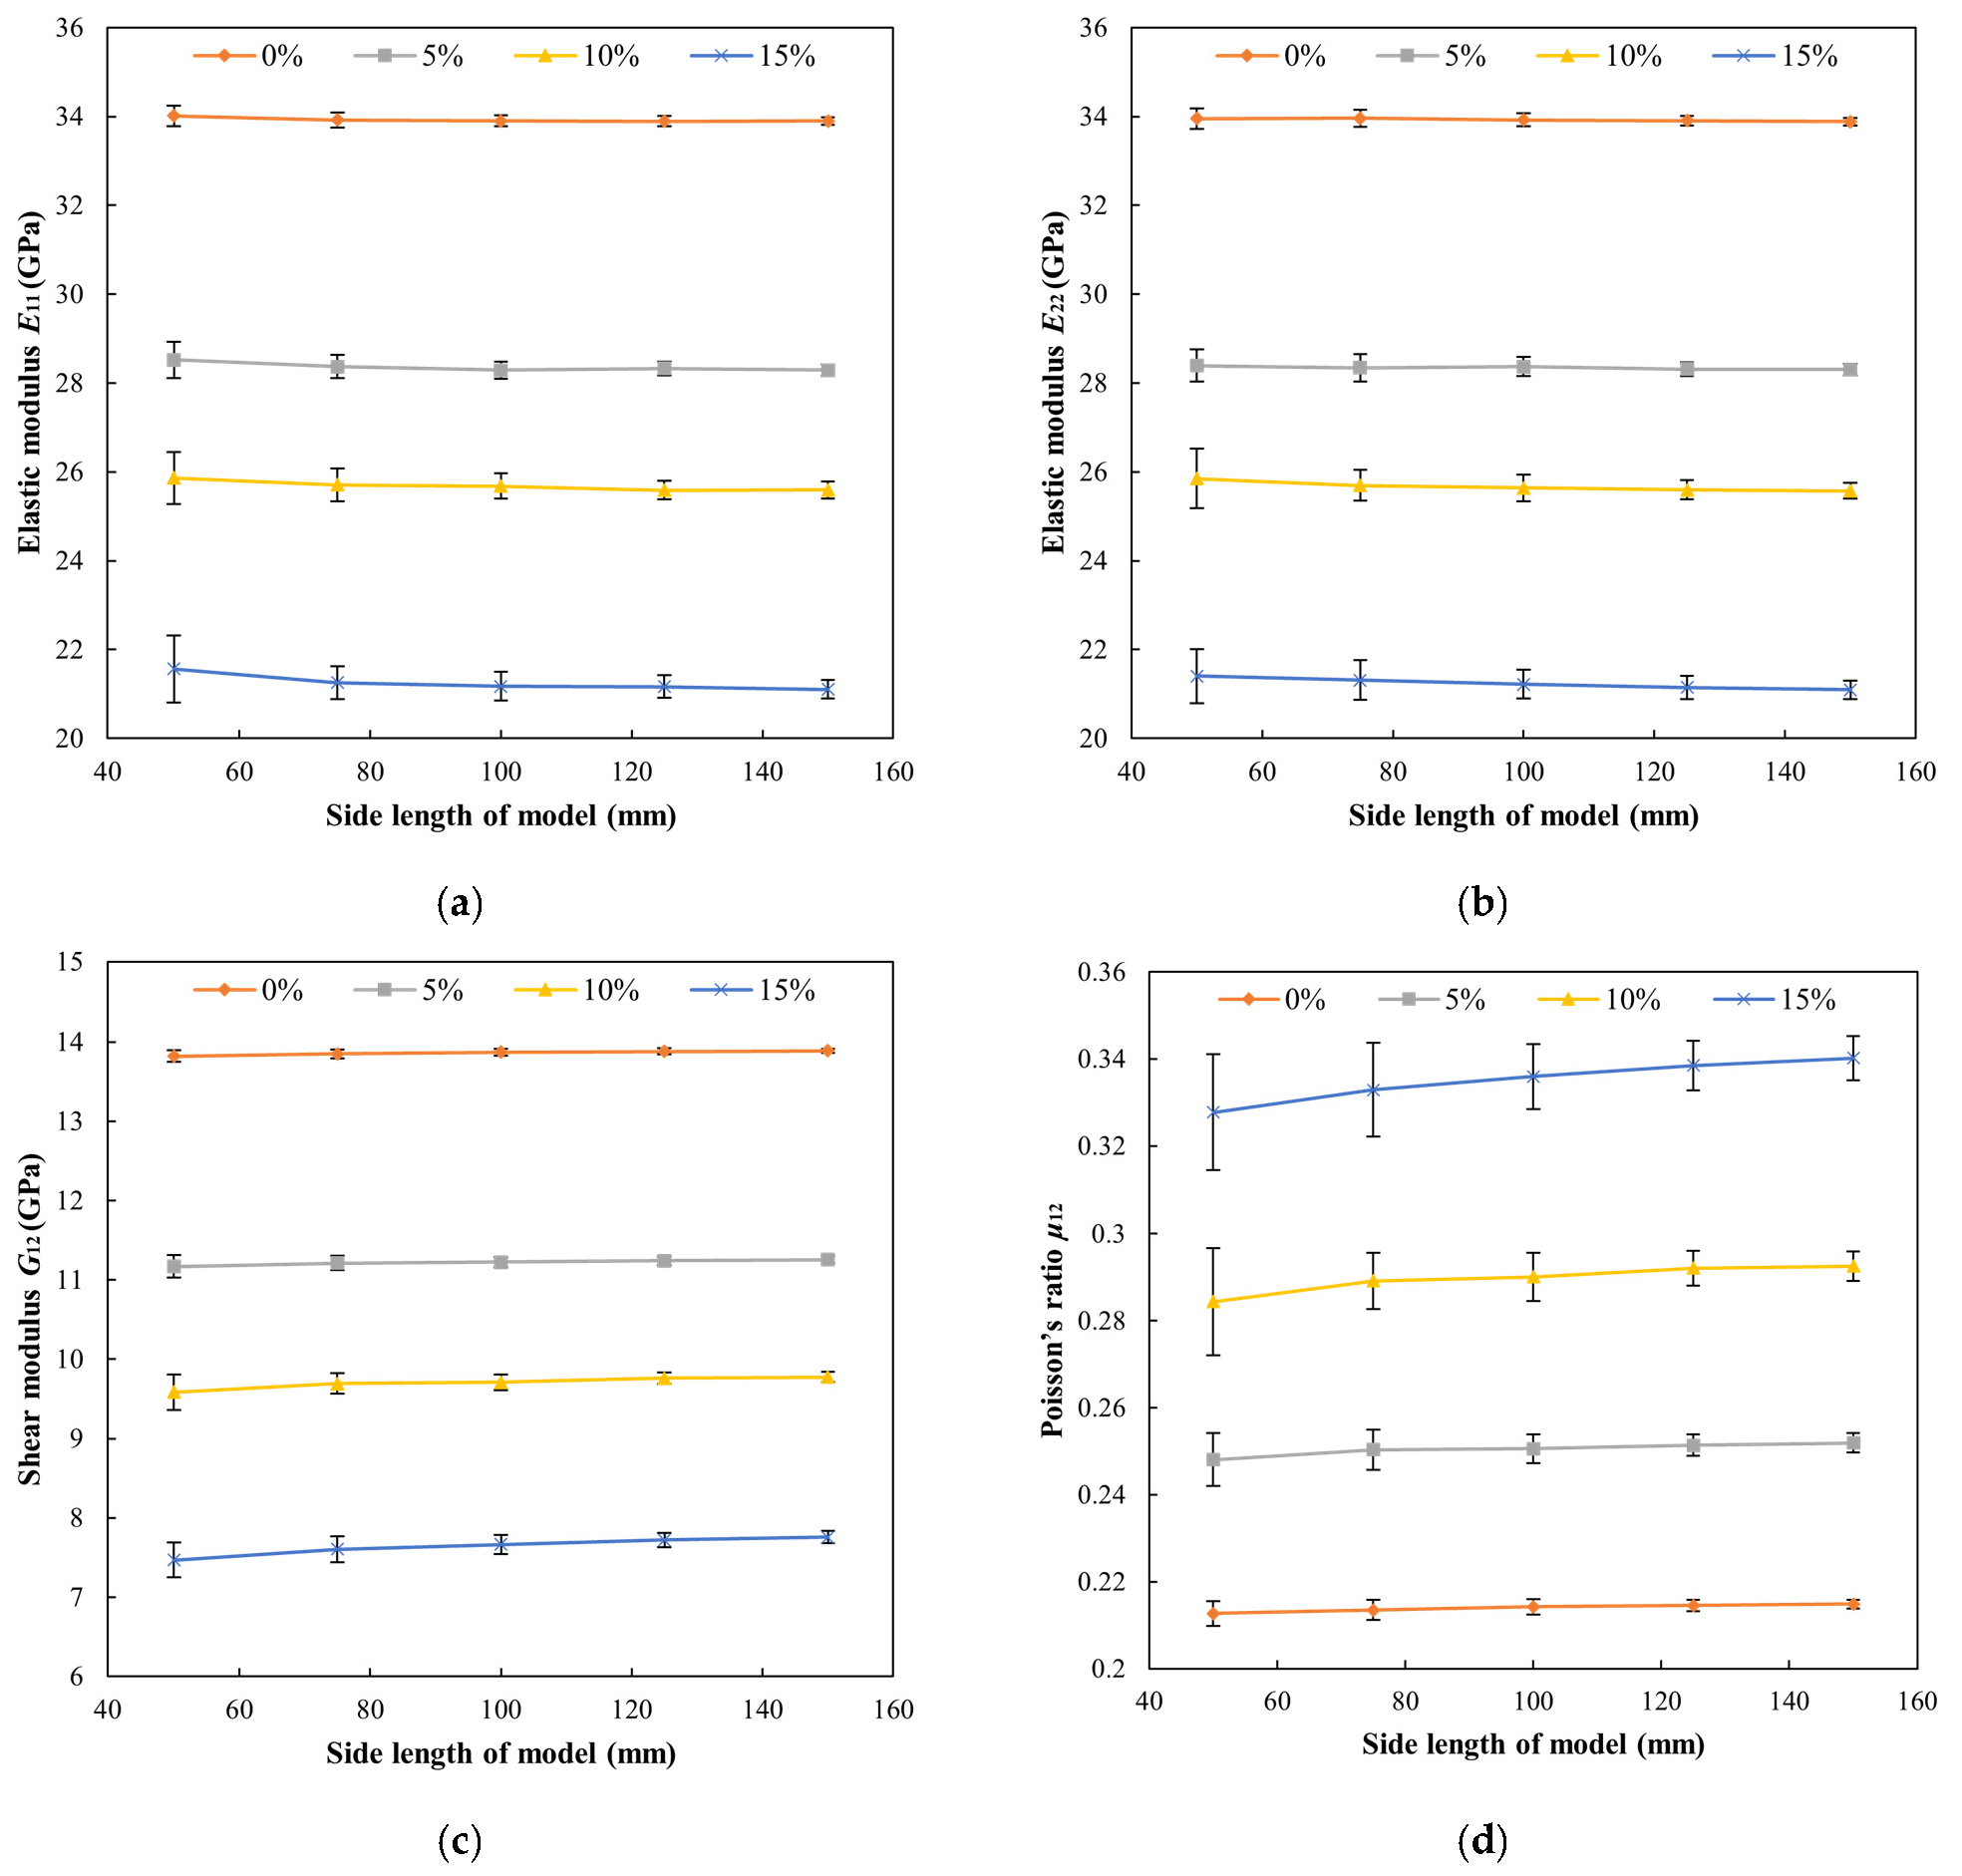
Based on the computational results of mesoscale homogenization for elastic parameters, figures were generated to illustrate the variations in homogenized elastic moduli E11, E22, shear modulus G12, and Poisson’s ratio μ12 with model size for specimens containing different rubber contents, as shown in Figure 9. The standard deviations of these parameters are indicated by “I”-shaped symbols, thus clearly illustrating the fluctuation range of simulation results relative to homogenized calculation results.
As shown in Figure 9, it can be observed that the homogenized elastic moduli E11 and E22 decrease with increasing model size, while the shear modulus G12 and Poisson’s ratio μ12 increase with the growth of the model size. It can be particularly noted that the larger the rubber content in the model, the more significant the changes in the homogenized elastic parameters mentioned above.
The systematic decrease in homogenized E with increasing RVE size is a well-documented phenomenon linked to the use of KUBCs. In numerical homogenization, KUBCs impose an upper-bound constraint on the apparent stiffness. As the RVE size increases, the model captures a broader, more representative network of “soft” compliant paths (continuous mortar matrix and rubber inclusions) that can deform collectively, relaxing the artificially stiff constraints at the boundaries. Thus, the effective stiffness softens and converges downward asymptotically toward the true effective property.
When the side length of the model is the same, for the same elastic parameter, as the rubber content increases, the fluctuation of the homogenized elastic parameter near its mean becomes larger, which further indicates an increase in the non-uniformity of the model. On the contrary, when focusing on curves with the same rubber content, as the model size increases, the fluctuation of the uniform elastic parameters near their mean gradually decreases. That is to say, the larger the model size, the higher the degree of uniformity, and the smaller the dispersion of the uniform elastic parameters.
Based on the mean and standard deviation of the homogenized elastic parameters, the coefficient of variation (CoV) cv can be calculated, as shown in Equation (20):
c v = σ / μ
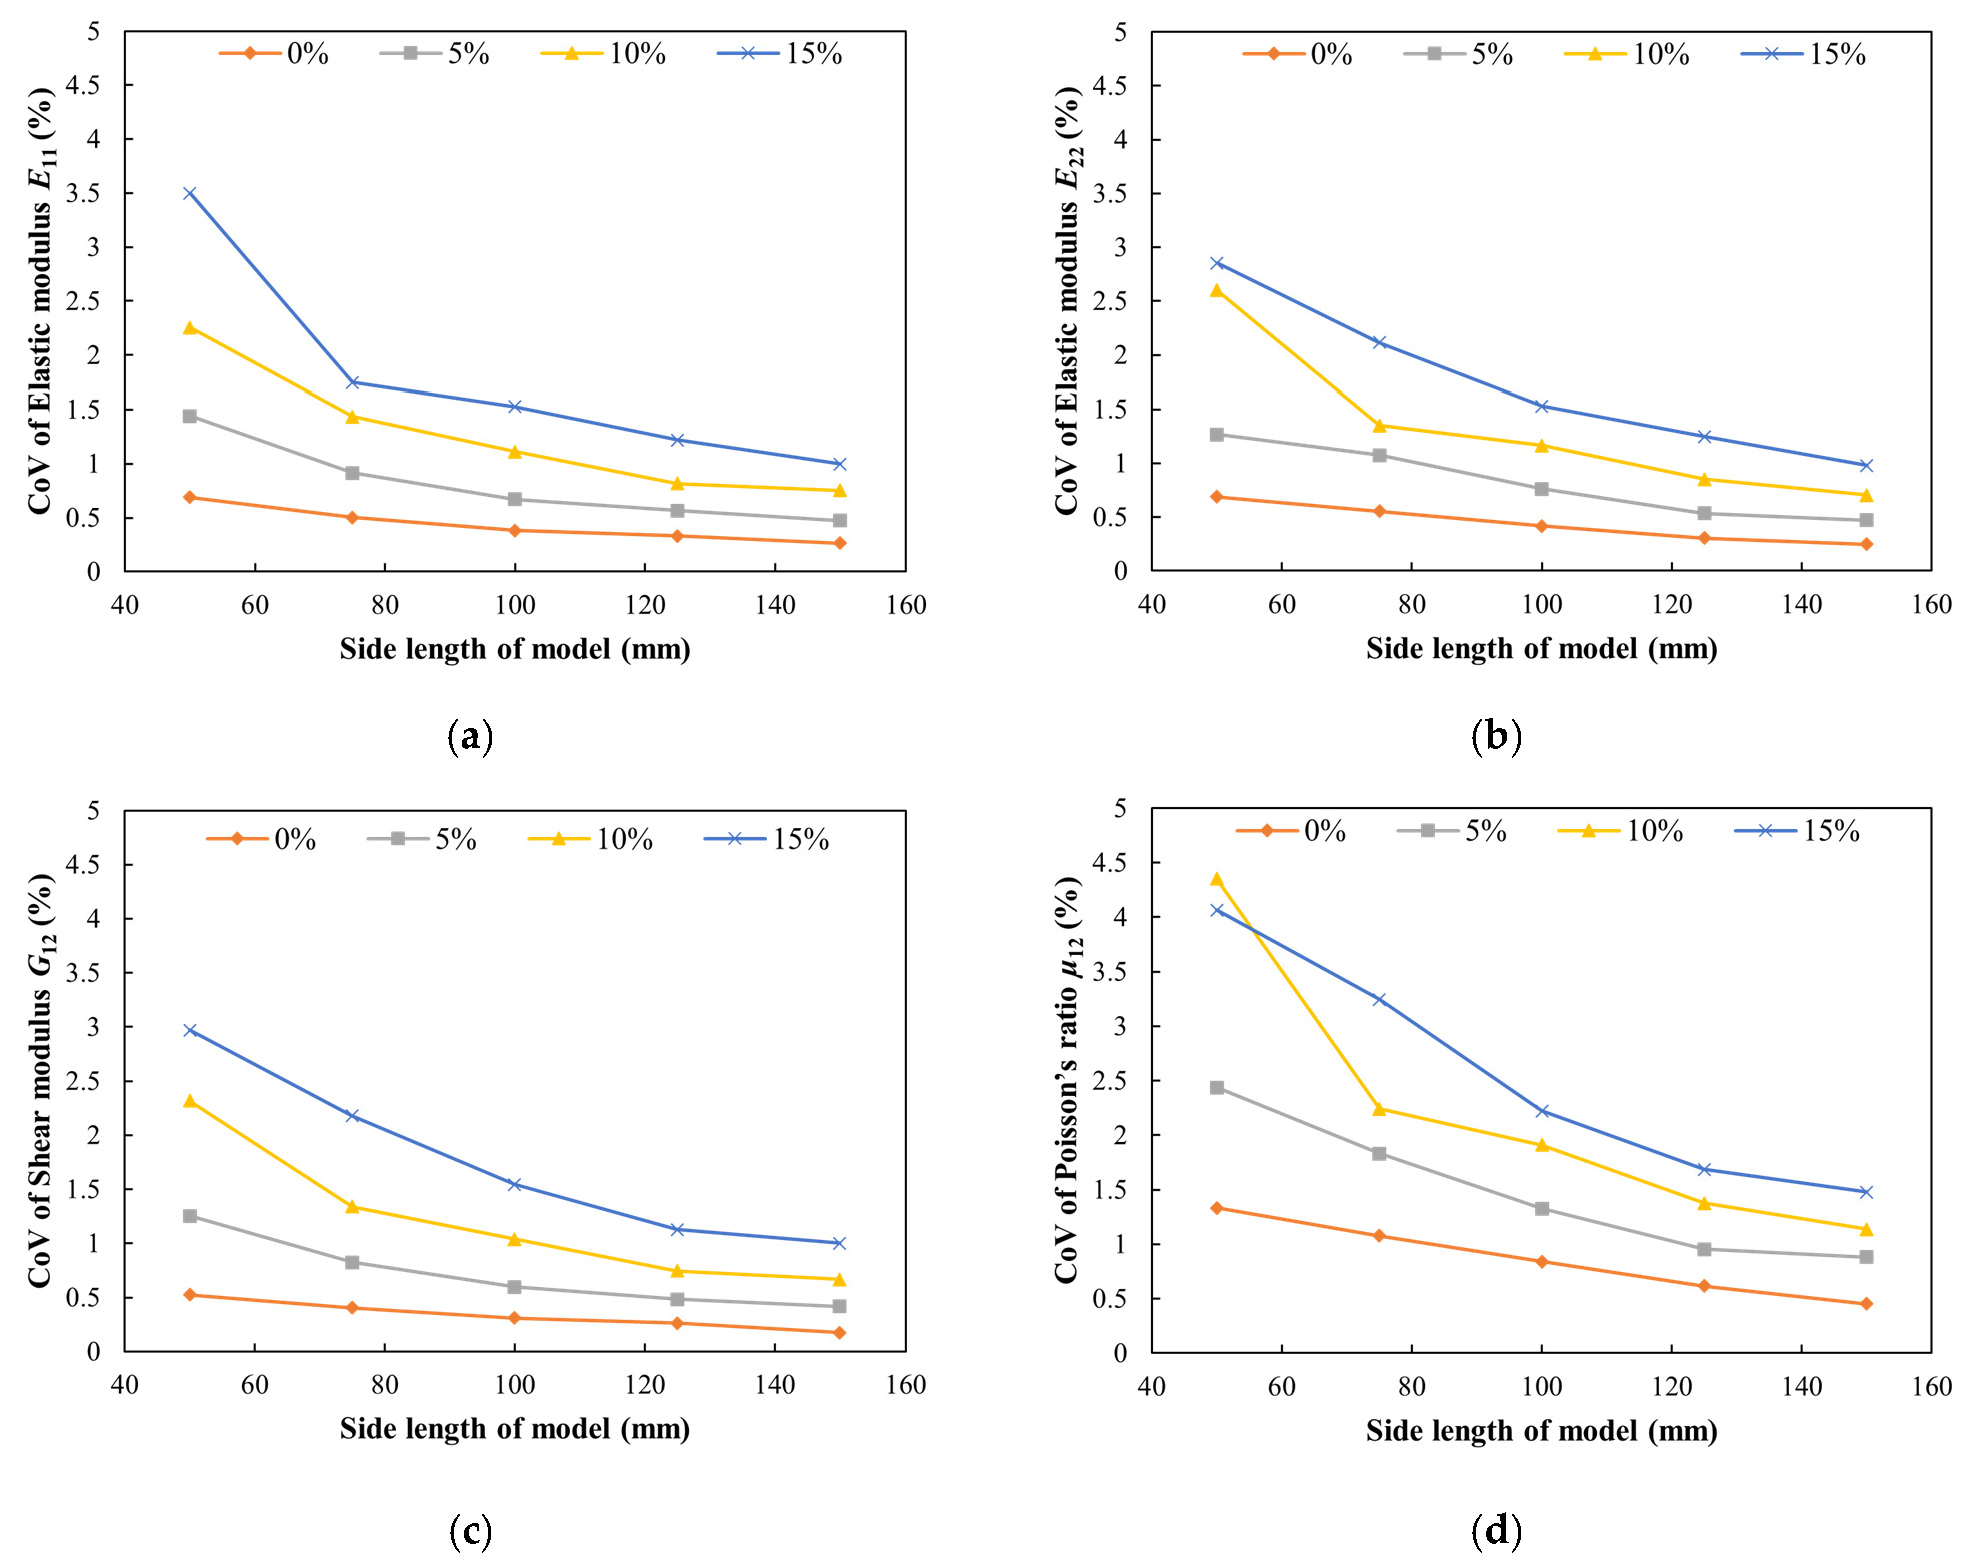
where μ is the mean of the elastic parameter, and σ is its standard deviation. Based on the mean and standard deviation of the homogenized elastic parameters shown in Figure 9, the corresponding coefficients of variation were calculated and plotted in Figure 10, with data provided in Table 6. It can be observed that for the coefficients of variation in elastic moduli E11 and E22, when the model size is ≤100 mm, cv decreases significantly as the model size increases. When the model size exceeds 100 mm, the rate of cv reduction slows down and tends to converge. cv exhibits stable convergence when the model size ranges between 125 mm and 150 mm. It can be predicted that when the model size exceeds 150 mm, cv will stabilize further. Given the maximum aggregate size Dmax = 25 mm, the required RVE size is 5 times 25 = 125 mm. When the RVE size is five times or more the maximum aggregate size Dmax, stable homogenization results can be obtained as equivalent material parameters at the macroscale.

4.4. The Influencing Factors of Equivalent Elastic Modulus

Based on the previous results in this section, the results of homogenization of equivalent elastic modulus E are listed in Table 7. Further research is conducted on the relationship between homogenization of equivalent elastic modulus E and side length L of the RVE model, as well as rubber content, in order to extend the prediction of equivalent elastic modulus E to larger size RVE models and models with different rubber contents.
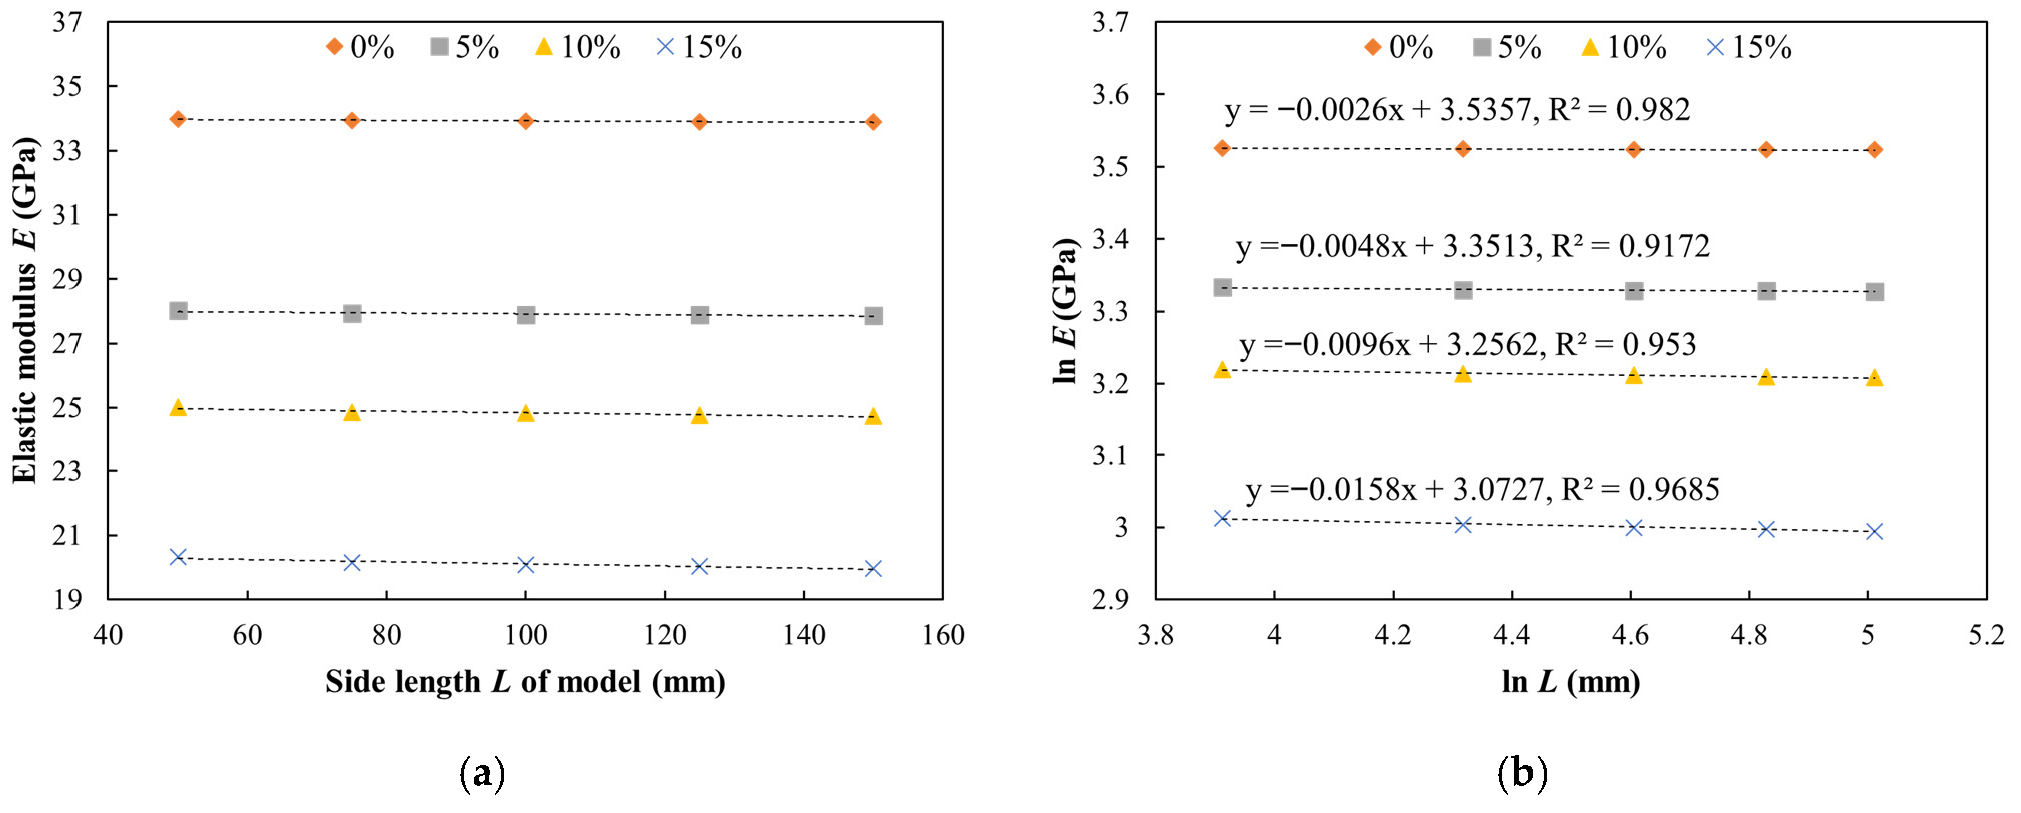
Based on the data in Table 7, Figure 11a was plotted. Subsequently, natural logarithms were taken for both the equivalent elastic modulus E and side length L of the RVE model, as shown in Figure 11b. The asymptotic stabilization observed in multiphase stochastic models generally follows a power-law decay, which correspondingly yields a linear trend when plotted on logarithmic scales (ln E vs. ln L). By linearly fitting the values of ln E and ln L, we can obtain the following:
{ 0 % : ln E = 0.0026 ln L + 3.5357 ,   R 2 = 0.9820 5 % : ln E = 0.0048 ln L + 3.3513 ,   R 2 = 0.9172 10 % : ln E = 0.0096 ln L + 3.2562 ,   R 2 = 0.9530 15 % : ln E = 0.0158 ln L + 3.0727 ,   R 2 = 0.9685
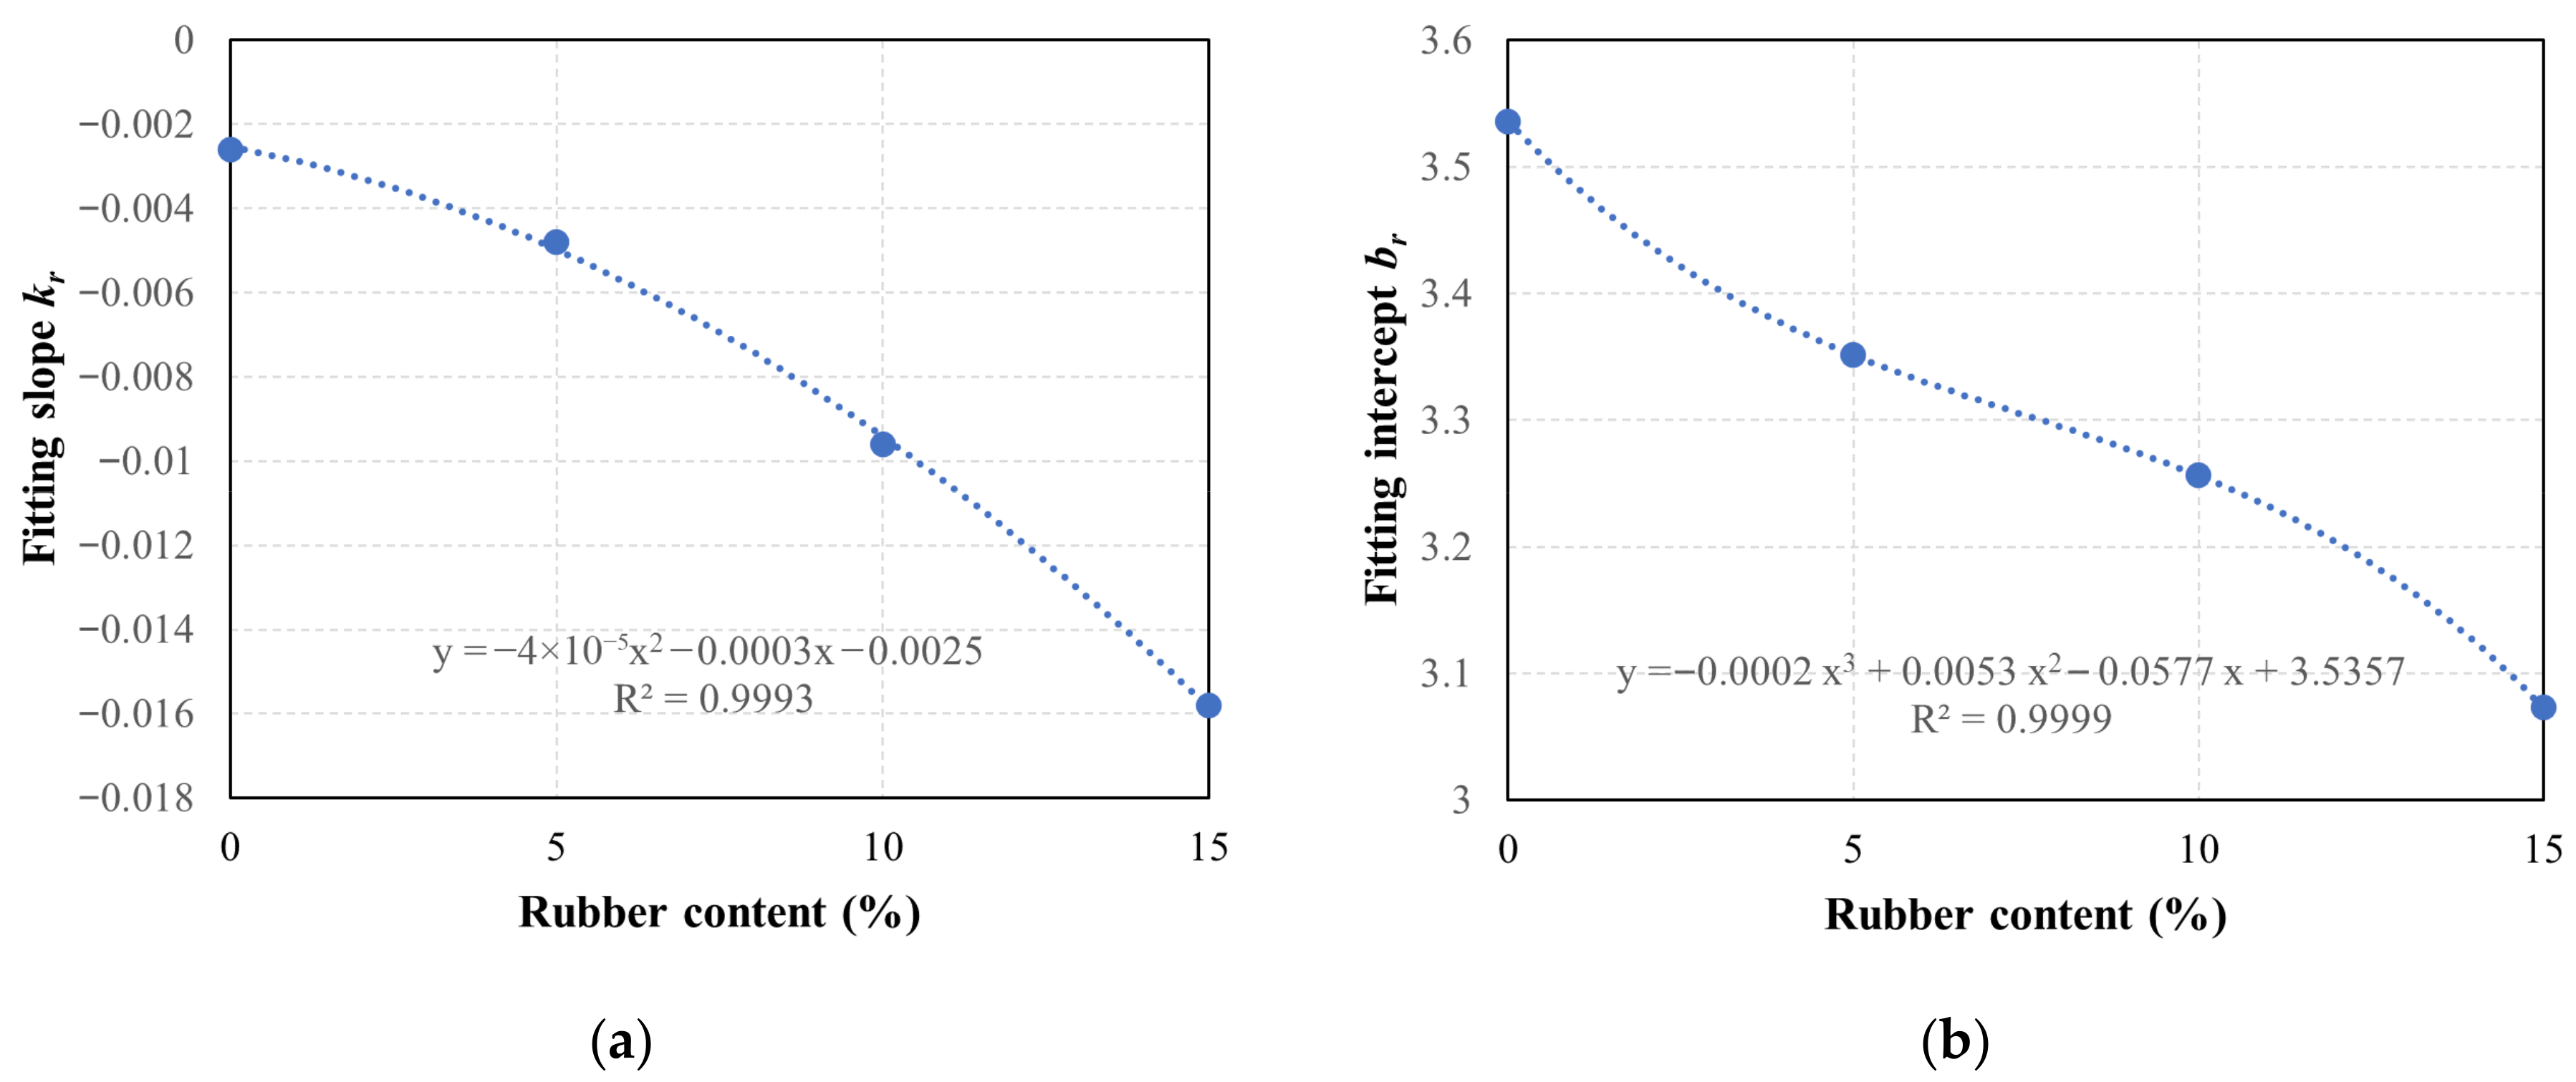
Equation (21) is an empirical, phenomenological scaling law based on the simulated data trends. However, it is mathematically analogous to well-established asymptotic scaling laws in concrete mechanics (such as Bažant’s size effect law [45]), where macroscopic properties scale nonlinearly with specimen size before hitting an asymptotic limit. There is a linear negative correlation between ln E and ln L. The absolute value of the slope kr of the fitted line increases with the rubber content (r), while the absolute value of the intercept br decreases as the rubber content increases. By fitting the values of kr and br separately (as shown in Figure 12), the following relationships are obtained:
{ k r = 0.00004 r 2 0.0003 r 0.0025 , R 2 = 0.9993 b r = 0.0002 r 3 + 0.0053 r 2 0.0577 r + 3.5357 , R 2 = 0.9999
By simplifying the slope and intercept of Equation (21) using kr and br respectively, we obtain the following:
ln E r = k r ln L + b r
E r = e k r ln L + b r
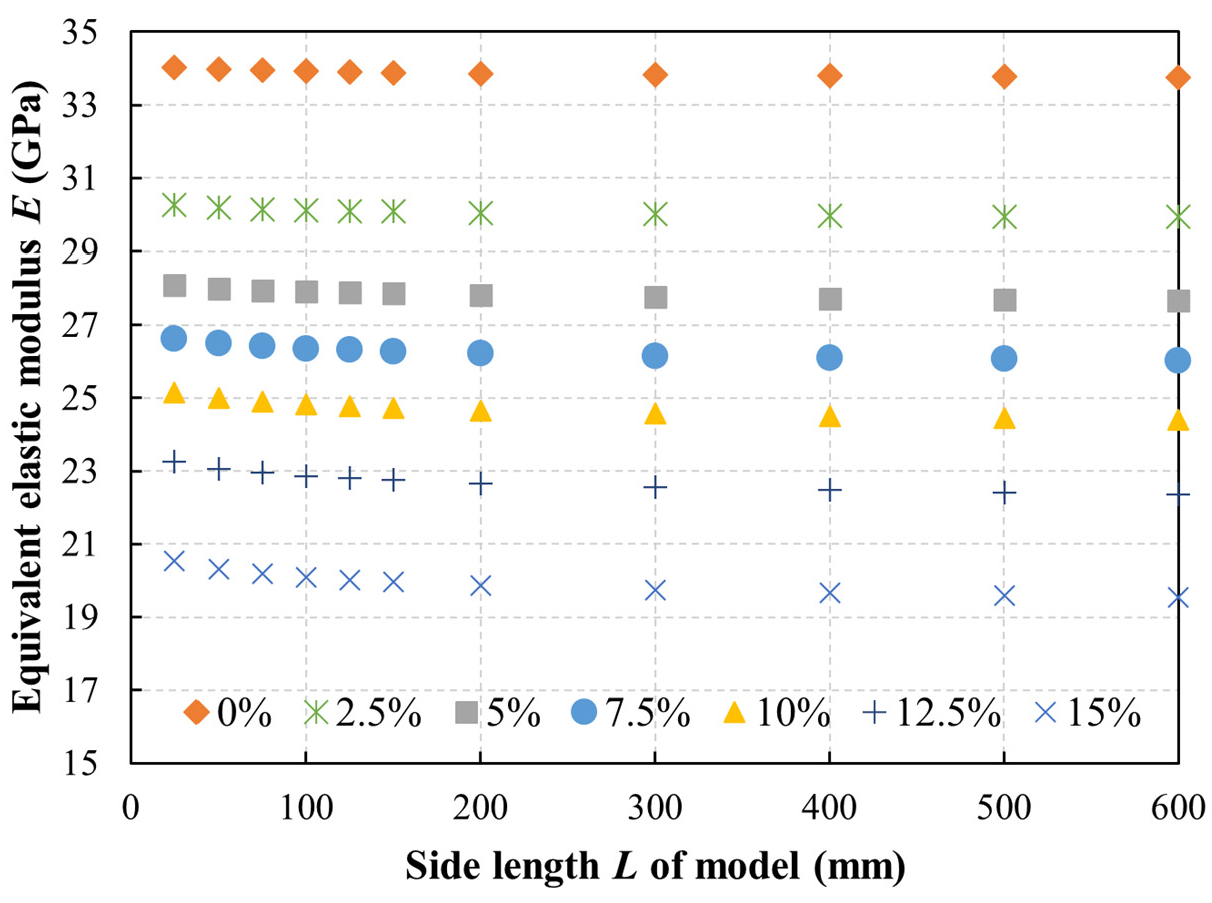
Based on Equation (21), the RVE model dimension L is expanded starting from 200 mm with intervals of 100 mm up to 600 mm, corresponding to the dimensions of structural concrete components. Extrapolation up to 600 mm is physically sound because it occurs entirely within the stabilized, post-RVE dimension, where properties asymptotically plateau. The equivalent elastic modulus E is calculated for each dimension, which can be applied in engineering structural design. According to the fitting relationship of Equation (22), the values of kr and br are interpolated to obtain the values of kr and br corresponding to different rubber contents between 0% and 15%. The corresponding values of equivalent elastic modulus E are then calculated. Here, the rubber contents of 2.5%, 7.5%, and 12.5% are taken for calculation, and Equation (25) can be obtained, as shown in Figure 13. As the model size increases, the equivalent elastic modulus E begins to decrease rapidly, then slows down, and finally stabilizes.
{ E 0 % = e 0.0026 ln L + 3.5357 E 2.5 % = e 0.0035 ln L + 3.4212 E 5 % = e 0.0048 ln L + 3.3513 E 7.5 % = e 0.0070 ln L + 3.3037 E 10 % = e 0.0096 ln L + 3.2562 E 12.5 % = e 0.0124 ln L + 3.1866 E 15 % = e 0.0158 ln L + 3.0727

5. Conclusions

Based on the traditional random aggregate model, 2D meso finite element models of CRC with different rubber contents and sizes are established in this paper. Through the simulation of a large number of model samples, the numerical homogenization analysis of the calculation results is carried out. Based on the meso numerical homogenization analysis, the macro equivalent parameters of CRC are obtained, which are helpful to reveal the macro mechanical properties of CRC from the perspective of its meso composition. Several main conclusions of this paper are as follows:
  • When the rubber content is the same, the larger the size of the model, the greater the elastic anisotropy ratio A. When the size is the same, the higher the rubber content, the smaller the elastic anisotropy ratio A. A smaller model size and a higher rubber content correspond to increased heterogeneity. Each mesoscale numerical model can be approximated as isotropic, and the average elastic modulus E = (E11 + E22)/2 can be used to simplify the definition of the equivalent elastic modulus of the model.
  • The probability density distribution of the homogenized elastic modulus E, shear modulus G, and Poisson’s ratio μ of the CRC model follows a Gaussian distribution. The homogenized elastic modulus E and shear modulus G decreased significantly with the increase in rubber content, while Poisson’s ratio μ increased. The simulation results are in good agreement with the existing CRC experimental data of elastic modulus.
  • With a constant rubber content, an increase in RVE model size leads to a progressive reduction in the standard deviation of the distributed data. In other words, larger dimensions of the RVE model enhance uniformity and minimize variability in the homogenized elastic parameters. With the increase in rubber content, the probability density distribution curve of the homogenized elastic modulus becomes flatter, and the standard deviation also increases significantly. This indicates that the distribution of homogenized elastic modulus obtained from simulations becomes more dispersed, demonstrating an enhanced non-uniformity degree in the model. When the RVE size is five times or more of the maximum aggregate size, the stable homogenization results can be obtained as the equivalent material parameters of the macro scale.
  • For the meso model of CRC with the same rubber content, the equivalent elastic modulus E is linearly and negatively correlated with the natural logarithm of the RVE model size L. The absolute value of the slope fitting kr increases with the increase in rubber content, and the absolute value of the intercept br decreases with the increase in rubber content. Through statistical analysis of data, the fitting formula for the equivalent elastic modulus under varying rubber contents was derived, and an extended analysis of RVE model dimensions and rubber contents was conducted. With the increase in RVE model size, the equivalent elastic modulus E initially decreases rapidly, then the rate of decrease slows down, and finally stabilizes.
  • The linear elasticity assumption utilized in this study is primarily applicable to the material’s pre-peak serviceability states. To simulate the ultimate impact response and macroscopic energy absorption, future work must couple the current model with damage mechanics frameworks. Additionally, it is recommended that future studies investigate the thermo-mechanical behavior of CRC under fire or high-temperature exposure. Since the inclusion of rubber significantly alters the material’s thermal conductivity, degradation temperature, and stiffness reduction characteristics, analyzing CRC under elevated temperatures will greatly enhance the engineering relevance of this research (e.g., see Reference [46]).

Author Contributions

Conceptualization, Z.M. and J.X.; methodology, G.Y. and Z.M.; software, G.Y. and L.Z.; validation, Y.Q., L.Z. and X.L.; formal analysis, G.Y., Y.Q. and L.Z.; investigation, G.Y., Y.Q., L.Z. and X.L.; resources, J.X. and X.L.; data curation, G.Y., Y.Q. and X.L.; writing—original draft preparation, G.Y. and L.Z.; writing—review and editing, Z.M. and J.X.; visualization, G.Y., Y.Q. and X.L.; supervision, Z.M. and J.X.; project administration, Z.M. and J.X.; funding acquisition, J.X. and G.Y. All authors have read and agreed to the published version of the manuscript.

Funding

This research was funded by the National Natural Science Foundation of China (Grant No. 51408408), the 111 Project (Grant No. B20039), and the China Postdoctoral Science Foundation (Grant No. 2025M773288).

Institutional Review Board Statement

Not applicable.

Informed Consent Statement

Not applicable.

Data Availability Statement

The data presented in this study are available on request from the corresponding author on reasonable request.

Conflicts of Interest

Authors Guang Yang, Zhongcheng Ma were employed by the company China Coal Tianjin Design Engineering Co., Ltd. Author Xiaofeng Liu was employed by the company China Petroleum Natural Gas Pipeline Engineering Co., Ltd. The remaining authors declare that the research was conducted in the absence of any commercial or financial relationships that could be construed as a potential conflict of interest.

Abbreviations

The following abbreviations are used in this manuscript:
CRCCrumb rubber concrete
RVERepresentative volume element
ITZInterfacial Transition Zone
KUBCsKinematic Uniform Boundary Conditions
SDsStandard deviations
CoVCoefficients of variation

References

  1. Xu, J.; Yao, Z.Y.; Yang, G.; Han, Q.H. Research on crumb rubber concrete: From a multi-scale review. Constr. Build. Mater. 2020, 232, 117282. [Google Scholar] [CrossRef] [Scilit]
  2. Qi, Y.; Yang, G.; Ma, Z.C.; Jia, P.P.; Li, L.; Xu, J. Mechanical and fracture properties of crumb rubber concrete based on CT in-situ uniaxial compression test and mesoscale numerical simulation. J. Build. Eng. 2026, 117, 114809. [Google Scholar] [CrossRef] [Scilit]
  3. Yang, G.; Qi, Y.; Ma, Z.C.; Xu, J. Quantitative characterization of crumb rubber concrete interfacial transition zone based on microscopic test method. Constr. Build. Mater. 2025, 505, 144689. [Google Scholar] [CrossRef] [Scilit]
  4. Yang, J.; Gao, X.F.; Xu, J.; Zhu, H.; Hasan, M.M.; Shao, J.W.; Haruna, S.I. A multi-scale investigation on recycled ceramic and rubber composite cement-based materials: Acoustic emission, NMR, molecular dynamics simulation. Constr. Build. Mater. 2024, 412, 134881. [Google Scholar] [CrossRef] [Scilit]
  5. Yang, J.; Gao, X.F.; Xu, J.; Lacidogna, G.; Shao, J.W.; Zhu, H.; Liu, C.Y.; Ye, C.J. Insights into the fracture properties of recycled ceramic and rubber composite cement-based materials: Fracture mechanics, acoustic emission, and digital image correlation. Constr. Build. Mater. 2024, 435, 136896. [Google Scholar] [CrossRef] [Scilit]
  6. Liu, F.; Meng, L.; Ning, G.; Li, L. Fatigue performance of rubber-modified recycled aggregate concrete (RRAC) for pavement. Constr. Build. Mater. 2015, 95, 207–217. [Google Scholar] [CrossRef] [Scilit]
  7. Abdelaleem, A.; Moawad, M.; El-Emam, H.; Salim, H.; Sallam, H.E.M. Long term behavior of rubberized concrete under static and dynamic loads. Case Stud. Constr. Mater. 2024, 20, e03087. [Google Scholar] [CrossRef] [Scilit]
  8. Zhang, Y.; Zhang, S.; Jiang, X.; Zhao, W.; Wang, Y.; Zhu, P.; Yan, Z.; Zhu, H. Uniaxial tensile properties of multi-scale fiber reinforced rubberized concrete after exposure to elevated temperatures. J. Clean. Prod. 2023, 389, 136068. [Google Scholar] [CrossRef] [Scilit]
  9. Han, X.; Zhou, S.; Chen, A.; Feng, L.; Ji, Y.; Wang, Z.; Sun, S.; Li, K.; Xia, X.; Zhang, Q. Analytical evaluation of stress–strain behavior of rubberized concrete incorporating waste tire crumb rubber. J. Clean. Prod. 2024, 450, 141963. [Google Scholar] [CrossRef] [Scilit]
  10. Elbialy, S.; Ibrahim, W.; Mahmoud, S.; Ayash, N.M.; Mamdouh, H. Mechanical characteristics and structural performance of rubberized concrete: Experimental and analytical analysis. Case Stud. Constr. Mater. 2024, 21, e03727. [Google Scholar] [CrossRef] [Scilit]
  11. Guo, Y.C.; Zhang, J.H.; Chen, G.; Chen, G.M.; Xie, Z.H. Fracture behaviors of a new steel fiber reinforced recycled aggregate concrete with crumb rubber. Constr. Build. Mater. 2014, 53, 32–39. [Google Scholar] [CrossRef] [Scilit]
  12. Ye, C.J.; Xu, J.; Lacidogna, G. Fracture behavior of 3D printed geopolymer concrete containing waste ceramic. Cem. Concr. Comp. 2025, 163, 106193. [Google Scholar] [CrossRef] [Scilit]
  13. Yang, G.; Chen, X.; Xu, J. Molecular dynamics simulation of interfacial mechanical properties of crumb rubber concrete. Constr. Build. Mater. 2024, 438, 137336. [Google Scholar] [CrossRef] [Scilit]
  14. Wriggers, P.; Moftah, S.O. Mesoscale models for concrete: Homogenisation and damage behavior. Finite Elem. Anal. Des. 2006, 42, 623–636. [Google Scholar] [CrossRef] [Scilit]
  15. Liu, H.K.; Ren, X.D.; Li, J. Indentation tests based multi-scale random media modeling of concrete. Constr. Build. Mater. 2018, 168, 209–220. [Google Scholar] [CrossRef] [Scilit]
  16. Zhou, F.P.; Lydon, F.D.; Barr, B.I.G. Effect of coarse aggregate on elastic modulus and compressive strength of high performance concrete. Cem. Concr. Res. 1995, 25, 177–186. [Google Scholar] [CrossRef] [Scilit]
  17. Aslani, F.; Nejadi, S. Mechanical properties of conventional and self-compacting concrete: An analytical study. Constr. Build. Mater. 2012, 36, 330–347. [Google Scholar] [CrossRef] [Scilit]
  18. GB/T 50010-2010; Standard for Design of Concrete Structures. Architecture and Building Press of China: Beijing, China, 2024.
  19. Ribeiro, P.O.; Carrazedo, R.; Oliveira, C.O.; Krahl, P.A. Orthotropic elastic properties for UHPFRC based on two-phase model homogenization. Constr. Build. Mater. 2024, 440, 137304. [Google Scholar] [CrossRef] [Scilit]
  20. Voigt, W. Über die beziehung zwischen den beiden elastizitätskonstanten isotroper körper. Wied Ann. 1889, 38, 573–587. [Google Scholar] [CrossRef] [Scilit]
  21. Reuss, A. Berechnung der fliessgrenze von mischkristallen auf grund der plastizitatsbedingung für einkristalle. Z. Angew. Math. Mech. 1929, 9, 49–58. [Google Scholar] [CrossRef] [Scilit]
  22. Hill, R. The elastic behaviour of a crystalline aggregate. Proc. Phys. Soc. Sect. A 1952, 65, 349. [Google Scholar] [CrossRef] [Scilit]
  23. Hashin, Z.; Shtrikman, S. A variational approach to the theory of the elastic behaviour of multiphase materials. J. Mech. Phys. Solids 1963, 11, 127–140. [Google Scholar] [CrossRef] [Scilit]
  24. Hill, R. A self-consistent mechanics of composite materials. J. Mech. Phys. Solids 1965, 13, 213–222. [Google Scholar] [CrossRef] [Scilit]
  25. Mori, T.; Tanaka, K. Average stress in matrix and average elastic energy of materials with misfitting inclusions. Acta Metall. 1973, 21, 571–574. [Google Scholar] [CrossRef] [Scilit]
  26. Christensen, R.M. A critical evaluation for a class of micro-mechanics models. J. Mech. Phys. Solids 1990, 38, 379–404. [Google Scholar] [CrossRef] [Scilit]
  27. Hassani, B.; Hinton, E. A review of homogenization and topology opimization I-homogenization theory for media with periodic structure. Comput. Struct. 1998, 69, 707–717. [Google Scholar] [CrossRef] [Scilit]
  28. Hassani, B.; Hinton, E. A review of homogenization and topology opimization II-analytical and numerical solution of homogenization equations. Comput. Struct. 1998, 69, 719–738. [Google Scholar] [CrossRef] [Scilit]
  29. Tang, X.W.; Zhang, C.H. Study on concrete in macro and meso scale mechanical properties based on homogenization theory. Chin. J. Comput. Mech. 2009, 26, 876–881. [Google Scholar]
  30. Yang, Z.; Zhan, X.; Zhu, H.; Zhang, B.; Lu, F.; Dong, Z. Mesoscopic investigation of the matrix pores and ITZ effects on the mechanical properties of seawater sea-sand coral aggregate concrete. J. Build. Eng. 2024, 90, 109375. [Google Scholar] [CrossRef] [Scilit]
  31. Qsymah, A.; Sharma, R.; Yang, Z.; Margetts, L.; Mummery, P. Micro X-ray computed tomography image-based two-scale homogenisation of ultra high performance fibre reinforced concrete. Constr. Build. Mater. 2017, 130, 230–240. [Google Scholar] [CrossRef] [Scilit]
  32. Alshahrani, A.; Kulasegaram, S.; Kundu, A. Elastic modulus of self-compacting fibre reinforced concrete: Experimental approach and multi-scale simulation. Case Stud. Constr. Mater. 2023, 18, e01723. [Google Scholar] [CrossRef] [Scilit]
  33. Wang, Z.M.; Huang, Y.J.; Yang, Z.J.; Liu, G.H.; Wang, F. Efficient meso-scale homogenisation and statistical size effect analysis of concrete modelled by scaled boundary finite element polygons. Constr. Build. Mater. 2017, 151, 449–463. [Google Scholar] [CrossRef] [Scilit]
  34. Li, X.; Xu, Y.; Chen, S. Computational homogenization of effective permeability in three-phase mesoscale concrete. Constr. Build. Mater. 2016, 121, 100–111. [Google Scholar] [CrossRef] [Scilit]
  35. Sebsadji, S.K.; Chouicha, K. Determining periodic representative volumes of concrete mixtures based on the fractal analysis. Int. J. Solids Struct. 2012, 49, 2941–2950. [Google Scholar] [CrossRef] [Scilit]
  36. Duarte, A.P.C.; Silva, B.A.; Silvestre, N.; de Brito, J.; Júlio, E. Mechanical characterization of rubberized concrete using an image-processing/XFEM coupled procedure. Compos. Part B Eng. 2015, 78, 214–226. [Google Scholar] [CrossRef] [Scilit]
  37. Chen, H.; Li, D.; Ma, X.; Zhong, Z.; Abd-Elaal, E.-S. Mesoscale Analysis of Rubber Particle Effect on Indirect Tensile and Flexural Tensile Strength of Crumb Rubber Mortar. J. Compos. Sci. 2023, 7, 16. [Google Scholar] [CrossRef] [Scilit]
  38. Liu, C.; Li, H.; Min, K.; Li, W.; Wu, K. Numerical Simulation of Rubber Concrete Considering Fatigue Damage Accumulation of Cohesive Zone Model. Materials 2024, 17, 5018. [Google Scholar] [CrossRef] [Scilit]
  39. Wang, Z.M.; Kwan, A.K.H.; Chan, H.C. Mesoscopic study of concrete I: Generation of random aggregate structure and finite element mesh. Comput. Struct. 1999, 70, 533–544. [Google Scholar] [CrossRef] [Scilit]
  40. Wang, Z.M.; Kwan, A.K.H.; Chan, H.C. Mesoscopic study of concrete II: Nonlinear finite element analysis. Comput. Struct. 1999, 70, 545–556. [Google Scholar] [CrossRef] [Scilit]
  41. Garboczi, E.J.; Day, A.R. An algorithm for computing the effective linear elastic properties of heterogeneous materials: Three-dimensional results for composites with equal phase poisson ratios. J. Mech. Phys. Solids 1995, 43, 1349–1362. [Google Scholar] [CrossRef] [Scilit]
  42. Walraven, J.C.; Reinhardt, H.W. Theory and experiments on the mechanical behaviour of cracks in plain and reinforced concrete subjected to shear loading. Heron 1981, 26, 1–68. [Google Scholar]
  43. Huang, Y.J.; Hai, L.; Li, Q.H.; Zhang, H.; Cheng, Z.; Xu, W.Z.; Xu, S.L. Stochastic analysis of dynamic fracture of concrete using CT-image based mesoscale models with a rate-dependent phase field method. Int. J. Impact Eng. 2025, 197, 105188. [Google Scholar] [CrossRef] [Scilit]
  44. Han, Q.H.; Wang, Y.H.; Xu, J.; Xing, Y. Static behavior of stud shear connectors in elastic concrete–steel composite beams. J. Constr. Steel Res. 2015, 113, 115–126. [Google Scholar] [CrossRef] [Scilit]
  45. Bažant, Z. Size effect on structural strength: A review. Arch. Appl. Mech. 1999, 69, 703–725. [Google Scholar] [CrossRef] [Scilit]
  46. Bolina, F.L.; Fachinelli, E.G.; Rodrigues, J.P.C. Analysis of building structures subjected to electric vehicle fires. J. Build. Eng. 2025, 107, 112769. [Google Scholar] [CrossRef] [Scilit]
Figure 1. Recycling process of waste tires (from: www.eldan-recycling.com).
Applsci 16 02936 g001
Figure 2. Schematic diagram of generating a two-dimensional dodecahedron random aggregate.
Applsci 16 02936 g002
Figure 3. Two-dimensional mesoscale models of CRC with different rubber contents: (a) 0%; (b) 5%; (c) 10%; (d) 15%.
Applsci 16 02936 g003
Figure 4. Flow chart of the homogenization method for CRC.
Applsci 16 02936 g004
Figure 5. Mesoscale finite element model with rubber content of 0% for different mesh sizes: (a) 0.25 mm; (b) 0.5 mm; (c) 1 mm; (d) 2 mm.
Applsci 16 02936 g005
Figure 6. Mesoscale homogenization calculation results of elastic modulus E of RVE with different rubber contents (left: mean value; right: standard deviation): (a) 0%; (b) 5%; (c) 10%; (d) 15%.
Applsci 16 02936 g006aApplsci 16 02936 g006b
Figure 7. Probability density distribution (left) and cumulative probability distribution (right) of rubber content 0% model with different side lengths for homogenization of elastic modulus: (a) 50 mm; (b) 75 mm; (c) 100 mm; (d) 125 mm; (e) 150 mm.
Applsci 16 02936 g007aApplsci 16 02936 g007b
Figure 8. Probability density distribution results and local magnification of elastic modulus of mesoscale RVE homogenization with different rubber contents: (a) 0%; (b) 5%; (c) 10%; (d) 15%.
Applsci 16 02936 g008
Figure 9. Mean and SD of homogenized elastic parameters calculated by RVE model: (a) elastic modulus E11; (b) elastic modulus E22; (c) shear modulus G12; (d) Poisson’s ratio μ12.
Applsci 16 02936 g009
Figure 10. Coefficients of variation in homogenized elastic parameters calculated by the RVE model: (a) elastic modulus E11; (b) elastic modulus E22; (c) shear modulus G12; (d) Poisson’s ratio μ12.
Applsci 16 02936 g010
Figure 11. Relationship between equivalent elastic modulus E (ln E) and RVE model size L (ln L) of different rubber content models: (a) E-L relationship; (b) ln E-ln L relationship.
Applsci 16 02936 g011
Figure 12. Fitting relationship between (a) slope k, (b) intercept b and rubber content (r).
Applsci 16 02936 g012
Figure 13. Equivalent elastic modulus E value of different sizes and different rubber content models.
Applsci 16 02936 g013
Table 1. CRC three-dimensional aggregate grading.
Rubber ContentProportion of Rubber
(1–3 mm)
Proportion of Coarse Aggregate (5–25 mm)Proportion of Pore
(1–3 mm)
25–20 mm20–15 mm15–10 mm10–5 mm
0%0.0000.0750.0850.1000.1300.010
5%0.0500.0690.0780.0920.1210.010
10%0.1000.0840.0950.1130.1480.010
15%0.1500.0840.0950.1130.1480.010
Table 2. CRC two-dimensional aggregate grading.
Rubber ContentProportion of Rubber
(1–3 mm)
Proportion of Coarse Aggregate (5–25 mm)Proportion of Pore
(1–3 mm)
25–20 mm20–15 mm15–10 mm10–5 mm
0%0.0000.05000.07750.10260.13830.010
5%0.0500.04610.07160.09470.12780.010
10%0.1000.05630.08740.11570.15600.010
15%0.1500.05630.08740.11570.15600.010
Table 3. Homogenization calculation results of models with different mesh sizes.
Mesh Size0.25 mm0.5 mm1 mm2 mm
E11 (MPa)33,734.1561633,760.7489833,828.7512333,854.59218
E22 (MPa)34,141.6419634,171.5211834,249.0574234,288.53498
E (MPa)33,937.8990633,966.1350834,038.9043234,071.56358
G12 (MPa)13,807.1391313,821.1781813,853.4163613,858.47128
μ120.2118786230.2117520260.2112958040.210743487
Relative error (%)-0.0831990700.2976178960.393850299
Number of elements186,00947,05812,0523769
Table 4. Calculation results of the elastic anisotropy ratio A of the mesoscale model.
Rubber ContentStatistical ValueL = 50 mmL = 75 mmL = 100 mmL = 125 mmL = 150 mm
0%Mean0.98520.99120.99380.99500.9954
SD0.01340.00940.00730.00660.0048
CoV1.359%0.951%0.739%0.667%0.479%
5%Mean0.97690.98830.99340.99300.9964
SD0.02910.01750.01430.01130.0099
CoV2.975%1.773%1.436%1.140%0.998%
10%Mean0.95310.97250.97530.98620.9869
SD0.04610.02880.02160.01620.0155
CoV4.832%2.959%2.217%1.647%1.575%
15%Mean0.92020.95520.96850.97610.9847
SD0.06720.03890.03300.02630.0215
CoV7.308%4.074%3.405%2.694%2.188%
Table 5. Statistical results of RVE homogenization elastic parameters at a mesoscale level.
ParameterModel SizeRubber Content 0%Rubber Content 5%Rubber Content 10%Rubber Content 15%
E
(GPa)
50 mm33.9808 ± 0.117228.0222 ± 0.226525.0139 ± 0.384720.3342 ± 0.4322
75 mm33.9390 ± 0.089727.9234 ± 0.153524.8647 ± 0.215820.1478 ± 0.2937
100 mm33.9102 ± 0.067427.8994 ± 0.118324.8250 ± 0.177620.0662 ± 0.2188
125 mm33.8956 ± 0.054727.8878 ± 0.082024.7590 ± 0.132820.0295 ± 0.1495
150 mm33.8875 ± 0.039627.8643 ± 0.076224.7528 ± 0.108919.9744 ± 0.1472
G
(GPa)
50 mm13.8207 ± 0.072711.1413 ± 0.13979.5016 ± 0.22017.3418 ± 0.2181
75 mm13.8501 ± 0.055911.1838 ± 0.09209.6104 ± 0.12867.4743 ± 0.1629
100 mm13.8699 ± 0.043011.1953 ± 0.06689.6234 ± 0.09997.5333 ± 0.1162
125 mm13.8803 ± 0.036311.2108 ± 0.05429.6784 ± 0.07227.5870 ± 0.0855
150 mm13.8872 ± 0.024311.2255 ± 0.04689.6888 ± 0.06467.6222 ± 0.0762
μ50 mm0.2127 ± 0.00280.2332 ± 0.00570.2542 ± 0.01110.2828 ± 0.0115
75 mm0.2135 ± 0.00230.2353 ± 0.00430.2585 ± 0.00580.2872 ± 0.0093
100 mm0.2142 ± 0.00180.2355 ± 0.00310.2593 ± 0.00500.2898 ± 0.0064
125 mm0.2146 ± 0.00130.2363 ± 0.00230.2611 ± 0.00360.2921 ± 0.0049
150 mm0.2149 ± 0.00100.2368 ± 0.00210.2615 ± 0.00300.2935 ± 0.0043
Table 6. Coefficients of variation in homogenized elastic parameters calculated by the RVE model.
Homogenization Elastic ParametersRubber ContentSide Length of Model
50 mm75 mm100 mm125 mm150 mm
CoV of E11 (%)0%0.68980.50080.37970.32980.2624
5%1.44160.91390.67120.56390.4738
10%2.25301.43511.11220.81570.7515
15%3.49761.74531.52781.22030.9981
CoV of E22 (%)0%0.68790.55490.41660.30490.2466
5%1.26661.07540.76160.53540.4695
10%2.59841.34881.16590.85240.7038
15%2.85362.11481.52951.24700.9778
CoV of G12 (%)0%0.52590.40390.30990.26120.1753
5%1.25420.82290.59650.48310.4172
10%2.31641.33831.03840.74610.6667
15%2.97062.17891.54221.12660.9996
CoV of μ12 (%)0%1.33351.07590.84060.61540.4517
5%2.43801.82991.32740.95380.8799
10%4.35292.24041.91091.37681.1376
15%4.06563.24552.22201.68441.4790
Table 7. Statistics of calculation results of equivalent elastic modulus E (GPa).
Rubber ContentL = 50 mmL = 75 mmL = 100 mmL = 125 mmL = 150 mm
0%33.980833.939033.910233.895633.8875
5%28.022227.923427.899427.887827.8643
10%25.013924.864724.825024.759024.7528
15%20.334220.147820.066220.029519.9744
Disclaimer/Publisher’s Note: The statements, opinions and data contained in all publications are solely those of the individual author(s) and contributor(s) and not of MDPI and/or the editor(s). MDPI and/or the editor(s) disclaim responsibility for any injury to people or property resulting from any ideas, methods, instructions or products referred to in the content.