Article

Design and Optimization of Improved Double Stator Cylindrical Linear Oscillating Generator with Curved Tooth Structure

School of Intelligence Science and Technology, Beijing University of Civil Engineering and Architecture, Beijing 100044, China
*
Author to whom correspondence should be addressed.
Appl. Sci. 2026, 16(6), 2786; https://doi.org/10.3390/app16062786
Submission received: 26 January 2026 / Revised: 12 March 2026 / Accepted: 12 March 2026 / Published: 13 March 2026
(This article belongs to the Section Electrical, Electronics and Communications Engineering)

Abstract

Double stator cylindrical linear oscillating generators (DSCLOGs) have been widely used in renewable energy power generation systems due to their higher power density, higher reliability, and low-noise characteristics. However, the detent force of a DSCLOG is an inevitable problem, which causes oscillations in the generator and leads to system instability. Conventionally, auxiliary teeth and skewed pole methods are employed to mitigate detent force, but these approaches often increase the overall machine size and the complexity of the manufacturing process. To solve this issue, an improved DSCLOG with curved teeth (CT-DSCLOG) is proposed to minimize the detent force. First, the structural characteristics and working principle of CT-DSCLOG are introduced. Then, to achieve a rapid and accurate analysis of the magnetic field in the irregular air gap, a 2D magnetic equivalent circuit (MEC) model is established by introducing Schwarz–Christoffel (S-C) mapping. And key structural parameters are identified through variance sensitivity analysis. Subsequently, a multi-objective optimization of the linear generator is performed using the Taguchi method combined with 3D finite element analysis (3D-FEA) to obtain the optimal structural parameters of CT-DSCLOG. Finally, the proposed structure is validated through prototype experiments. The results are provided to validate the effectiveness of the proposed structure.

1. Introduction

In recent years, linear oscillating generators have gained widespread adoption in Stirling power systems due to simple structure, high dynamic performance, and compact size compared with traditional rotary generators. However, the detent force is a critical factor affecting the safe operation of linear machines, and it has received much attention in the field of linear machines optimization research [1,2,3,4]. To solve this problem, a large number of studies have been conducted, mainly focusing on optimization and improvements in material properties, topological structures, and stacking methods.
Soft magnetic composite material (SMC) has attracted extensive research and application in linear machine fields in recent years, because of their high magnetic permeability, low coercivity, and low losses under high-frequency working conditions [5,6,7,8]. In [9], an improved permanent magnet (PM) rotary generator structure was proposed. A hybrid soft magnetic material for the core is used to replace the traditional silicon steel sheets. Through an experimental test, torque ripple was reduced and torque density was enhanced. In [10], an SMC and Si-Steel (SMC-Si) hybrid material core disk transverse flux permanent magnet brushless motor (DTFM) was introduced. Experimental tests confirmed that this design can effectively reduce the cogging torque. In [11], an improved iron–cobalt–vanadium soft magnetic material for the stator core of a PM rotary generator was proposed. The electromagnetic performance was enhanced through the optimization of torque density and generator efficiency. But the inherent brittleness and low mechanical strength of SMC affected mechanical robustness. Moreover, under low-speed working conditions, the nonlinear magnetization characteristics of the soft magnetic materials may induce localized magnetic saturation, thereby reducing the effective magnetic permeability of the core, leading to an increase in copper losses, and deteriorated overall efficiency.
To address the aforementioned issues, different stacking methods for silicon steel sheets are explored such as circumferential laminations, segmented circumferential laminations, and hybrid lamination techniques [12,13,14]. In [15], a cylindrical linear oscillating generator with circumferential laminations was designed, incorporating auxiliary teeth in the inner stator structure. Experimental results demonstrated that the detent force of the generator was effectively reduced. In [16], a segmented circumferential laminated cylindrical linear oscillation generator was proposed, which employs the magnetic field reconstruction method to achieve high-precision modeling, rapid analysis of magnetic flux distribution and end effect in the segmented laminated structure. This structure effectively suppresses detent force. In [17], an improved hybrid laminated PM linear oscillating generator was introduced. The electromagnetic performance is investigated by combining magnetic network analysis and finite element calculations. Prototype testing verifies the superiority of the proposed hybrid laminated approach. In [18], a cylindrical linear oscillating generator combining novel stacking methods was proposed. A 3D FEA model was employed to calculate the magnetic flux density, and the stacking coefficient is also optimized. The experiment confirmed that the optimized generator not only reduced the detent force but also enhanced the thrust force. Most of the above research focuses on three-phase generators. The detent force can be minimized by phase displacement, which is difficult to achieve for single-phase generators [19,20]. Therefore, the issue of minimized detent force in single-phase generators remains a critical concern.
The detent force is closely associated with the magnetic field distribution. Accurately optimizing the magnetic field is crucial to reduce the detent force of linear machines [21,22]. Currently, the primary methods for magnetic field optimization design include intelligent algorithms [23,24,25], the finite element method (FEM) [26,27,28], the subdomain (SD) method [29,30,31], and magnetic equivalent circuit (MEC) [32,33]. Intelligent algorithms require a large amount of experimental data to train the models, which imposes higher demands on computational efficiency. FEM is the most precise analysis tool, as it accounts for material saturation and almost no simplification of the actual geometry. But it is unable to explicitly reveal the mathematical relationships between design variables and optimization objectives, which limits its effectiveness in analytical design and optimization. The analytical model based on the SD method can provide a more accurate prediction of the magnetic field distribution. However, when applied to the irregular geometries of linear machines, it requires dividing the domain into multiple subregions and introducing corresponding boundary conditions, thereby increasing computational cost and complexity.
The MEC method is valued for its computational efficiency and its ability to account for magnetic saturation and complex flux paths, making it well-suited for the initial design and optimization stages of linear machines.
Based on the analysis of existing research, developing a method to accurately and quickly analyze the electromagnetic characteristics of irregular air gaps in single-phase linear machines, while reducing detent force through structural optimization, remains an urgent problem. The main contributions of this article are as follows.
(1)
While auxiliary teeth and skewed pole techniques are conventionally employed to minimum detent force fluctuations, these methods inevitably increase both the overall machine volume and the complexity of the manufacturing process. To address these limitations, an improved DSCLOG with curved teeth (CT-DSCLOG) is proposed. By designing the shape of stator teeth, the magnetic field distortion caused by the end effect can be improved. Meanwhile, through a special arrangement of S/N/N/S permanent magnets, a magnetic concentration effect was achieved, which increased the magnetic flux density in the air gap. As a result, the electromagnetic performance of the designed linear generator was enhanced.
(2)
Schwarz–Christoffel (S-C) complex function mapping has been introduced into the 2D MEC modeling. By mapping the complex curved shape gap area into a regular rectangular area, it solves the problem of difficult calculation of the irregular air gap magnetic reluctance.
(3)
An integrated optimization approach is developed by combining variance-based sensitivity analysis with the Taguchi method. To simplify the optimization process and reduce the number of variables, structural parameters with the most significant impact on magnetic field are first screened using sensitivity analysis. These selected variables then serve as the input for the Taguchi optimization process. By combining this process with 3D FEA, the optimal structural parameters of the linear generator are systematically determined.
The paper is organized as follows: Section 2 introduces the structure and working principle of CT-DSCLOG. Section 3 provides a detailed explanation of the research methods and procedures used in this paper. Based on the structure of proposed machine, a 2D equivalent magnetic circuit model is established to analyze the distribution of the magnetic flux density of CT-DSCLOG in Section 4. In Section 5, five variables with a significant impact on the generator’s magnetic flux density are selected based on a variance sensitivity analysis. On this basis, a 3D FEA model of the CT-DSCLOG is established to account for end effects. The Taguchi method is then employed in conjunction with FEA to determine the optimal structural parameters. Section 6 validates the effectiveness of the proposed structure through FEA and prototype experiments, while Section 7 provides the concluding remarks.

2. Topology and Working Principle

2.1. Topology of CT-DSCLOG

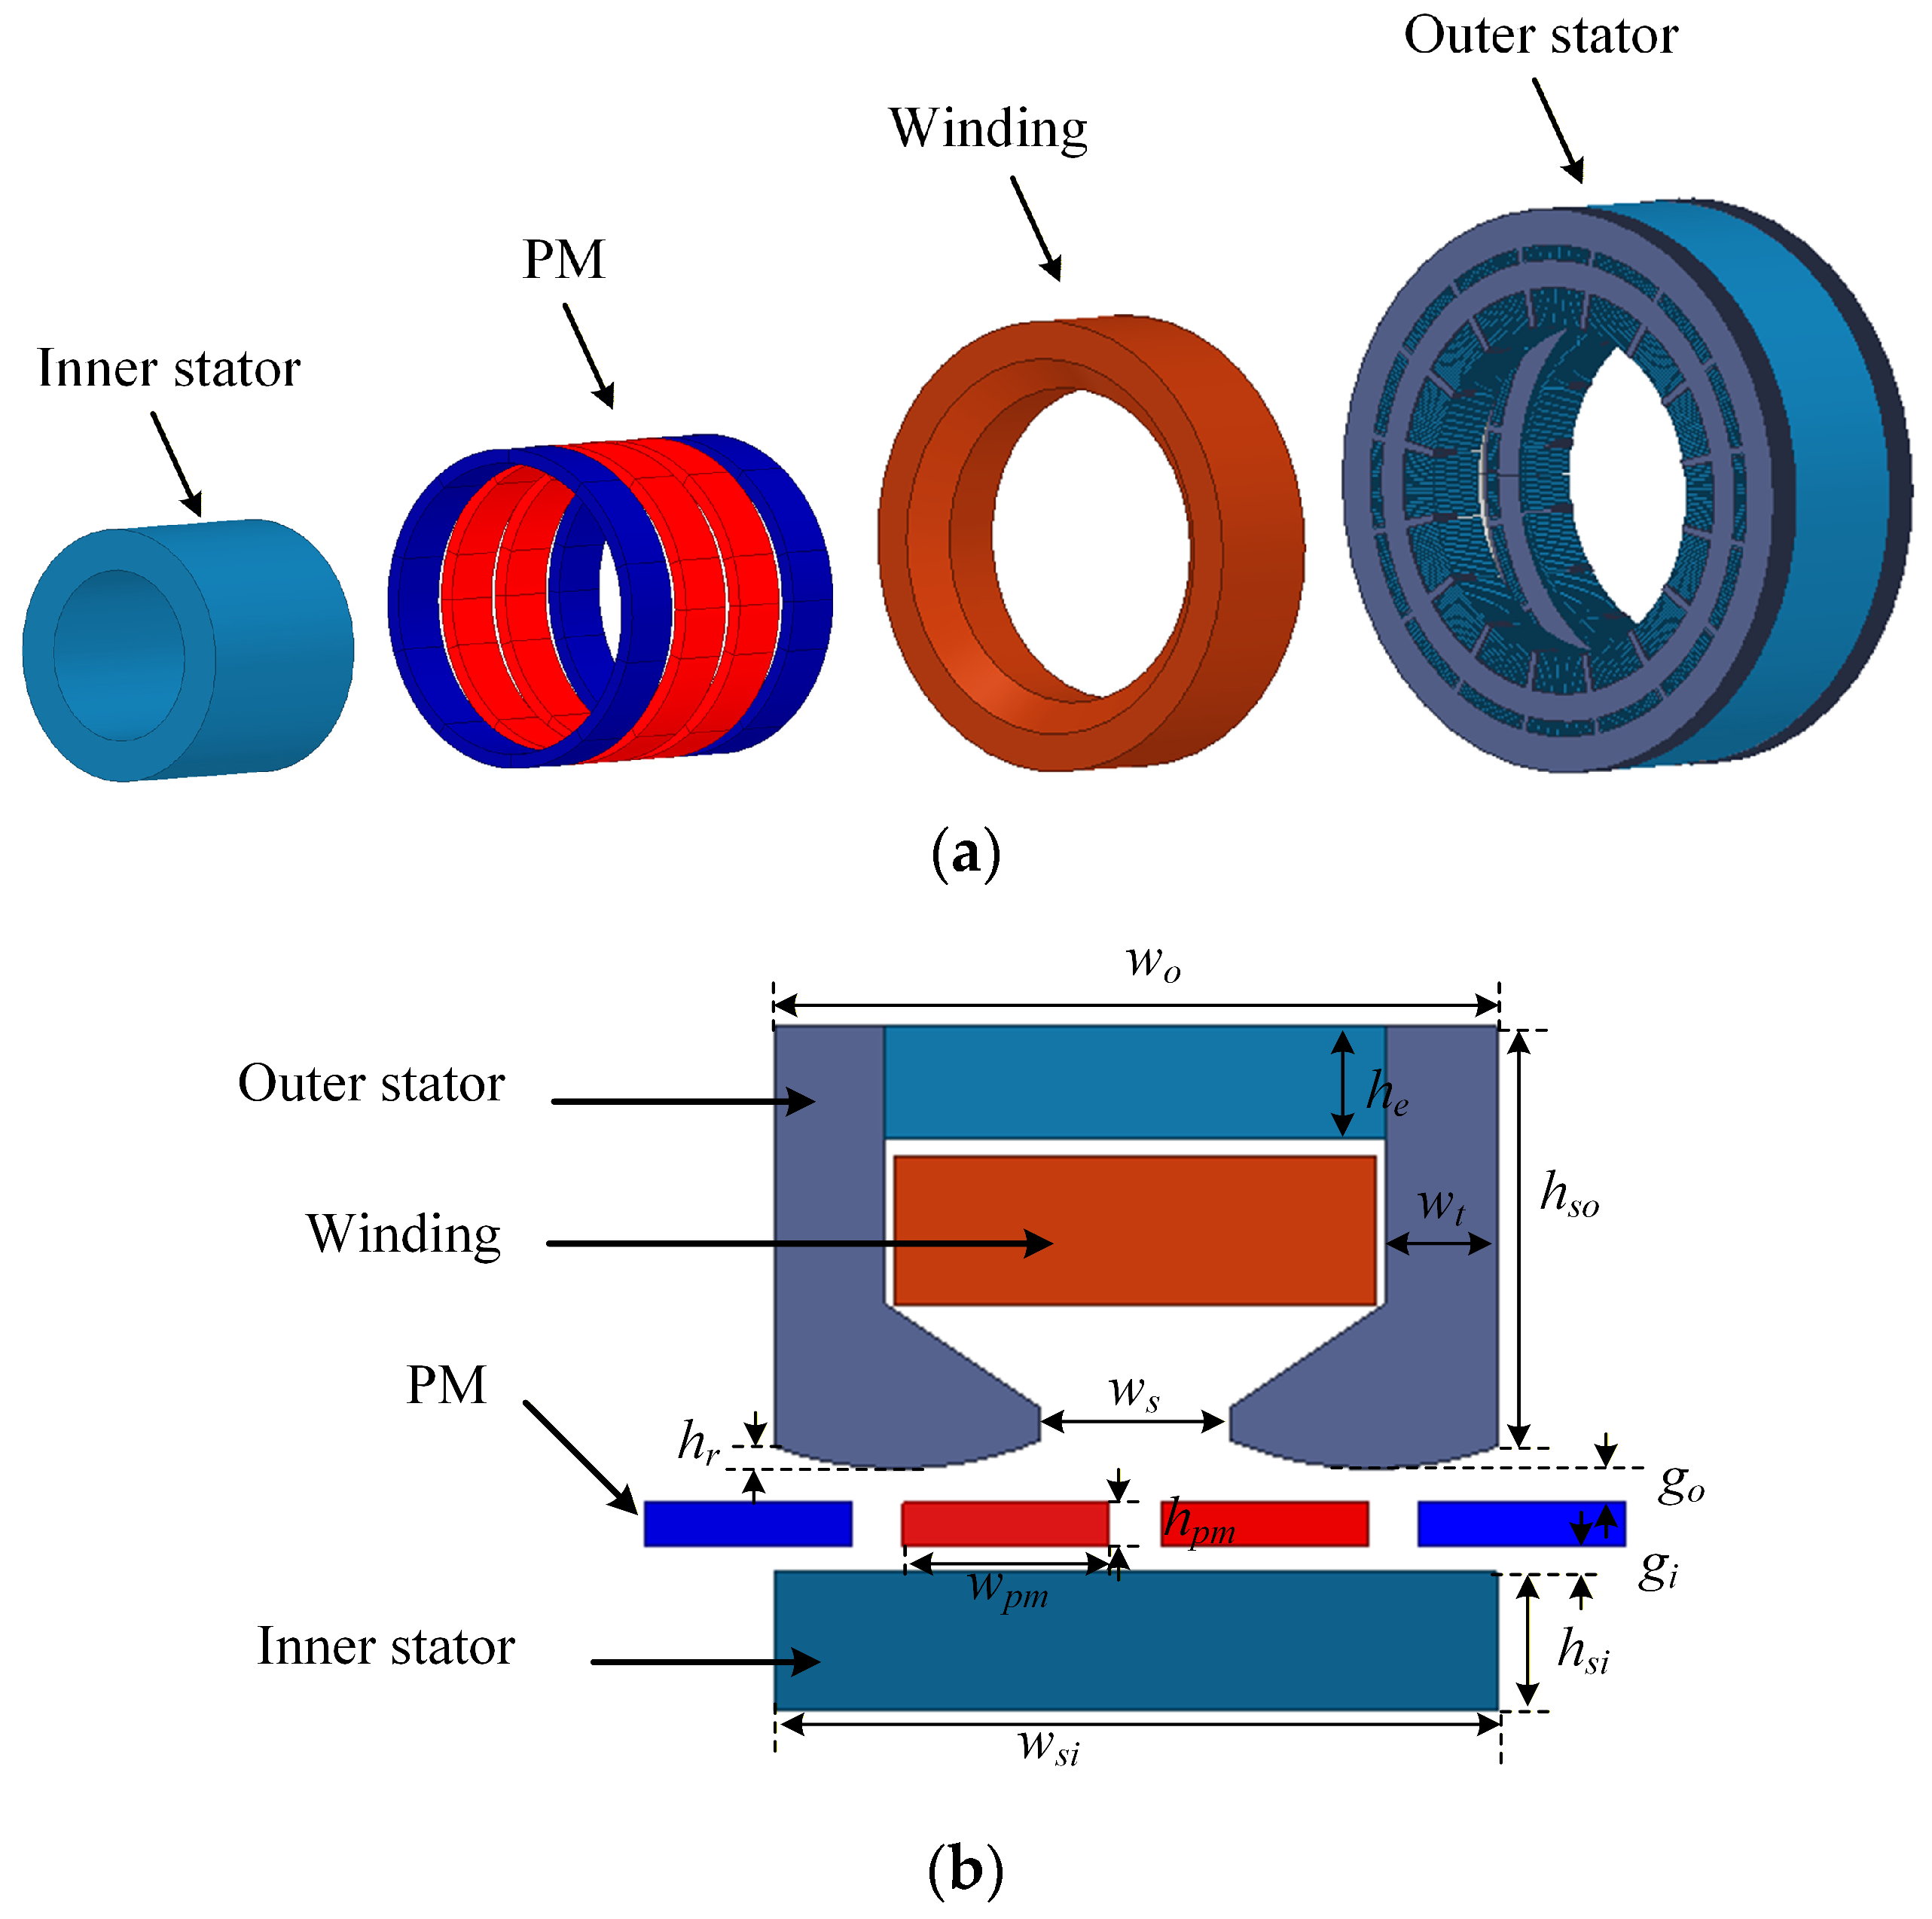
Figure 1a illustrates the 3D topological structure of CT-DSCLOG, while the corresponding cross-sectional diagram is shown in Figure 1b. The CT-DSCLOG primarily consists of four components: the inner stator, PM, windings, and outer stator. The outer stator employs a C-shaped core with curved tooth structures, within which the concentrated windings are embedded. The PM acts as the mover assembled on a support frame between the inner and outer stators. Considering the loss effect, the outer stator of the proposed linear machine adopts a combination of circumferential segmented lamination and axial lamination, while the inner stator is constructed using circumferential lamination. Table 1 shows the structure parameters of the CT-DSCLOG.

2.2. Working Principle

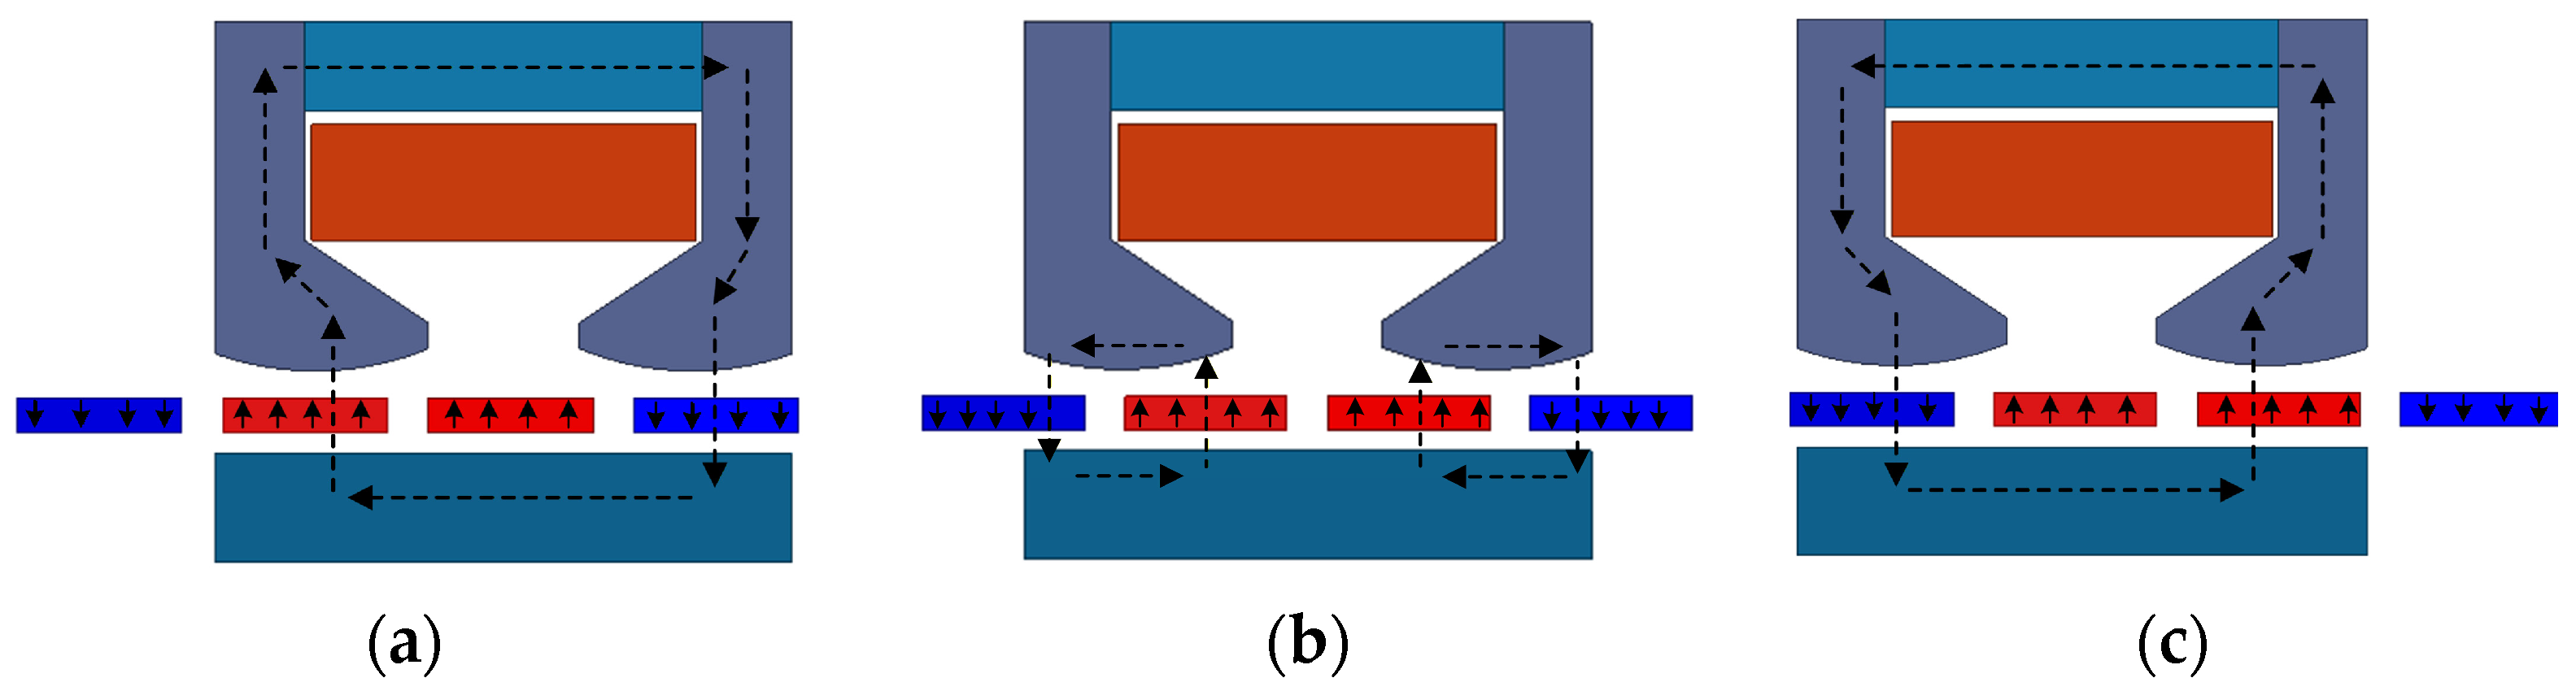
To explain the proposed machine working principle, the distribution of the main magnetic flux path is demonstrated in Figure 2. The magnetic flux distribution of the machine at the initial position is illustrated in Figure 2a. The magnetic flux path is oriented in the clockwise direction. As shown in Figure 2b, when the mover is located at the middle position, the magnetic flux is mainly concentrated in the pole shoe region, and the flux linkage through the coil is zero. The magnetic flux distribution of the machine at the end position is demonstrated in Figure 2c. The magnetic flux path is oriented in the counterclockwise direction. As the mover of the CT-DSCLOG undergoes reciprocating oscillatory motion, the flux linkage of the coil varies with the mover position, thereby inducing an electromotive force during winding.

3. Proposed Method

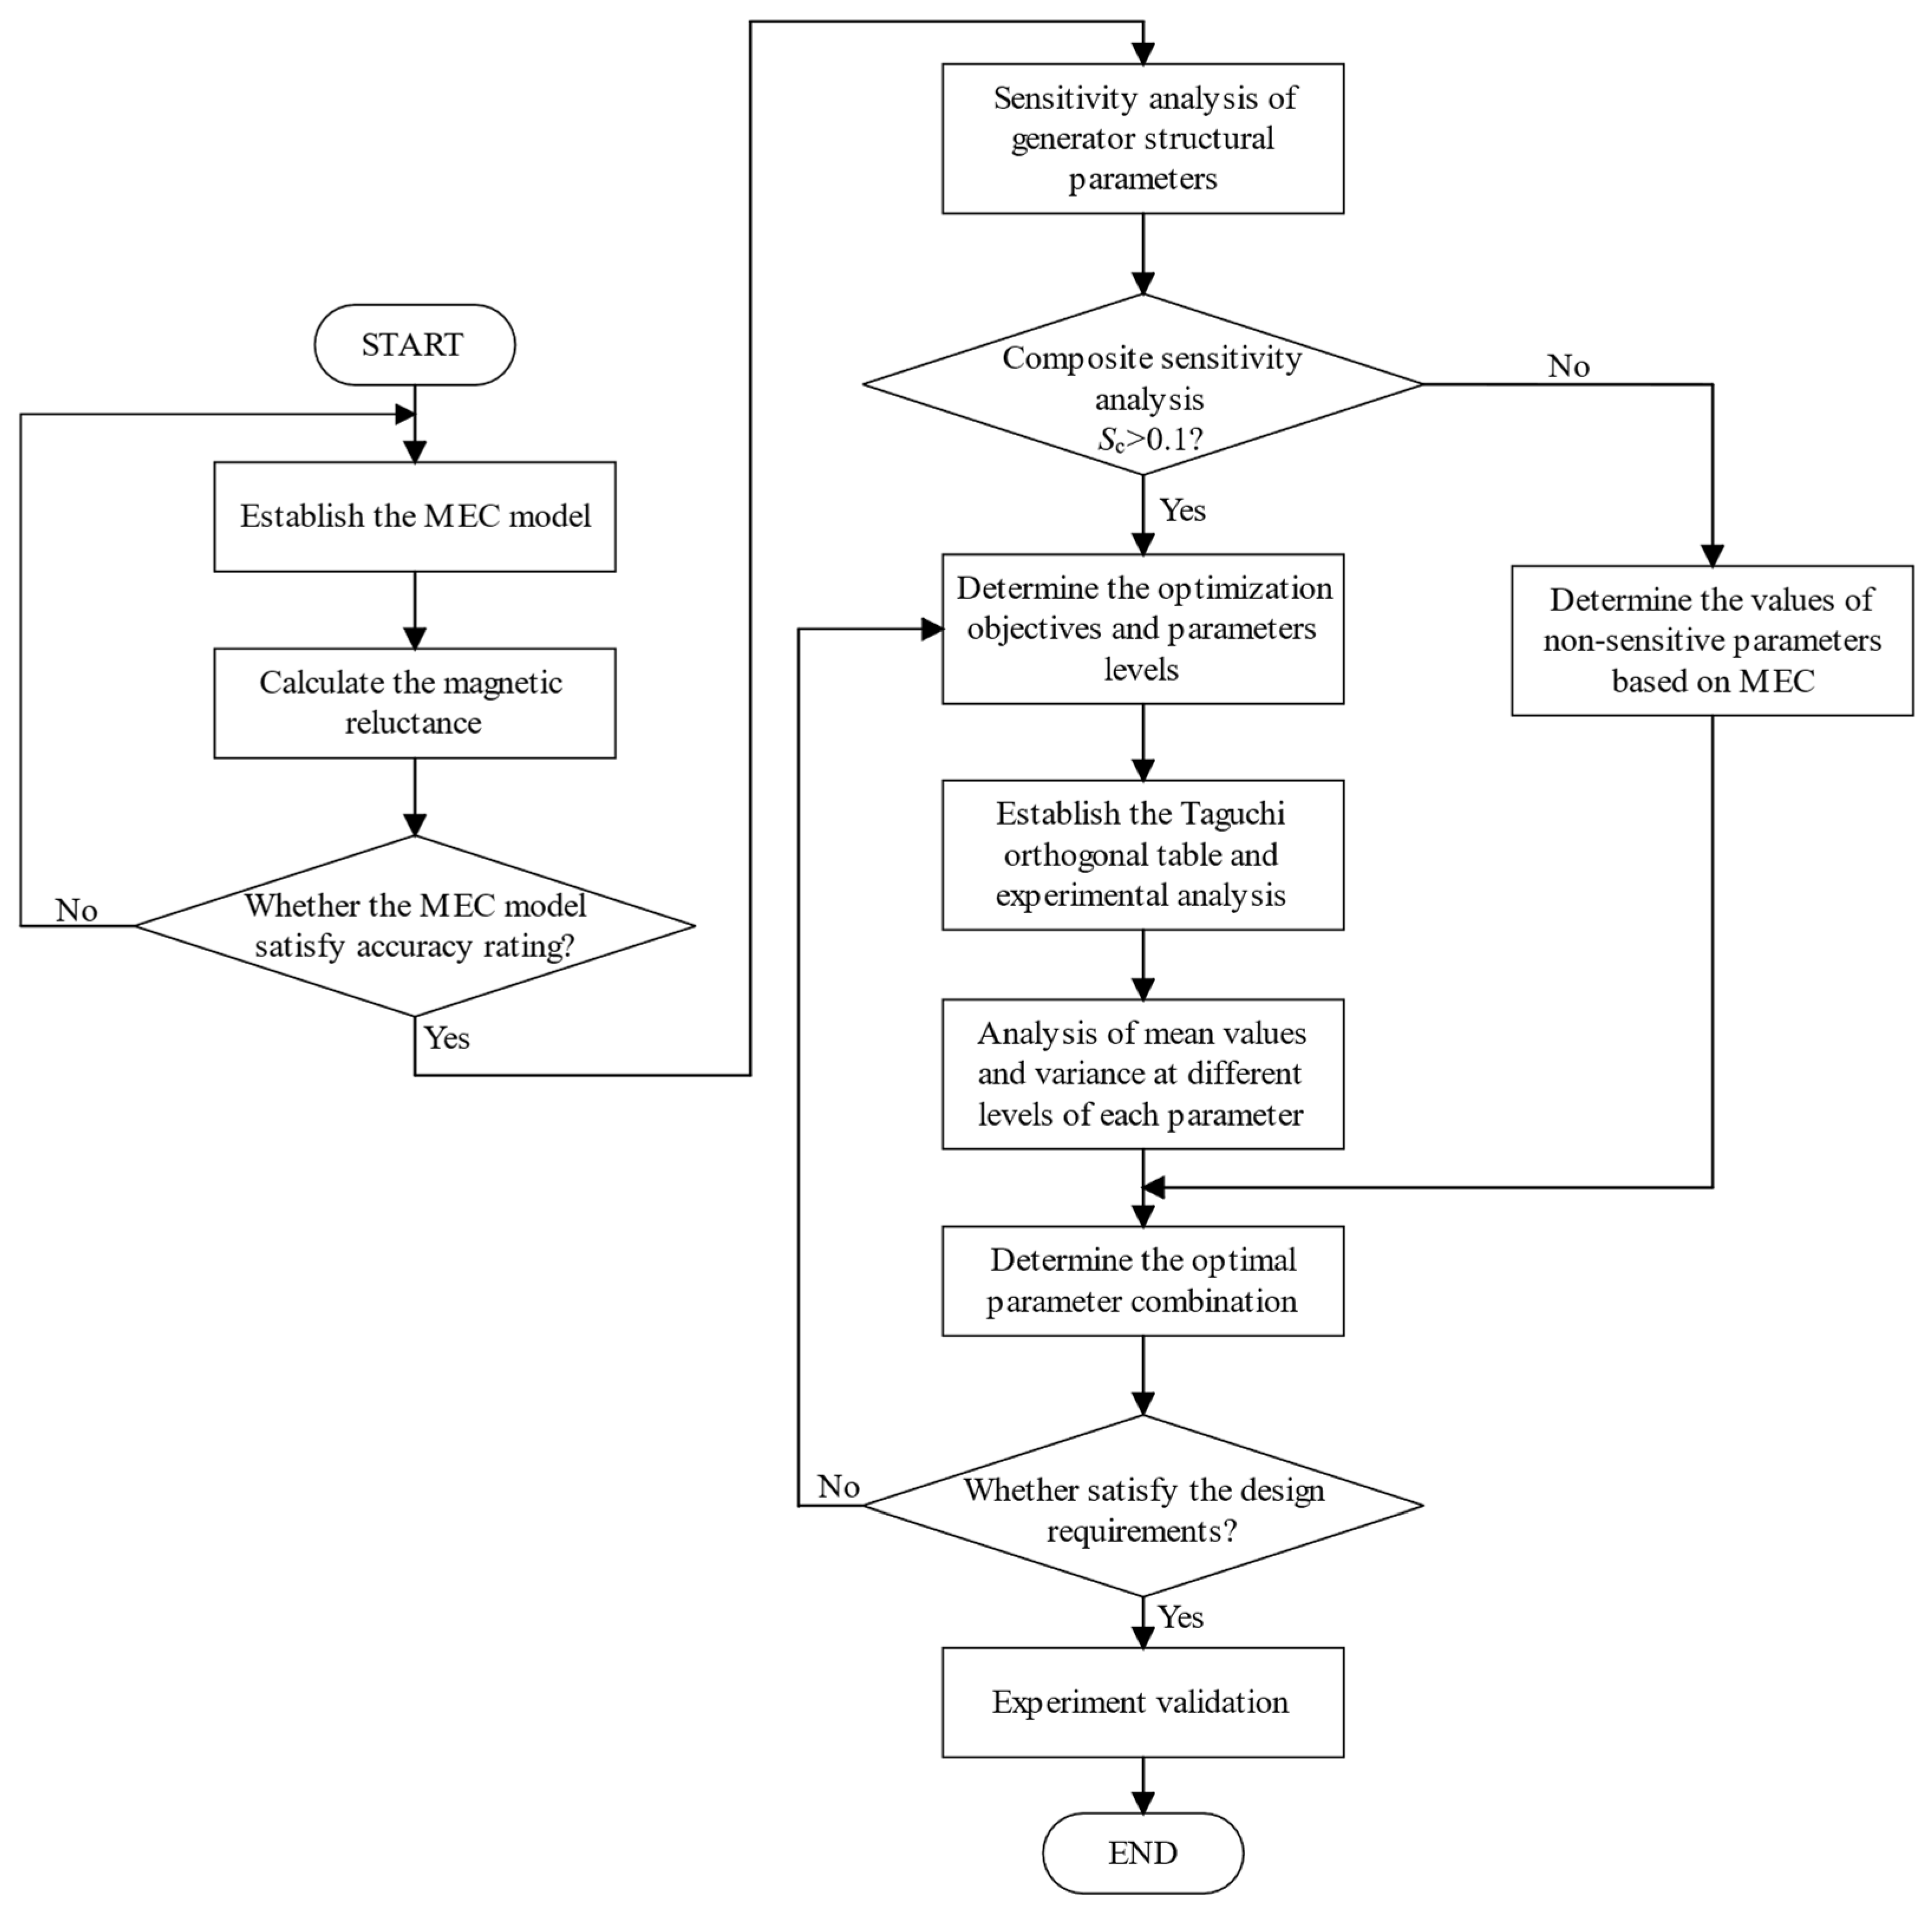
The flowchart of the proposed method is provided in Figure 3 to give a clear overview. The proposed method is divided into three stages: the analytical numerical analysis stage, the generator parameters optimization stage, and the experimental validation stage. Once the stage is determined, the corresponding method for that stage will be selected. The proposed method can be broadly categorized into five main steps, outlined as follows.
(1)
Magnetic circuit analysis: By establishing the MEC model, the main magnetic circuit distribution of the generator is analyzed. For irregular air gap, the S-C mapping is employed to accurately analyze the magnetic flux density of the air gap.
(2)
Validation of the MEC method: To verify the accuracy of the MEC model, the calculation results are compared between MEC model and FEA without considering the end effects.
(3)
Selection of optimized structure parameters: Through sensitivity analysis, the influence of structure parameters on the magnetic flux density of the generator was analyzed, thereby enabling the determination of the key optimization variables.
(4)
Taguchi Multi-objective Optimization: The sample data was obtained through Taguchi orthogonal experiments, mean values and variance analyses of different parameter levels were calculated to determine the optimal parameter combination that satisfy the optimization objectives.
(5)
Experiment validation: Finally, to verify the effectiveness of the design, the experimental data of the prototype generator were measured for comparison and verification.

4. Equivalent Magnetic Circuit Analysis

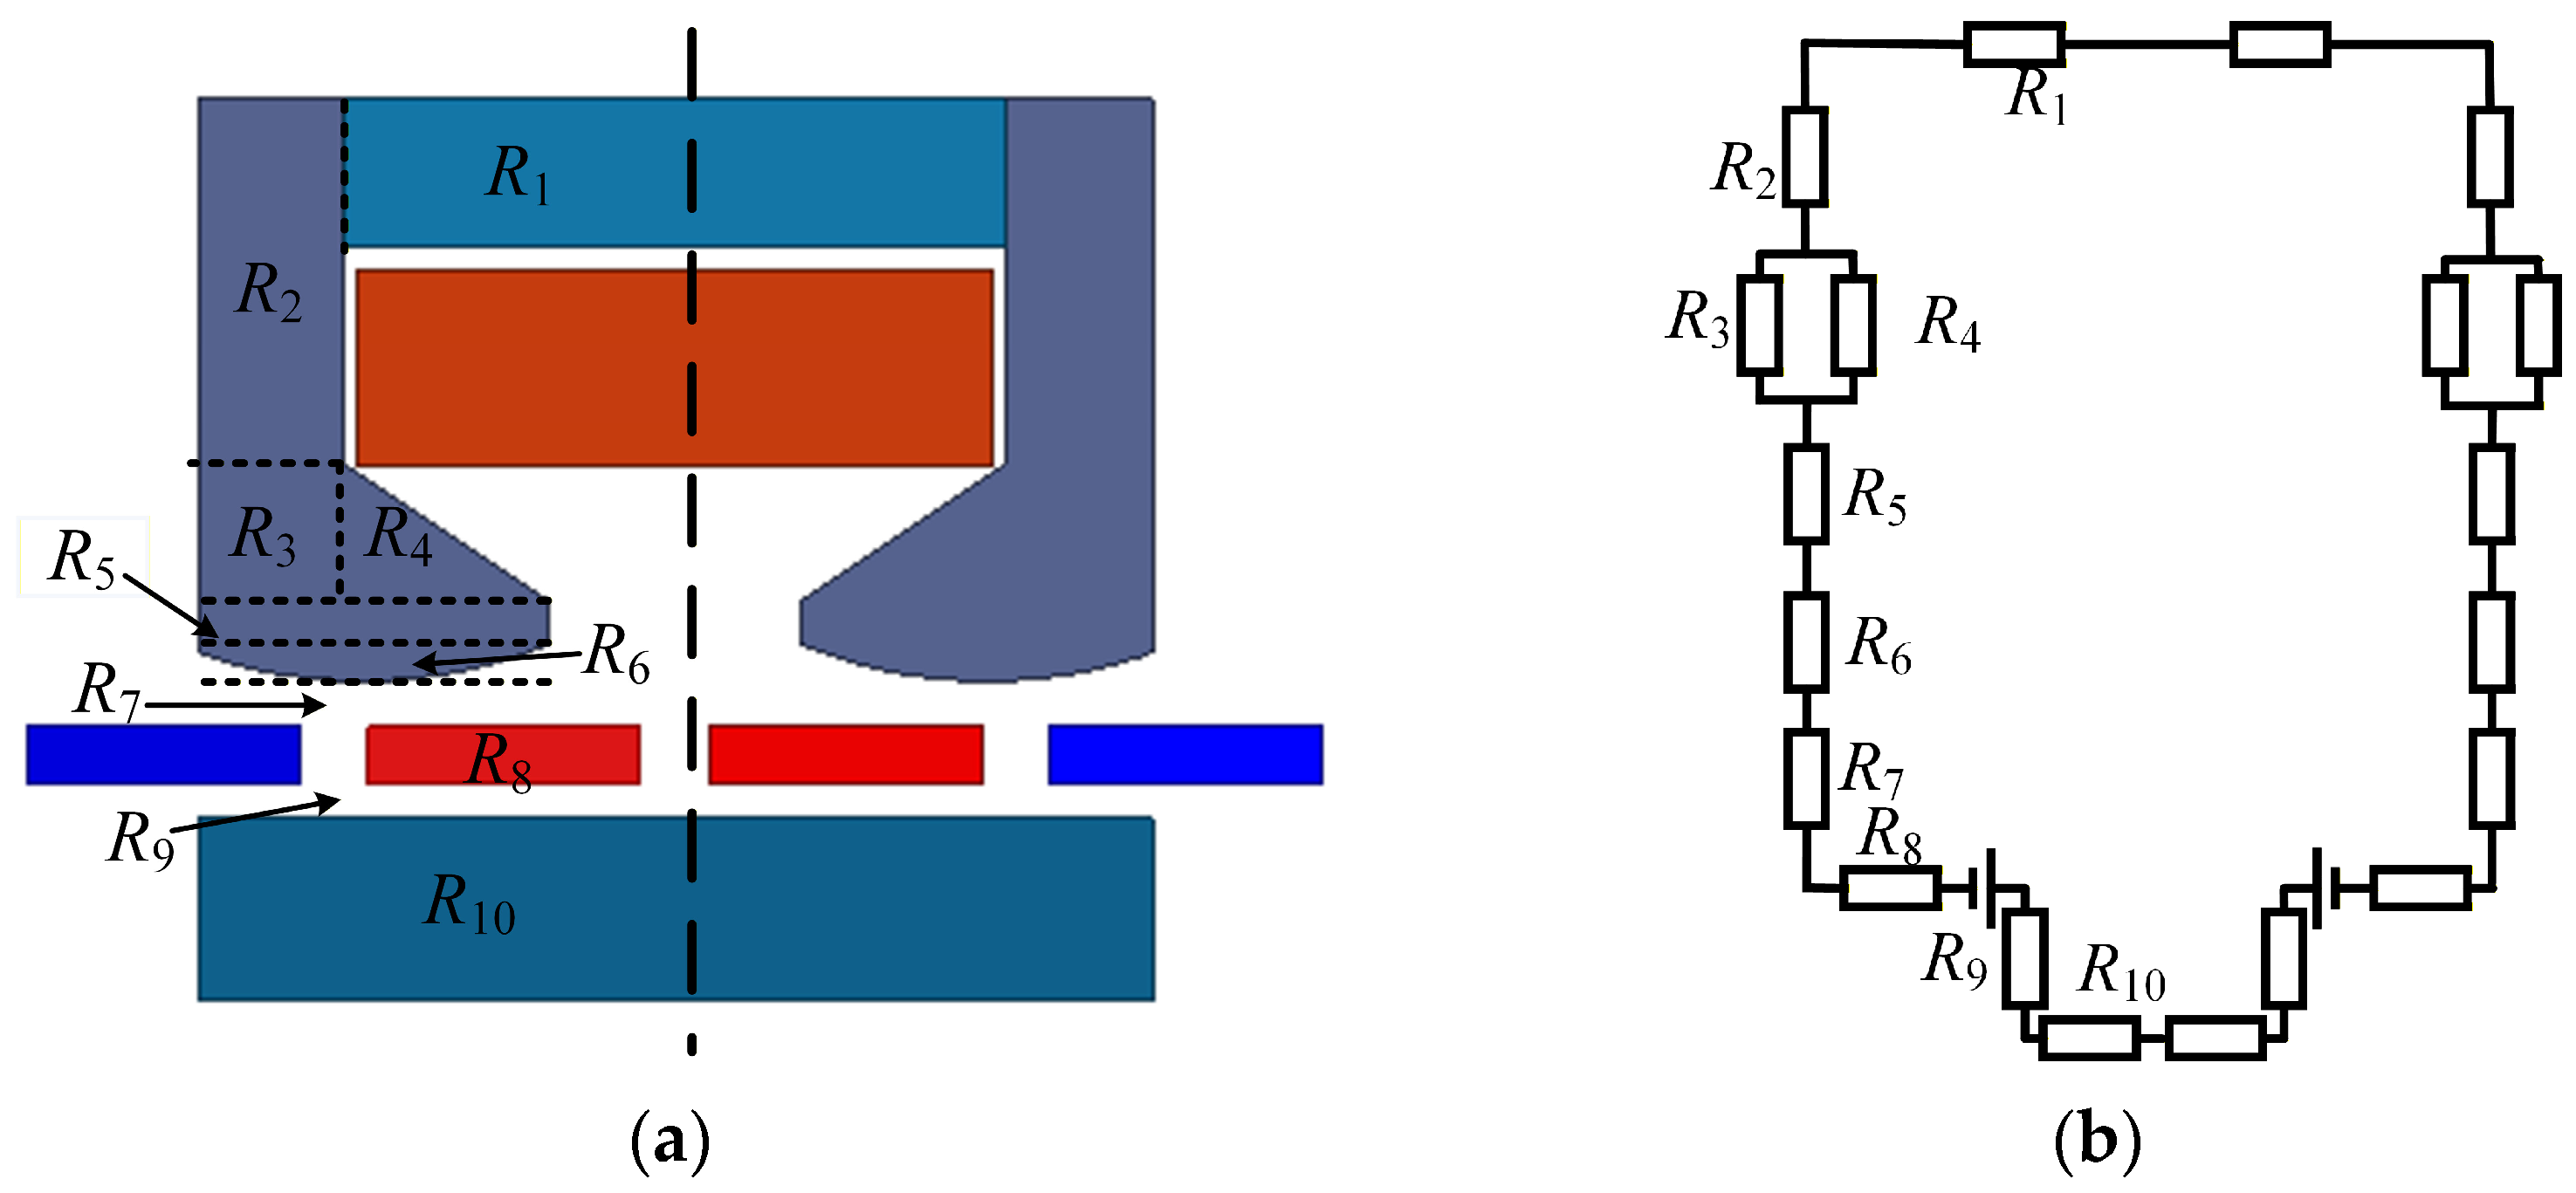
To reduce the magnetic field calculation costs and enhance parameter analysis efficiency, the MEC is employed to analysis the CT-DSCLOG. Considering the symmetry of the generator structure and the relatively symmetrical distribution of magnetic flux between the stator and rotor, only half of the generator is selected for modeling and analysis, as shown in Figure 4. The magnetic circuit model is developed based on several simplifying assumptions to enhance computational efficiency [34]:
(1)
each medium consists of isotropic material and the permeability of each element is constant;
(2)
magnetic leakage and flux fringing is omitted in the magnetic circuit;
(3)
eddy current and hysteresis is ignored in the magnetic circuit;
(4)
axial and radial end effect are negligible.
To increase the accuracy of the calculation, the proposed magnetic circuit model of the linear generator was divided into three sections: the stator region, the air gap region, and the PM region.

4.1. Stator Region Magnetic Reluctance Analysis

The inner and outer stators serve as primary magnetic paths within the magnetic circuit, guiding the magnetic flux generated by the PM from the winding region to the air gap region. Considering the irregular structure of this generator and curved teeth, the outer stator is modeled as four regular sections and two irregular sections. The inner stator is a regular rectangle. The regular sections are calculated as follows:
R i = l i μ 0 μ r A i     i = 1 , 2 , 3 , 5 , 8 , 10
where li represents the effective length of the magnetic circuit for each region, Ai represents the cross-sectional area through which the magnetic circuit passes in each regular region, μ0 is the vacuum magnetic permeability, and μr is the relative magnetic permeability of the material corresponding to each different region.
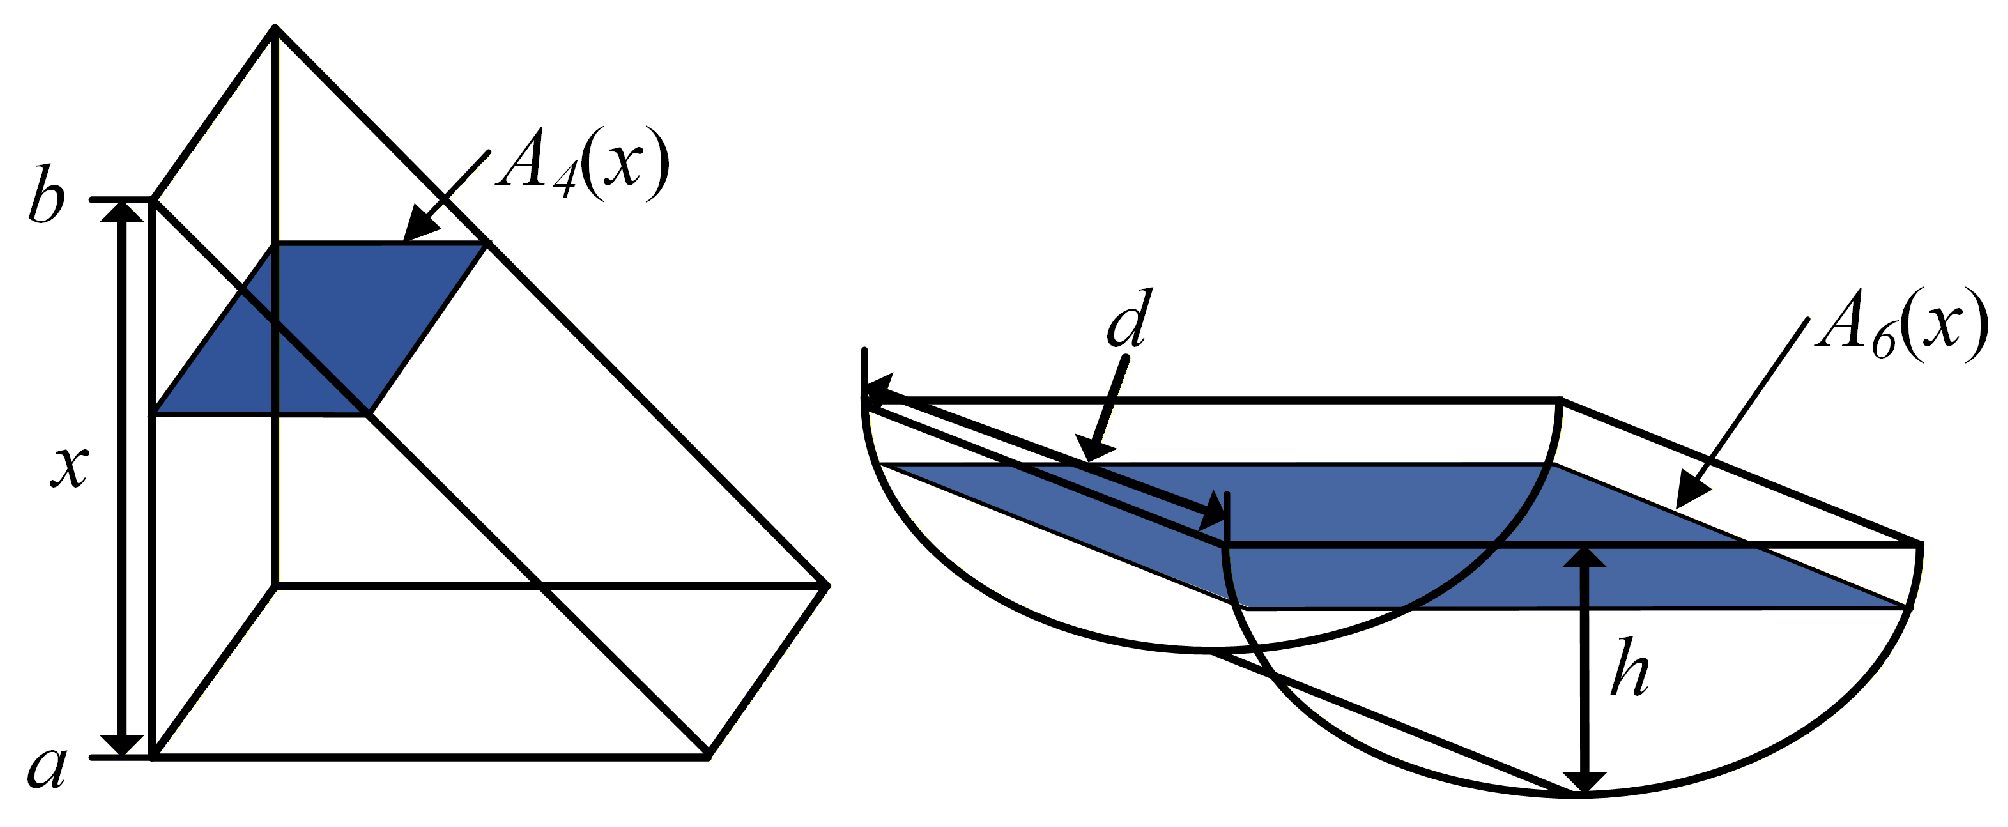
A segmentation and discretization approach are applied to calculated irregular regions of outer stator (R4 and R6). As illustrated in Figure 5, the reluctance of each segment can be calculated based on its cross-sectional area (A4(x) and A6(x)) with geometric parameters (h is height of curved tooth, d is stator yoke width). Then, the reluctances of all segments are summed up to obtain the total reluctance of the irregular region.
The values of R4 and R6 can be calculated as:
R 4 = a b 1 μ 0 μ r A 4 ( x ) d x = 1 μ 0 μ r d ( b a ) l n ( b a )
R 6 = 0 h 1 μ 0 μ r A 6 ( x ) d x = 1 μ 0 μ r d arcsin ( h 2 R )
where a and b represent the starting and ending points, respectively, for the integration over the irregular region of the pole shoe, R is the radius of curved tooth.

4.2. Air Gap Region: Magnetic Reluctance Analysis

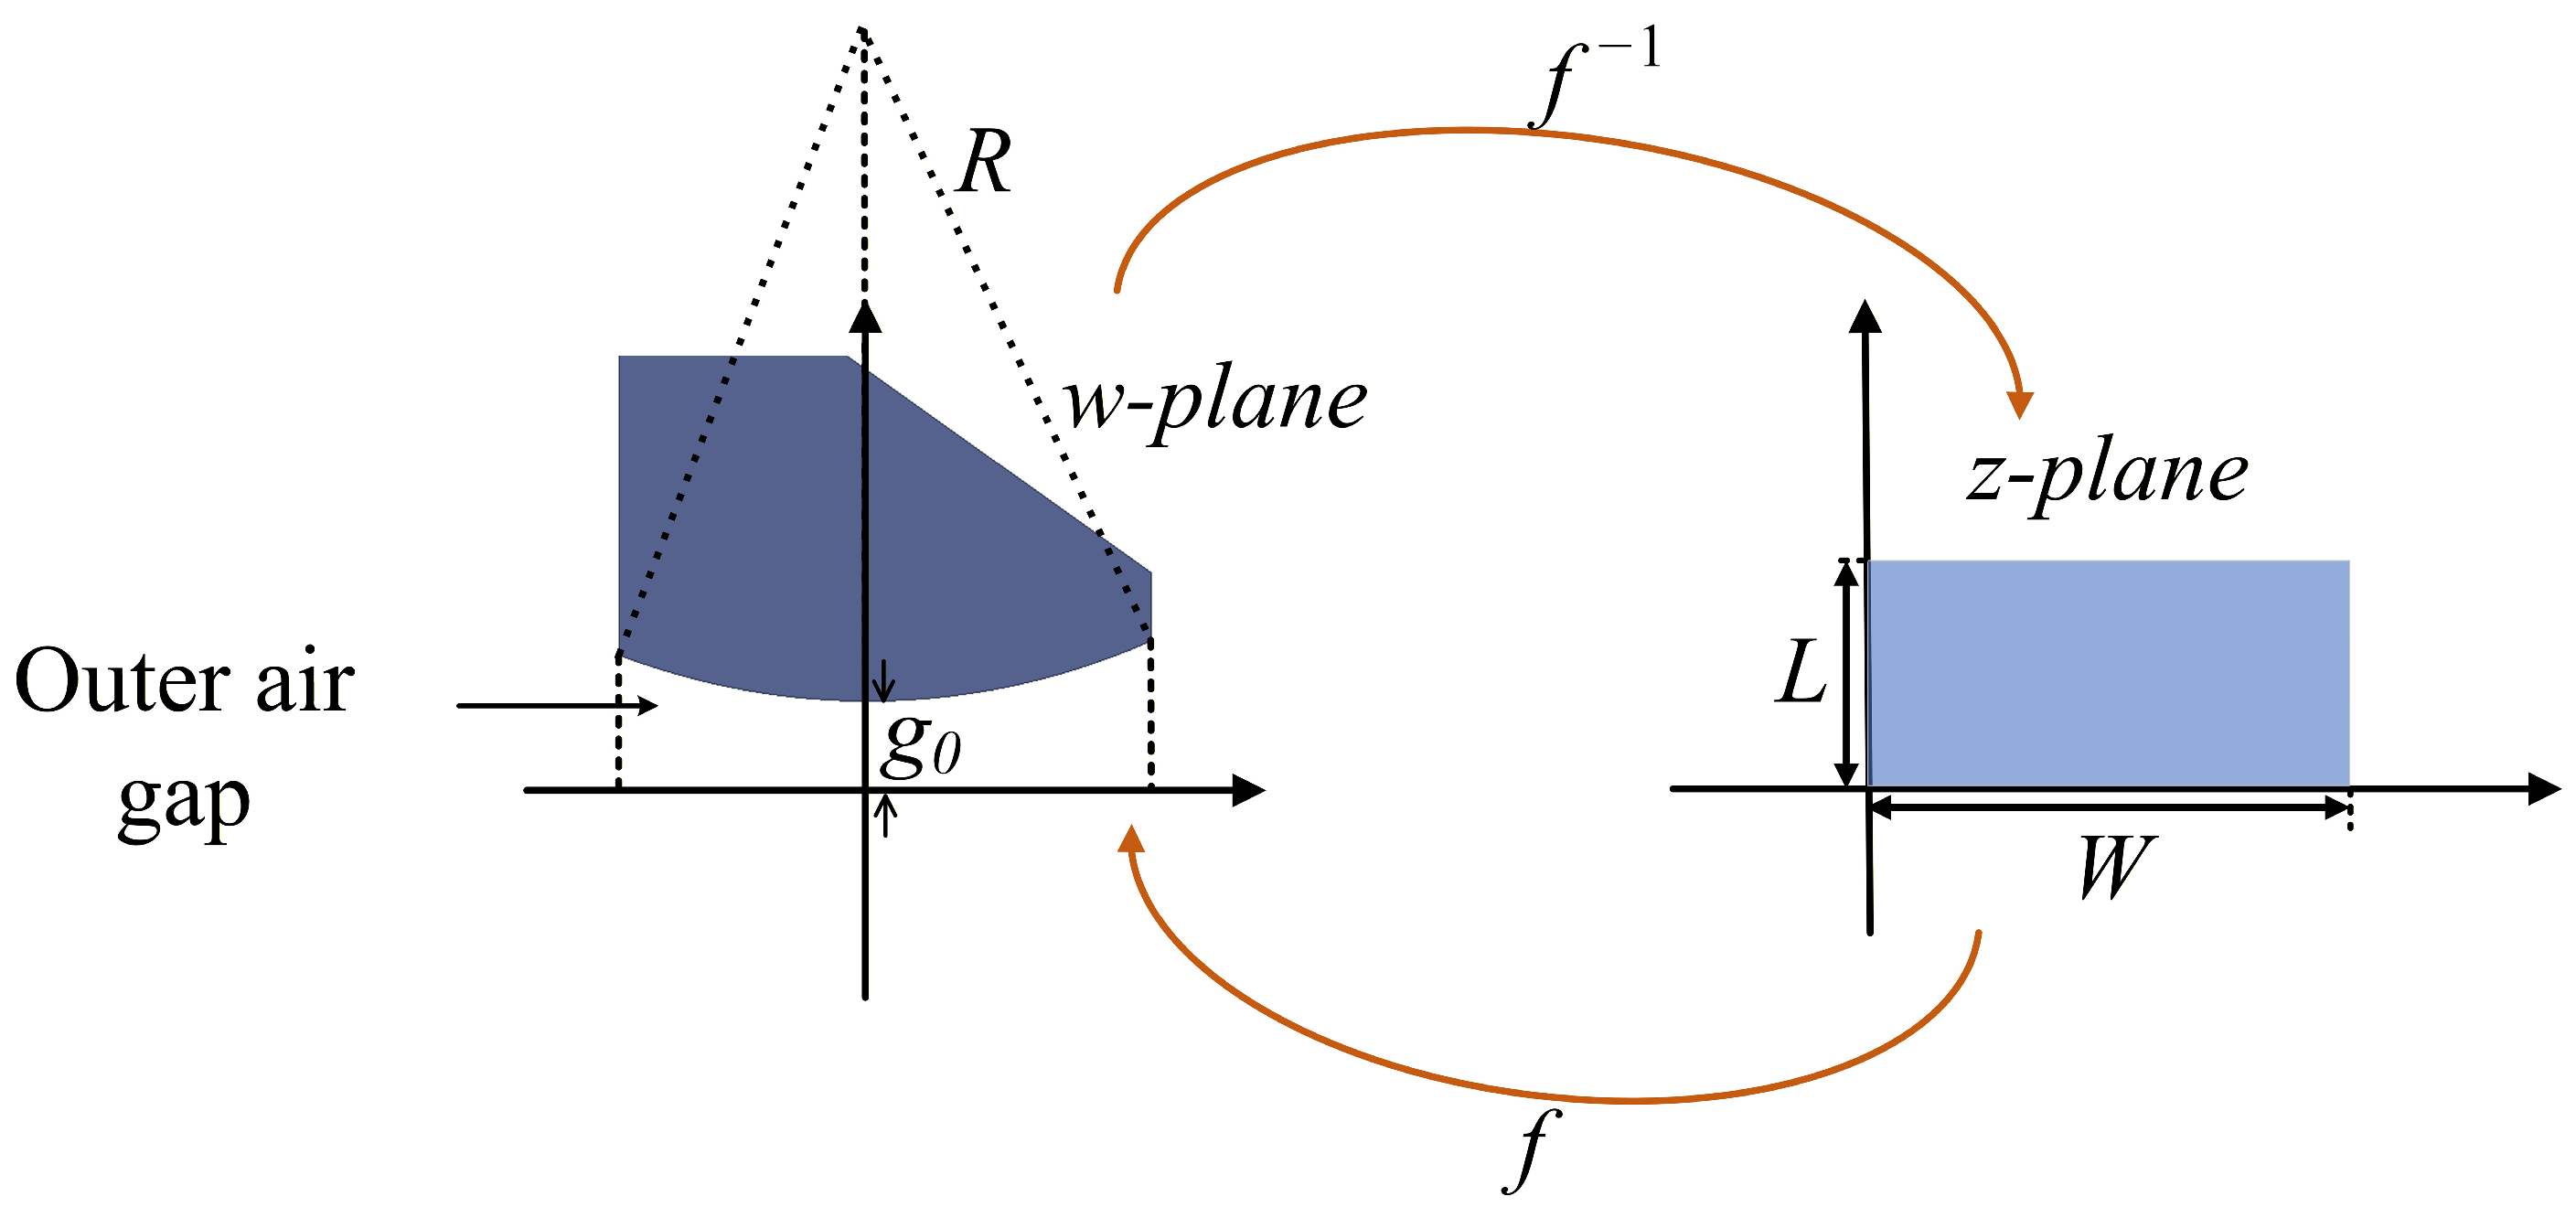
The air gap region can also be divided into regular and irregular sections. The most complicated part for calculating the magnetic reluctances is the air gap length, because the magnetic reluctance at each point on the curved teeth is different. To address this issue, the Schwarz–Christoffel (S-C) mapping method is employed to calculate the magnetic reluctance of the air gap region. The outer air gap region is mapped onto a rectangular area of length W and width L in the z-plane, as shown in Figure 6.
The magnetic reluctance of the outer air gap can be calculated as:
R 7 = 1 μ 0 l d l A ( l )
Though S-C mapping, R7 can be expressed as:
R 7 = 1 μ 0 0 W d x g c q ( x )
The equivalent curved teeth outer air gap length obtained through the S-C mapping is approximately:
g c q ( x ) = g 0 + x 2 2 R
R 7 = 1 μ 0 2 R g 0 arctan ( W 2 1 2 R g 0 )
R 9 = δ i n μ 0 A i n
where W is the length of rectangular area in the z-plane, δin is the length of inner air gap, Ain is the cross-sectional area which the magnetic circuit passes through in the inner air gap.

4.3. Calculation of PM Magnetomotive Force and Internal Magnetic Reluctance

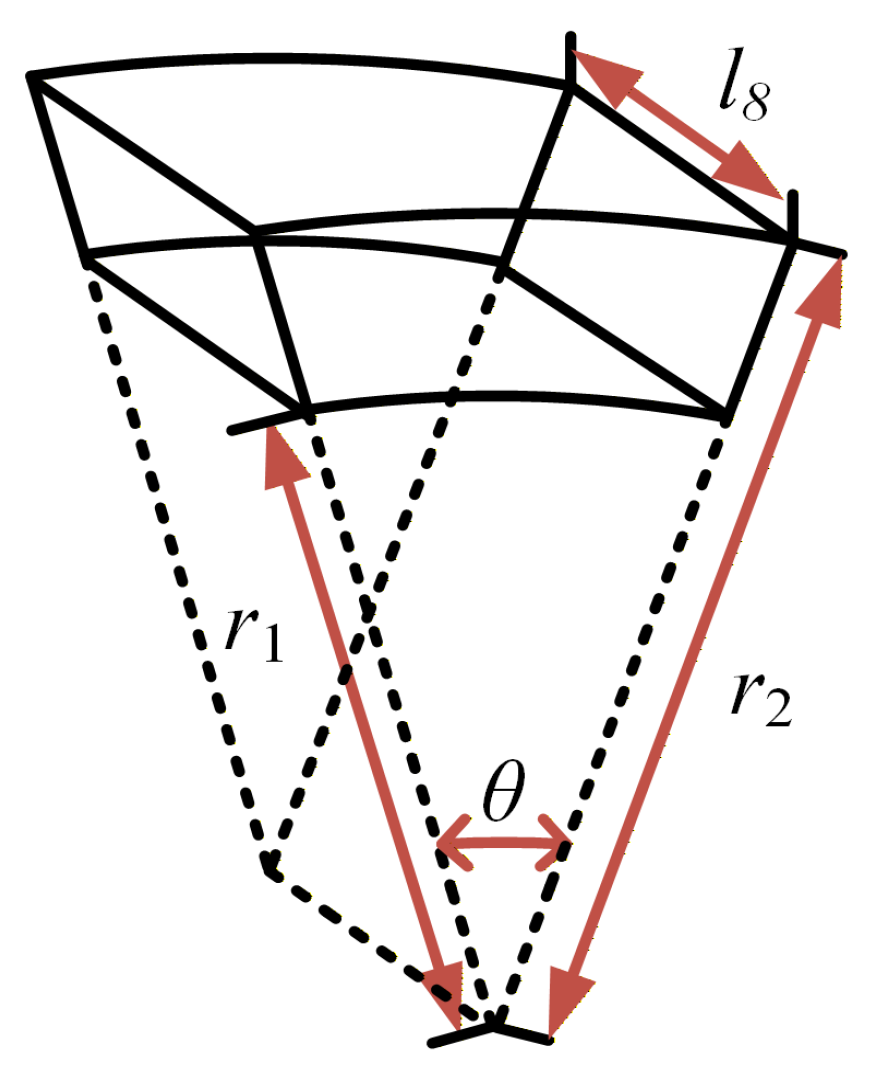
The PM of the proposed linear generator adopts a radially magnetized tile-shaped structure, as shown in Figure 7. It not only provides magnetomotive force but also exhibits magnetic reluctance. Unlike rectangular PM, the magnetic flux paths of tile-shaped magnets are distributed radially, where both cross-sectional area and path length vary with radius. Therefore, a radial magnetic reluctance integration approach is employed to establish its MEC model. The magnetomotive force and magnetic reluctance expressions for the tile-shaped PM are expressed as:
F P M = H c l p m
R 8 = 1 μ 0 r 1 r 2 d r l 8 θ r
R 8 = 1 μ 0 μ p m θ l 8 l n ( r 2 r 1 )
where Hc represents the coercive force of the PM, R8 represents the magnetic reluctance of the PM, μ0 represents the vacuum magnetic permeability, μpm represents the relative permeability of the PM, θ represents the central angle subtended by the PM, lpm is the axial length of the PM, and r1 and r2 are the inner and outer radii of the tile-shaped PM, respectively.

4.4. Analyze the Cogging Force

The cogging force is generated due to the interaction between the permanent magnets and the stator teeth. It can be defined as follows:
F c o g = w m x
The permeability of the stator and back iron are assumed to be infinite, and the magnetic field energy is approximately the sum of the air gap energy and PM energy. The Fcog can be calculated as stated in [34]:
F c o g = w d g o / 2 μ 0 n = 1 F n cos n z x × ( a p m B r e m 2 + n = 1 B r n cos 2 n p x )
B r n = 2 / n π B r 2 sin a p m π
where wd is the depth of the generator, p is flux pole-pairs, apm is the pole arc coefficient, Brem is the remanent magnetic flux density. Fn is the n-th harmonic amplitude.
The air gap magnetic flux density can be expressed as follows:
B a g = F P M R l S g
where FPM is magnetomotive force, Sg is the cross-sectional area of the air gap, Rl is the amplitude of magnetic reluctance.
The Back-EMF can be expressed as follows:
e = N c d ϕ d t
where Nc is the number of coils and ϕ is the phase flux linkage.

4.5. Accuracy Analysis of the MEC Model

To verify the effectiveness and accuracy of the MEC model, the MEC model was applied to a proposed machine whose specifications are shown in Table 1, and the performance calculation results are compared between the MEC model and FEA.
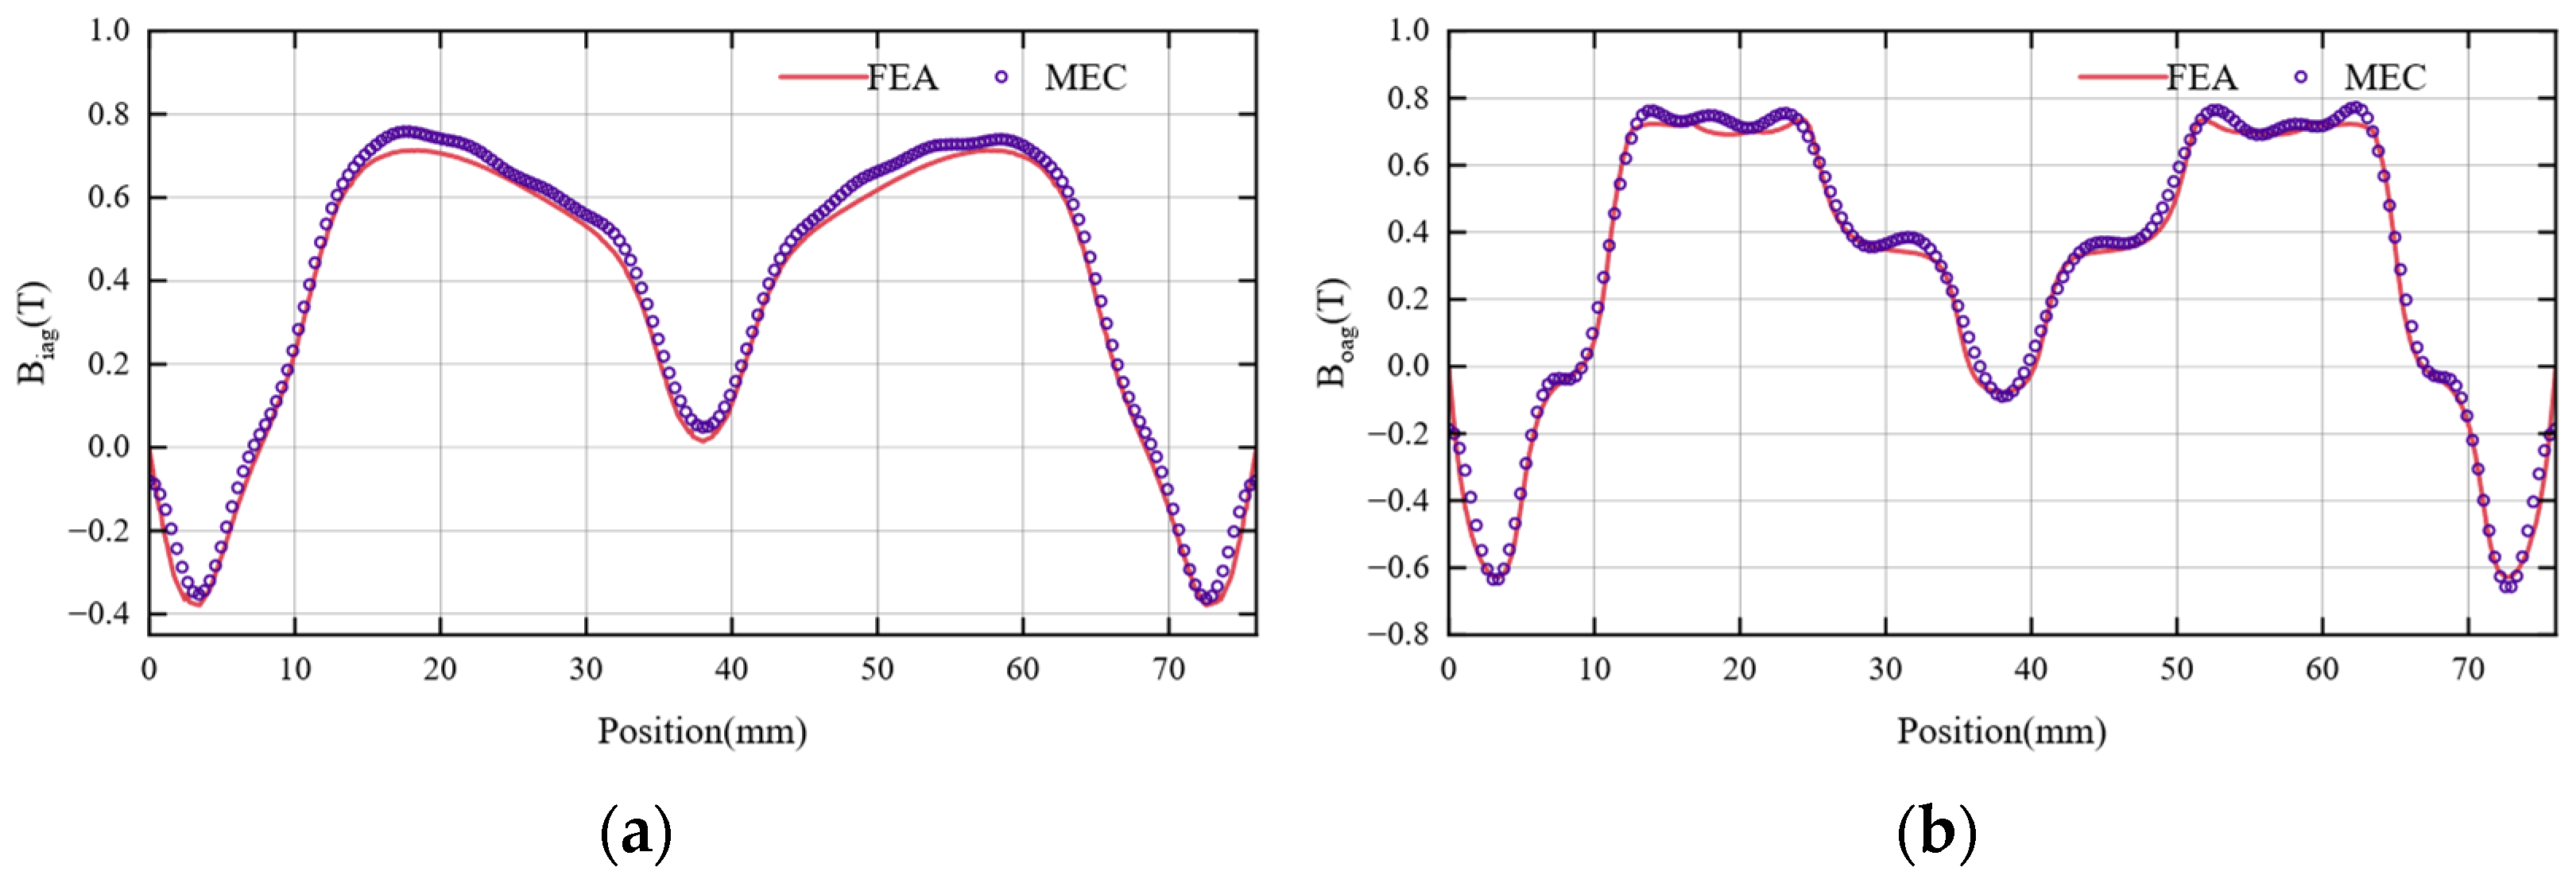
Figure 8 shows the comparison results of the magnetic flux density distribution in the inner and outer air gap regions between the MEC model and FEA. As can be seen from Figure 8a, the inner stator is equivalent to a slotless iron core structure, and the permanent magnets are arranged in an S-N-N-S way. The inner air gap magnetic flux density distribution exhibits a distinct dual-peak characteristic; this is attributed to the field redistribution mechanism at the interface of like poles (N-N). At the center of the N-N region, the opposing magnetic vectors lead to a strong repulsion effect, forcing the flux lines to deviate from the radial direction, which results in the observed local minimum in Biag. And in the central region of the PM, approximately between 15 mm and 60 mm, as the PM directly faces the air gap, the magnetic resistance of the magnetic circuit is mainly determined by the thickness of the air gap. So, the distribution of magnetic field lines is the densest, corresponding to the two main peak values of the waveform at about 0.75 T. Unlike Figure 8a, Figure 8b shows the magnetic flux density of the slotted outer air gap. The presence of the stator slot introduces a periodic fluctuation superimposed on the main magnetic peaks, which is physically rooted in the spatial variation in the air gap reluctance between the stator teeth and the slot opening. From Figure 8, the quantitative comparison between the FEA and MEC results demonstrates high fidelity, with a maximum deviation in peak magnetic flux density restricted to less than 2.6%.
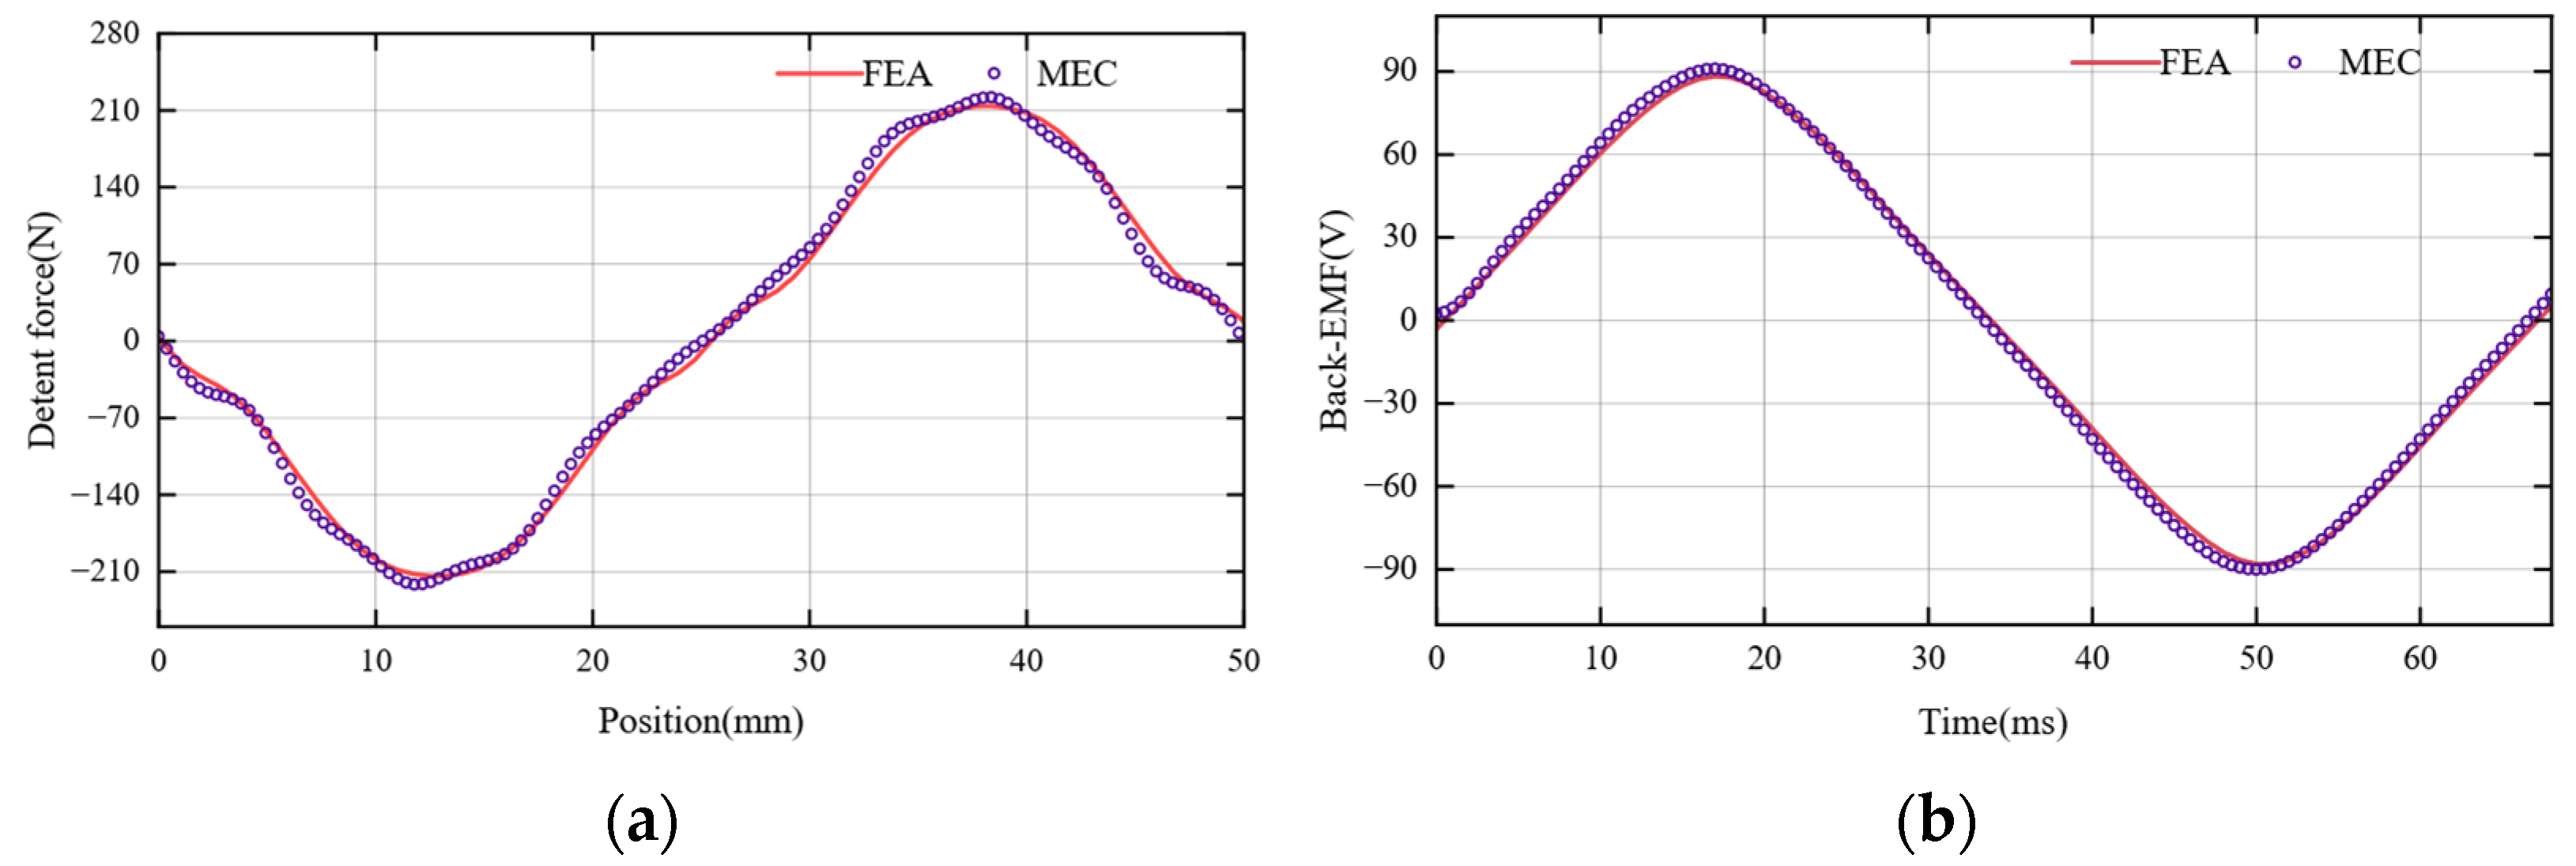
Figure 9 illustrates a comparative analysis of the detent force and Back-EMF between the analytical MEC model and the FEA method. As depicted in Figure 9a, the peak detent force predicted by the FEA and MEC models is 213.88 N and 222.98 N, respectively, representing a localized relative error of approximately 4.2%. Similarly, Figure 9b presents the Back-EMF profiles at a specified velocity, where the peak values for the FEA and MEC models are recorded as 87.23 V and 90.09 V, respectively, yielding a discrepancy of 3.2%. The minor discrepancies observed, particularly at the crests and troughs of the magnetic flux density and force waveforms, are primarily attributed to the inherent limitations of the MEC approach in fully characterizing complex leakage flux paths and local magnetic saturation at the pole edges and tooth tips. Nevertheless, the analytical results remain within an acceptable range and are suitable for initial design optimization and performance estimation.

4.6. Sensitivity Analysis for Magnetic Flux Density

Based on the established MEC model, the key structural parameters listed in Table 2 are analyzed via sensitivity analysis to determine their influence on the magnetic flux density of the linear generator, so that the critical optimization variables can be identified.
To validate the sensitivity analysis results, each variable was assigned two levels, and twelve parameter combinations were generated using the Plackett–Burman sampling method. The interaction effects among parameters were uniformly distributed across the samples, ensuring balanced and representative coverage of the design space while maintaining computational efficiency. For each parameter combination, magnetic flux density data in different regions were obtained through uniform sampling. The variance decomposition method was then applied to evaluate the sensitivity S(xi) of each parameter to local magnetic field variations. Finally, the composite sensitivity Sc(xi) was determined by averaging the values of S(xi). The specific calculation basis for the sensitivity S(xi) and Sc(xi) of each variable is as follows:
S ( x i ) = V ( E ( f B x i ) ) V ( f B )
S c ( x i ) = 1 i S ( x i )
where fB is the magnetic flux density in different regions, xi is the structural parameter, E(fB|xi) is the mean value of f when xi is constant, V(E(fB|xi)) denotes the variance of E(fB|xi) for different values of xi, V(fB) is the variance of all samples, and i is the number of parameters.
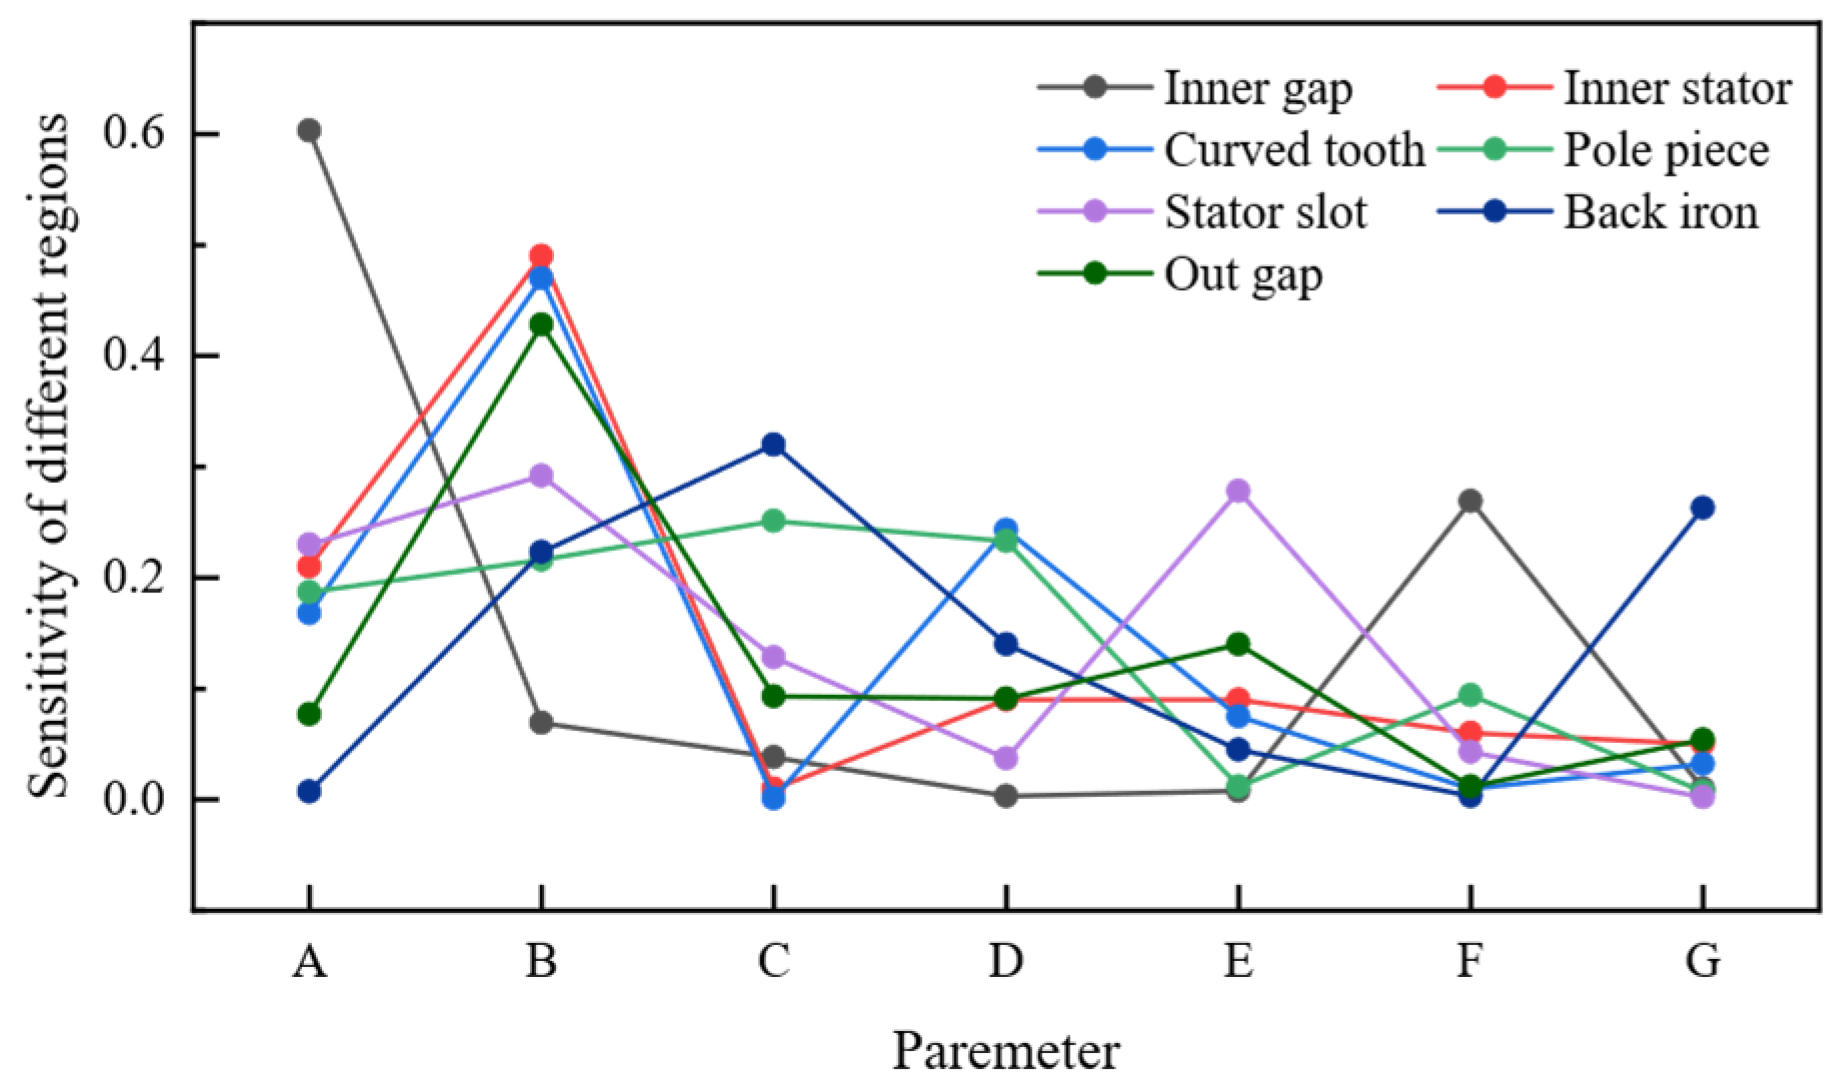
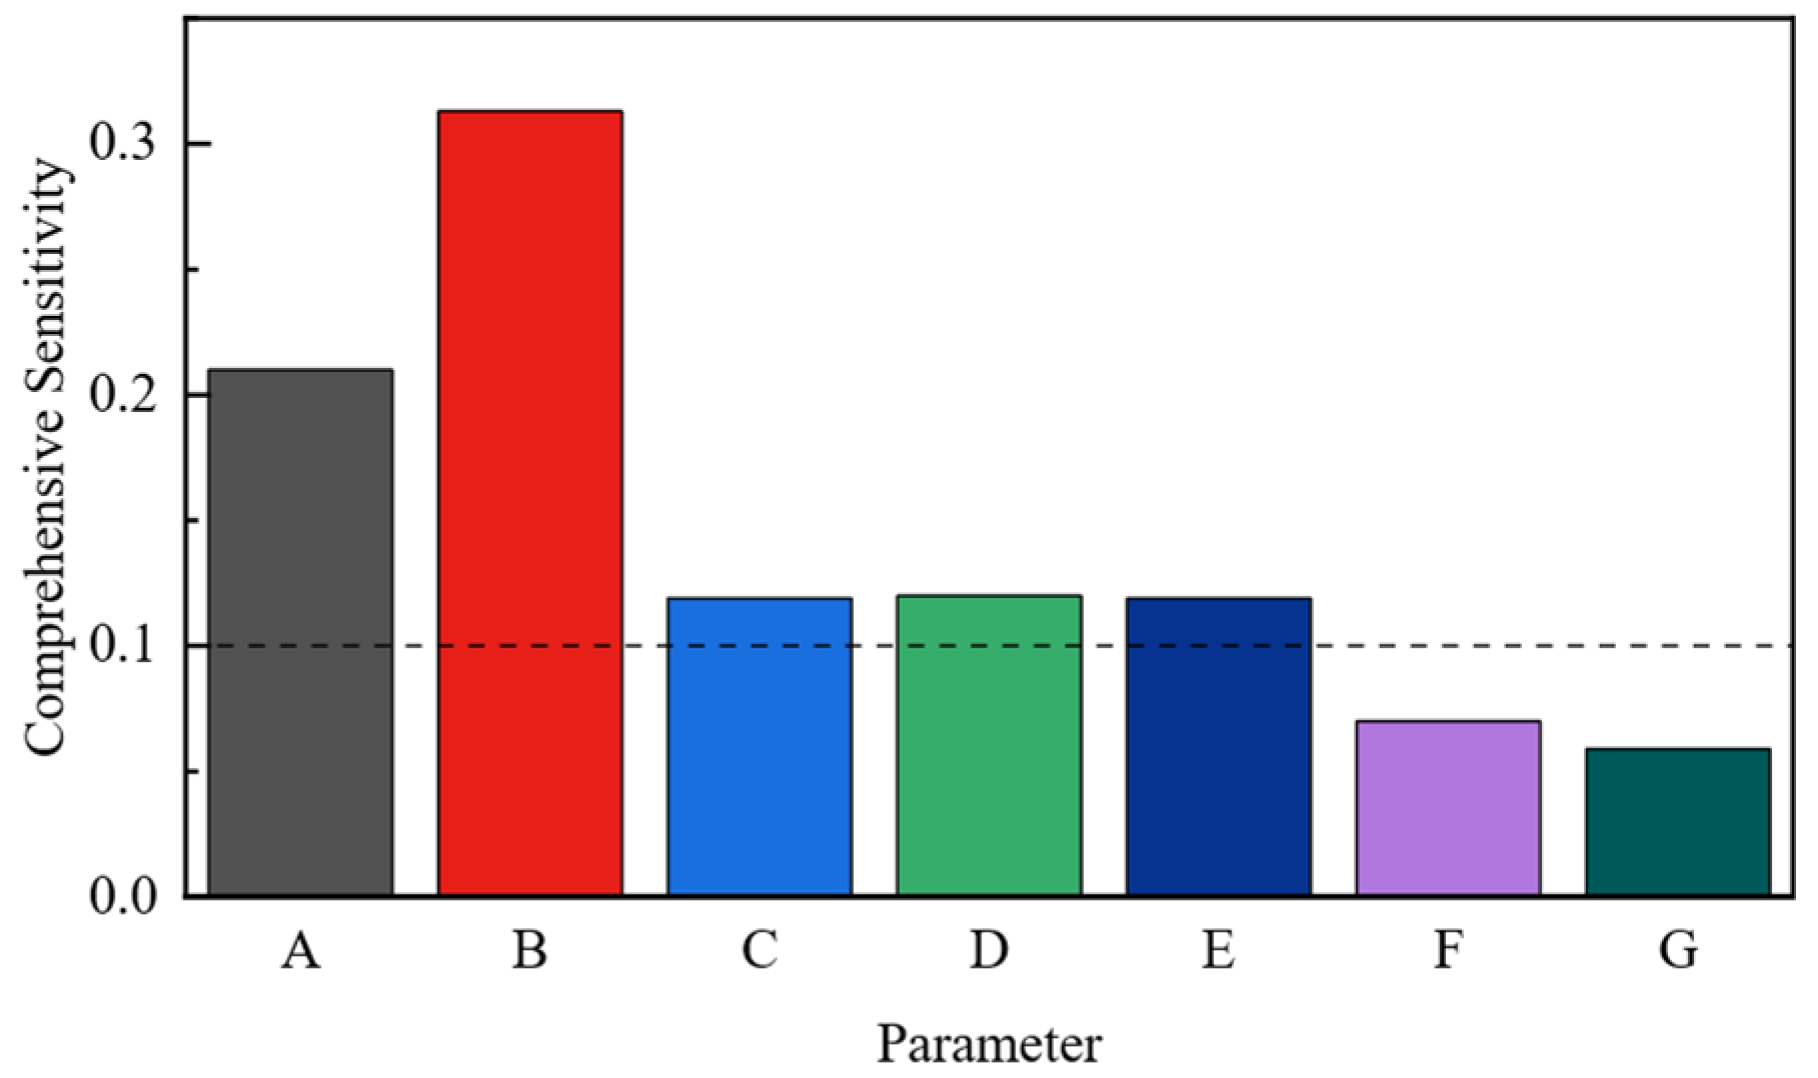
Figure 10 shows each parameter’s sensitivity to magnetic flux density in different regions of the generator. The composite sensitivity of each parameter is shown in Figure 11. Based on comprehensive sensitivity analysis, parameters with a comprehensive sensitivity of more than 0.1 were selected as the optimization parameters. These are PM width (A) and height (B), slot opening width (C), curved tooth height (D), and outer stator height (E). Under the same conditions, changes in the inner stator height and back iron height have a minimal influence on the generator’s magnetic flux density. Consequently, their optimal values (84 mm and 11.5 mm, respectively) were determined using the MEC model.

5. Taguchi Method Optimization of Generator Parameters

5.1. Optimal Variable Selection

In this section, a 3D FEA model of the CT-DSCLOG is established to account for the end effects of the linear machine. Subsequently, the Taguchi method is combined with FEA to optimize the structural parameters. By selecting three levels for each of the five optimization parameters, an L27(35) orthogonal matrix is established to evaluate the performance of the associated compositions. The minimum detent force, maximum Back-EMF and maximum power are taken as the optimization objectives. The optimization parameter levels are given in Table 3.

5.2. Orthogonal Experimental Design

Using traditional FEA, 35 = 243 calculations are required. By employing the Taguchi method, only 33 = 27 calculations are required, which significantly reduces the time. Table 4 presents the experimental matrix and the results of the proposed linear machine.

5.3. Analysis of Mean and Variance

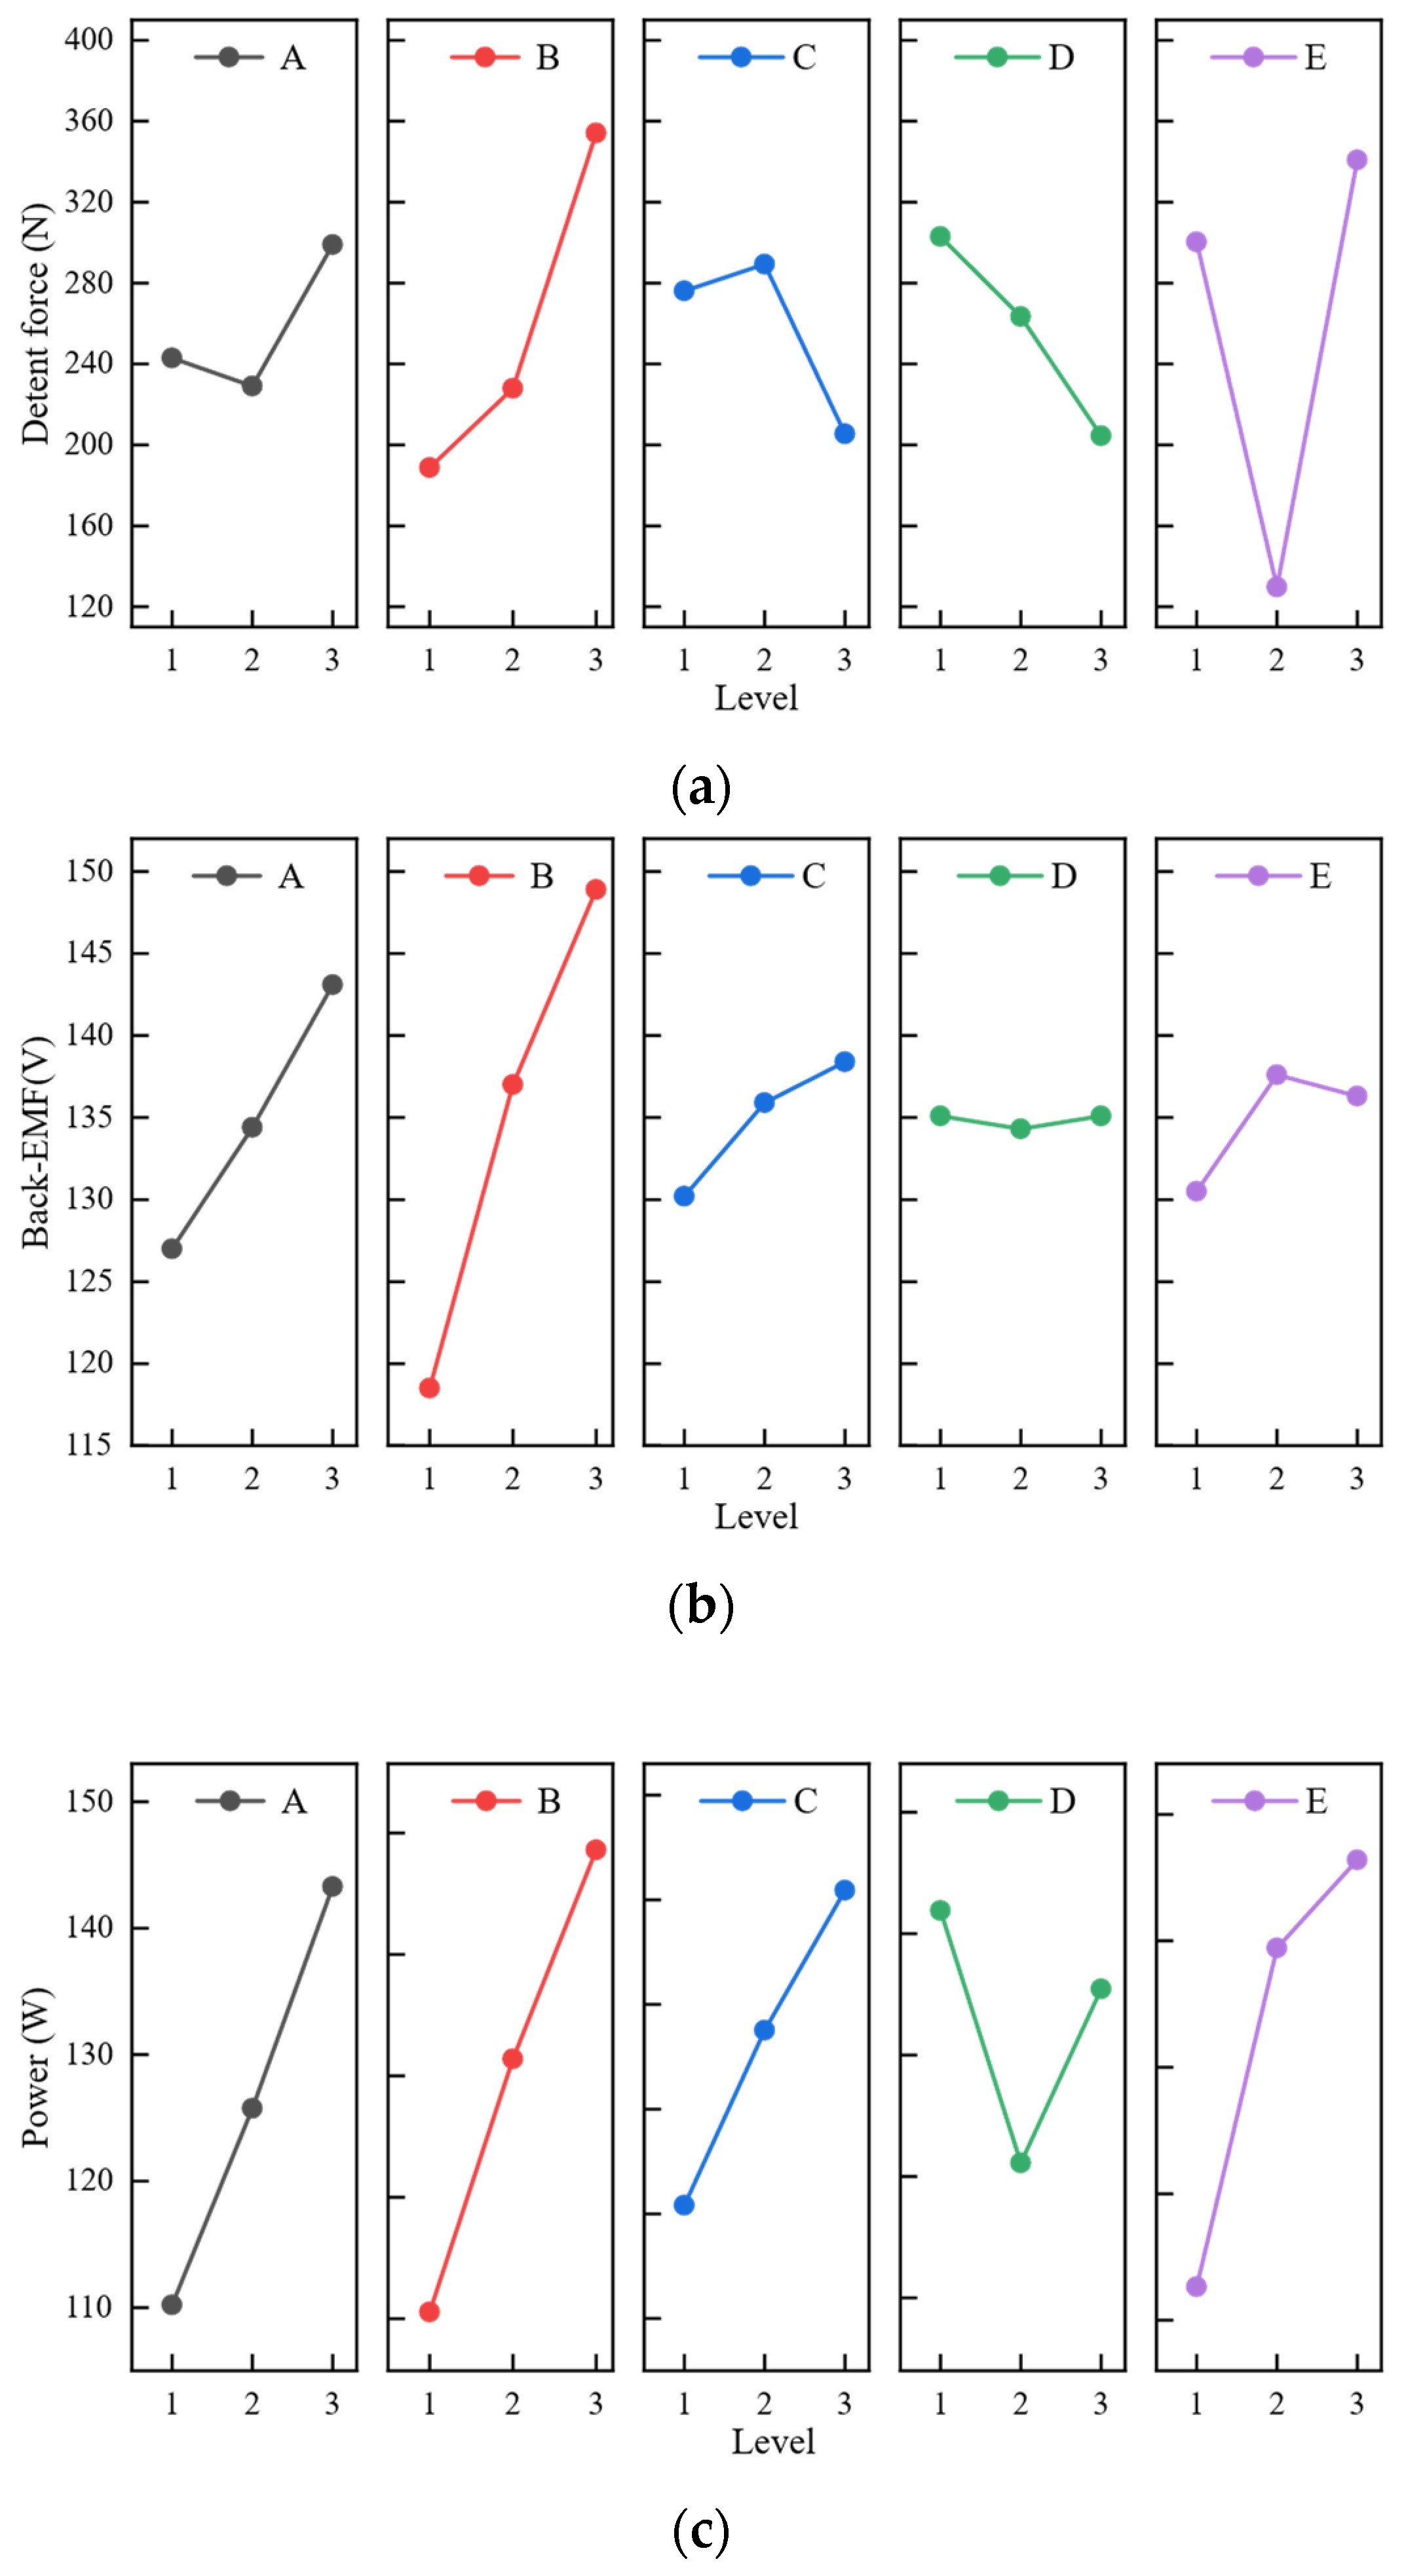
For different optimization objectives, the average values of each variable at different levels were calculated from Equation (19), and the results are shown in Figure 12.
m = 1 n i = 1 n S i
where m represents the average value across different levels, n represents the number of experiments conducted at each level, and Si indicates the objective value at the i-th optimization iteration.
As shown in Figure 12, three different parameter combinations satisfy the optimization requirements for individual objectives: A(2)B(1)C(3)D(3)E(2) for minimum detent force, A(3)B(3)C(3)D(3)E(2) for maximum Back-EMF, and A(3)B(3)C(3)D(1)E(3) for maximum power. To resolve these conflicts, a priority-based compromise rule is established by analyzing the variance of each factor. This rule ensures that the final design prioritizes parameters that suppress the detent force effects while providing the highest contribution to electromagnetic performance.
The contribution of each parameter to the variation can be calculated as follows:
S Q = 1 Q i = 1 Q ( S i m ) 2
where SQ is the variance of each factor, Q represents the number of levels, Si is the experimental value for the i-th level, and m is the overall mean value for each optimization objective.
The variance and proportion contributed by each optimization factor for different optimization objectives are shown in Table 5.
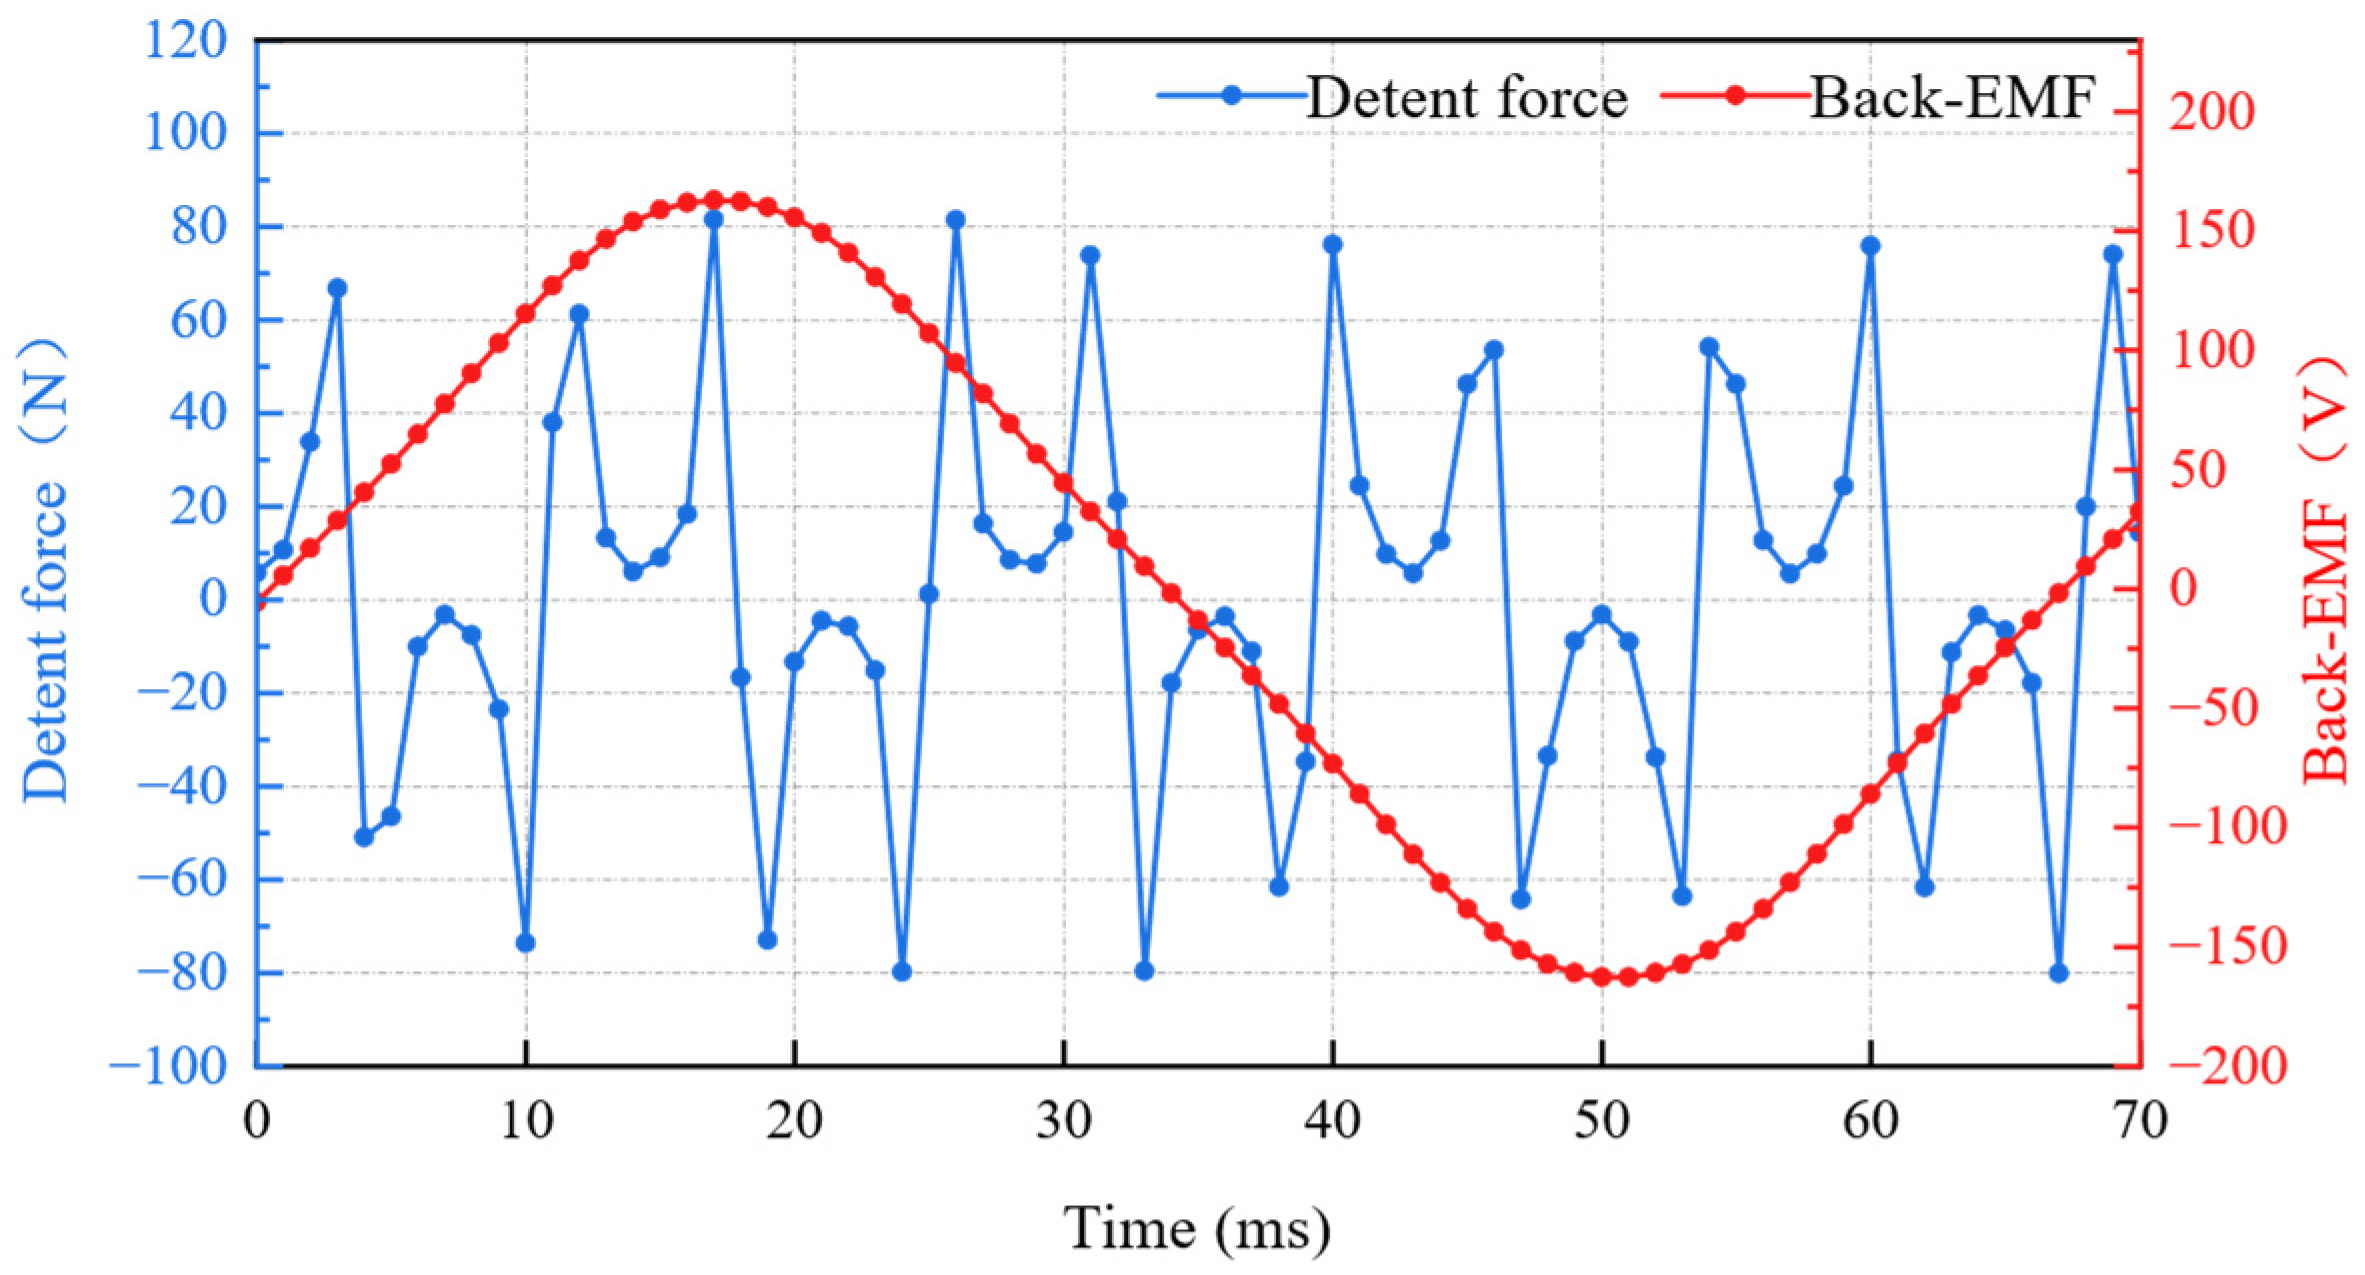
As shown in Table 5, the PM height (B) significantly impacts the output power, accounting for 72.4%. The influence of PM width (A) on the Back-EMF is significantly greater than its influence on the detent force and power, accounting for 19.7%. The outer stator slot height (E) exerts the greatest influence on detent force, contributing to 47.8%. In order to meet the design requirements, the optimal combination of structural parameters is A(3)B(3)C(3)D(3)E(2). Based on this combination, the distribution of detent force and Back-EMF are obtained as shown in Figure 13.

6. Simulation and Experimental Validation

In this section, in order to evaluate the effectiveness of the proposed CT-DSCLOG, a comparative study involving the traditional DSCLOG and the machine described in [18] was conducted, using both FEA and experimental testing. The comparative study of these three linear machines was conducted at the same moving speed, and share the same inner and outer radius, winding configuration, slot filling factor, and material properties. The main parameters of the three investigated linear machines are given in Table 6.
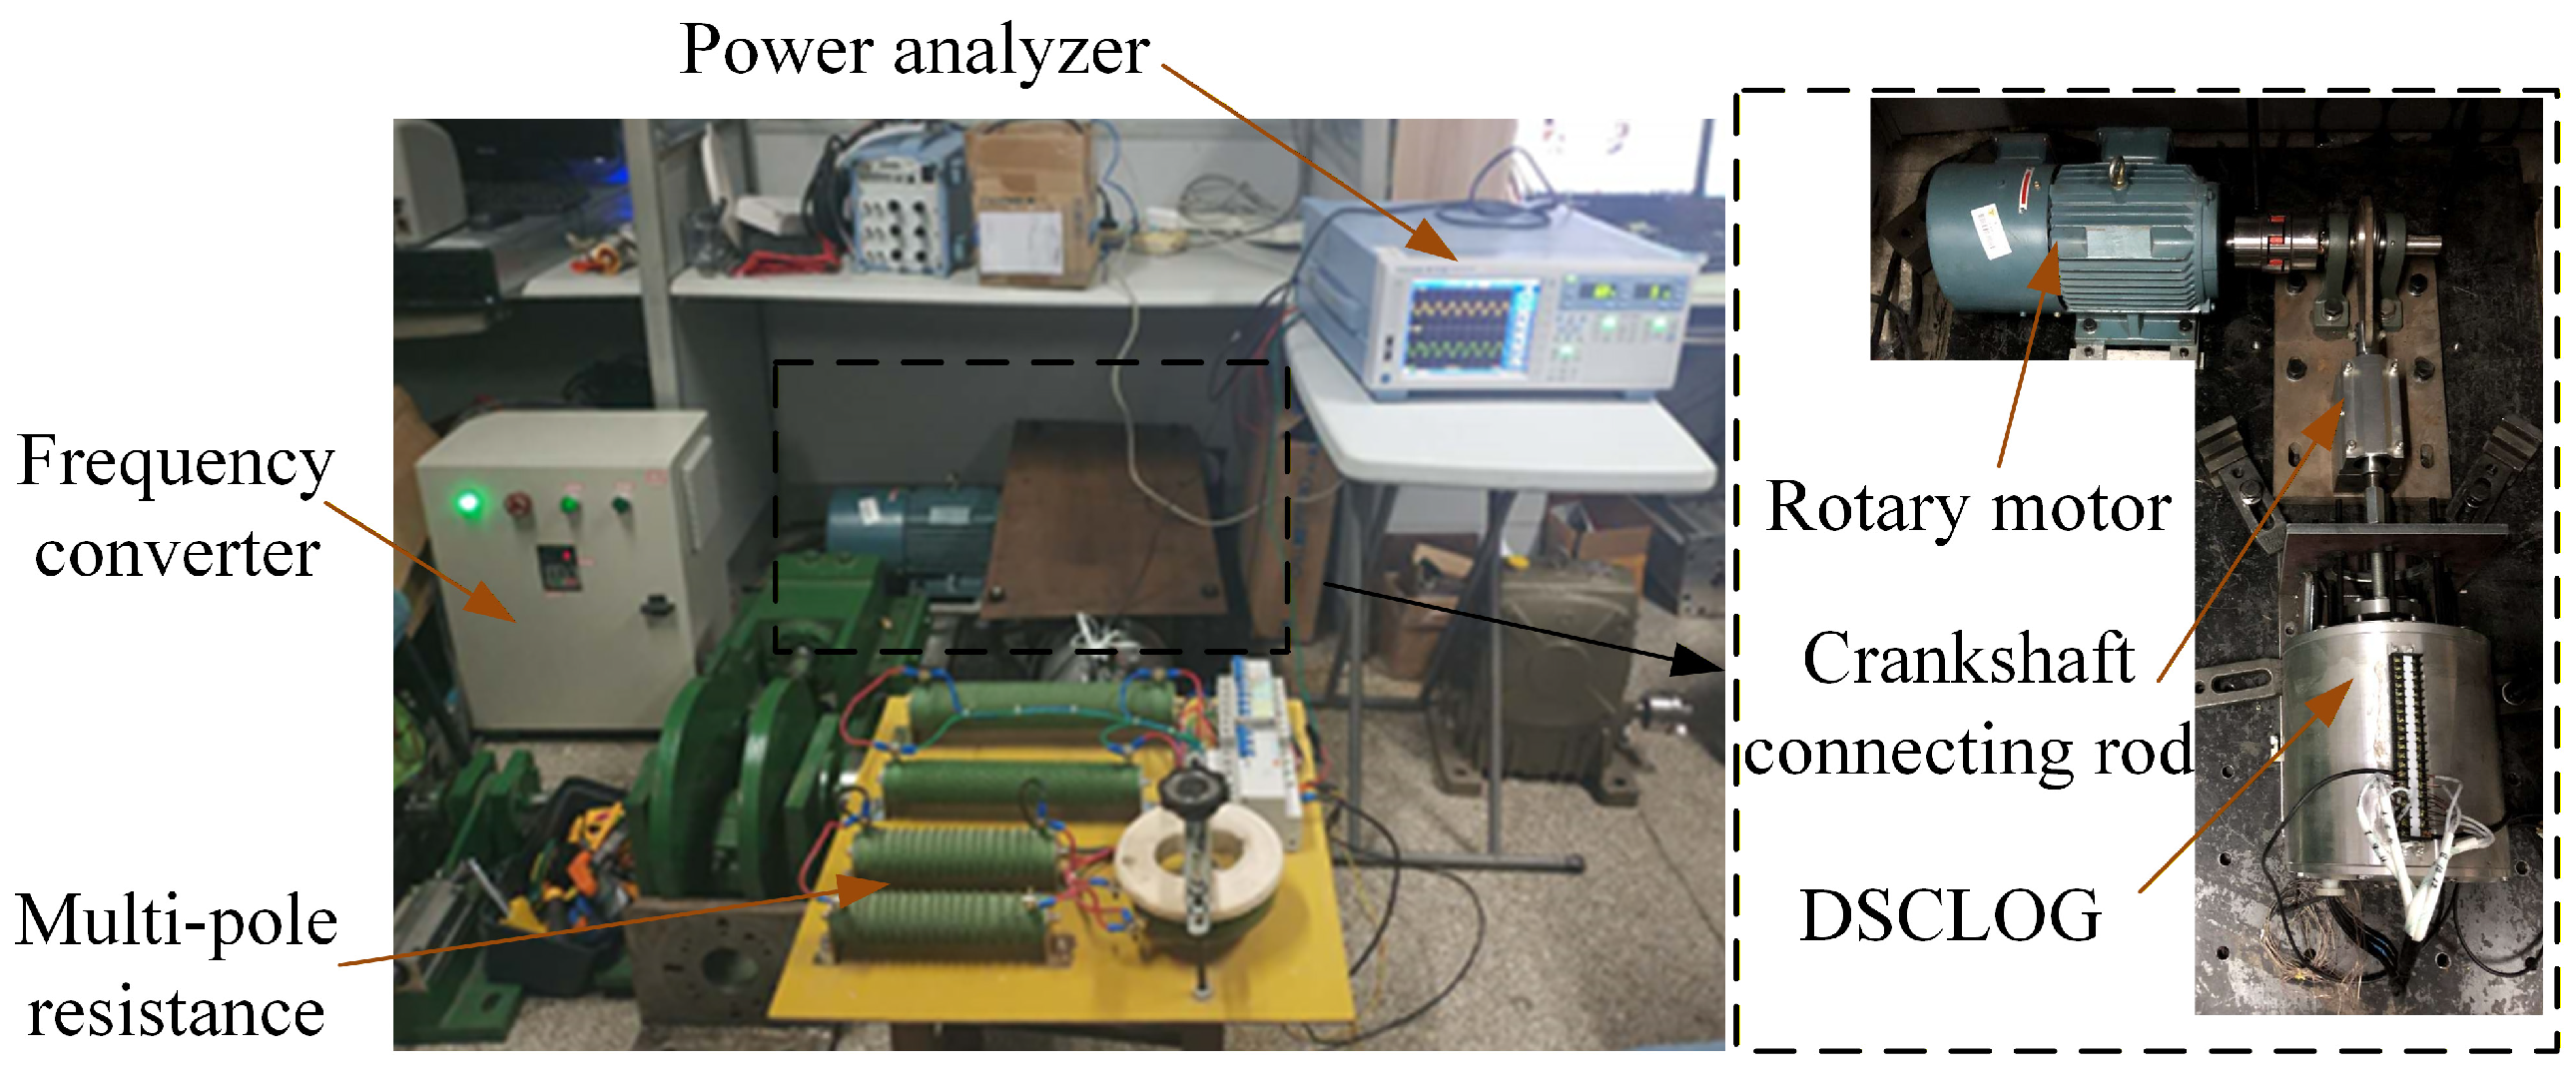
The experimental platform for evaluating the Back-EMF and power characteristics of the DSTLOG is depicted in Figure 14. The drive system utilizes a YVF100L-2 (GAOKE motor; Jiangsu, China) variable-frequency induction motor coupled with a crank-connecting rod mechanism to convert rotary motion into rectilinear reciprocating motion with a fixed stroke of 20 mm and an adjustable frequency range of 0–20 Hz. The electrical load was emulated using a configurable multi-pole resistance module.
Electrical parameters were recorded using a Yokogawa WT1800 high-precision power analyzer (Yokogawa, Shanghai, China). To ensure measurement integrity under switching conditions, hardware-level Line and Frequency Filters were activated to suppress high-frequency noise while preserving fundamental and harmonic components. The Root Mean Square (RMS) values of the phase voltage (U) and current (I) were computed over an integral number of cycles, synchronized via a Phase-Locked Loop (PLL) according to:
U r m s = 1 T 0 T u ( t ) 2 d t
Simultaneously, peak values were captured by the instrument’s high-speed sampling subsystem, which identifies the maximum absolute instantaneous values within each observation window. All thermal-sensitive measurements were conducted within the sensor’s compensated temperature range (−10 °C to +40 °C) to eliminate the effects of thermal drift.
The detent force of the DSTLOG prototype was characterized using a precision-controlled linear motion test rig. A high-sensitivity BS1-type tension transducer (JIANGBAILI, Jiangsu, China) (C3 accuracy class) was employed, featuring a rated capacity of 100 kg and a combined error of ≤±0.030% RO, which accounts for nonlinearity, hysteresis, and repeatability. To ensure metrological traceability, the sensor was factory-calibrated using standard deadweights. Prior to each measurement sequence, shunt calibration and in situ zero-point adjustment were executed to compensate for the tare weight of the mechanical fixtures and ambient factors.
To enhance the signal-to-noise ratio (SNR), the transducer’s output (0–10 V) was captured via a digital oscilloscope equipped with an integrated 2.90 kHz hardware low-pass filter to mitigate high-frequency electromagnetic interference (EMI). The effective sampling rate was maintained at 500 Hz, yielding a spatial resolution of approximately 0.0014 mm per sample at the specified scanning speed. At this quasi-static velocity, the influence of dynamic inertial forces is negligible. To decouple the intrinsic detent force from direction-dependent friction, a bidirectional scanning strategy was implemented. The final detent force distribution was derived by spatially averaging the profiles from 20 complete reciprocal cycles:
F c o g ( x ) = F u p ( x ) + F d o w n ( x ) 2
where Fup and Fdown represent the measured force during the upward and downward strokes, respectively.

6.1. No-Load Experiment Analysis

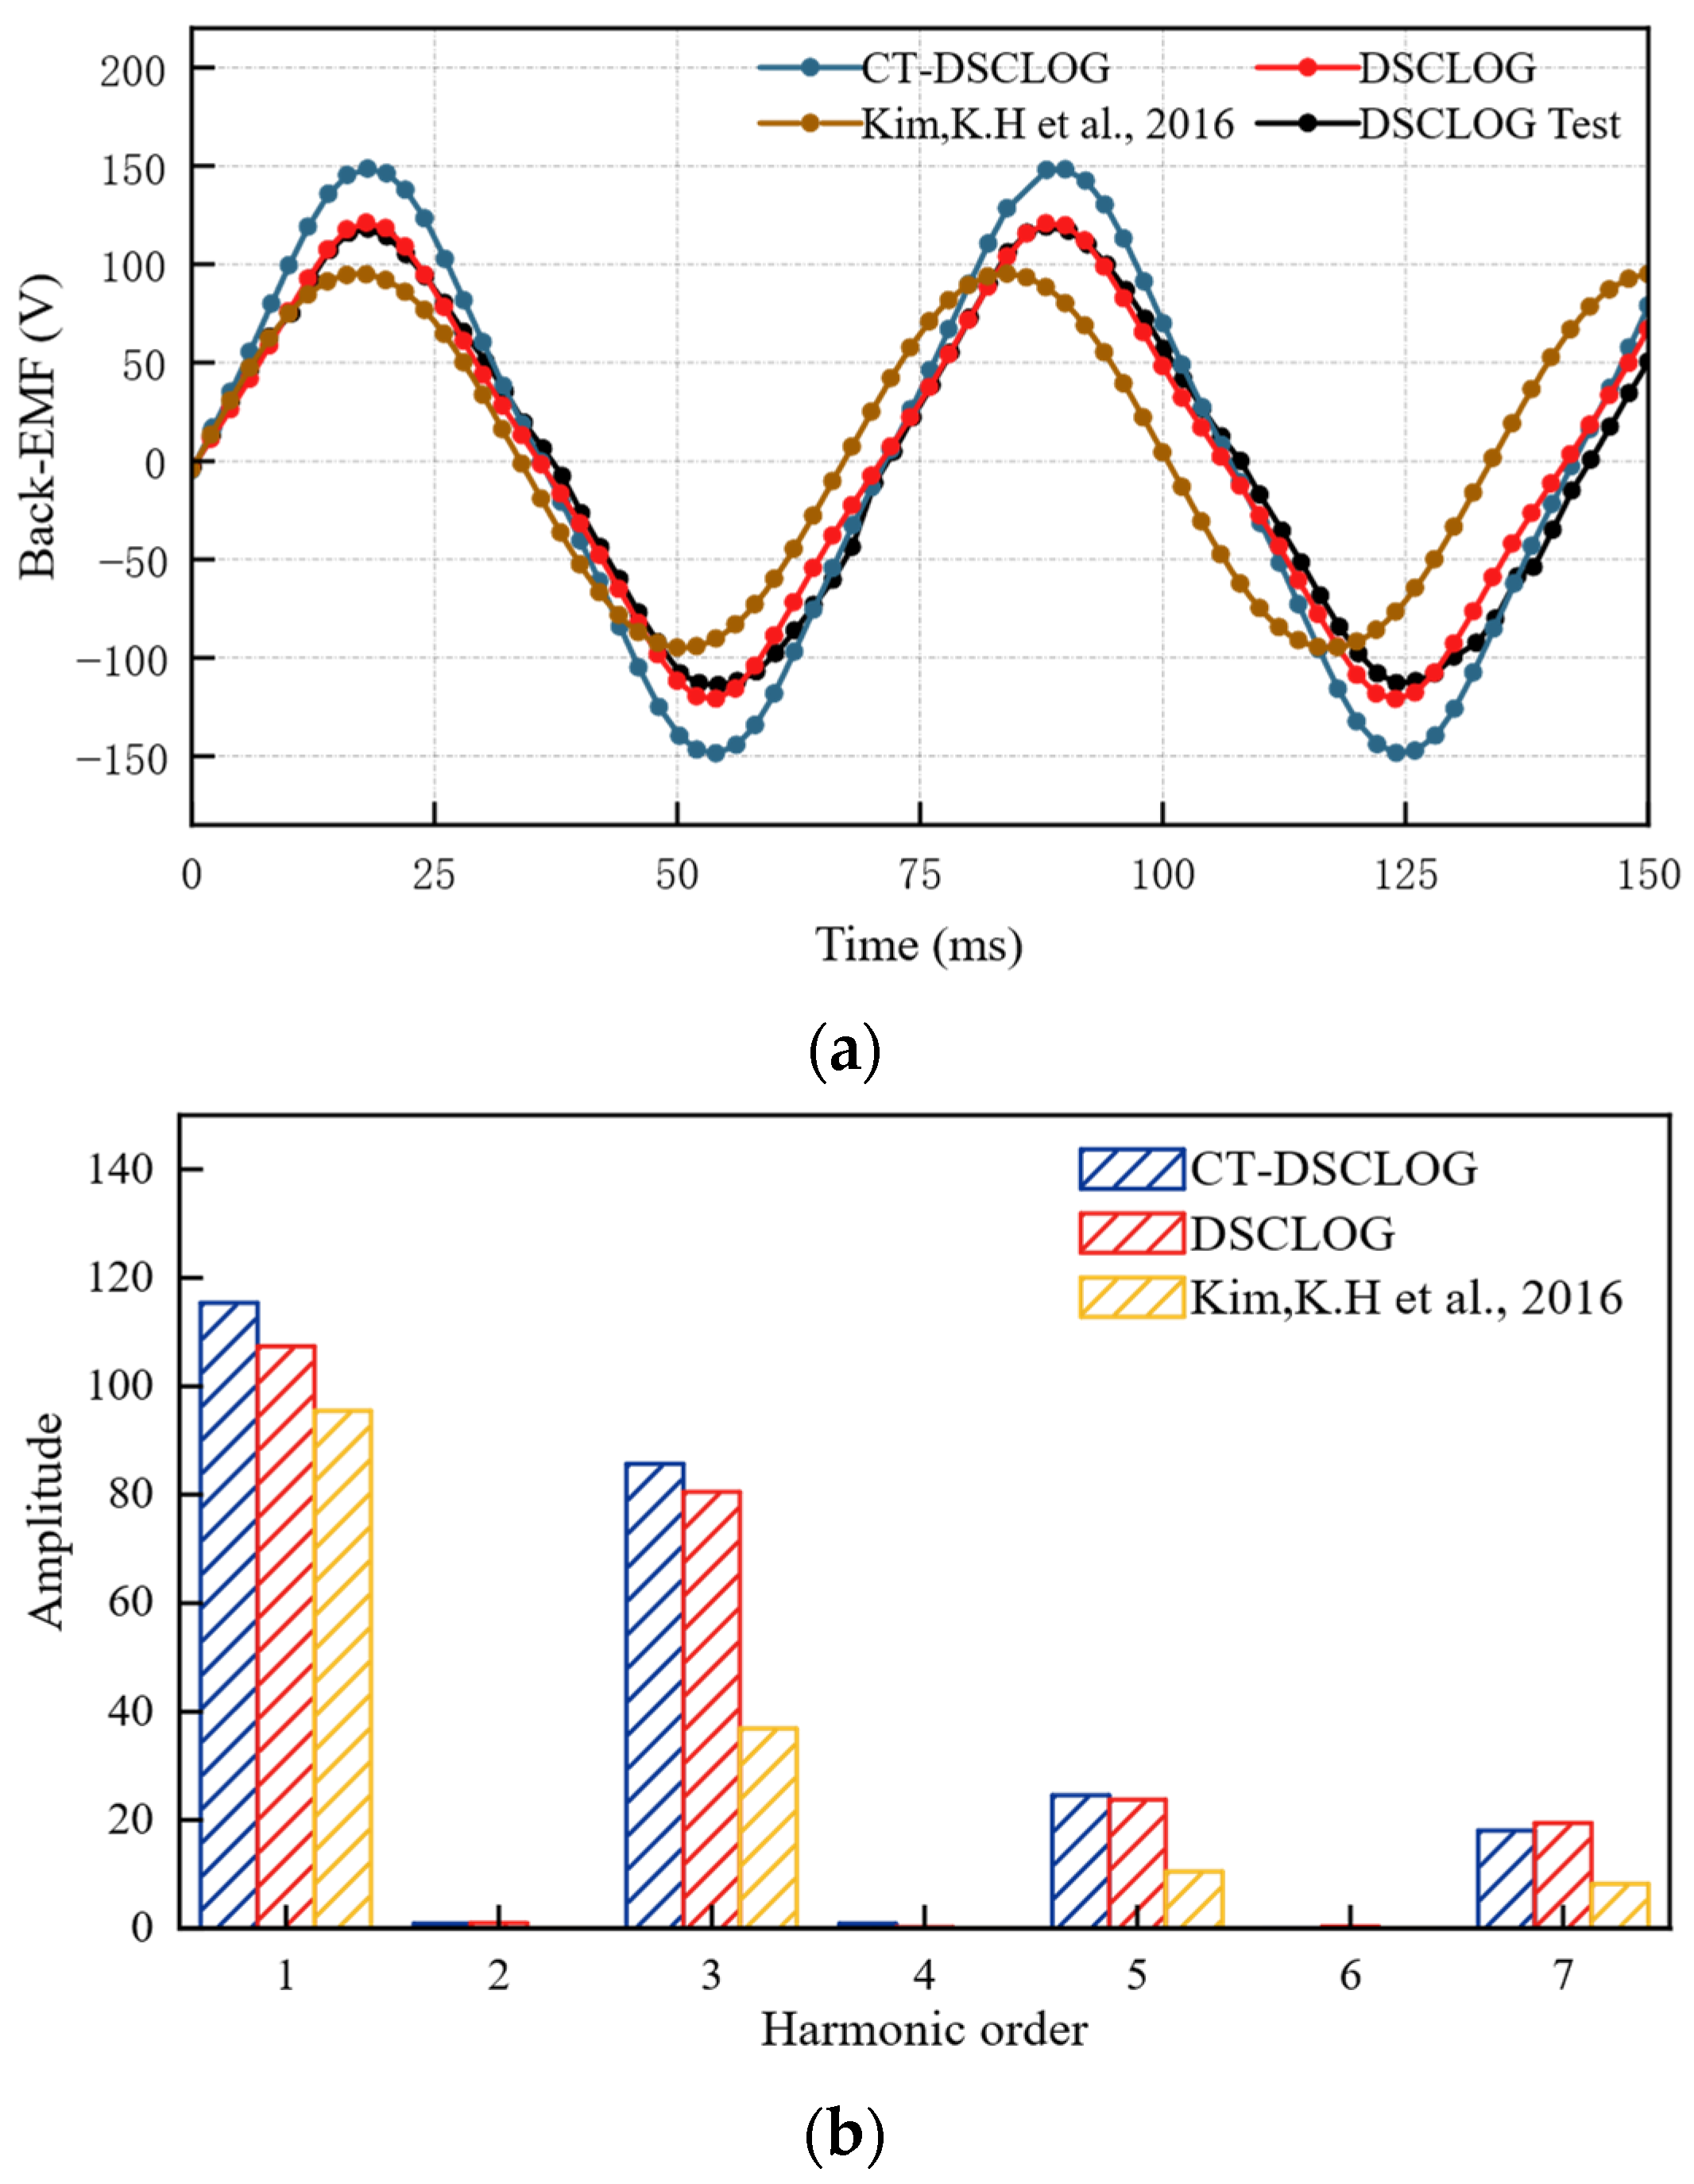
Figure 15 presents a comparative analysis of the no-load Back-EMF waveforms and their corresponding harmonic spectra for the three investigated structures at a mover velocity of 0.942 m/s. As illustrated in Figure 15a, the Back-EMF distribution of all designs exhibits a high degree of sinusoidal. The traditional DSCLOG and the Ref. [18] machine achieve peak voltages of 122 V and 95.1 V, respectively, whereas the improved CT-DSCLOG manifests a significantly augmented peak value of 148.7 V. This performance enhancement is primarily ascertained by the S-N-N-S PM array, which uses a repulsion-induced flux squeezing mechanism to maximize the air gap magnetic flux density. And a phase discrepancy is observed between the proposed designs and Ref. [18]. This phenomenon arises because the effective magnetic center of single N-pole structure of Ref. [18] is shifted compared to the proposed linear machine. Consequently, while the CT-DSCLOG synchronizes its maximum magnetic flux gradient with the peak mover velocity at the stroke midpoint, the Ref. [18] machine experiences a spatial lag that diminishes its flux interaction efficiency. These findings demonstrate that the optimized S-N-N-S PM arrangement not only amplifies the voltage magnitude through flux concentration but also fundamentally aligns the electromechanical phase characteristics with the reciprocating motion to maximize conversion efficiency. In addition, the harmonic analysis in Figure 15b further corroborates this topological advantage, the CT-DSCLOG yields the largest fundamental amplitude, representing a 57.9% increase over the Ref. [18] configuration. Although the simplified single-pole structure of Ref. [18] effectively suppresses higher-order components, it results in a substantial reduction in power density. Meanwhile, to rigorously validate the electromagnetic model, the simulation was calibrated against experimental measurements using the traditional DSCLOG structure. The results demonstrate that the measured Back-EMF deviates from the FEA predictions by less than 3%, thereby establishing a high-fidelity benchmark and confirming the metrological accuracy of the simulation platform. Building upon this validated foundation, the performance of the improved CT-DSCLOG structure was subsequently evaluated through a comparative FEA study. This ensures that the predicted enhancements in the CT-DSCLOG are grounded on a reliable and experimentally verified numerical basis.
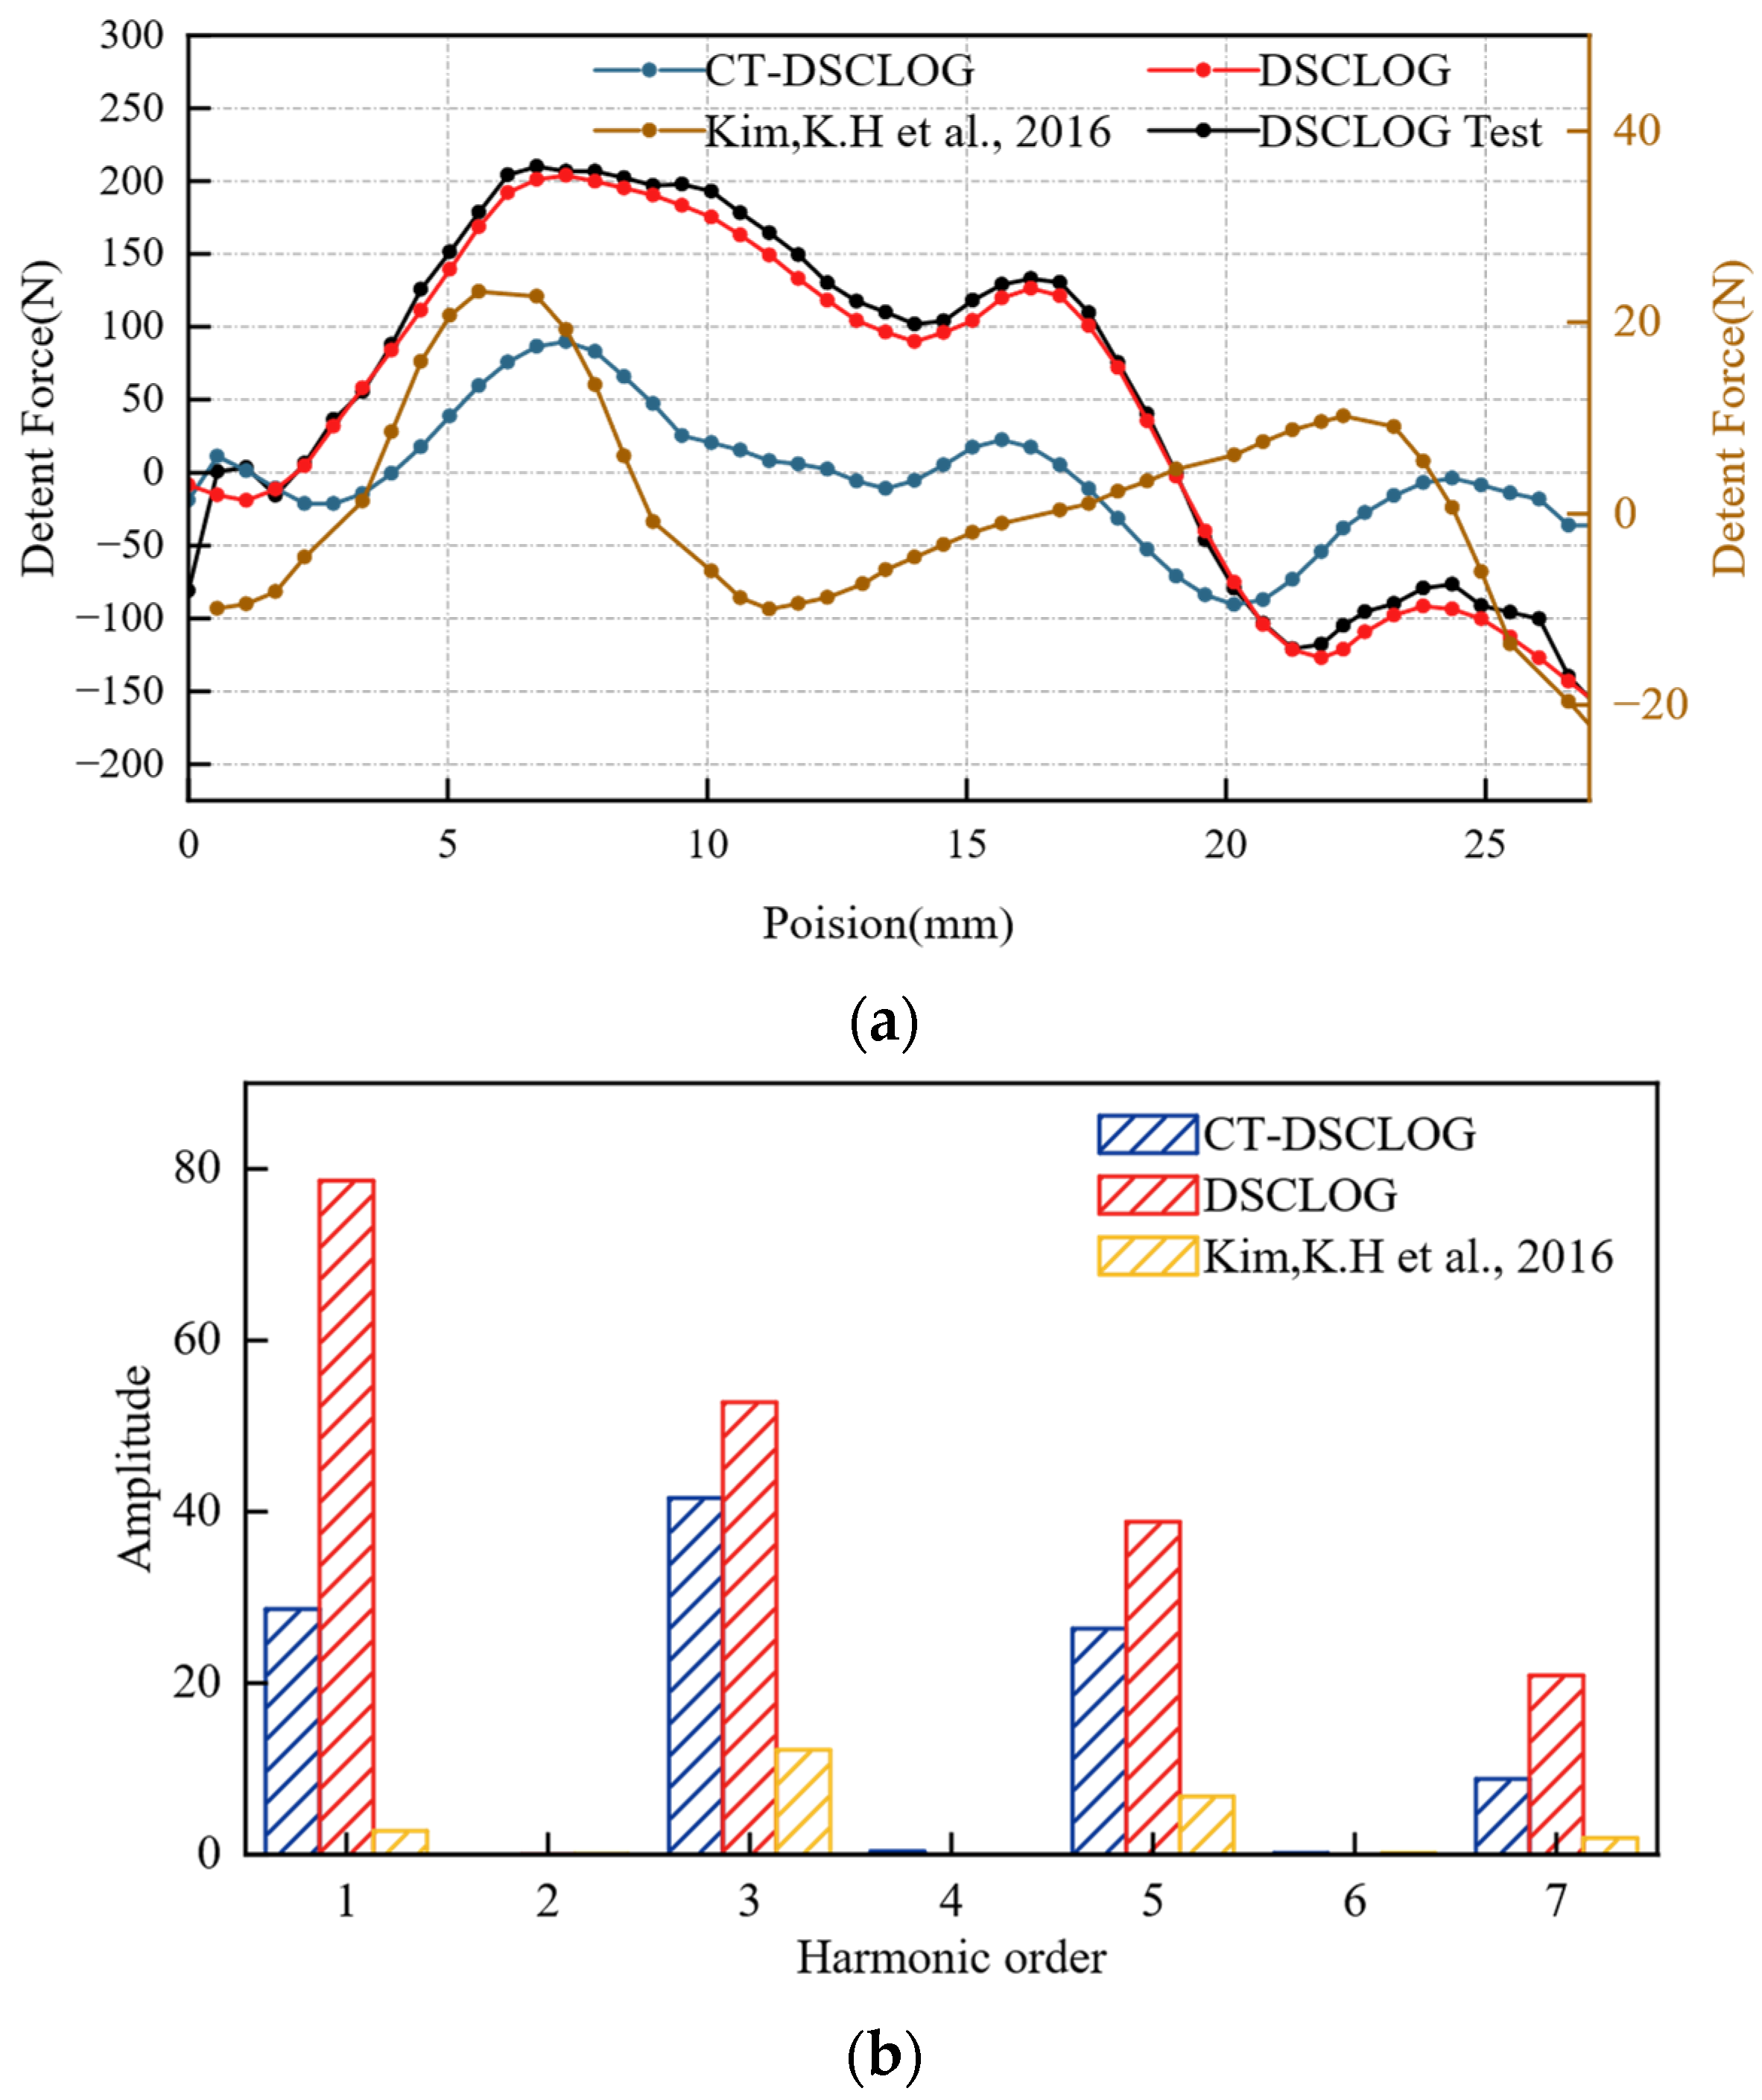
The detent force characteristics of the three different linear generators are compared in Figure 16. As shown in Figure 16a, the maximum detent force of the proposed improved structure reduces from 201.91 N to 89.93 N, compared with the traditional DSCLOG. This is attributed to the curved shape of the pole shoe. This geometry nearly linearizes the air gap reluctance variation, preventing the abrupt magnetic attraction changes typically seen in straight-pole designs. Conversely, the Ref. [18] machine manifests the lowest detent force magnitude among the evaluated structures, the maximum detent force is about 23.19 N, and its single-pole configuration yields a significantly lower air gap magnetic energy density compared to the flux-concentrated arrays. Since the detent force is proportional to the spatial derivative of the magnetic energy, the inherently weaker field of Ref. [18] minimizes the total energy fluctuation during the mover’s translation.
The corresponding harmonic spectra is shown in Figure 16b; the CT-DSCLOG achieves a remarkable suppression of the fundamental detent component, reducing its amplitude from 80 N to approximately 30 N. This reduction demonstrates the superior performance of the curved shape pole shoe in mitigating fundamental reluctance fluctuations. Specifically, the intense 3rd and 5th harmonics observed in the traditional DSCLOG arising from the magnetic field redistribution at the S-N-N-S polar interfaces are nearly eliminated in the CT-DSCLOG configuration. This phenomenon indicates that the optimized curved shape geometry functions as a spatial low-pass filter, effectively decoupling the high-frequency electromagnetic force components generated by the interaction between the permanent magnet edges and the stator slotting effects. Although the Ref. [18] machine manifests the smallest detent force, it suffers from a large reduction in induced voltage capability. In contrast, the proposed CT-DSCLOG maintains a high output voltage while achieving a 55.4% reduction in peak detent force, thereby establishing an optimal physical balance between high power density and superior operational stability.

6.2. Load Experiment Analysis

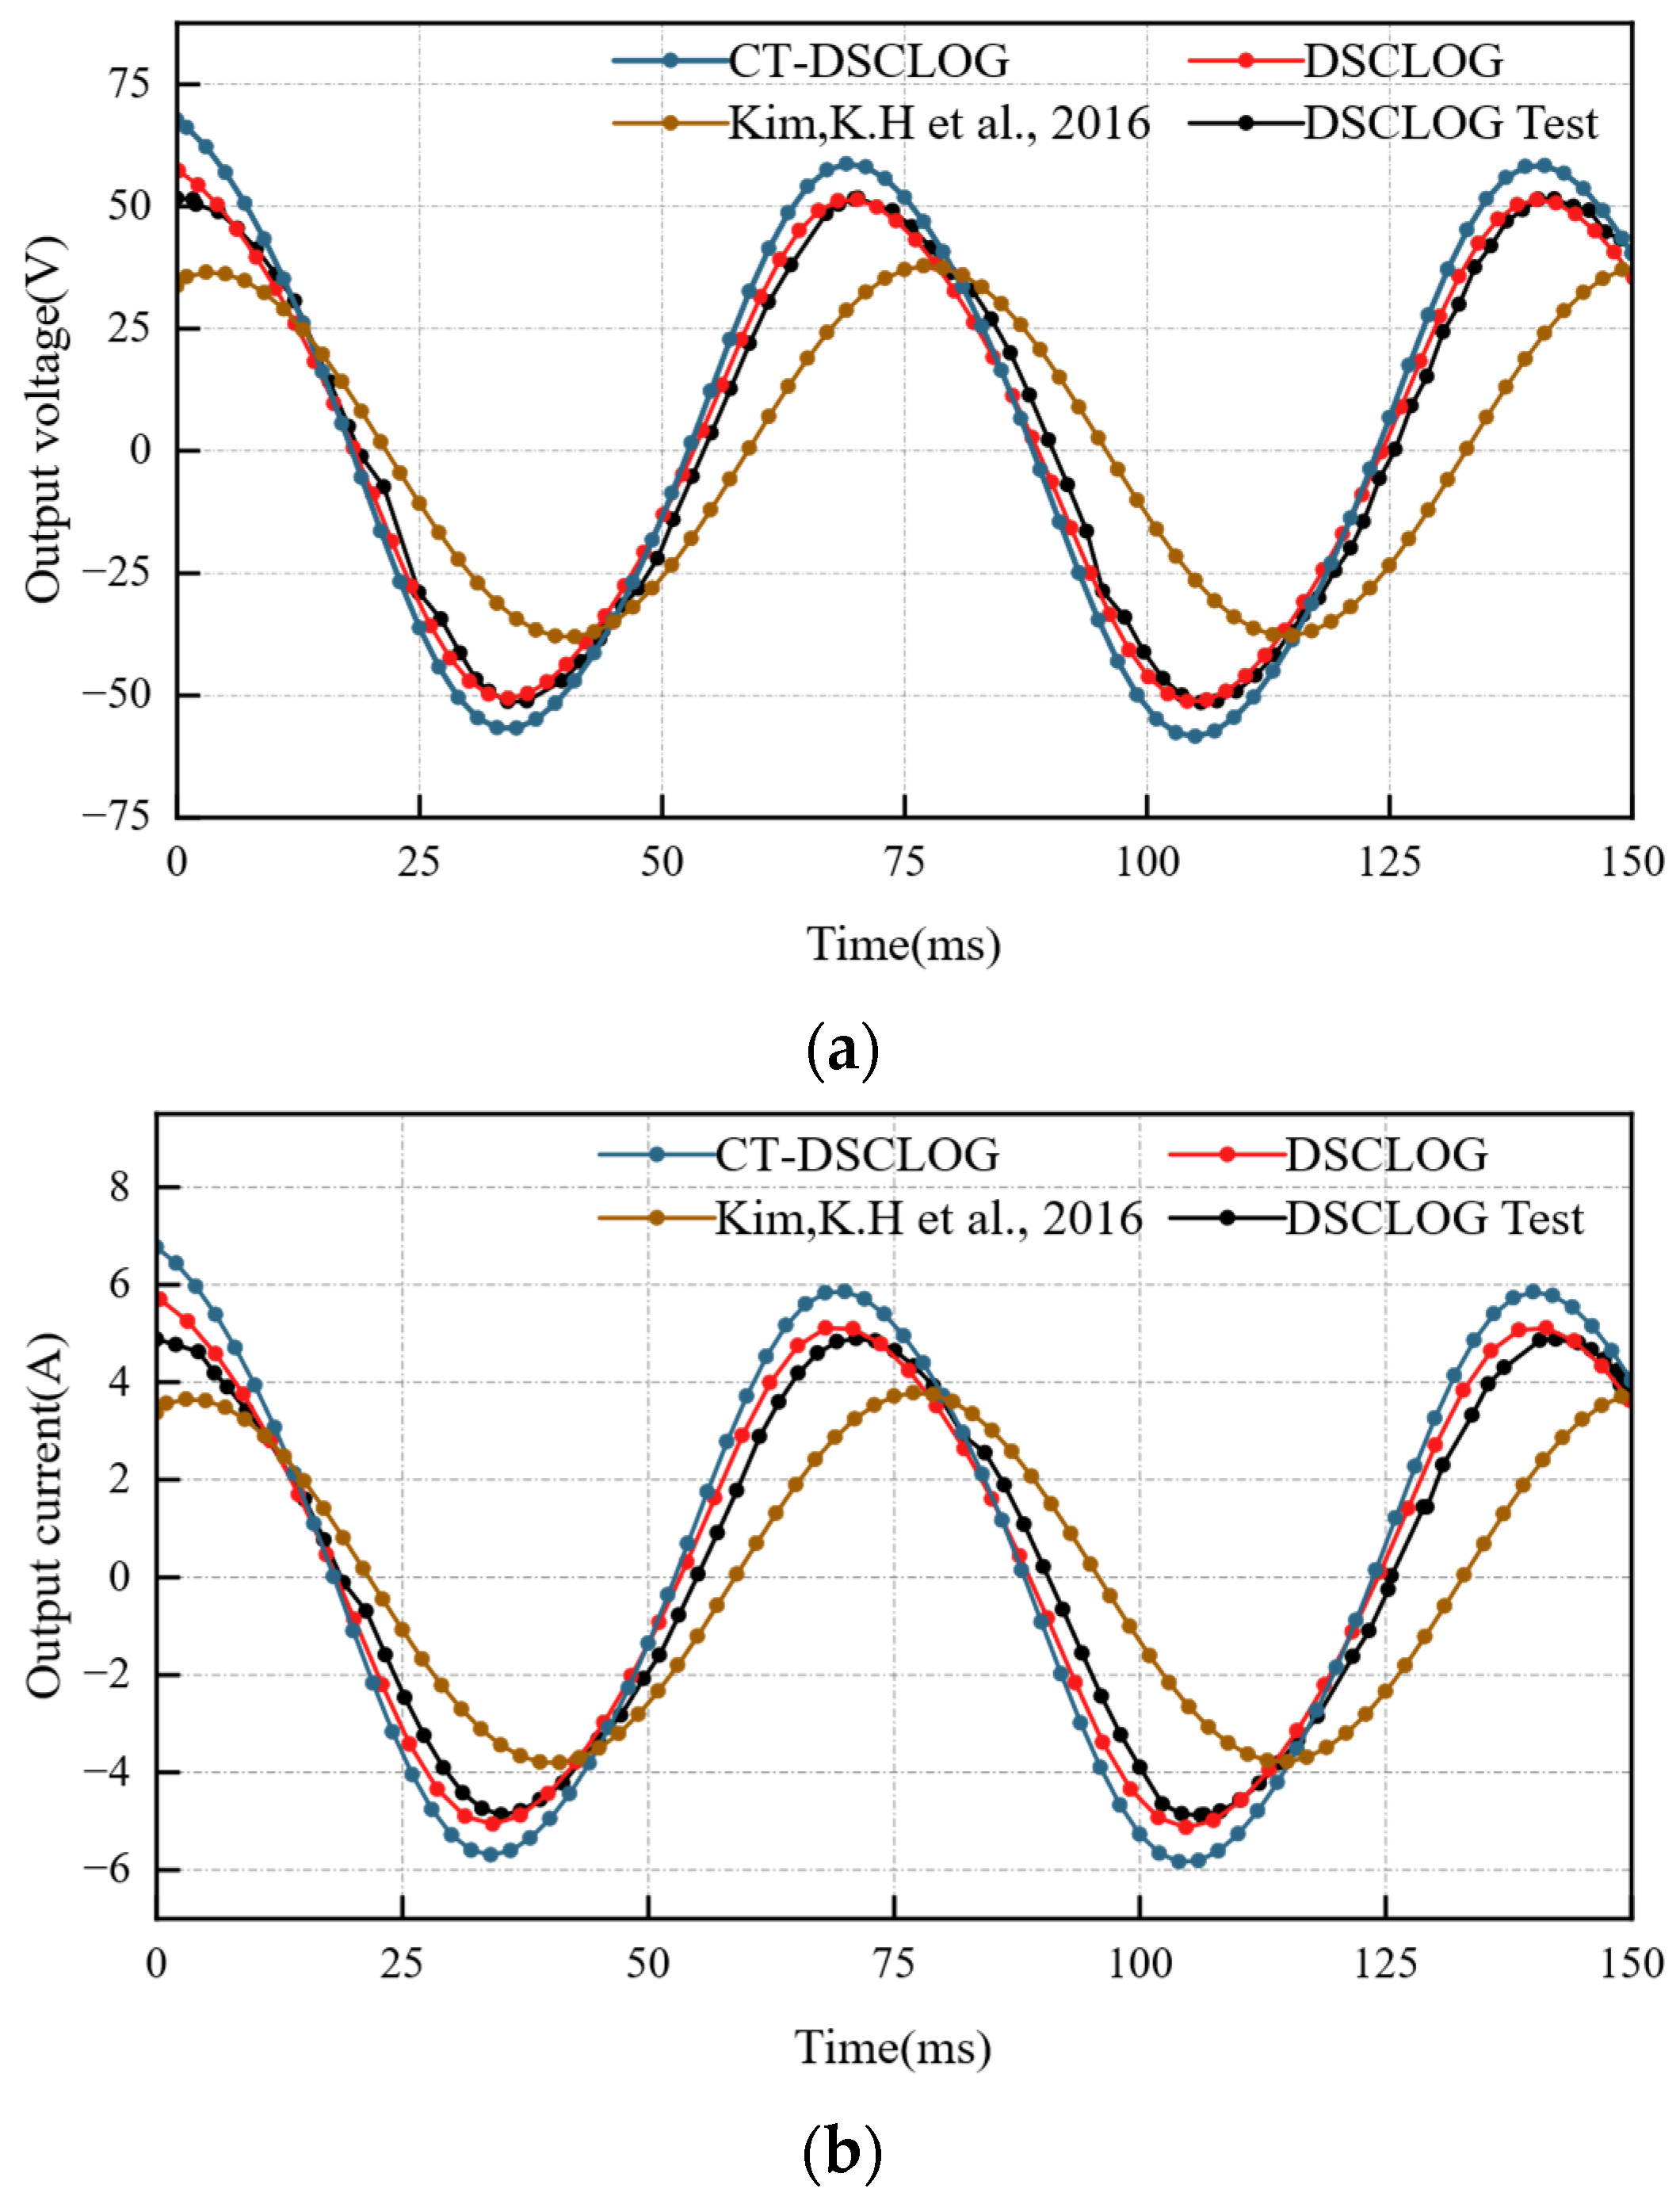
Figure 17 presents an analysis of the simulated and experimental output characteristics for the three generators under a consistent load of 10 Ω. As illustrated in Figure 17a, the peak output voltages for the CT-DSCLOG, DSCLOG, and Ref. [18] machines are 66.1 V, 57.26 V, and 33.72 V, respectively. Notably, the Ref. [18] waveform manifests a significant phase lag compared to the other two linear machines. This phase discrepancy is primarily attributed to the armature reaction intensified by the single-pole topology of the Ref. [18] machine. Due to its relatively low air gap magnetic energy density, the Ref. [18] machine possesses a soft magnetic circuit with limited magnetic stiffness. Consequently, under the magnetomotive force generated by the load current, the main magnetic field undergoes severe cross-magnetizing distortion and spatial retardation. This interaction induces a displacement of the resultant magnetic axis, leading to the observed spatial phase shift in the output voltage. Figure 17b gives the corresponding output current, and the peak value for the CT-DSCLOG, DSCLOG, and Ref. [18] machines are 6.76 A, 5.7 A, and 3.64 A, respectively, and since the three linear generators are connected to purely resistive loads, the phases of the output current and the output voltage are the same.
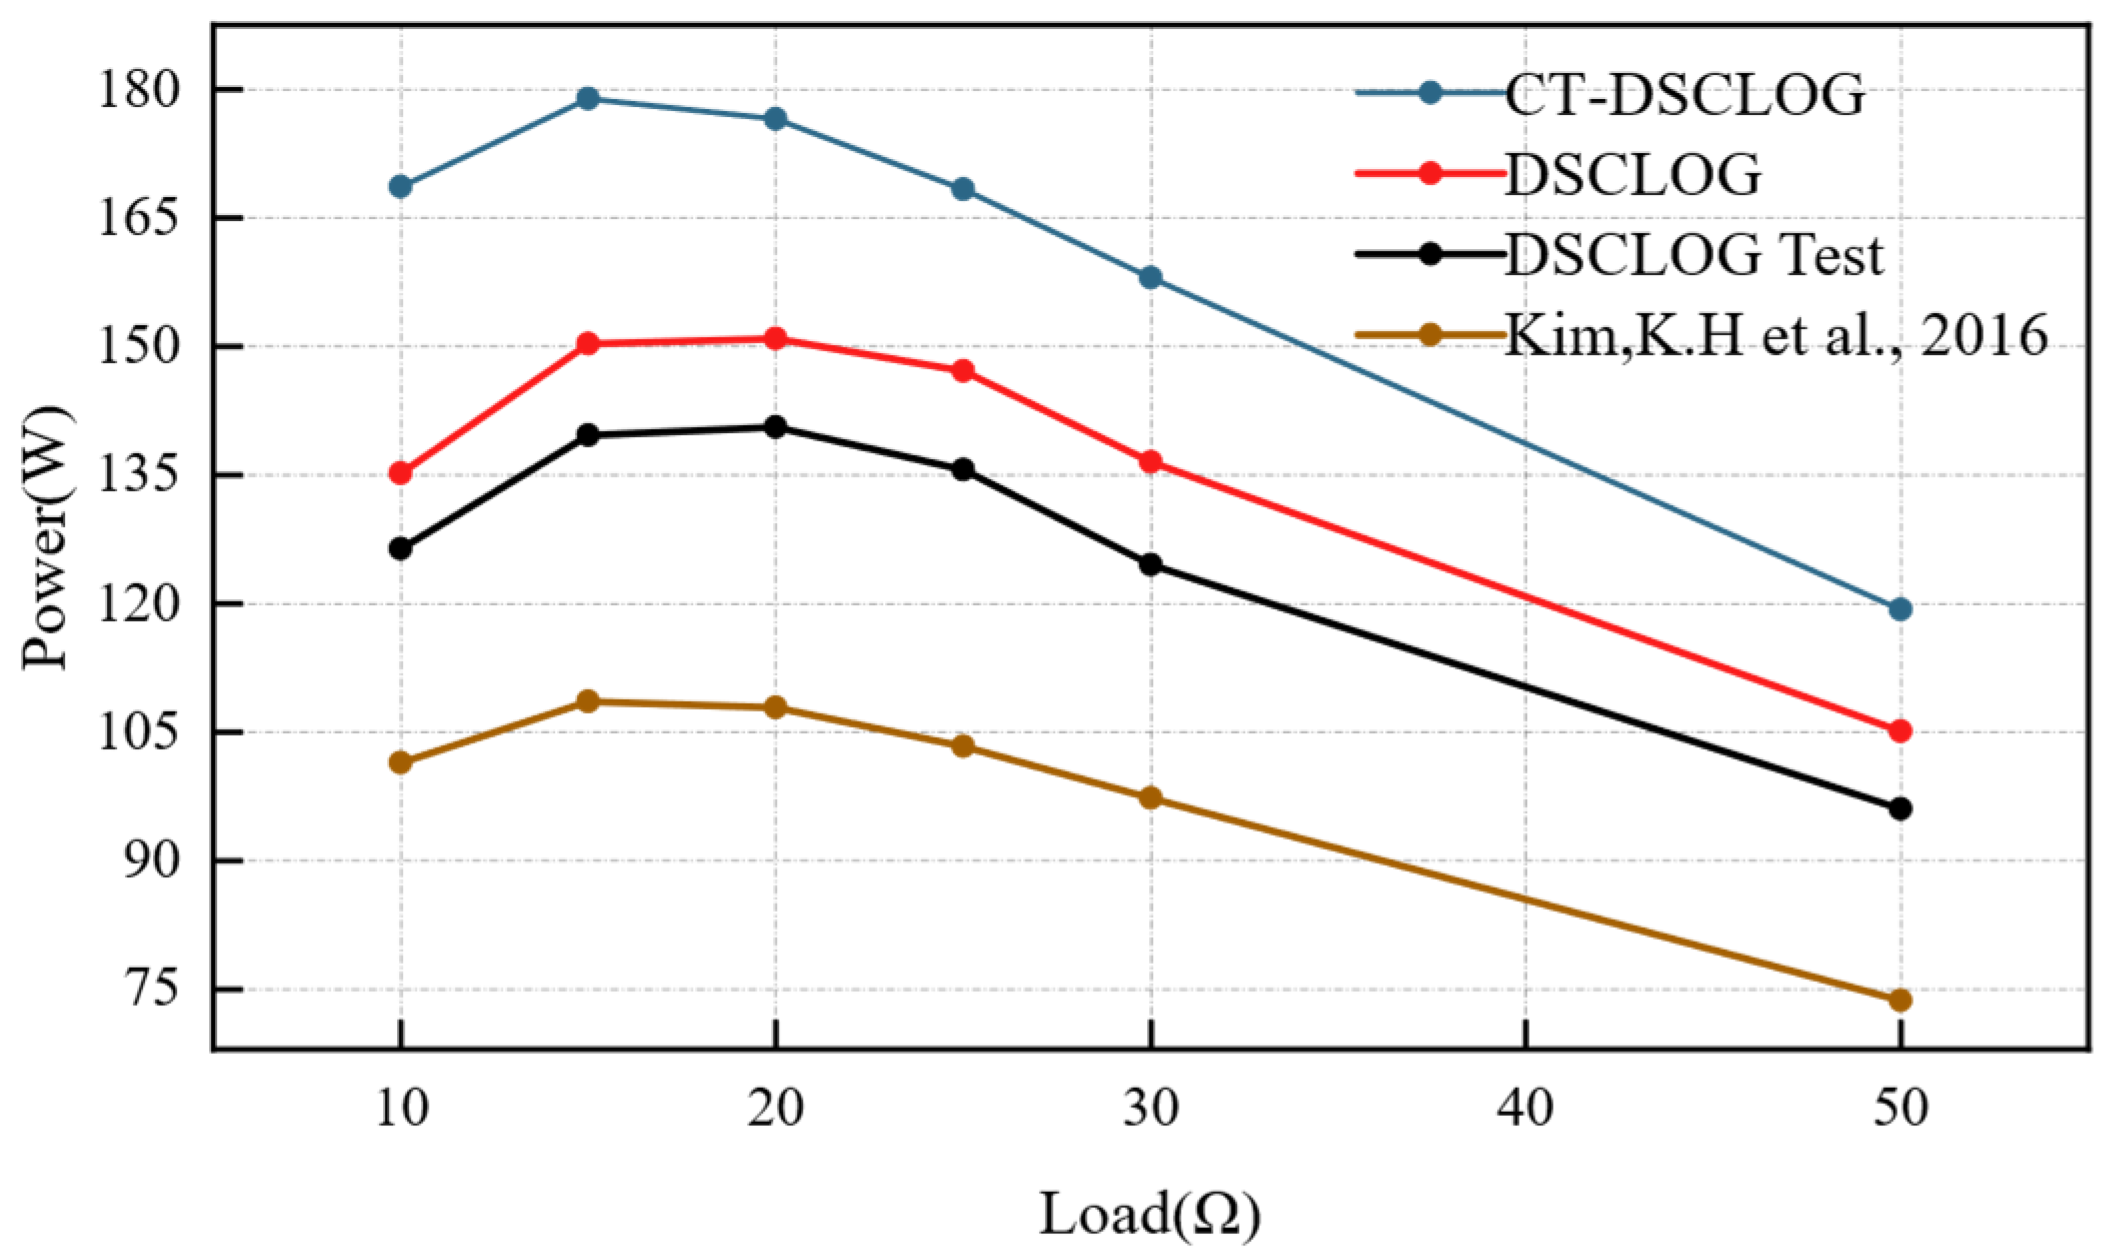
Figure 18 illustrates the variation in output power for the three linear generators across a range of load resistances. As the resistance increases, all generators exhibit a characteristic nonlinear power distribution initially rising to a peak before gradually declining. This trend is consistent with the fundamental theory of impedance matching, where maximum power transfer occurs when the external load resistance approaches the internal impedance of the generator. Notably, the CT-DSCLOG peak power is about 178.9 W, which demonstrates a substantial enhancement in power delivery compared to both the traditional DSCLOG and the Ref. [18] machine.
A comprehensive performance comparison is summarized in Table 7. The CT-DSCLOG achieves the highest efficiency of 84.45%, outperforming the DSCLOG and Ref. [18]. Although the copper loss of the CT-DSCLO is higher due to its superior current delivery, the proportional increase in output power significantly outweighs the rise in total losses. Furthermore, while the PM usage in the CT-DSCLOG increases by only 9.2% compared to the traditional design, it yields a substantial 23.7% enhancement in power density. This high material utilization rate is primarily attributed to the S-N-N-S flux-concentration effect, which maximizes the air gap magnetic energy density without causing excessive iron losses. These results confirm that the proposed topological method has good electromagnetic performance.

7. Conclusions

In this paper, a curved teeth double stator tubular linear oscillating generator (CT-DSCLOG) topology was proposed and investigated. A hybrid optimized method combining an equivalent magnetic circuit and the Taguchi method is adopted to optimize the structure parameters of CT-DSCLOG. The conclusions are summarized as follows:
(1)
The proposed CT-DSCLOG achieves an optimal balance between high power density and low detent force without complex auxiliary structures. This structure renders the generator ideal for vibration energy harvesting in space-constrained or weight-sensitive applications. To support the practical implementation of this design, the precision of the underlying modeling approach was rigorously validated. By incorporating Schwarz–Christoffel (S-C) mapping into the 2D MEC model, the magnetic field of the irregular air gap region is accurately calculated. In the comparison of the calculated results of the air gap magnetic flux density, the maximum deviation in the peak magnetic flux density was limited to less than 2.6%. The errors in the comparison of the results of detent force and Back-EMF are all less than 5%. The high degree of consistency between the MEC analytical results and FEA results validates the precision of the proposed modeling approach for the irregular air gap region.
(2)
A multi-objective optimization strategy was successfully implemented. The variance-based sensitivity analysis quantitatively identified structure parameters, effectively reducing the dimensions of sample space. Subsequently, the Taguchi method combined with 3D-FEA was employed to achieve a robust multi-objective optimization. This methodology significantly improves design efficiency and accuracy of the optimization results.
(3)
A quantitative electromagnetic performance comparison of two DSCLOG and a linear machine of Ref. [18] is conducted using FEA and experiments. The results show that CT-DSCLOG achieves a 21.8% and 57.9% increase in Back-EMF compared to traditional DSCLOG and Ref. [18] machine, respectively, leading to a 54.5% reduction in detent force compared to traditional DSCLOG. Under the same load conditions, the output voltage of CT-DSCLOG is 15% and 96.2% higher than that of DSCLOG and the machine of Ref. [18], respectively. The output current is increased by 18.59% and 85.7% compared with DSCLOG and the machine of Ref. [18], respectively. The efficiency of CT-DSCLOG is 84.45%. Furthermore, compared with traditional designs, the usage of PM in CT-DSCLOG has only increased by 9.2%, but the power density has significantly improved by 23.7%.
Overall, the proposed linear generator has good electromagnetic performance, but several challenges need to be addressed in future work: (1) The current modeling approach, combining MEC with S-C mapping, is primarily restricted to two-dimensional (2-D) domains. Consequently, it cannot fully capture 3D parasitic effects such as transverse flux leakage. Furthermore, the reliance on Hague’s solutions requires the assumption of linear magnetic properties. Future work will focus on developing quasi-3D analytical models and integrating iterative algorithms to account for local magnetic saturation under heavy load conditions. (2) While this study focuses on magnetic field optimization, the impact of temperature rise on the magnetic properties of PMs and winding resistance is significant during continuous high-frequency oscillation. A multi-physics coupling analysis will be conducted to evaluate the thermal stability and long-term reliability of the CT-DSCLOG. (3) The implementation of curved teeth increases the sensitivity of the detent force to assembly precision. Future work will involve a probabilistic robustness analysis to evaluate the impact of manufacturing tolerances and eccentricities on machine performance, thereby ensuring the viability of the design for large-scale industrial applications.


Author Contributions

Methodology, A.L.; Software, A.L. and Y.S. (Yuxin Shen); Validation, A.L. and Y.S. (Yuxin Shen); Formal analysis, Y.S. (Yuxin Shen); Investigation, A.L.; Data curation, Y.S. (Yuxin Shen); Writing—original draft, A.L. and Y.S. (Yuxin Shen); Writing—review & editing, A.L. and R.G.; Supervision, R.G., X.Z. and Y.S. (Yang Song); Project administration, R.G., X.Z. and Y.S. (Yang Song); Funding acquisition, R.G., X.Z. and Y.S. (Yang Song). All authors have read and agreed to the published version of the manuscript.

Funding

This work was supported in part by the National Natural Science Foundation of China under Grant 62371032, in part by the R&D Program of Beijing Municipal Education Commission under Grant KM202310016005 and KM202410016009, and in part by BUCEA Young Scholar Research Capability Improvement Plan under Grant X21081.

Institutional Review Board Statement

Not applicable.

Informed Consent Statement

Not applicable.

Data Availability Statement

The original contributions presented in the study are included in the article, further inquiries can be directed to the corresponding author.

Conflicts of Interest

The authors declare no conflict of interest.

References

  1. Zhou, S.; Wu, H.; Xiao, C. Technology review of free piston sterling linear generator system. Micromotors 2013, 46, 7–11. [Google Scholar]
  2. Zhao, M.; Zuo, S.; Wei, Y. Overview of structure and key problems for transverse flux permanent magnet linear machine. Proc. CSEE 2021, 44, 7806–7821. [Google Scholar]
  3. Boldea, I. Electric generators and motors: An overview. CES Trans. Electr. Mach. Syst. 2017, 1, 3–14. [Google Scholar] [CrossRef] [Scilit]
  4. Ion, C.P. A Comprehensive Overview of Single–Phase Self-Excited Induction Generators. IEEE Access 2020, 8, 197420–197430. [Google Scholar] [CrossRef] [Scilit]
  5. Guoxin, Z.; Decai, K.; Xiaolin, G. Performance difference study on permanent magnet synchronous motor based on soft magnetic composite material and silicon steel sheet. Trans. China Electrotech. Soc. 2018, 33, 75–81. [Google Scholar]
  6. Wang, S.; Liu, C.; Wang, Y. 6σ robust multidisciplinary design optimization method for permanent magnet motors with soft magnetic composite cores. Trans. China Electrotech. Soc. 2019, 34, 637–645. [Google Scholar]
  7. Sato, M. Verification of Variable Magnetic Flux in Motor with Magnetic Composite Materials Inserted into the Rotor. IEEE Access 2025, 13, 28979–28987. [Google Scholar] [CrossRef] [Scilit]
  8. Chu, S.; Liang, D.; Jia, S.; Liang, Y. Research and Analysis on Design Characteristics of High-Speed Permanent Magnet Claw Pole Motor with Soft Magnetic Composite Cores for Wide Temperature Range. IEEE Trans. Ind. Appl. 2022, 58, 7201–7213. [Google Scholar] [CrossRef] [Scilit]
  9. Song, Y.; Wu, X.; Gao, W. Application for Optimization of New Soft Magnetic Material Motor by Taguchi Method. CES Trans. Electr. Mach. Syst. 2022, 6, 261–268. [Google Scholar] [CrossRef] [Scilit]
  10. Yanliang, X.; Bo, C.; Wenjing, Z. Disk transverse flux permanent magnet brushless motor based on soft magnetic composite-Si steel core. Trans. China Electrotech. Soc. 2020, 35, 983–990. [Google Scholar]
  11. Wang, L.; Zhang, H.; Hu, A.; Li, Y.; Pei, R. Research on Torque Performance of a Traction Motor by Using Fe-Co-V Soft Magnetic Alloys. IEEE Trans. Magn. 2022, 58, 8203206. [Google Scholar] [CrossRef] [Scilit]
  12. Wei, X.; Xiang, L.; Kaiju, L. Overview of linear oscillatory machines: Topology and application. Trans. China Electrotech. Soc. 2022, 37, 5377–5401. [Google Scholar]
  13. Zhao, L.; Lu, Q. A Novel Tubular Partitioned Stator Flux-Reversal Permanent Magnet Linear Machine for Direct-Drive Wave Energy Generation. IEEE Trans. Magn. 2019, 55, 7502707. [Google Scholar] [CrossRef] [Scilit]
  14. Guo, R.; Bian, Y.; Guo, B.; Zhang, F.; Wang, W. Design and Analysis of an Improved Tubular Permanent Magnet Linear Machine with a T-Type Magnet Array. IEEE Trans. Transp. Electrif. 2025, 11, 2814–2828. [Google Scholar] [CrossRef] [Scilit]
  15. Zhang, H.; Jin, L.; Yu, H.; Xu, Z.; Wei, X.; Leng, J. Detent Force Reduction Design for the C-Core Single-Phase Permanent Magnet Linear Oscillation Actuator. IEEE Trans. Ind. Appl. 2023, 59, 1577–1587. [Google Scholar] [CrossRef] [Scilit]
  16. Guo, R.; Yu, H.; Guo, B. Analysis of a Tubular Linear Permanent Magnet Oscillator with Auxiliary Teeth Configuration for Energy Conversion System. IEEE Trans. Transp. Electrif. 2020, 6, 602–611. [Google Scholar] [CrossRef] [Scilit]
  17. Zhang, H.; Xu, Z.; Shen, Z. Comparative Analysis of Electromagnetic Characteristics of Permanent Magnet Linear Oscillating Actuators with different Laminated Methods. In Proceedings of the 2024 IEEE 21st Biennial Conference on Electromagnetic Field Computation (CEFC), Jeju, Republic of Korea, 2–5 June 2024; pp. 1–2. [Google Scholar]
  18. Kim, K.H.; Park, H.I.; Jeong, S.S.; Jang, S.M.; Choi, J.Y. Comparison of Characteristics of Permanent-Magnet Linear Oscillating Actuator According to Laminated Method of Stator Core. IEEE Trans. Appl. Supercond. 2016, 4, 5201704. [Google Scholar] [CrossRef] [Scilit]
  19. Shao, Y.; Wen, H.; Long, D.; Shuai, Z. Design and Optimization of a Single-Phase Tubular Linear Oscillating Permanent Magnet Machine for Stirling Generator. IEEE Trans. Ind. Appl. 2024, 60, 6158–6169. [Google Scholar] [CrossRef] [Scilit]
  20. Jin, L.; Mao, Y.; Wang, X. Optimization-based maximum-torque fault-tolerant control of dual three-phase PMSM drives under open-phase fault. IEEE Trans. Power Electron. 2022, 38, 3653–3663. [Google Scholar] [CrossRef] [Scilit]
  21. Chen, L.; Li, L. Development of the linear motor and its key technologies for compressors. Proc. CSEE 2013, 33, 52–68. [Google Scholar]
  22. Zhu, Z.Q.; Ng, K.; Howe, D. Design and analysis of high-speed brushless permanent magnet motors. In Proceedings of the 1997 Eighth International Conference on Electrical Machines and Drives (Conf. Publ. No. 444), Cambridge, UK, 1–3 September 1997; pp. 381–385. [Google Scholar]
  23. Xie, B.C.; Zhang, Y.; Xu, Z.Y. Review on multidisciplinary optimization key technology of electrical machine based on surrogate models. Trans. China Electrotech. Soc. 2022, 37, 5117–5143. [Google Scholar]
  24. Liu, F.; Wang, X.; Xing, Z.; Ren, J.; Li, X. Analysis and Research on No-Load Air Gap Magnetic Field and System Multi-objective Optimization of Interior PM Motor. IEEE Trans. Ind. Electron. 2022, 69, 10915–10925. [Google Scholar] [CrossRef] [Scilit]
  25. Wu, S.; Zhao, X.; Jiao, Z.; Luk, P.C.K.; Jiu, C. Multi-Objective Optimal Design of a Toroidally Wound Radial-Flux Halbach Permanent Magnet Array Limited Angle Torque Motor. IEEE Trans. Ind. Electron. 2017, 64, 2962–2971. [Google Scholar] [CrossRef] [Scilit]
  26. Pompermaier, C.; Haddad, K.F.J.; Zambonetti, A.; da Luz, M.V.F.; Boldea, I. Small linear PM oscillatory motor: Magnetic circuit modeling corrected by axisymmetric 2-D FEM and experimental characterization. IEEE Trans. Ind. Electron. 2012, 59, 1189–1196. [Google Scholar] [CrossRef] [Scilit]
  27. Ma, M.N.; Li, L.Y.; He, Z.; Chan, C.C. Influence of longitudinal end effects on electromagnetic performance of a permanent magnet slotless linear launcher. IEEE Trans. Plasma Sci. 2013, 43, 1161–1166. [Google Scholar] [CrossRef]
  28. Chen, Y.M.; Fan, S.Y.; Lu, W.S. Performance analysis of linear permanent-magnet motors with finite-element analysis. IEEE Trans. Magn. 2008, 44, 377–385. [Google Scholar] [CrossRef] [Scilit]
  29. Isfahani, A.H. Analytical framework for thrust enhancement in permanent-magnet (PM) linear synchronous motors with segmented PM poles. IEEE Trans. Magn. 2010, 46, 1116–1122. [Google Scholar] [CrossRef] [Scilit]
  30. Amara, Y.; Barakat, G. Analytical modeling of magnetic field in surface mounted permanent-magnet tubular linear machines. IEEE Trans. Magn. 2010, 46, 3870–3884. [Google Scholar] [CrossRef] [Scilit]
  31. Yan, L. Armature reaction field and inductance of coreless moving coil tubular linear machine. IEEE Trans. Ind. Appl. 2014, 61, 6956–6965. [Google Scholar] [CrossRef] [Scilit]
  32. Souissi, A.; Zouaghi, M.W.; Abdennadher, I.; Masmoudi, A. MEC based modeling and sizing of a tubular linear PM synchronous machine. IEEE Trans. Ind. Appl. 2015, 51, 2181–2194. [Google Scholar] [CrossRef] [Scilit]
  33. Boughrara, K.; Ibtiouen, R.; Zarko, D. Magnetic field analysis of external rotor permanent-magnet synchronous motors using conformal mapping. IEEE Trans. Magn. 2010, 46, 3684–3693. [Google Scholar] [CrossRef] [Scilit]
  34. Wang, S.; Chen, F.; Tian, Z.; Wu, X.; Li, A. An Enhanced Magnetic Equivalent Circuit Model for a Magnetorheological Clutch Including Nonlinear Permeability, Flux Fringing, and Leakage Effects. IEEE Trans. Transp. Electrif. 2023, 9, 488–500. [Google Scholar] [CrossRef] [Scilit]
Figure 1. Topological structure of CT-DSCLOG: (a) Explosion diagram, (b) 2D cross-section diagram.
Applsci 16 02786 g001
Figure 2. Magnetic flux path distribution of CT-DSCLOG: (a) Initial position, (b) middle position, (c) end position.
Applsci 16 02786 g002
Figure 3. Flowchart of proposed method.
Applsci 16 02786 g003
Figure 4. Schematic diagram for magnetic circuit modeling and analysis: (a) Region division, (b) magnetic reluctance diagram.
Applsci 16 02786 g004
Figure 5. Schematic diagram for solving irregular regional magnetic reluctance.
Applsci 16 02786 g005
Figure 6. Schematic of S-C mapping.
Applsci 16 02786 g006
Figure 7. Schematic diagram of PM magnetization.
Applsci 16 02786 g007
Figure 8. Comparison results of magnetic flux density distribution in air gap region: (a) Inner air gap, (b) outer air gap.
Applsci 16 02786 g008
Figure 9. Comparison between FEA and MEC of detent force and Back-EMF: (a) Detent force, (b) Back-EMF.
Applsci 16 02786 g009
Figure 10. Sensitivity of each parameter to magnetic flux density in different regions.
Applsci 16 02786 g010
Figure 11. Composite sensitivity of each parameter.
Applsci 16 02786 g011
Figure 12. The average value of each parameter: (a) Detent force, (b) Back-EMF, (c) power.
Applsci 16 02786 g012
Figure 13. Distribution of the detent force and Back-EMF based on Taguchi method.
Applsci 16 02786 g013
Figure 14. Prototype test rig.
Applsci 16 02786 g014
Figure 15. Comparisons of no-load Back-EMF and their harmonic spectra: (a) Back-EMF waveforms, (b) harmonic spectra [18].
Applsci 16 02786 g015
Figure 16. Comparisons of no-load detent force and their harmonic spectra: (a) Detent force, (b) harmonic spectra [18].
Applsci 16 02786 g016
Figure 17. Comparison of waveforms at the load conditions of the generators: (a) Output voltage comparison of different structures, (b) output current comparison of different structure [18].
Applsci 16 02786 g017
Figure 18. Power comparison of three machines [18].
Applsci 16 02786 g018
Table 1. Initial dimensions of the generator.
ParametersSymbolValue
Outer stator widthw076 mm
Outer stator heighthso42 mm
Yoke tooth widthwt13 mm
slot opening widthws26 mm
PM widthwpm22 mm
PM heighthpm5 mm
Outer air gap widthgo1 mm
Inner air gap widthgi3 mm
Inner stator heightwsi84 mm
Inner stator widthhsi16 mm
Curved tooth heighthr0.5 mm
Table 2. Key structural parameters select from MEC.
ParametersSymbolRange (mm)
PM widthA20~24
PM heightB3~6
Slot opening widthC18~26
Curved tooth heightD0~1
Outer stator heightE68~84
Inner stator heightF68~84
Back iron heightG9~13
Table 3. Optimization parameter levels.
Optimization FactorLevel 1Level 2Level 3
A202224
B345
C182226
D00.51
E687684
Table 4. Experimental matrix and finite element results.
NumberExperimental MatrixDetent Force/NBack-EMF/VPower/W
ABCDE
111111284.13194.1853.465
211112134.130113.3059.492
311113301.530111.3360.717
412221325.891122.9499.770
51222295.612134.02109.319
612223336.795132.51114.926
713331347.440137.93143.072
81333253.180148.18171.796
913333307.528148.98179.208
1021231216.799115.7179.566
112123254.339120.7089.055
1221233150.919121.5192.260
1322311297.255136.40139.117
142231253.417142.04151.158
1522313232.960142.80151.703
1623121332.951139.16130.407
1723122232.779145.67145.715
1823123489.806145.22152.788
1931321236.134129.56104.444
203132293.083130.02113.502
2131323227.304129.80114.124
2232131316.947137.96118.714
2332132113.545141.69134.476
2432133279.405143.04141.382
2533211344.812161.00178.292
2633212337.235162.95192.885
2733213741.356151.46191.686
Table 5. Variance at each level of each optimization parameter.
Optimization FactorDetent ForceBack-EMFPower
SQRatioSQRatioSQRatio
A912.85.2129.6919.7182.6012.4
B4978.028.4469.3471.31067.572.4
C1606.59.129.964.5151.6310.3
D1636.89.30.340.0518.861.3
E8385.847.828.584.4552.933.6
Table 6. Main structural parameters of three linear machines.
ParameterCT-DSCLOGDSCLOG (hr = 0)Ref. [18] Machine
Out radius of stator, Ro100 mm
Inner radius of stator, Ri33.6 mm
Outer stator height, hso76 mm
Inner stator height, hsi84 mm
Height of PM, hpm5 mm
Number of coils, Nc420
Magnet gradeN42UH
Steel gradeDW465
Moving speed0.942 sin (30πt)
Stroke±10 mm
Width of PM, wpm24 mm22 mm54 mm
Pole pitch, τp30 mm--
Curved tooth height, hr1 mm0 mm
Table 7. Performance comparison of three linear machines.
ItemCT-DSCLOGDSCLOG (hr = 0)Ref. [18] Machine
Power (W)168.63135.19101.4
Copper loss (W)3728.6122.27
Iron loss (W)0.750.680.56
Eddy current (W)0.170.150.13
Hysteresis (W)0.560.500.41
PM usage (m3)1.66 × 10−41.52 × 10−40.94 × 10⁻⁴
Power density (kW/m3)96.5878.0560.6
Efficiency84.45%82.81%79.41%
Disclaimer/Publisher’s Note: The statements, opinions and data contained in all publications are solely those of the individual author(s) and contributor(s) and not of MDPI and/or the editor(s). MDPI and/or the editor(s) disclaim responsibility for any injury to people or property resulting from any ideas, methods, instructions or products referred to in the content.