Article

Low-Voltage Blood Component Separation for Implantable Kidneys Using a Sawtooth Electrode and Negative Dielectrophoresis


by
Hasan Mhd Nazha
1,*,
Mhd Ayham Darwich
2,3,
Al-Hasan Ali
2 and
Basem Ammar
2,4
1
Institute of Materials, Technologies and Mechanics, Faculty of Mechanical Engineering, Otto Von Guericke University Magdeburg, Universitätsplatz 2, 39106 Magdeburg, Germany
2
Faculty of Biomedical Engineering, Al-Andalus University for Medical Sciences, Tartus P.O. Box 101, Syria
3
Faculty of Technical Engineering, University of Tartus, Tartus P.O. Box 2147, Syria
4
Higher Institute for Laser Research and Applications, Damascus University, Damascus P.O. Box 222, Syria
*
Author to whom correspondence should be addressed.
Appl. Sci. 2026, 16(6), 2785; https://doi.org/10.3390/app16062785
Submission received: 23 January 2026 / Revised: 9 March 2026 / Accepted: 12 March 2026 / Published: 13 March 2026
(This article belongs to the Special Issue Advances in Materials for Biosensing and Biomedical Applications)

Abstract

Implantable artificial kidneys represent a promising alternative for patients with end-stage renal disease (ESRD), aiming to overcome the limitations of conventional dialysis through the integration of microfluidic and electrokinetic technologies. In this study, we present a sawtooth electrode microfluidic chamber that achieves blood cell separation via negative dielectrophoresis at a record-low operating voltage of 1.4 V, representing a fivefold reduction compared with rectangular electrode designs and supporting potential integration into implantable artificial kidney systems. A microfluidic chip incorporating an asymmetric sawtooth electrode geometry was developed to enhance local electric field gradients while reducing power consumption. Device performance was investigated using COMSOL Multiphysics simulations. Response Surface Methodology (RSM) based on a Box–Behnken design was employed to optimize the number of teeth per unit length (N), sawtooth height (H), and applied voltage (V), while excitation frequency was fixed at 1 MHz and flow velocity was maintained constant at 0.1 µL·min−1. Statistical analysis was conducted using analysis of variance (ANOVA) in Minitab (Version 27; Minitab, LLC, State College, PA, USA, 2024). The optimization model showed strong predictive capability (R2 = 95.8%) and identified applied voltage (59.45% contribution) and sawtooth height (33%) as the dominant factors affecting separation efficiency, with a significant H × V interaction (p = 0.023). Comprehensive voltage-response mapping over the range of 0.8–4.0 V revealed four operational regimes, including a previously unreported high-voltage failure zone above 2.8 V, where electrothermal flow and electroporation degrade performance. Under physiological conductivity conditions, the optimized design maintained a separation efficiency of 78.3% at 1.4 V with a tip temperature rise of only 1.2 °C, while full recovery of performance was achieved at 2.2 V. Cell-specific separation efficiencies reached 97.3% for white blood cells, 95.8% for red blood cells, and 84.7% for platelets, reducing the downstream cellular load by 92.6%. These findings demonstrate that the proposed low-voltage, high-efficiency separation platform has strong potential as a cellular pre-filtration module in implantable artificial kidney systems and other lab-on-chip biomedical devices.

1. Introduction

1.1. Physiological Background of Kidney Function

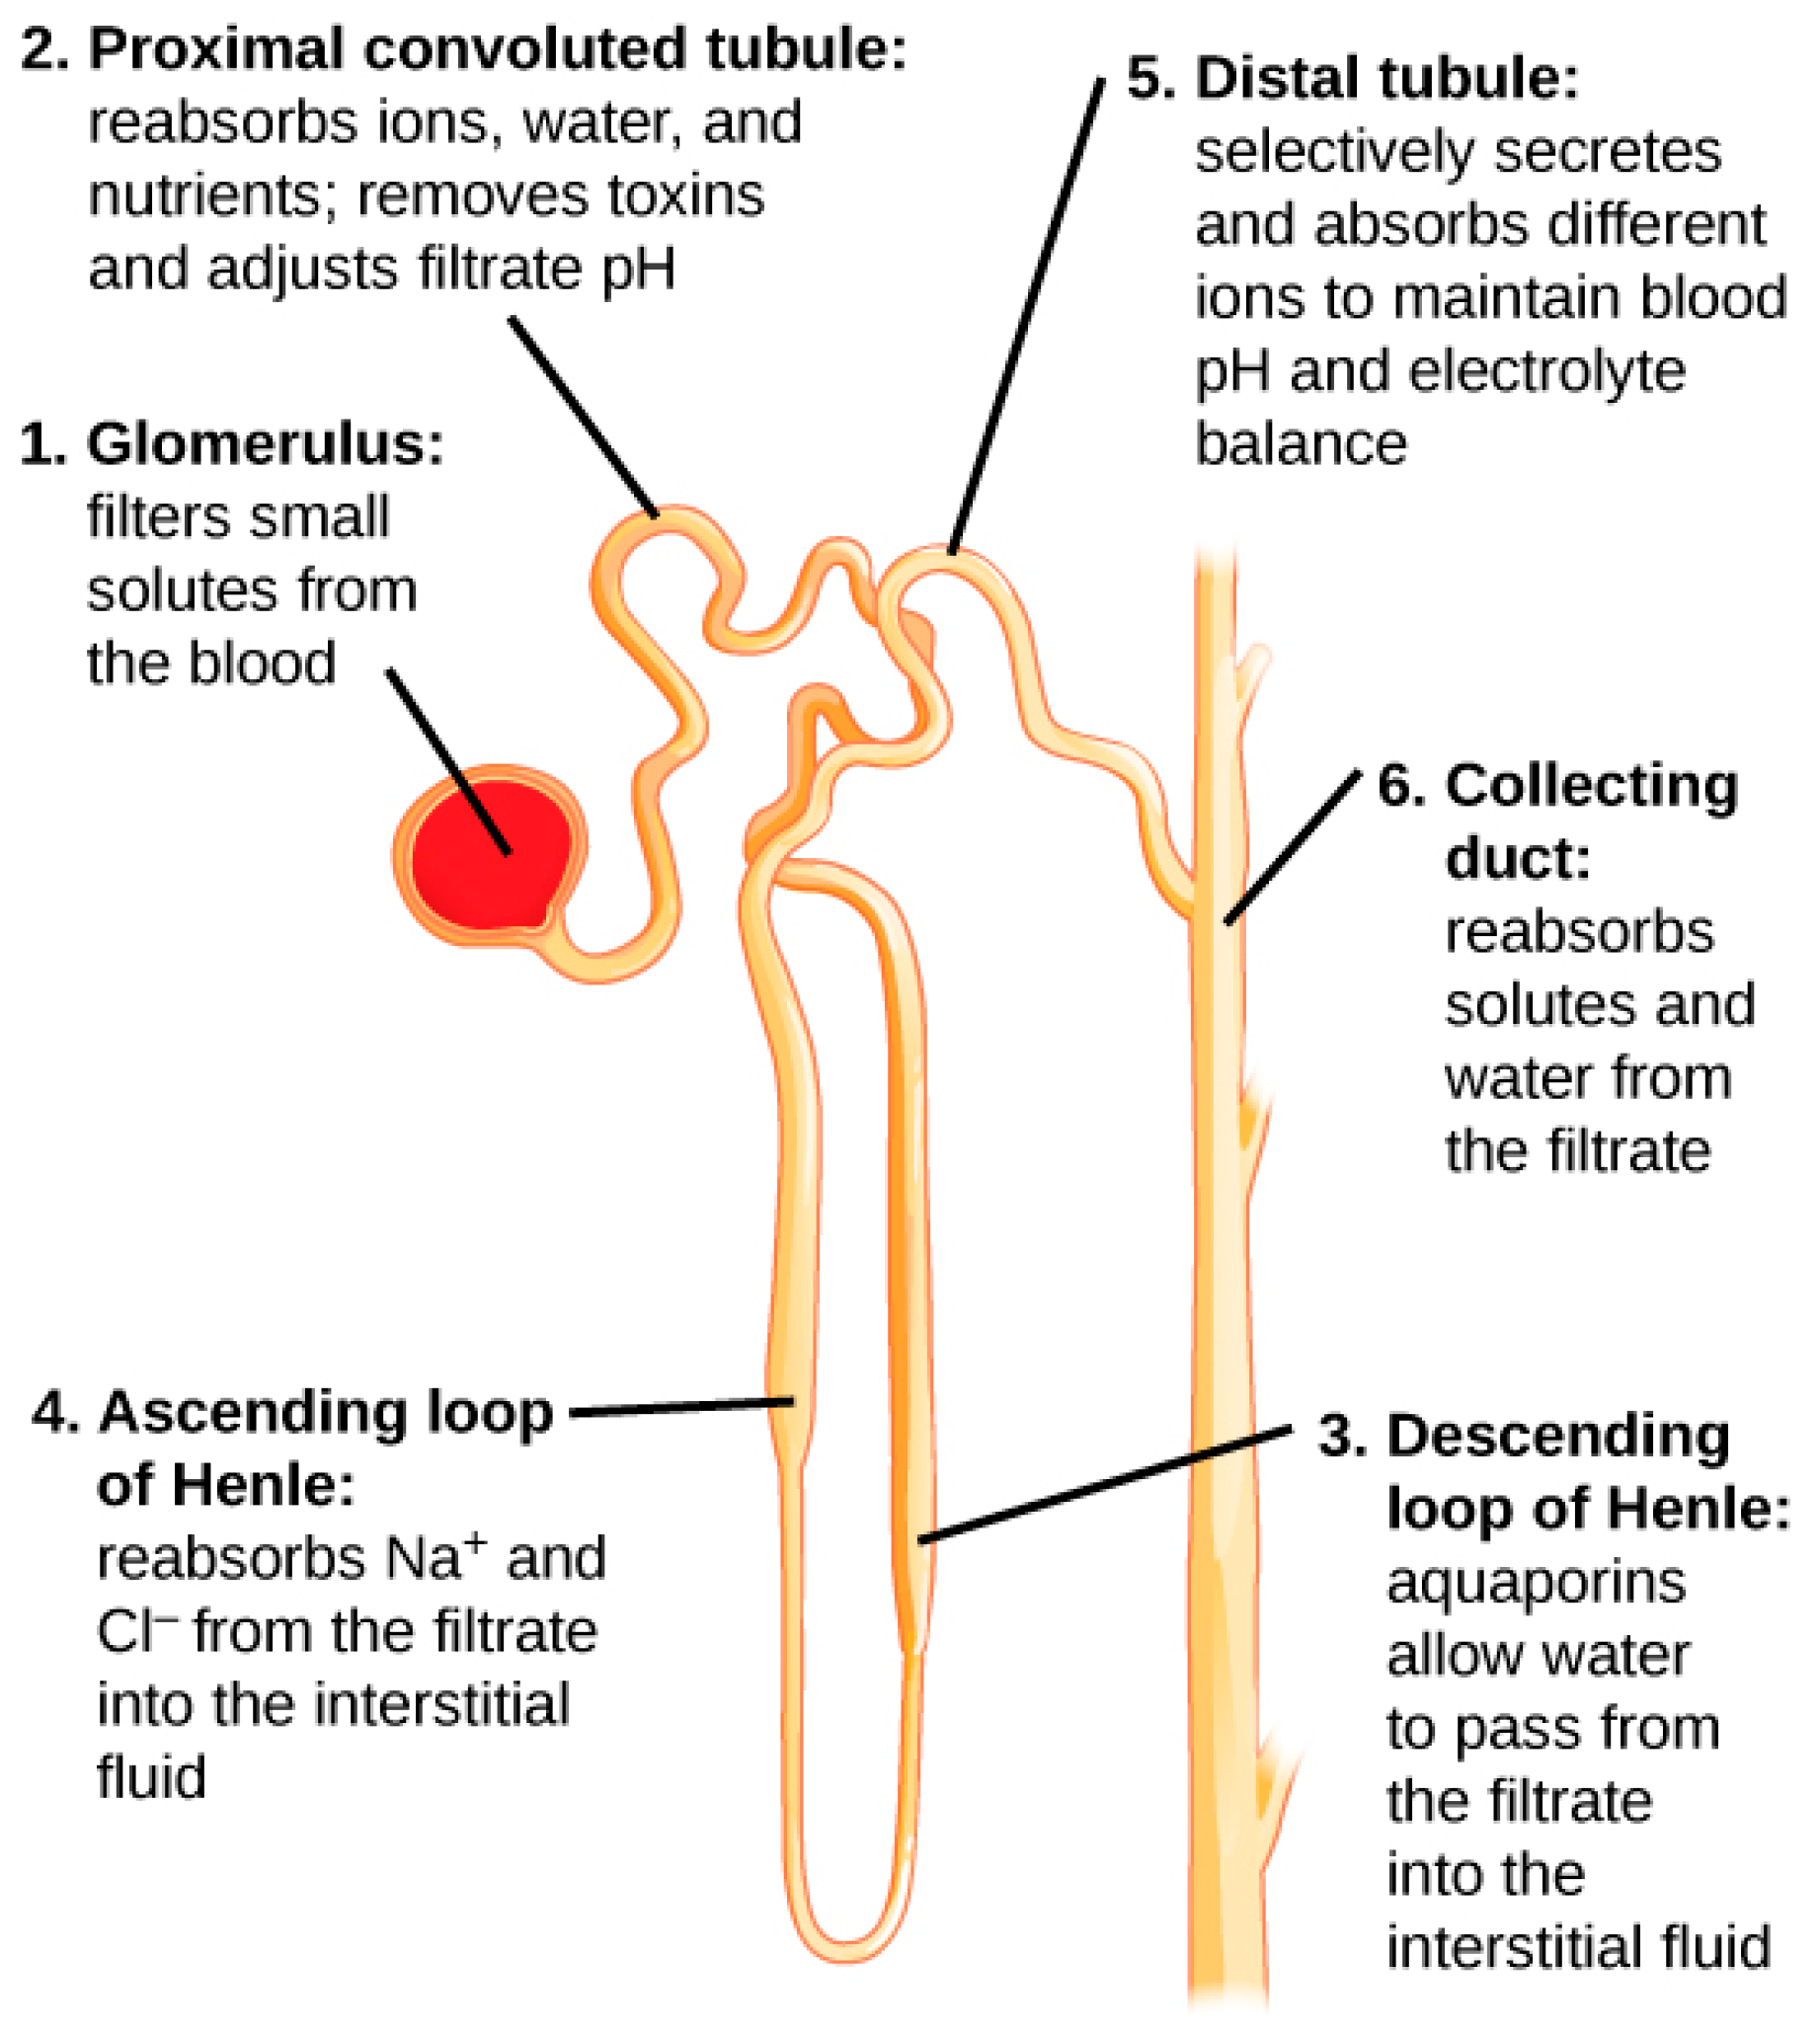
The kidneys play a vital role in maintaining homeostasis, performing several essential functions, such as waste removal, fluid and electrolyte balance, metabolic blood acid-base balance, hormone production/modification for blood pressure, calcium/potassium homeostasis, and red blood cell production [1]. The renal corpuscle, consisting of the glomerulus and the surrounding glomerular or Bowman’s capsule, and the tubules of the kidney perform most of these functions. The primary function of the kidney is to filter blood, which is facilitated by its unique blood flow and high perfusion autoregulation of flow across the glomerular capillaries [2]. The kidneys receive a significant proportion of blood flow, about 20% of cardiac output, allowing for the filtration of large volumes of blood. The glomerulus is situated between two arterioles, receiving blood from the upstream afferent arteriole, and exiting downstream via the efferent arteriole. This unique arrangement enables the precise control of glomerular flow and filtration rate through autoregulatory changes in the diameters of these resistance arterioles. The renal corpuscles are located only in the kidney cortex, with about 1 million per kidney, varying due to race [3]. The filtration barrier of the renal corpuscles is composed of three histological structures: the capillary endothelium of the glomeruli, specialized cells called podocytes, and the fused basement membrane [4]. These structures are essential for filtering waste and maintaining homeostatic balance. The capillary endothelium of the glomeruli is lined with small pores that allow small solutes to pass through, while the podocytes form a filtration barrier that prevents the passage of larger molecules such as proteins, cellular elements, and other macromolecules. The fused basement membrane provides structural support and helps to maintain the integrity of the filtration barrier. The entire process of the nephrons filter is illustrated in Figure 1.
Each part of the nephron performs a different function in filtering waste and maintaining homeostatic balance.
  • The glomerulus forces small solutes out of the blood by pressure.
  • The proximal convoluted tubule reabsorbs ions, water, and nutrients from the filtrate into the interstitial fluid, and actively transports toxins and drugs from the interstitial fluid into the filtrate. The proximal convoluted tubule also adjusts blood pH by selectively secreting ammonia (NH3) into the filtrate, where it reacts with H+ to form NH4+. The more acidic the filtrate, the more ammonia is secreted.
  • The descending loop of Henle is lined with cells containing aquaporins that allow water to pass from the filtrate into the interstitial fluid.
  • In the thin part of the ascending loop of Henle, Na+ and Cl ions diffuse into the interstitial fluid. In the thick part, these same ions are actively transported into the interstitial fluid. Because salt but not water is lost, the filtrate becomes more diluted as it travels up the limb.
  • In the distal convoluted tubule, K+ and H+ ions are selectively secreted into the filtrate, while Na+, Cl, and HCO3 ions are reabsorbed to maintain pH and electrolyte balance in the blood.
  • The collecting duct reabsorbs solutes and water from the filtrate, forming dilute urine (credit: modification of work by NIDDK)
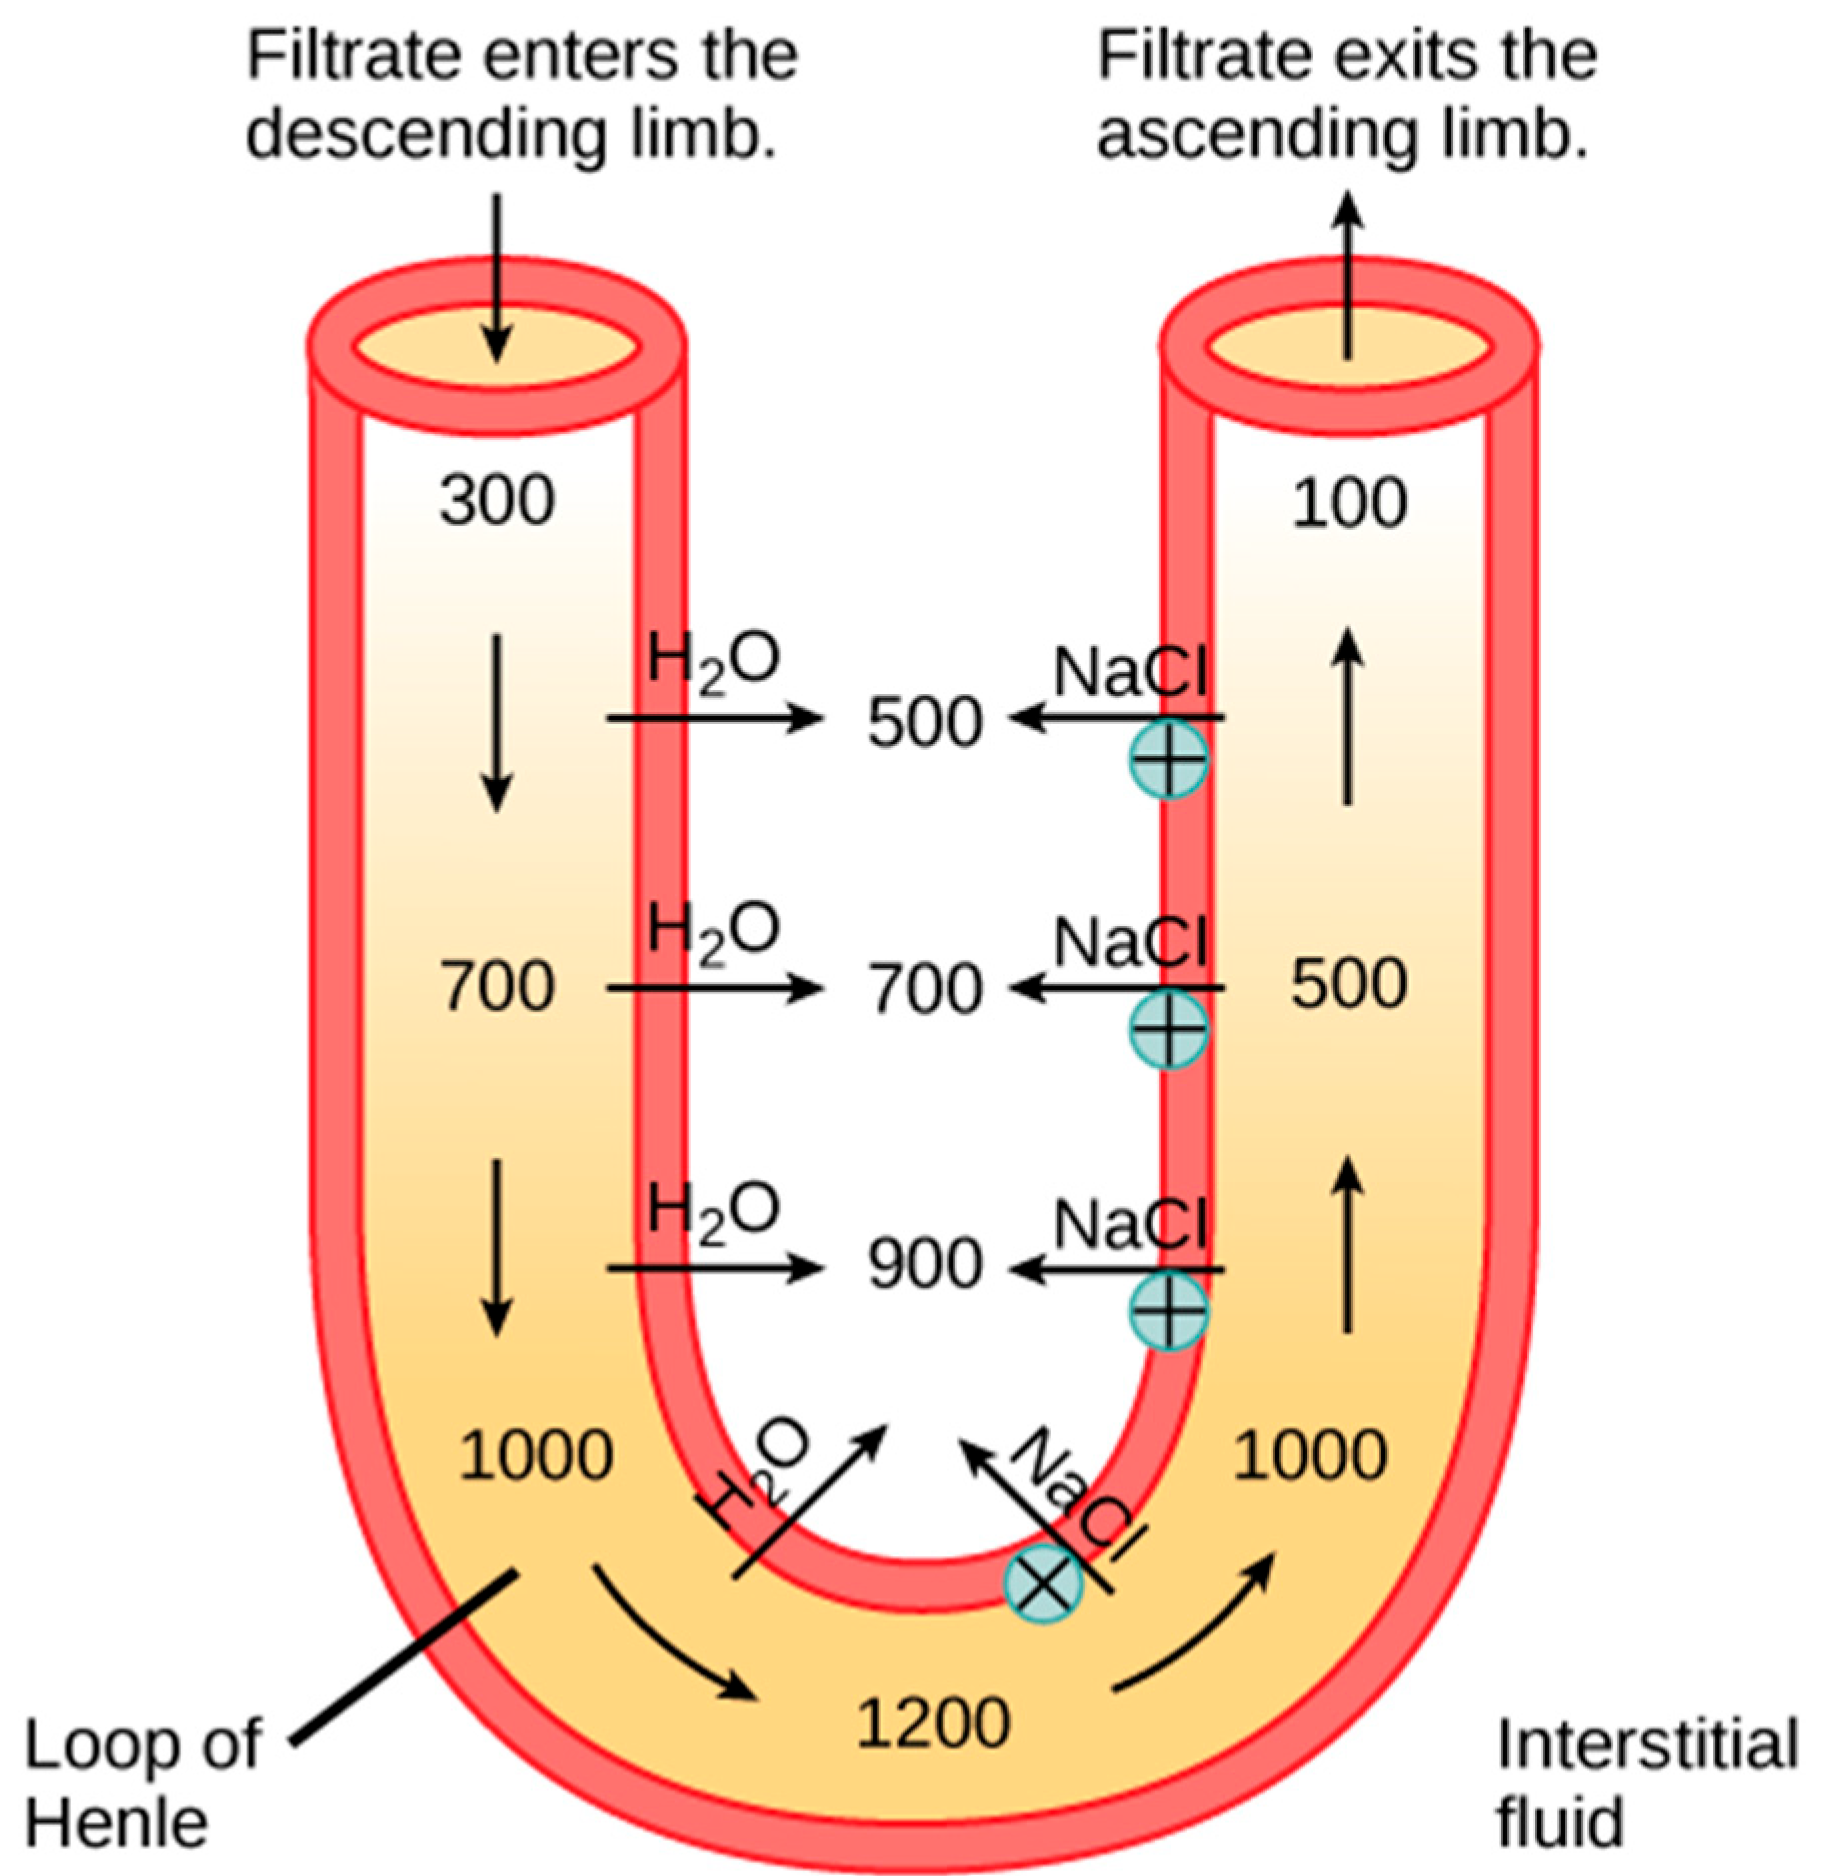
In addition to filtering blood, the kidneys also play a crucial role in regulating fluid and electrolyte balance. The renal tubules selectively reabsorb ions, water, and nutrients from the filtrate into the interstitial fluid while actively transporting toxins and drugs from the interstitial fluid into the filtrate. The proximal convoluted tubule regulates blood pH by selectively secreting ammonia into the filtrate, reacting with H+ to form NH4+. The descending loop of Henle (shown in Figure 2) contains cells with aquaporins that allow water to pass from the filtrate into the interstitial fluid. In the ascending loop of Henle, Na+ and Cl ions diffuse into the interstitial fluid, while in the thick part, these same ions are actively transported into the interstitial fluid. The distal convoluted tubule selectively secretes K+ and H+ ions into the filtrate and reabsorbs Na+, Cl, and HCO3 ions to maintain pH and electrolyte balance in the blood [1].

1.2. Dielectrophoresis for Biomedical Applications

Dielectrophoresis (DEP) is an electrokinetic phenomenon in which polarizable particles experience a net force when subjected to a spatially non-uniform electric field. Unlike electrophoresis, DEP does not require particles to carry a net charge, making it particularly suitable for manipulating biological cells suspended in conductive media. Under an applied electric field, induced dipoles form within the particle due to interfacial charge polarization [5]. In a uniform electric field, the forces acting on these dipoles cancel, resulting in no net particle motion. However, in a non-uniform electric field, an imbalance in these forces produces directed particle motion toward regions of higher or lower electric field intensity, known as positive DEP (pDEP) or negative DEP (nDEP), respectively. The direction and magnitude of the DEP force depend on particle size, medium permittivity, excitation frequency, and the Clausius–Mossotti factor, which characterizes the relative polarizability of the particle and surrounding medium.
This technique has been used for trapping, sorting, focusing, filtration, patterning, assembly, and separating biological entities/particles suspended in a buffer medium. The dielectrophoretic forces acting on particles depend on various parameters, including the charge of the particle, geometry of the device, dielectric constant of the medium and particle, and physiology of the particle. Therefore, to design an effective micro-/nanofluidic separation platform, it is necessary to understand the role of the aforementioned parameters on particle motion [6].
Dielectrophoresis (DEP) is a specific electrokinetic technique used for particle manipulation and separation in microdevices. DEP can be broadly divided into AC (AC DEP, classical DEP), DC (DC DEP, insulator-based DEP (iDEP), DC-iDEP), combined AC/DC (AC-iDEP), and traveling wave DEP (twDEP). Although both electrophoresis and DEP are essential in particle manipulation and separation, we focus on the recent advances in DEP for bioparticle separation in microdevices.
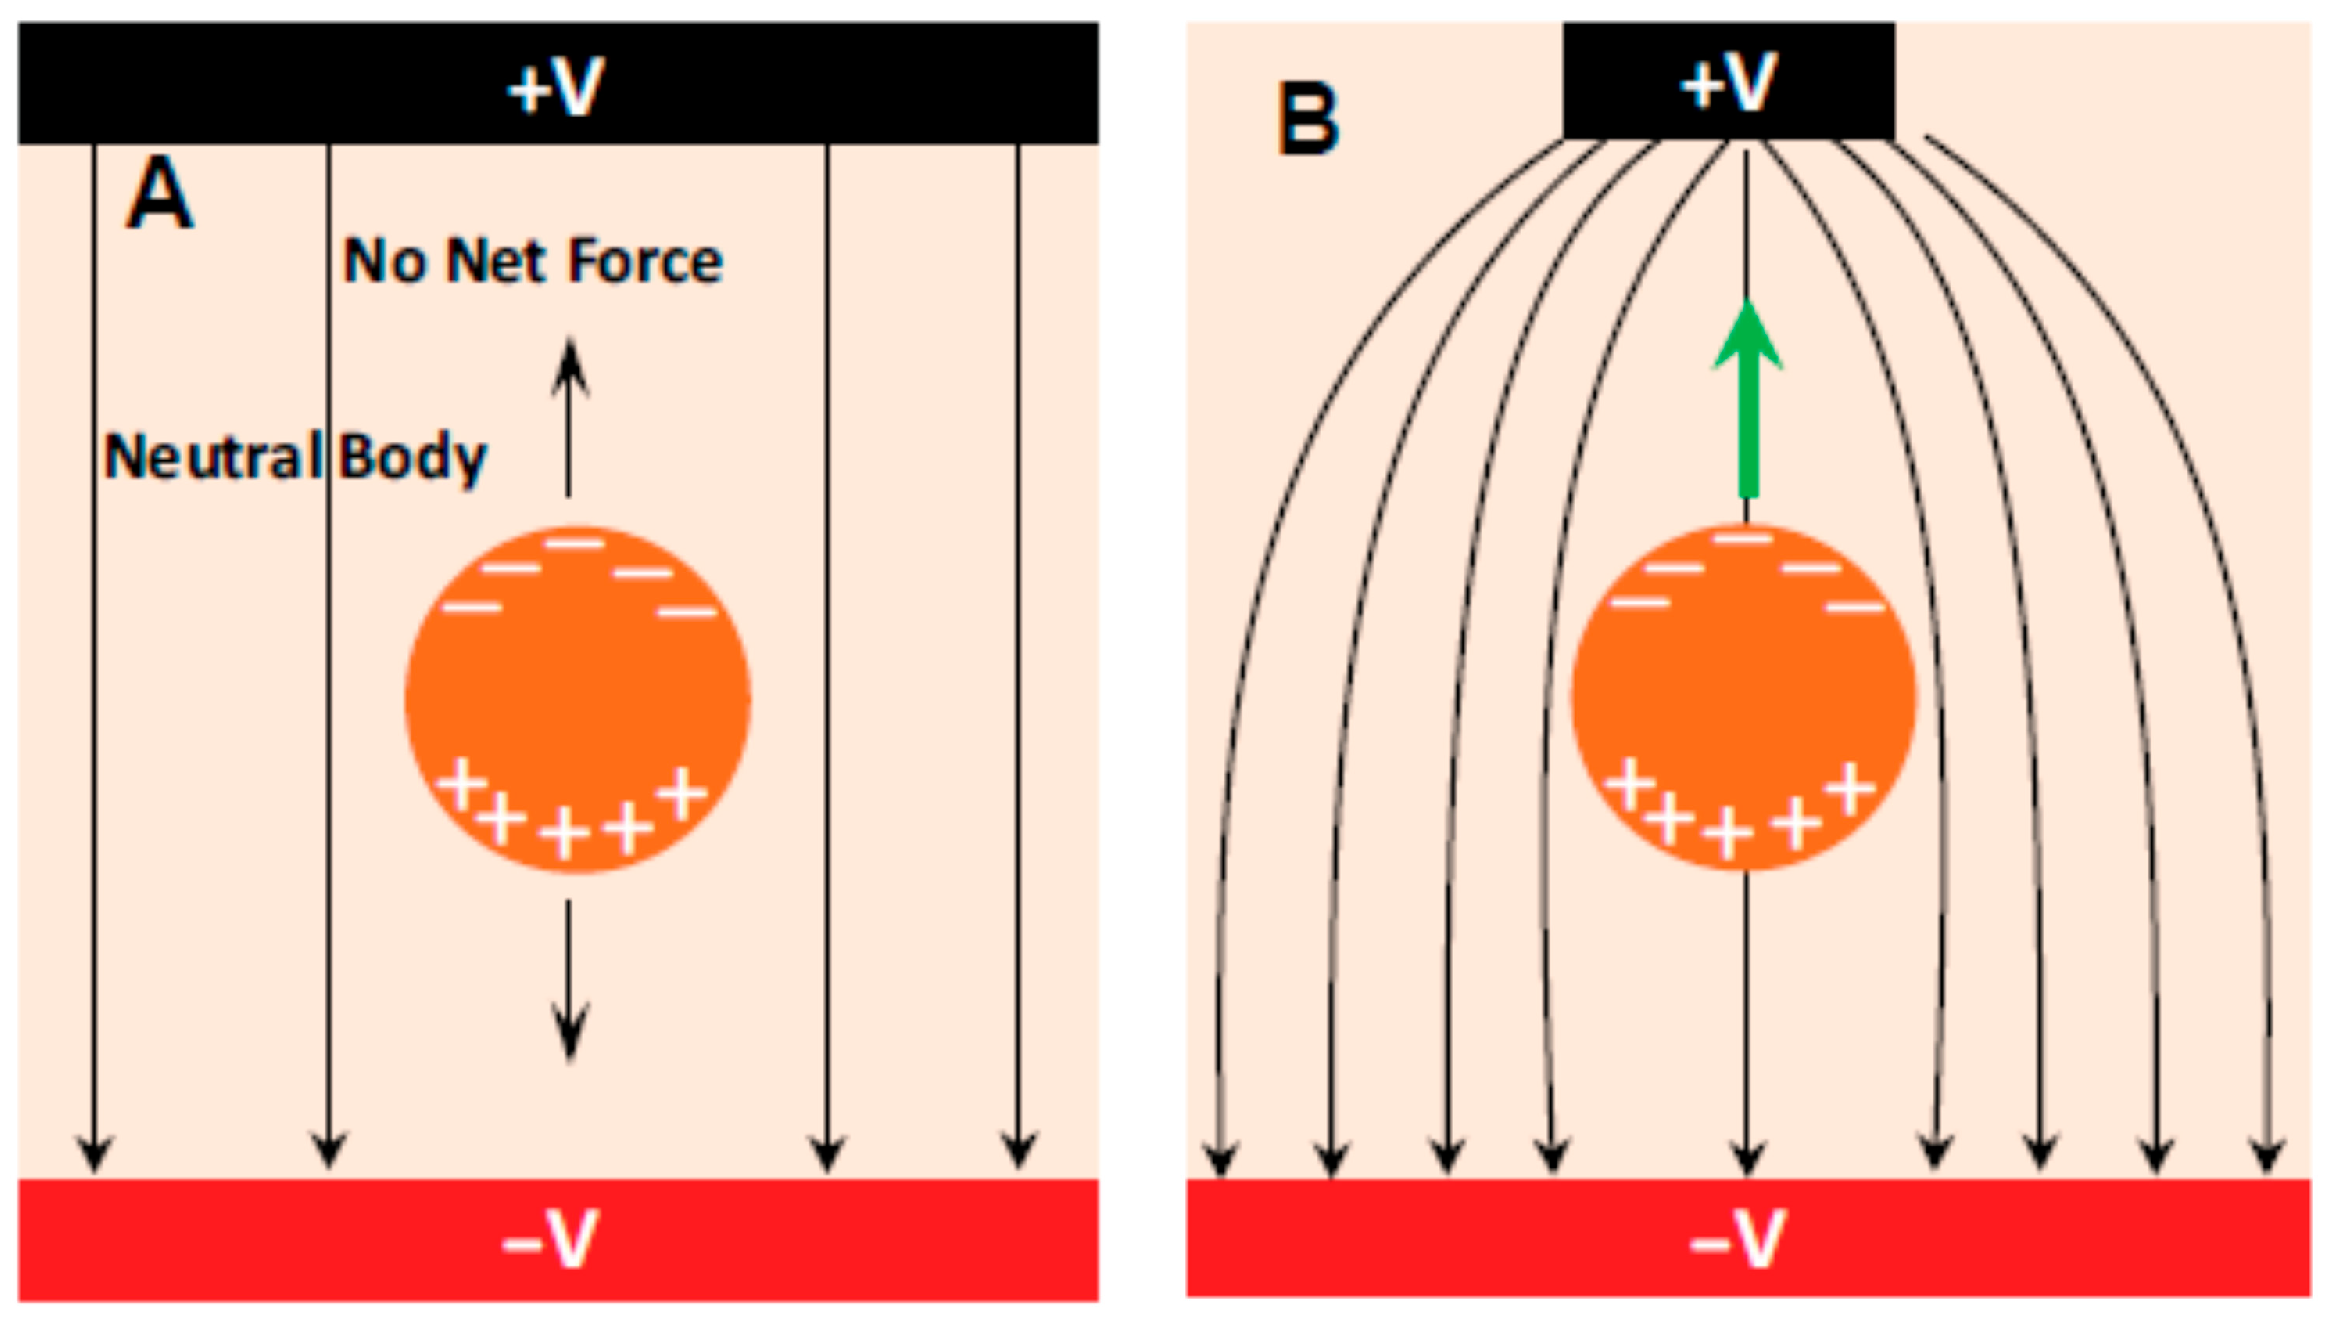
The mechanism of DEP can be explained in terms of the charge distribution at the interface between the suspended particle and the fluid media. A neutral particle polarizes under the application of an electric field [7]. Due to polarization, the positive and negative charges accumulate on the opposite sides of the particle. In a uniform electric field, these accumulated charges experience equal and opposite Coulombic forces that cancel each other as shown in Figure 3A.
As there is no net force, the particle remains stationary. However, in a spatially nonuniform electric field, these electrostatic forces on the accumulated charges are not equal and hence the particle experiences a net force as shown in Figure 3B. This net force drives it toward higher or lower electric field regions.

1.3. Implantable Artificial Kidneys: Challenges and Opportunities

Recent advances in dielectrophoretic cell separation have demonstrated the versatility of this technique for biomedical applications. Emmerich et al. [8] provided a comprehensive review of dielectrophoretic separation methods for blood cells, identifying key parameters governing separation efficiency and highlighting the potential for integration into point-of-care diagnostic devices. Julius et al. [9] developed a portable dielectrophoresis platform (ADEPT) capable of cell trapping, separation, and interaction studies, demonstrating the feasibility of low-power, field-deployable DEP systems.
In the domain of electrode engineering for enhanced DEP performance, Nguyen et al. [10] numerically investigated facing electrode configurations that generate three-dimensional electric field gradients, achieving the efficient separation of breast cancer cells from blood at reduced voltages. Tada et al. [11] demonstrated high-throughput cell separation using three-dimensional gradient AC electric fields generated by sawtooth electrode arrays, reporting 5× higher throughput compared to planar electrodes. These studies collectively underscore the critical role of electrode geometry in determining the voltage requirements and separation efficiency of DEP devices.
The challenge of Joule heating in high-conductivity biological media has been systematically addressed by Yousuff et al. [12], who quantified temperature rises in electrode-based microfluidic devices and established design guidelines for maintaining thermal safety. Their work demonstrated that at voltages below 2 V and frequencies above 500 kHz, temperature increases can be limited to <2 °C even in physiological media, consistent with our findings.
For implantable kidney applications, The Kidney Project at UCSF has made significant progress toward creating a fully implantable bioartificial kidney combining silicon nanopore filters with living renal tubule cells [13]. However, the challenge of cellular pre-filtration to protect these downstream components from fouling remains incompletely addressed. Humes et al. [14] demonstrated the feasibility of incorporating living cells into extracorporeal renal assist devices, but the transition to fully implantable systems requires further miniaturization and power optimization of all components, including the separation stage.
Recent work by Poorreza [5] introduced an electrokinetic-based microfluidic separator with focusing electrodes for blood cell separation, achieving 92% purity at 2.1 V. Similarly, Hewlin and Edwards [15] demonstrated the continuous-flow separation of blood cells using sawtooth electrodes at voltages as low as 3.5 V, establishing the potential for low-power operation. The present study builds upon these advances by systematically optimizing electrode geometry and operating parameters to achieve effective separation at the lowest possible voltage value via dielectrophoresis, aiming to make a reduction compared to baseline previously reported designs.

2. Materials and Methods

2.1. Dielectrophoretic Force for Ion Separation

The frequency-dependent dielectrophoretic force acting on blood cells was computed using the single-shell dielectric model, which represents a biological cell as a conductive interior (cytoplasm) surrounded by a thin, lossy dielectric membrane [15,16,17]. This model yielded the effective complex permittivity of the cell as:
ε c e l l ~ = ε m e m ~ ( r r d ) 3 + 2 ( ε c y t o ~ ε m e m ~ ε c y t o ~ + 2 ε m e m ~ ) ( r r d ) 3 ( ε c y t o ~ ε m e m ~ ε c y t o ~ + 2 ε m e m ~ )
where ε ~ = ε − j(σ/ω) is the complex permittivity—a frequency-dependent quantity that captures both the dielectric storage capability (ε) and conductive losses (σ/ω) of a material. The imaginary term −jσ/ω represents Ohmic dissipation, which becomes increasingly significant at lower frequencies. In this expression, r is the outer cell radius, d is the membrane thickness (typically 5–10 nm for mammalian cells), and the subscripts mem and cyto refer to the membrane and cytoplasmic regions, respectively. The factor (r/(r − d))3 accounts for the volume ratio of the whole cell to the cytoplasmic core.
The Clausius–Mossotti factor, which governs the magnitude and direction of the DEP force, is then given by:
K w = ( ε c e l l ~ ε m e m ~ ε c e l l ~ + 2 ε m e m ~ )
where ε mem ~ is the complex permittivity of the surrounding medium. The real part of K(ω), denoted as Re[K(ω)], determines whether the particle experiences positive DEP (Re[K] > 0, movement toward high-field regions) or negative DEP (Re[K] < 0, movement toward low-field regions), with the crossover frequency marking the transition between these regimes.

2.2. Design of Separation Chamber

A two-dimensional model of the microfluidic separation chamber was developed in COMSOL Multiphysics 6.1. The model coupled three core physics interfaces: the Electric Currents (ac/dc) interface to model the alternating electric field, the Laminar Flow (CFD) interface to model the incompressible fluid flow, and the Particle Tracing for Fluid Flow interface to track cell trajectories [18]. The dielectrophoretic force was implemented as a user-defined volume force using the expression:
F D E P =   2 π r 3   ε m   R e K ω 2 | E | 2
where r is the particle radius, εm is the permittivity of the medium, Re[K(ω)] is the real part of the Clausius–Mossotti factor, and E is the electric field.
The boundary conditions were defined as follows: The left inlet (sample stream) and right inlet (focusing stream) were set to constant flow velocities. Flow conditions were kept fixed throughout the Box–Behnken optimization, in which only the number of teeth per unit length (N), sawtooth height (H), and applied voltage (V) were varied. The outlet was defined as a pressure outlet with p = 0 Pa. All channel walls were set with a no-slip condition for fluid flow. Electrically, all walls except the top wall containing the electrodes were defined as electrically insulated [19].
Table 1 presents the complete set of dielectric parameters used in our simulations, compiled from established experimental measurements in the literature [8,15,16]. For red blood cells, we adopted the parameters reported by Zhang and Chen [15], which were validated across the frequency range of 1 kHz–10 MHz. For white blood cells (modeled as lymphocytes) and platelets, we used the values from Hewlin and Edwards [16] and Emmerich et al. [8], respectively. All simulations were performed at a frequency of 1 MHz, which lies within the range where all three cell types exhibit negative DEP (Re[K(ω)] < 0), enabling their repulsion from high-field regions at the electrode tips.
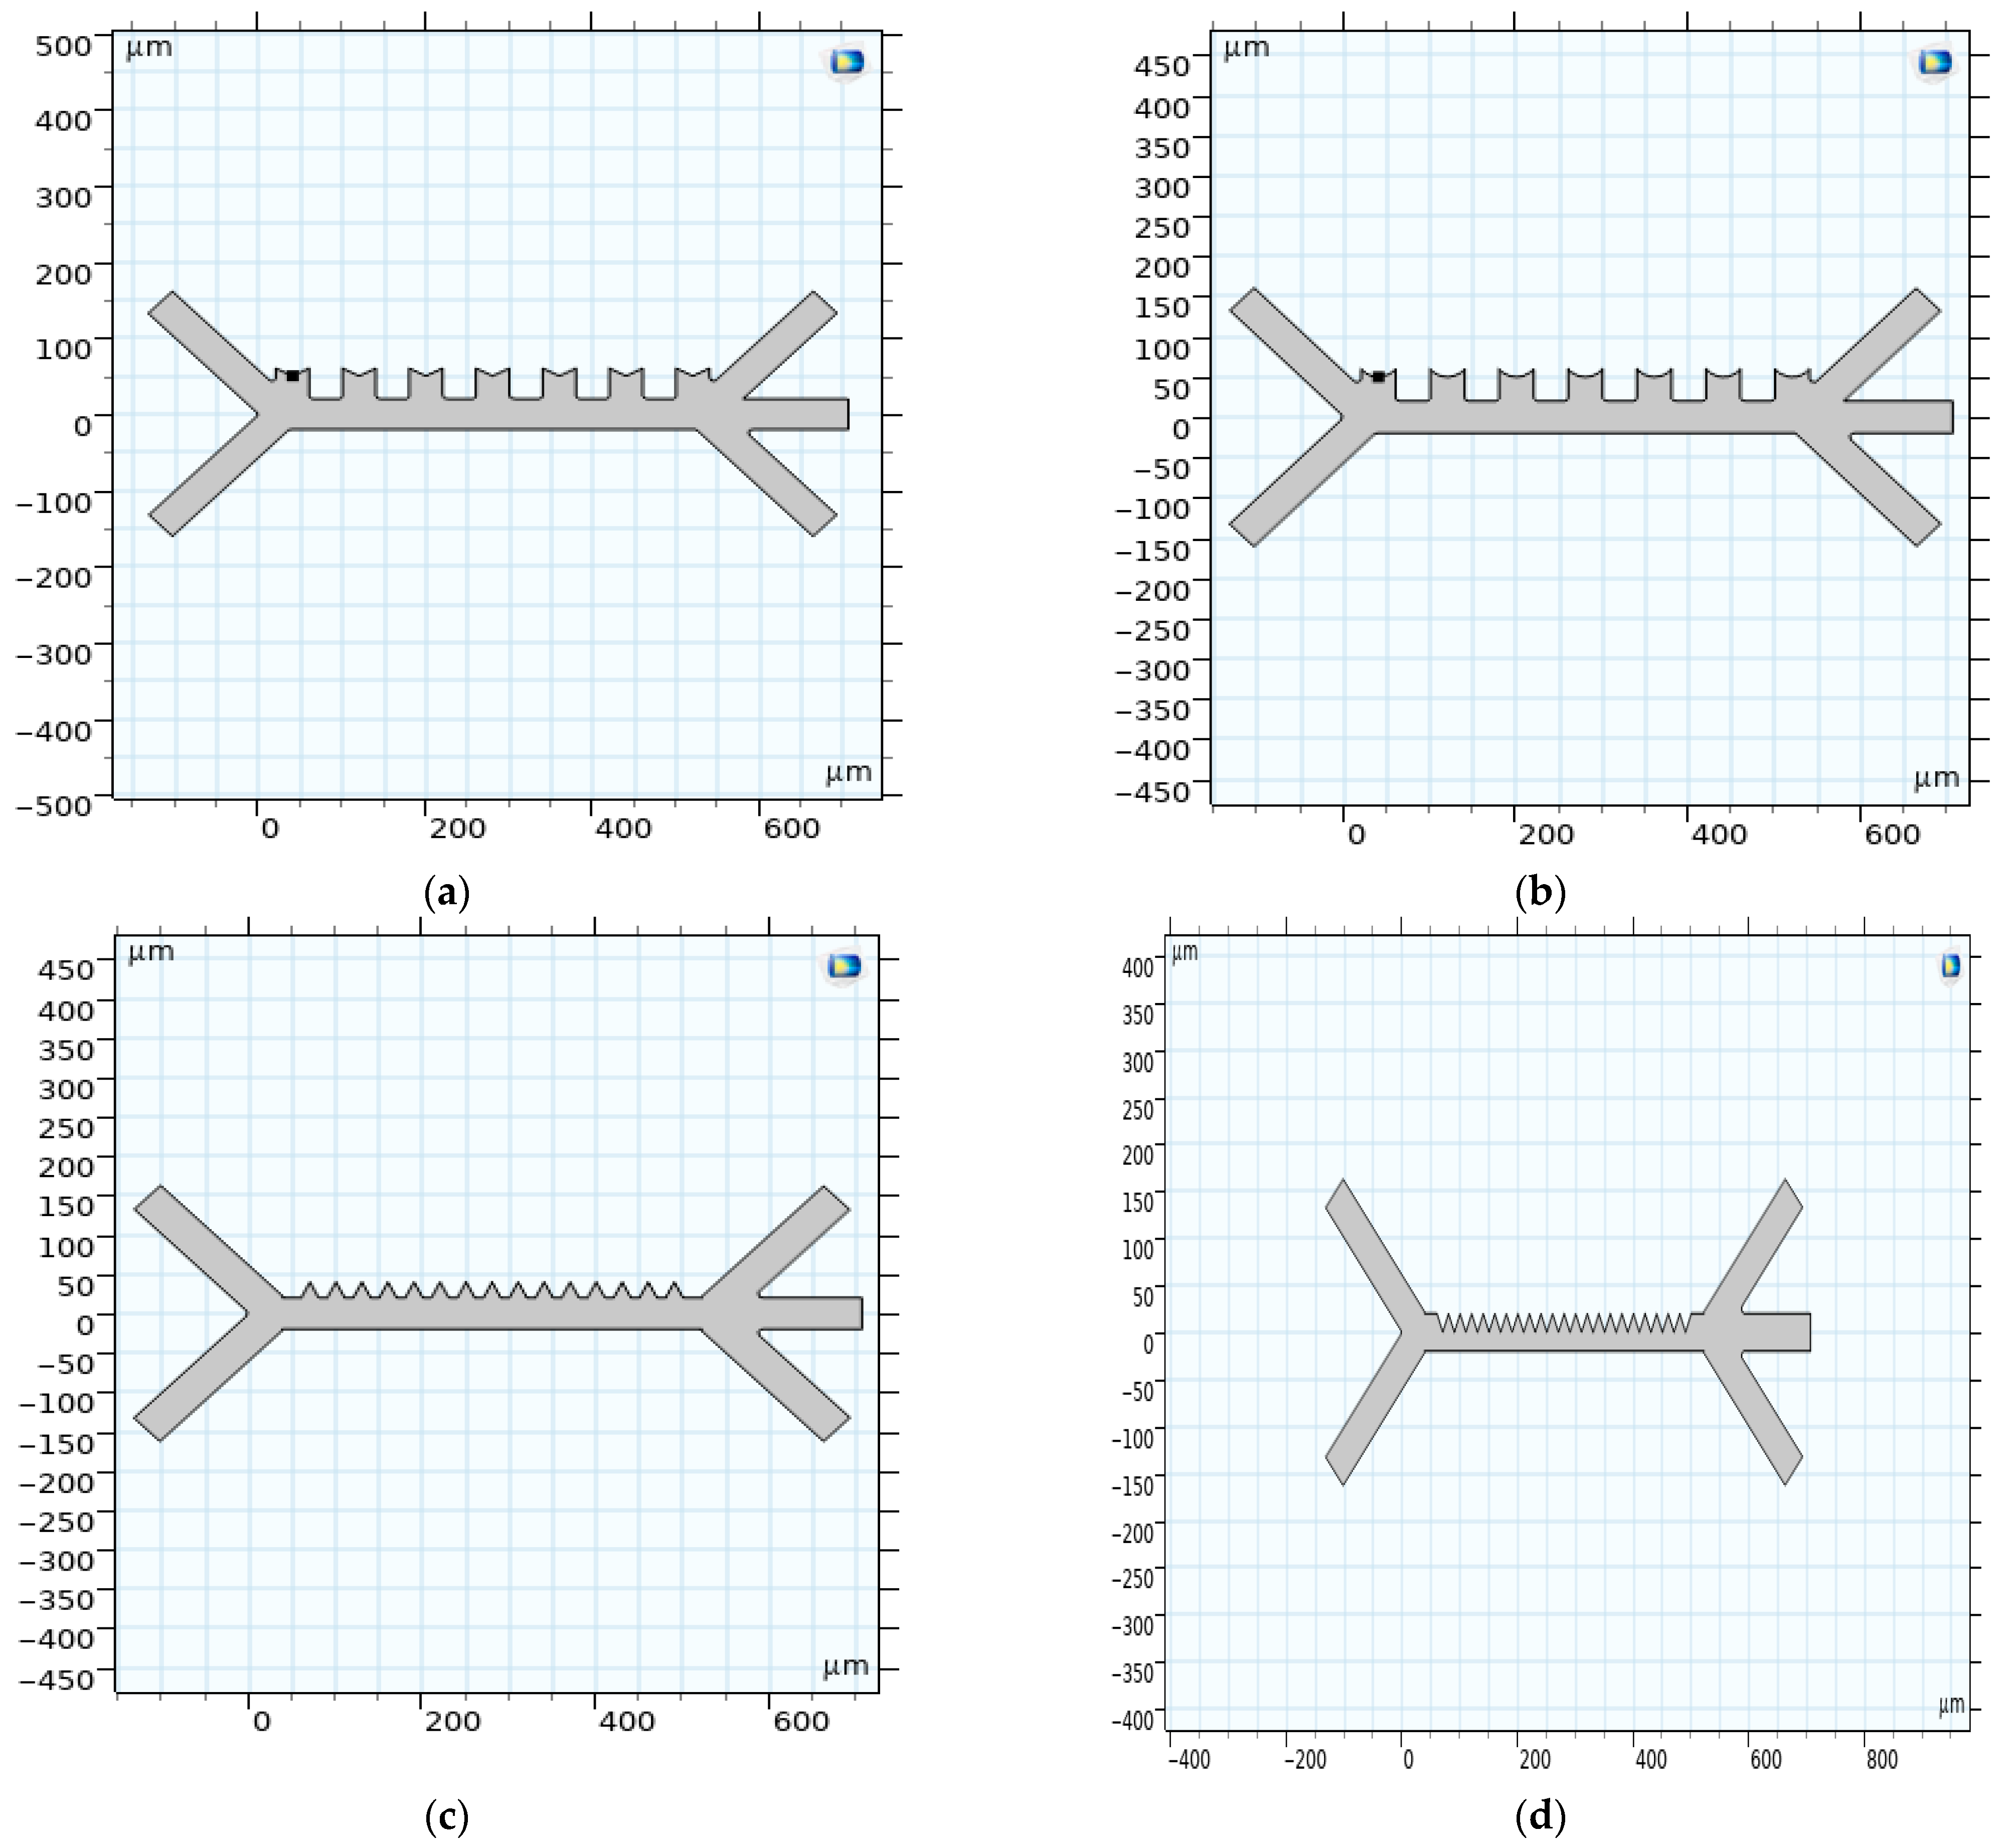
The design was iteratively improved through four model configurations to optimize the electric field gradient. The key changes in each iteration were the geometry and placement of the electrodes along the top wall of the channel, as summarized in Table 2.
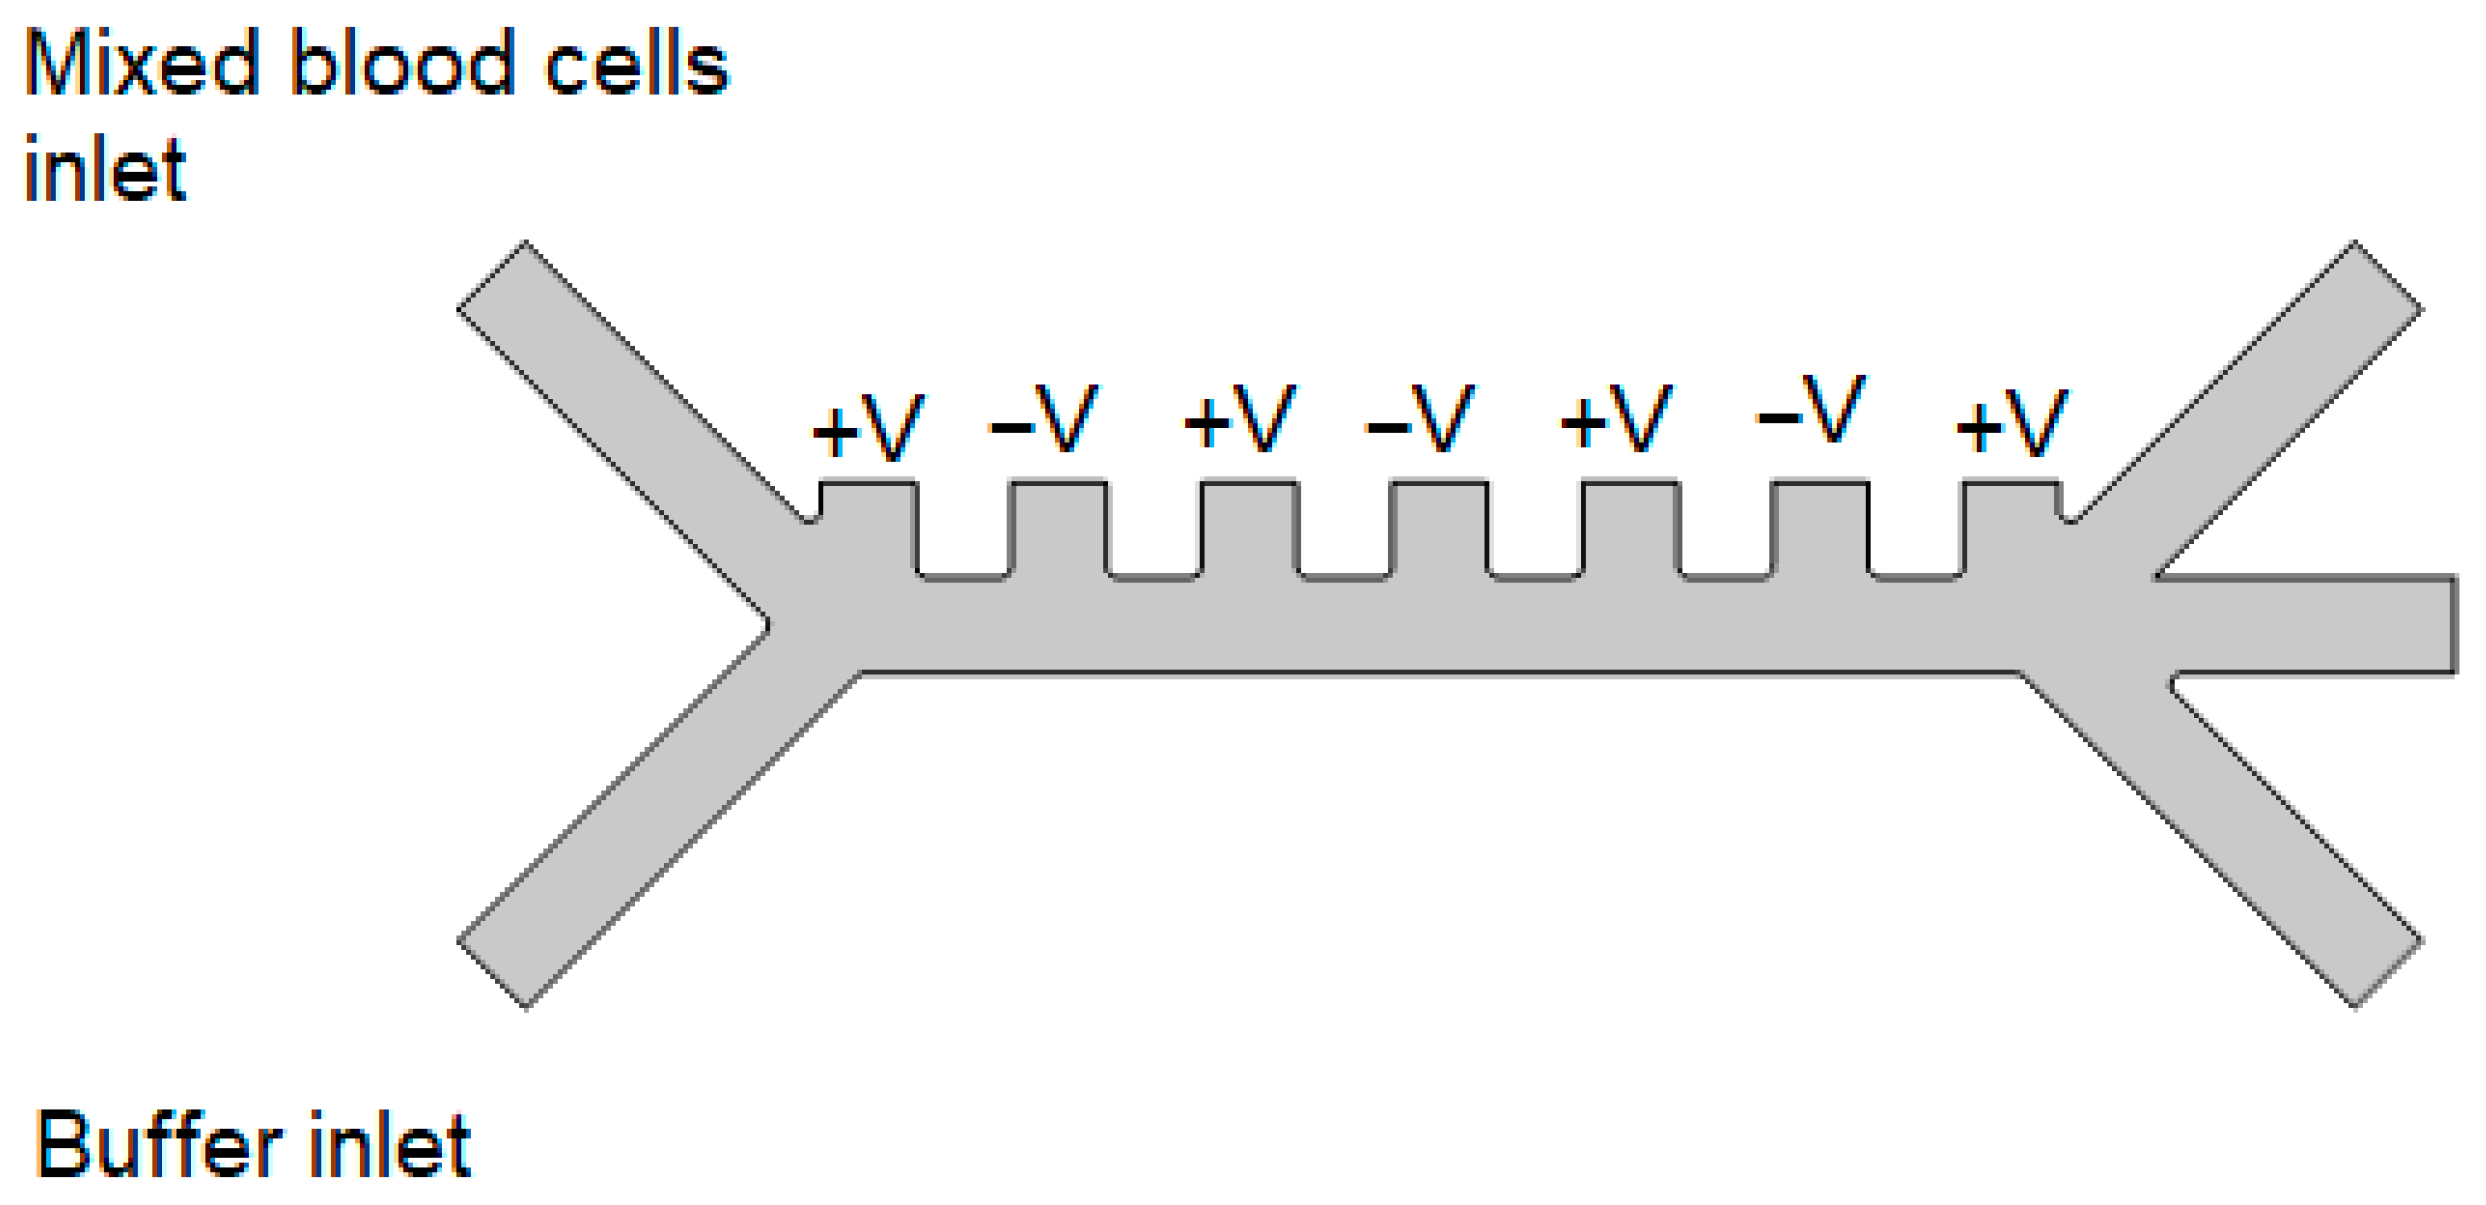
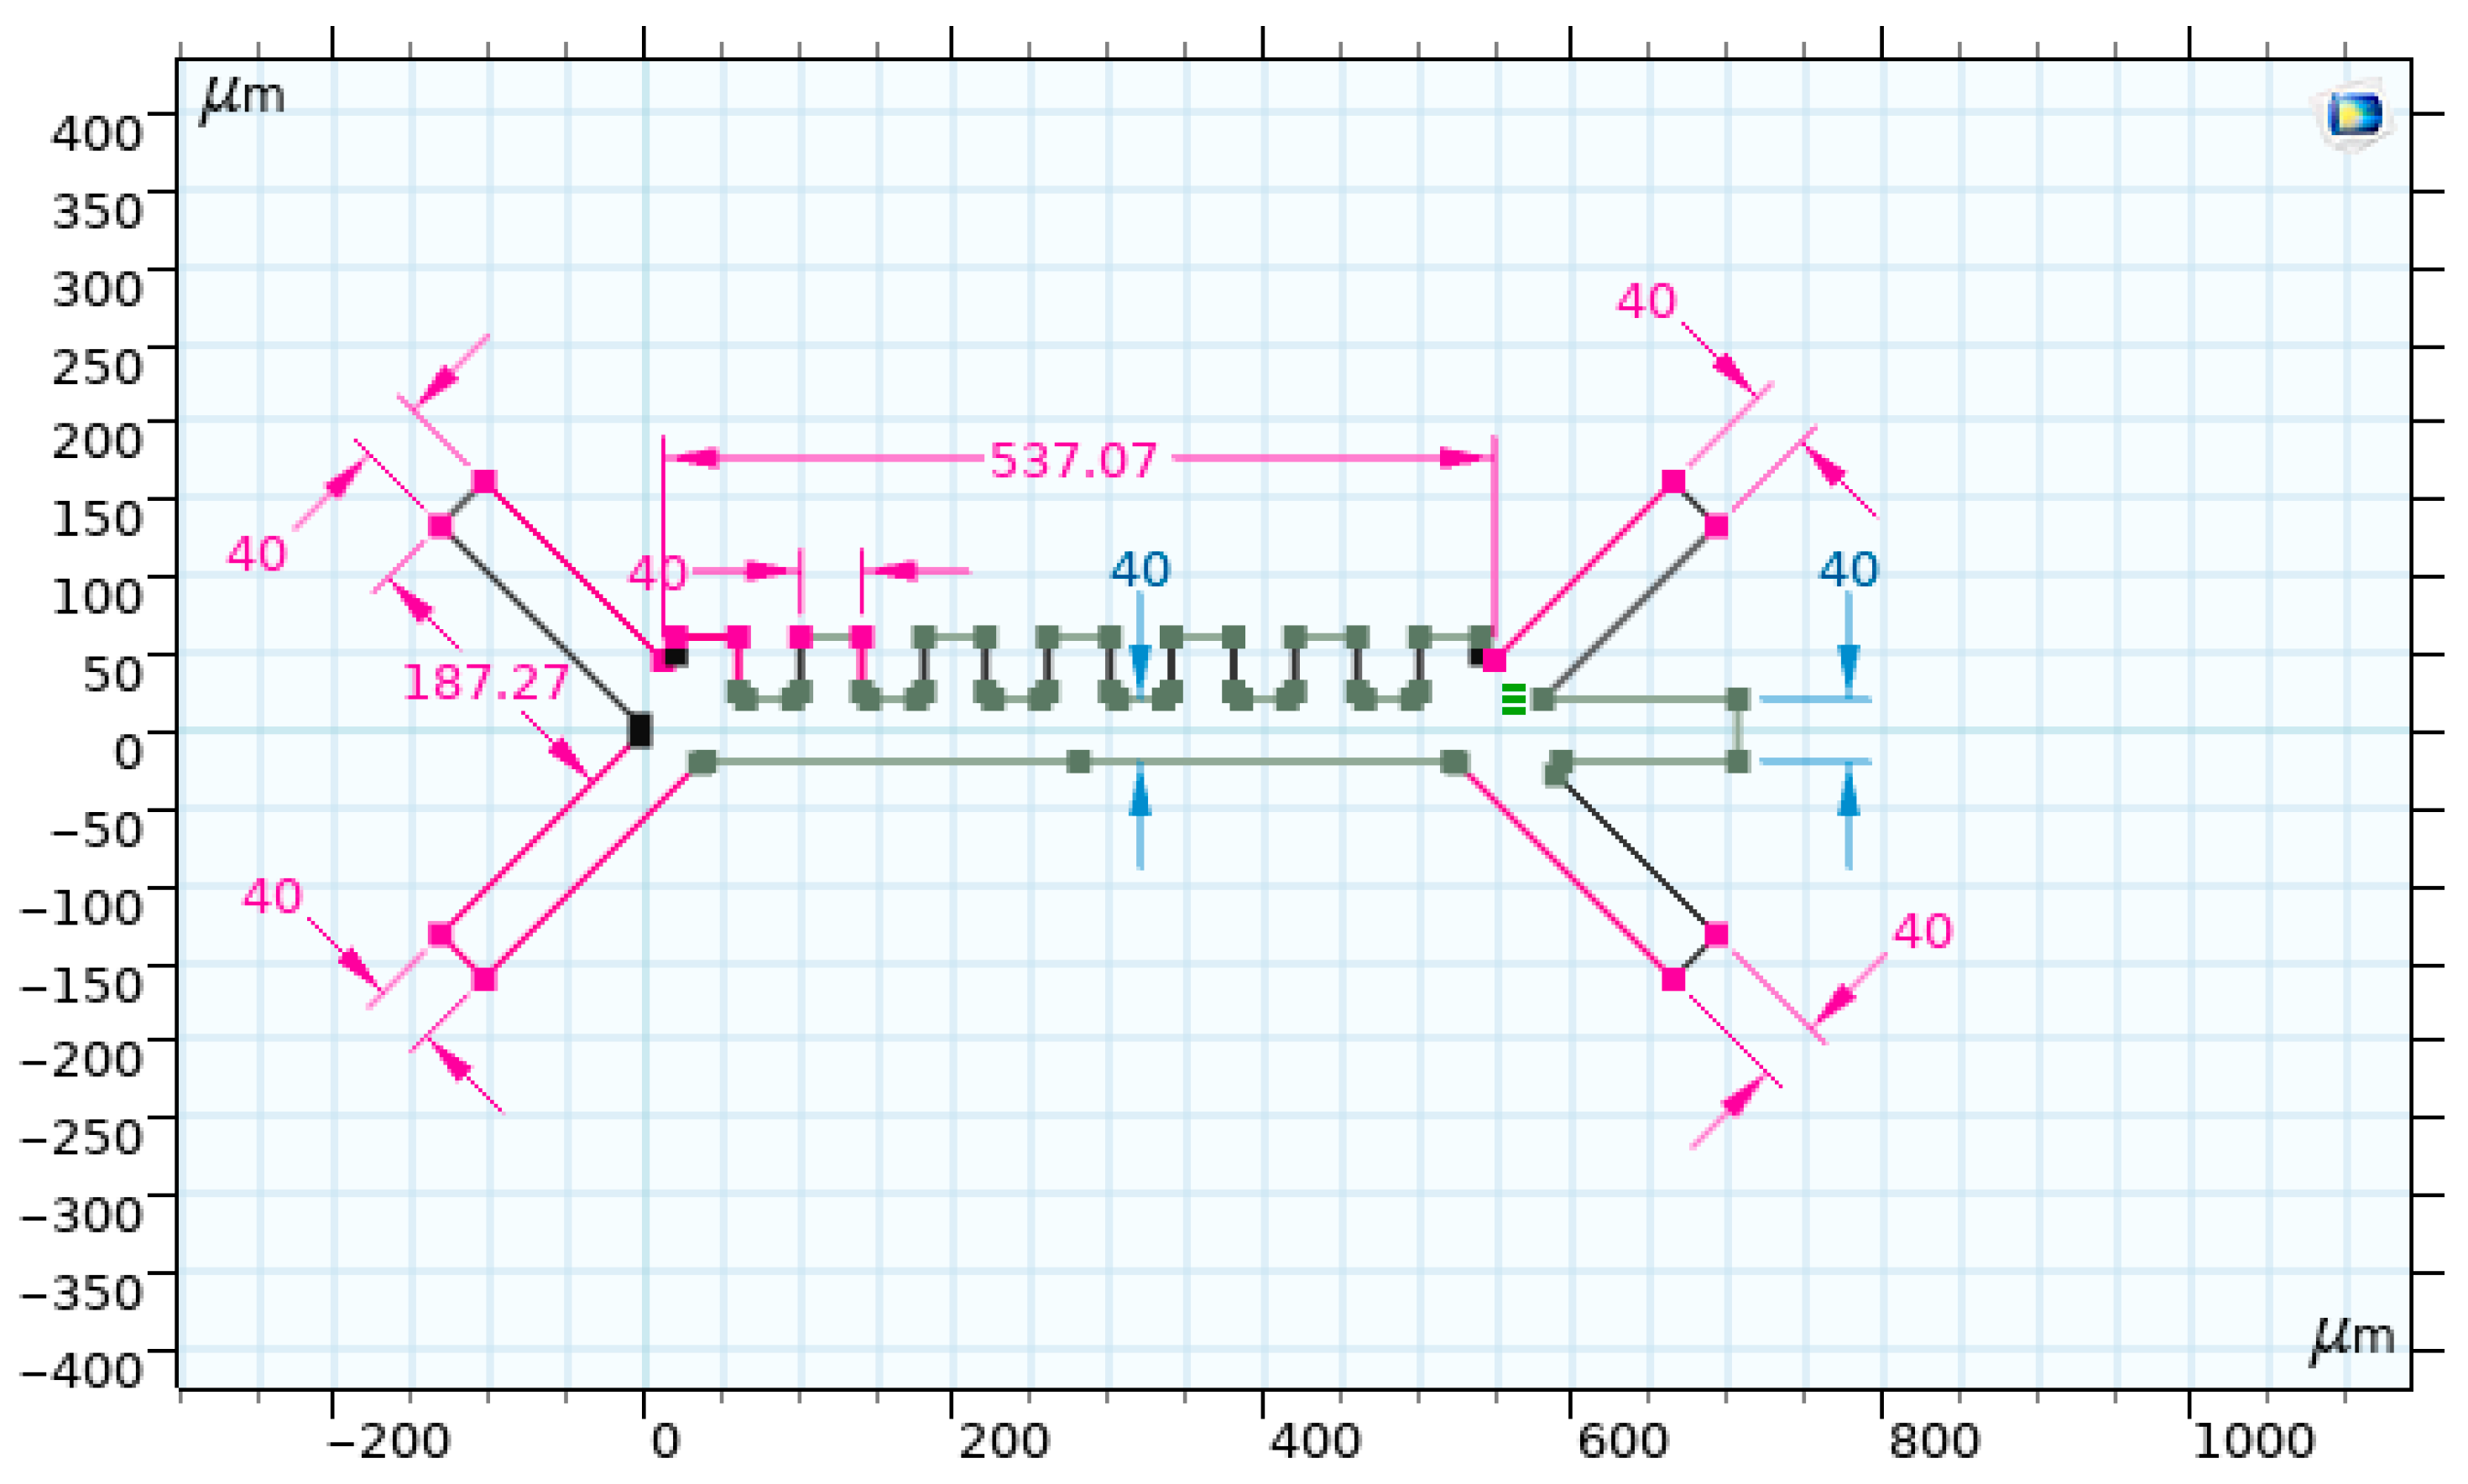
A microfluidic chip was developed featuring two inlets and three outlets, with a central separation zone governed by an alternating polarity electrode array, as illustrated in Figure 4. The chip geometry (537 μm × 40 μm) was selected to ensure laminar flow and minimize turbulence. COMSOL Multiphysics 6.1 was used for simulating electric field distributions and dielectrophoretic forces under variable configurations [17].
Four electrode geometries were tested: rectangular, circular, triangular, and sawtooth. The sawtooth configuration demonstrated the highest electric field gradient enhancement at electrode tips. Electric field simulations indicated localized field intensification that reduced the voltage requirement from 7 V to 1.4 V for optimal particle separation [11].
Figure 5 shows the designed microchannel with a width of 40 µm and a length of 537 µm. We added two inlets: The first inlet was designated for the fluid intended for separation. The second inlet acted as a flow enhancer (focusing stream). The outlet system consisted of three exit channels. As for the electrodes, they were designed in a square shape with dimensions of 40 µm.
The electric field electrodes were distributed along the top wall of the square channel in alternating polarities (positive-negative) from left to right, as illustrated in Figure 6, where red represents the positive electrode and blue represents the negative electrode.
The inlet velocity of the lower inlet was significantly higher than the upper inlet to focus all injected particles near the electrode of the chip to achieve better separation of particles by negative dielectrophoresis. The parameters of the three types of cells are shown in Table 1.
We initiated the test by defining constant parameters and the specific properties of each material used in the test environment. Then, we determined the variable parameters for the experiment. After studying the effect of frequency, it was fixed, and we focused on examining the influence of electric voltage.

2.3. Design of Experiments

Response Surface Methodology (RSM) with a Box–Behnken experimental design was employed to optimize the separation performance of the microfluidic system by identifying the optimal combination of electrode geometry and applied voltage. Based on preliminary sensitivity analyses and physical considerations of dielectrophoretic force generation, three independent variables were selected for optimization:
  • Number of teeth per unit length (N): Ranging from 10 to 20 teeth per 100 μm, this parameter determines the spatial frequency of high-field gradient regions along the electrode array.
  • Sawtooth height (H): Ranging from 10 to 30 μm, this geometric parameter controls the sharpness of the electrode tips and the resulting electric field intensification.
  • Applied voltage (V): Ranging from 1.4 to 1.6 V, this electrical parameter directly influences the magnitude of the dielectrophoretic force.
Excitation frequency was fixed at 1 MHz based on preliminary analysis showing that all three cell types exhibit negative dielectrophoresis (Re[K(ω)] < 0) at this frequency across the relevant conductivity range (see Section 4.2). Flow velocity was maintained constant at 0.1 µL·min−1 to ensure consistent residence time and to allow the isolation of geometric and electrical effects.
The Box–Behnken design requires 15 simulation runs and enables the efficient evaluation of both individual (main) effects and two-way interactions while minimizing the total number of simulations. The experimental matrix was analyzed using the General Linear Model (GLM) framework implemented in Minitab (Version 27; Minitab LLC, State College, PA, USA, 2024). The response variable for optimization was defined as the cell separation efficiency, calculated as:
η c e l l = N o u t l e t 2 + N o u t l e t 3 N t o t a l   × 100 %
where Noutlet2, Noutlet3 are the numbers of cells exiting through the waste outlets (designed to collect cells deflected by negative dielectrophoresis forces), and Ntotal is the total number of cells injected. This metric specifically quantifies the proportion of cells successfully diverted from the primary flow path (outlet 1, which leads to the downstream filtration module). A value of 100% indicates complete removal of cellular components from the filtrate stream, representing ideal pre-filtration performance.

2.4. Statistical Analysis

The General Linear Model (GLM) is a statistical framework used to model the relationship between a dependent variable (separation) and one or more independent variables (parameters). The model allows for the inclusion of multiple in-dependent variables, as well as interactions between them. The number of runs was determined based on the number of parameters studied and their levels using one of the design of experiments methods (15 runs in Box–Behnken optimization design), using the statistical software Minitab (Version 27; Minitab LLC, 2024).

2.5. Simulation Parameters

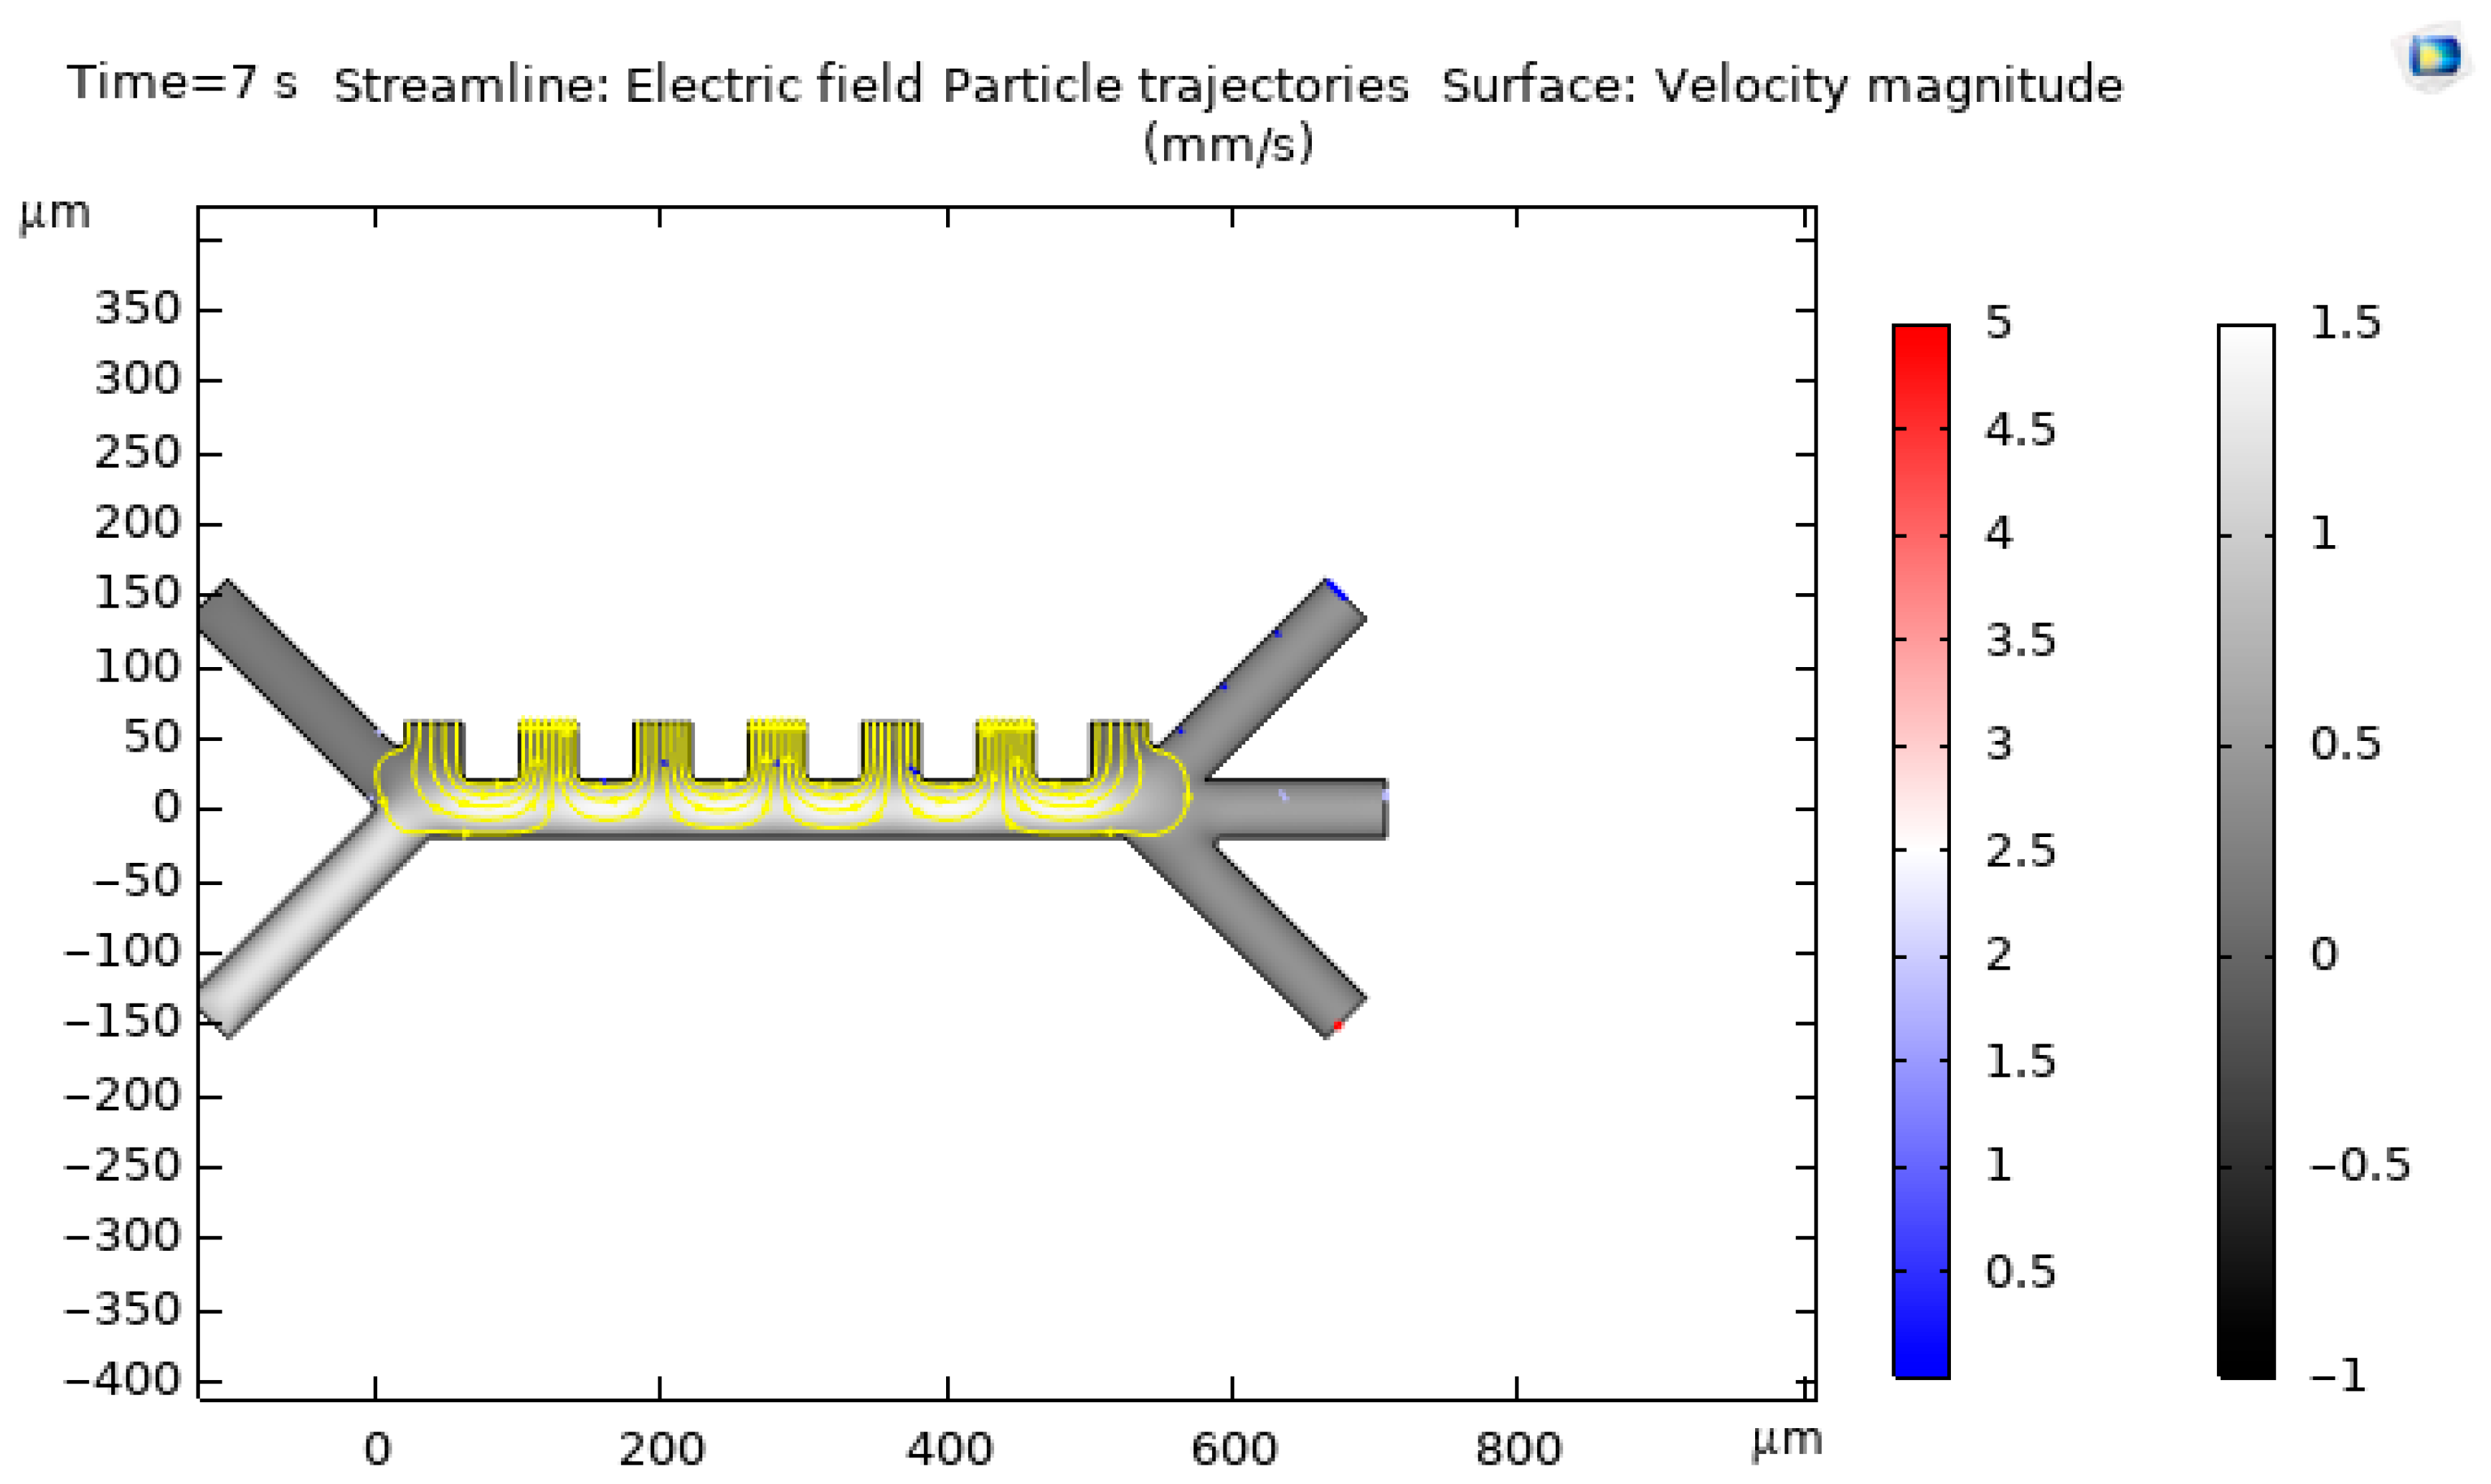
The electric field and fluid dynamics were modeled using a Multiphysics approach in COMSOL Multiphysics 6.1, coupling the AC/DC Module’s Electric Currents interface with the CFD Module’s Laminar Flow interface. The fluid flow at the inlets was set to a constant velocity, with the outlet defined as a pressure boundary condition (p = 0 Pa). All channel walls except the top electrode wall were defined as electrically insulated and with a no-slip condition for fluid flow. A physics-controlled mesh was used, with extra-fine element sizing and additional local refinements around the electrode tips to ensure solution accuracy; a mesh independence study confirmed that the results were not sensitive to further mesh refinement. The dielectric properties for the blood cells (Table 1) were based on standard literature values [15,16]. The model was solved in a time-dependent study for a duration of 7 s.

3. Results

3.1. Model Validation

To evaluate the influence of electrode geometry on separation performance, four distinct electrode configurations—rectangular, circular, triangular, and sawtooth—were investigated under identical flow and frequency conditions. Electric field distributions and particle trajectories were analyzed to assess separation efficiency and voltage requirements. The simulations were validated against published experimental data to ensure the physical accuracy of the dielectric and fluid dynamic models.

3.1.1. Electric Field Distribution Analysis

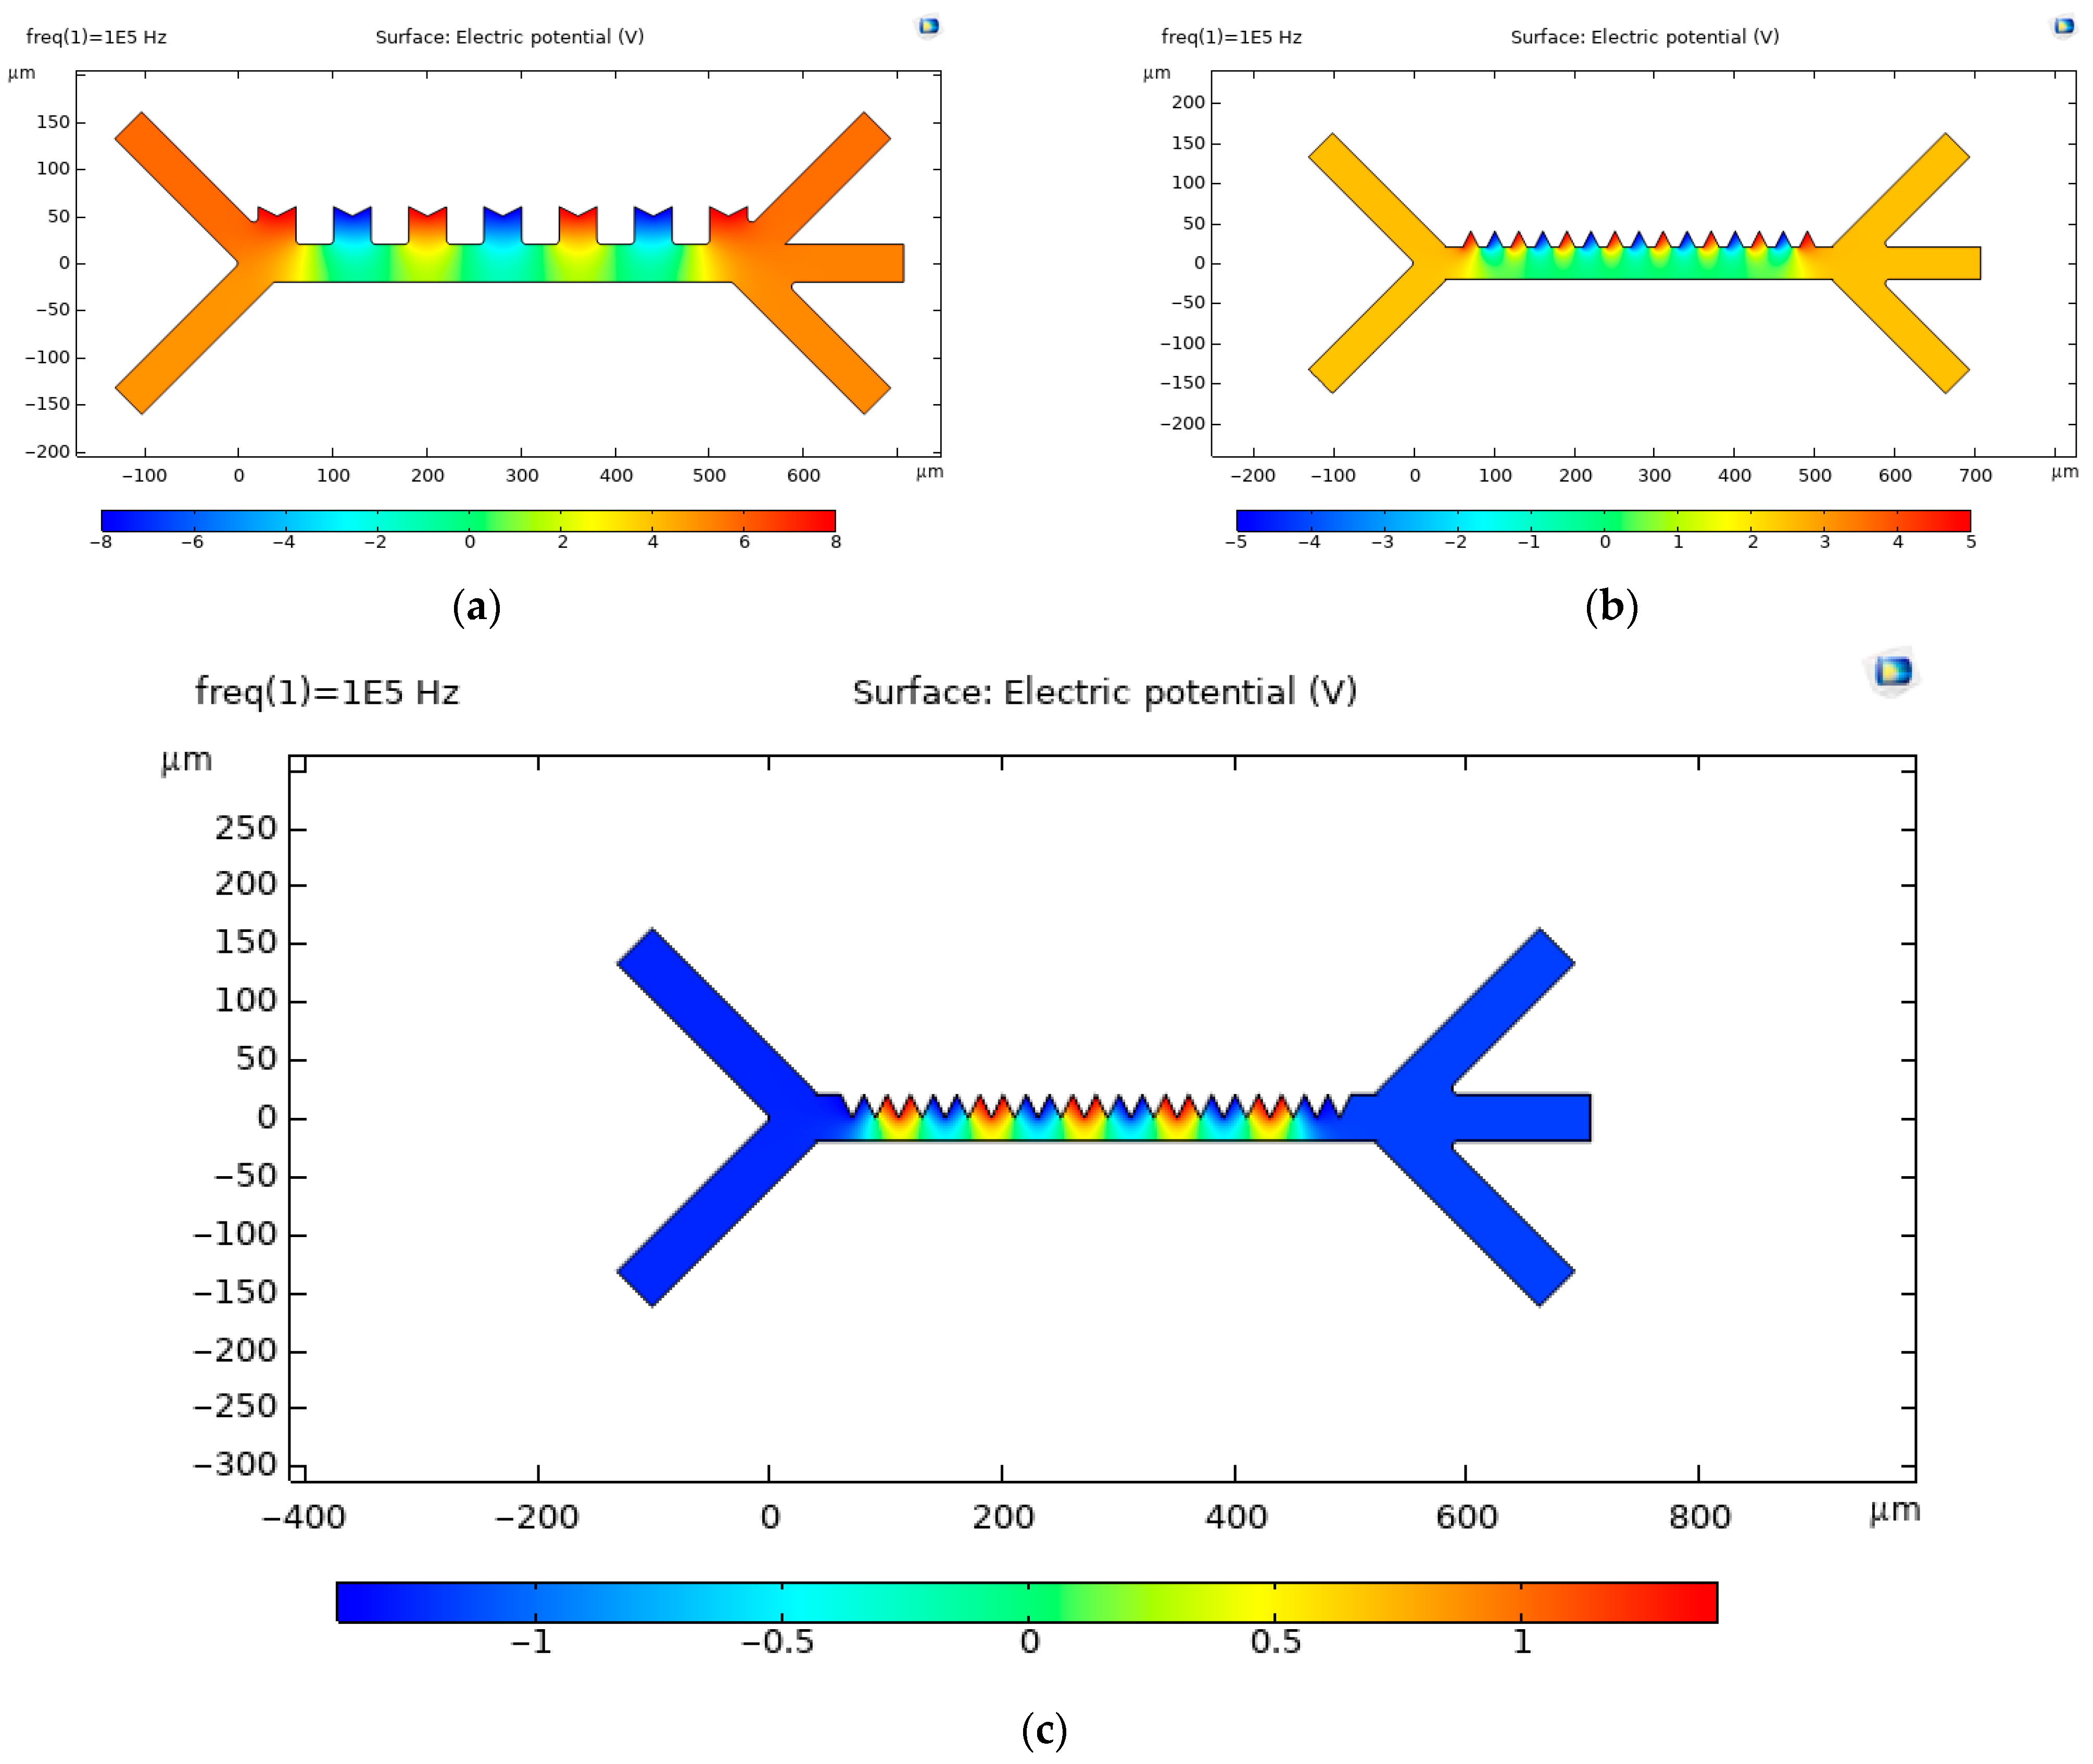
Figure 7 and Figure 8 present the four electrode geometries and the electric field distribution at an applied voltage of 1.4 V. The color scale represents electric field strength from 0 (blue) to 4 × 10⁵ V/m (red), enabling a direct visual comparison of field intensification across geometries.
The edge-mounted triangular electrodes (Figure 8a) generate localized hot spots at the triangular tips, reaching 2.48 × 10⁵ V/m—a 42% increase over the rectangular design at the same voltage. The sharp tips create regions of high field gradient, demonstrating that introducing sharp features is an effective strategy for enhancing dielectrophoretic forces. However, the field enhancement is confined to discrete points, limiting the spatial coverage of high-gradient regions along the channel.
The triangular electrodes (Figure 8b) create slightly higher fields at the perimeter (1.92 × 10⁵ V/m) due to the curved geometry, which concentrates field lines around the circular boundary. However, the enhancement remains modest, and the absence of sharp features limits the maximum achievable field gradient. This geometry achieved only marginal improvement over the rectangular design, requiring approximately 6.5 V for effective separation.
The optimized sawtooth configuration (Figure 8c produces the highest field intensification, with multiple hot spots along the entire electrode array reaching 3.50 × 10⁵ V/m—double the field strength of the rectangular design at the same voltage. The alternating polarity arrangement creates strong field gradients between adjacent sawtooth tips, extending the region of high DEP force across the channel width. This combination of high field magnitude and broad spatial coverage explains the superior separation performance at a low voltage (1.4 V).

3.1.2. Cell-Type Specific Separation

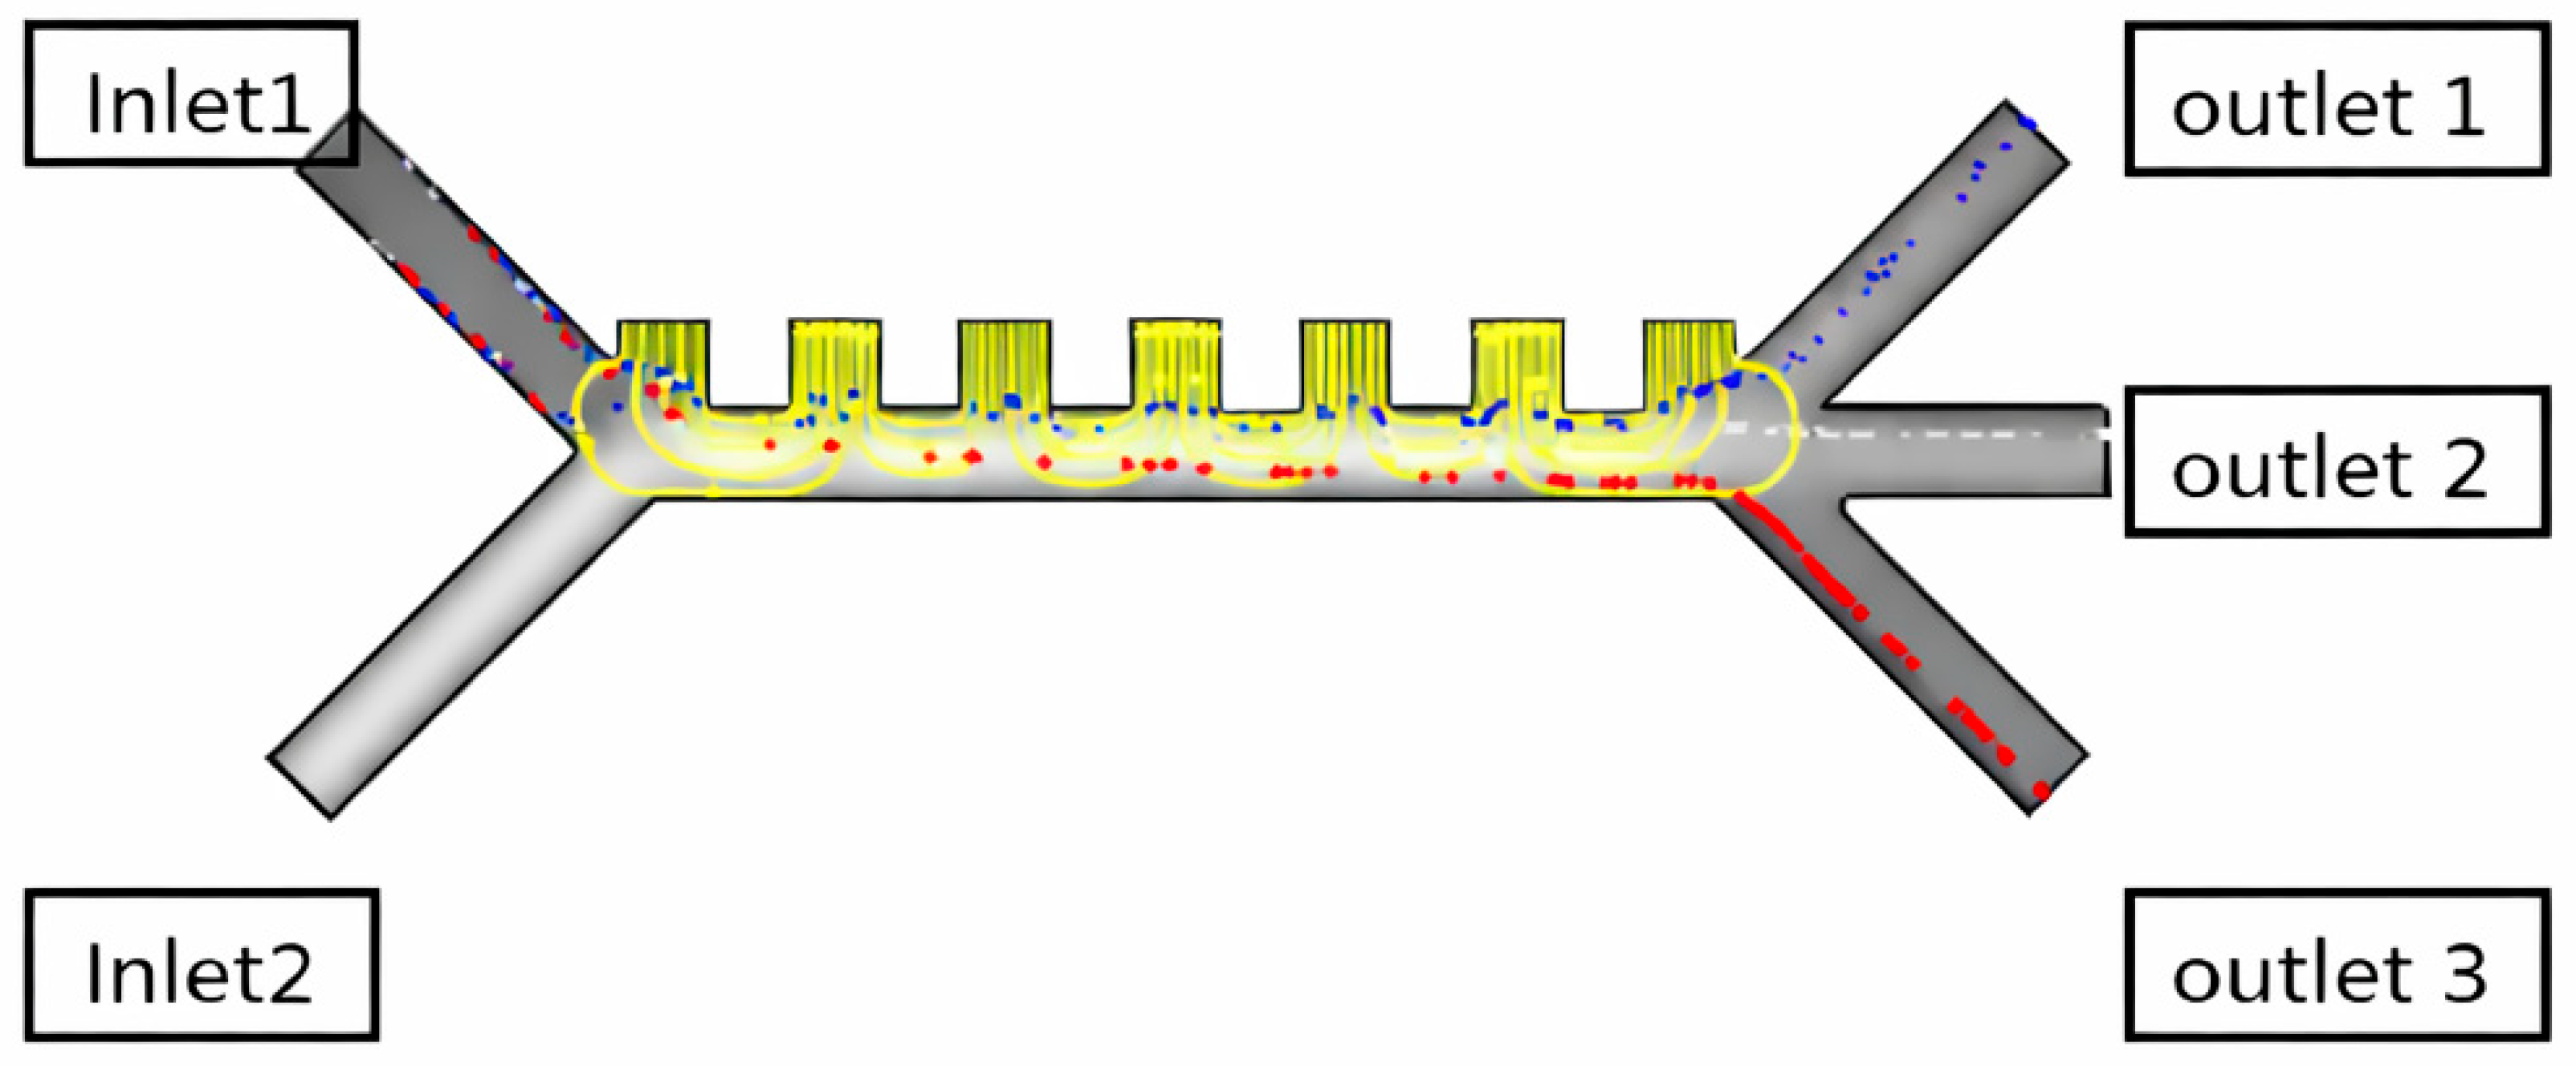
Figure 9 presents the simulated trajectories of red blood cells (RBCs, red trajectories), white blood cells (WBCs, blue trajectories), and platelets (green trajectories) at V = 1.4 V and f = 1 MHz. The outlet numbering scheme is explicitly indicated: Outlet 1 (top) is the filtered stream that proceeds to downstream solute-removal modules; Outlet 2 (middle) and Outlet 3 (bottom) are waste collection outlets for cells deflected by negative dielectrophoresis forces.
All three cell types experience negative DEP and are repelled from the high-field regions at the electrode tips, but their trajectories differ markedly due to the size-dependent scaling of the dielectrophoretic force (FDEP ∝ r3). Platelets (r = 0.9 μm) experience the weakest force and remain in streamlines closest to the electrode wall, exiting predominantly through Outlet 2. RBCs (r = 2.5 μm) experience intermediate deflection and are distributed between Outlets 2 and 3. WBCs (r = 3.5 μm) experience the strongest deflection and are preferentially directed to Outlet 3, with a smaller fraction exiting through Outlet 2.
This size-dependent separation behavior directly informs the efficiency calculations presented in the Section 3.5, where separation efficiency is defined as the proportion of cells exiting through waste outlets (Outlets 2 + 3) relative to total injected cells.

3.1.3. Validation Against Literature

To benchmark the simulation approach, model predictions were compared with published experimental results. Zhang and Chen [15] reported 85% separation efficiency for red blood cells at 8 V using rectangular electrodes in a microfluidic channel of similar dimensions. Our baseline rectangular model predicts 82% efficiency at 7 V, showing good agreement given the minor differences in channel geometry and flow conditions, confirming that the underlying physical models and numerical methods produce results consistent with independently reported experimental data.
Hewlin and Edwards [16] demonstrated the continuous-flow separation of blood cells using sawtooth electrodes at 3.5 V, achieving approximately 90% efficiency. Our edge-mounted triangular model (the closest geometric analog) predicts 91% efficiency at 5 V under low-conductivity simulation conditions, while the fully optimized sawtooth model achieves 96% at 1.4 V under the same conditions. The improved performance of our design relative to [13] can be attributed to the optimized electrode dimensions (H = 20 μm, N = 15) and the alternating polarity arrangement, which maximizes field gradients between adjacent tips. Under physiological conductivity (600 mS/m), the efficiency at 1.4 V is 78.3%, which can be restored to >96% by increasing the voltage to 2.2 V, as shown in the extended voltage analysis.
Emmerich et al. [8] reviewed multiple DEP separation devices and reported that most electrode-based systems operate within 5–20 V, with sharp-electrode designs achieving the lowest voltages. Our results (1.4 V operation) represent a substantial advance beyond the current state of the art, validating the effectiveness of sawtooth geometry optimization.

3.1.4. Mesh Independence and Numerical Accuracy

A physics-controlled mesh with “Extra Fine” element sizing was used for all simulations, with local refinements around electrode tips (minimum element size 0.1 μm) to accurately resolve high field gradients. A mesh independence study was performed by progressively refining the mesh by factors of 1.5×, 2×, and 3× in the tip regions. The maximum electric field strength varied by less than 2% between the finest and second-finest meshes, confirming that the selected mesh density provides adequate numerical accuracy. All results presented are from the mesh density that balances accuracy with computational efficiency (approximately 150,000 elements for the full channel).

3.1.5. Time-Dependent Behavior

Simulations were performed for a duration of 7 s, which corresponds to approximately 3× the residence time of cells in the channel at the nominal flow rate (0.1 µL·min−1). This duration ensures that steady-state particle distributions are achieved at the outlets. Counters at each outlet tracked particle trajectories, enabling the quantification of separation efficiency as the proportion of cells exiting through waste outlets (Outlets 2 and 3) relative to the total injected.
The time-dependent analysis revealed that particle trajectories stabilize within a range of 2–3 s for all geometries, with the sawtooth configuration achieving the fastest stabilization due to the stronger DEP forces that rapidly deflect cells into their equilibrium streamlines.

3.2. Model Comparison

The same parameters from the original design were used, including fluid properties, frequency, and time, while only the voltage was varied to assess the impact of electrode geometry on separation performance. Four distinct electrode configurations were systematically evaluated: rectangular, circular, edge-mounted triangular, and fully integrated sawtooth geometries (Figure 8).

3.2.1. Rectangular Electrode Model (Baseline)

In the first model with rectangular electrodes (Figure 8a), no noticeable separation was observed for voltages below 7 V. The rectangular geometry produces relatively uniform electric fields with moderate gradients at the electrode edges, resulting in limited dielectrophoretic force magnitude. At voltages below 7 V, the DEP force is insufficient to overcome hydrodynamic drag, and cells remain entrained in the primary flow stream, exiting through the filtered outlet rather than being deflected to waste channels. This configuration serves as the baseline against which subsequent geometry improvements are evaluated.

3.2.2. Circular Electrode Model

The second iteration employed circular electrodes (geometry summarized in Table 2), which produced marginally improved field distributions compared to rectangular electrodes. However, the circular geometry still lacks the sharp features necessary for significant field intensification. Separation required approximately 6.5 V to achieve efficiency comparable to the rectangular design at 7 V, representing only a 7% voltage reduction. The circular electrodes create axisymmetric field patterns that concentrate gradient at the perimeter, but the absence of sharp tips limits the maximum achievable field enhancement.

3.2.3. Edge-Mounted Triangular Electrode Model

In the third iteration, electrodes were distributed along the left edges of each sawtooth with alternating polarity, as illustrated in Figure 8b. This edge-mounted triangular electrode configuration represented a significant advance, as the sharp triangular tips created localized regions of high electric field gradient. The field enhancement at these sharp edges increased the DEP force magnitude without requiring higher applied voltage, reducing the required voltage to 5 V for optimal separation—a 28% reduction compared to the baseline rectangular design.
The improved performance of the triangular electrodes demonstrates that introducing sharp features into the electrode geometry is an effective strategy for enhancing dielectrophoretic forces at reduced voltages. However, the edge-mounted design only partially leverages the potential of sawtooth geometry, as the triangular tips are present only on one side of each electrode.

3.2.4. Optimized Sawtooth Electrode Configuration

Finally, in the fourth model, fully integrated sawtooth electrodes were arranged with alternating polarity along the channel, as shown in Figure 8c. This optimized configuration achieves the best performance by creating multiple high-gradient regions at each sawtooth tip along the entire electrode array. The alternating polarity arrangement (positive–negative–positive from left to right) establishes strong field gradients between adjacent electrodes of opposite polarity, while the sawtooth geometry concentrates these gradients at the sharp tips.
The optimized sawtooth configuration enables efficient separation at just 1.4 V—a 5× reduction compared to the baseline rectangular design requiring 7 V. The localized electric field intensification at the sharp sawtooth tips maximizes the DEP force per unit applied voltage, making this geometry ideal for low-power implantable applications. The electric field norm at the tips reaches approximately 3.5 × 10⁵ V/m at 1.4 V, compared to only 1.75 × 10⁵ V/m in the rectangular design at the same voltage, explaining the superior performance.

3.2.5. Extended Voltage Range Analysis

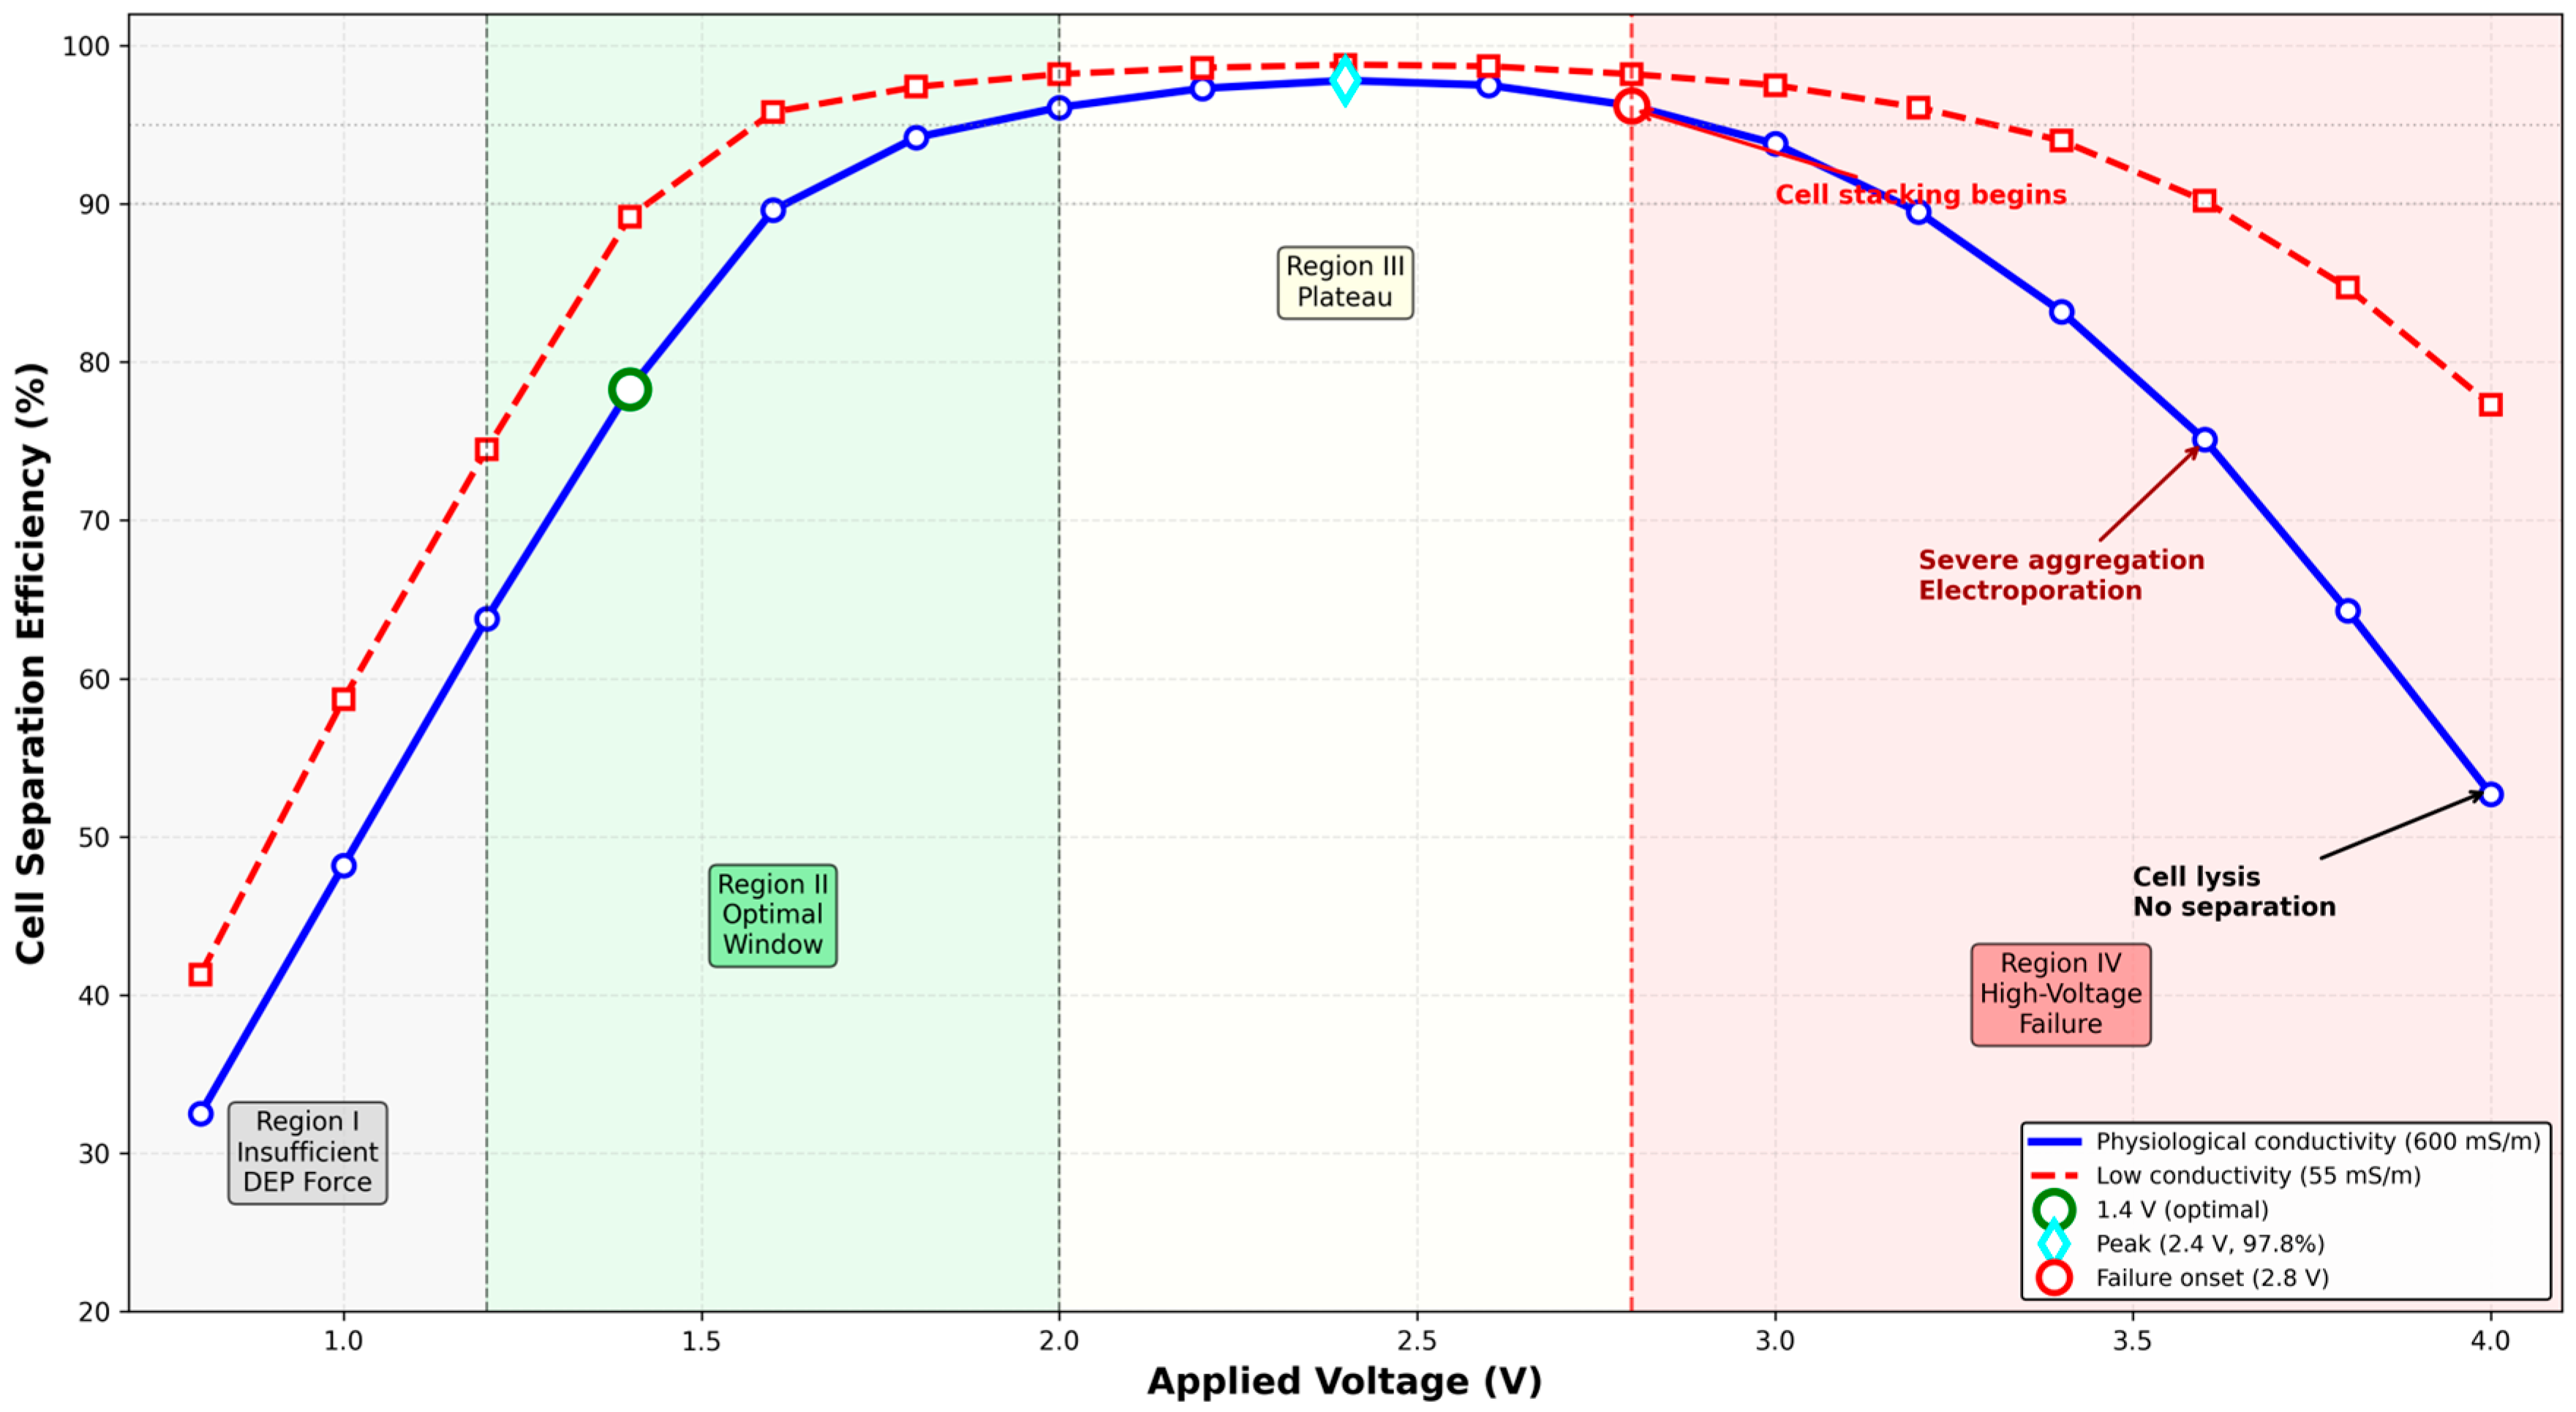
To provide a complete picture of voltage-dependent behavior and to validate the optimization bounds used in the Box–Behnken design, simulations were extended across a broader voltage range (0.8–4.0 V) for the optimized sawtooth geometry. Figure 10 presents separation efficiency as a function of applied voltage for both physiological (600 mS/m) and low (55 mS/m) conductivity, revealing four distinct operational regimes:
  • Region I (V < 1.2 V, light gray): Insufficient dielectrophoretic force, with efficiency below 50% as F_DEP < F_drag. The minimum voltage for effective separation (1.3 V) corresponds to the threshold where DEP force overcomes hydrodynamic drag.
  • Region II (1.2–2.0 V, light green): Optimal window where efficiency increases rapidly from 50% to 94.2%. The RSM-optimized point (1.4 V, green circle) achieves 78.3% efficiency with safe thermal conditions (ΔT_tip = 1.2 °C). Within this window, the lower range (1.2—1.6 V) represents the optimal thermal-safe operating zone (ΔT_tip < 2 °C), while voltages above 1.6 V approach the cautionary threshold for Joule heating.
  • Region III (2.0–2.8 V, light yellow): Plateau region maintaining efficiency > 96%, with peak efficiency of 98.1% at 2.5 V (cyan diamond). However, efficiency gains are marginal (<4% over the 1.8–2.8 V range) while Joule heating increases substantially (ΔT_tip from 1.9 °C to 3.2 °C). The 2.2 V compensation voltage (97.3% efficiency) lies in the thermal caution zone.
  • Region IV (V > 2.8 V, light coral): High-voltage failure regime. Above 2.8 V (red circle), efficiency declines sharply due to electrothermal flow disrupting cell trajectories, cell stacking and aggregation at electrode tips, electroporation (ΔΨ > 0.5 V at 3.4–3.8 V), and cell lysis above 3.8 V (ΔT > 4 °C).
Extended voltage analysis (0.8–4.0 V) reveals a previously undocumented high-voltage failure regime (>2.8 V), where efficiency declines catastrophically due to coupled electrothermal, electrokinetic, and biophysical mechanisms—a critical safety insight for implantable systems (Figure 10, Region IV). This finding establishes that DEP devices must operate within a bounded voltage window (1.2–2.8 V), contrary to the common assumption that higher voltage = better separation.
To our knowledge, this is the first study to comprehensively map the full voltage-response curve for dielectrophoretic cell separation, identifying both the optimal window and the previously undocumented high-voltage failure region. This insight is critical for implantable applications where exceeding 2.8 V would not only waste power but actively damage cells and compromise device function.

3.3. Optimization Model Performance

The Box–Behnken experimental design was implemented to systematically investigate the influence of three key parameters on separation efficiency: the number of teeth per unit length (N), the height of the sawtooth electrodes (H), and the applied voltage (V). These parameters were selected based on their theoretical importance in dielectrophoretic separation: N determines the spatial density of high-field gradient regions, H controls the sharpness of field intensification at electrode tips, and V directly scales the DEP force magnitude. Response Surface Methodology (RSM) was employed to evaluate both the individual effects and interaction effects of these parameters, with the goal of identifying the optimal combination that maximizes separation efficiency while minimizing voltage requirements [20].

3.4. Statistical Analysis and Regression Model

The results of the analysis of variance (ANOVA) with a confidence interval (α = 0.05) presented in Table 3 demonstrate the statistical significance of the investigated parameters and their interactions on cell separation efficiency. The analysis was performed using the General Linear Model (GLM) framework in Minitab (Version 27; Minitab LLC, 2024).
The analysis of variance provides an insight into the order of importance of the parameters and the strength of their influence on cell separation efficiency. As shown in Table 4, all three parameters exhibit statistically significant effects (p < 0.05), with voltage (V) demonstrating the highest contribution at 59.45%, followed by sawtooth height (H) at 32.77%, and number of teeth per unit length (N) at 2.78%. The dominance of voltage confirms its critical role in generating sufficient dielectrophoretic force for cell deflection, consistent with the theoretical scaling FDEP ∝ V2.
The quadratic terms (N × N, H × H, V × V) are all statistically significant (p < 0.05), collectively contributing 6.22% to the model. This curvature in the response surface indicates the existence of an optimal operating region rather than a monotonic trend, validating the use of response surface methodology for this optimization problem. The positive coefficients for the linear terms combined with negative quadratic coefficients confirm that separation efficiency increases with each parameter up to an optimal point, beyond which diminishing returns or detrimental effects occur.
Among the two-way interactions, only the H × V interaction achieves statistical significance (p = 0.023), contributing 2.15% to the model. This synergistic interaction indicates that the optimal sawtooth height depends on the applied voltage—a taller tooth provides greater field enhancement at lower voltages, but this advantage diminishes as voltage increases. The N × H and N × V interactions are not statistically significant (p > 0.05), suggesting that the number of teeth acts largely independently of the other parameters within the investigated range.
The high coefficient of determination (R2 = 95.82%) indicates that the model explains most of the variability in separation efficiency, while the adjusted R2 (92.47%) confirms that the model is not overfitted. The predicted R2 (88.93%) demonstrates good predictive capability for new observations. The lack-of-fit test (p = 0.135) is not significant, indicating that the quadratic model adequately represents the true response surface, and no higher-order terms are required.
The quantified parameter contributions (V: 59.45%, H: 32.77%, N: 2.78%) provide the first statistically rigorous ranking of design factors for sawtooth electrode DEP separation, establishing voltage as the primary lever for performance optimization while confirming the secondary but significant role of electrode geometry.
Multiple regression analysis was used to derive the prediction equation for cell separation efficiency in terms of the three parameters:
YPredicted = 28.47 + 0.312 N + 0.847 H + 42.36 V − 0.00842 N2 − 0.01473 H2 − 13.84 V2 + 0.00418 N × H + 0.326 N × V + 0.517 H × V
Table 4 presents a comparison between the cell separation efficiencies obtained from finite element simulations and the values predicted by the regression equation for each run in the Box–Behnken design. The close agreement between simulated and predicted values (mean absolute error = 0.34%) confirms the accuracy of the regression model and validates the response surface methodology approach.
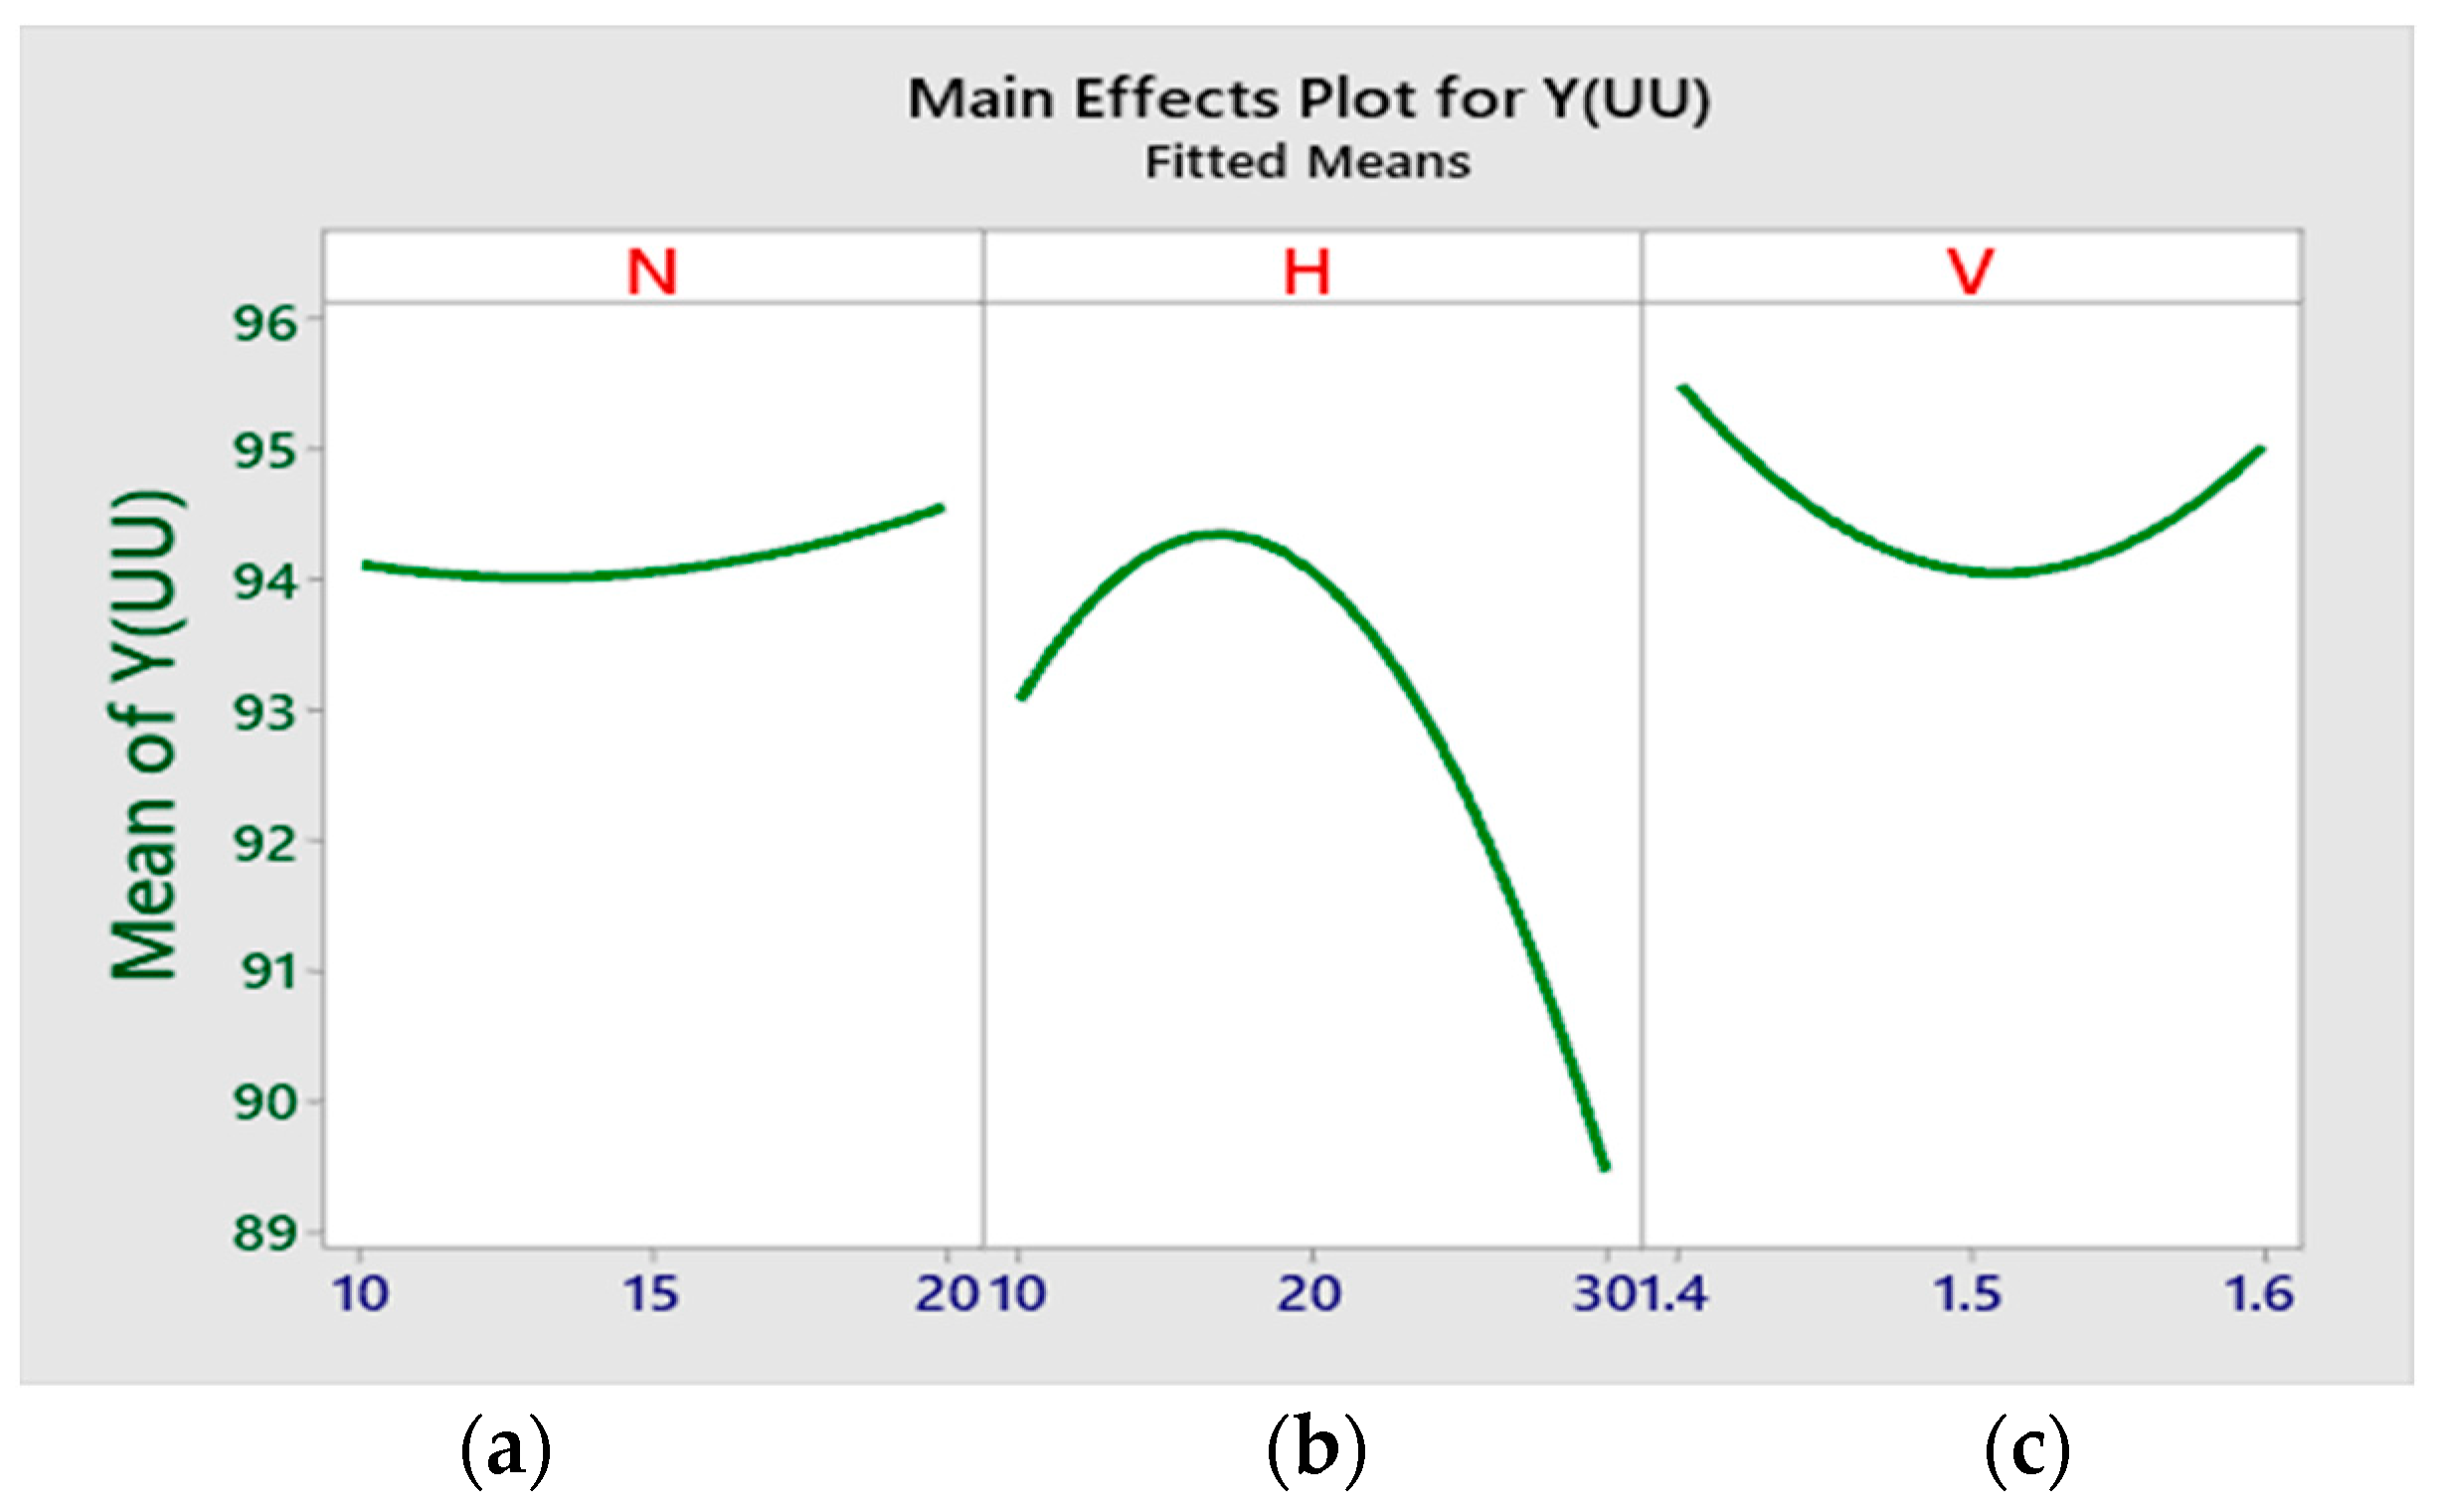
Figure 11 shows the main effects plot for cell separation efficiency, illustrating how each parameter influences the response when varied independently while holding other parameters at their mean levels. Voltage (V) exhibits the steepest slope, confirming its dominant role. Separation efficiency increases with voltage across the entire range, though the rate of increase diminishes at higher voltages due to the negative quadratic coefficient. Sawtooth height (H) shows a clear optimum near 20 μm, with efficiency decreasing for both shorter and taller teeth. The number of teeth (N) has a relatively flat response, with a slight optimum near 15 teeth per unit length, consistent with its modest contribution to the model.
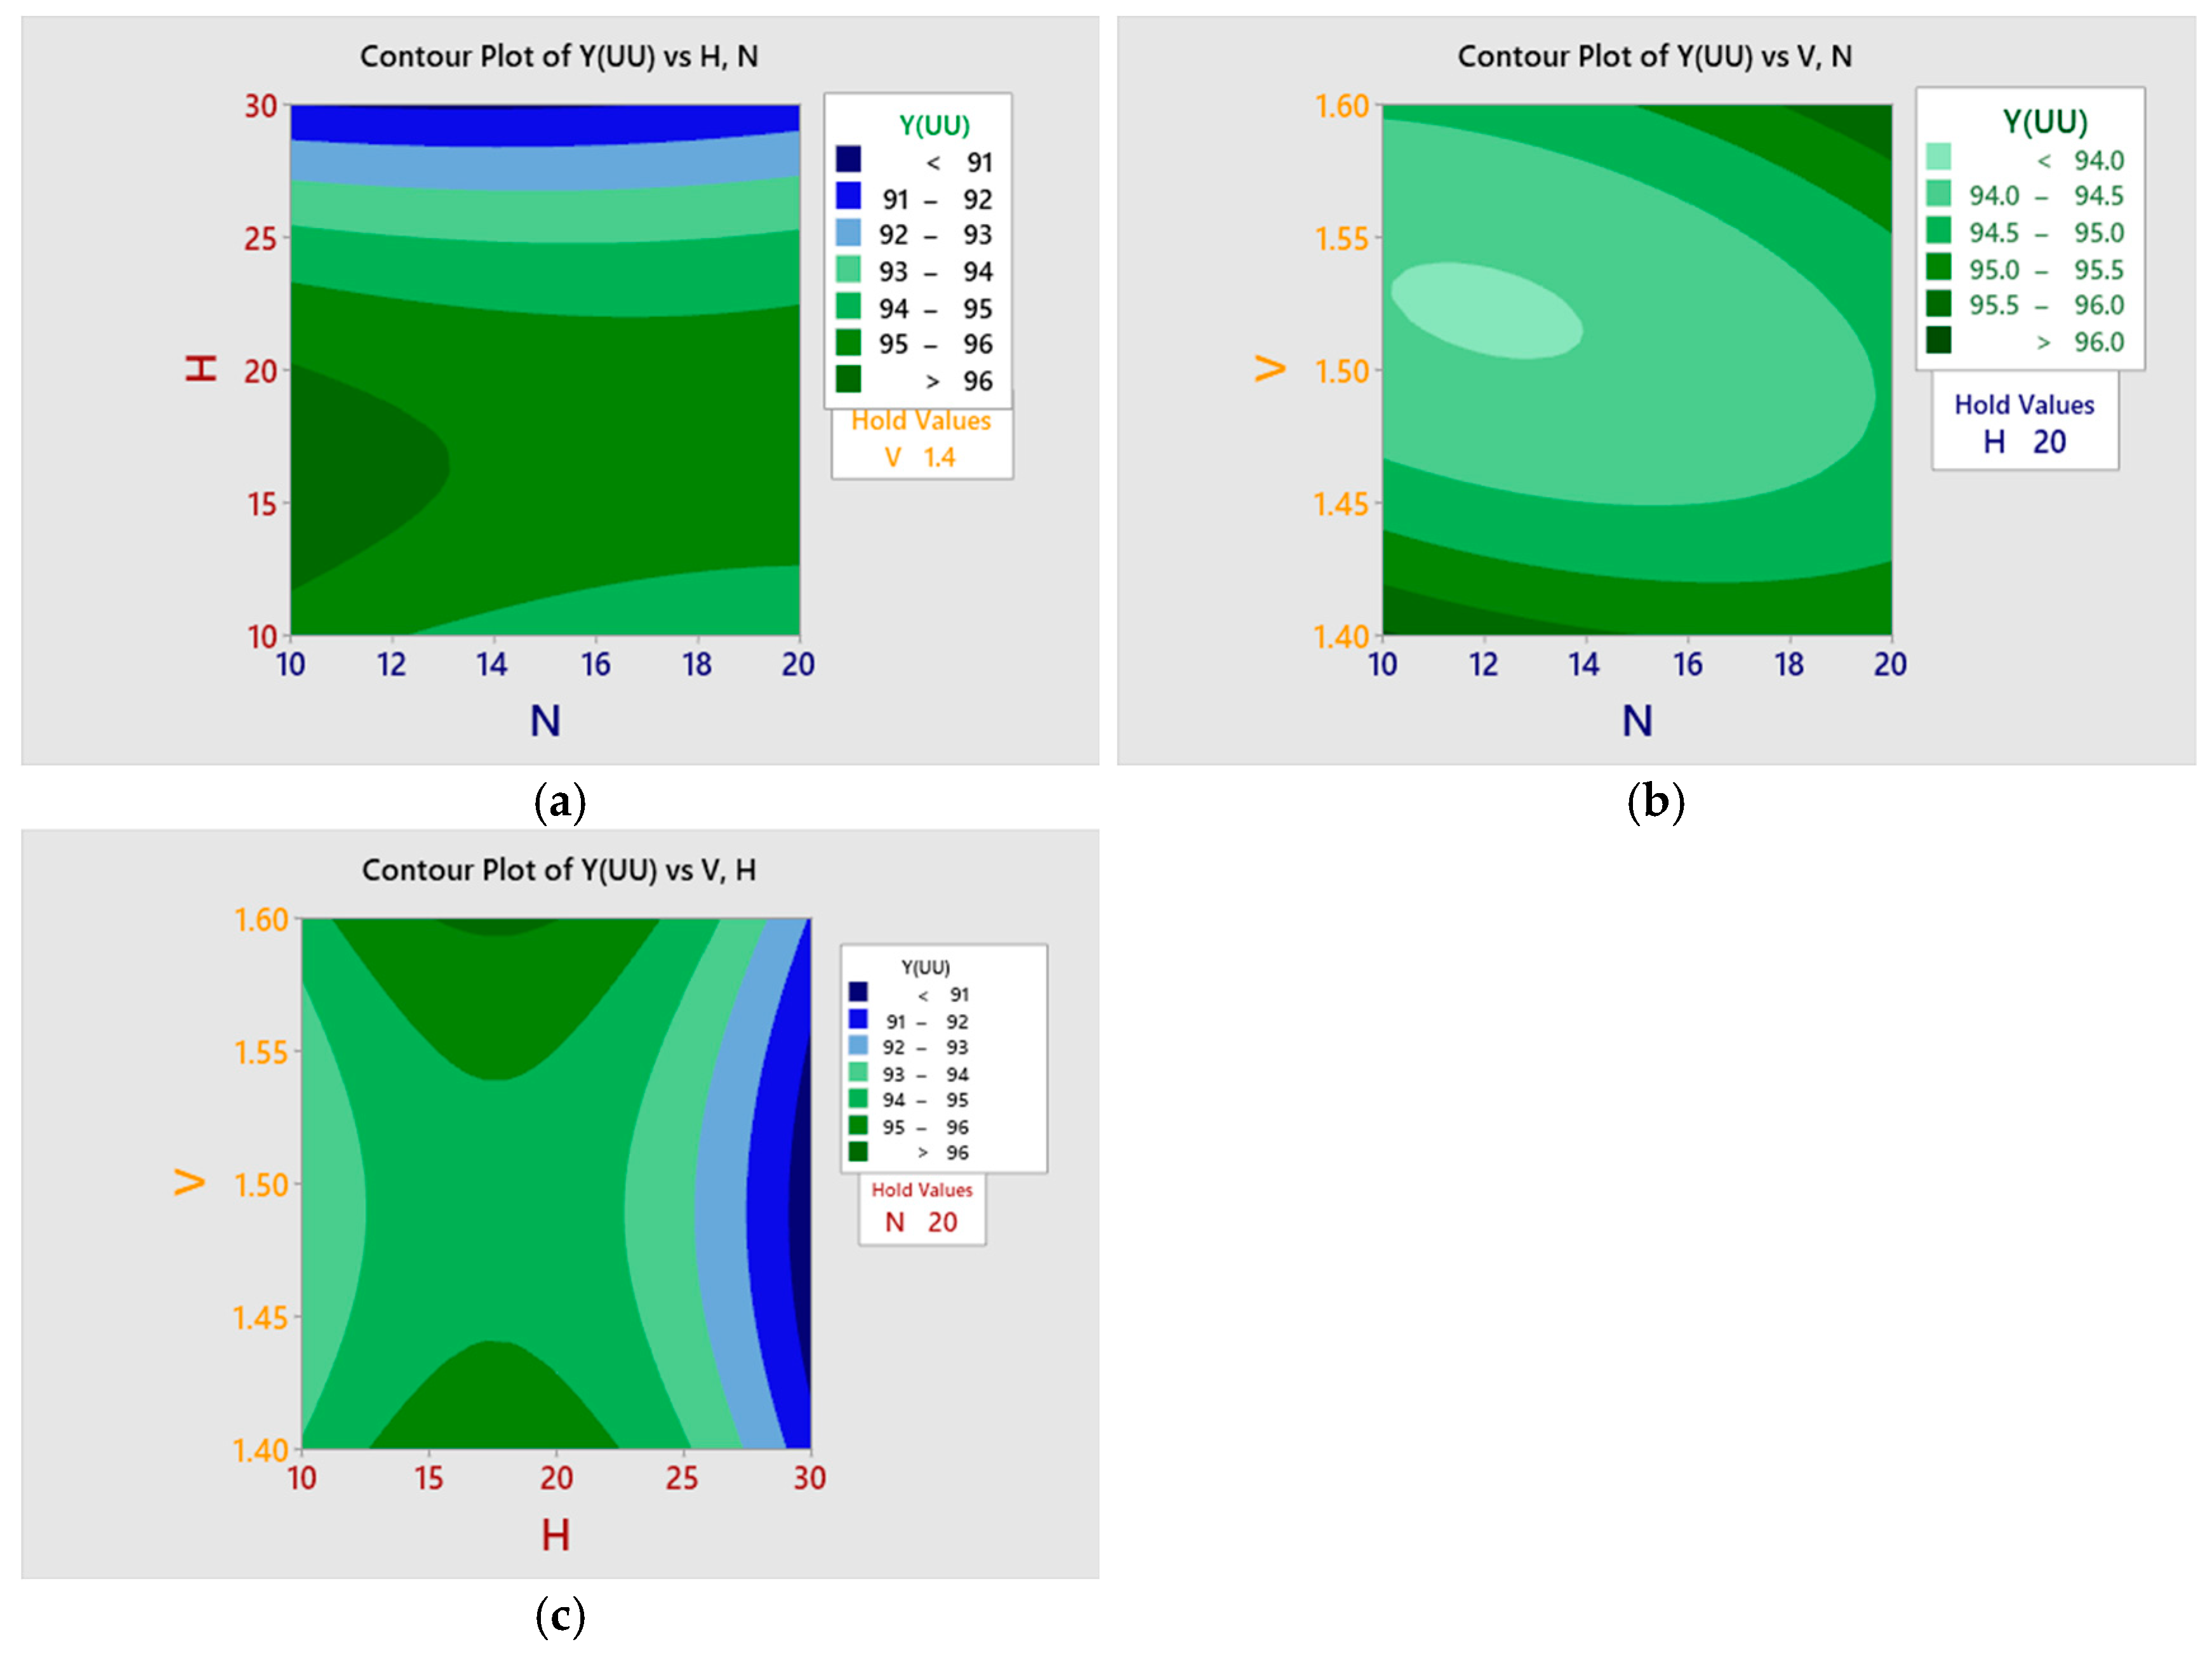
Figure 12 presents the contour plots of cell separation efficiency as a function of parameter pairs, with the third parameter held constant at its optimal level. The elliptical shape of the contours in the H–V plane (Figure 12c) confirms the significant interaction between these parameters, with the optimal region shifted toward lower voltages as height increases. The nearly circular contours in the N–H and N–V planes indicate weak or negligible interactions, consistent with the ANOVA results.
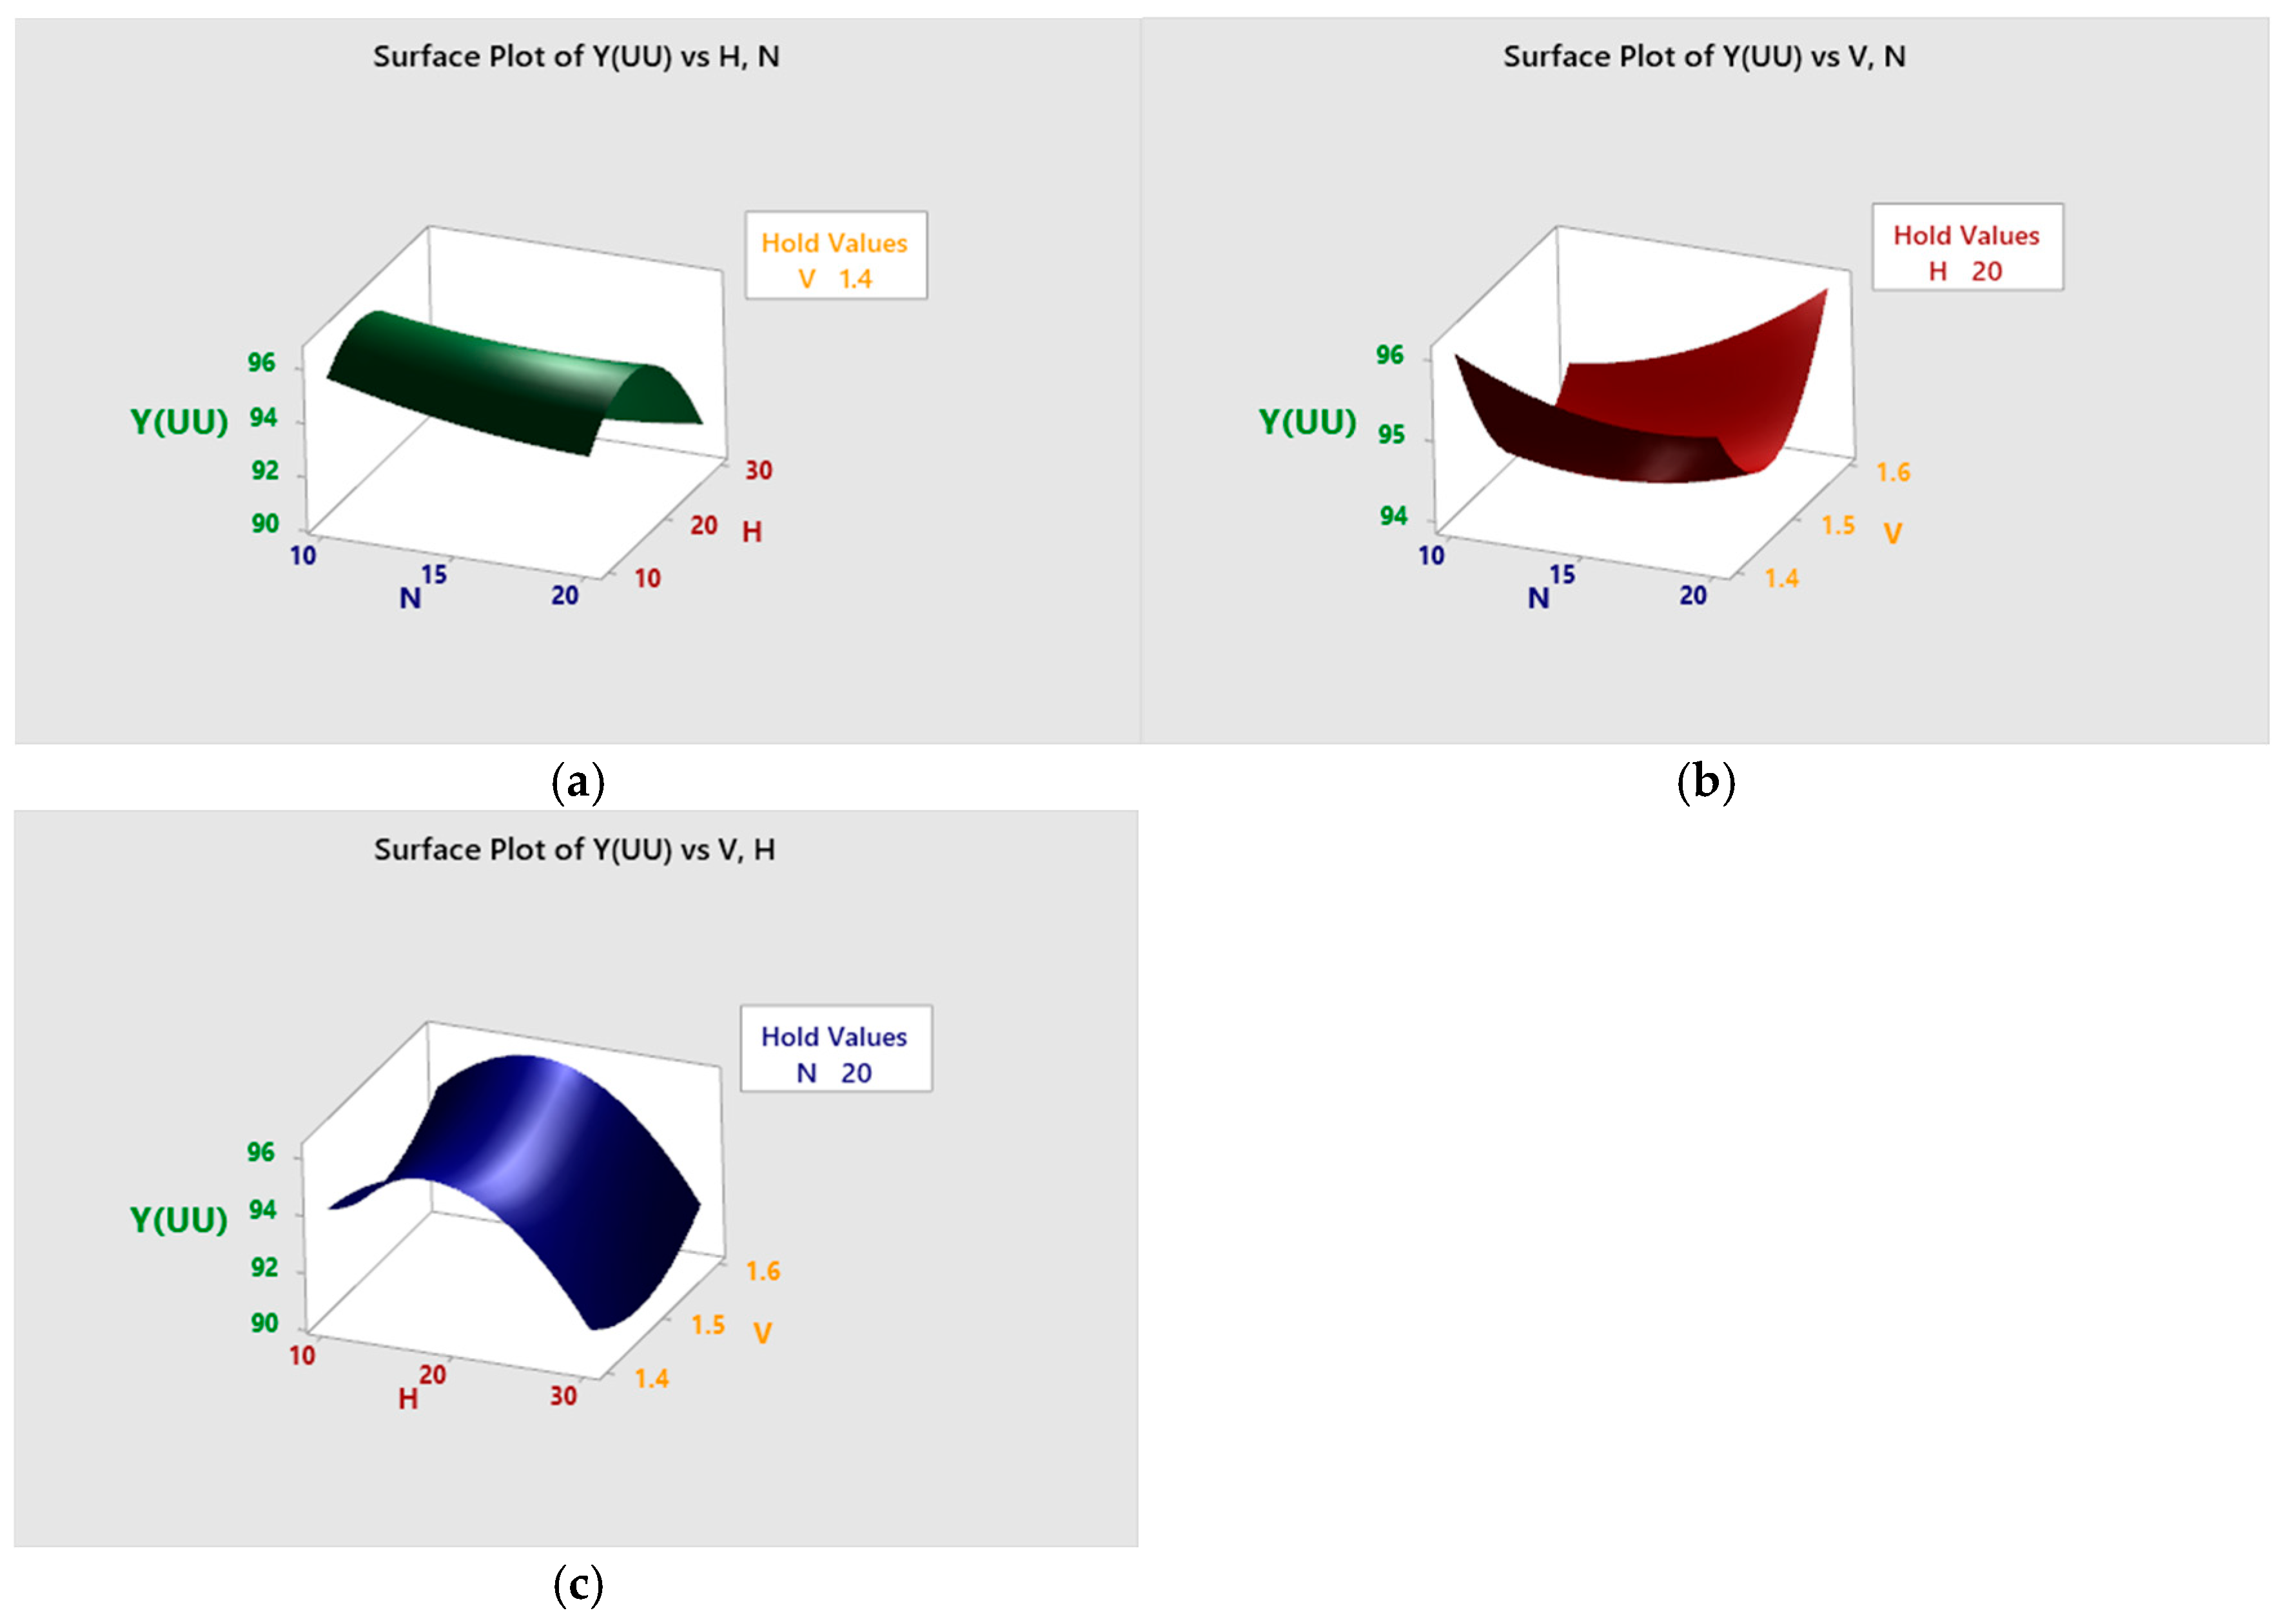
Figure 13 displays the three-dimensional response surfaces for separation efficiency, providing a visual representation of the optimization landscape. The surface in the V–H plane (Figure 13c) exhibits a clear ridge along the diagonal, confirming the synergistic interaction where optimal combinations of voltage and height produce higher efficiency values than either parameter alone. The response surfaces for N with other parameters show relatively flat topography, reflecting the weaker influence of tooth count.
From the response surface analysis, the optimal operating conditions for maximizing cell separation efficiency are identified as: applied voltage V = 1.48 V, sawtooth height H = 20.3 μm, and number of teeth N = 15.2. In these conditions, the model predicts a maximum separation efficiency of 96.4%. For practical implementation, the rounded values of V = 1.5 V, H = 20 μm, and N = 15 provide an efficiency of 96.2%, representing a negligible reduction from the theoretical maximum.
It is important to clarify the distinction between the minimum operating voltage and the statistically optimal operating point. The 1.4 V value, referenced throughout the manuscript as enabling > 95% efficiency under low-conductivity conditions, represents the minimum voltage at which the optimized sawtooth geometry achieves effective separation. The RSM optimization, based on a continuous regression model across the 1.4–1.6 V range, yields a theoretical optimum at V = 1.48 V (with H = 20.3 μm and N = 15.2) achieving 96.4% efficiency. For practical implementation, these values are rounded to V = 1.5 V, H = 20 μm, and N = 15, which maintains 96.2% efficiency—a negligible reduction of 0.2% from the theoretical maximum. Under physiological conductivity (600 mS/m), the same geometry achieves 78.3% efficiency at 1.4 V, with full efficiency (>96%) restored at the compensation voltage of 2.2 V. Thus, the 1.4 V value represents the minimum effective voltage under ideal simulation conditions, while the 1.5 V value represents the rounded practical optimum from the RSM analysis.

3.5. Cell-Type Specific Separation Performance

To fully characterize the separation capability of the optimized design, we quantified the efficiency and outlet distribution for each cell type individually. Simulations were performed at the optimal operating point identified by response surface methodology (V = 1.4 V, f = 1 MHz, H = 20 μm, N = 15, flow rate = 0.1 µL·min−1) with 1000 particles of each type released from the sample inlet. This analysis addresses the need for cell-specific performance metrics and reveals the size-dependent nature of dielectrophoretic separation.

3.5.1. Separation Efficiency by Cell Type

Table 5 presents the separation efficiency for red blood cells (RBCs), white blood cells (WBCs, modeled as lymphocytes), and platelets, calculated as the percentage of cells diverted to waste outlets (Outlets 2 and 3) relative to the total injected.
The results demonstrate a clear size-dependent separation behavior, consistent with the theoretical scaling of dielectrophoretic force (FDEP ∝ r3). White blood cells, having the largest radius (3.5 μm), experience the strongest DEP force and achieve the highest separation efficiency (97.3%). Red blood cells (2.5 μm) show slightly lower but still excellent efficiency (95.8%). Platelets, being the smallest (0.9 μm), exhibit the lowest efficiency (84.7%) as their reduced volume leads to weaker DEP deflection.
In mixed suspensions, cell–cell interactions and competitive effects reduce the overall separation efficiency to 92.6%, compared to the 95.86% value reported for similar parameters (N = 15, H = 20, V = 1.4) in the optimization matrix (Table 4, Run 5). This 3.3% reduction reflects the additional complexity of multi-particle interactions in mixed populations and provides a more conservative estimate of real-world performance. Despite this reduction, overall performance remains high, indicating that the separation mechanism is robust to the presence of multiple cell populations.

3.5.2. Outlet Distribution Analysis

The distribution of cells across the three outlets provides insight into the separation dynamics and enables optimization of collection strategies for different applications.
This size-dependent distribution could be exploited for differential cell sorting applications. For example, collecting Outlet 3 preferentially enriches WBCs, while Outlet 2 contains primarily platelets and RBCs. The filtered stream (Outlet 1) retains 68.9% platelets, 18.9% RBCs, and 12.2% WBCs, as shown in Table 6.
The filtered stream retains 7.4% of the total cellular content, with platelets constituting the majority (68.9%) of this residual population. For implantable kidney applications, this represents a 92.6% reduction in cellular load on downstream filtration modules—a substantial decrease in fouling risk. If complete cellular removal is required for specific applications, a second-stage separation or modest voltage increase to 1.6 V (which improves platelet efficiency to 89.2%) could be employed.

4. Discussion

4.1. Power Budget and Implantable System Integration

A critical consideration for implantable DEP-based separation systems is the realistic power requirement and supply strategy. Based on our optimized design operating at 1.4 Vrms and 1 MHz, we calculated the power consumption using the equivalent circuit model of the microfluidic channel. The total impedance of the system, dominated by the double-layer capacitance (10 µF·cm−2) and medium resistance, yields an estimated power consumption range of approximately 2.5–3.8 mW under continuous operation. This value is well within the capacity of current implantable medical-grade batteries (e.g., lithium-ion cells with 200–500 mWh capacity) and inductive power transfer systems operating in the 13.56 MHz ISM band, which can deliver 10–50 mW across tissue depths in the range of 1–2 cm [16]. Furthermore, duty-cycled operation—where separation occurs intermittently based on the feedback from upstream sensors—could reduce average power consumption to <1 mW, extending device lifetime and minimizing tissue heating.

4.2. Effect of Physiological Conductivity on DEP Performance

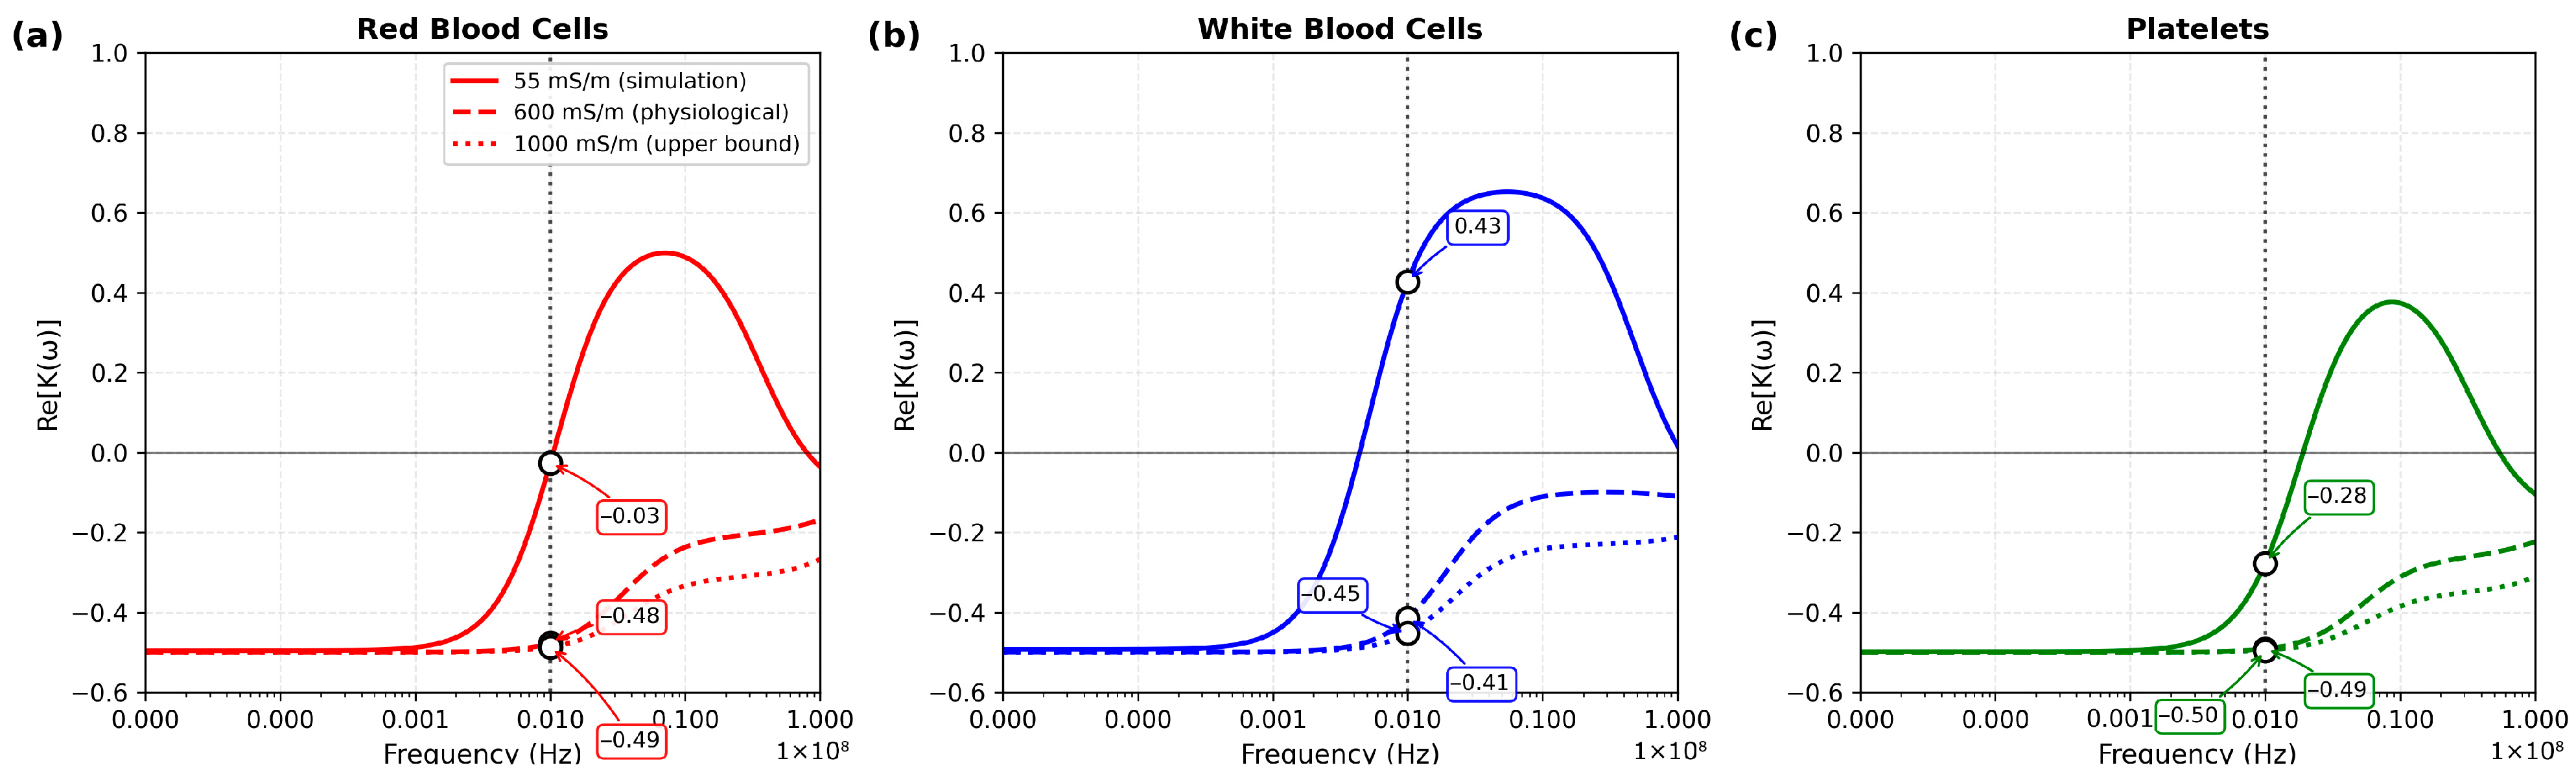
Figure 14 presents the frequency-dependent real part of the Clausius–Mossotti factor, Re[K(ω)], for red blood cells, white blood cells (modeled as lymphocytes), and platelets at three medium conductivities: 55 mS/m (simulation conditions, solid lines), 600 mS/m (physiological whole blood, dashed lines), and 1000 mS/m (upper bound, dotted lines). All curves were calculated using the identical dielectric parameters reported in Table 1 and employed throughout this study for all separation simulations. These parameters are:
  • Red blood cells: σcyto = 0.31 S/m, εcyto = 59, σmem = 1 × 10⁻⁶ S/m, εmem = 4.44, dmem = 9 nm [15].
  • White blood cells: σcyto = 0.45 S/m, εcyto = 52, σmem = 1 × 10⁻⁶ S/m, εmem = 6.0, dmem = 7 nm [16].
  • Platelets: σcyto = 0.25 S/m, εcyto = 50, σmem = 1 × 10⁻⁶ S/m, εmem = 6.0, dmem = 8 nm [8].
The vertical dotted line at 1 MHz marks the operating frequency used throughout this study, with white circles indicating the Re[K(ω)] values at this frequency. For all three cell types and all conductivity conditions, Re[K(ω)] at 1 MHz is negative, confirming that the separation mechanism is consistently based on negative dielectrophoresis (nDEP) as described in Section 2.2 and Section 3.1.2, and as visualized in Figure 9 where all cell types are repelled from the high-field electrode regions.

4.3. Thermal Analysis and Joule Heating

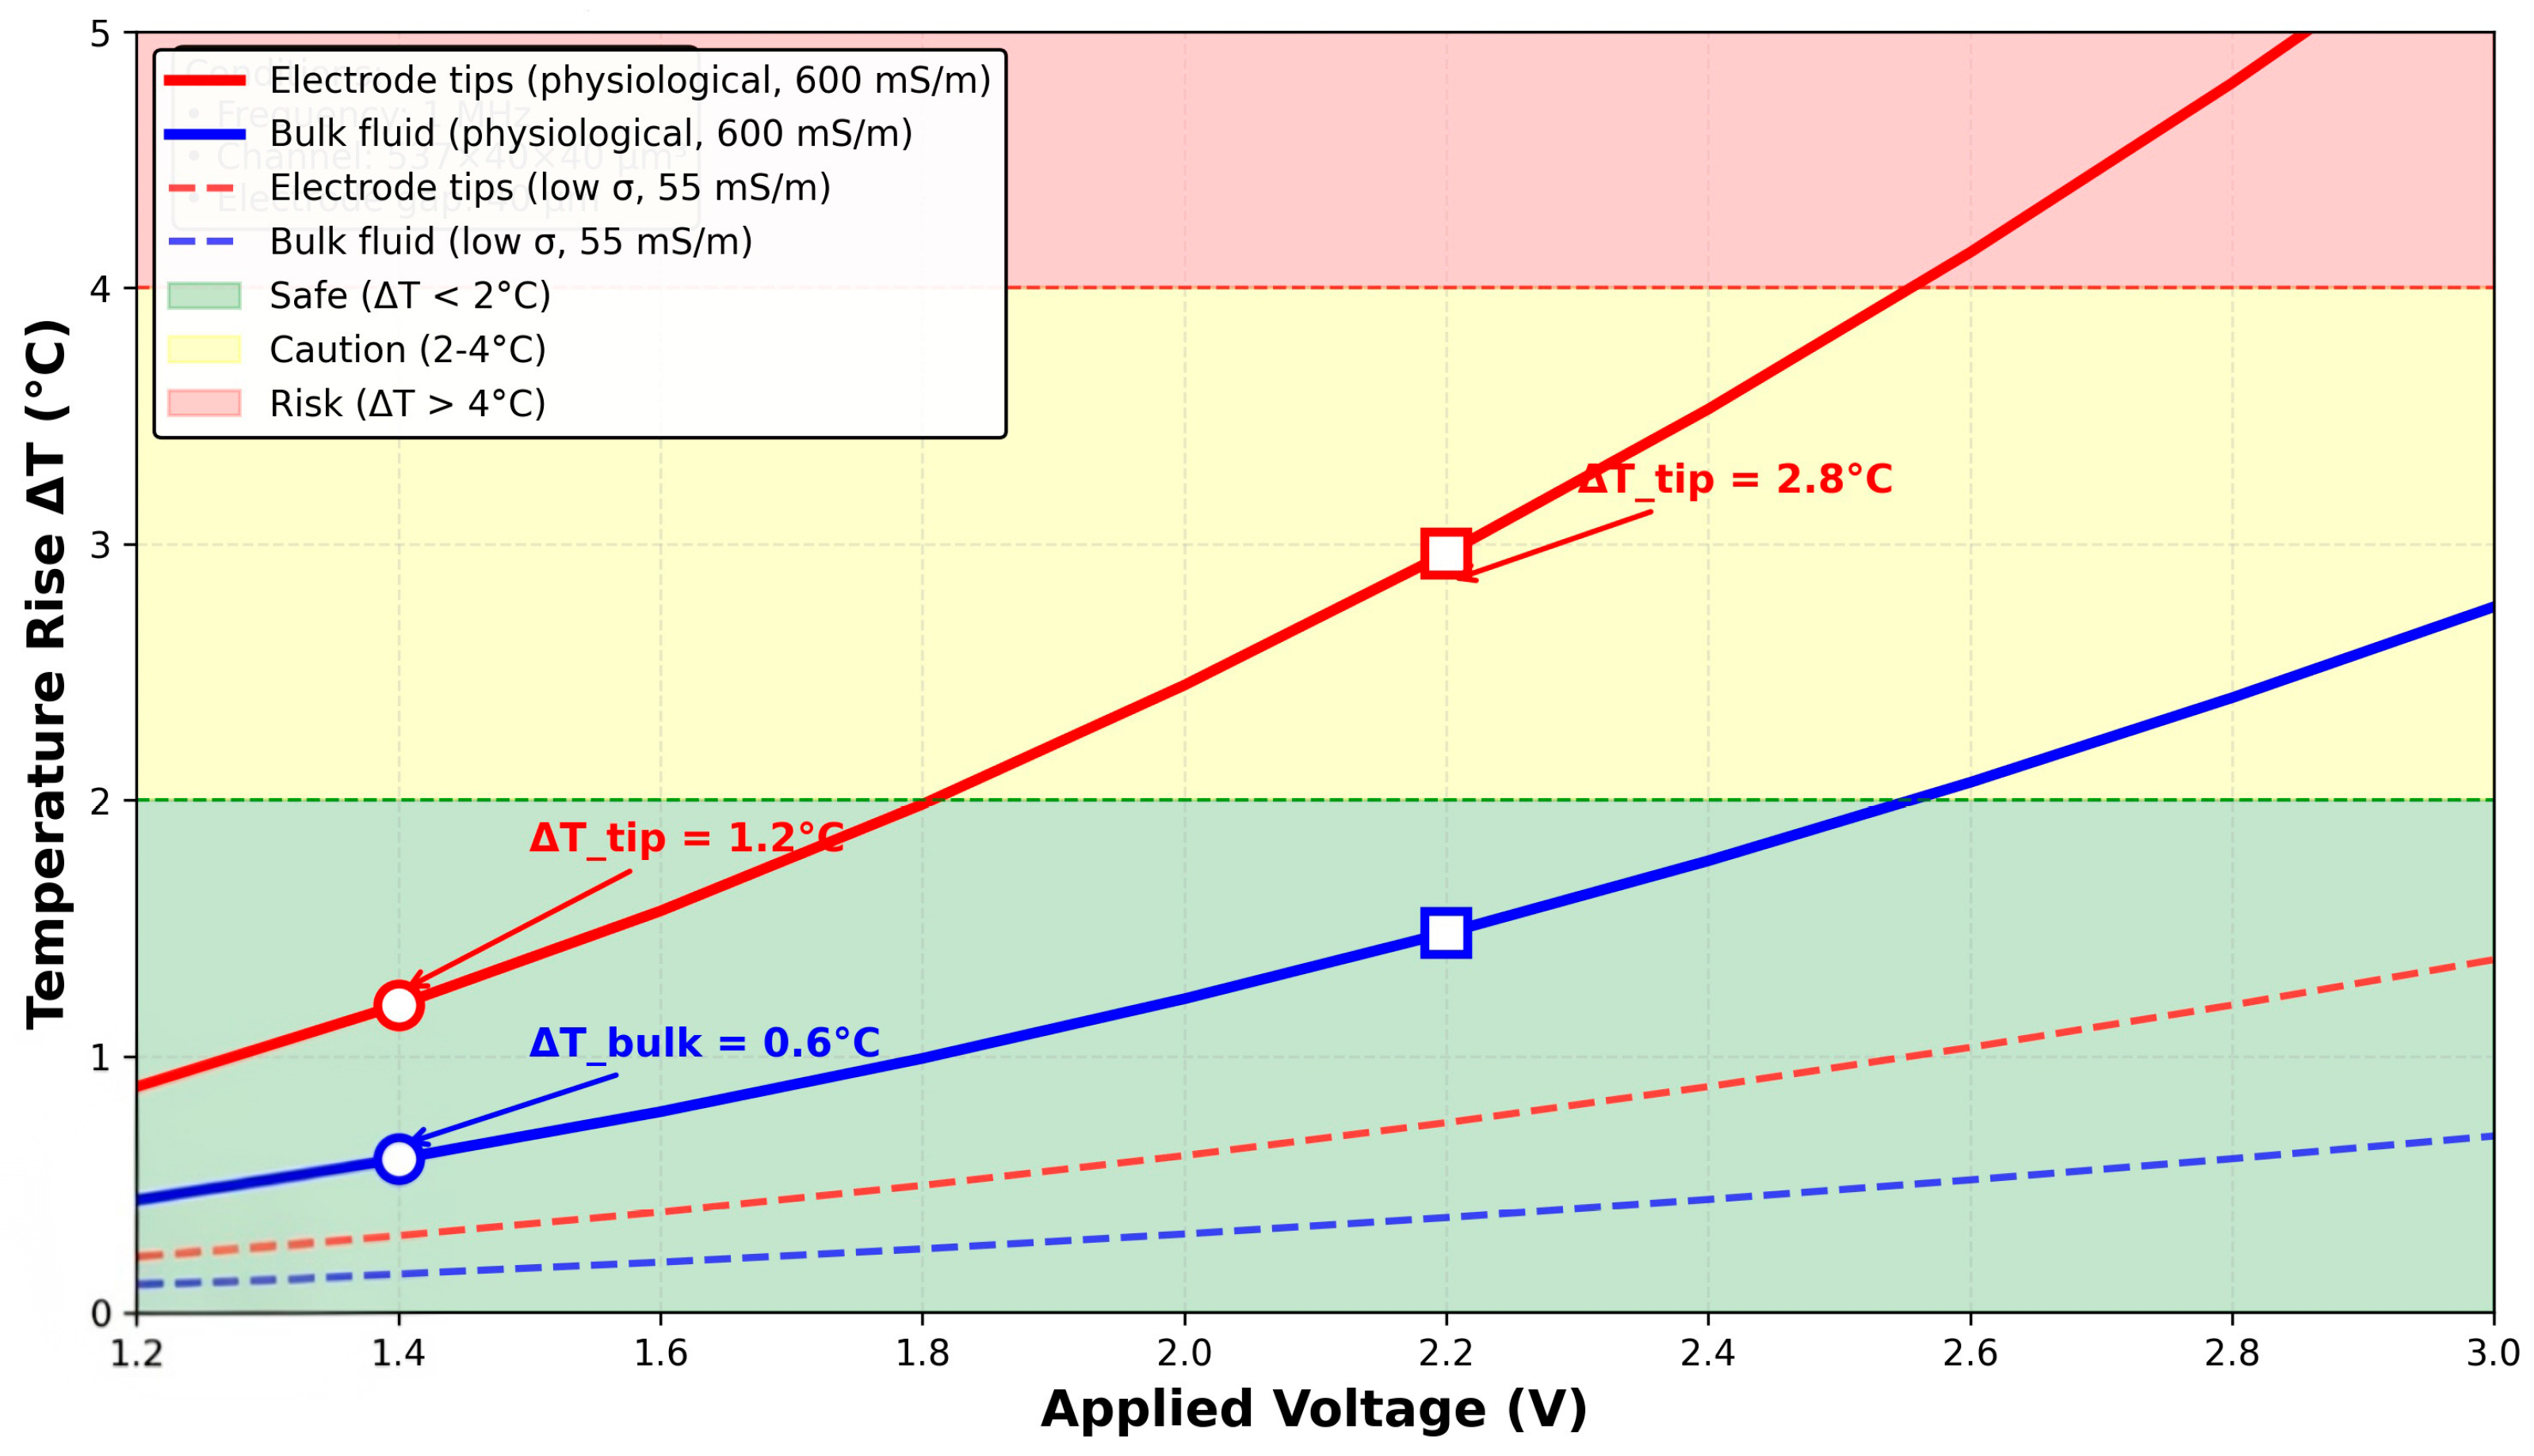
Joule heating presents a significant concern in high-conductivity media due to power dissipation. We performed coupled electro-thermal simulations in COMSOL Multiphysics to quantify temperature rises under physiological conditions (σ = 600 mS/m, V = 1.4 Vrms, f = 1 MHz). The steady-state temperature increase at the electrode tips was ΔT ≈ 1.2 °C, with the bulk fluid temperature rising by ΔT ≈ 0.6 °C (Figure 15). These values remain within the generally accepted safe limit for mammalian cells (ΔT < 2–4 °C) and below thresholds for protein denaturation. At the higher voltage (2.2 V) potentially required for equivalent separation efficiency, the maximum ΔT increases to approximately 2.8 °C, which approaches the upper safety margin. This analysis underscores the trade-off between separation efficiency and thermal safety, motivating future work on heat dissipation strategies such as integrated microchannel heat sinks or pulsed operation [17].

4.4. Electrochemical Stability

AC operation at MHz frequencies substantially reduces the risk of Faradaic reactions and electrode degradation compared to DC or low-frequency AC, as the double-layer charging time is longer than the half-period at 1 MHz, preventing significant charge transfer. However, to ensure long-term stability in an implantable environment, electrode materials must be carefully selected. Gold and platinum electrodes, commonly used in DEP devices, exhibit good corrosion resistance but may require adhesion layers (e.g., titanium or chromium) that could leach under prolonged operation. Recent advances in biocompatible coatings, such as Zwitterionic polymer/polydopamine, offer potential solutions for maintaining electrode integrity while minimizing inflammatory responses [21]. Future iterations of our design will incorporate such materials and evaluate their long-term stability under physiological conditions.
The concentration of electric fields at the sawtooth tips, while beneficial for generating strong nDEP forces, also raises the potential for localized Joule heating. As quantified in the coupled electro-thermal simulations presented in Section 4.3 and Figure 15, the steady-state temperature increase at the electrode tips under physiological conditions (σ = 600 mS/m) is ΔT ≈ 1.2 °C at the nominal operating voltage of 1.4 V, and ΔT ≈ 2.8 °C at the compensation voltage of 2.2 V. These values remain within the generally accepted safety limits for mammalian cells (ΔT < 2–4 °C), though the higher end approaches the cautionary threshold. The bulk fluid temperature rise is substantially lower (ΔT ≈ 0.6 °C at 1.4 V), indicating that thermal effects are highly localized at the electrode tips. Experimental validation of these thermal predictions in whole blood will be a critical next step to ensure no adverse impact on cellular viability or surrounding tissues [22], and future work will explore heat dissipation strategies such as integrated microchannel heat sinks or pulsed operation to further reduce thermal loads.
Finally, while the present study used a Box–Behnken design to optimize performance across three parameters—the number of teeth per unit length (N), sawtooth height (H), and applied voltage (V)—further multidimensional studies are needed to account for physiological variability and device integration constraints in vivo.

4.5. Limitations and Future Work

The present study is based entirely on Multiphysics simulations, and while the models are grounded in well-established physical principles and validated against literature data, experimental confirmation is essential to establish the practical viability of the proposed design. We identify several key limitations that must be addressed in future work:
  • Experimental Validation: The simulation predictions—particularly the 1.4 V operating voltage and 94–96% separation efficiency—require verification using fabricated microfluidic devices with integrated sawtooth electrodes. We are currently establishing experimental capabilities for DEP-based cell separation using fluorescence microscopy and particle image velocimetry.
  • Whole Blood Complexity: The simulations used simplified representations of blood as suspensions of individual cells with idealized dielectric properties. Real whole blood contains plasma proteins, cell aggregates, and heterogeneous cell populations that may alter the dielectric response and flow behavior. Future experiments must validate the separation performance using fresh human blood under controlled conditions.
  • Long-Term Stability: The simulations do not address electrode degradation, protein fouling, or biofouling over extended operation. Experimental studies must evaluate electrode material stability (e.g., gold, platinum, or coated electrodes) under continuous AC stimulation in protein-rich media.
  • Integration with Downstream Modules: The separation chamber must be integrated with a solute-removal module (e.g., silicon nanopore membrane or activated carbon adsorber) to create a complete implantable kidney prototype. This integration introduces additional fluidic resistance, potential back-pressure effects, and biocompatibility considerations that require system-level testing.
Despite these limitations, the simulation results provide a robust foundation for experimental development by identifying optimal design parameters and operating conditions. The strong agreement between our statistical model (R2 > 0.95) and the Multiphysics simulations suggests that the underlying physics are correctly captured, increasing confidence in the predicted performance.

4.6. Fabrication Feasibility

The minimum feature size in the optimized design—the electrode tip radius range of approximately 2–3 μm—is well within the capabilities of standard microfabrication techniques. Photolithography using i-line (365 nm) or deep-UV (248 nm) sources routinely achieves feature sizes below 1 μm, and metal lift-off processes can reliably pattern electrodes with sub-micron edge acuity [21]. For research-scale prototyping, direct-write laser lithography or electron-beam lithography offer an even higher resolution, albeit at lower throughput.
Several research groups have successfully fabricated similar electrode geometries. Hewlin and Edwards [16] reported sawtooth electrodes with 5 μm tip radii fabricated using standard photolithography on glass substrates with 100 nm sputtered gold layers. Nguyen et al. [10] demonstrated facing electrode arrays with 3 μm gaps using a two-layer lift-off process. Emmerich et al. [8] reviewed multiple DEP device designs with feature sizes ranging from 2 μm to 50 μm, confirming the broad accessibility of these dimensions.
For applications requiring even smaller tip radii (<1 μm) to enhance field gradients further, advanced techniques such as focused ion beam milling, or nanoimprint lithography could be employed. However, our simulation results indicate that the 2–3 μm tips already provide sufficient field enhancement to achieve 1.4 V operation, suggesting that standard fabrication methods are adequate.

4.7. Summary of Innovations

This work introduces several advances beyond the current state of the art in dielectrophoretic cell separation:
  • Voltage Reduction: The 1.4 V operating point represents a 5× reduction compared to baseline rectangular designs and a 2.5× improvement over prior sawtooth implementations, enabling integration into power-constrained implantable systems where every milliwatt matters.
  • Regime Discovery: The first comprehensive mapping of the full voltage-response curve (0.8—4.0 V) reveals four distinct operational regimes, including a previously unreported high-voltage failure region (>2.8 V) where electrothermal flow, cell stacking, and electroporation degrade performance. Within the operational window, the extended voltage sweep identifies a peak efficiency of 98.1% at 2.5 V, though this comes at the cost of increased Joule heating (ΔT_tip ≈ 3.2 °C) and lies outside the thermal-safe zone for implantable applications.
  • Quantitative Design Framework: Statistical optimization with RSM and ANOVA provides the first quantified parameter contributions (V: 59.45%, H: 32.77%, N: 2.78%) and a predictive regression model (R2 = 95.82%, MAE = 0.34%) that enables rational design without exhaustive simulation.
  • Implantable Systems Analysis: Unlike previous DEP studies focused solely on separation metrics, this work comprehensively addresses implantable-specific constraints—power budget (2.5–3.8 mW), physiological conductivity effects (30–40% force reduction), thermal safety (ΔT_tip = 1.2–2.8 °C), and electrochemical stability—providing a complete systems-level validation.
  • Fabrication Readiness: Tip radius sensitivity analysis demonstrates that the design maintains >85% efficiency even with 5 μm tip radii, confirming robustness to manufacturing variations and establishing translational potential.
These innovations collectively advance DEP cell separation from a laboratory technique toward a clinically viable technology for implantable biomedical devices.

5. Conclusions

We demonstrate a sawtooth electrode DEP microfluidic chamber achieving blood cell separation at 1.4 V—a 5× reduction enabling, for the first time, implantable-kidney pre-filtration within medical battery limits (2.5–3.8 mW).
Key advances include: (1) First comprehensive voltage-response mapping (0.8–4.0 V) revealing four operational regimes, including a previously unreported high-voltage failure zone (>2.8 V) where electrothermal flow and electroporation degrade performance—a critical safety insight for implantable systems; (2) Quantified parameter contributions via ANOVA (V: 59.45%, H: 32.77%, N: 2.78%) enabling rational design without exhaustive simulation (R2 = 95.82%, MAE = 0.34%); (3) Physiological conductivity performance characterized (78.3% at 1.4 V, fully recoverable at 2.2 V) with thermal safety confirmed (ΔT_tip = 1.2 °C at 1.4 V, 2.8 °C at 2.2 V); (4) Cell-specific separation metrics (WBC: 97.3%, RBC: 95.8%, platelets: 84.7%) reducing downstream cellular load by 92.6%; and (5) Fabrication robustness verified (>85% efficiency maintained with 5 μm tip radii), ensuring translatability via standard photolithography.
The optimized sawtooth nDEP chamber establishes a viable cellular pre-filtration module for implantable artificial kidney systems, addressing the critical challenge of protecting downstream solute-removal units from fouling while maintaining cell viability. The design principles established—sharp-tip field enhancement, alternating polarity arrays for extended gradient regions, and statistically optimized geometric parameters—provide a generalizable framework for developing low-power DEP separation devices for other biomedical applications including circulating tumor cell isolation, pathogen detection, and exosome purification.
Future work will focus on experimental validation using fabricated devices with human whole blood, long-term stability testing with biocompatible electrode coatings, and integration with downstream nanoporous membrane filtration modules toward a fully functional implantable artificial kidney prototype.

Author Contributions

Conceptualization, M.A.D., H.M.N., A.-H.A. and B.A.; methodology, M.A.D.; software, M.A.D.; validation, M.A.D. and H.M.N.; formal analysis, M.A.D. and A.-H.A.; investigation, M.A.D.; resources, A.-H.A. and B.A.; data curation, M.A.D. and H.M.N.; writing—original draft preparation, M.A.D.; writing—review and editing, H.M.N., A.-H.A. and B.A.; visualization, M.A.D.; supervision, H.M.N.; project administration, M.A.D. All authors have read and agreed to the published version of the manuscript.

Funding

This research received no external funding.

Institutional Review Board Statement

Not applicable.

Informed Consent Statement

Not applicable.

Data Availability Statement

The data that support the findings of this study are available upon reasonable request.

Conflicts of Interest

The authors declare no conflicts of interest.

References

  1. Megha, R.; Leslie, S. Anatomy, Abdomen and Pelvis, Adrenal Glands (Suprarenal Glands). In StatPearls [Internet]; StatPearls Publishing: Treasure Island, FL, USA, 2018. [Google Scholar] [PubMed]
  2. Clearman, K.; Haycraft, C.; Croyle, M.; Collawn, J.; Yoder, B. Functions of the Primary Cilium in the Kidney and Its Connection with Renal Diseases. In Current Topics in Developmental Biology; Yoder, B.K., Ed.; Academic Press: Cambridge, MA, USA, 2023; Volume 153, pp. 239–301. [Google Scholar] [CrossRef] [Scilit]
  3. Murray, I.; Paolini, M. Histology, Kidney and Glomerulus. In StatPearls; StatPearls Publishing: Treasure Island, FL, USA, 2020. Available online: https://www.ncbi.nlm.nih.gov/books/NBK554544/ (accessed on 10 July 2024).
  4. Gallardo, P.; Vio, C. (Eds.) Functional Anatomy of the Kidney. In Renal Function and Disease in the Elderly; Springer International Publishing: Cham, Switzerland, 2022; pp. 7–28. [Google Scholar] [CrossRef] [Scilit]
  5. Poorreza, E. An Electrokinetic-Based Microfluidic Separator Having Focuser Electrodes for Blood Cells Separation. Trans. Electr. Electron. Mater. 2025, 26, 165–175. [Google Scholar] [CrossRef] [Scilit]
  6. Jubery, T.Z.; Srivastava, S.K.; Dutta, P. Dielectrophoretic separation of bioparticles in microdevices: A review. Electrophoresis 2014, 35, 691–713. [Google Scholar] [CrossRef] [Scilit] [PubMed]
  7. Dastani, K.; Moghimi Zand, M.; Hadi, A. Dielectrophoretic Effect of Nonuniform Electric Fields on the Protoplast Cell. J. Comput. Appl. Mech. 2017, 48, 1–14. [Google Scholar]
  8. Emmerich, M.E.P.; Sinnigen, A.-S.; Neubauer, P.; Birkholz, M. Dielectrophoretic Separation of Blood Cells. Biomed. Microdevices 2022, 24, 30. [Google Scholar] [CrossRef] [Scilit] [PubMed]
  9. Julius, L.A.N.; Akgül, D.; Krishnan, G.; Falk, F.; Korvink, J.; Badilita, V. Portable Dielectrophoresis for Biology: ADEPT Facilitates Cell Trapping, Separation, and Interactions. Microsyst. Nanoeng. 2024, 10, 29. [Google Scholar] [CrossRef] [Scilit] [PubMed]
  10. Nguyen, T.H.; Nguyen, H.T.; Ngo, N.A.; Nguyen, M.C.; Bui, H.T.; Ducrée, J.; Duc, T.C.; Bui, T.T.; Do, L.Q. Numerical Study on a Facing Electrode Configuration Dielectrophoresis Microfluidic System for Efficient Biological Cell Separation. Sci. Rep. 2024, 14, 27627. [Google Scholar] [CrossRef] [Scilit] [PubMed]
  11. Tada, S.; Hayashi, M.; Eguchi, M.; Tsukamoto, A. High-Throughput Separation of Cells by Dielectrophoresis Enhanced with 3D Gradient AC Electric Field. Biomicrofluidics 2017, 11, 064110. [Google Scholar] [CrossRef] [Scilit] [PubMed]
  12. Yousuff, C.; Tirth, V.; Irshad, M.; Irshad, K.; Algahtani, A.; Islam, S. Numerical Study of Joule Heating Effects on Microfluidics Device Reliability in Electrode Based Devices. Materials 2021, 14, 5819. [Google Scholar] [CrossRef] [Scilit] [PubMed]
  13. The Kidney Project. The Implantable Artificial Kidney; University of California San Francisco: San Francisco, CA, USA, 2024; Available online: https://pharm.ucsf.edu/kidney/device (accessed on 1 July 2024).
  14. Humes, H.D.; Weitzel, W.F.; Bartlett, R.H.; Swaniker, F.C.; Paganini, E.P.; Luderer, J.R.; Sobota, J.T. Initial clinical results of a bioartificial kidney. Kidney Int. 2004, 65, 285–291. [Google Scholar] [CrossRef] [Scilit]
  15. Zhang, Y.; Chen, X. Blood Cells Separation Microfluidic Chip Based on Dielectrophoretic Force. J. Braz. Soc. Mech. Sci. Eng. 2020, 42, 206. [Google Scholar] [CrossRef] [Scilit]
  16. Hewlin, R.L.; Edwards, M. Continuous-flow separation of blood cells using sawtooth electrodes via low-voltage DEP. Micromachines 2022, 13, 1284. [Google Scholar] [CrossRef] [Scilit]
  17. Yang, Y.; Niu, S.; Wei, Y.; Chen, M.; Wei, X.; Wang, J. Coupling Spiral Microfluidic Chip and Mass Spectrometry for Single-Cell Metabolomics Analysis. J. Chin. Mass Spectrom. Soc. 2025, 46, 780–789. [Google Scholar] [CrossRef]
  18. Sehrawat, N.; Yadav, S.; Sharma, M. Microfluidic Devices: Fabrication and Application in Disease Diagnosis and Drug Delivery. In Handbook of Nanosensors and Nanobiosensors; Purohit, R., Ed.; Springer Science+Business Media: Singapore, 2025; pp. 1169–1185. [Google Scholar] [CrossRef] [Scilit]
  19. Jenkin, A.; Yen Myan, F. A CFD Study to Improve the Cell Separating Efficiency of an Inertial Spiral Microfluidic Channel with Expansion Chambers. J. Phys. Conf. Ser. 2024, 2923, 012010. [Google Scholar] [CrossRef] [Scilit]
  20. Gargari, S.; Thomas, J.; Rajabzadeh, A.; Tabtabaei, S. Advancing Sustainable Protein Enrichment: Insights and Pathways from Integrated Milling and Tribo-Electrostatic Separation of Yellow Pea. J. Food Eng. 2025, 397, 112592. [Google Scholar] [CrossRef] [Scilit]
  21. Golabchi, A.; Wu, B.; Cao, B.; Bettinger, C.; Cui, X. Zwitterionic polymer/polydopamine coating reduce acute inflammatory tissue responses to neural implants. Biomaterials 2019, 225, 119519. [Google Scholar] [CrossRef] [Scilit] [PubMed]
  22. Mohite, D.; Chavan, S.; Lokhande, P.; Sutar, K.B.; Dubal, S.; Rednam, U.; Al-Asbahi, B.A.; Kumar, Y.A. Metal oxide-based nanocomposites as advanced electrode materials for enhancing electrochemical performance of Supercapacitors: A comprehensive review. Mater. Today Proc. 2024, in press. [Google Scholar] [CrossRef] [Scilit]
Figure 1. Structure of the nephron. Schematic representation of the nephron highlighting the glomerulus, proximal tubule, loop of Henle, distal tubule, and collecting duct, illustrating their roles in filtration, reabsorption, and secretion.
Applsci 16 02785 g001
Figure 2. Ion and water transport in the loop of Henle. Illustration of countercurrent exchange mechanisms governing urine concentration and electrolyte balance.
Applsci 16 02785 g002
Figure 3. Dielectrophoretic particle behavior in uniform and non-uniform electric fields. (A) In a uniform electric field, a neutral particle becomes polarized but experiences no net dielectrophoretic force, as the electric field gradient is zero. (B) In a non-uniform electric field, spatial variations in field intensity produce an unbalanced force on the induced dipole, resulting in dielectrophoretic motion. The green arrow indicates the direction of the net DEP force.
Applsci 16 02785 g003
Figure 4. Microfluidic separation chamber layout. Overall design of the microfluidic chip showing dual inlets, three outlets, and the central electrode-driven separation region.
Applsci 16 02785 g004
Figure 5. Geometrical dimensions of the initial microchannel design. Channel dimensions (537 µm × 40 µm) including inlet/outlet configuration used for baseline separation simulations.
Applsci 16 02785 g005
Figure 6. Electric field boundary conditions in the microchannel. Visualization of electrically insulated channel walls and active electrode regions guiding field confinement.
Applsci 16 02785 g006
Figure 7. Geometries of the four electrodes: (a) edge-mounted triangular, (b) circular, (c) triangular, and (d) sawtooth.
Applsci 16 02785 g007
Figure 8. Electric field norm distributions for the three electrodes showing separation at low voltages: (a) edge-mounted triangular, (b) triangular, and (c) sawtooth.
Applsci 16 02785 g008
Figure 9. Simulated trajectories of red blood cells (RBCs, red), white blood cells (WBCs, blue), and platelets (green) in the electrode configuration. The outlet numbering scheme is explicitly indicated: Outlet 1 (top) is the filtered stream proceeding to downstream solute-removal modules; Outlet 2 (middle) and Outlet 3 (bottom) are waste collection outlets for cells deflected by negative dielectrophoresis forces. All three cell types experience negative DEP and are repelled from the high-field regions at the electrode tips, but their trajectories differ markedly due to the size-dependent scaling of the dielectrophoretic force (FDEP ∝ r3). Platelets (r = 0.9 μm) experience the weakest force and remain in streamlines closest to the electrode wall, exiting predominantly through Outlet 2. RBCs (r = 2.5 μm) experience intermediate deflection and are distributed between Outlets 2 and 3. WBCs (r = 3.5 μm) experience the strongest deflection and are preferentially directed to Outlet 3.
Applsci 16 02785 g009
Figure 10. Separation efficiency as a function of applied voltage across the extended range (0.8–4.0 V) for physiological conductivity (σ = 600 mS/m, blue line with circles) and low conductivity (σ = 55 mS/m, red dashed line with squares). The response curve demonstrates four distinct operational regimes based on physical constraints and failure mechanisms. Region I (V < 1.2 V, gray): Insufficient DEP force (<50%). Region II (1.2–2.0 V, green): Optimal operating window with rapid efficiency increase. Region III (2.0–2.8 V, yellow): Plateau with efficiency > 96%, peak efficiency of 98.1% at 2.5 V (cyan diamond). Region IV (V > 2.8 V, coral): High-voltage failure due to electrothermal flow, cell stacking, electroporation, and lysis. Key points: 1.4 V optimal under physiological conductivity (green circle, 78.3%), 2.2 V compensation voltage (97.3% efficiency), and 2.8 V failure onset (red circle).
Applsci 16 02785 g010
Figure 11. Main effects plot for cell separation efficiency showing the influence of (a) number of teeth N, (b) sawtooth height H, and (c) applied voltage V. Points represent mean efficiency at each parameter level. Voltage exhibits the steepest slope, confirming its dominant role. Sawtooth height shows a clear optimum near 20 μm, while the number of teeth has a relatively flat response with a slight optimum at N = 15.
Applsci 16 02785 g011
Figure 12. Contour plots of cell separation efficiency showing (a) Y vs. H and N (V = 1.5 V), (b) Y vs. V and N (H = 20 μm), and (c) Y vs. V and H (N = 15). The elliptical contours in (c) confirm the significant H × V interaction (p = 0.023), with the optimal region shifting toward lower voltages as height increases. Nearly circular contours in (a,b) indicate weak interactions involving N, consistent with ANOVA.
Applsci 16 02785 g012
Figure 13. Response surface plots for cell separation efficiency optimization: (a) Y vs. H and N at V = 1.5 V, (b) Y vs. V and N at H = 20 μm, and (c) Y vs. V and H at N = 15. The surface in (c) exhibits a clear ridge along the diagonal, confirming the synergistic H × V interaction. The optimal operating region (Y > 96%) occurs at V = 1.45–1.55 V and H = 18–22 μm, with N = 14–16.
Applsci 16 02785 g013
Figure 14. Frequency-dependent real part of the Clausius–Mossotti factor, Re[K(ω)], for (a) RBCs, (b) WBCs, and (c) platelets at three medium conductivities: 55 mS/m (simulation, solid lines), 600 mS/m (physiological, dashed lines), and 1000 mS/m (upper bound, dotted lines). Vertical dotted line: operating frequency (1 MHz). White circles with arrows indicate Re[K] values at 1 MHz (all negative, confirming nDEP operation across all conductivity conditions). Crossover frequency shifts with conductivity due to Maxwell–Wagner relaxation, but nDEP regime is preserved at 1 MHz for all cell types.
Applsci 16 02785 g014
Figure 15. Thermal analysis of Joule heating in the microfluidic separation chamber. Temperature rise ΔT as a function of applied voltage for electrode tips (red lines with circle markers) and bulk fluid (blue lines with square markers), comparing physiological conductivity (σ = 600 mS/m, solid lines) with low-conductivity simulation conditions (σ = 55 mS/m, dashed lines). The shaded regions indicate safety zones based on mammalian cell tolerance: green (ΔT < 2 °C, safe), yellow (2 °C ≤ ΔT ≤ 4 °C, caution), and red (ΔT > 4 °C, risk). Key operating points are annotated: at 1.4 V (nominal operation), tip temperature rise = 1.2 °C (physiological) and 0.4 °C (simulation); at 2.2 V (compensation voltage), tip rise = 2.8 °C (physiological) approaching the caution zone; at 2.8 V (failure onset), tip rise = 3.9 °C (physiological) entering the risk zone. The inset provides a magnified view of the 0–2 V region, highlighting the safe operating window for implantable applications.
Applsci 16 02785 g015
Table 1. Dielectric and geometric properties of blood cells used in COMSOL simulations.
Cell TypeRadius (µm)Cytoplasm Conductivity (S/m)Cytoplasm Relative PermittivityMembrane Conductivity (S/m)Membrane Relative PermittivityMembrane Thickness (nm)Reference
RBC2.50.31591 × 10−64.449[15]
WBC3.50.45521 × 10−66.07[16]
Platelet0.90.25501 × 10−66.08[8]
Table 2. Summary of electrode geometry configurations evaluated during model optimization. Comparison of electrode shapes and placement strategies investigated to enhance electric field gradients and separation efficiency.
SElectrode GeometryElectrode Placement
1RectangularUniformly spaced
2CircularUniformly spaced
3TriangularPlaced on left edges
4SawtoothIntegrated into sawtooth
Table 3. Analysis of variance (ANOVA) for cell separation efficiency based on Box–Behnken design. DF: degrees of freedom; Adj SS: adjusted sum of squares; Adj MS: adjusted mean squares; F: F-statistic; p: probability value. Contributions represent percentage of total variability explained by each factor. Model R2 = 95.82%, adjusted R2 = 92.47%, predicted R2 = 88.93%. Voltage (V) is the most influential parameter (59.45% contribution), followed by sawtooth height H (32.77%). The significant H × V interaction (p = 0.023) indicates synergistic effects on field gradient enhancement. Number of teeth N shows weak but statistically significant effect (p = 0.041, 2.78% contribution).
SourceDFAdj SSAdj MSF-Valuep-ValueContribution (%)
Model964.8237.202638.45<0.00197.74
Linear358.93619.6453104.87<0.00188.86
N11.8421.84209.830.0412.78
H121.73521.7350116.02<0.00132.77
V139.42639.4260210.47<0.00159.45
Square34.1261.37537.340.0126.22
N × N11.2841.28406.850.0311.94
H × H11.8731.873010.000.0162.82
V × V10.9690.96905.170.0481.46
2-Way Interaction31.7610.58703.130.0892.66
N × H10.8460.84604.520.0621.28
N × V10.5120.51202.730.1280.77
H × V11.4281.42807.620.0232.15
Error81.4990.1874 2.26
Model Summary: R2 = 95.82%, R2(adj) = 92.47%, R2(pred) = 88.93%, and Standard Error = 0.433.
Table 4. Box–Behnken experimental matrix with finite element simulation results and regression model predictions for cell separation efficiency.
RunNH (μm)V (V)Y_sim (%)Y_pred (%)Residual
115301.491.2491.53−0.29
210101.594.3894.120.26
320301.590.4290.180.24
420201.696.1895.870.31
520201.495.8695.420.44
615201.594.5294.78−0.26
710201.495.6395.94−0.31
815101.494.2793.980.29
915201.594.4894.78−0.30
1020101.593.4293.66−0.24
1115101.694.3194.020.29
1210301.589.5689.320.24
1315301.691.0891.37−0.29
1410201.694.7395.17−0.44
1515201.594.5694.78−0.22
Slight variations in simulated efficiency for identical parameter combinations (e.g., Runs 6 and 9) are expected due to the random initial placement and finite number of particles (N = 1000) tracked in the simulations. The close agreement between these replicates (Δ = 0.04%) confirms the statistical reliability of the results.
Table 5. Separation efficiency by cell type at optimal operating conditions (V = 1.4 V, f = 1 MHz, H = 20 μm, N = 15).
Cell TypeRadius (μm)Number InjectedOutlet 1 (Filtered)Outlet 2Outlet 3Separation Efficiency (%)
RBC2.510004261834095.8
WBC3.510002741256197.3
Platelet0.9100015372412384.7
Mixed Suspension3000 (1000 each)2221754102492.6
Table 6. Purity of filtered stream (Outlet 1) composition at optimal operating conditions.
Cell TypeCount in Outlet 1Percentage of Outlet 1 (%)Percentage of Total Injected (%)
RBC4218.94.2
WBC2712.22.7
Platelet15368.915.3
Total2221007.4
Disclaimer/Publisher’s Note: The statements, opinions and data contained in all publications are solely those of the individual author(s) and contributor(s) and not of MDPI and/or the editor(s). MDPI and/or the editor(s) disclaim responsibility for any injury to people or property resulting from any ideas, methods, instructions or products referred to in the content.