1. Introduction
The demand for efficient and high-quality image compression has intensified with the increasing complexity of digital textures used in 3D graphics, games, and real-time applications. In this context, finding an optimal compression technique for storing 2D texture data has become crucial to balance quality, file size, and performance requirements. Traditional image formats like JPEG have been widely used for their compression efficiency and universal compatibility, yet they lack several advanced features essential for modern graphics applications. Recently, the AV1 Image File Format (AVIF) (
https://aomediacodec.github.io/av1-avif/, accessed on 27 January 2026) has emerged as a promising alternative, offering high-quality compression, HDR support, and advanced color depths. However, its relatively high computational overhead raises questions about its suitability for real-time applications.
At the same time, GPU-specific compression techniques, such as S3 Texture Compression (S3TC) and Block Partitioned Texture Compression (BPTC) remain standard for real-time rendering due to their optimized decompression algorithms tailored to GPU architectures and their ubiquitous hardware support across modern graphics APIs and devices. Although these formats offer the performance benefits necessary for games and interactive media, they often sacrifice some degree of visual fidelity, compression potential, and flexibility, limiting their effectiveness for applications requiring nuanced color representation and smooth gradients.
This article explores the advantages and trade-offs of using AVIF to store 2D texture data, contrasting it with JPEG’s efficiency and the GPU-specific strengths of S3TC and BPTC. The primary objective is not general perceptual image quality assessment, but rather the technical evaluation of compression fidelity for 2D texture storage and distribution, specifically in the context of graphics pipelines, GPU texture formats, and data representation efficiency. By evaluating these formats in terms of compression efficiency, image quality, decoding overhead, and compatibility, the present work aims to provide insights into their suitability for different applications within the field of 3D graphics and texture storage. Through a comparative analysis, we assess the extent to which AVIF might serve as a viable alternative to traditional image and GPU-specific texture compression techniques in modern graphics workflows. This study is motivated by the fact that, to the best of our knowledge, it is the first to explicitly examine AVIF’s potential for 3D computer graphics, providing quantitative insights to determine if—and in which contexts—AVIF might serve as a viable alternative to established image texture formats.
Context and State of the Art
AVIF, introduced in 2019 and based on the AV1 compression algorithm [
1], is progressively gaining traction [
2] as a next-generation image compression standard. Developed by the Alliance for Open Media, AVIF is expected to offer superior compression efficiency compared to JPEG, making it increasingly attractive for various applications. JPEG, in use since 1992, is currently the most widely used lossy image compression standard, particularly for Internet applications and digital cameras [
3,
4]. Since its introduction, JPEG has established itself as a critical technology in information and communication. Its success can be attributed to its efficiency, versatility, and robustness, making it the most widely adopted lossy image compression format for still images, with trillions of JPEG pictures taken and archived to date [
5]. Ongoing advancements in image technology create a competitive landscape for JPEG, with AVIF emerging as a new contender in the field. However, JPEG’s entrenched presence and widespread compatibility with existing systems are likely to continue ensuring its relevance in the future of still image applications.
In the field of image compression, some studies have already evaluated the advantages and trade-offs of the AVIF format compared to other currently used formats [
6] and on different devices [
7]. Comparing the new AVIF image file format against other image codecs for natural, synthetic, and game images demonstrated that AVIF achieved superior overall performance for images encoded with both 4:2:0 and 4:4:4 chroma subsampling [
8]. A broader comparative evaluation of state-of-the-art image compression formats further assessed AV1 alongside both image-native and video-derived codecs indicating that, when balancing compression efficiency and computational cost, AV1 and WebP represent practical alternatives [
4]. A comparative evaluation of JPEG and video codecs for still images AV1, H.265, H.264, VP9, on over 1100 high-resolution images using objective (PSNR, SSIM) and perceptual (VMAF, VIF) image quality metrics showed that video codecs generally outperform JPEG, with AV1 achieving the best overall performance; video codecs also provided clear advantages regarding compressed file size [
9].
The implications of efficient image compression extend across various domains. When comparing JPEG XS, JPEG 2000, HEVC, and AV1 for medical imaging, AV1 consistently outperformed the other codecs in terms of visual quality across most objective metrics, demonstrating efficient compression with minimal quality degradation, though it had the longest encoding times [
10]. Similarly, in the context of automated analysis of in vitro cell microscopy images, AV1 compression proved competitive compared to JPEG, JPEG 2000, JPEG XL, BPG, and WebP, making it the preferred choice when both reliability and compression efficiency are priorities [
11]. A comparative analysis of image encoders and the effects of compression on automated image analysis by machines indicated that traditional image codecs like JPEG and WebP may lead to unsatisfactory performance, whereas advanced codecs such as VVC, JPEG XL, and AVIF could be more suitable for these applications, despite their increased computational complexity [
12]. In another example, efficient image compression schemes can have a significant impact on the performance of optical camera communication (OCC), a technology with expanding applications in areas such as intelligent transportation systems. Specifically, AVIF image compression has demonstrated effectiveness in reducing the bit error ratio (BER) in OCC systems, thus enhancing data integrity and communication reliability [
13]. Research has also focused on improving encoder performance. By exploring speed and memory optimizations for the libaom encoder to enhance image encoding efficiency, a study detailed the evolution of the encoder in terms of speed and heap memory usage and described methods to accelerate the AVIF encoder [
14].
Dataset size varies substantially across the image-compression literature. Several studies report evaluations on larger test sets, often consisting of dozens of natural images [
8], typically randomly selected [
4], to obtain more stable aggregated performance estimates across heterogeneous content. At the other end of the spectrum, some works adopt very small, selected sets. For example, in [
10] the evaluation is conducted on 4 standardized test patterns, while in [
15] the authors state that the main analysis is carried out on two representative images. Overall, reported dataset sizes range from a few illustrative images to large benchmarks, with a larger number of samples generally providing stronger statistical confidence, while smaller numbers are often used when experiments are computationally expensive.
Although previous studies have concentrated on AVIF’s use in 2D applications, none have specifically examined its application in real-time 3D computer graphics, particularly as a format for storing texture bitmaps and assessing the impact of compression artifacts when images are filtered, colorized, and viewed from various angles during rendering.
S3TC [
16] and BPTC [
17] are texture compression schemes commonly used for compressing images that are intended for use as textures in computer graphics. These techniques are designed for implementation in high-performance hardware. They reduce memory usage and enable efficient random access during texture sampling. Even though standard image compression methods like JPEG and PNG can achieve higher compression ratios than S3TC and BPTC, they decompress images all at once. In contrast, texture compression schemes allow specific sections of an image to be decompressed independently, enhancing performance in graphics applications. These techniques allow the GPU to access specific parts of the texture data quickly, rather than needing to load the entire image. This is important for rendering, as it enables the rendering pipeline to retrieve only the necessary texels (texture pixels) for each frame. Including S3TC and BPTC in the analysis is essential because these texture compression schemes, widely used in real-time graphics applications, also degrade the original image quality to achieve higher compression. This allows us to compare how their quality degradation compares with that of the AVIF file format.
2. Materials and Methods
To support the experimental evaluation, we developed a custom software pipeline designed to encode, decode, and render images using the selected compression formats. This pipeline integrates a lightweight graphics engine capable of handling texture loading and visualization in both 2D and 3D scenarios. The overall methodology consists of preparing the test dataset, compressing each image using the different formats, rendering the resulting textures within a controlled setup, and evaluating their quality using predefined analysis metrics. The following subsections describe the software framework, test conditions, and evaluation procedures in detail.
2.1. Mockup Rendering Engine and Visualization Setup
To evaluate the visual impact of the different compression formats, a mockup rendering engine was developed as part of the software pipeline. Its purpose is not to simulate a full production graphics engine, but rather to provide a controlled and repeatable environment in which textures encoded with various formats can be visualized and compared under consistent conditions. The engine supports texture loading, shader-based rendering, and scene configuration sufficient for assessing visual fidelity after compression.
The following texture formats were integrated into the system: AVIF, JPEG, S3TC, and BPTC. In addition, PNG was included as a lossless baseline, providing reference images against which the compressed results could be evaluated.
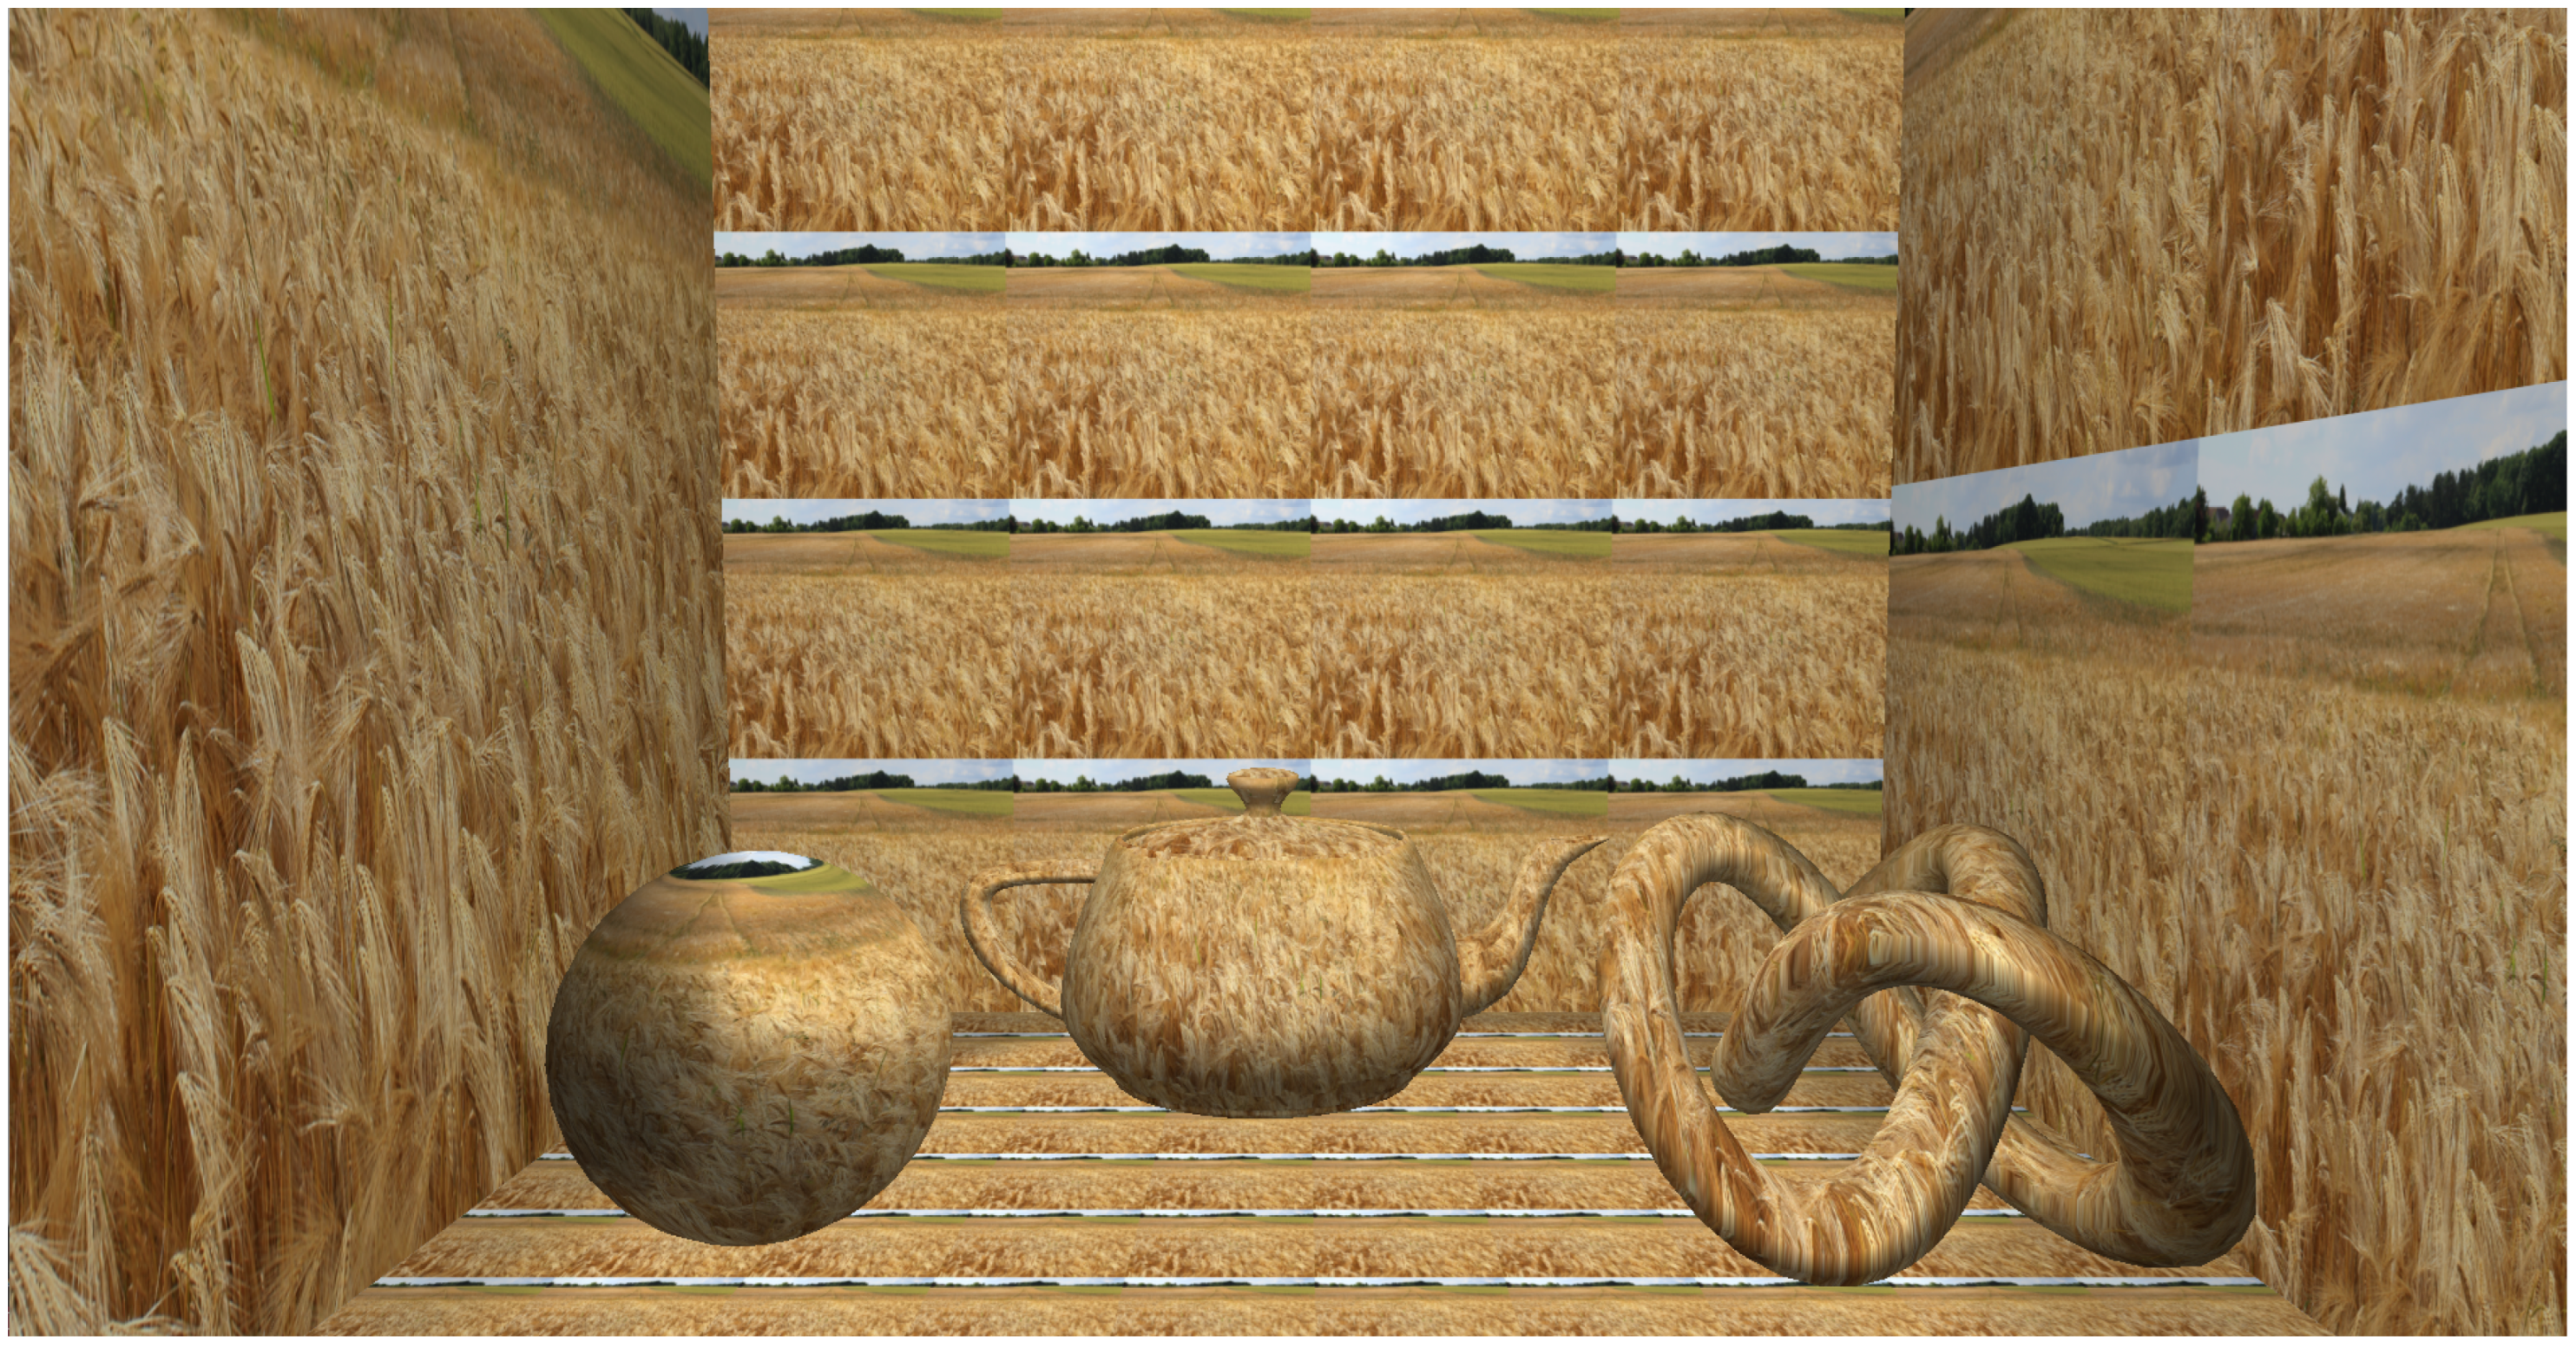
The visualization process consists of two stages. First, textures are displayed in a simplified 2D setup that allows for quick inspection of artifacts, color deviations, and structural distortions. Once this preliminary assessment is completed, the engine proceeds to the 3D visualization phase. Here, a predefined scene (see
Figure 1) is rendered in a Full HD (1920 × 1080) window. The scene depicts a room containing three textured geometric objects—a sphere, a teapot, and a torus knot—illuminated by three light sources. Both the objects and the room’s surfaces are fully textured, with varying levels of tessellation applied to expose the textures at different mipmapping levels.
The geometry of this 3D scene also enables the observation of textures mapped onto surfaces across a wide range of viewing angles. This is particularly important because formats such as JPEG and AVIF are inherently designed for frontal image projection on a screen, whereas texture mapping in 3D graphics places these images on arbitrarily oriented surfaces. Evaluating textures under oblique angles therefore allows a deeper analysis of how compression artifacts interact with advanced filtering techniques (e.g., anisotropic filtering), which becomes essential when surfaces are viewed at grazing angles.
This mockup environment provides a consistent and controlled basis for analyzing how each compression format behaves when textures are used in a typical graphics workflow, supporting both qualitative inspection and metric-based evaluation.
2.2. Test Image Dataset
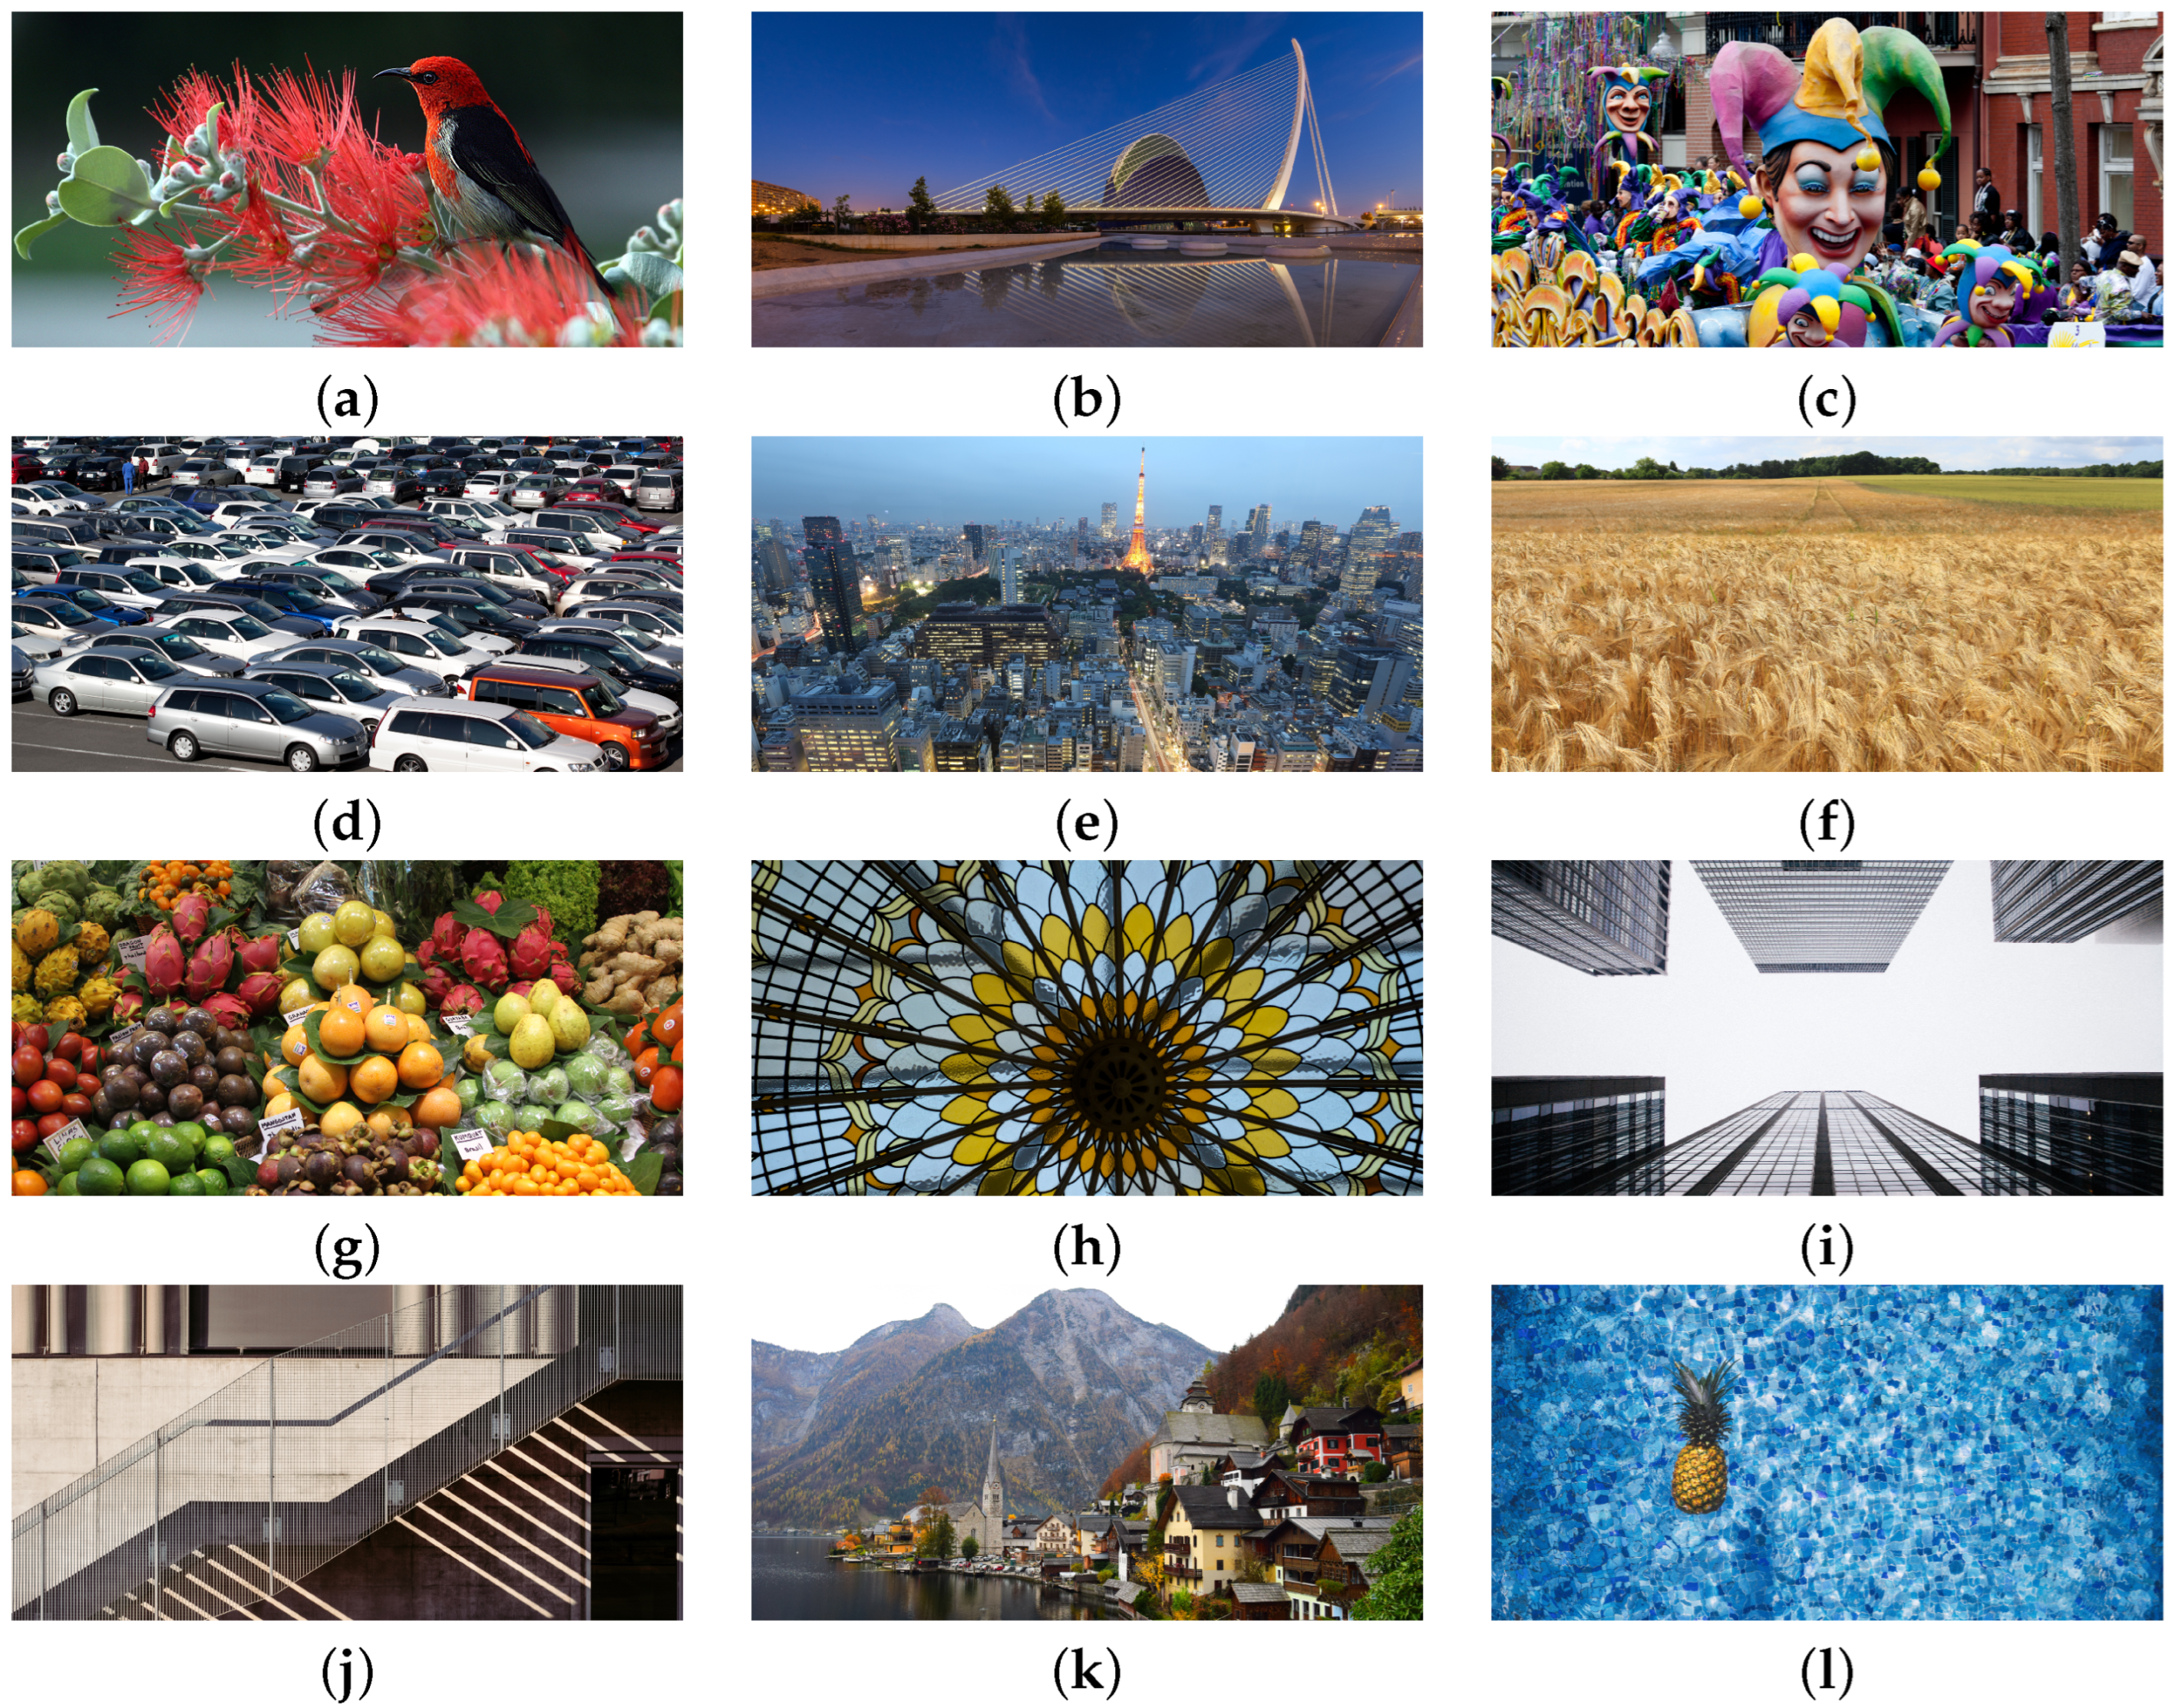
For the experimental evaluation, a dataset of twelve textures with diverse visual characteristics was selected for use in the rendering pipeline (see
Figure 2). All images were sourced from the DIV2K dataset [
18], which provides high-quality, high-resolution natural images in PNG format representing a wide range of real-world scenes.
Rather than a random subset, the 12 images were selected to be content-diverse and representative of visual characteristics known to influence compression behavior. The chosen images include natural scenes, structures with strong edges, complex urban scenes, fine edges and repetitive structures, foliage and other granular details, smooth gradients and glossy materials, complex patterns, and highly colorful, irregular content, spanning both darker and brighter scenes. This diversity reduces the risk that the obtained efficiency metrics are artifacts of a particular image type. Specifically, the selected images were chosen to cover two complementary goals:
Texture-like content, resembling patterns and materials commonly used in graphics applications.
Compression-sensitive content, containing fine details, high-frequency regions, or structural complexity useful for evaluating the behavior of compression algorithms.
To ensure consistency during texture loading and mipmap generation, each image was resized both vertically and horizontally to the nearest power of two, following standard practices in texture mapping workflows. All test images are provided in PNG format in RGB with 8 bits per channel, ensuring a uniform, lossless reference for comparison across the evaluated formats.
After resizing, each image has a resolution of 2048 × 1024 pixels, corresponding to an uncompressed bitmap size of approximately 6 MB (computed as width × height × 3 channels). This provides a sufficiently large and consistent baseline for assessing differences in visual fidelity, compression ratio, and performance across all tested methods.
2.3. Software and Hardware Testing Environment
Development and experiments were conducted on Microsoft Windows 11 Professional. The mockup testing application was implemented in C/C++ using Visual Studio Community Edition 2022. The graphics engine is based on OpenGL 4 and FreeGLUT 3.6.0, and it was used for rendering both 2D and 3D visualizations. The 3D scene was created with Blender 4.2, and test images were resized using GIMP 2.10.36 when necessary. Data analysis was performed using Python 3.13 with the Pandas library within the JupyterLab environment.
For texture encoding, decoding, and loading, the following libraries were used:
FreeImage 3.18.0 [
19] for PNG and JPEG read/write support;
libavif/libaom/libgav1 1.0.4 [
20] for AVIF encoding and decoding;
Compressonator 4.5 [
21] for S3TC and BPTC compression into DDS containers;
TexConv 2024.9.5.1 [
22] for BPTC encoding.
All experiments and performance measurements were executed on a personal computer with the following specifications:
Processor: AMD Ryzen 9 3950X, 16 cores, 3.50 GHz base speed
RAM: 32 GB
Storage: 2 TB M.2 SSD
GPU: AMD Radeon Pro WX 9100, 16 GB VRAM, AMD PRO Edition, driver v25.Q2
To ensure stable and reproducible measurements, dynamic frequency scaling and turbo mode were disabled. Each operation (loading, compression, and saving) was repeated six times; the first run was discarded as a warm-up, and the average of the remaining five runs was recorded. This procedure yielded highly stable results, with negligible standard deviation for JPEG and AVIF, and below 3% for S3TC and BPTC.
2.4. Performance Evaluation Metrics
To evaluate the performance of each compression format, we measured three complementary aspects of the processed images: visual fidelity, computational efficiency, and storage efficiency. Visual fidelity was assessed by comparing the reconstructed images to the original lossless reference, quantifying deviations caused by compression. Computational efficiency was evaluated by recording the time required for encoding and decoding each image. Storage efficiency was measured as the reduction in file size achieved by the compression process.
In more detail, the following metrics were used to quantify these aspects:
Mean Squared Error (MSE): Measures the quality of a compressed image compared to the original, often employed as a mean to assess image compression algorithms. Lower values indicate higher fidelity. The MSE is calculated for each pixel channel as follows:
Peak Signal-to-Noise Ratio (PSNR): Quantifies reconstruction quality of images after lossy compression [
23]. It is defined as the ratio between the maximum signal power and noise level introduced by compression. The PSNR is defined through the MSE and includes a normalization factor based on the maximum value that a pixel channel can assume (255 for 8-bit images). It is expressed in decibels with a typical range of 0 to 60; the higher the PSNR value, the better the fidelity of the compressed image to the original. The PSNR is calculated as follows:
Compression ratio: Measures how effectively an algorithm reduces the data size relative to the original uncompressed image. A value greater than 1 indicates that compression was effective, with larger values corresponding to greater reductions in size. Conversely, a ratio below 1 indicates that compressed output is larger than the input, which is undesirable. The compression ratio is calculated as:
Space saving: Expresses the reduction in file size as a percentage with respect to the uncompressed input. Values closer to 100% indicate strong size reduction, while negative values occur if compression increases the file size. Space saving is computed as:
Although space saving is related to compression ratio, both metrics are reported to serve complementary interpretive purposes: compression ratio enables direct comparison with prior studies, while space saving provides a more intuitive measure of practical storage reduction.
Image encoding time: Measures the time, in milliseconds, required to compress the original PNG image into the target format. Each image is encoded six times in sequence; the first measurement is discarded to mitigate cold-start effects, and the reported encoding time is the average of the remaining five runs. This metric reflects the computational cost of producing compressed assets, which can be significant during content-creation or preprocessing pipelines.
Image decoding time: Measures the time, in milliseconds, required to load a compressed image for use. As with encoding, each image is decoded six times, discarding the first measurement and averaging the subsequent five (based on cached data). This metric characterizes the CPU-side cost of preparing textures before they are transferred to the GPU. For GPU-native formats (S3TC and BPTC), decoding time is not reported. These formats are designed to remain compressed in VRAM and are not decoded on the CPU. Instead, the GPU performs on-the-fly decompression of only the texels required for rendering each frame. This texture-fetch approach minimizes memory bandwidth usage and avoids any CPU-side decompression cost, making traditional decoding-time measurements irrelevant for these formats.
2.5. Analysis Procedure
The analysis consists of two consecutive phases: a 2D rendering stage followed by a 3D rendering stage. In both phases, the images are compressed into the target formats, loaded into textures, rendered within a controlled scene, and compared against a reference rendering. Upon completion, the program outputs two CSV files containing all measurements collected during both phases. These files are available as
Supplementary Material to this article (as
analysis_result_2D.csv and analysis_result_3D.csv).
2.5.1. 2D Analysis Procedure
The 2D analysis begins by loading the original test image into a texture and rendering it on screen at its native resolution as a flat, two-dimensional image. A screenshot of this rendering is captured and used as the reference for all subsequent comparisons.
The original image is then compressed into JPEG using FreeImage and into AVIF using avifenc [
20]. Both formats are encoded at six predefined quality levels. These levels vary in encoder quality (0–100) and chroma subsampling settings, ensuring consistent testing across formats. The six quality presets are:
Low: Quality 10, chroma subsampling 4:2:0 (Q10, 4:2:0).
Average: Quality 25, chroma subsampling 4:2:0 (Q25, 4:2:0).
Normal: Quality 50, chroma subsampling 4:2:0 (Q50, 4:2:0).
Good: Quality 75, chroma subsampling 4:2:2 (Q75, 4:2:2).
Excellent: Quality 100, chroma subsampling 4:2:2 (Q100, 4:2:2).
Maximum: Quality 100, chroma subsampling 4:4:4 (Q100, 4:4:4).
For AVIF, all compression tasks are performed with encoder speed (−s) parameter set to 0 (slowest encoding, highest quality) and both encoder and decoder are configured to use all available CPU cores. Tiling was left at the default single-tile setting. The complete AVIF encoding configuration is summarized in
Table 1.
The image is also converted into GPU-native formats S3TC (DXT1) and BPTC (BC7) within a DDS container using compressonator. For BPTC, four quality configurations are encoded: 0% (Q00, lowest), 10% (Q10), 50% (Q50), and 100% (Q100, highest).
Each compressed image is then loaded into a texture, rendered using the same procedure as the original, and a screenshot is captured. This screenshot is compared to the reference, and the following metrics are computed and saved to a CSV file: MSE, PSNR, compression ratio, space saving, encoding time, and decoding time. The entire process is repeated for each image in the test dataset.
2.5.2. 3D Analysis Procedure
After completing the 2D evaluation, the same images are analyzed in a 3D rendering context by using them as textures in the scene described in
Section 2.1. The original test image is first applied as a texture to all objects in the scene. The rendered frame is captured and saved as the 3D reference screenshot. Each compressed image generated in the 2D phase is then loaded into a texture, applied to the same objects, and rendered under identical conditions. A screenshot is captured and compared to the reference.
Each compressed image is evaluated in three rendering modes:
Natural: textures rendered without filtering, lights disabled.
Filtered: textures rendered with mipmapping, trilinear, and anisotropic filtering, lights disabled.
Filtered and illuminated: textures rendered with mipmapping, trilinear, and anisotropic filtering, three lights enabled.
The three rendering modes were chosen to represent the main use cases, enabling separate analysis of how texture filtering and illumination affect the visibility of compression artifacts.
For every compressed texture and every rendering mode, MSE and PSNR are computed and saved to a CSV file.
3. Results
In this section, we report the experimental results obtained by applying the methodology described in the previous section. The resulting dataset of processed images was systematically analyzed using the defined evaluation metrics. The results are organized and discussed according to three main aspects: image quality, compression efficiency, and encoding and decoding performance. Averaged results are reported as mean ± SD (min–max).
3.1. Image Quality
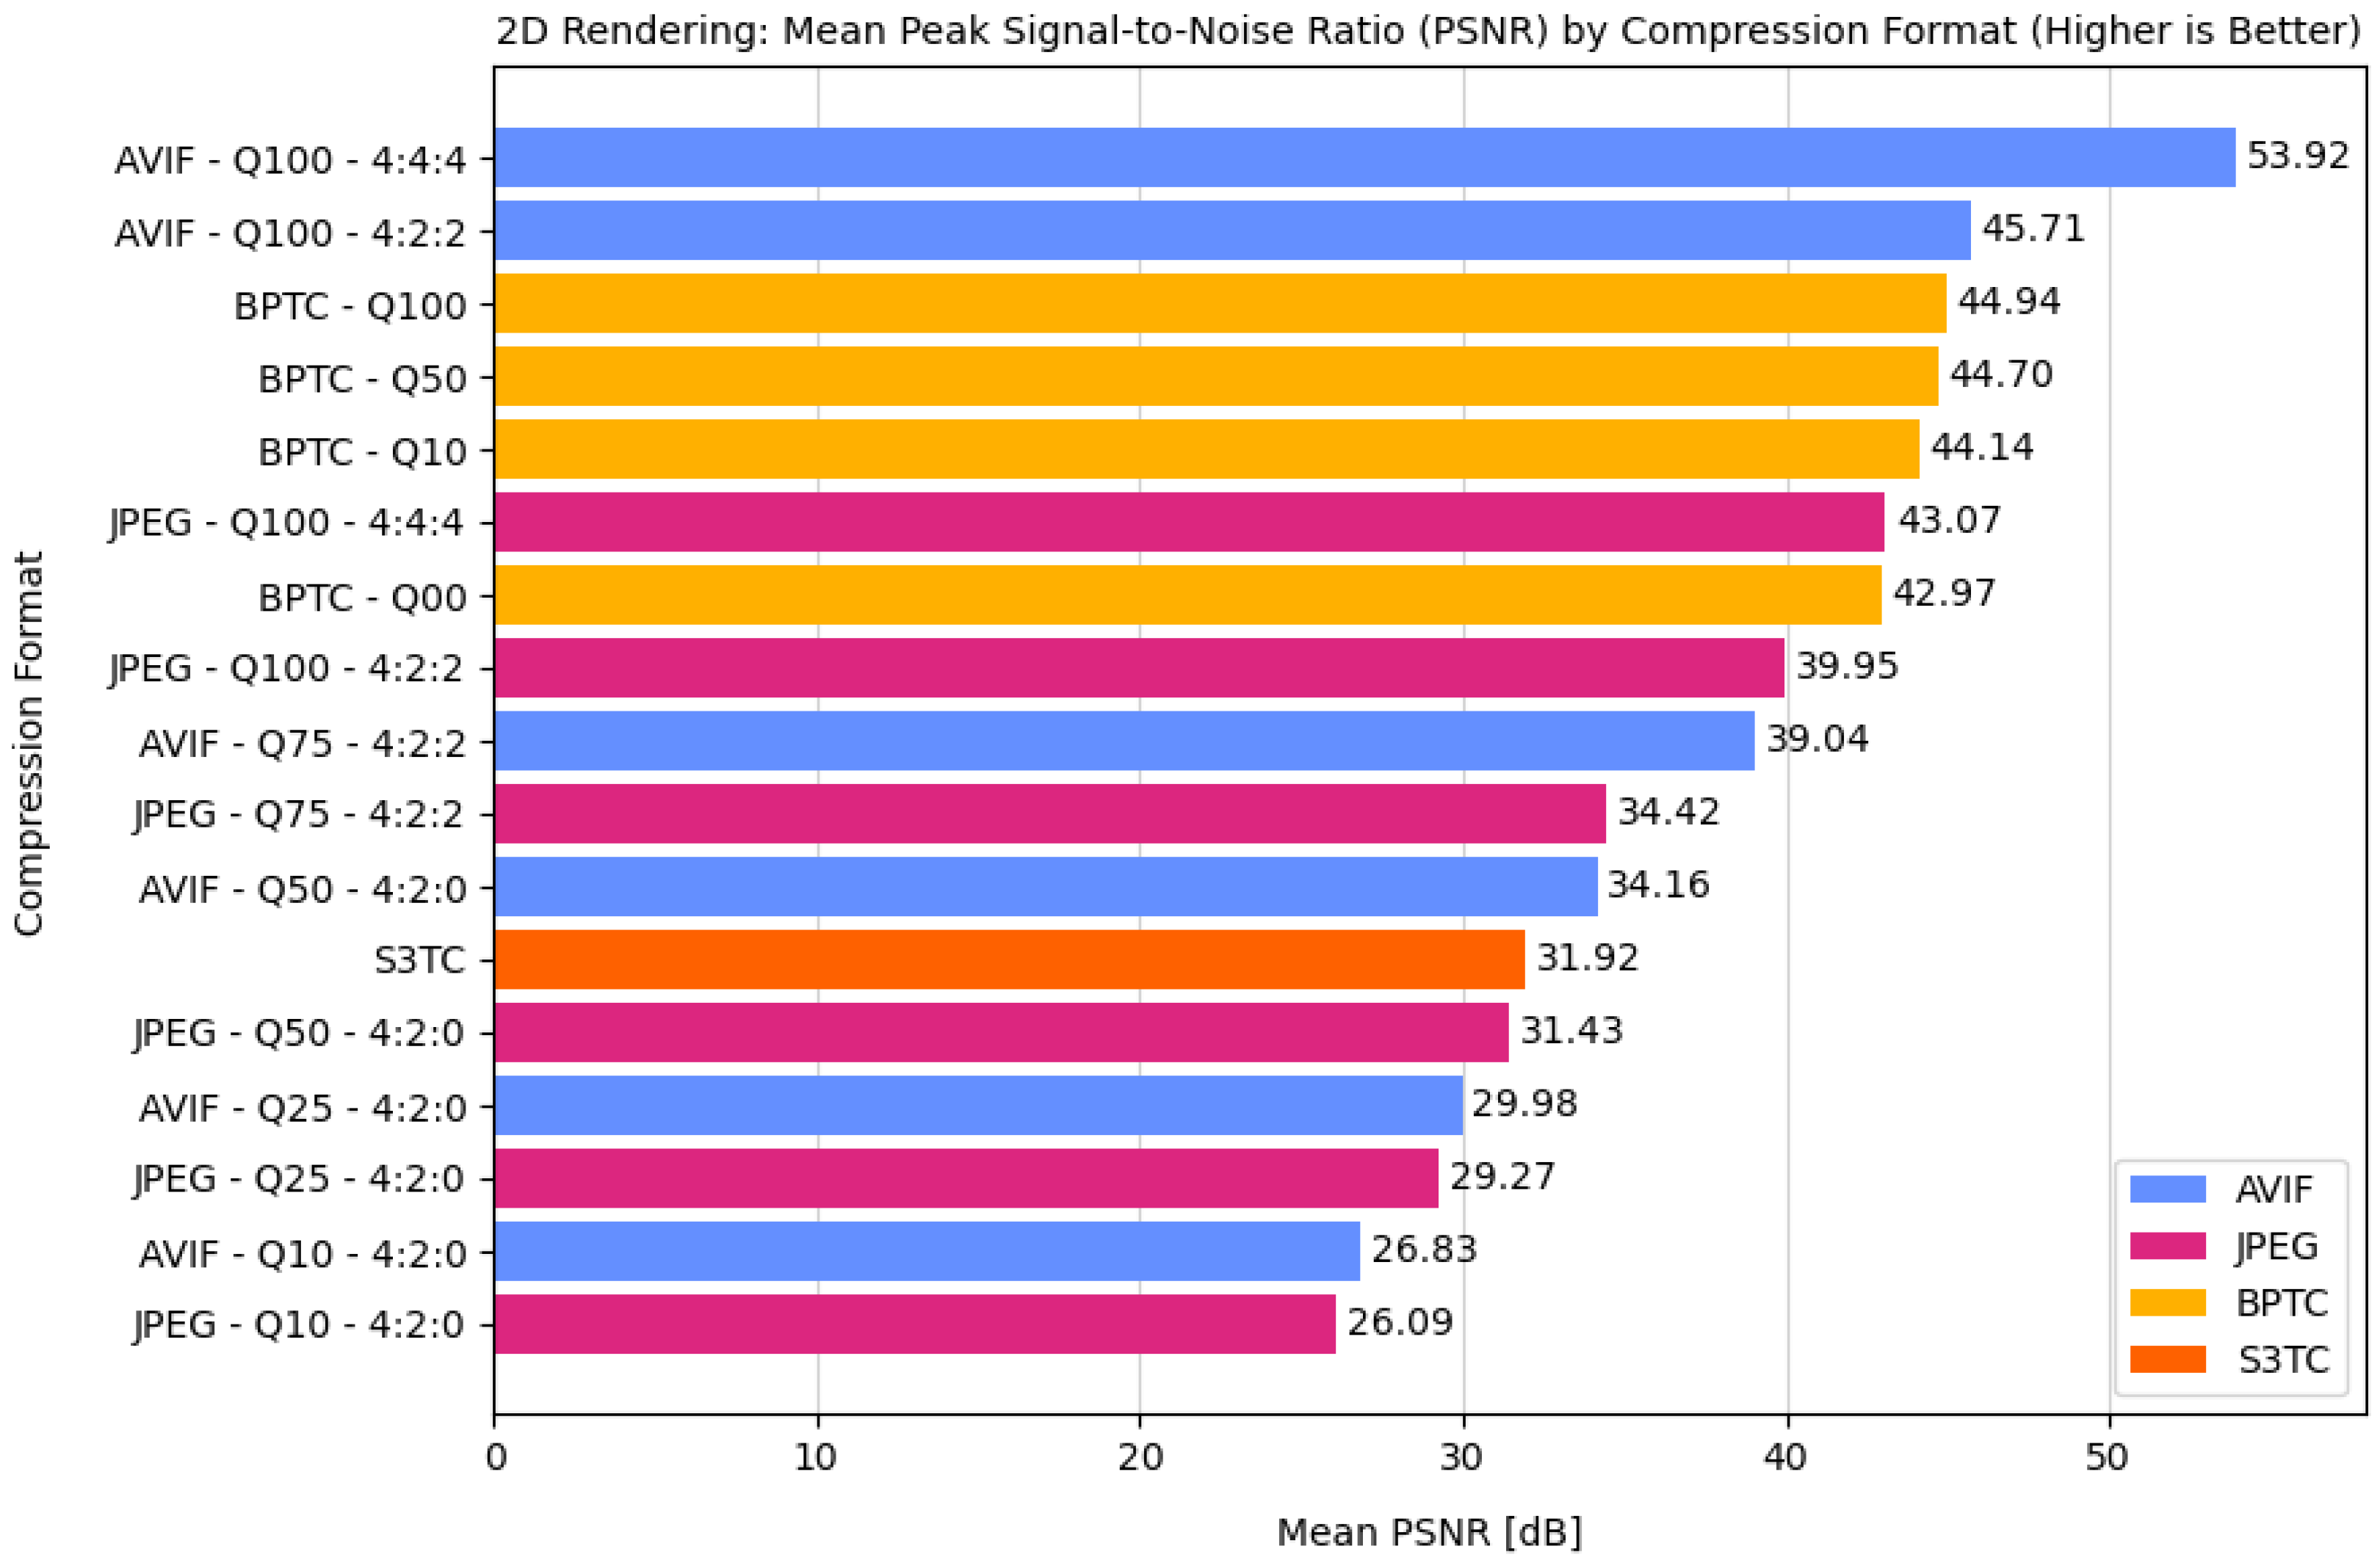
Figure 3 reports the mean PSNR values measured across all test images during 2D rendering for the four compression formats, annotated with the corresponding quality and chroma subsampling settings where applicable. The highest PSNR is achieved by AVIF at the maximum quality configuration (Q100, 4:4:4), reaching 53.92 ± 0.75 dB (52.97–55.48 dB). This is followed by AVIF at the second-highest setting (Q100, 4:2:2), with a PSNR value of 45.71 ± 2.45 dB (39.19–49.14 dB).
The BPTC format exhibits consistently high image quality, with PSNR values ranging from 44.94 ± 1.94 dB (40.63–47.51 dB) at the highest quality setting to 42.97 ± 1.89 dB (39.18–45.86 dB) at the lowest. The variation across BPTC quality levels is limited to less than 2 dB, indicating stable reconstruction fidelity regardless of compression parameters.
For JPEG, the best result is obtained at the maximum quality configuration (Q100, 4:4:4), yielding a PSNR of 43.07 ± 1.73 dB (40.60–45.49 dB), which is comparable to the lowest-quality BPTC configuration (Q00, 42.97 dB). At its second-highest setting (Q100, 4:2:2), JPEG achieves a PSNR of 39.95 ± 1.46 dB (36.25–41.31 dB), closely matching AVIF at a lower quality configuration (Q75, 4:2:2), which reaches 39.04 ± 1.27 dB (35.67–40.50 dB).
In contrast, the S3TC format exhibits substantially lower reconstruction quality, with an average PSNR of 31.92 ± 1.43 dB (29.83–33.81 dB). This value is comparable to that of JPEG at Q50 with 4:2:0 chroma subsampling, at 31.43 ± 1.60 dB (27.41–33.68 dB), and can be considered indicative of poor visual fidelity. The lowest PSNR values are observed for both AVIF and JPEG at their minimum quality settings, with PSNR values of approximately 26 dB.
Overall, these results indicate that AVIF consistently provides higher image fidelity than JPEG when compared at equivalent quality settings, with the performance gap widening as the quality level increases.
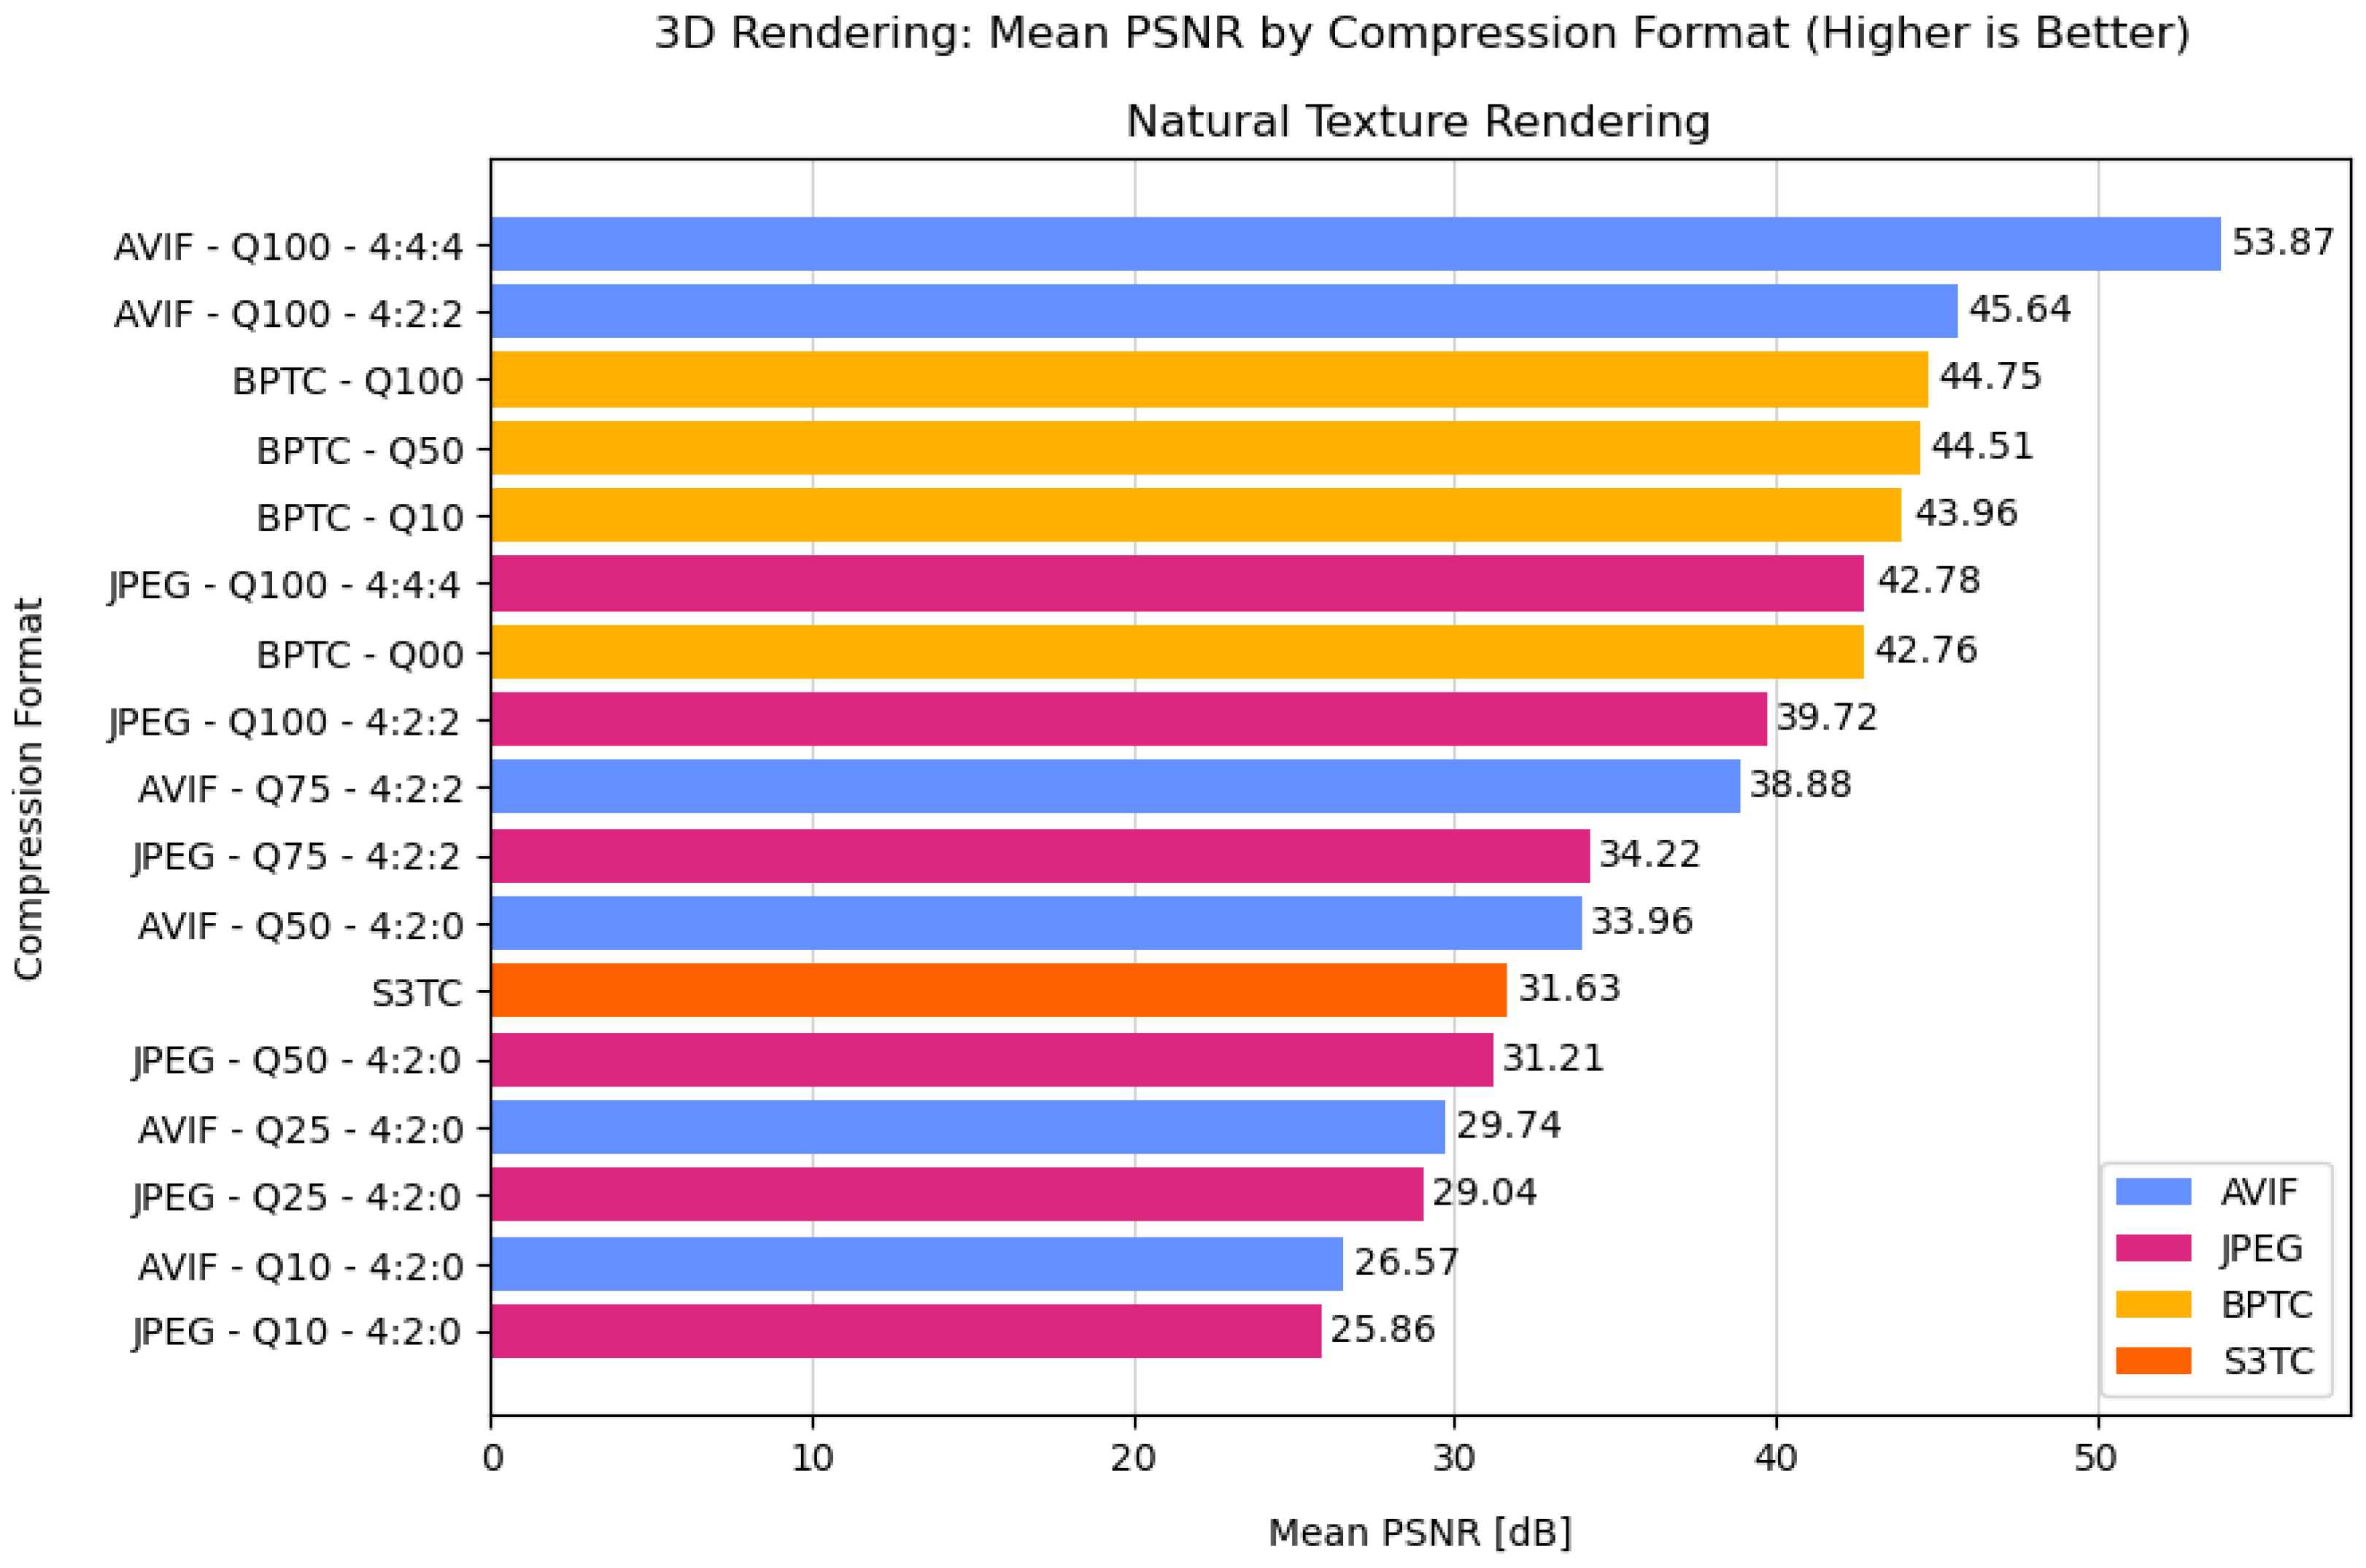
Figure 4 reports the mean PSNR values measured across all test images during 3D rendering in natural mode, i.e., without texture filtering or illumination. The results closely mirror those obtained in the 2D rendering evaluation. Across all compression formats, the mean PSNR decreases by less than 0.3 dB compared to the corresponding 2D results, and the relative ranking of formats remains unchanged.
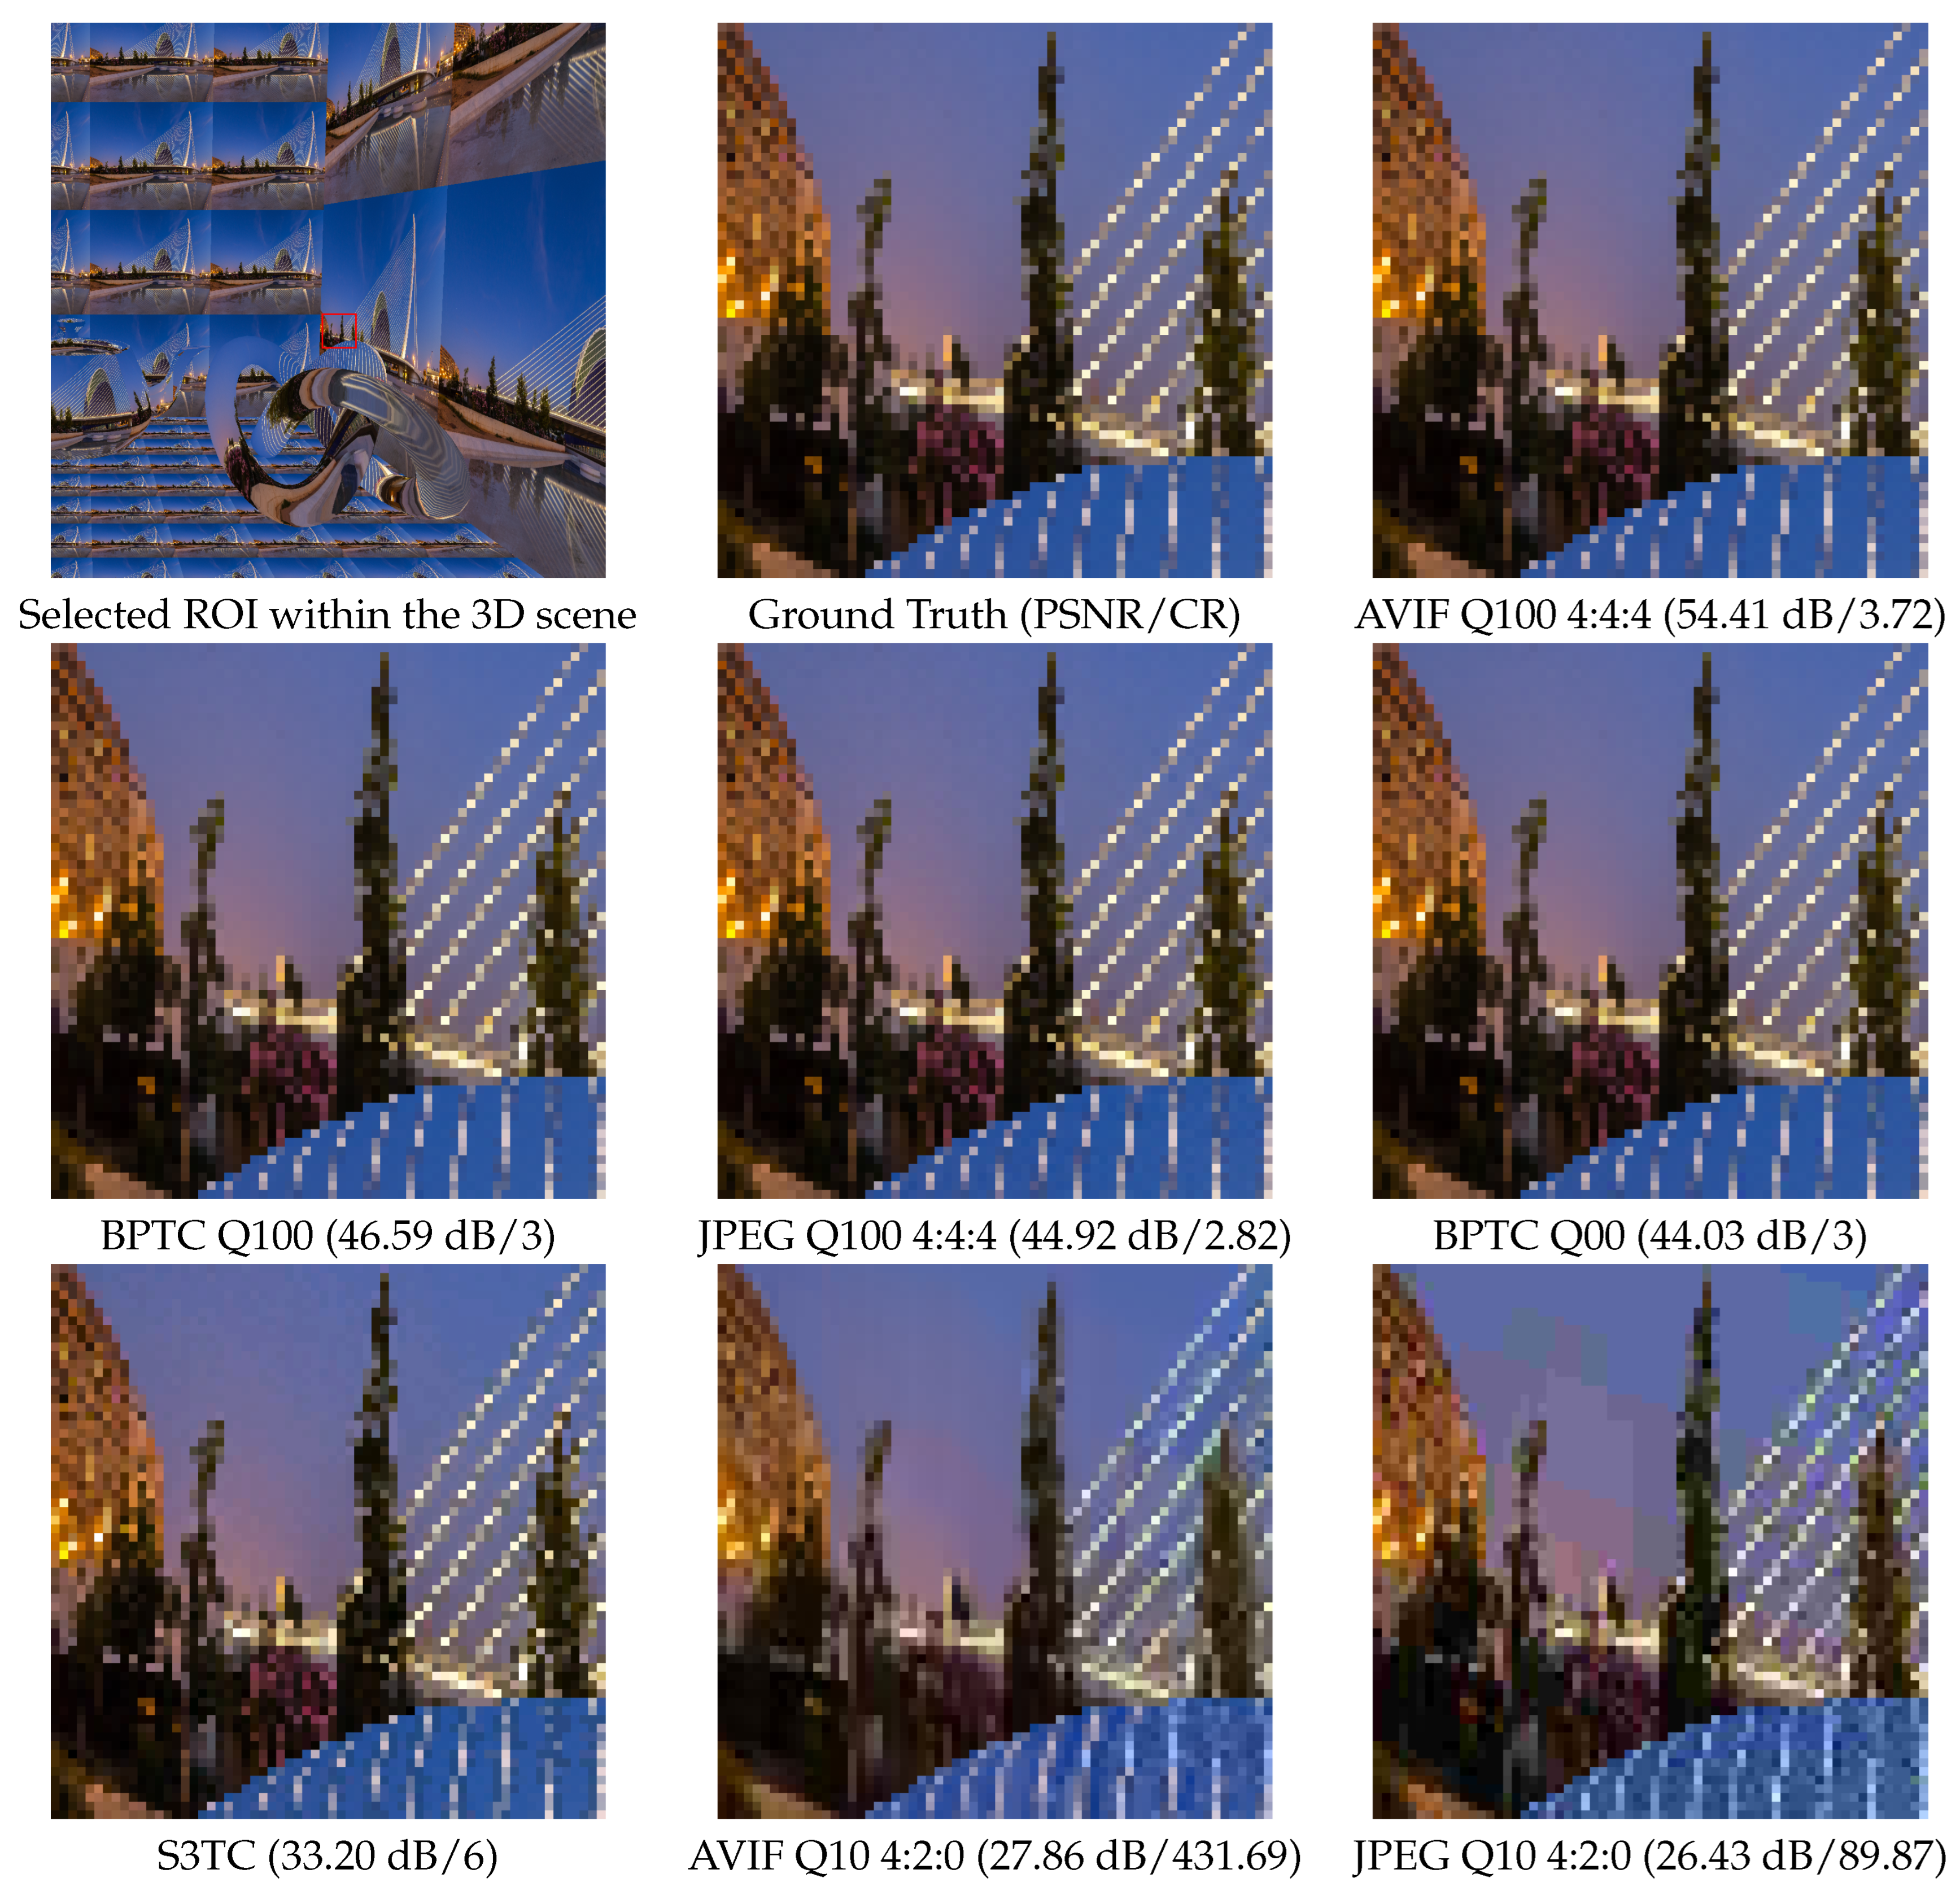
Figure 5 presents a visual comparison of a representative region of interest in the 3D scene rendered in natural mode for selected compression formats and quality settings.
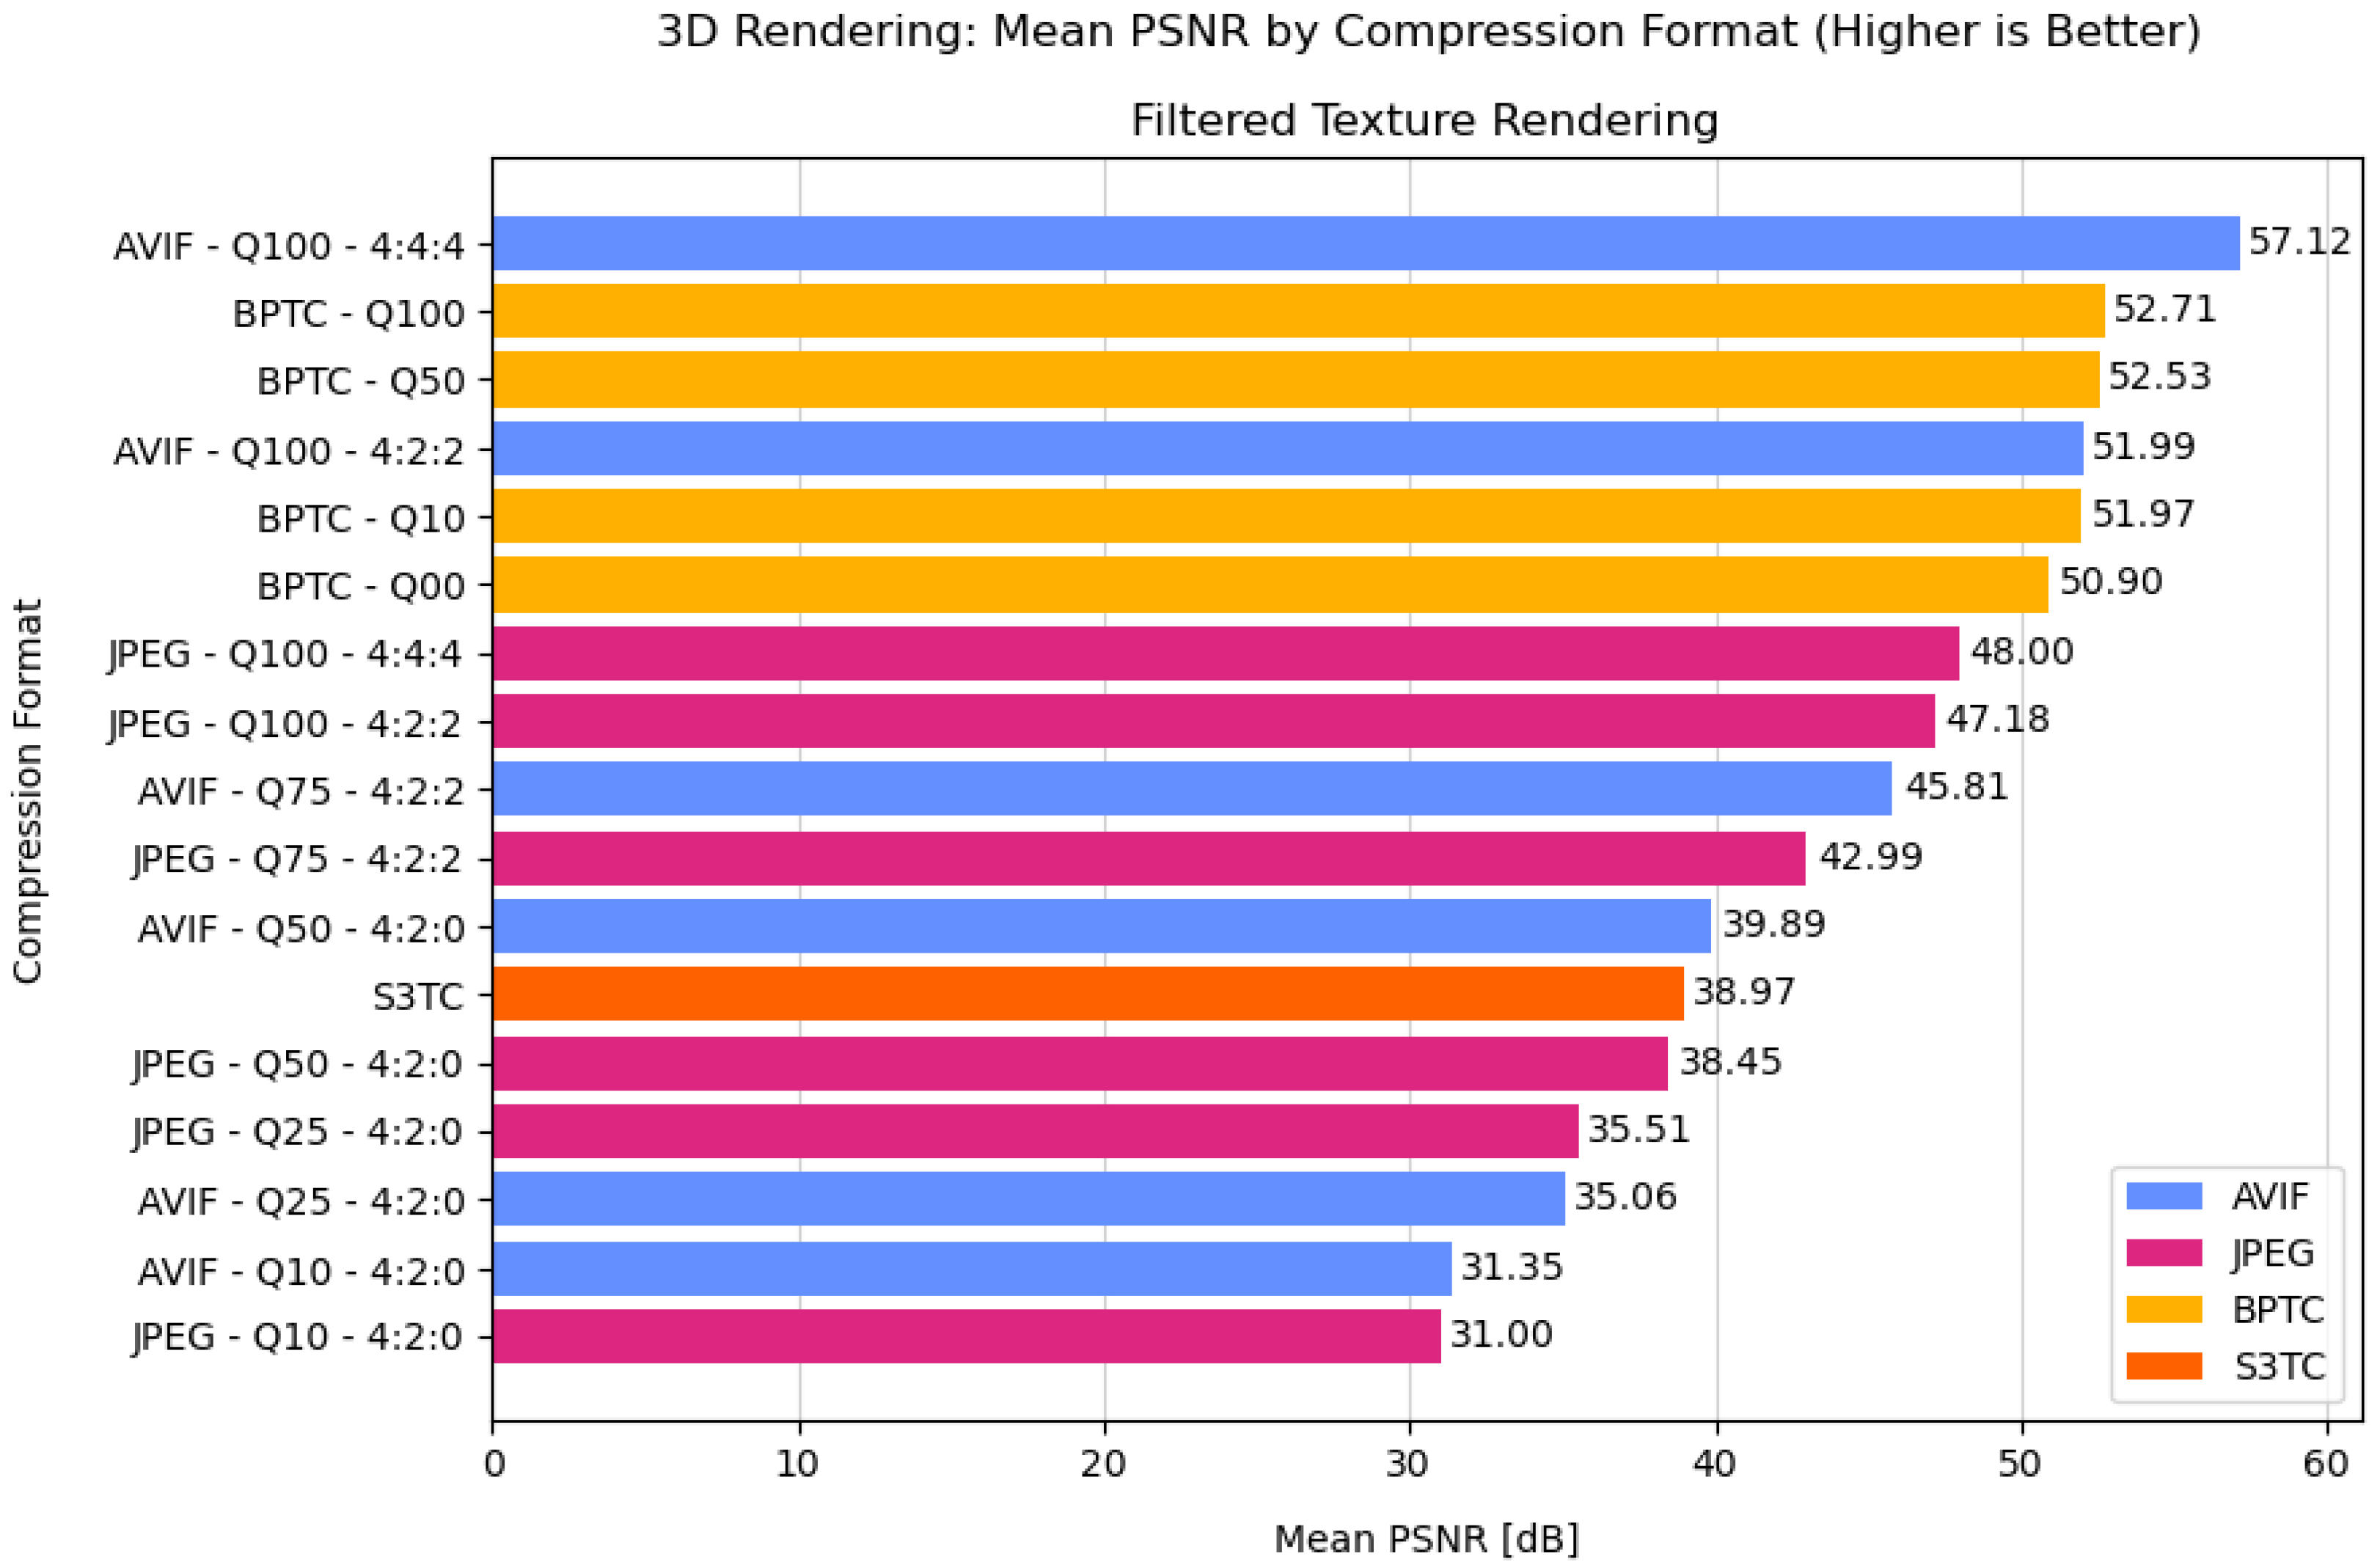
When textures are rendered in filtered mode (
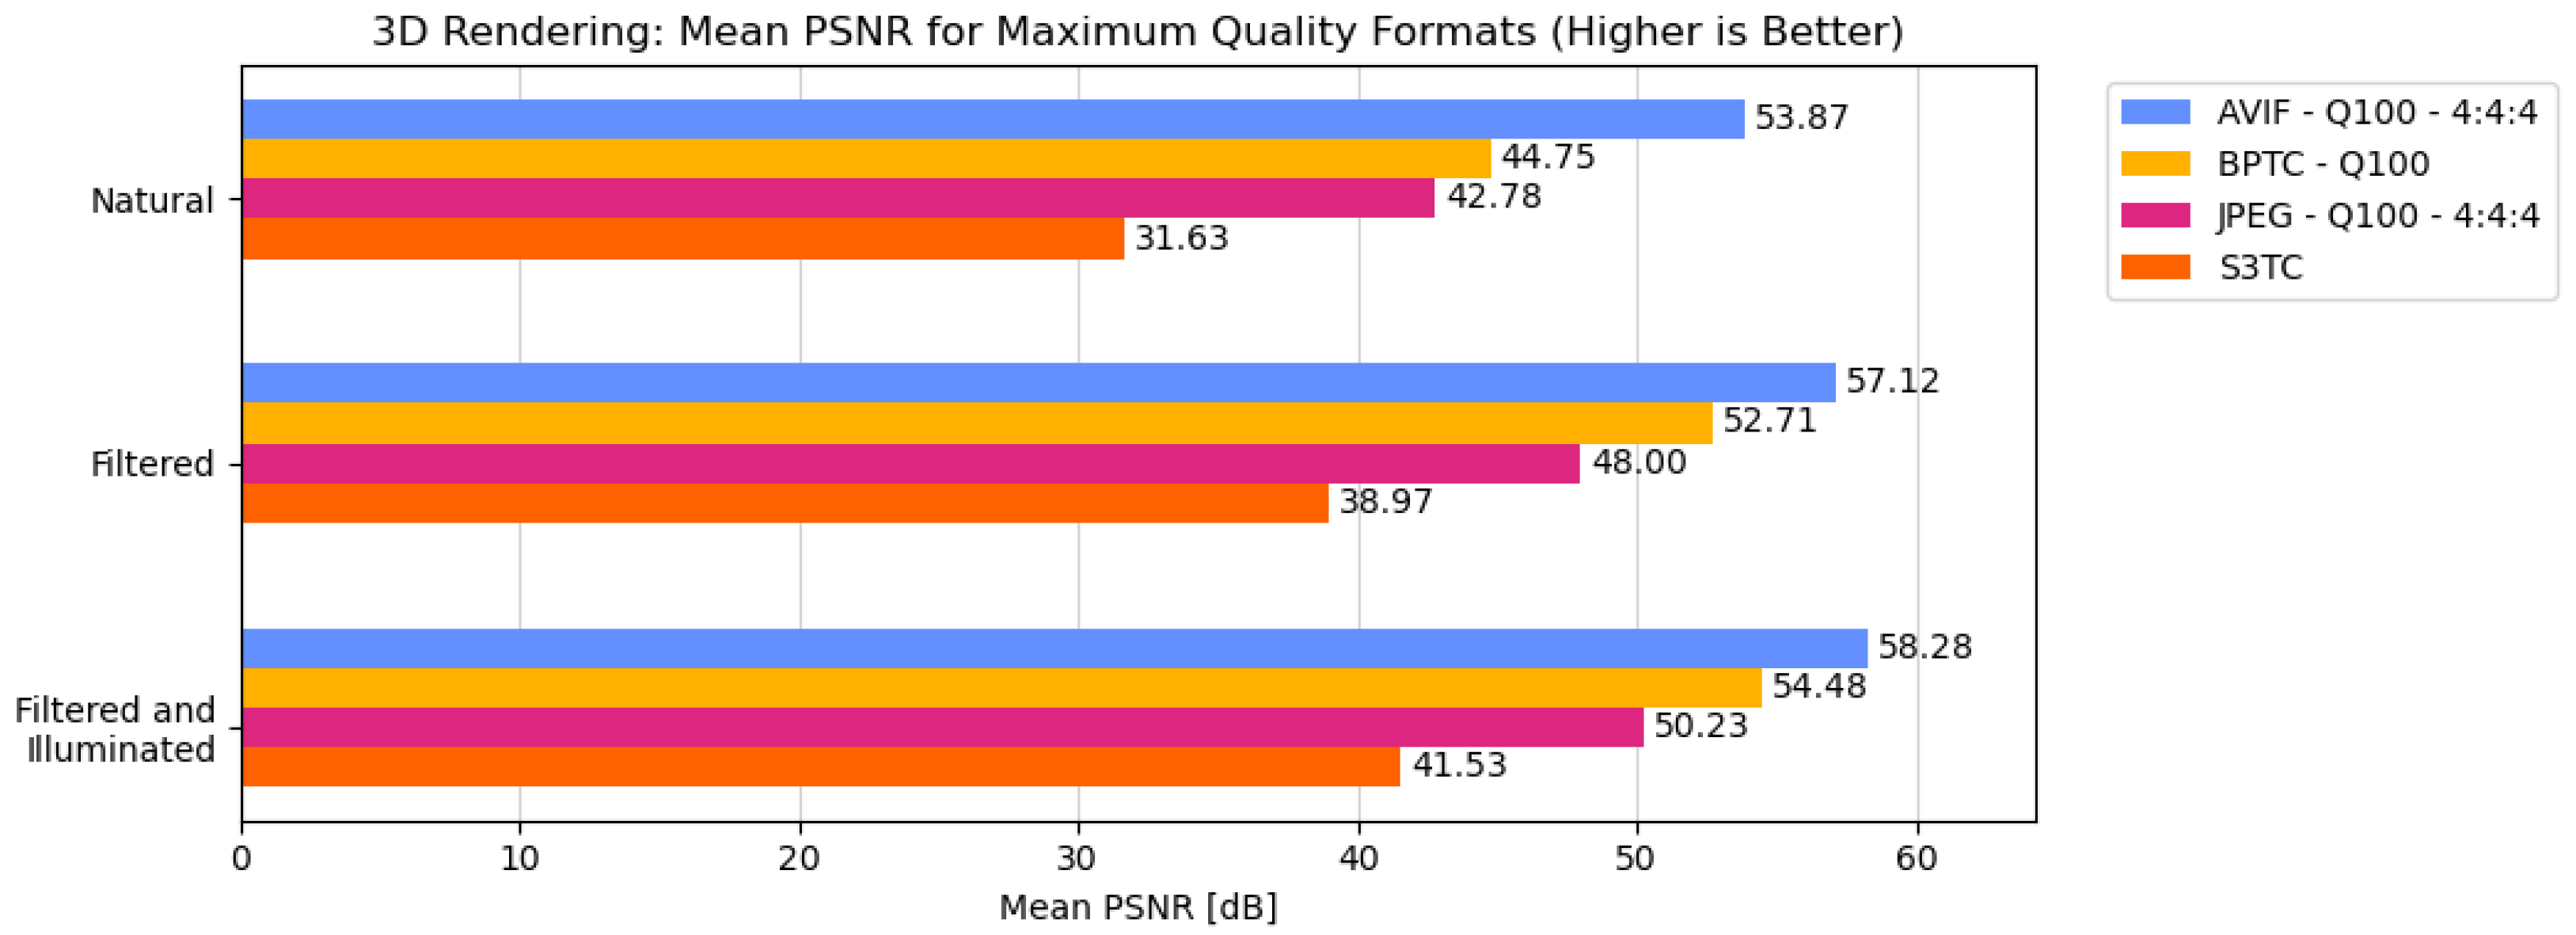
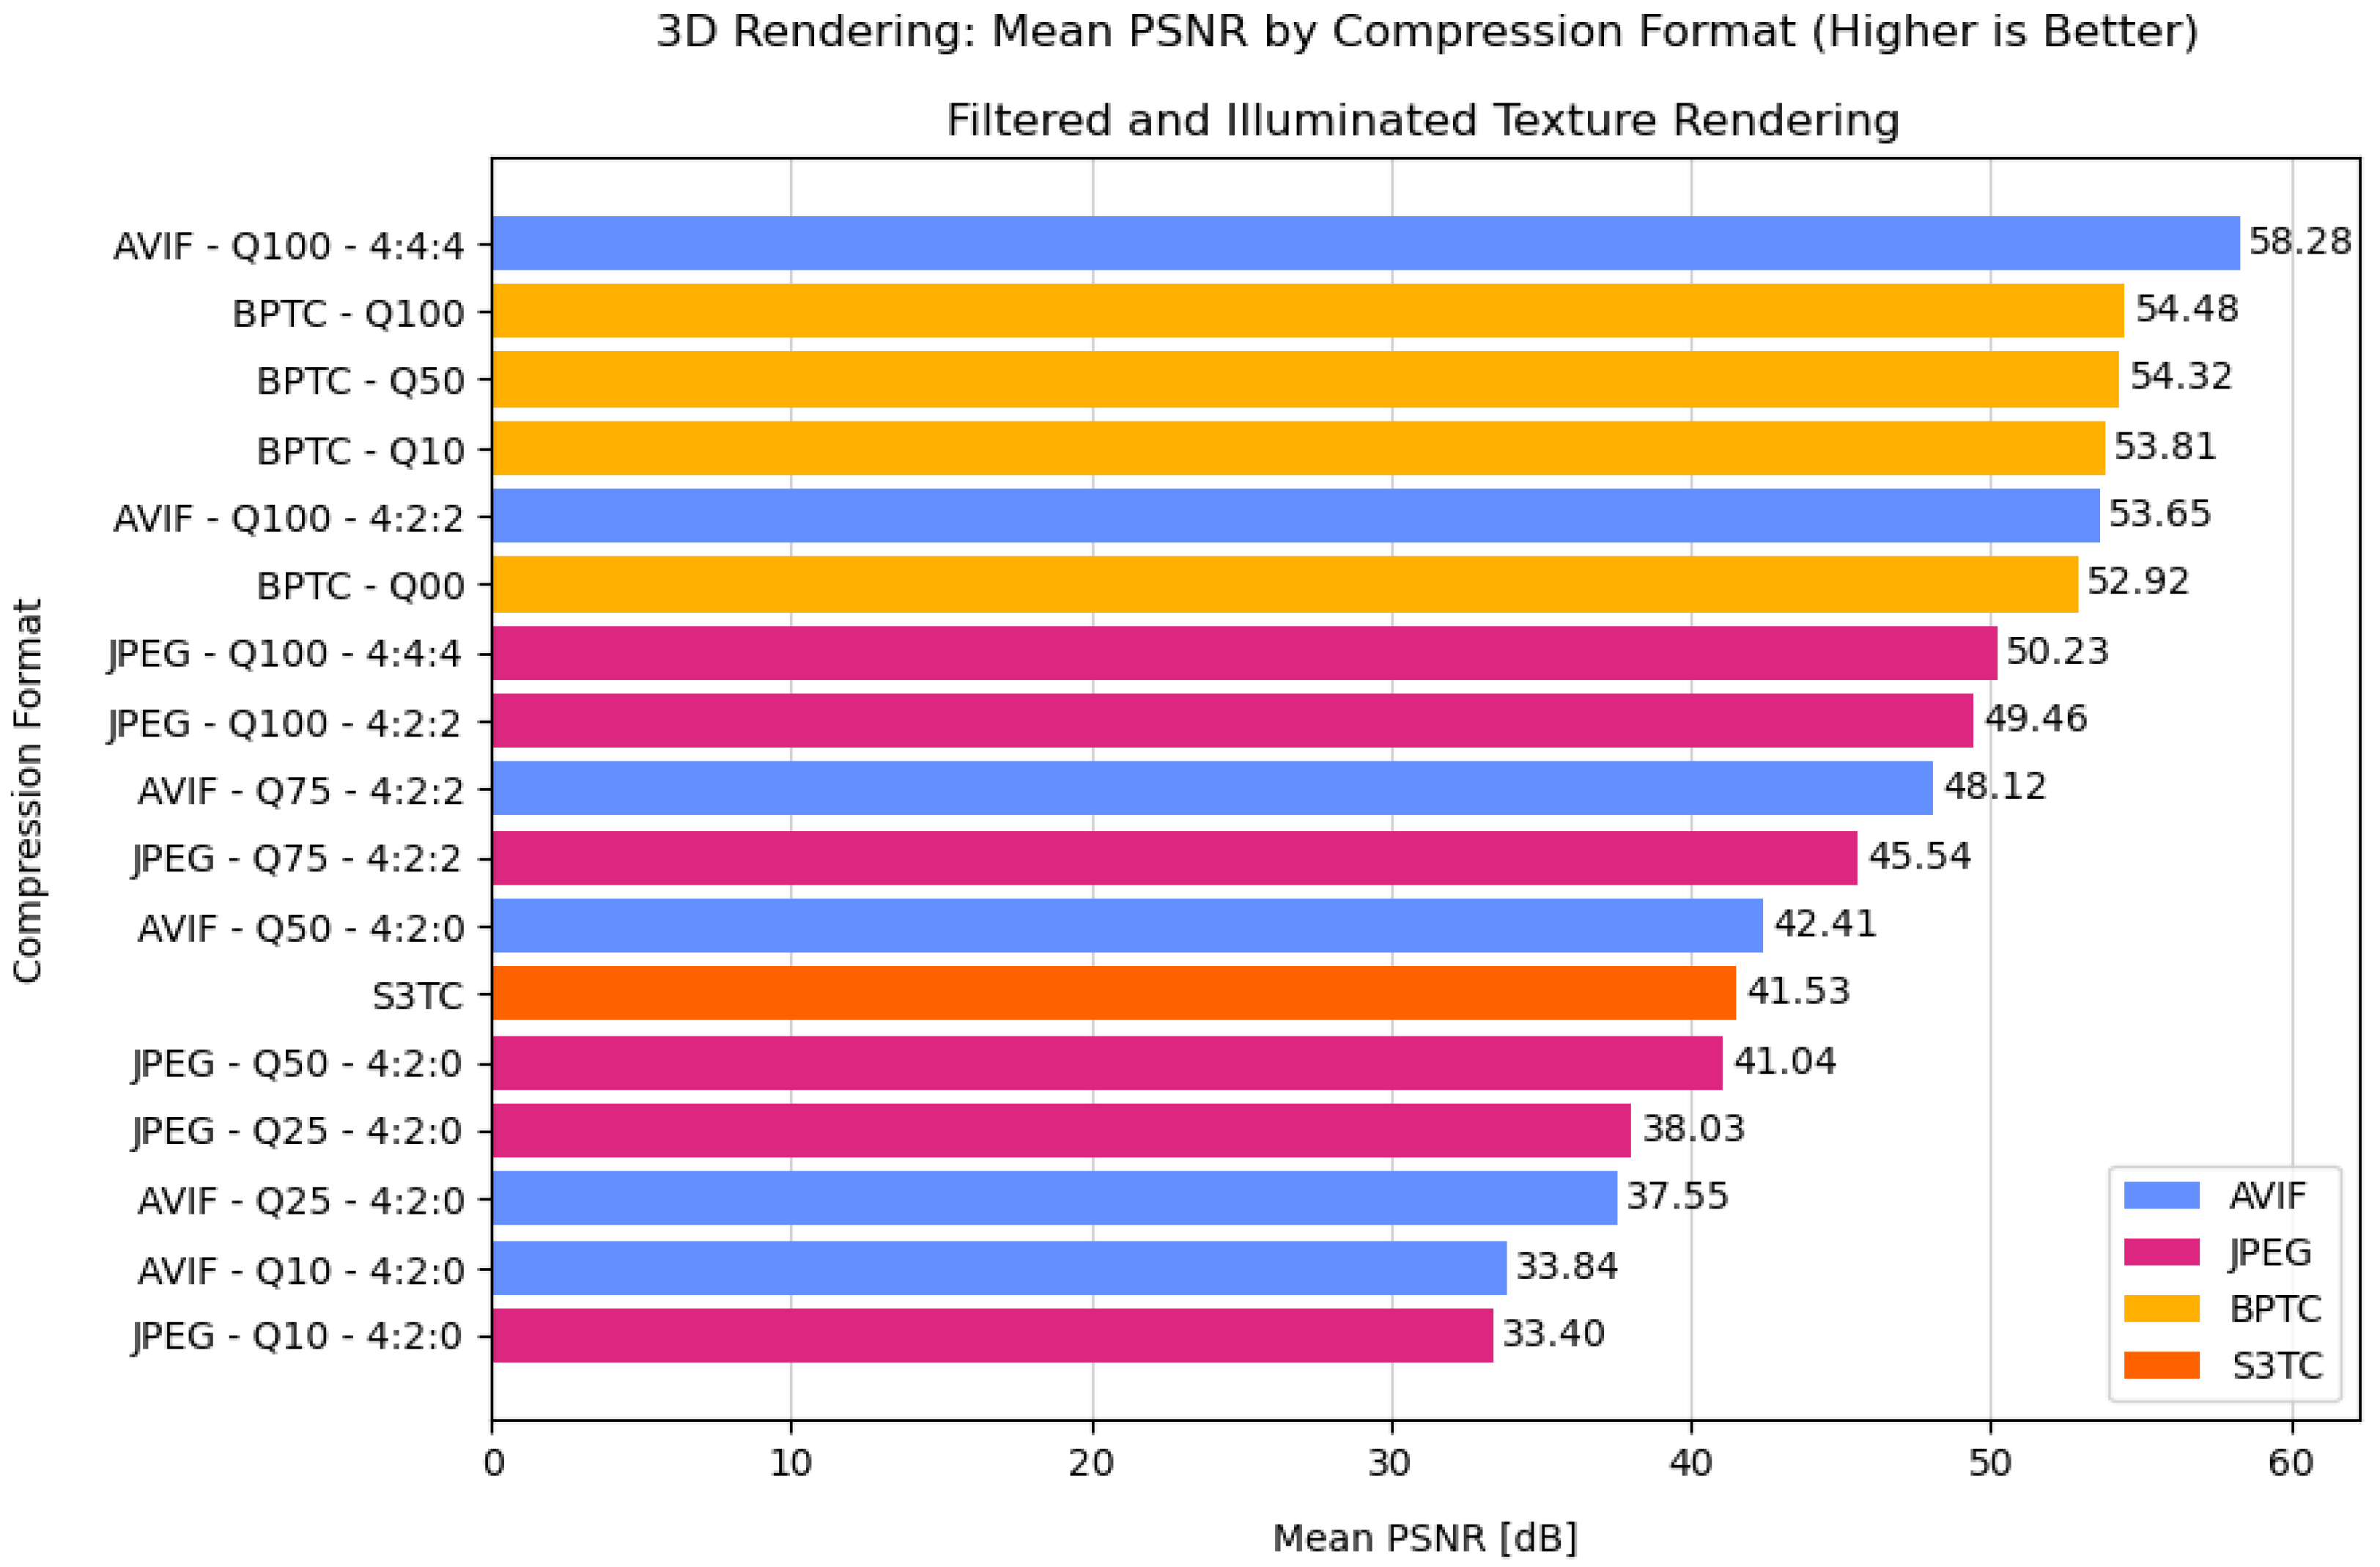
Figure 6), using anisotropic filtering, trilinear filtering, and mipmapping, the mean PSNR values increase between 3.2 and 8.8 dB relative to natural mode, depending on the format. A further increase is observed in filtered and illuminated mode (
Figure 7), where scene illumination is enabled in addition to texture filtering. In this configuration, PSNR improvements range from 4.4 to 11.3 dB compared to natural mode. These increases indicate a higher measured fidelity between textures generated from compressed images and those derived from the original, uncompressed data.
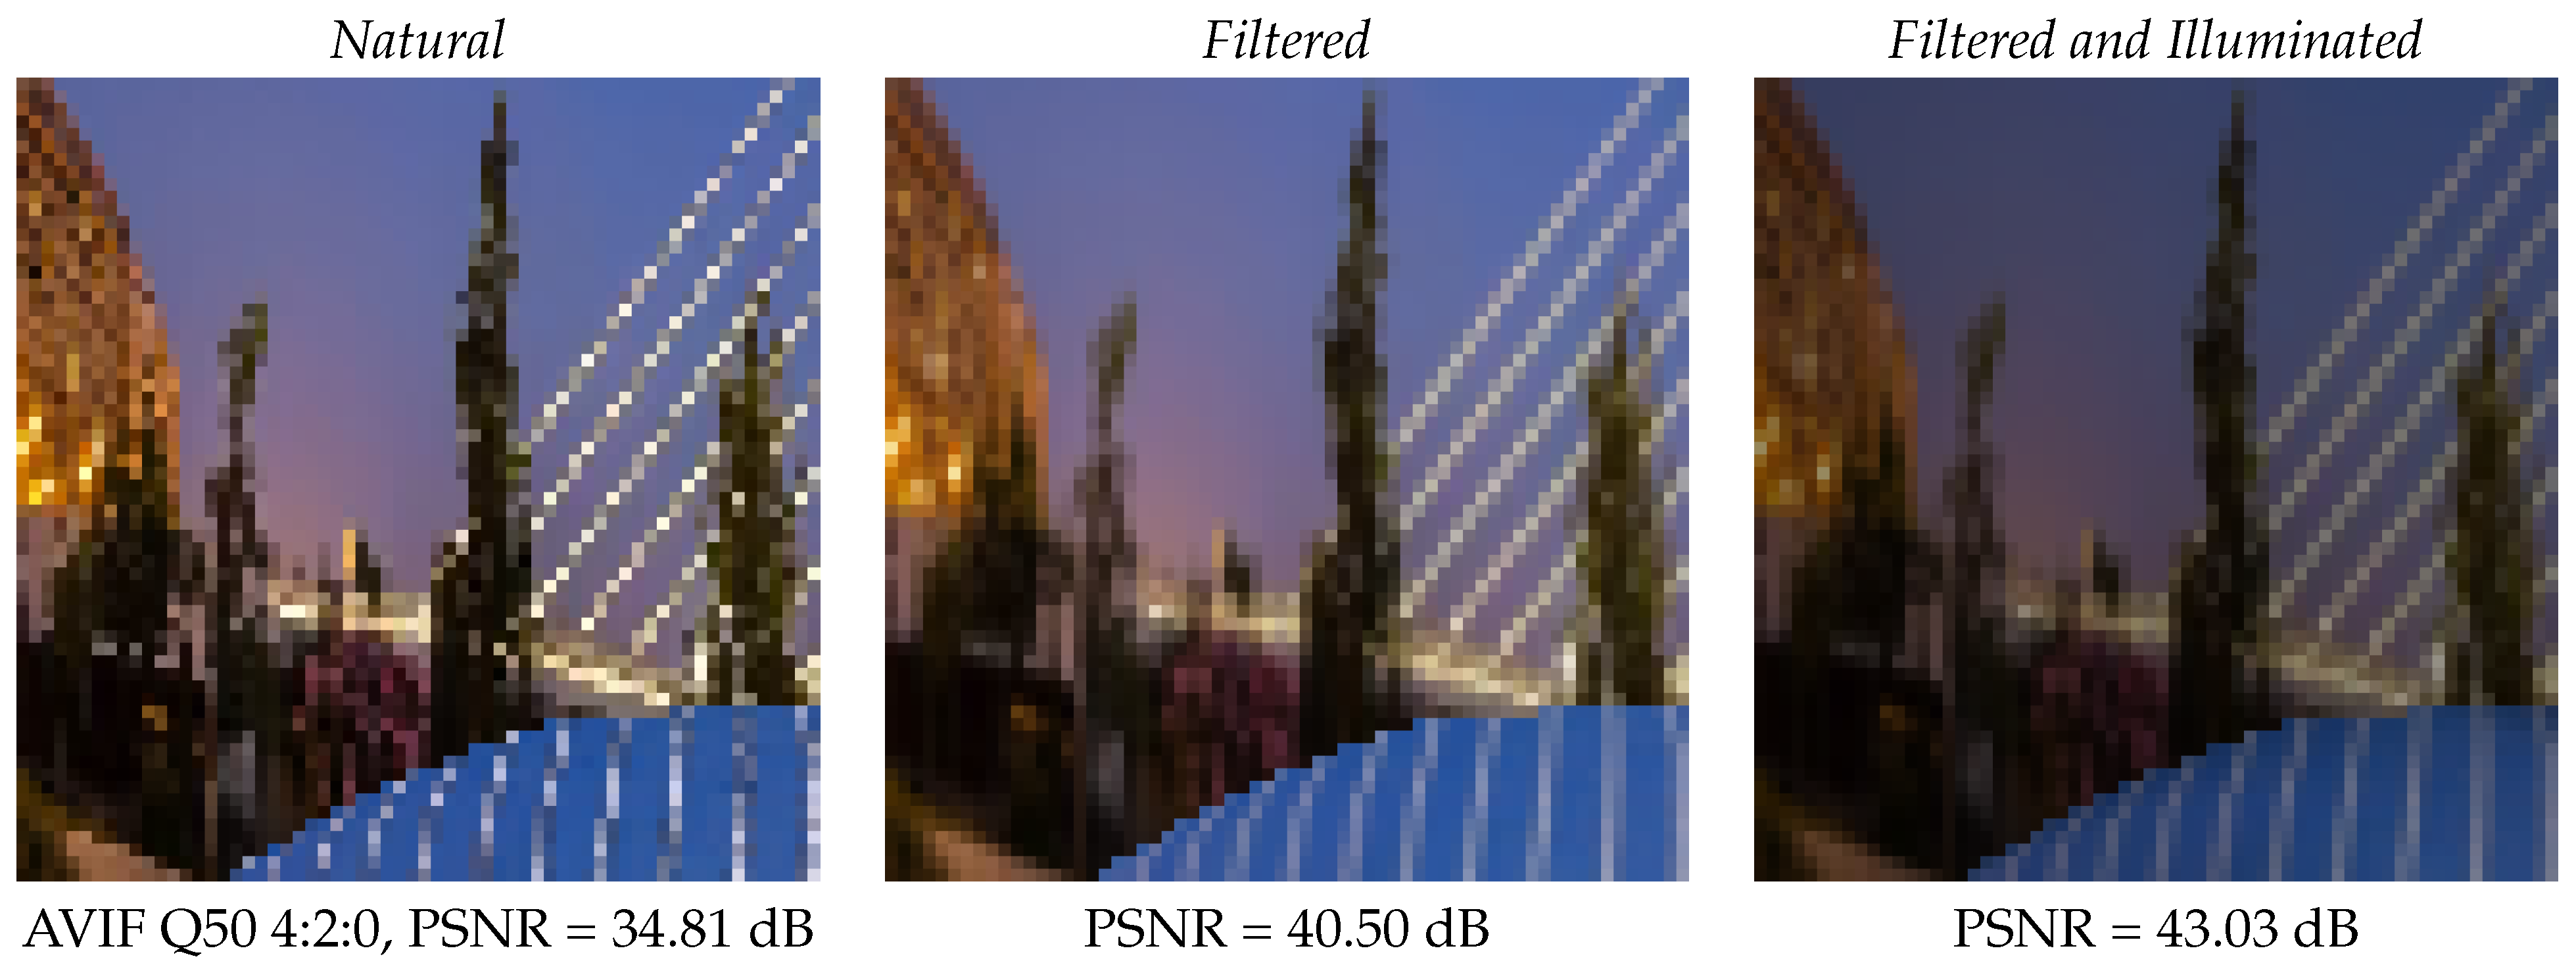
Figure 8 shows the visual effect of texture filtering and illumination in a representative image region. This behavior reflects the reduced sensitivity of PSNR to high-frequency compression artifacts once texture filtering and lighting are applied.
Under filtered and illuminated rendering conditions, the relative performance gap between formats is reduced. In particular, the ranking shifts slightly in favor of BPTC, with the difference between BPTC at its highest quality setting (Q100) and the best-performing AVIF configuration (Q100, 4:4:4) narrowing substantially. In filtered and illuminated mode, BPTC exhibits PSNR values that are 3.8 dB lower at its highest quality setting and 5.4 dB lower at its lowest, relative to AVIF (Q100, 4:4:4). By contrast, in natural mode, these differences increase to 9.1 dB and 11.1 dB, respectively.
Additionally, the variation between the highest and lowest BPTC quality settings is reduced in filtered and illuminated rendering, with a maximum difference of 1.6 dB. Across all tested quality configurations, JPEG consistently underperforms BPTC in both filtered and filtered and illuminated modes, and also remains inferior to the two highest-quality AVIF configurations.
In the 2D evaluations, the PSNR variability, expressed as relative standard deviation, ranged from to across all formats and quality settings. In the 3D rendering tests, the PSNR variability ranged from to in natural mode, from to in filtered mode, and from to in filtered and illuminated mode. These ranges indicate that the reported average PSNR values are stable across different images and rendering configurations.
Overall, the image quality results show a clear progression across rendering configurations, with PSNR values remaining largely unchanged between 2D rendering and 3D rendering in natural mode, and increasing substantially when texture filtering and illumination are enabled. While these improvements indicate a higher measured similarity between compressed and uncompressed textures under more realistic rendering conditions, they also highlight a reduced sensitivity of PSNR to compression artifacts in the presence of filtering and lighting effects. As a consequence, differences in reconstruction fidelity between formats become less pronounced, leading to a partial convergence of performance (particularly between AVIF and BPTC) under filtered and illuminated rendering.
3.2. Compression Efficiency
BPTC and S3TC exhibit fixed compression ratios by design, equal to 3 and 6, respectively, for a 24-bit source image. In contrast, both AVIF and JPEG provide variable compression ratios depending on quality and chroma subsampling settings.
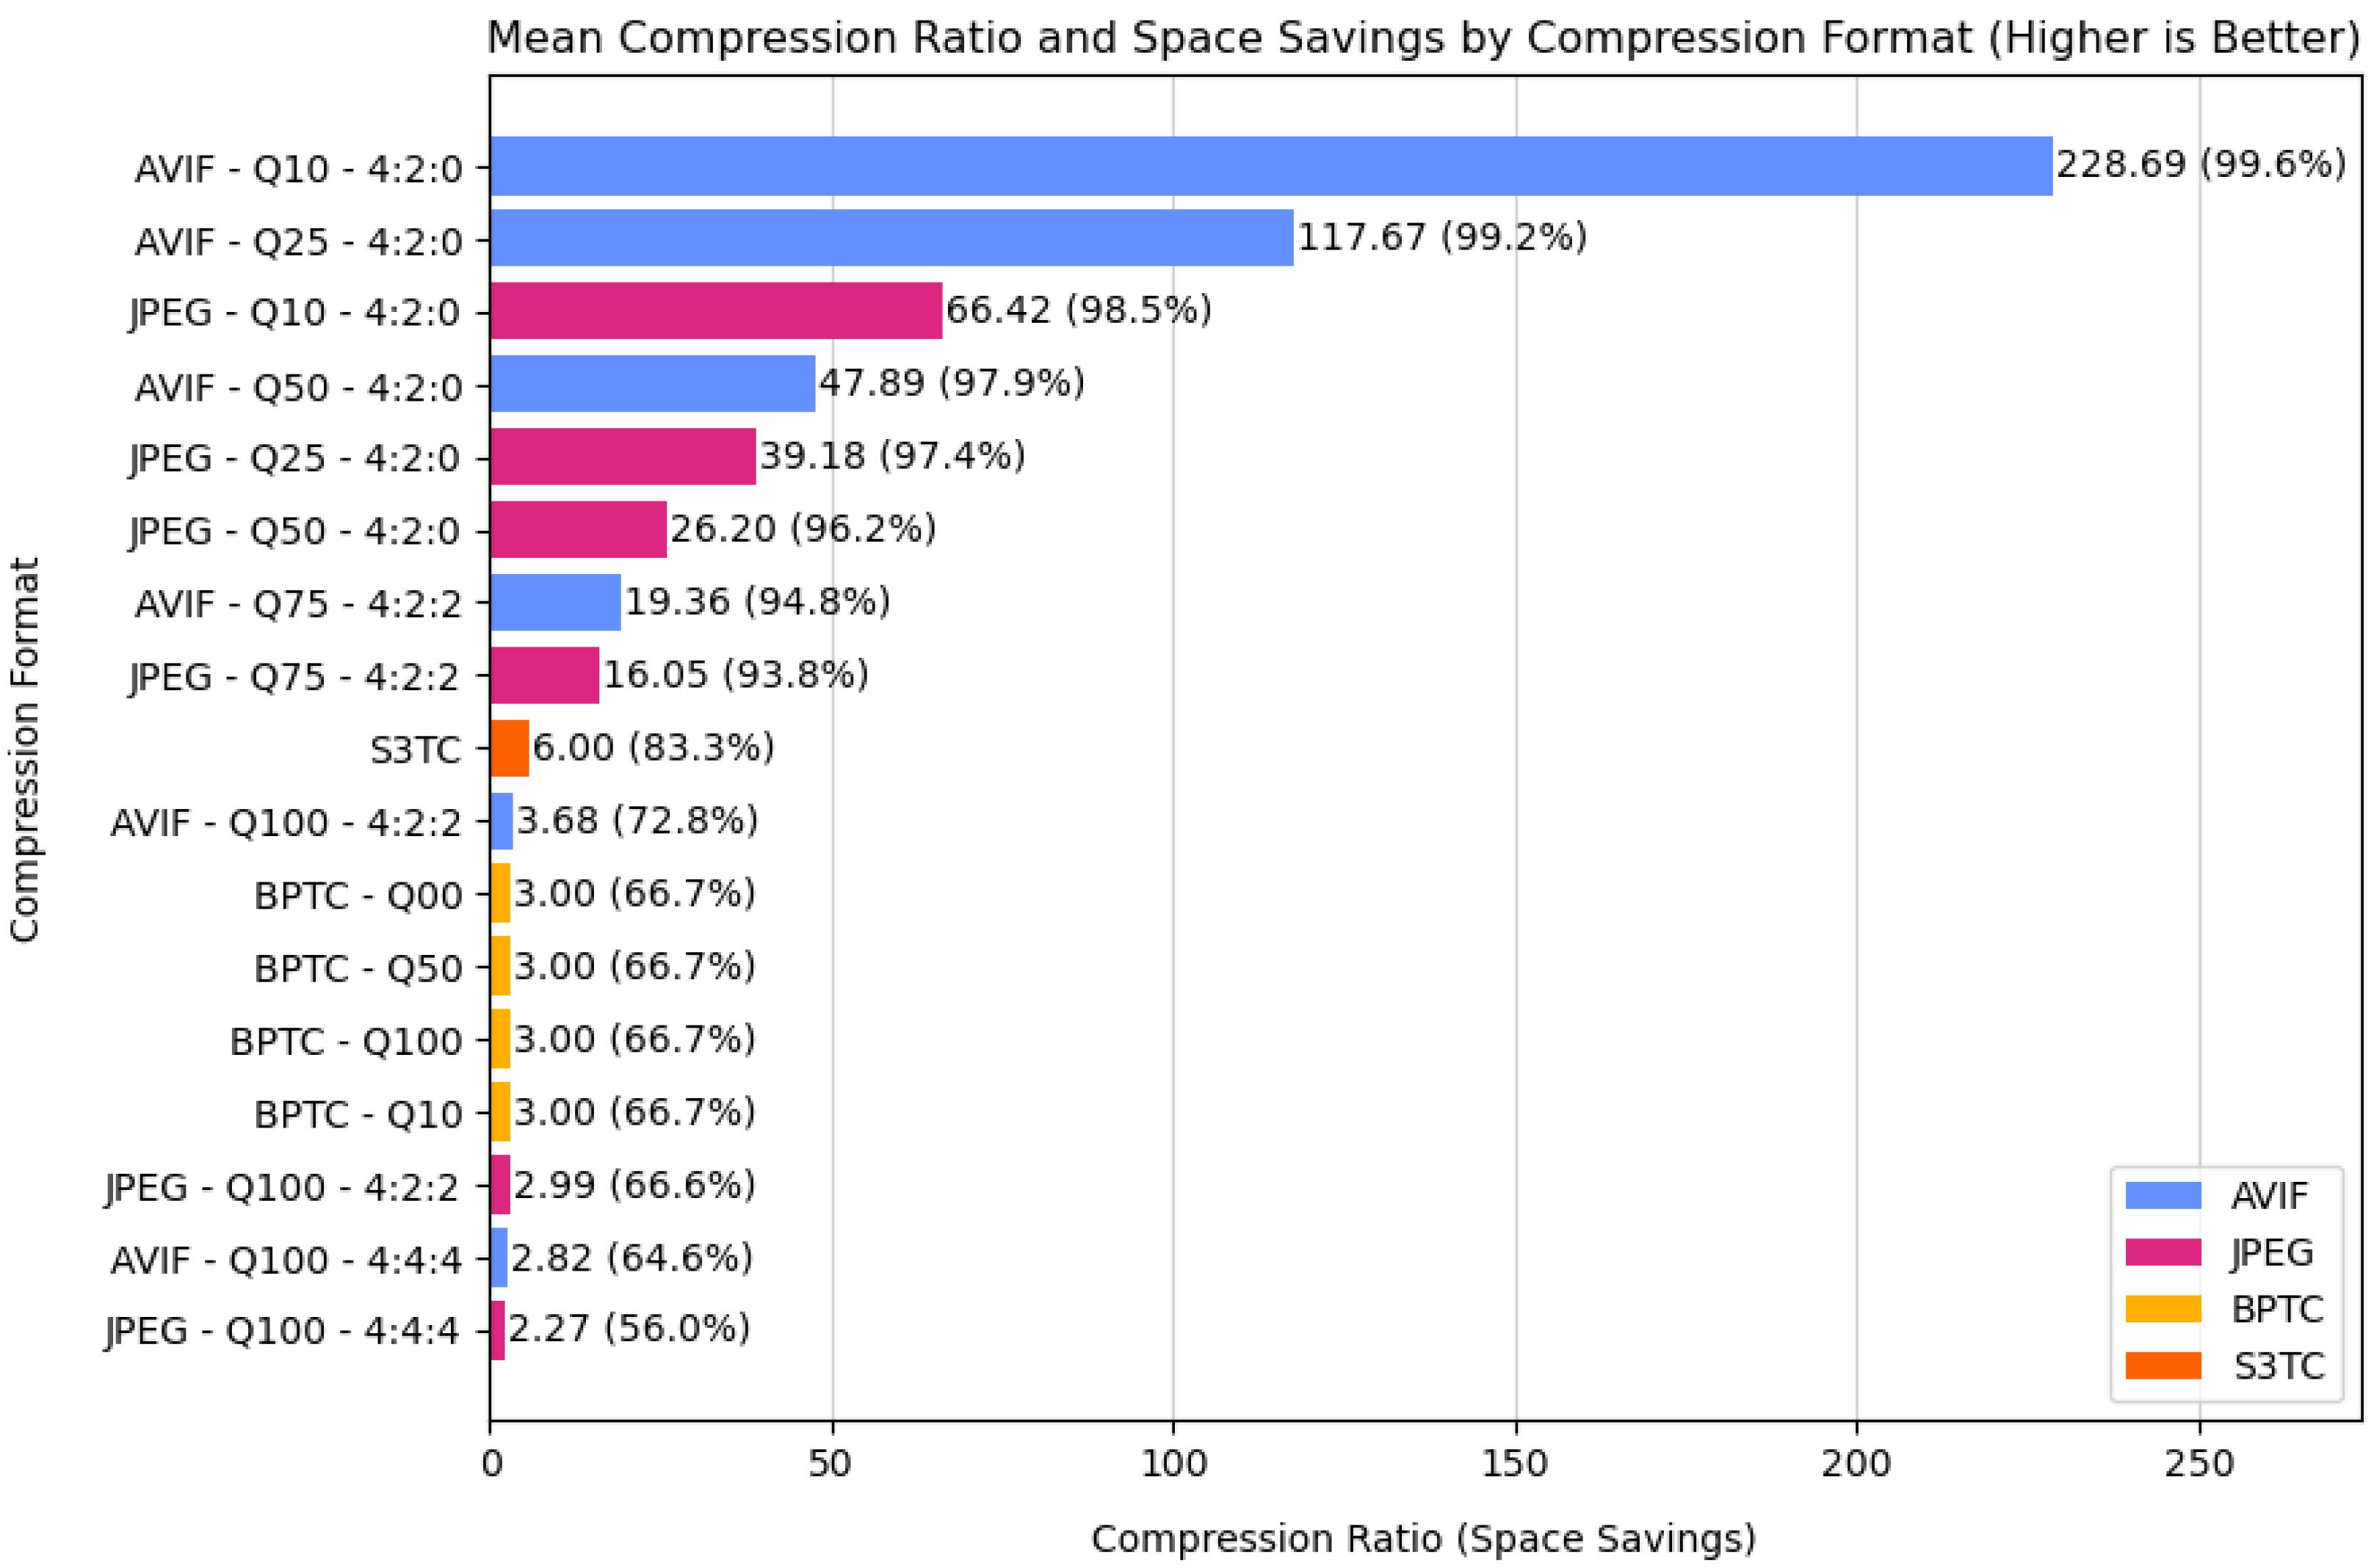
As shown in
Figure 9, AVIF at its maximum quality configuration (Q100, 4:4:4) achieves a compression ratio of 2.82 ± 0.49 (1.89–3.72), which is slightly lower than that of BPTC but higher than that of JPEG at the same settings (2.27 ± 0.37, 1.53–2.82). When these results are considered alongside the corresponding 2D PSNR measurements (
Figure 3), AVIF (Q100, 4:4:4) is observed to deliver substantially higher image quality than BPTC at comparable compression levels, exceeding the highest-quality BPTC configuration (Q100) by approximately 9 dB.
At its second-highest quality setting (Q100, 4:2:2), AVIF achieves a higher compression ratio of 3.68 ± 0.61 (2.55–4.87), slightly surpassing BPTC, while still maintaining a PSNR advantage of approximately 0.8 dB over BPTC (Q100). These results indicate that AVIF can match or exceed the compression efficiency of BPTC while providing superior reconstruction fidelity.
JPEG exhibits a less favorable trade-off between compression efficiency and image quality. Although JPEG at Q100 with 4:2:2 chroma subsampling achieves a compression ratio comparable to that of BPTC, its PSNR is lower by approximately 3–5 dB, depending on the selected BPTC quality level. When AVIF and JPEG are compared directly at equivalent quality configurations, AVIF consistently outperforms JPEG in terms of both compression efficiency and image quality.
Notably, JPEG at its maximum quality configuration (Q100, 4:4:4) yields the lowest compression efficiency among all evaluated formats, with a compression ratio of 2.27 ± 0.37 (1.53–2.82), while providing an image quality only marginally higher (by approximately 0.1 dB) than BPTC at its lowest quality setting (Q00). At the lowest quality configurations, AVIF achieves the highest compression ratios across all formats, reaching a maximum value of 228.69 ± 90.57 (137.58–431.69) at Q10 with 4:2:0 chroma subsampling.
For compression ratio, JPEG exhibited a relative standard deviation ranging from 16.19% to 27.76%, and AVIF from 16.54% to 52.73%, depending on the quality settings. No variability is reported for BPTC and S3TC, as these GPU-native formats operate at fixed compression ratios by design. This level of variability for compression ratio is expected, as codec behavior is strongly influenced by image characteristics. While individual samples exhibit content-dependent variability, the selected dataset spanning the visual characteristics known to affect compression behavior reduces the influence of atypical cases and provides performance estimates that are representative of expected behavior across common texture content and rendering configurations.
Overall, AVIF demonstrates a more favorable balance between compression efficiency and image quality than both JPEG and GPU-oriented block compression formats across a wide range of quality settings.
3.3. Encoding and Decoding Performance
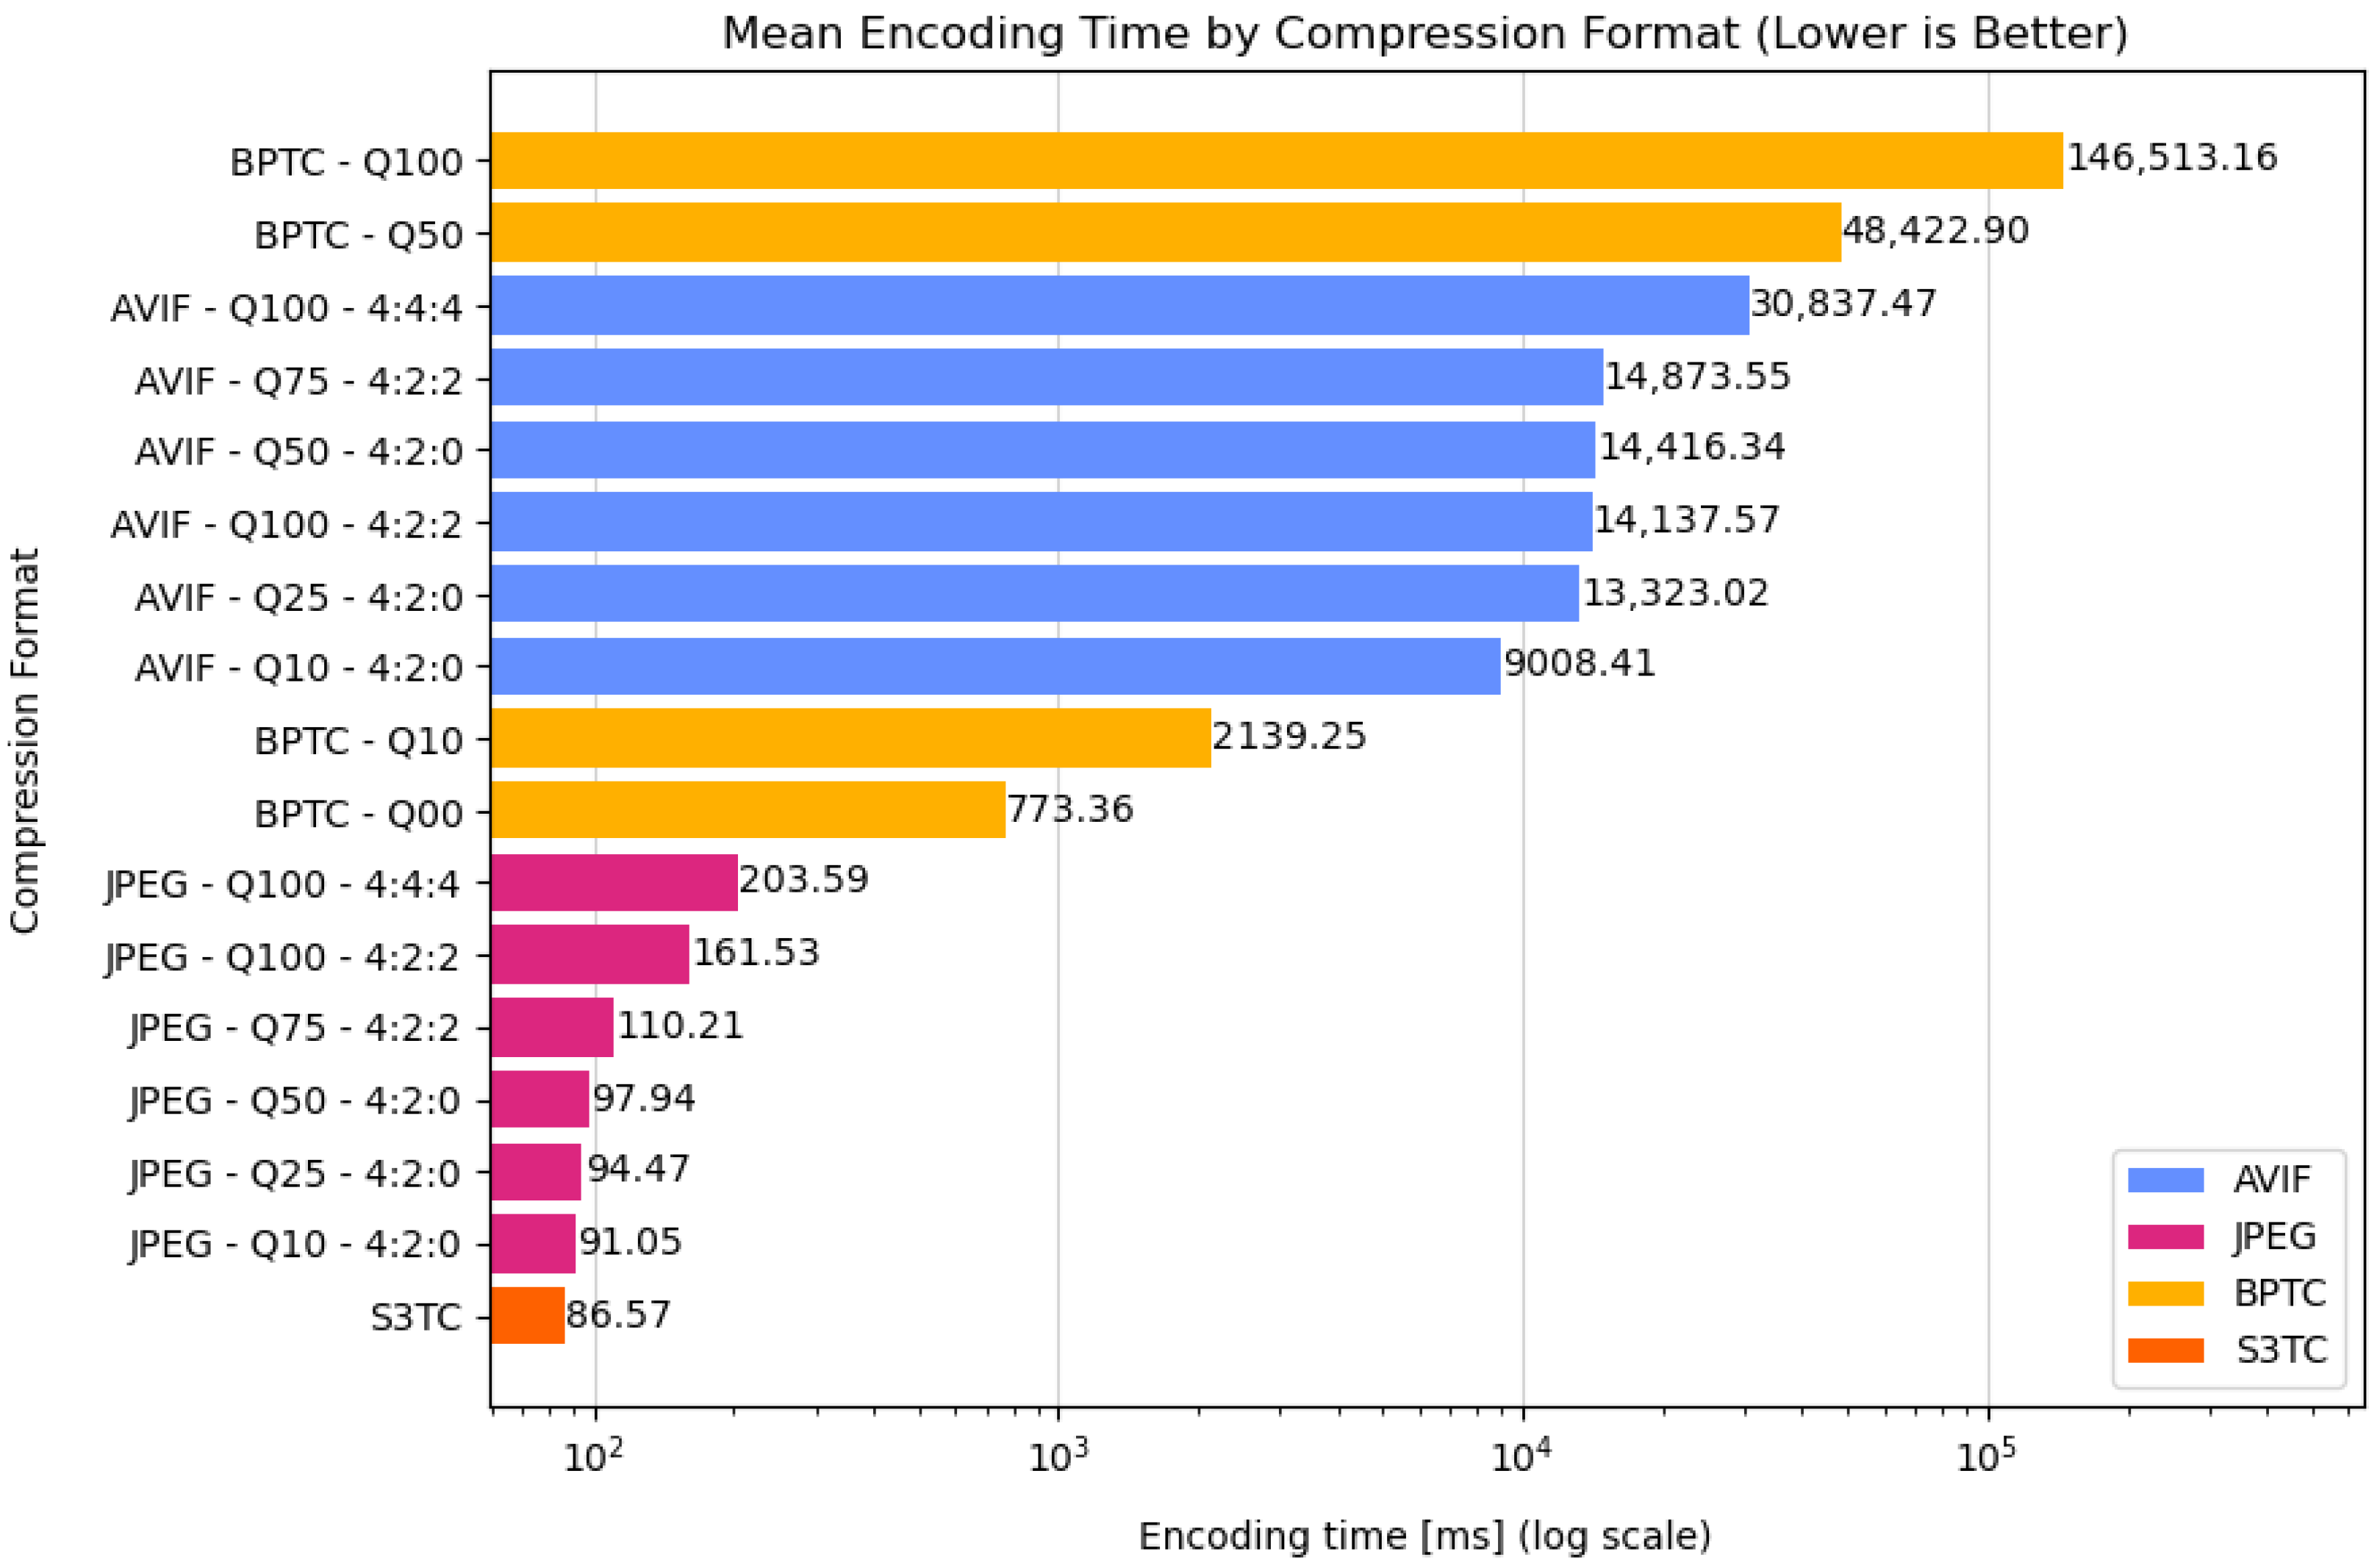
Figure 10 reports the mean encoding times measured across all test images for the evaluated compression formats. JPEG and S3TC exhibit the fastest encoding performance, with average encoding times ranging from 86.57 ms to 203.59 ms across quality settings. In contrast, both BPTC and AVIF require substantially longer encoding times.
BPTC shows a strong dependence on quality settings: increasing the quality level from 50% to 100% results in an approximately threefold increase in encoding time (from 48,422 ms to 146,513 ms), making BPTC at Q100 the slowest configuration among all tested formats. This increase in encoding cost yields only a marginal improvement in image quality, corresponding to a PSNR gain of approximately 0.2 dB in both 2D and 3D rendering.
AVIF exhibits consistently high encoding costs across all quality configurations, with average encoding times ranging from 9008 ± 2470 ms (5089-12,440 ms) at its lowest quality setting (Q10, 4:2:0) to 30,837 ± 4040 ms (25,422–37,223 ms) at its highest (Q100, 4:4:4). However, unlike BPTC, this increase in encoding time is accompanied by a substantial improvement in image quality, with a PSNR gain of approximately 27.1 dB. At its highest quality configuration, AVIF achieves the highest image fidelity among all evaluated formats, while also outperforming BPTC in both compression efficiency and image quality at comparable quality levels.
At lower quality settings, BPTC (Q00) requires significantly less encoding time, averaging 773.36 ± 285.88 ms (400.29–1425.45 ms) which is lower than that of AVIF across all tested configurations. Despite this, BPTC at Q00 still delivers high reconstruction fidelity, with a PSNR of approximately 43 dB in 2D rendering, exceeding that of AVIF at Q75 with 4:2:2 chroma subsampling by nearly 4 dB. JPEG follows a similar trend to AVIF in terms of quality scaling, with encoding times increasing from an average of 91.05 ± 3.74 ms (85.14–96.28 ms) at Q10 (4:2:0) to 203.59 ± 12.50 ms (177.64–219.61 ms) at Q100 (4:4:4), corresponding to an increase in PSNR of approximately 17 dB.
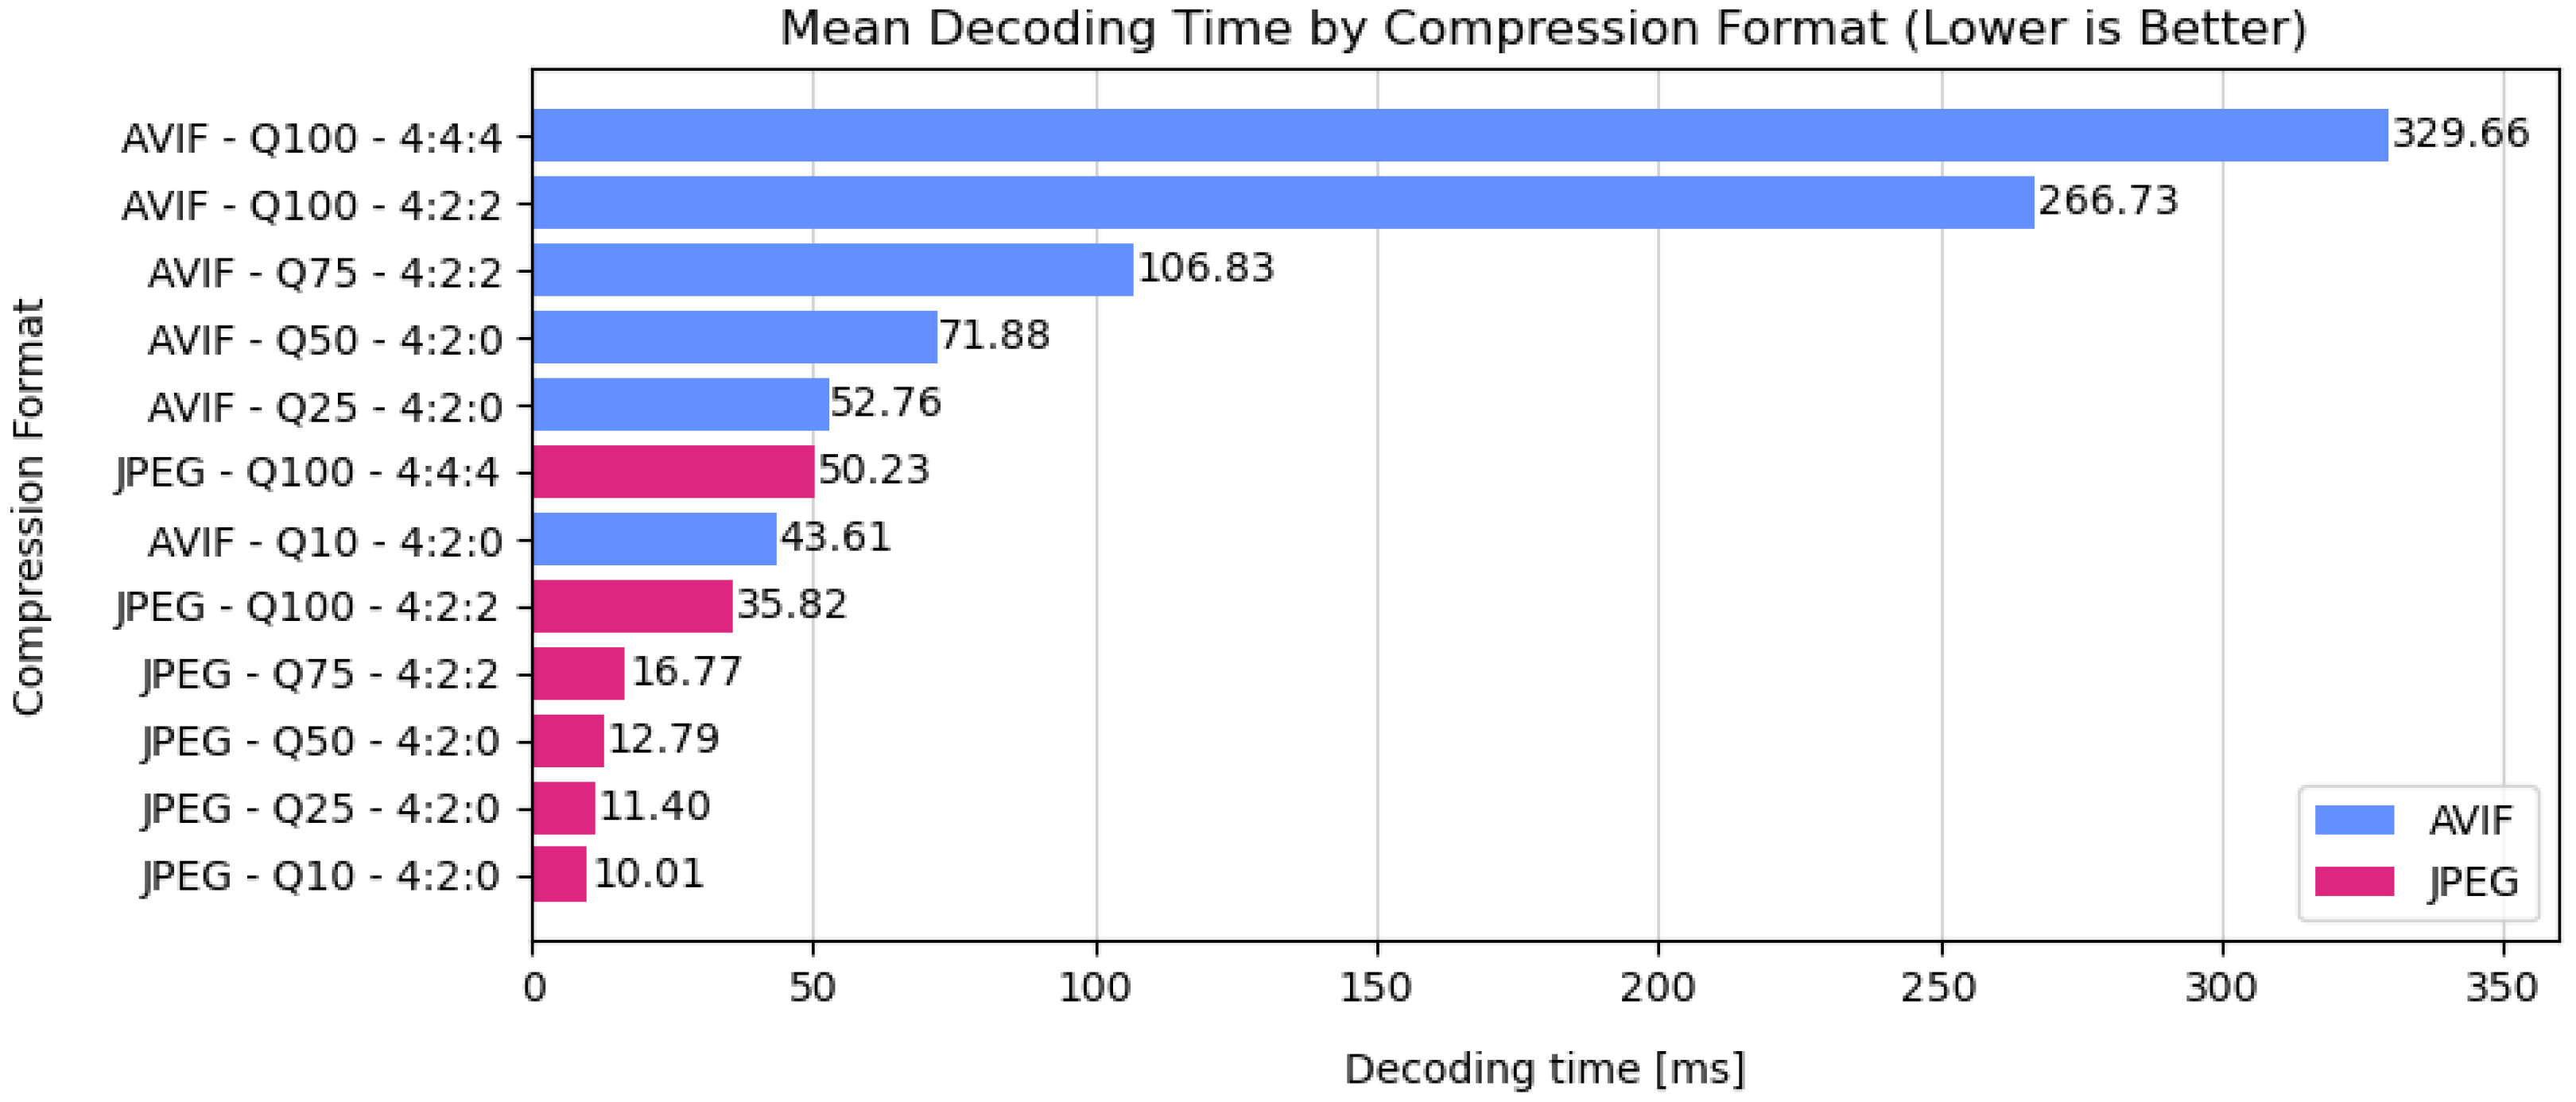
Decoding performance is illustrated in
Figure 11. JPEG demonstrates consistently low decoding times, ranging from 10.01 ms to 50.23 ms across quality settings. At equivalent configurations, JPEG decodes significantly faster than AVIF, whose decoding times range from 43.61 ms to 329.66 ms, depending on quality and chroma subsampling.
Encoding time variability was for S3TC, – for JPEG, – for AVIF, and – for BPTC. The variability of decoding times was – for JPEG and – for AVIF. As with compression ratio, the observed variability in encoding and decoding times is expected due to the sensitivity of codecs to image content characteristics. The diversity of visual features within the dataset ensures that the results are representative of typical texture content and practical usage scenarios.
Decoding times for the S3TC and BPTC formats are not reported, as these GPU-oriented compression schemes are not explicitly decoded on the CPU prior to rendering. Instead, texture data is transferred to GPU memory in its compressed form and is only decoded at sampling time by the GPU hardware, on a per-texel basis, during rendering. As a result, there is no well-defined, full-image decoding step comparable to that of CPU-decoded formats such as JPEG and AVIF, making a direct comparison of decoding times between these approaches not meaningful.
4. Discussion
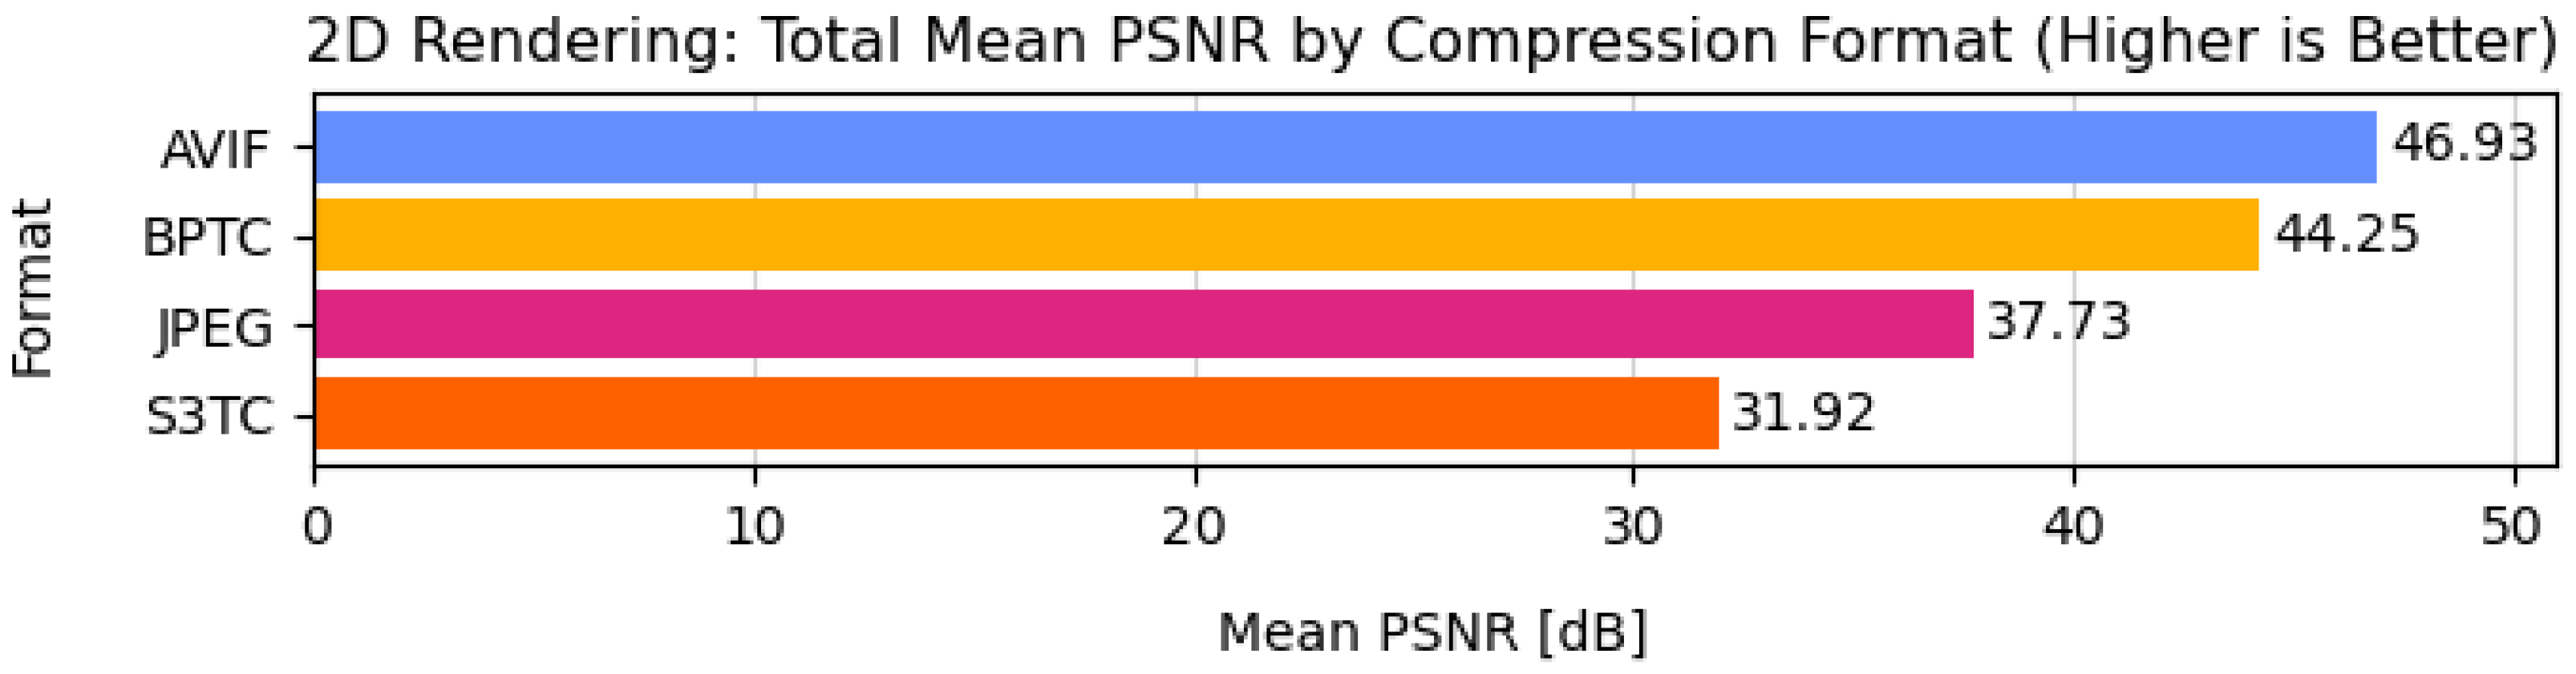
Across all evaluated formats, AVIF consistently produces the highest image quality. When considering the mean PSNR values computed across all test images and quality settings during 2D rendering (
Figure 12), AVIF outperforms BPTC by 2.7 dB, JPEG by 9.2 dB, and S3TC by 15 dB on average. This advantage is preserved under 3D rendering conditions, as shown by the comparison of mean PSNR values obtained using the highest quality configuration for each format (
Figure 13). In this case, AVIF exceeds BPTC by 3.8 to 9.1 dB, JPEG by 8 to 11.1 dB, and S3TC by 16.7 to 22.2 dB, depending on whether texture filtering and illumination are enabled.
The results further show that the application of texture filtering and scene illumination increases the PSNR values for all formats, indicating a reduced sensitivity of the final rendered image to compression artifacts present in the original texture. Consequently, performance differences between formats become less pronounced under more realistic rendering conditions, although AVIF maintains a consistent advantage in reconstruction fidelity.
In terms of compression efficiency, AVIF also achieves the highest mean compression ratio across all test images and quality settings, with an average value of 70. This corresponds to a 174.4% improvement over JPEG, which achieves an average compression ratio of 25.5. These results demonstrate that, compared to JPEG, AVIF delivers substantially higher image quality while producing significantly smaller files. Moreover, at comparable compression ratios, AVIF consistently yields higher PSNR values than BPTC, which is constrained by its fixed compression ratio of 3.
These findings are consistent with prior work reported in [
8], where AVIF was shown to achieve the highest bitrate savings across multiple objective quality metrics and chroma subsampling configurations. Together, these results confirm the effectiveness of AVIF as a highly efficient image compression format capable of preserving visual quality while substantially reducing storage requirements.
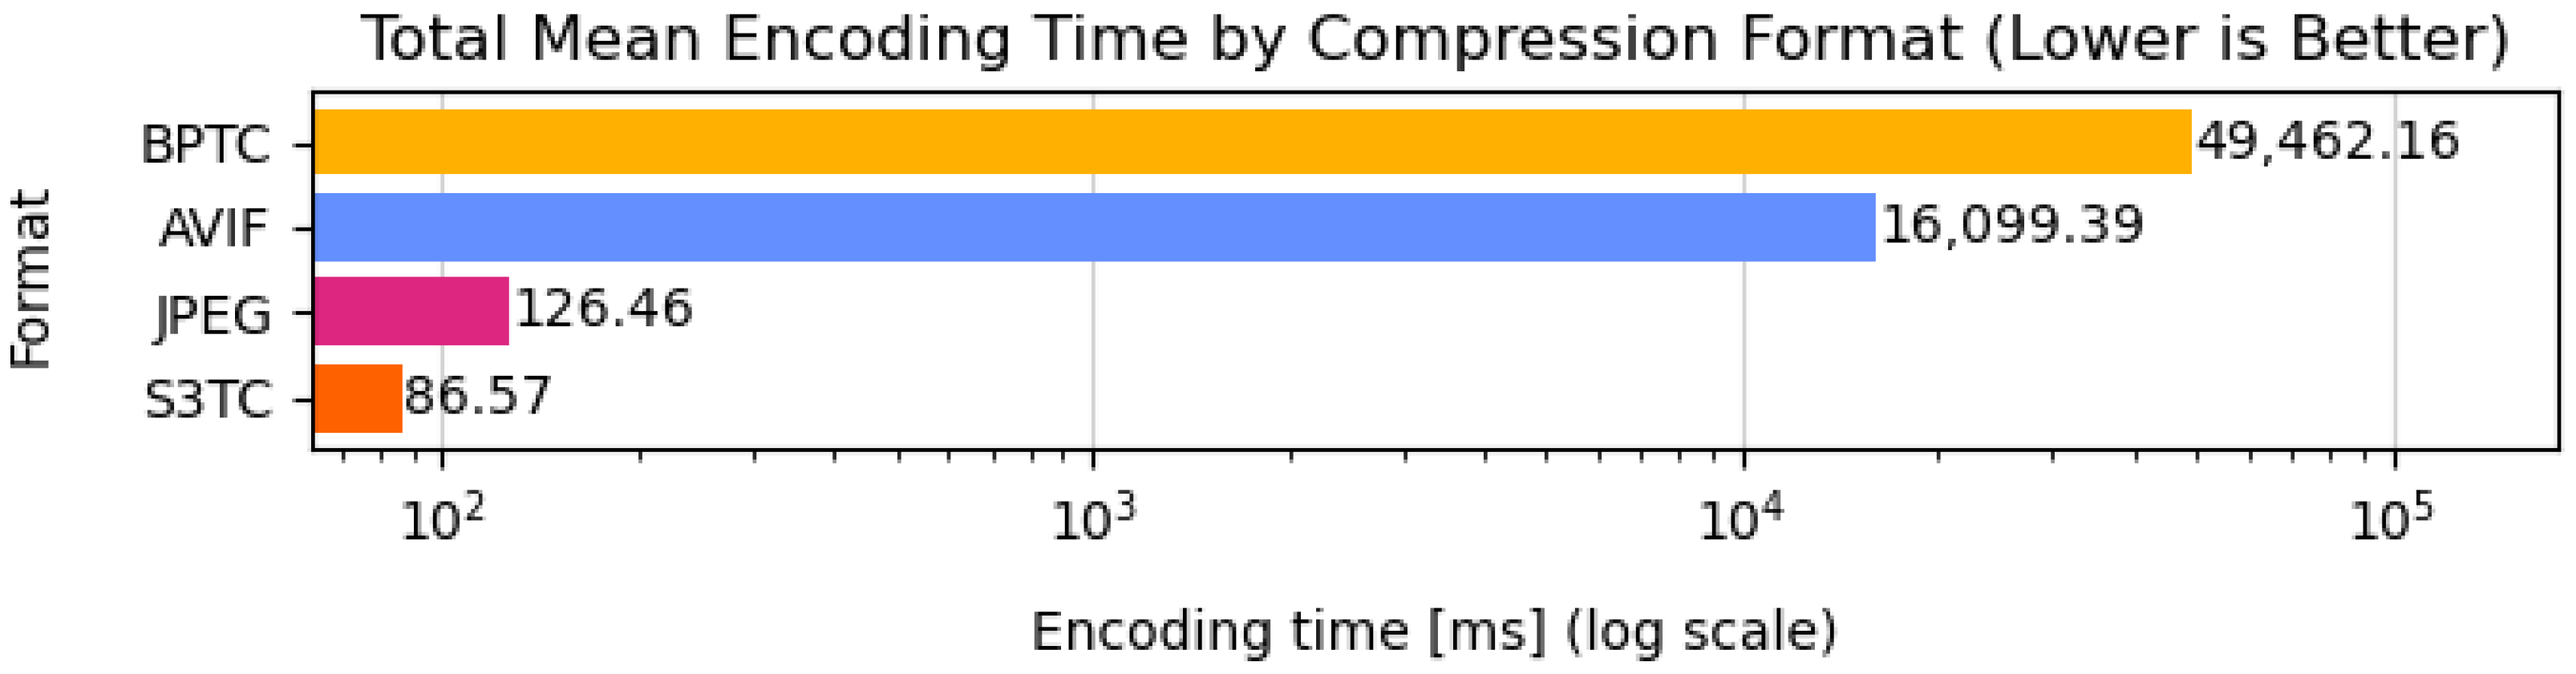
Despite its advantages in image quality and compression efficiency, AVIF exhibits significantly higher computational costs. The average encoding time for AVIF across all test images is 16,099 ms, compared to 126.46 ms for JPEG and 86.57 ms for S3TC (
Figure 14). This corresponds to an increase of approximately 12,630% relative to JPEG and 18,496% relative to S3TC. BPTC exhibits the highest average encoding time (at 49,462 ms), making it the slowest format overall.
For BPTC, the increase in encoding time from the lowest to the highest quality setting exceeds 18,800%, while the corresponding gain in image quality remains below 2 dB. This indicates a poor trade-off between encoding cost and reconstruction fidelity. In contrast, AVIF shows a more favorable scaling behavior: a 242% increase in encoding time from its lowest to highest quality configuration yields a PSNR improvement of 27.1 dB. JPEG follows a similar trend, with a 123% increase in encoding time corresponding to a PSNR gain of approximately 17 dB. When directly comparing AVIF and BPTC, AVIF can deliver higher image quality while requiring, on average, roughly one-third of the encoding time needed by BPTC at comparable quality levels. However, unlike AVIF, BPTC is explicitly designed for GPU-native usage. Textures encoded in BPTC are stored in GPU memory in a fixed-rate compressed representation and are decoded on-the-fly by dedicated hardware. This approach enables predictable memory consumption, efficient cache utilization, and negligible runtime decoding overhead, partially offsetting the drawbacks associated with its high encoding cost and limited compression flexibility.
Decoding performance further highlights the trade-offs between formats. AVIF requires, on average, 536% more time to decode than JPEG, indicating significantly lower decoding efficiency. While this overhead may be acceptable in offline or preprocessing scenarios, it represents a potential limitation for real-time or latency-sensitive applications. GPU-native formats such as S3TC and BPTC mitigate decoding overhead by remaining compressed in GPU memory and relying on hardware-supported texture sampling during rendering, rather than performing explicit full-image decompression on the CPU.
Finally, S3TC exhibits comparatively low image quality, with PSNR values around 31 dB in 2D rendering, comparable to a medium-quality JPEG configuration (Q50, 4:2:0). Although S3TC achieves fast encoding times and benefits from GPU-native decoding, its fixed compression ratio of 6 results in substantially lower compression efficiency than JPEG and AVIF, limiting its suitability in scenarios where storage efficiency and visual fidelity are critical.
Overall, the results indicate that AVIF is well suited for scenarios where high visual fidelity and storage efficiency are prioritized over encoding and decoding speed, such as offline asset generation or distribution pipelines. However, both AVIF and JPEG must be fully decoded before being loaded into the GPU; consequently, their VRAM usage corresponds to the decoded texture size. Conversely, GPU-native formats such as BPTC and S3TC remain advantageous for real-time rendering due to their direct hardware support, despite their lower compression efficiency and, in the case of S3TC, reduced image quality. S3TC and BPTC remain block-compressed in VRAM, occupying fixed ratios of 1/6 and 1/3 of the uncompressed texture size, respectively. This characteristic can represent a relevant trade-off when selecting a texture format for 3D graphics applications.
It should be noted that AVIF is still a relatively young format. Similar to the early days of JPEG, current limitations in encoding and decoding speed may be mitigated over time as codecs are further optimized and hardware acceleration becomes more widely available. In practical workflows, AVIF can be used to minimize package size during software distribution, with conversion to GPU-native formats such as S3TC or BPTC performed locally at runtime upon first loading to optimize performance. While AVIF offers clear advantages in storage efficiency and visual quality, formats such as JPEG or S3TC/BPTC may be preferable when faster loading times or broader hardware compatibility are prioritized.
The evaluation was conducted on a dataset of 12 images representing a deliberately selected stratified sample of diverse visual characteristics, including color complexity, edge density, high-frequency textures, smooth gradients, and mixed urban and natural scenes. All test images consist of natural photographic content; synthetic textures, artistic content, and domain-specific imagery were not included. While this selection was designed to reduce bias toward any single content type, the limited sample size may not capture the full variability of real-world textures. Nevertheless, the consistency of codec ranking across all 12 heterogeneous images suggests that the observed performance trends are robust for photographic textures. Encoding and decoding times were measured on a single hardware configuration; performance may vary on systems with different CPU architectures, GPU models, memory bandwidth, or operating systems. The reported timing results should therefore be interpreted as indicative of relative performance trends rather than absolute benchmarks.
Energy consumption was not evaluated in this study and is therefore not considered as a quantitative metric. However, longer decoding and processing times may contribute to higher energy usage depending on hardware architecture, power management strategies, and execution context. A rigorous assessment of energy efficiency would require dedicated measurement infrastructure and experimental protocols and is outside the scope of the present work.
PSNR was selected as the primary metric, as it directly measures signal-domain reconstruction error and aligns with the characteristics of hardware-oriented block compression formats such as BPTC and S3TC; it is therefore well suited to the technical focus of this study. While PSNR is an objective metric that does not explicitly model perceptual characteristics of the human visual system, it remains a well-established choice for assessing objective coding performance in engineering-oriented evaluations [
24].
5. Conclusions
This article evaluated the performance of the AV1 Image File Format (AVIF) for texture storage in 3D computer graphics, focusing on image quality, compression efficiency, and encoding and decoding performance. AVIF was compared against the widely used JPEG format and the GPU-oriented texture compression schemes S3TC and BPTC. The evaluation considered both 2D image reconstruction quality and the behavior of compressed textures when used in a 3D rendering pipeline, including the effects of texture filtering and scene illumination.
The results show that AVIF consistently achieves the highest image fidelity among the evaluated formats. When compressed images are used as textures in a 3D scene and all formats are considered at their maximum quality settings, AVIF outperforms BPTC by up to 9.1 dB, JPEG by up to 11.1 dB, and S3TC by up to 22.2 dB in terms of PSNR, depending on the use of texture filtering and illumination. The application of filtering and lighting increases PSNR values for all formats, with improvements ranging from 4.4 to 11.3 dB, thereby reducing the influence of the original texture quality on the final rendered output while preserving AVIF’s relative advantage.
In addition to superior reconstruction fidelity, AVIF demonstrates significantly higher compression efficiency. On average, AVIF achieves a compression ratio 174.4% higher than JPEG while simultaneously exceeding JPEG by 9.2 dB in image quality in 2D rendering. Across all tested configurations, AVIF consistently provides a more favorable balance between compression ratio and image quality than JPEG, S3TC, and BPTC, enabling substantial reductions in storage requirements without compromising visual fidelity.
These benefits come at the cost of substantially higher computational complexity. On average, AVIF requires approximately 126 times longer to encode an image than JPEG and 185 times longer than S3TC, which exhibits the fastest encoding performance. Decoding times are also significantly higher for AVIF, requiring approximately 5.4 times longer than JPEG. As a result, AVIF is less suited to real-time or latency-sensitive workflows, but remains well suited for offline texture generation and asset distribution pipelines where compression efficiency and visual quality are prioritized over processing speed.
Among GPU-native formats, S3TC exhibits limited image quality, comparable to a medium-quality JPEG configuration (Q50, 4:2:0), while offering fast encoding and direct hardware support at a fixed compression ratio of 6. BPTC delivers substantially higher image quality, second only to AVIF at the highest quality settings, but incurs a disproportionate increase in encoding time relative to its modest quality gains and operates at a fixed compression ratio of 3. Nevertheless, both S3TC and BPTC benefit from hardware-accelerated texture sampling and predictable GPU memory usage, partially offsetting their compression limitations in real-time rendering scenarios.
Looking ahead, future work could explore hybrid texture pipelines that combine highly compressed formats such as AVIF with modern machine learning–based upscaling and reconstruction techniques [
25,
26]. Such approaches could enable the use of lower-resolution or more aggressively compressed textures while preserving visual fidelity at render time. Applications involving large-scale virtual environments and streamed content, such as global terrain visualization or digital globe systems (e.g., Google Earth–like applications), represent promising use cases where AVIF’s high compression efficiency could significantly reduce storage and bandwidth requirements while maintaining high visual quality.
Perceptual metrics such as MS-SSIM, along with user studies or expert evaluations, provide complementary perspectives by better capturing aspects of visual quality that align with human perception, and represent valuable directions for future work.