Article

Immunohistochemical, Biochemical and Genetic Evaluation of the Effects of Ginseng Administration on Blood–Brain Barrier in Rats Exposed to 2100 MHz and 2450 MHz Electromagnetic Radiation

1
Department of Bioengineering, Institute of Science and Technology, Süleyman Demirel University, Isparta 32260, Turkey
2
Department of Electrical and Electronics Engineering, Faculty of Engineering and Natural Sciences, Süleyman Demirel University, Isparta 32260, Turkey
3
Department of Nutrition and Dietetics, Faculty of Health Sciences, Süleyman Demirel University, Isparta 32260, Turkey
4
Genetic Research Unit, Innovative Technologies Application and Research Center, Süleyman Demirel University, Isparta 32260, Turkey
*
Author to whom correspondence should be addressed.
Appl. Sci. 2026, 16(5), 2376; https://doi.org/10.3390/app16052376
Submission received: 26 January 2026 / Revised: 16 February 2026 / Accepted: 25 February 2026 / Published: 28 February 2026

Abstract

Numerous studies have demonstrated that the brain and blood–brain barrier, which are sensitive targets for cell phone and microwave radiation, are damaged after exposure. Additionally, ginseng has been shown to play a role in preserving the integrity of the blood–brain barrier. In this study, we investigated the immunohistochemical, genetic and biochemical effects of electromagnetic field (EMF) on the blood–brain barrier (BBB) and the protective role of ginseng on these effects. The animals were randomly allocated into seven groups (eight in each group): group I: control, group II: sham, group III: ginseng, group IV: 2100 MHz EMF, group V: 2100 MHz EMF + ginseng, group VI: 2450 MHz EMF, group VII: 2450 MHz EMF + ginseng. EMF groups exposed to EMF, 1 h day−1 for 30 days. Ginseng was administered 150 mg/kg/day for 30 days. As a result, it was determined immunohistochemically that EMF caused apoptosis in brain tissue. It was observed that cyclooxygenase-2 (COX-2) gene decreased and B-cell lymphoma/leukemia-2 gene (BCL-2)-associated X (BAX) protein increased in EMF groups, as well as apoptosis formation. On the other hand, it was concluded that ginseng decreased the harmful effects by increasing the expression of the COX-2 gene and decreasing the BAX protein in this process leading to apoptosis.

1. Introduction

The World Health Organization (WHO) identifies electromagnetic radiation as a widespread and increasing environmental concern. Electromagnetic fields, sometimes called noiseless pollution, result from technologies essential to modern communication, such as mobile phones, televisions, computers, microwaves, cellular networks, and base stations [1].
In studies examining the effects of EMF on the BBB, exposure to radiofrequency electromagnetic fields (RF-EMF) has been shown to alter BBB properties [2]. It was also emphasized that changes in BBB permeability may depend on the specific absorption rate (SAR) (W/kg) value. If the signal intensity is high enough (high SAR), exposure to RF-EMF can alter the physical properties of the BBB by increasing cranial nervous system temperature. However, no significant alteration in BBB permeability is observed at low SAR values [2].
In rodents, COX-2 is expressed in neurons of the forebrain, brainstem, and spinal cord. Specifically, neuronal COX-2 is present in postsynaptic dendrites and excitatory terminals in the neocortex, hippocampus, amygdala, and dorsal horn. During neuroinflammation, COX-2 expression increases considerably in astroglia and microglia. These glial cells form the primary defense of the central nervous system (CNS) against pathogens and injury. Additionally, neuronal COX-2 is closely associated with cerebral vessels and helps regulate cerebral blood flow [3]. COX-2 is upregulated during neuroinflammation, which increases the need for neuroprotective mechanisms. Natural agents such as ginseng have been reported to exhibit neuroprotective effects. Ginsenosides, the active components of ginseng, exhibit antioxidant, anti-inflammatory and anti-apoptotic properties that may help alleviate COX-2-mediated neuronal stress, protect the blood–brain barrier and support overall neuronal survival. In addition, it has been stated that ginseng components, particularly ginsenosides such as Rb1, Rb2, Rb3, Rc, Rd, Re, Rg1, Rg2, and Rg3 exhibit notable therapeutic potential in a variety of neurological disorders [4]. Studies have shown that ginsenoside Rb1, one of the most important components of Panax ginseng, prevents apoptosis in the brain, protects the BBB against damage, and has a neuroprotective effect [5]. Cell apoptosis is a standard component of organismal development. Initial apoptotic events are linked to mitochondrial alterations regulated by members of the BCL-2 protein family, such as the anti-apoptotic protein BCL-2 and the pro-apoptotic protein BAX. It has been reported that ginsenoside Rg2 inhibits BAX protein expression, one of the apoptotic-related proteins [6].
This study examined zonula occludens-1 (ZO-1) and occludin to assess endothelial cell connections in the BBB, as well as glial fibrillar acidic protein (GFAP) and aquaporin-4 (AQP-4) in astrocyte footpads to evaluate astrocyte damage. The TUNEL method revealed that EMF induces apoptosis in brain tissue. Alongside immunohistochemical and histopathological analysis, genetic and biochemical techniques were used to assess COX-2 gene and BAX protein expression, as both are key markers of cell stress and apoptosis.
This study aims to determine whether ginseng protects against BBB damage caused by different EMF exposures. The 2100 MHz (e.g., 3G mobile phones) and 2450 MHz (e.g., wireless internet) frequencies chosen for our study are electromagnetic field frequencies to which we are frequently exposed in our daily lives. To date, no published comparisons have examined how ginseng affects the BBB in rats exposed to 2100 MHz or 2450 MHz electromagnetic radiation, using immunohistochemical, biochemical, and genetic approaches. This lack of prior research highlights the importance of the present study.

2. Materials and Methods

2.1. Experimental Animals and Groups

All the procedures were approved by the Animal Experiments Local Ethical Committee of Süleyman Demirel University (Date of registration: 19 July 2019, Issue: 8). All experimental procedures were carried out in compliance with the Animal Welfare Act and the Suleyman Demirel University Guidelines on the Care and Use of Laboratory Animals, as well as international guidelines on the use of laboratory animals (e.g., EU Regulation 86/609/EEC). The mean body weights of the young male Wistar–Albino rat groups (250–300 g) did not differ significantly. All animals were housed in individual cages according to their groups, in rooms maintained at 22–24 °C with 45–60% relative humidity and a controlled 12 h light/dark cycle. Rats were fed a standard rat pellet food (Korkuteli Yem Gıda Sanayi Ticaret AS, Antalya, Turkey) during the experiment and provided with water ad libitum.
In the study, fifty-six rats were randomly divided into seven groups of eight rats. EMF and EMF + ginseng groups were applied 1 h/day EMF for 30 days. During this period, Panax Ginseng Root Extract Powder (obtained from Sepe Natural Company, İzmir, Turkey) was given to the ginseng and EMF + ginseng group by the gavage method in addition to the EMF application. The groups were as follows:
Group I: Control group. The rats that were not exposed to EMF and applied with 1 mL of water by gavage method (8 rats).
Group II: Sham group. The rats were kept in EMF apparatus without EMF application and applied with 1 mL of water by gavage method (8 rats).
Group III: Ginseng group. The rats were administered 150 mg/kg/day of antioxidant (Panax Ginseng) by gavage method (8 rats) [7].
Group IV: 2100 MHz EMF group. The rats were exposed to 2100 MHz EMF and applied with 1 mL of water by gavage method (8 rats).
Group V: 2100 MHz EMF + Ginseng group. The rats were exposed to 2100 MHz EMF and administered with 150 mg/kg/day antioxidant (Panax Ginseng) by gavage method (8 rats).
Group VI: 2450 MHz EMF group. The rats were exposed to 2450 MHz EMF and applied with 1 mL of water by gavage method (8 rats).
Group VII: 2450 MHz EMF + Ginseng group. The rats were exposed to 2450 MHz EMF and administered with 150 mg/kg/day antioxidant (Panax Ginseng) by gavage method (8 rats).
At the conclusion of the experimental period, the rats were euthanized under anesthesia using ketamine (90 mg/kg; Richter Pharma AG, Wels, Austria) and xylazine (10 mg/kg; Alfasan, Woerden, Holland). Brain tissues were promptly excised, fixed in 10% buffered formalin for histopathological and immunohistochemical analyses, and preserved at −80 °C for subsequent biochemical and genetic assessments.

2.2. Exposure System and Design

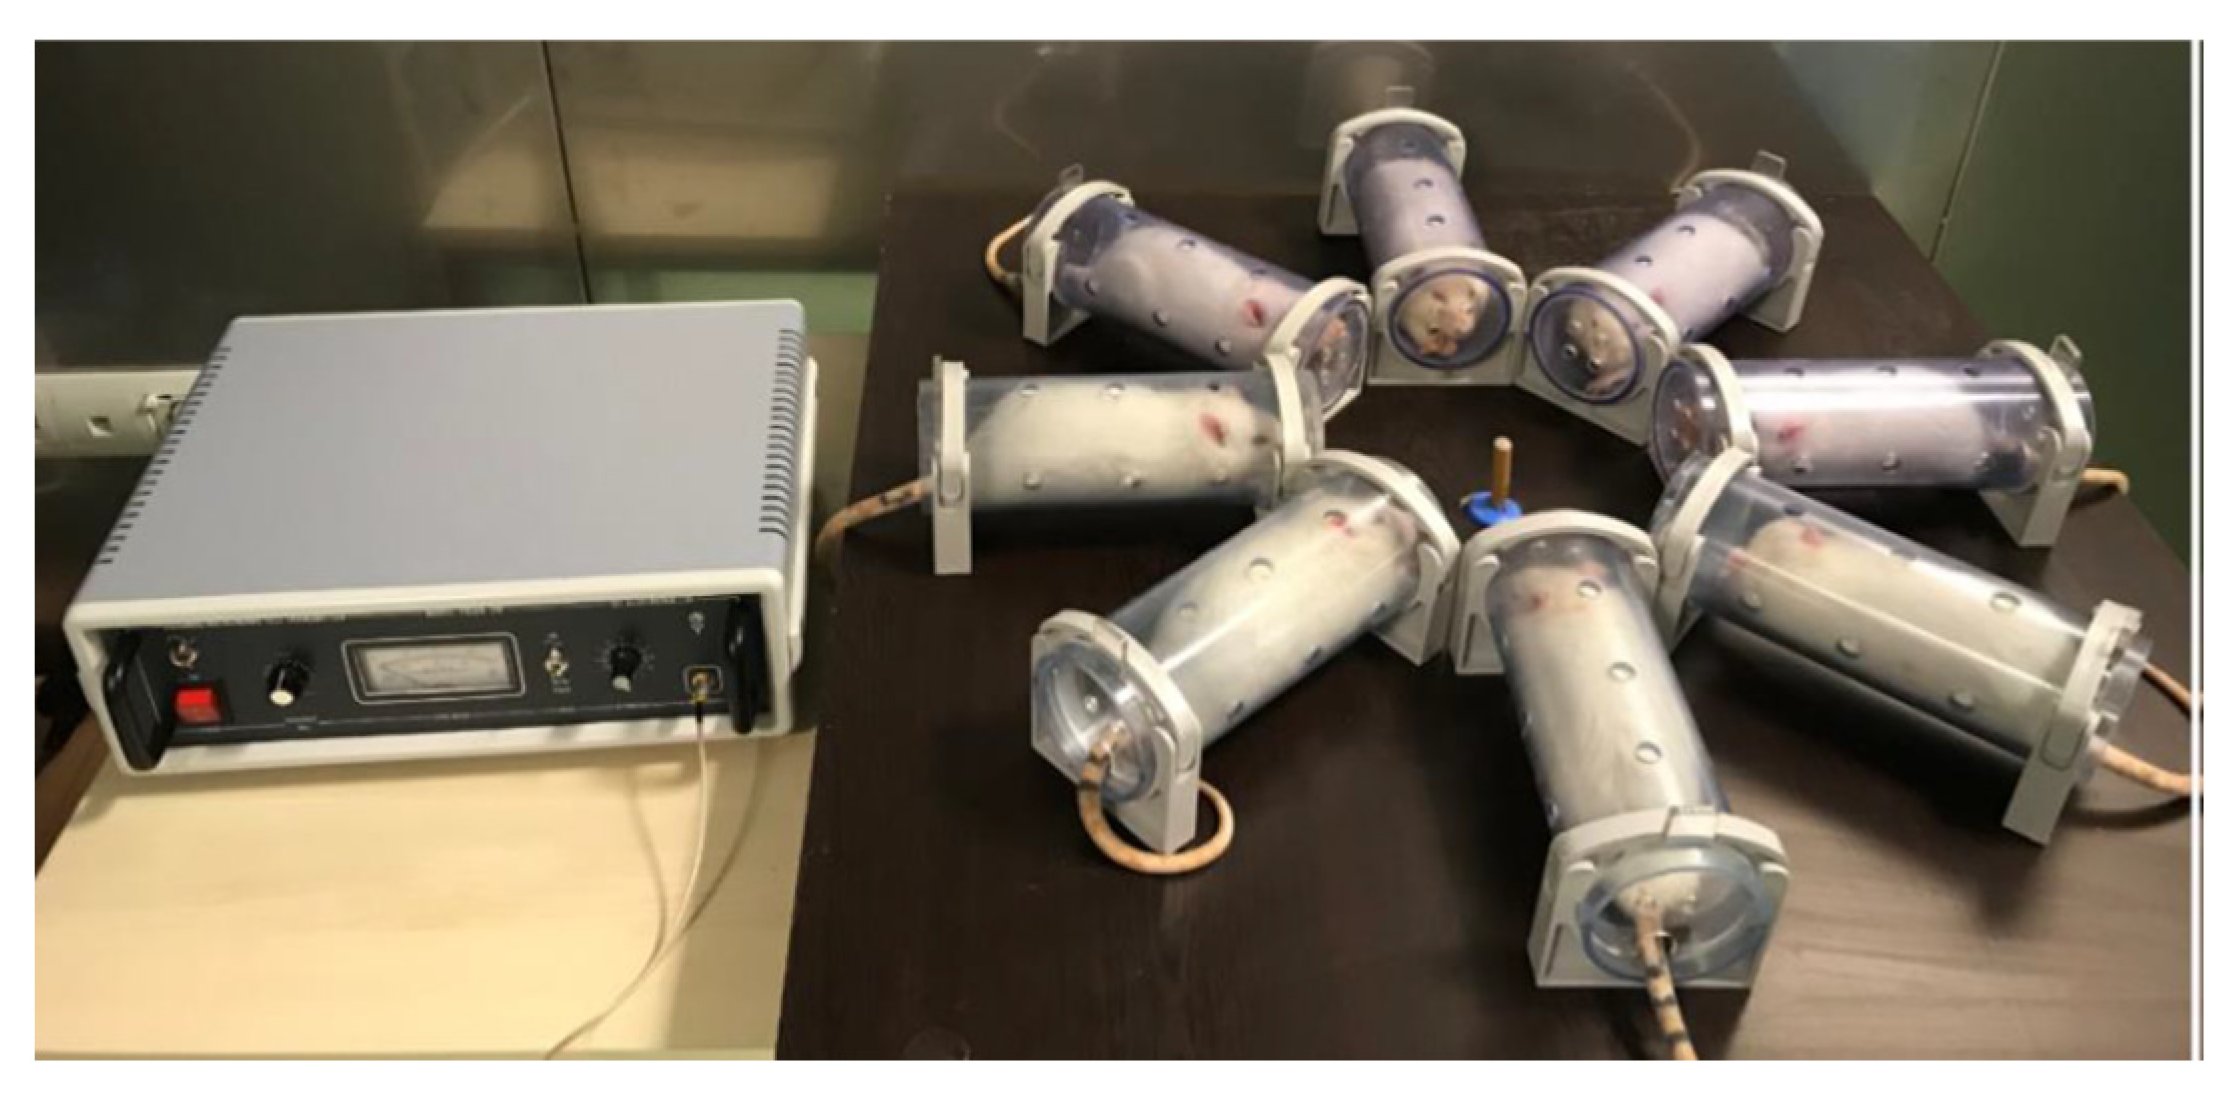
A radiofrequency generator (Set Elektronik A.Ş., Sakarya, Turkey) with center frequencies of 2450 MHz (tuned 2400–2500 MHz) and 2100 MHz (tuned 2050–2150 MHz), capable of delivering 1 W RMS to a 50 Ohm load, was used as the EMF source. The device’s monopole antenna, with 50 Ohm impedance, was positioned vertically at the center of the carousel experimental setup. The electromagnetic wave output could be set to either pulsed or continuous mode, and the power adjusted between 0.1 W and 1 W, allowing control over the field intensity in both the near and far regions of the antenna. All experiments were conducted in an electromagnetically shielded room at the Experimental Animals Laboratory of Süleyman Demirel University, providing 80 dB attenuation at the operating frequency to ensure stable environmental conditions. No mobile phones or other electronic devices capable of influencing the experimental setting were allowed inside the room. The rats were housed in plastic restraining tubes measuring 7 cm in diameter and 22 cm in length, and the experimental setup was configured so that each rat was positioned at an equal distance from the monopole antenna. Experimental design is shown in Figure 1 [8].
The electric field strength and electromagnetic field intensity were measured using an Electromagnetic Field Meter (EXTECH Instruments Corporation, Nashua, NH, USA). The RF generator output was gradually increased until the electric field at the target tissue (rat brain) reached 10 V/m [8], at which point the transmitter power was fixed. The specific absorption rate (SAR) for the brain was then calculated. In a sufficiently large slab, which can be considered infinite in all three dimensions, the E-field intensity under exposure to a plane wave of known magnitude can be calculated (Equation (1))
E z = E 0 e α z
E0 is the tangential E-field intensity at the interface between air and the dielectric slab, Ez is the field intensity along the direction of wave propagation, z is the distance from the interface, and α is the attenuation constant (Equation (2)).
α = 2 π f c ε r / 2 1 / 2 1 + σ / 2 π f ε r ε 0 2 1 / 2 1 1 / 2   ( Neper / m )
where f is the frequency, c is the velocity of light in vacuum, εr is the relative dielectric constant, σ is the conductivity of the dielectric slab, and ε0 is the permittivity of free space. This method is suitable at relatively high frequencies (above 2 GHz) so that the size of the slab is easily manageable. Also, a relatively high-power source is needed to provide sufficient power density [9].
Relative dielectric permittivity;
ε r = ε j ε
ε = σ ω ε 0
ε = ε 0 ε r   ( Farad / m )
ε; dielectric permittivity of any material.
L o s s   t a n g e n t = C o n d u c t i o n   C u r r e n t D i s p l a c e m e n t   C u r r e n t
SAR = E2σ/ρ
The dielectric properties of brain tissue samples were measured at İstanbul Technical University, Bioelectromagnetics Laboratory of the Department of Electronics and Communication Engineering. According to the measured ε and ε values, at 2100 MHz EMF ε′ = (13.58)·( ε 0 ) and ε″ = (7.34)·( ε 0 ), at 2450 MHz EMF ε = (11.45)·( ε 0 ) and ε = (8.14)·( ε 0 ).
Conductivity (S/m) and relative permeability values were calculated according to the formulas given in Equations (3)–(6) using the measured e′ and e″ values at the İstanbul Technical University. Calculated dielectric properties of rat brain tissue at different frequencies are given in Table 1.
Using software developed in MATLAB R2021b (MathWorks, Natick, MA, USA) at the Department of Electrical and Electronics Engineering, Süleyman Demirel University, the average SAR values induced in the tissue were computed by using the Finite Difference (FDTD) method, according to Equation (7) (Table 2).

2.3. Histopathological Examinations

Brain tissue sections, cut at 5 μm thickness with a microtome, were first processed through a xylol-alcohol series, followed by rinsing in distilled water. The sections were then incubated in Luxol Fast Blue solution at 60 °C for 2 h, treated with 95% alcohol, and washed again in distilled water. Subsequently, the samples were immersed in lithium carbonate solution for 20 min at room temperature, transferred to 70% alcohol and distilled water, and then stained with Cresyl Violet for 2–5 min at room temperature. After a brief rinse in distilled water, the sections were dehydrated through an alcohol-xylol series and sealed with Entellan [10].

2.4. Immunohistochemistry Examinations

The streptavidin peroxidase immunohistochemical method [11] was applied using the antibodies ZO-1 and occludin to determine the connection between the endothelial cells in the blood–brain barrier in the brain tissue, GFAP and AQP-4 found in the astrocyte footplates to determine the astrocyte damage. In the samples taken on slides with polylysin, firstly, deparaffinized tissue sections were rinsed with PBS (Phosphate-Buffered Saline; Sigma, cat. no.: P4417, Steinheim, Germany) and then incubated in hydrogen peroxide for 5 min to block endogenous peroxidase activity. After three 5 min washes with PBS, the tissues were immersed in 1 M sodium citrate solution (pH 6.0) and heated in a microwave for 12 min to unmask antigenic sites. Tissue sections washed several times with PBS were incubated with primary antibodies ZO-1, occludin, GFAP and AQP-4 for 60 min at room temperature in a humid environment after applying Ultra V Block solution (ScyTek cat. no.: AAA125 69144, Logan, UT, USA) for 5 min to prevent non-specific antibody binding. Following primary antibody incubation, tissue sections were washed three times for 5 min each with PBS and then incubated with the secondary antibody (biotinylated Goat Anti-Polyvalent; ScyTek, cat. no.: ABF125 68813, Logan, UT, USA) for 30 min at room temperature in a humid chamber. After another three 5 min PBS washes, the sections were treated with Streptavidin Peroxidase (ScyTek, cat. no.: ABG125 69365, Logan, UT, USA) for 30 min under the same conditions, followed by a PBS rinse. Diaminobenzidine (DAB) Substrate Kit solution (ScyTek, cat. no.: ACH500, Logan, UT, USA) was then applied, and once the signal was visualized under a light microscope, the sections were simultaneously washed with PBS. Finally, the prepared sections were examined under a light microscope (Leica DM 500, Wetzler, Germany), and representative images were captured. Semi-quantitative scoring was made according to the severity and extent of immunohistochemical staining (0: No, +1: Slight, +2: Moderate, +3: Severe).

2.5. Tunel Method

TUNEL (terminal deoxynucleotidyl transferase-mediated dUTP nick end labeling) technique was used to determine apoptosis. Apoptotic signals create breaks on DNA. The brain tissues removed after decapitation were fixed in 10% formalin solution and embedded in paraffin after routine follow-ups. Sections of 5 μm thickness from paraffin blocks were taken on polylysine slides. TUNEL method was used to determine DNA fragmentation for staining apoptotic cells. Tissues deparaffinized with xylene were dehydrated by passing through a graded alcohol series, washed with PBS, and incubated with 5% proteinase K for 10 min and incubated with 3% H2O2 for 5 min to inhibit endogenous peroxidase activity. After washing the tissues with PBS, they were incubated with Equilibration Buffer for 20 min and kept in a humid environment at 37 °C. Tissues, which were incubated for 90 min in a humid environment at 37 °C by dropping TdT enzyme, and kept in Block buffer for 10 min and then in Stop/Wash Buffer for 10 min, were incubated with Anti-Digoxigenin-Peroxidase for 30 min, and apoptotic cells were visualized with DAB substrate. Brown nucleated cells were evaluated in favor of apoptosis.

2.6. Gene Expression Analysis

Gene expression analysis was carried out with the service of Intron Health Products Import Export Trade Limited Company. RNA isolation from the studied rat brain tissue was performed according to the tissue RNA extraction kit (MG-DRNA-01, Hibrigen Biotechnology R&D Industry and Trade Inc., Kocaeli, Turkey) protocol. After mRNA isolation, the cDNA synthesis stage was started. After the master mix was prepared for cDNA synthesis, the reverse transcription reaction was started. cDNA Synthesis Kit (High Capacity) (Wizbio, WizScript™, Seongnam, Republic of Korea) was used. The obtained cDNA samples were stored frozen at −80 °C until the Real-time PCR step. Wizbio (WizPure™ qPCR Master (SYBR)-W1711) kit used for real-time QPCR. After the literature research and primer design, the COX-2 mRNA expression level was determined by using the Glyceraldehyde 3-phosphate dehydrogenase (GAPDH) gene as the housekeeping gene. After the master mix was prepared, the Real-time qPCR reaction was started. The real-time qPCR reaction was performed on the Applied Biosystems™ 7500 Fast Real-time PCR instrument (Thermo Fisher Scientific, Waltham, MA, USA). The relative quantitation calculation is based on the relative expression of the target gene relative to the reference gene. Quantification of mRNA expressions was done by taking the GAPDH transcript as a reference and normalizing it with respect to the control group. The “Comparative CT (ΔΔCT)” method was used for the calculation of the relative quantification.

2.7. Enzyme-Linked Immunosorbent Assay (ELISA)

BAX protein level was determined by sandwich ELISA method using “RAT Apoptosis regulator BAX ELISA kit” (Catalog No: E1869Ra; Bioassay Technology Laboratory (BT-Lab), Shanghai, China). The standard curve range of the kit was 20–7000 ng/L and the sensitivity was 10.13 ng/L. Standards and samples were measured in triplicate. Analysis was performed according to the protocol prescribed by the commercial kit.

2.8. Statistical Analysis

Homogeneity of variances was assessed using the Levene test, and it was found to be homogeneous (p > 0.05). The Shapiro–Wilk test was used to determine whether the results were normally distributed. Since the groups did not show a normal distribution, the Kruskal–Wallis test, a nonparametric test, was used. The Mann–Whitney U test was used for comparisons between groups. All statistical analyses were performed using IBM SPSS Statistics 27.0 (The International Business Machines Corporation, Armonk, NY, USA) statistical software. In all analyses, data with p < 0.05 were considered statistically significant. Results were expressed as mean ± standard deviation (SD).

3. Results

3.1. Histopathological Results

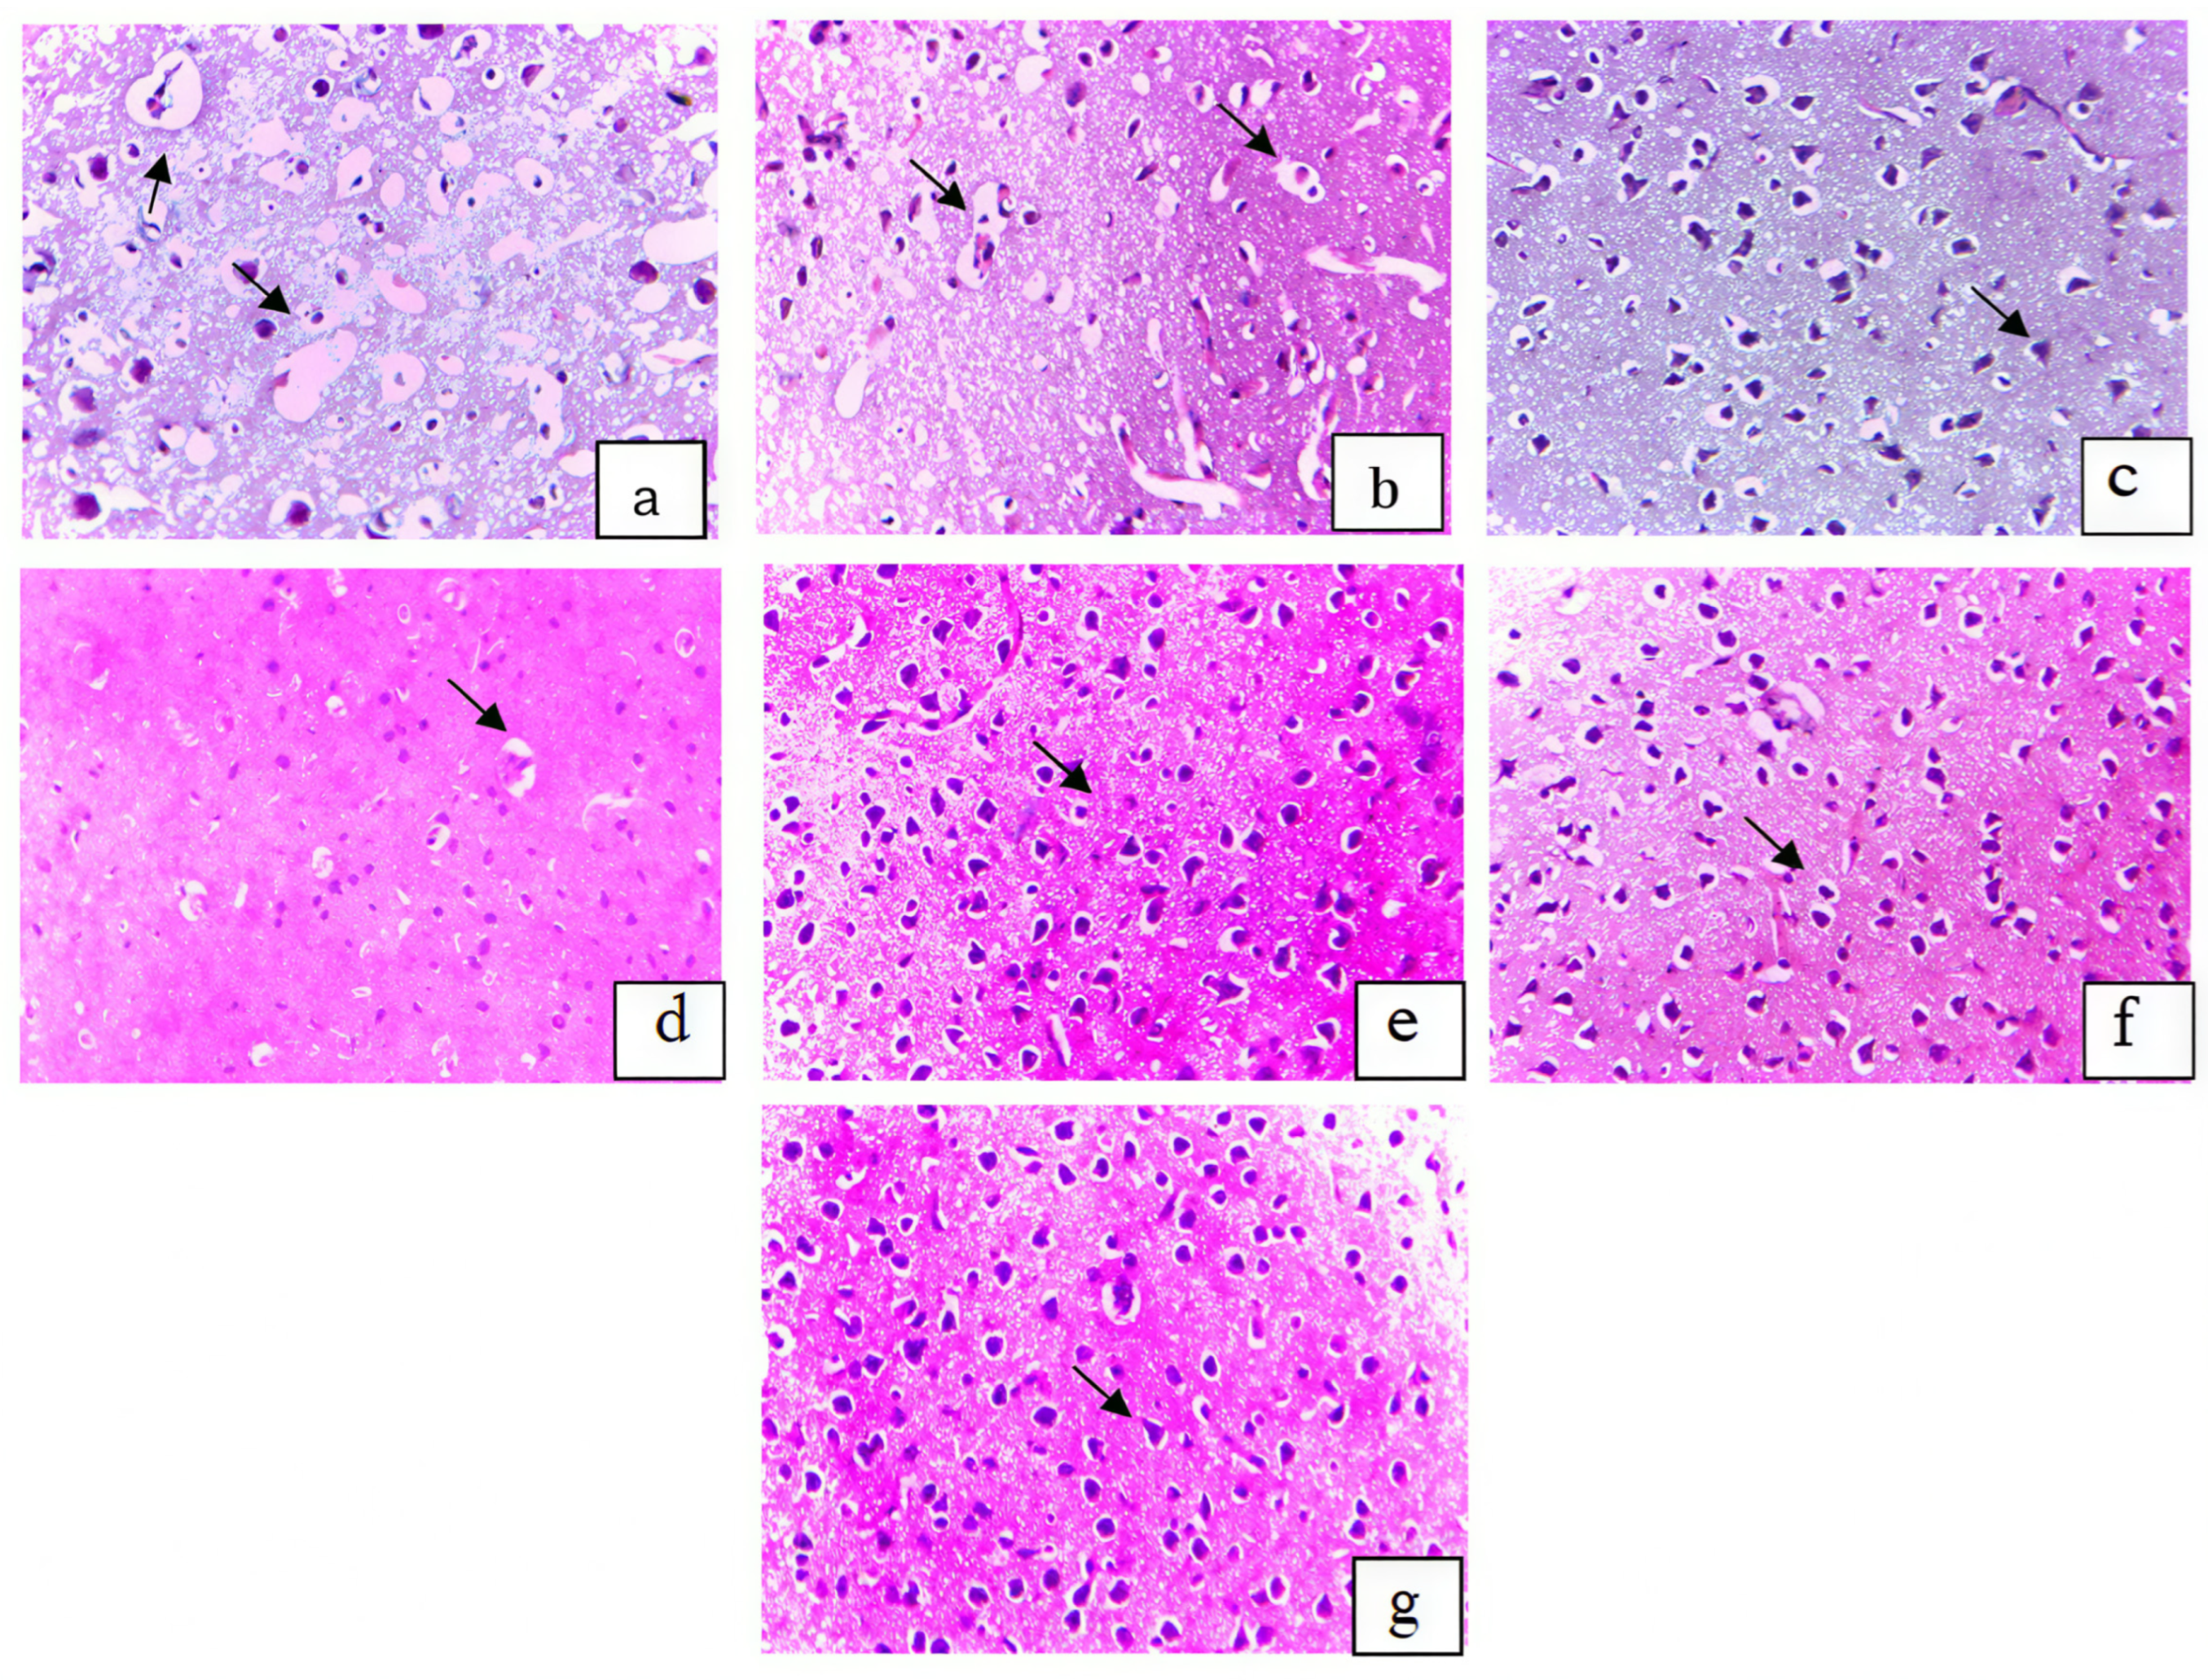
Potential brain tissue damage was assessed using a semi-quantitative scoring system ranging from 0 to +3 (0: No, +1: Slight, +2: Moderate, +3: Severe). When the groups were compared in terms of degeneration level in neurons, damage to neuroglia cells, cavities and autophagic vacuoles, edema, congestion and dilatation in vessels, 2100 MHz and 2450 MHz EMF groups were found to have +2 (Moderate) damage, while 2100 MHz + ginseng, +1 (Slight) damage was detected in 2450 MHz + ginseng groups and sham group. No damage was detected in the ginseng and control groups (0: No). In the 2100 MHz EMF and 2450 MHz EMF groups, degenerations, vacuolizations, dilatation of the vessels, congestion and minor edema were detected, especially in the neurons in the cortical region of the brain. In the 2100 MHz + ginseng and 2450 MHz + ginseng groups and the sham group, degenerations, vacuolizations and dilatations in the vessels in the neurons in the cortical region of the brain were milder, and there was no edema and congestion. Neurons in the cortical region of the brain tissue of rats in both the ginseng and control groups were found to exhibit normal morphology. According to the Kruskal–Wallis test result, the difference between the groups was significant (p < 0.001). Following a significant Kruskal–Wallis result, pairwise comparisons were conducted using the Mann–Whitney U test. The results of semi-quantitative histopathological scoring and statistical analysis between groups are given in Table 3. Light microscope images of the groups are given in Figure 2.

3.2. Immunohistochemical Results

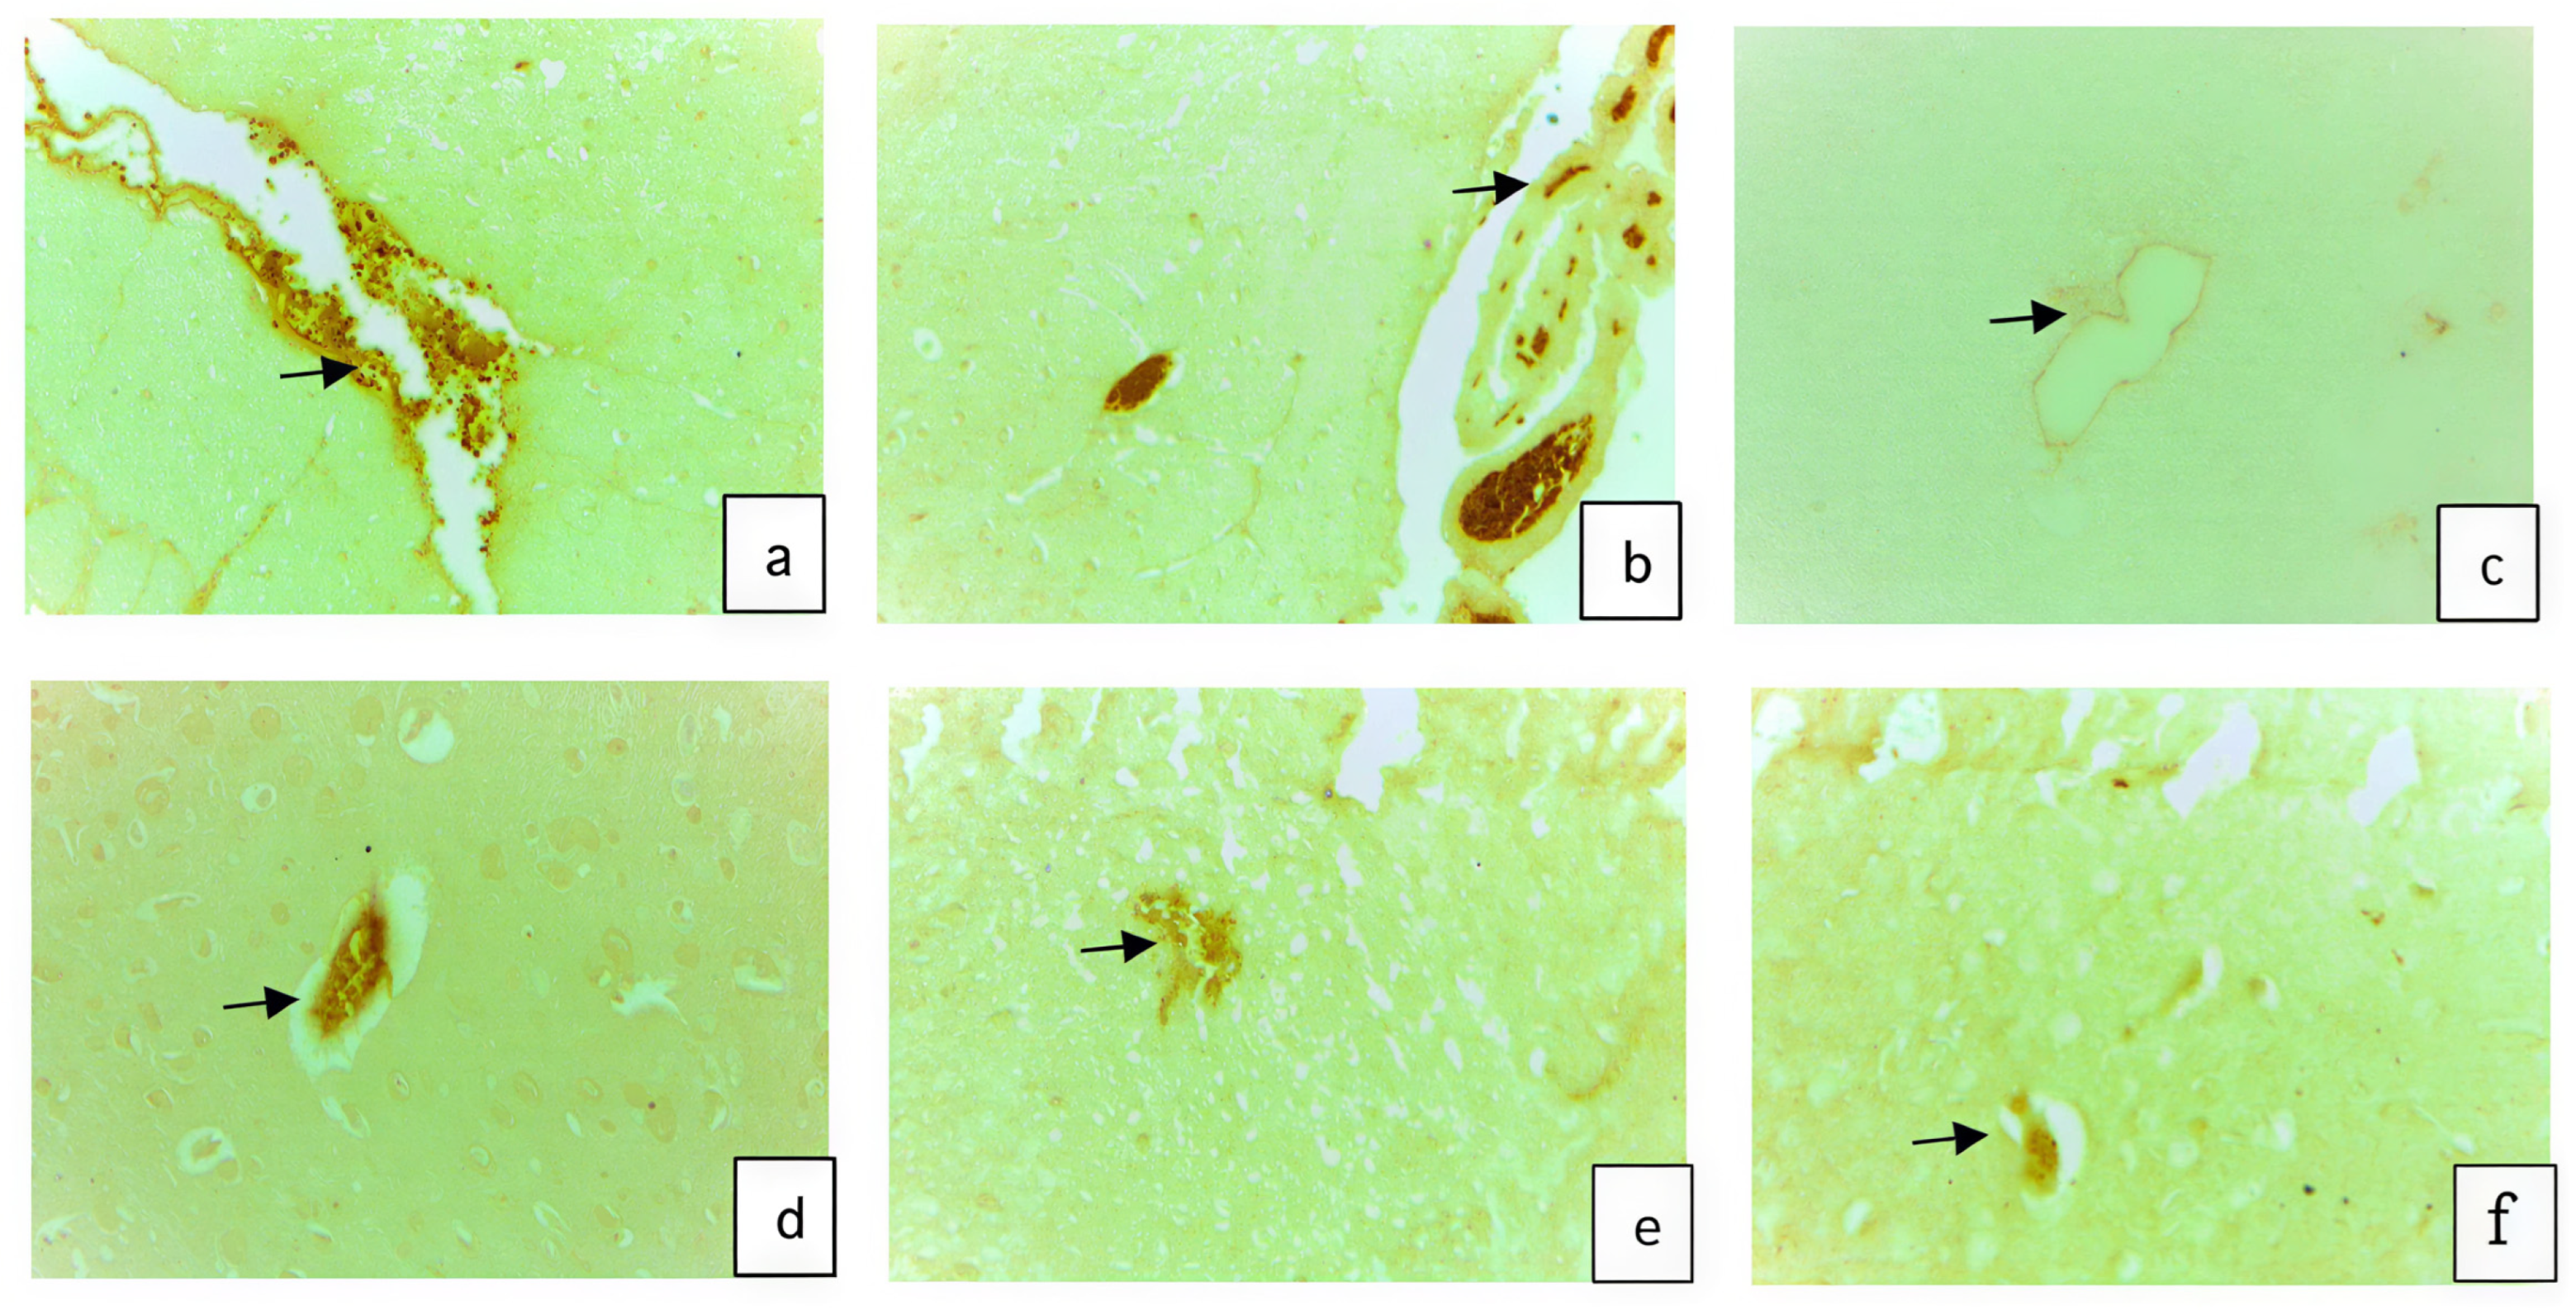
The severity and extent of cytoplasmic immunostaining of ZO-1 protein and occludin in BBB endothelial cells were scored semi-quantitatively from 0 to +3 (0: No, +1: Slight, +2: Moderate, +3: Severe). ZO-1 and occluding immunopositive cell density in BBB endothelial cells were scored individually in 8 rats in each group. Overall differences among groups were first evaluated using the Kruskal–Wallis test (p = 0.007). Following a significant Kruskal–Wallis result, pairwise comparisons were conducted using the Mann–Whitney U test. ZO-1 and occludin immune-positive cell density of the groups and statistical analysis between groups are given in Table 4. Light microscope images of the groups are given in Figure 3.
The severity and extent of cytoplasmic immunostaining of GFAP in the cytoplasm of BBB astrocyte cells and AQP-4 in the astrocyte footplates were scored semi-quantitatively with numbers from 0 to +3 (0: No, +1: Slight, +2: Moderate, +3: Severe). Since the groups were not suitable for normal distribution, the Kruskal–Wallis test, which is one of the non-parametric tests, was used to determine the difference between the groups, and the difference between the groups was found to be statistically significant (p = 0.005). Pairwise comparisons were made using the Mann–Whitney U test. GFAP and AQP-4 immune-positive cell density of the groups and statistical analysis between groups are given in Table 5. Light microscope images of the groups are given in Figure 4.
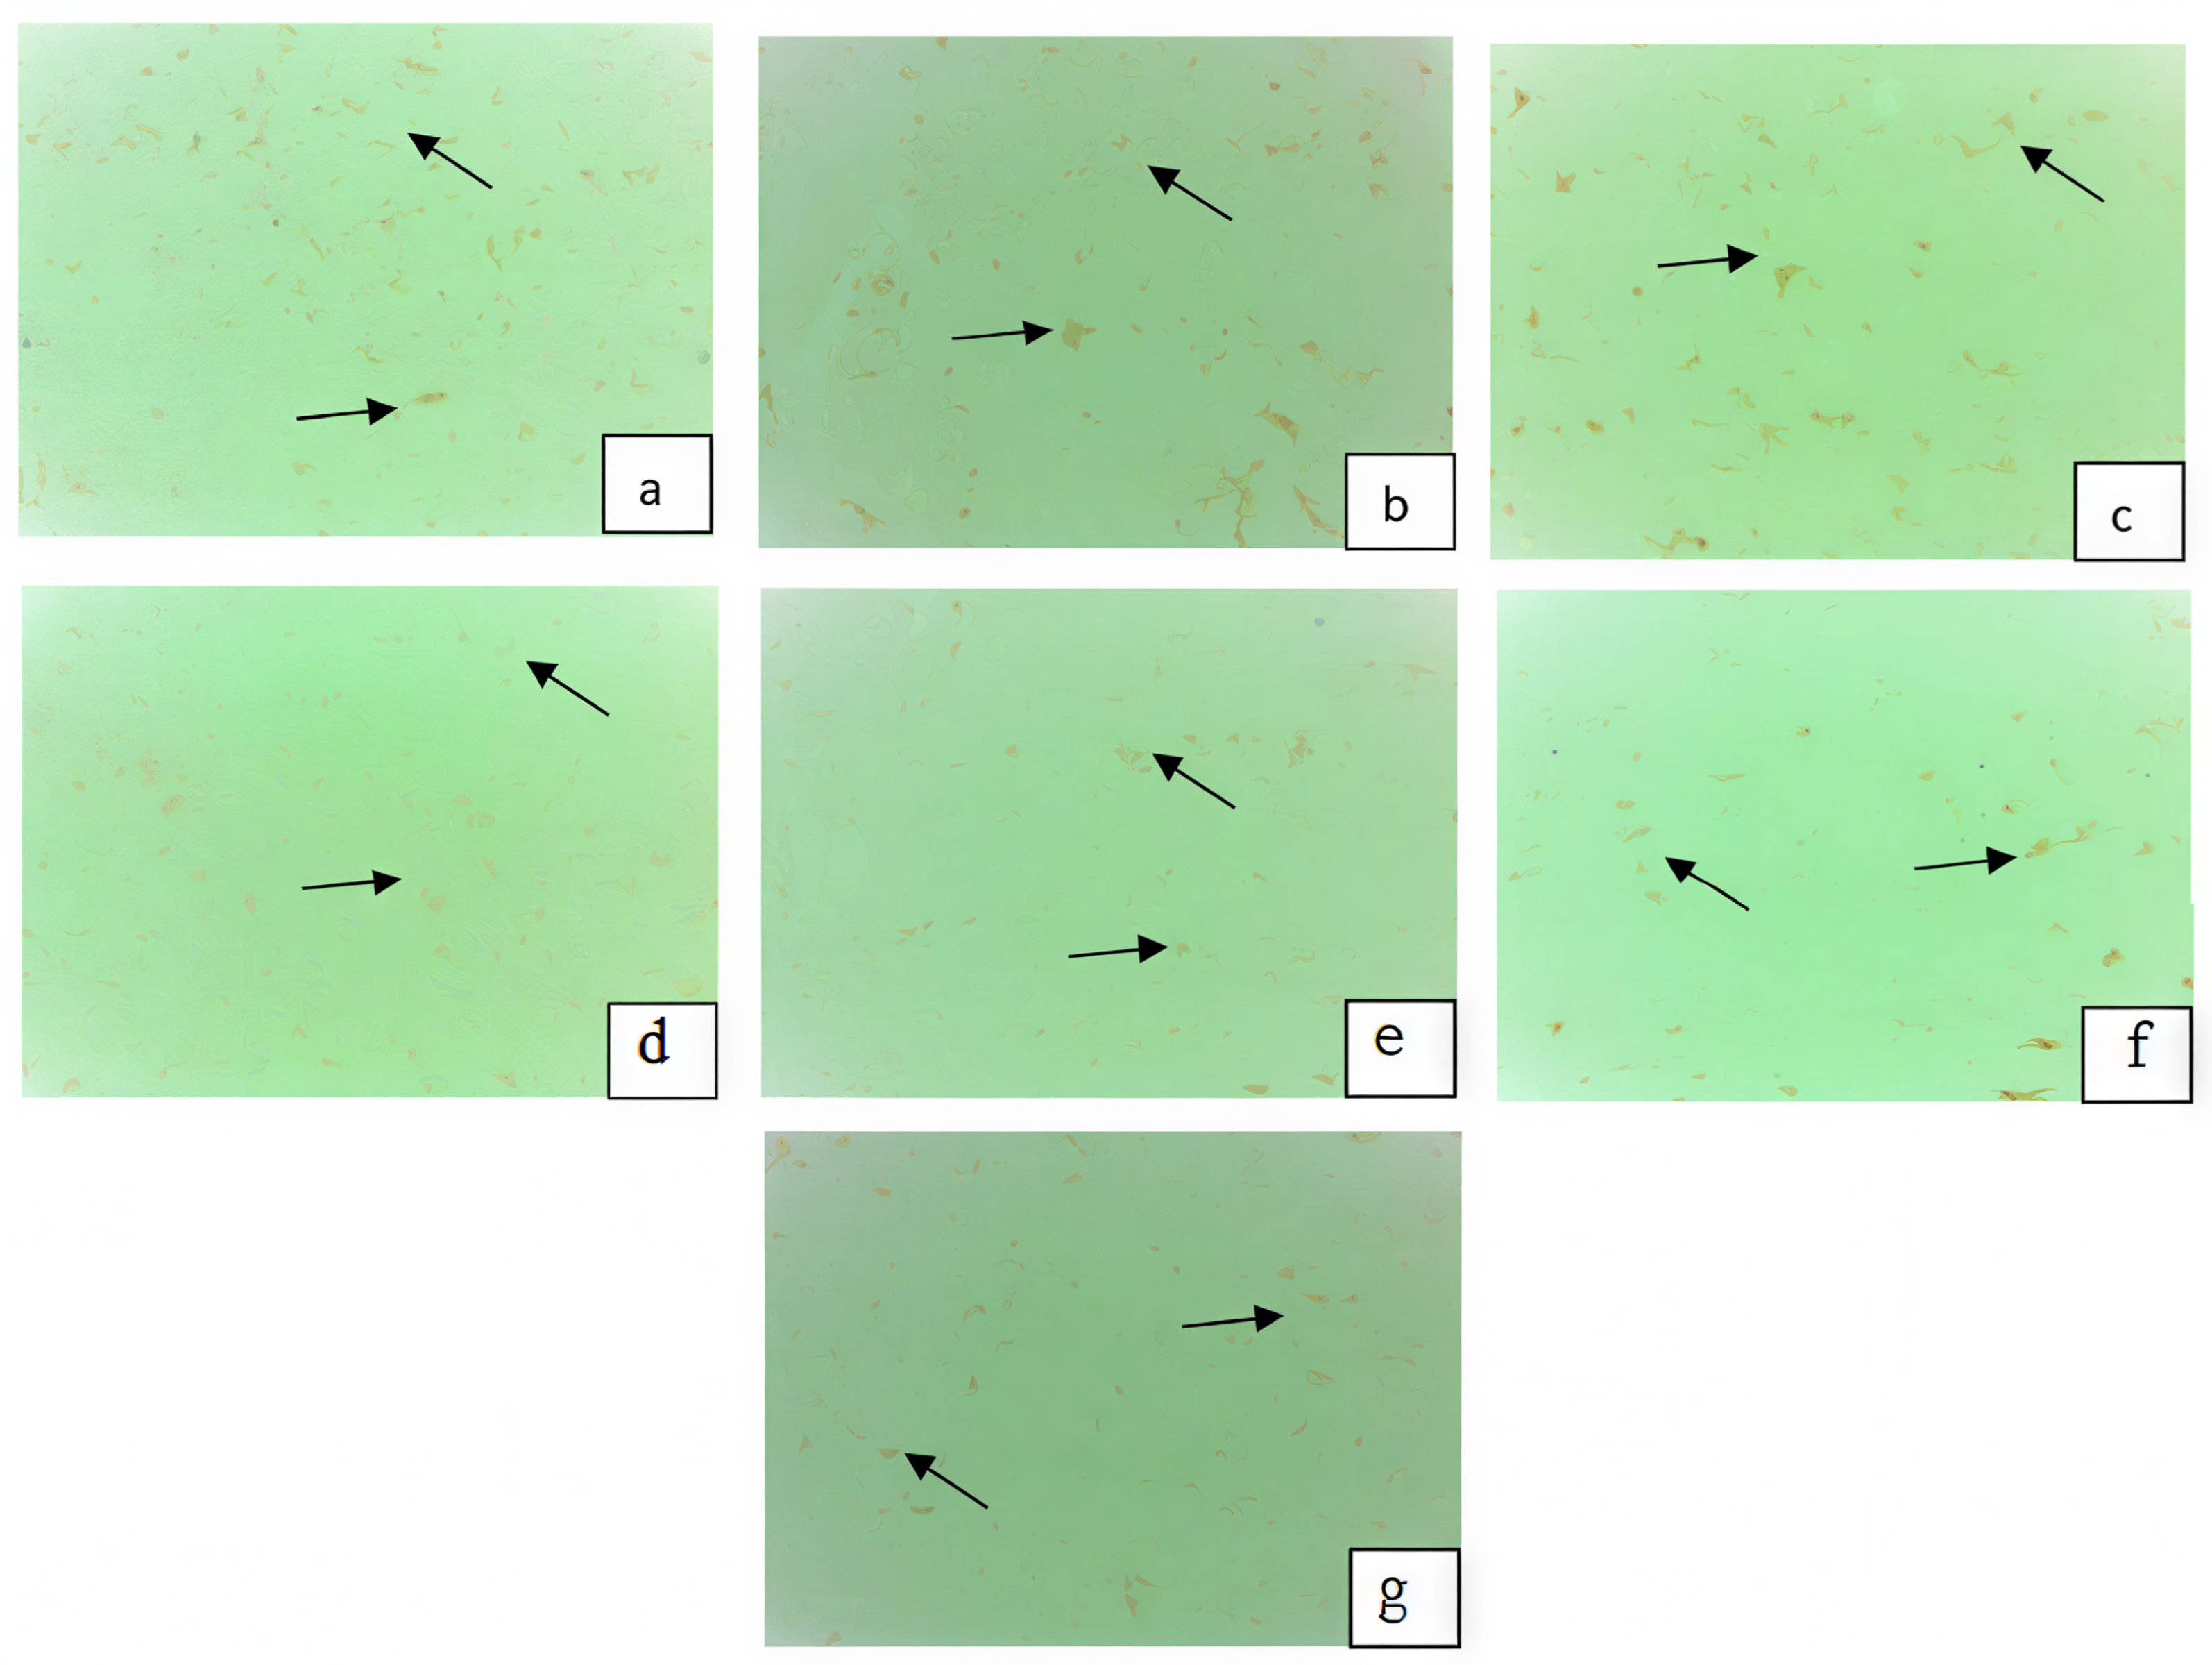
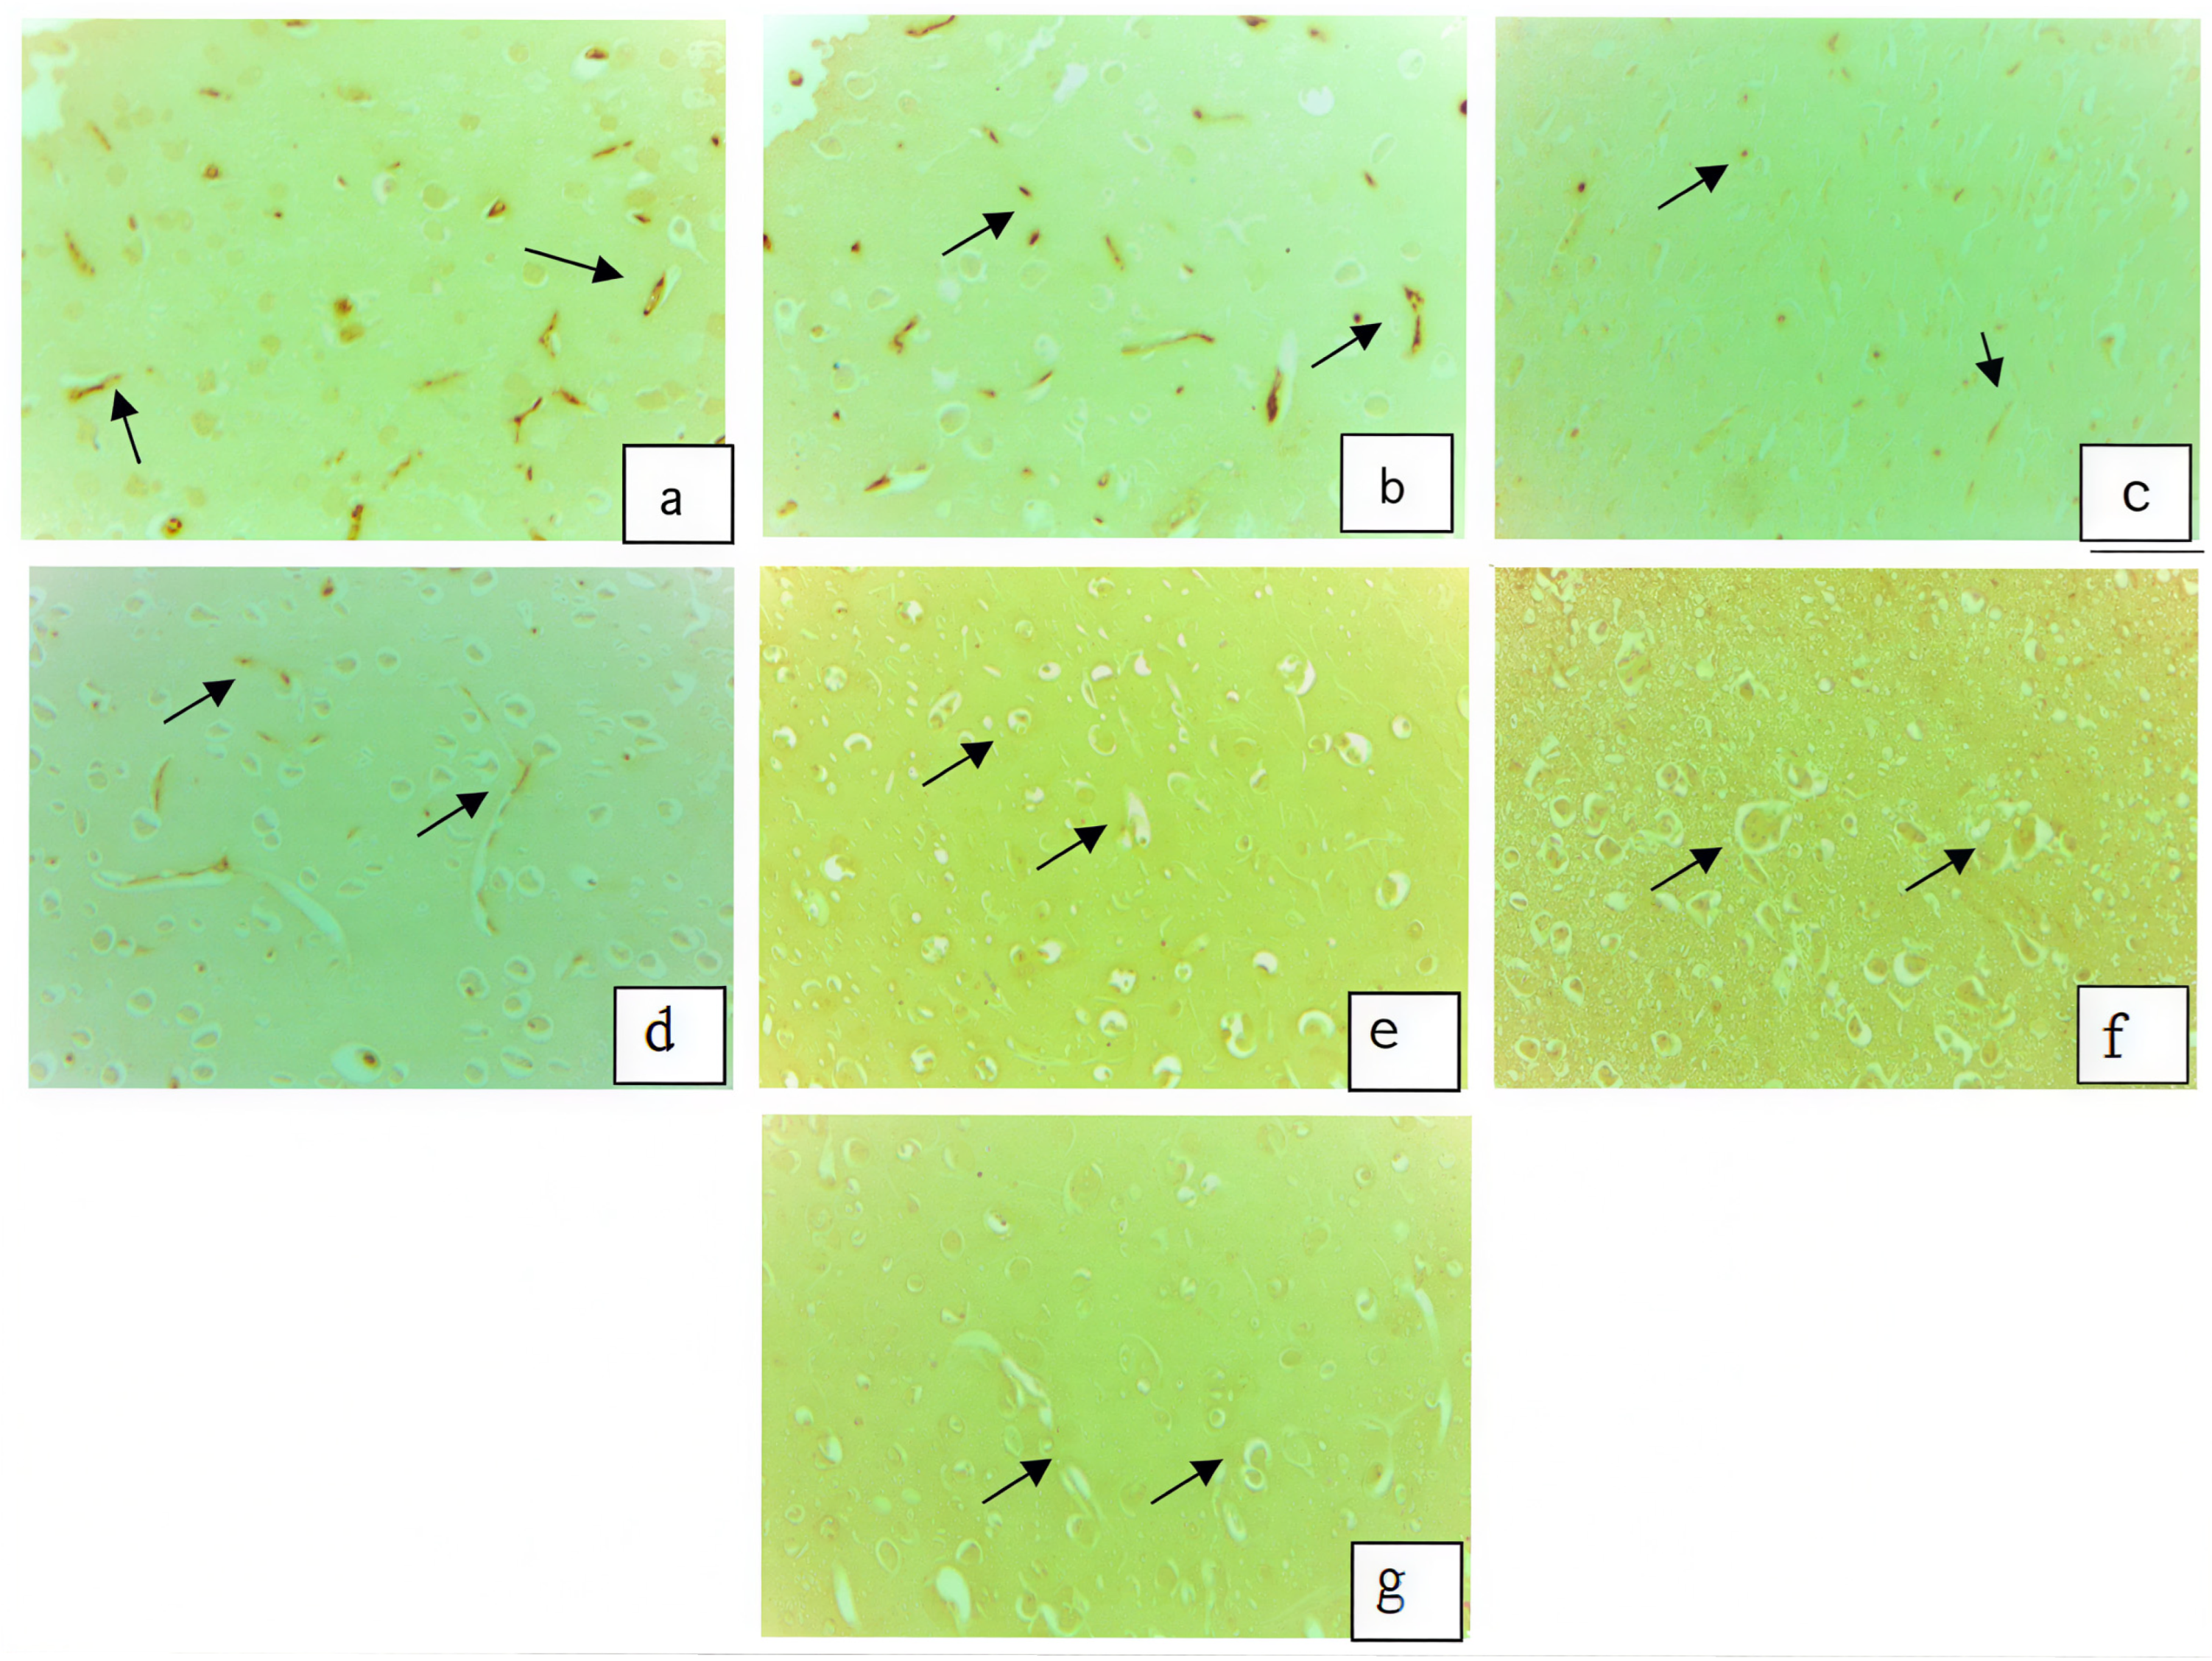
The severity and extent of immunostaining of apoptotic cells of the groups obtained as a result of the TUNEL method were scored semi-quantitatively, from 0 to +3 (0: No, +1: Slight, +2: Moderate, +3: Severe). According to Kruskal–Wallis test results, the difference between the groups was statistically significant (p < 0.001). Pairwise comparisons were made using the Mann–Whitney U test. The results of semi-quantitative immune-positive apoptotic cell scoring for the groups and statistical analysis between groups are given in Table 6. The light microscope images obtained according to the result of the TUNEL method are given in Figure 5.

3.3. Gene Expression Results

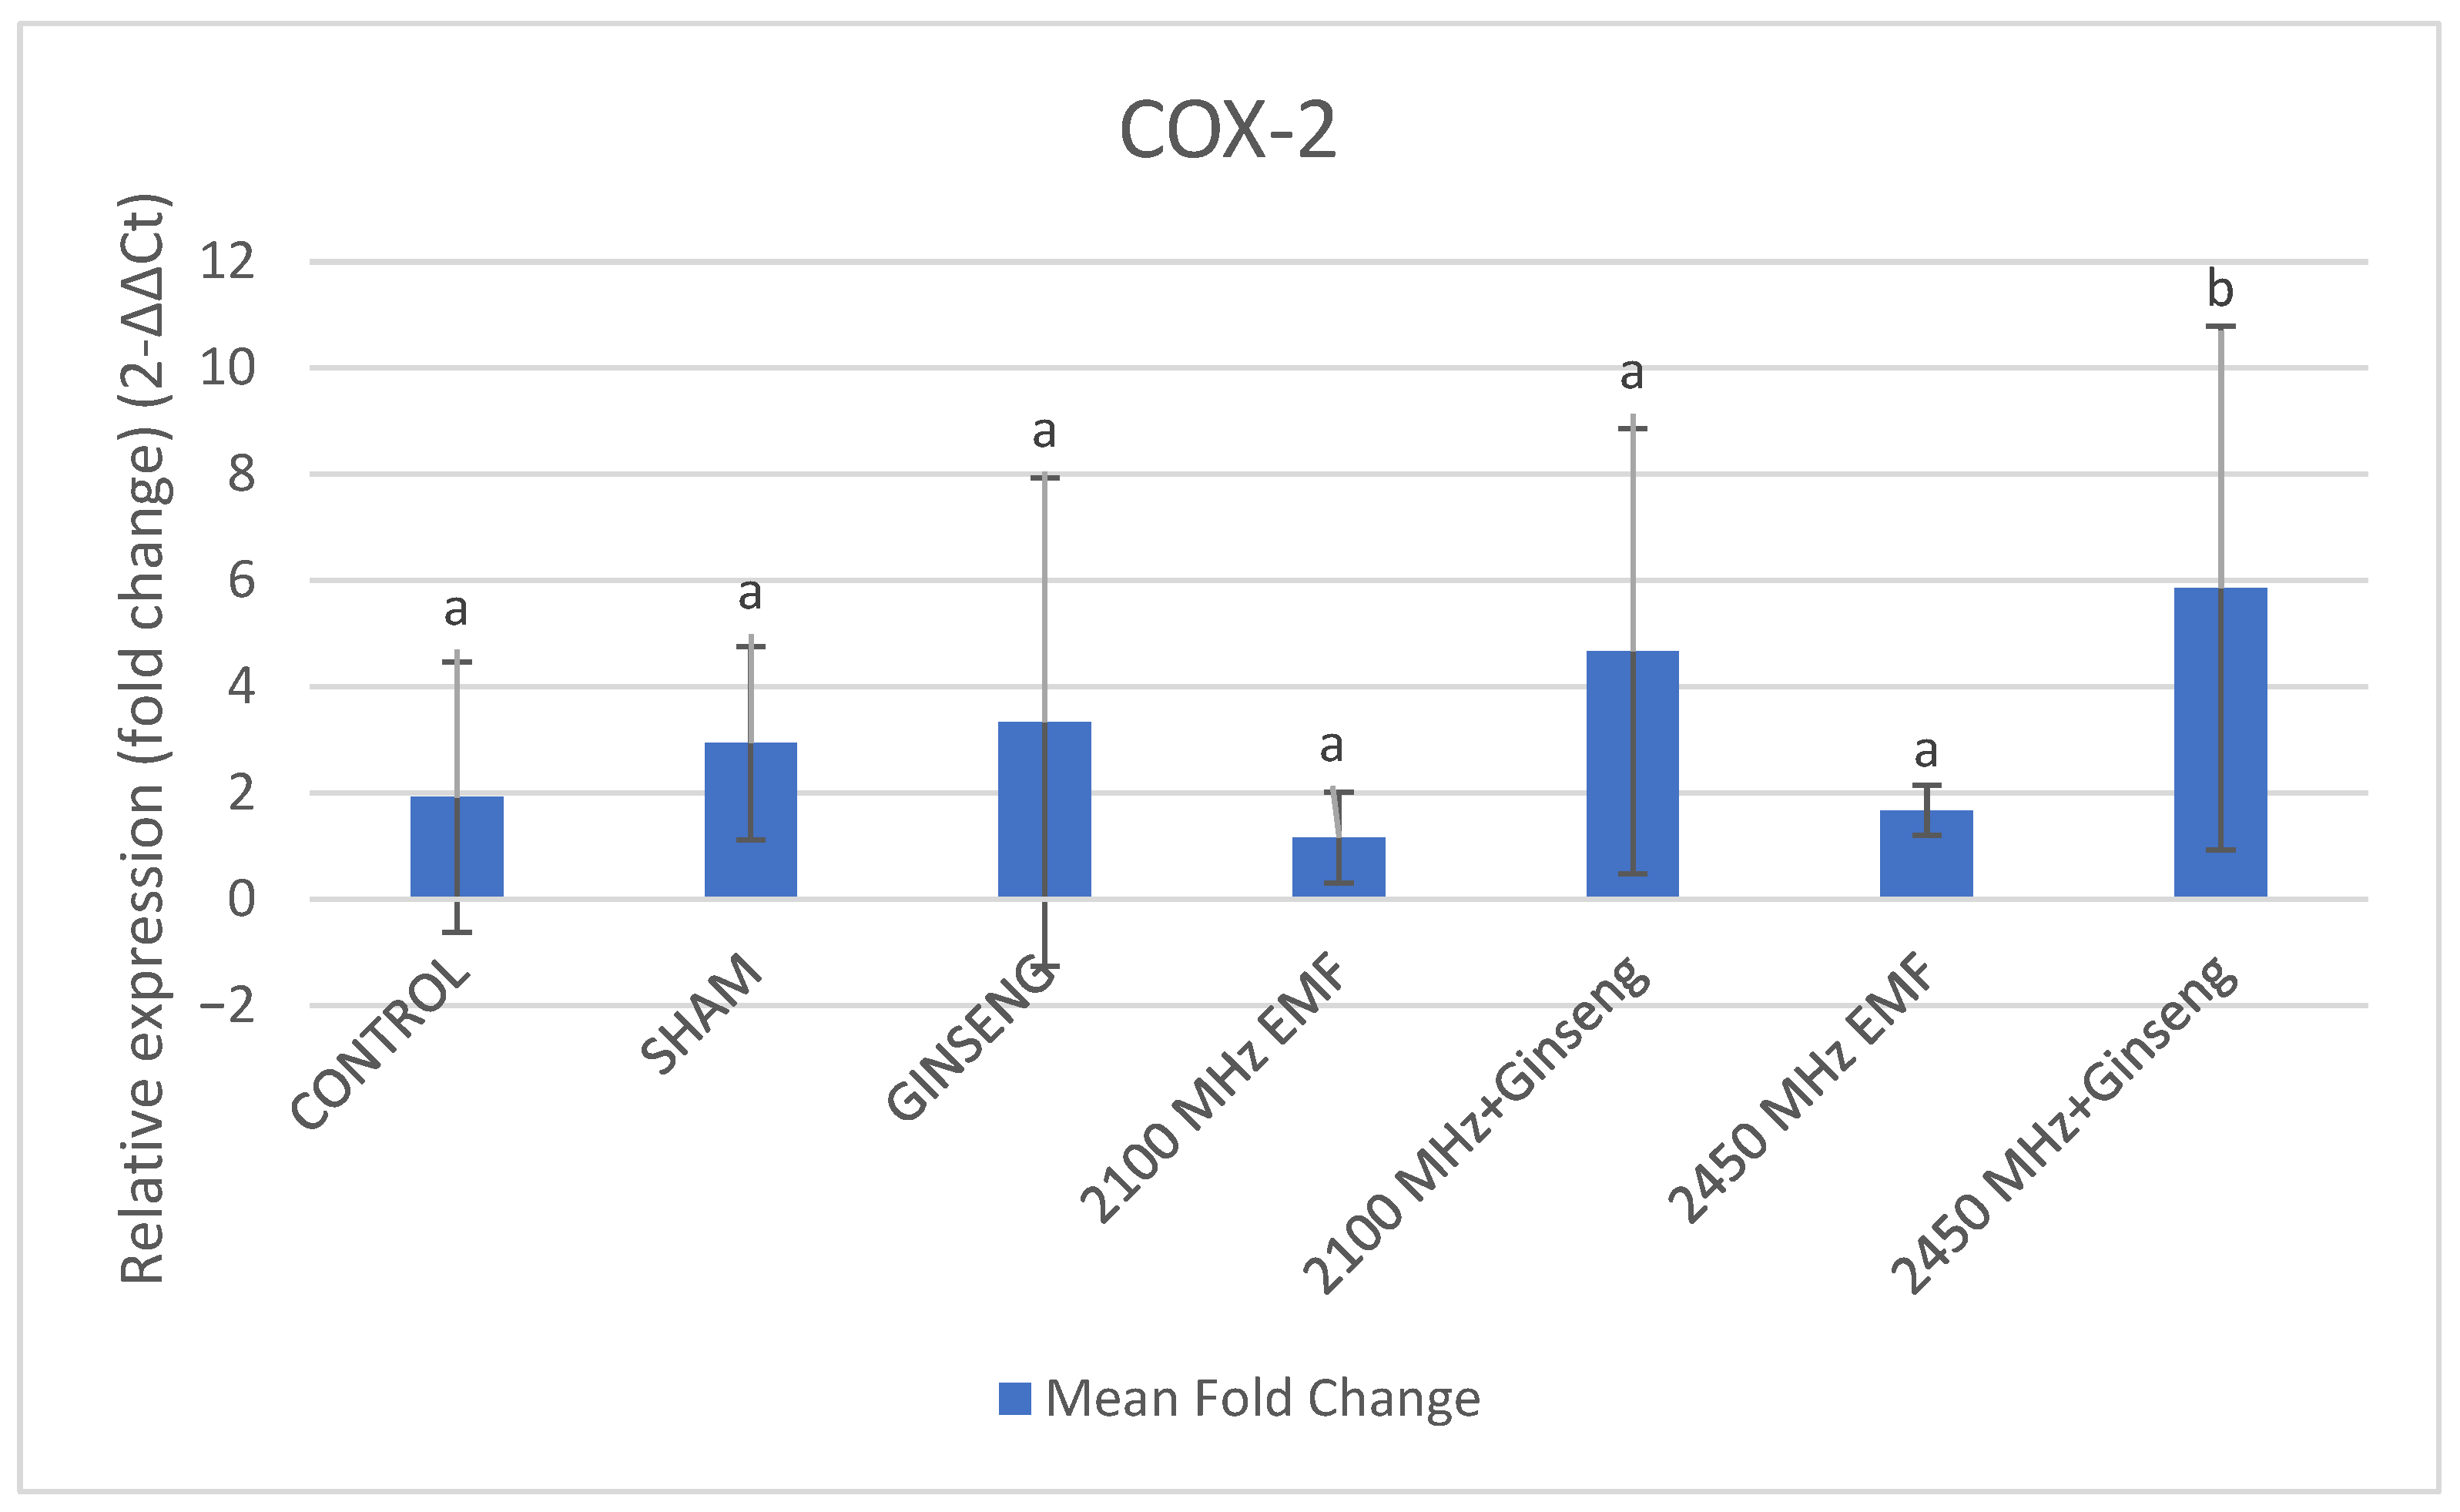
The expression level of COX-2 gene was analyzed in brain tissue samples of male rats exposed to 2100 MHz and 2450 MHz EMF. qPCR results were expressed as mean ± standard deviation. According to the Kruskal–Wallis test results, the difference between the groups was not statistically significant (p = 0.640). When the differences between the groups in terms of COX-2 gene expression were examined, according to the Mann–Whitney U test, it was determined that the mean values of the sham group (2.94 ± 1.82) were increased compared to the mean values of the control group (1.92 ± 2.54). However, this increase was not statistically significant (p = 0.275). A statistically insignificant increase was observed in the ginseng group (3.33 ± 4.60) compared to the sham group (2.94 ± 1.82) (p = 0.513). When the 2100 MHz EMF (1.16 ± 0.85) and 2450 MHz EMF (1.67 ± 0.47) groups were compared, an increase in COX-2 gene expression level was observed in the 2450 MHz EMF group. However, this increase is not significant (p = 0.275). The COX-2 gene expression level in the 2100 MHz EMF + ginseng group (4.67 ± 4.19) is quite high compared to the 2100 MHz EMF group (1.16 ± 0.85). However, this difference is not significant (p = 0.127). When the 2450 MHz EMF group (1.67 ± 0.47) and the 2450 MHz EMF + ginseng group (5.86 ± 4.93) were evaluated, the high difference was statistically significant (p = 0.05). A statistically insignificant decrease was observed in the 2100 MHz EMF group compared to the sham group (p = 0.127), and in the 2450 MHz EMF group compared to the sham group (p = 0.275) (Figure 6).

3.4. BAX ELISA Results

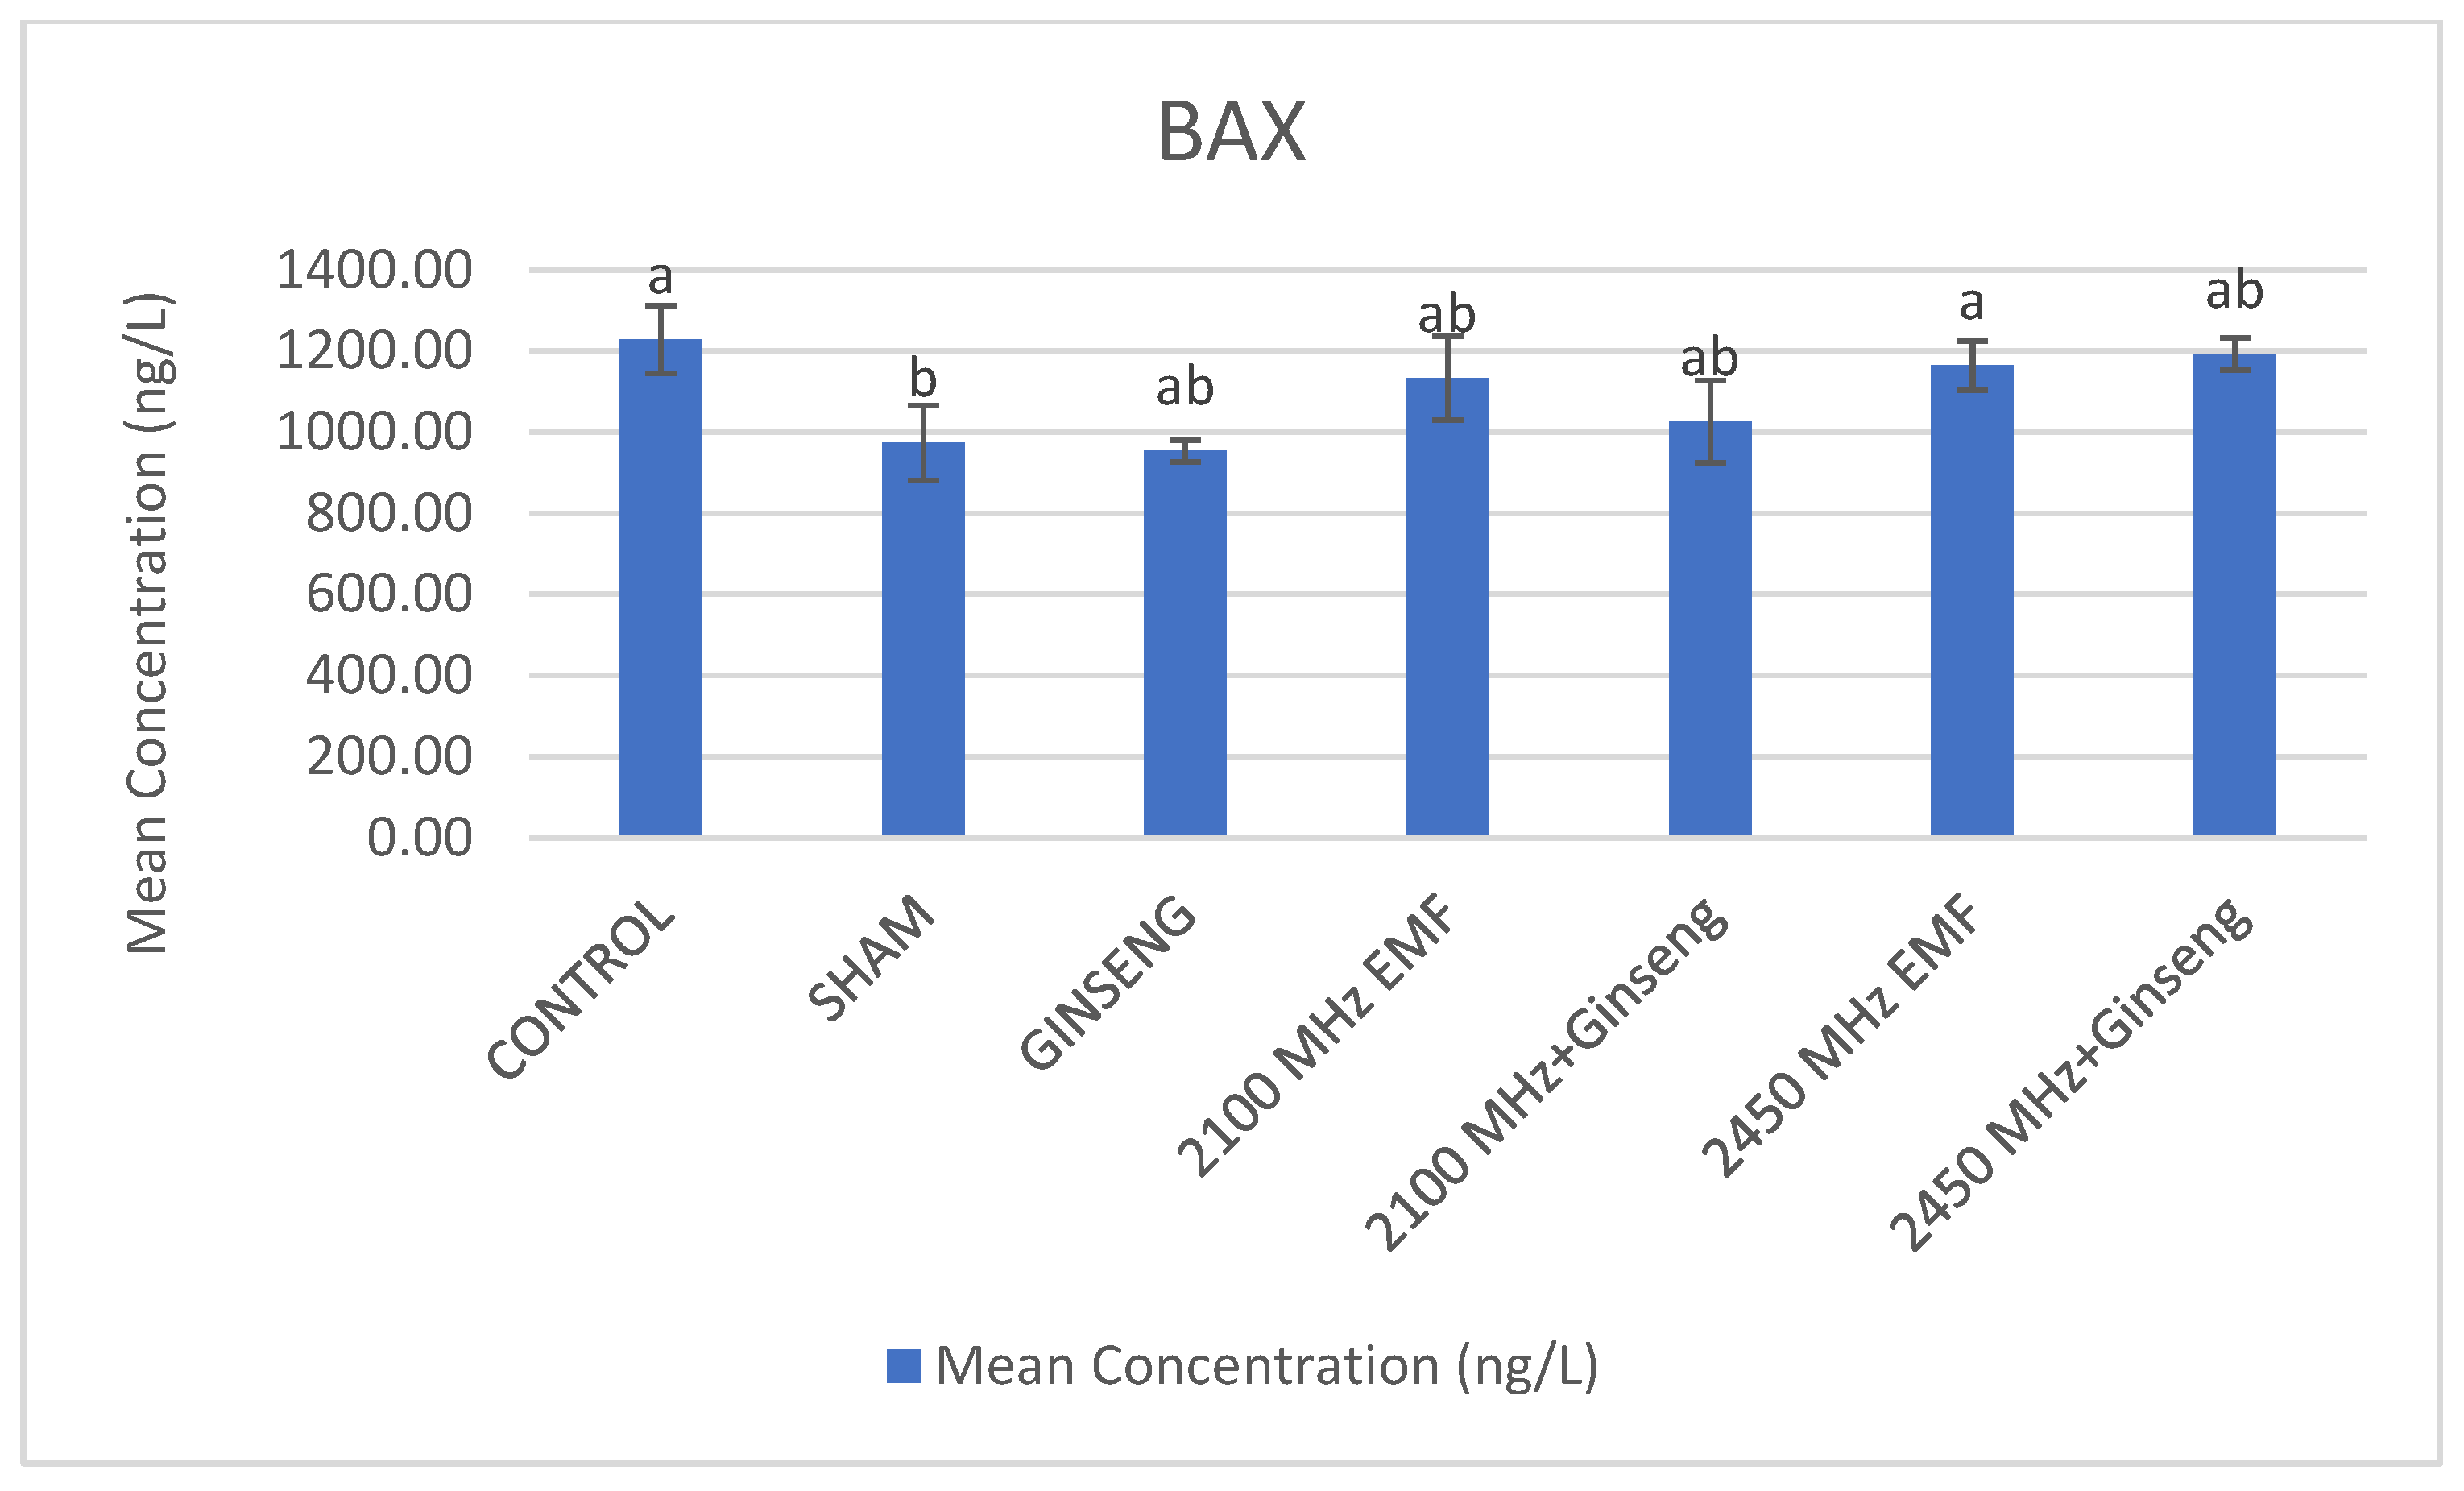
As the data did not meet the assumptions for normal distribution, the non-parametric Kruskal–Wallis test was applied to compare the groups, and a statistically significant difference was observed (p = 0.021). When the differences between the groups in terms of BAX protein concentrations were examined, according to the Mann–Whitney U test, the difference between control and sham (p = 0.05), sham and 2450 MHz EMF (p = 0.05) groups was significant. The difference is insignificant when comparing the other groups (p > 0.05) (Figure 7).

4. Discussion

In studies assessing biological responses to microwave radiation, the expression levels of ZO-1, occludin, and GFAP in the brain were examined to evaluate blood–brain barrier (BBB) permeability. ZO-1 and occludin are tight junction (TJ) proteins in endothelial cells, and decreased ZO-1 expression can impair TJ integrity, leading to BBB disruption. It has been suggested that GFAP, a well-known indicator of mature astrocytes, contributes to the maintenance of astrocytic form and structural organization [12].
Gao et al. [13] showed that exposure to electromagnetic radiation increased blood-brain barrier permeability and decreased ZO-1 expression in brain tissue. Akakin et al. [14] showed the immunohistochemical effect of 1800 MHz mobile phone radiation on GFAP in the brain and observed an increase in the number of immune-positive cells in GFAP in the exposure group. Ammari et al. [15] exposed rats to 900 MHz EMF for 45 min/day (SAR = 1.5 W/kg) and 15 min/day (SAR = 6 W/kg) five days a week for an eight-week period. They stated that there was an increase in GFAP in the exposure groups as a result of the immunohistochemistry analysis performed to determine the damage in astrocytes. They also observed severe neuronal degeneration and vacuolizations in the cerebral cortex of the EMF groups. Similar histological findings were obtained in our study.
It has been reported that exposure to electromagnetic radiation (EMR) induces apoptosis and degeneration in hippocampal neurons [16,17,18]. Dogan et al. [19] showed that EMR emitted from 3G mobile phones did not cause a significant difference in the number of apoptotic cells in rat brain tissue between groups. In another study examining the effects of 900 MHz EMF on brain tissue, histopathological examinations indicated changes in the frontal cortex, basal ganglia, hippocampus, and cerebellum [20]. Exposure to 2100 MHz EMF for 30 min per day for 90 days has been shown to cause apoptosis in the brain [21]. Similarly, in our study, when the 2100 MHz EMF group was compared with the control and sham groups, a significant increase in apoptosis markers was observed in the EMF groups compared to the control and sham groups (p = 0.002).
The p53 genes act as major control elements within cellular signaling networks in many pathological states and enhance adaptive mechanisms through their interaction with specific target genes. Both p53 and its associated downstream targets are critically involved in apoptotic processes during cerebral ischemia. These p53-dependent genes mainly function in two areas: modulation of cell cycle progression and regulation of programmed cell death, including genes belonging to the BCL-2 family [22]. Apoptosis mediated by p53 can be triggered either by enhancing BAX expression or by inhibiting BCL-2 function. Shahin et al. [23] observed intense immunoreactivity in BAX and p53 in hippocampal neuronal cells by 2.45 GHz microwave EMR and concluded that 2.45 GHz EMR induced apoptosis. Another study found upregulation of BAX mRNA expression and downregulation of BCL-2 expression in brain tissue as a result of 2450 MHz microwave exposure [24]. Tarsaei et al. [25] showed in their study that long-term exposure to 2450 MHz EMF decreased BCL-2 expression and increased proapoptotic BAX expression in the hippocampus of rats. They stated that long-term exposure to 2450 MHz EMF induced apoptosis by upregulating BAX and downregulating BCL-2. Similarly, in this study, a significant increase was observed in the 2450 MHz EMF group compared to the sham group (p = 0.05). Among the EMF groups, the highest BAX protein concentration was measured in the 2450 MHz EMF group. An increase was observed in the 2450 MHz EMF group compared to the 2100 MHz EMF group (p = 0.827). However, this increase was not significant.
Recent studies have linked increased COX-2 expression and elevated prostaglandin synthesis to the initiation of endoplasmic reticulum (ER) stress; however, the molecular pathways underlying COX-mediated ER stress activation remain unclear. With ER stress, a problem arises in the 3D folding of proteins [26,27]. Although the unfolded protein response (UPR) initially aims to alleviate cellular stress and restore proteostasis, it can activate cell death in response to cases of irreversible cell damage [28]. Blocking COX-2 induces apoptosis [29]. In this study, similar results were observed when the COX-2 gene expression levels in the groups were compared with the BAX protein concentration results. BAX protein level decreased in groups with increased COX-2 expression level. The variation between groups in histology supports our TUNEL apoptosis results.
Histological results emerge as a result of biochemical interactions. For biochemical interactions to occur, proteins must be formed. The working and working level of DNA is important for the formation of proteins. Therefore, it was preferred to study gene expression and ELISA. Histologically, the effect of EMF was observed. Instead of reevaluating the same ones studied in histology, different parameters were studied in order to connect the research to the cause–effect relationship. As a result, the decision was made to look at the expression of COX-2.
Based on the results of this study, it can be proposed that elevated GFAP expression and immunoreactivity may play a role in mediating brain injury induced by electromagnetic field exposure from mobile phones. In contrast to low-frequency electromagnetic fields, exposure to high-frequency non-ionizing radiation, such as radiofrequency radiation (RFR), may lead to substantial energy uptake and subsequent increases in tissue temperature, depending on exposure intensity. The thermal consequences associated with elevated RFR levels are generally well characterized. However, the non-thermal effects of low-intensity radiation are still not fully explained. Additional research is necessary to better understand the fundamental neuronal mechanisms involved in the interaction between RFR and the CNS. The evaluation of COX-2 expression in brain tissue increases the importance of the subject, especially since the COX parameter interacts with so many pathways and is a parameter that diverges from many different pathways. These findings will help provide a reference for the protection of individuals exposed to high EMR, particularly due to ginseng application.
The neuroprotective effects of ginseng may be attributed to its bioactive components, particularly ginsenosides, which have been shown to exert antioxidant, anti-inflammatory, and anti-apoptotic properties [4,5,7]. Ginsenosides are known to reduce ROS generation, stabilize mitochondrial membrane potential, and modulate apoptotic pathways by regulating the BAX/BCL-2 [6,7]. The observed modulation of COX-2 expression in the present study may also be associated with the anti-inflammatory effects of ginseng [4,7], contributing to the attenuation of EMF-induced neuronal injury.
When the results of ginseng application to the created stress were examined, differences were also observed in the groups to which ginseng was applied. As a result, when the mechanism of action differs, the mechanism of response and repair also differs. Different hypotheses have been created based on the data we have regarding this topic. There is greater stress on the ER, there is stress on the mitochondria, the temperature increased, thermal stress occurred, the p53 anti-tumor pathway, in which COX-2 is directly effective, was effective. However, this situation was eliminated by the antioxidative effect of ginseng.

5. Conclusions

In conclusion, our immunohistochemical findings support our histopathological findings. It was concluded that the brain tissues of the 2100 MHz and 2450 MHz EMF groups were damaged, that these damages were reduced in the groups given ginseng, and that the ginseng dose used could be effective. Compared to the control group, the 2100 MHz and 2450 MHz EMF groups showed higher immunostaining intensity in apoptotic cells (+2, moderate), whereas the 2100 MHz + ginseng and 2450 MHz + ginseng groups showed lower staining intensity (+1, slight). GFAP expression in the cytoplasm of BBB astrocytes and AQP-4 immunopositive cell density in astrocyte end-feet were scored as +3 (severe) in the control, sham, and ginseng groups. The 2100 MHz EMF + ginseng group showed higher staining intensity (+3) than the 2100 MHz EMF group (+2), and the 2450 MHz EMF + ginseng group showed higher staining intensity (+3) than the 2450 MHz EMF group (+2), although these differences were not statistically significant (p = 0.27). While the density of ZO-1 and occludin immune-positive cells in the BBB endothelial cells was found at +1 (slight) level in the preparation of the 2100 MHz and 2450 MHz EMF groups, 2100 MHz + ginseng and 2450 MHz + ginseng groups, in the sham, ginseng and control groups, immune-positive staining was determined as +2 (moderate). It has been determined that the dose of ginseng used provides protection, but does not completely prevent tissue damage, both in histopathological findings and in immunohistochemical evaluations. It is recommended to find the most effective protective dose by conducting different studies using different doses of ginseng.


Author Contributions

Experiment, İ.P.K.; collection of tissues at the end of the experiment, İ.P.K. and N.Ş.; electromagnetic field setup, electromagnetic measurements and calculations, İ.P.K., Ö.C. and S.Ç.; histopathological and immunohistochemical examinations, N.Ş.; genetics and biochemical analysis, U.Ş.; writing—original draft preparation, İ.P.K. All authors have read and agreed to the published version of the manuscript.

Funding

This research was supported by The Scientific Research Projects Coordination Unit of Süleyman Demirel University (Project Code: FDK-2020-7451).

Institutional Review Board Statement

The study was conducted in accordance with the Declaration of Helsinki, and approved by the Institutional Ethics Committee of Süleyman Demirel University Animal Experiments Local Ethics Committee Chairman Turkey (Date of registration: 19 July 2019, Issue: 8).

Informed Consent Statement

Not applicable.

Data Availability Statement

All the research data related to this manuscript will be available upon reasonable request from the corresponding authors.

Conflicts of Interest

The authors declare no conflicts of interest.

References

  1. Mahboubi, A. The Side Effects of Electromagnetic Waves on the Human Brain: A review study. In Proceedings of the 11th Majlesi Conference on Electrical Engineering, Majlesi, Iran, 6 August 2022; Available online: https://hal.science/hal-03762538/ (accessed on 10 January 2026).
  2. Kim, J.H.; Lee, J.K.; Kim, H.G.; Kim, K.B.; Kim, H.R. Possible Effects of Radiofrequency Electromagnetic Field Exposure on Central Nerve System. Biomol. Ther. 2019, 27, 265–275. [Google Scholar] [CrossRef] [Scilit] [PubMed]
  3. López, D.E.; Ballaz, S.J. The Role of Brain Cyclooxygenase-2 (Cox-2) Beyond Neuroinflammation: Neuronal Homeostasis in Memory and Anxiety. Mol. Neurobiol. 2020, 57, 5167–5176. [Google Scholar] [CrossRef] [Scilit] [PubMed]
  4. Ratan, Z.A.; Haidere, M.F.; Hong, Y.H.; Park, S.H.; Lee, J.O.; Lee, J.; Cho, J.Y. Pharmacological potential of ginseng and its major component ginsenosides. J. Ginseng. Res. 2021, 45, 199–210. [Google Scholar] [CrossRef] [Scilit] [PubMed]
  5. Lin, Z.; Xie, R.; Zhong, C.; Huang, J.; Shi, P.; Yao, H. Recent progress (2015–2020) in the investigation of the pharmacological effects and mechanisms of ginsenoside Rb1, a main active ingredient in Panax ginseng Meyer. J. Ginseng. Res. 2022, 46, 39–53. [Google Scholar] [CrossRef] [Scilit] [PubMed]
  6. Zhang, G.; Liu, A.; Zhou, Y.; San, X.; Jin, T.; Jin, Y. Panax ginseng ginsenoside-Rg2 protects memory impairment via anti-apoptosis in a rat model with vascular dementia. J. Ethnopharmacol. 2008, 115, 441–448. [Google Scholar] [CrossRef] [Scilit] [PubMed]
  7. Choi, J.H.; Jang, M.; Nah, S.Y.; Oh, S.; Cho, I.H. Multitarget effects of Korean red ginseng in animal model of Parkinson’s disease: Antiapoptosis, antioxidant, antiinflammation, and maintenance of blood-brain barrier integrity. J. Ginseng Res. 2018, 42, 379–388. [Google Scholar] [CrossRef] [Scilit] [PubMed]
  8. Postaci, I.; Coskun, O.; Senol, N.; Aslankoc, R.; Comlekci, S. The physiopathological effects of quercetin on oxidative stress in radiation of 4.5 g mobile phone exposed liver tissue of rat. Bratisl. Lek. Listy 2018, 119, 481–489. [Google Scholar] [CrossRef] [Scilit] [PubMed]
  9. Polk, C.; Postow, E. Biological Effects of Electromagnetic Fields, 1st ed.; CRC Press: Boca Raton, FL, USA, 1996. [Google Scholar] [CrossRef] [Scilit]
  10. Bancroft, J.D.; Stevens, A.; Turner, D.R. Theory and Practice of Histological Techniques; Churchill Livingstone: New York, NY, USA; Edinburg, UK, 1996; pp. 126–129. [Google Scholar]
  11. Şenol, N.; Kaya, E.; Coşkun, Ö.; Aslankoç, R.; Çömlekçi, S. Evaluation of the Effects of a 50 Hz Electric Field on Brain Tissue by Immunohistochemical Method, and on Blood Tissue by Biochemical, Physiological and Comet Method. Appl. Sci. 2023, 13, 3276. [Google Scholar] [CrossRef] [Scilit]
  12. Li, D.; Liu, X.; Liu, T.; Liu, H.; Tong, L.; Jia, S.; Wang, Y.F. Neurochemical regulation of the expression and function of glial fibrillary acidic protein in astrocytes. Glia 2020, 68, 878–897. [Google Scholar] [CrossRef] [Scilit] [PubMed]
  13. Gao, P.; Chen, Q.; Hu, J.; Lin, Y.; Lin, J.; Guo, Q.; Yue, H.; Zhou, Y.; Zeng, L.; Li, J.; et al. Effect of ultra-wide-band electromagnetic pulses on blood-brain barrier permeability in rats. Mol. Med. Rep. 2020, 22, 2775–2782. [Google Scholar] [CrossRef] [Scilit] [PubMed]
  14. Akakin, D.; Tok, O.E.; Anil, D.; Akakin, A.; Sirvanci, S.; Sener, G.; Ercan, F. Electromagnetic waves from mobile phones may affect rat brain during development. Turk. Neurosurg. 2021, 31, 412–421. [Google Scholar] [CrossRef] [Scilit] [PubMed]
  15. Ammari, M.; Gamez, C.; Lecomte, A.; Sakly, M.; Abdelmelek, H.; De Seze, R. GFAP Expression in the Rat Brain Following Sub-Chronic Exposure to a 900 MHz Electromagnetic Field Signal. Int. J. Radiat. Biol. 2010, 86, 367–375. [Google Scholar] [CrossRef] [Scilit] [PubMed]
  16. Del Vecchio, G.; Giuliani, A.; Fernandez, M.; Mesirca, P.; Bersani, F.; Pinto, R. Continuous exposure to 900 MHz GSM-modulated EMF alters morphological maturation of neural cells. Neurosci. Lett. 2009, 455, 173–177. [Google Scholar] [CrossRef] [Scilit] [PubMed]
  17. Hussein, S.; El-Saba, A.A.; Galal, M.K. Biochemical and histological studies on adverse effects of mobile phone radiation on rat’s brain. J. Chem. Neuroanat. 2016, 78, 10–19. [Google Scholar] [CrossRef] [Scilit] [PubMed]
  18. Ertilav, K.; Uslusoy, F.; Ataizi, S.; Nazıroğlu, M. Long term exposure to cell phone frequencies (900 and 1800 MHz) induces apoptosis, mitochondrial oxidative stress and TRPV1 channel activation in the hippocampus and dorsal root ganglion of rats. Metab. Brain. Dis. 2018, 33, 753–763. Available online: https://link.springer.com/article/10.1007/s11011-017-0180-4 (accessed on 10 January 2026). [CrossRef] [Scilit] [PubMed]
  19. Dogan, M.; Turtay, M.G.; Oguzturk, H.; Samdanci, E.; Turkoz, Y.; Tasdemir, S.; Bakir, S. Effects of Electromagnetic Radiation Produced by 3G Mobile Phones on Rat Brains: Magnetic Resonance Spectroscopy, Biochemical and Histopathological Evaluation. Hum. Exp. Toxicol. 2012, 31, 557–564. [Google Scholar] [CrossRef] [Scilit] [PubMed]
  20. Celiközlü, S.D.; Ozyurt, M.S.; Cimbiz, A.; Yardimoglu, M.Y.; Cayci, M.K.; Ozay, Y. The Effects of Long-Term Exposure of Magnetic Field via 900-Mhz GSM Radiation on Some Biochemical Parameters and Brain Histology in Rats. Electromagn. Biol. Med. 2012, 31, 344–355. [Google Scholar] [CrossRef] [Scilit] [PubMed]
  21. Seymen, C.M.; Ilgaz, C.; Erdogan, D.; Elmas, C.; Saglam, A.; Elmazoglu, Z.; Aral, B.S.; Kaplanoglu, G.T. Melatonin Modulates NMDA-Receptor 2B/Calpain-1/Caspase-12 Pathways in Rat Brain After Long Time Exposure to GSM Radiation. Turk. Neurosurg. 2019, 29, 887–900. [Google Scholar] [CrossRef] [Scilit] [PubMed]
  22. Lu, H.; Wang, B. SIRT1 exerts neuroprotective effects by attenuating cerebral ischemia/reperfusion-induced injury via targeting p53/microRNA-22. Int. J. Mol. Med. 2017, 39, 208–216. [Google Scholar] [CrossRef] [Scilit] [PubMed]
  23. Shahin, S.; Banerjee, S.; Singh, S.P.; Chaturvedi, C.M. 2.45 GHz microwave radiation impairs learning and spatial memory via oxidative/nitrosative stress induced p53-dependent/independent hippocampal apoptosis: Molecular basis and underlying mechanism. Toxicol. Sci. 2015, 148, 380–399. [Google Scholar] [CrossRef] [Scilit] [PubMed]
  24. Motawi, T.K.; Darwish, H.A.; Moustafa, Y.M.; Labib, M.M. Biochemical Modifications and Neuronal Damage in Brain of Young and Adult Rats after Long-Term Exposure to Mobile Phone Radiations. Cell. Biochem. Biophys. 2014, 70, 845–855. [Google Scholar] [CrossRef] [Scilit] [PubMed]
  25. Tarsaei, M.; Peyrovan, Z.S.; Mahdavi, S.M.; Chahardehi, A.M.; Vafaee, R.; Haidari, M.H. Effects of 2.45 GHz Non-Ionizing Radiation on Anxiety-Like Behavior, Gene Expression, and Corticosterone Level in Male Rats. J. Lasers Med. Sci. 2022, 13, e56. [Google Scholar] [CrossRef] [Scilit] [PubMed]
  26. Rasheed, Z.; Haqqi, T.M. Endoplasmic reticulum stress induces the expression of COX-2 through activation of eIF2α, p38-MAPK and NF-κB in advanced glycation end products stimulated human chondrocytes. Biochim. Biophys. Acta 2012, 1823, 2179–2189. [Google Scholar] [CrossRef] [Scilit] [PubMed]
  27. Soliman, E.; Henderson, K.L.; Danell, A.S.; Van Dross, R. Arachidonoyl-ethanolamide activates endoplasmic reticulum stress-apoptosis in tumorigenic keratinocytes: Role of cyclooxygenase-2 and novel J-series prostamides. Mol. Carcinog. 2016, 55, 117–130. [Google Scholar] [CrossRef] [Scilit] [PubMed]
  28. Lebeaupin, C.; Blanc, M.; Vallée, D.; Keller, H.; Bailly-Maitre, B. BAX inhibitor-1: Between stress and survival. FEBS J. 2020, 287, 1722–1736. [Google Scholar] [CrossRef] [Scilit] [PubMed]
  29. Sato, A.; Mizobuchi, Y.; Nakajima, K.; Shono, K.; Fujihara, T.; Kageji, T.; Nagahirao, S. Blocking COX-2 induces apoptosis and inhibits cell proliferation via the Akt/survivin-and Akt/ID3 pathway in low-grade-glioma. J. Neurooncol. 2017, 132, 231–238. [Google Scholar] [CrossRef] [Scilit] [PubMed] [PubMed Central]
Figure 1. Exposure setup.
Applsci 16 02376 g001
Figure 2. (a) Degenerations and vacuolizations in 2100 MHz EMF group neurons (+2) (arrow), H&E, ×40; (b) degenerations, vacuolizations in neurons of 2450 MHz EMF group (+2) (arrow), H&E, ×40; (c) degenerations, vacuolizations in 2100 MHz + ginseng group neurons (+1) (arrow), H&E, ×40; (d) degenerations, vacuolizations in 2450 MHz + ginseng group neurons (+1) (arrow), H&E, ×40; (e) ginseng group, normal-looking neurons (arrow), H&E, ×40; (f) sham group, normal-looking neurons (arrow), H&E, ×40; (g) control group, normal looking neurons (arrow), H&E, ×40.
Applsci 16 02376 g002
Figure 3. (a) Control group BBB ZO-1 immune-positive cells (+2) (arrow), ×40; (b) control group BBB occludin immune-positive cells (+2) (arrow), ×40; (c) 2100 MHz + ginseng group occludin immune-positive cells (+2), ×40; (d) 2100 MHz EMF group occludin immune-positive cells (+1) (arrow), ×40; (e) 2450 MHz + ginseng group ZO-1 immune-positive cells (+2), ×40; (f) 2100 MHz EMF group ZO-1 immune-positive cells (+1) (arrow), ×40.
Applsci 16 02376 g003
Figure 4. (a) Control group astrocyte GFAP immune-positive cells (+3) (arrows), ×40; (b) control group astrocyte AQP-4 immune-positive cells (+3) (arrows), ×40; (c) 2100 MHz + ginseng group astrocyte GFAP immune-positive cells (+3) (arrows), ×40; (d) 2100 MHz EMF group astrocyte GFAP immune-positive cells (+2) (arrows), ×40; (e) 2450 MHz EMF group astrocyte GFAP immune-positive cells (+2) (arrows), ×40; (f) 2450 MHz EMF group astrocyte AQP-4 immune-positive cells (+2) (arrows), ×40; (g) 2100 MHz EMF group astrocyte AQP-4 immune-positive cells (+2) (arrows), ×40.
Applsci 16 02376 g004
Figure 5. (a) 2100 MHz EMF band, TUNEL positive cells (+2) (arrows), ×40; (b) 2450 MHz EMF group, TUNEL positive cells (+2) (arrows), ×40; (c) 2100 MHz + ginseng group, TUNEL positive cells (+1) (arrows), ×40; (d) 2450 MHz + ginseng group, TUNEL positive cells (+1) (arrows), ×40; (e) ginseng group, TUNEL negative cells, (arrows), ×40; (f) sham group, TUNEL negative cells, (arrows), ×40; (g) control group, TUNEL negative cells, (arrows), ×40.
Applsci 16 02376 g005
Figure 6. Average expression change graph of COX-2 gene by groups (different lowercase letters above the bars indicate statistically significant differences between groups (p ≤ 0.05).
Applsci 16 02376 g006
Figure 7. BAX protein concentration variation (different lowercase letters above the bars indicate statistically significant differences between groups (p < 0.05), whereas groups sharing at least one common letter are not significantly different from each other).
Applsci 16 02376 g007
Table 1. Electrical properties of rat brain tissue at 2100 MHz and 2450 MHz.
FrequencyConductivity (S/m)Relative Dielectric Constant
2100 MHz0.8613.67
2450 MHz1.544.8
Table 2. SAR values calculated in rat brain tissue at different frequencies.
FrequencySAR (mW/kg)
2100 MHz56.29
2450 MHz98.66
Table 3. Statistical evaluation of histopathological scoring.
GroupHistopathological Score (Mean ± SD)p Value
Control0.17 ± 0.41 a<0.001
Sham1.17 ± 0.41 b
Ginseng0.17 ± 0.41 a
2100 MHz EMF2.00 ± 0.63 c
2450 MHz EMF2.00 ± 0.63 c
2100 MHz + Ginseng1.17 ± 0.41 b
2450 MHz + Ginseng1.17 ± 0.41 b
Different superscript letters (a–c) indicate statistically significant differences between groups (p < 0.05). A significant increase was observed in the sham group compared to the control group (p = 0.006). Significant increases were observed in the 2100 MHz EMF and 2450 MHz EMF groups compared to the control (p = 0.003) and sham (p = 0.026) groups. When comparing the 2100 MHz EMF-2100 MHz EMF + ginseng and 2450 MHz EMF-2450 MHz EMF + ginseng groups, significant decreases were observed in the ginseng-treated groups compared to the EMF groups (p = 0.026).
Table 4. Statistical evaluation of ZO-1 and occludin immune-positive cell density of the groups.
GroupImmune Positive
Cell Density (Mean ± SD)
p Value
Control2.17 ± 0.75 a0.007
Sham2.17 ± 0.75 a
Ginseng2.17 ± 0.75 a
2100 MHz EMF1.17 ± 0.41 b
2450 MHz EMF1.17 ± 0.41 b
2100 MHz + Ginseng2.17 ± 0.75 a
2450 MHz + Ginseng2.17 ± 0.75 a
Different superscript letters (a, b) indicate statistically significant differences between groups (p < 0.05). There was no significant difference between the control, sham, and ginseng groups (all a, p = 1.00). A significant decrease in immune-positive cell density was observed in the 2100 MHz EMF and 2450 MHz EMF groups (b) compared to the control group (a, p = 0.023) and sham group (a, p = 0.023). No significant difference was found between the 2100 MHz EMF and 2450 MHz EMF groups (both b, p = 1.00). Furthermore, immune-positive cell density was higher in the 2100 MHz EMF + ginseng and 2450 MHz EMF + ginseng groups (a) compared to the corresponding EMF-only groups (b), and these increases were statistically significant (p = 0.023 for both comparisons).
Table 5. Statistical evaluation of GFAP and AQP-4 immune-positive cell density of the groups.
GroupImmune Positive
Cell Density (Mean ± SD)
p Value
Control2.83 ± 0.41 a0.005
Sham2.83 ± 0.41 a
Ginseng2.83 ± 0.41 a
2100 MHz EMF2.17 ± 0.41 b
2450 MHz EMF2.17 ± 0.41 b
2100 MHz + Ginseng2.83 ± 0.41 a
2450 MHz + Ginseng2.83 ± 0.41 a
Different superscript letters (a, b) indicate statistically significant differences between groups (p < 0.05). Since the data were not normally distributed, the Kruskal–Wallis test was applied, revealing a statistically significant difference between groups (p = 0.005). According to pairwise comparisons using the Mann–Whitney U test, no significant difference was observed between the Control, Sham, and Ginseng groups (all a, p = 1.00). Compared to the control group, the decrease in the 2100 MHz EMF and 2450 MHz EMF groups was statistically significant (a vs. b, p = 0.027). No significant difference was found between the 2100 MHz EMF and 2450 MHz EMF groups (both b, p = 1.00). The 2100 MHz EMF + ginseng group showed a significant increase compared to the 2100 MHz EMF group (p = 0.027). Similarly, when comparing the 2450 MHz EMF + ginseng and 2450 MHz EMF group, a significant increase was observed in the group treated with ginseng (p = 0.027).
Table 6. Statistical evaluation of immune-positive apoptotic cell scoring.
GroupApoptotic Damage Score (Mean ± SD)p Value
Control0.17 ± 0.41 a<0.001
Sham0.17 ± 0.41 a
Ginseng0.17 ± 0.41 a
2100 MHz EMF2.33 ± 0.52 b
2450 MHz EMF2.33 ± 0.52 b
2100 MHz+ Ginseng1.33 ± 0.52 c
2450 MHz + Ginseng1.33 ± 0.52 c
Different superscript letters (a–c) indicate statistically significant differences between groups (p < 0.05). According to the Kruskal–Wallis test results, the difference between the groups was statistically significant (p < 0.001). According to the Mann–Whitney U test in pairwise comparisons, there was no significant difference between control, sham and ginseng groups (p = 1.00). When the 2100 MHz and 2450 MHz EMF groups are compared with the control and sham groups, a significant increase was observed in the EMF groups compared to the control and sham groups (p = 0.002). However, when the 2100 MHz and 2450 MHz EMF groups were compared within themselves, no significant difference was observed (p = 1.00). There was a significant decrease in the 2100 MHz + ginseng group compared to the 2100 MHz EMF group (p = 0.014). There was a significant decrease in the 2450 MHz + ginseng group compared to the 2450 MHz EMF group (p = 0.014).
Disclaimer/Publisher’s Note: The statements, opinions and data contained in all publications are solely those of the individual author(s) and contributor(s) and not of MDPI and/or the editor(s). MDPI and/or the editor(s) disclaim responsibility for any injury to people or property resulting from any ideas, methods, instructions or products referred to in the content.