Article

Phase Reconstruction and Unwrapping Method for InSAR Building Layover Areas in Complex Scenes Integrated with YOLOv11

1
Institute of Geospatial Information, Information Engineering University, Zhengzhou 450001, China
2
National Key Laboratory of Intelligent Spatial Information, Beijing 100094, China
3
School of Remote Sensing Engineering, Henan College of Surveying and Mapping, Zhengzhou 450001, China
*
Author to whom correspondence should be addressed.
Appl. Sci. 2026, 16(5), 2372; https://doi.org/10.3390/app16052372
Submission received: 31 January 2026 / Revised: 20 February 2026 / Accepted: 27 February 2026 / Published: 28 February 2026
(This article belongs to the Section Earth Sciences)

Abstract

Aimed at the problems of severe layover, interferometric phase aliasing and phase jumps caused by dense urban features, which lead to difficulties in phase unwrapping and insufficient automation and intelligence in building areas under complex scenes, this paper proposes a phase reconstruction and unwrapping method for interferometric synthetic aperture radar (InSAR) building layover areas in complex scenarios integrated with YOLOv11. Based on a self-constructed dedicated dataset, the YOLOv11 object detection network is trained to identify and locate building layover areas in synthetic aperture radar (SAR) images and extract their original interferometric phases. On this basis, by integrating the building facade interferometry model and the interferometric phase gradient model, regions dominated by facade scattering are effectively identified, and their interferometric phases are reconstructed to reduce scattering interference from non-relevant areas. Finally, the reconstructed phase is unwrapped using a quality-guided phase unwrapping method. Experimental results demonstrate that the proposed method can automatically and intelligently achieve phase unwrapping in building areas under complex scenes, providing reliable technical support for urban deformation monitoring and 3D reconstruction.

1. Introduction

Synthetic aperture radar (SAR) enables all-day and all-weather imaging due to its unique imaging mechanism and technical characteristics. With the advancement of related technologies such as information technology, photogrammetry, and digital signal processing, interferometric synthetic aperture radar (InSAR) technology has also developed rapidly, demonstrating significant research value and application potential in areas such as urban three-dimensional reconstruction, urban planning, and dynamic monitoring. However, in complex scenes with densely distributed buildings, phenomena such as layover, shadowing, and decorrelation caused by the geometric relationship between building structures and the sensor pose challenges for phase unwrapping in InSAR technology [1,2,3,4].
Current research on InSAR phase unwrapping specifically for building areas remains relatively limited. Traditional InSAR processing often treats building regions as challenging areas, applying filtering or similar techniques to partially suppress the chaotic phase patterns therein. For instance, Lin [5] proposed an adaptive iterative non-local interferometric phase filtering method. This approach adaptively computes weights based on the probability distribution characteristics of the interferometric phase and performs iterative filtering on the real and imaginary parts in the complex domain to avoid phase jumps. While this method significantly reduces the number of residues while preserving fringe information, it primarily recovers large-scale topographic trends and does not aim to retain fine details such as building heights. Consequently, its data support capability is relatively limited for applications requiring high-precision 3D information, such as urban 3D reconstruction [6,7,8].
With the continuous improvement in the resolution of SAR images, their potential for detailed extraction of height information for surface objects is increasingly evident. Numerous scholars have conducted research on utilizing InSAR technology to extract building heights, where phase unwrapping in building areas has consistently remained a key challenge [9,10,11]. Wang [12] established a phase model for InSAR layover areas, derived the phase characteristics of layover regions, and proposed a phase reconstruction method tailored to these characteristics. Stilla [13] conducted an in-depth analysis of the causes of phenomena such as layover, shadowing, and multiple scattering. Using high-precision airborne LiDAR data as a reference for the true ground surface, they predicted the spatial distribution of layover and shadow areas in a scene under given SAR sensor parameters through geometric-optical simulation. Their quantitative analysis indicated that only 43% of building areas can yield reliable interferometric data. Rossi [14] utilized the mapping counter generated during the geocoding stage of InSAR processing to identify building layover areas by detecting regular patterns of multiple mappings and non-mapped regions. For each detected layover patch, they performed spectrum analysis, employing both non-parametric Fast Fourier Transform and parametric super-resolution algorithms to estimate the fringe frequencies contained within the layover signal, thereby inferring its main scattering components. Zhuang [15] developed a general interferometric model and an interferometric phase gradient model suitable for complex scenarios. They used these models to reconstruct a complete “pure” facade interferometric phase, enabling phase unwrapping in building areas and the subsequent inversion of building heights. Wang [6] acquired building interferometric phase maps and information on the number of layover components. They proposed a building-area-oriented simulation method for interferometric SAR complex image pairs and analyzed the patterns of phase variation based on the simulation results, providing guidance for reference phase determination during phase unwrapping in building regions.
However, when confronting complex urban building scenes with issues such as phase jumps and severe layover, the aforementioned methods often lack efficient, robust, and easily operable phase unwrapping solutions, exhibiting insufficient automation and intelligent processing capabilities. Given the powerful feature extraction and pattern recognition capabilities demonstrated by deep learning in the remote sensing field [16,17,18,19,20,21], this paper proposes a phase reconstruction and unwrapping method for InSAR building layover areas in complex scenarios integrated with YOLOv11. This method introduces deep learning technology during the layover area identification stage, integrating it with existing research on physical modeling and processing strategies for layover phases. It constructs an automated workflow from intelligent SAR image recognition to adaptive phase unwrapping, thereby advancing InSAR technology toward greater intelligence and automation in phase unwrapping for complex building areas. This lays a solid data foundation for related research in urban deformation monitoring, 3D reconstruction technology, and other applications.

2. Methods

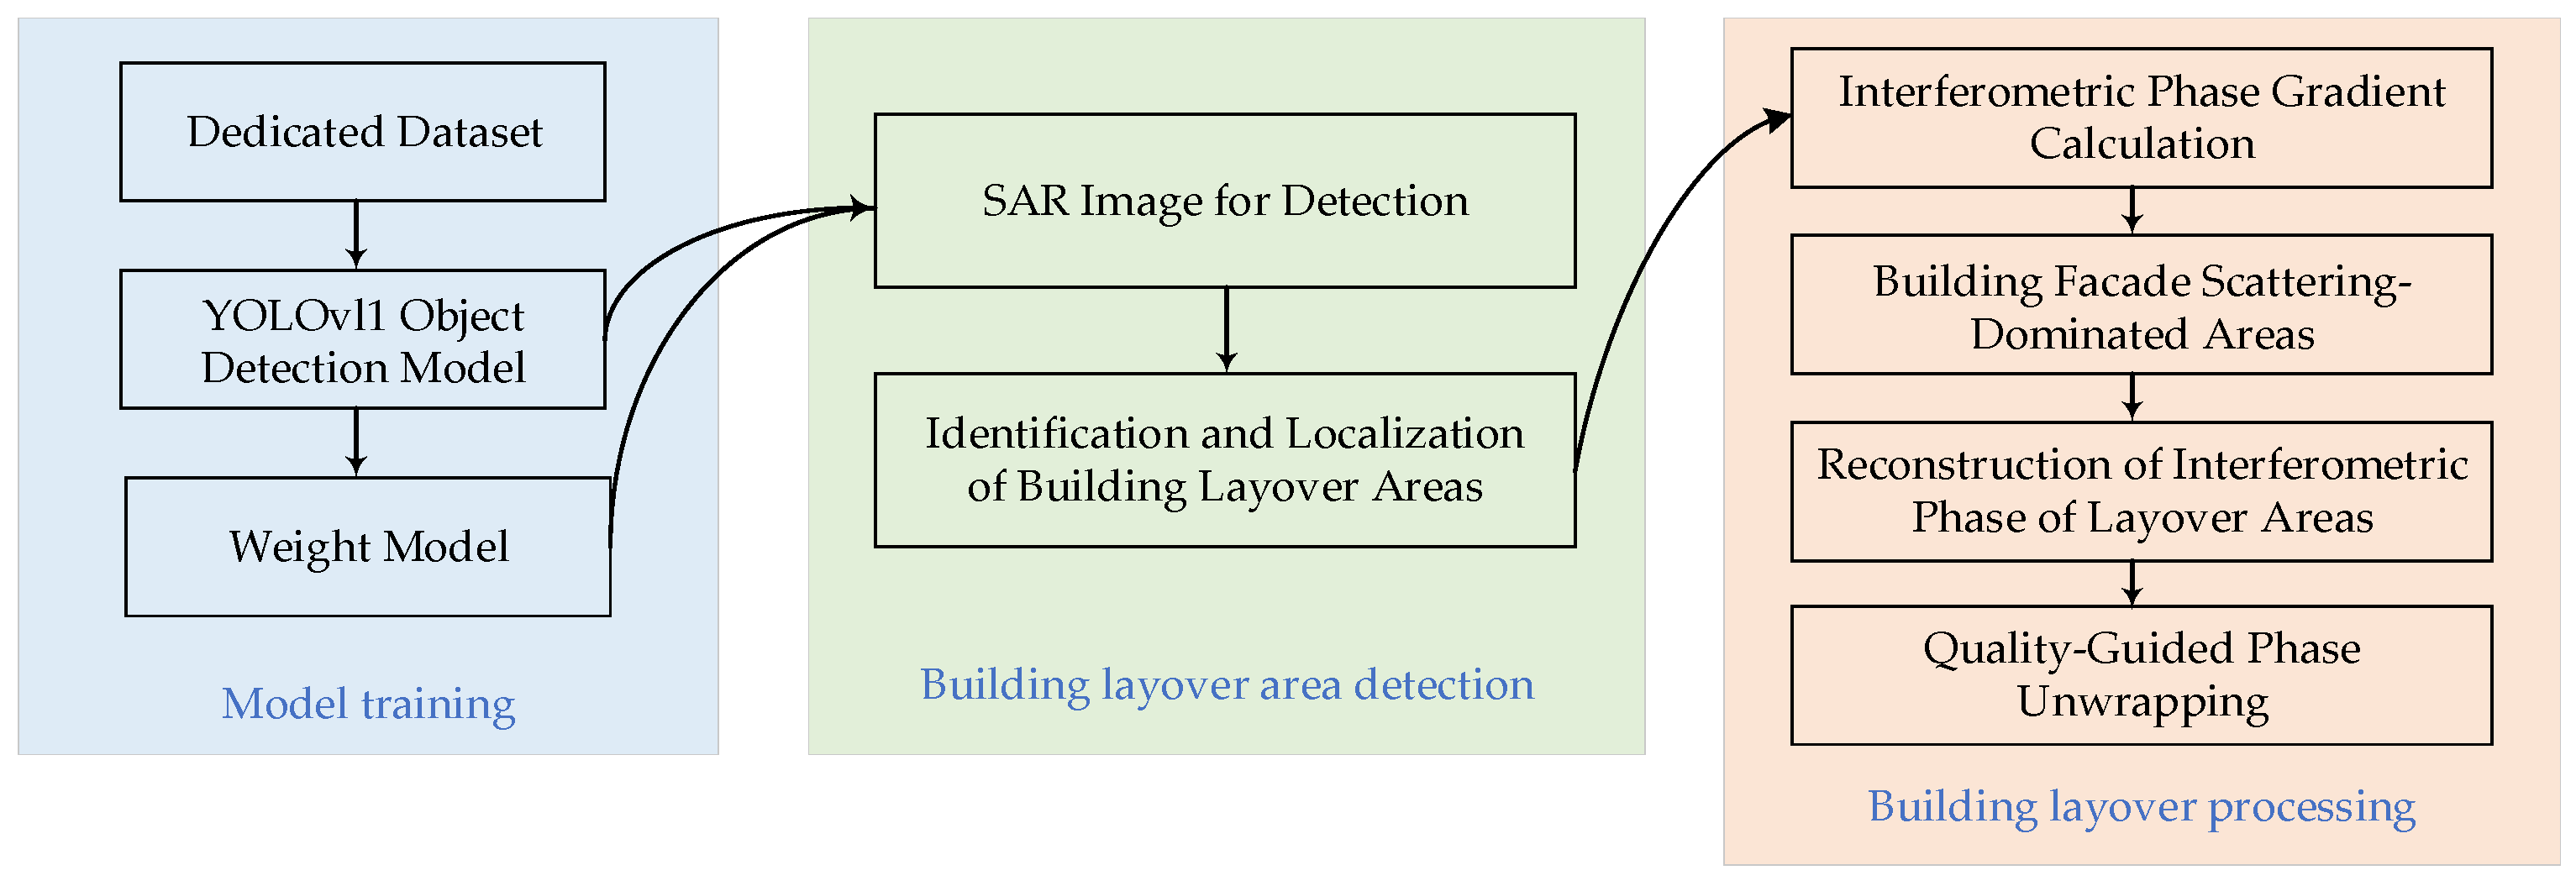
To address the challenges posed by aliasing in the layover areas of buildings in SAR images under complex scenes, as well as the phase jumps caused by dramatic height variations between buildings and the surrounding ground—which significantly increase the difficulty of phase unwrapping—this paper proposes a method for phase reconstruction and unwrapping in InSAR building layover areas tailored to complex scenarios. This method represents the original research work of the authors, with its core innovation primarily reflected in both the overall architectural design of the algorithm and the specific implementation strategy. The detailed workflow of the proposed method is illustrated in Figure 1.
Given the current lack of publicly available datasets, this study constructed a dedicated dataset for detecting building layover areas in SAR images through manual annotation, which was used to train the YOLOv11 object detection model. Subsequently, the SAR images to be processed are input into the trained network to obtain the locations of building layover areas and their corresponding original interferometric phase information. Building on this, the ideal phase gradient for these areas is calculated using the building facade interferometric phase gradient model. By taking this theoretical gradient as a reference, pixels within the layover areas where facade scattering dominates can be identified. Finally, by integrating the above information, the pure interferometric phase of the building facade is reconstructed, followed by the application of a quality-guided phase unwrapping method to achieve automated and intelligent phase unwrapping for the building areas in the SAR images.

2.1. Analysis and Modeling of Building Scattering in Complex Scenes

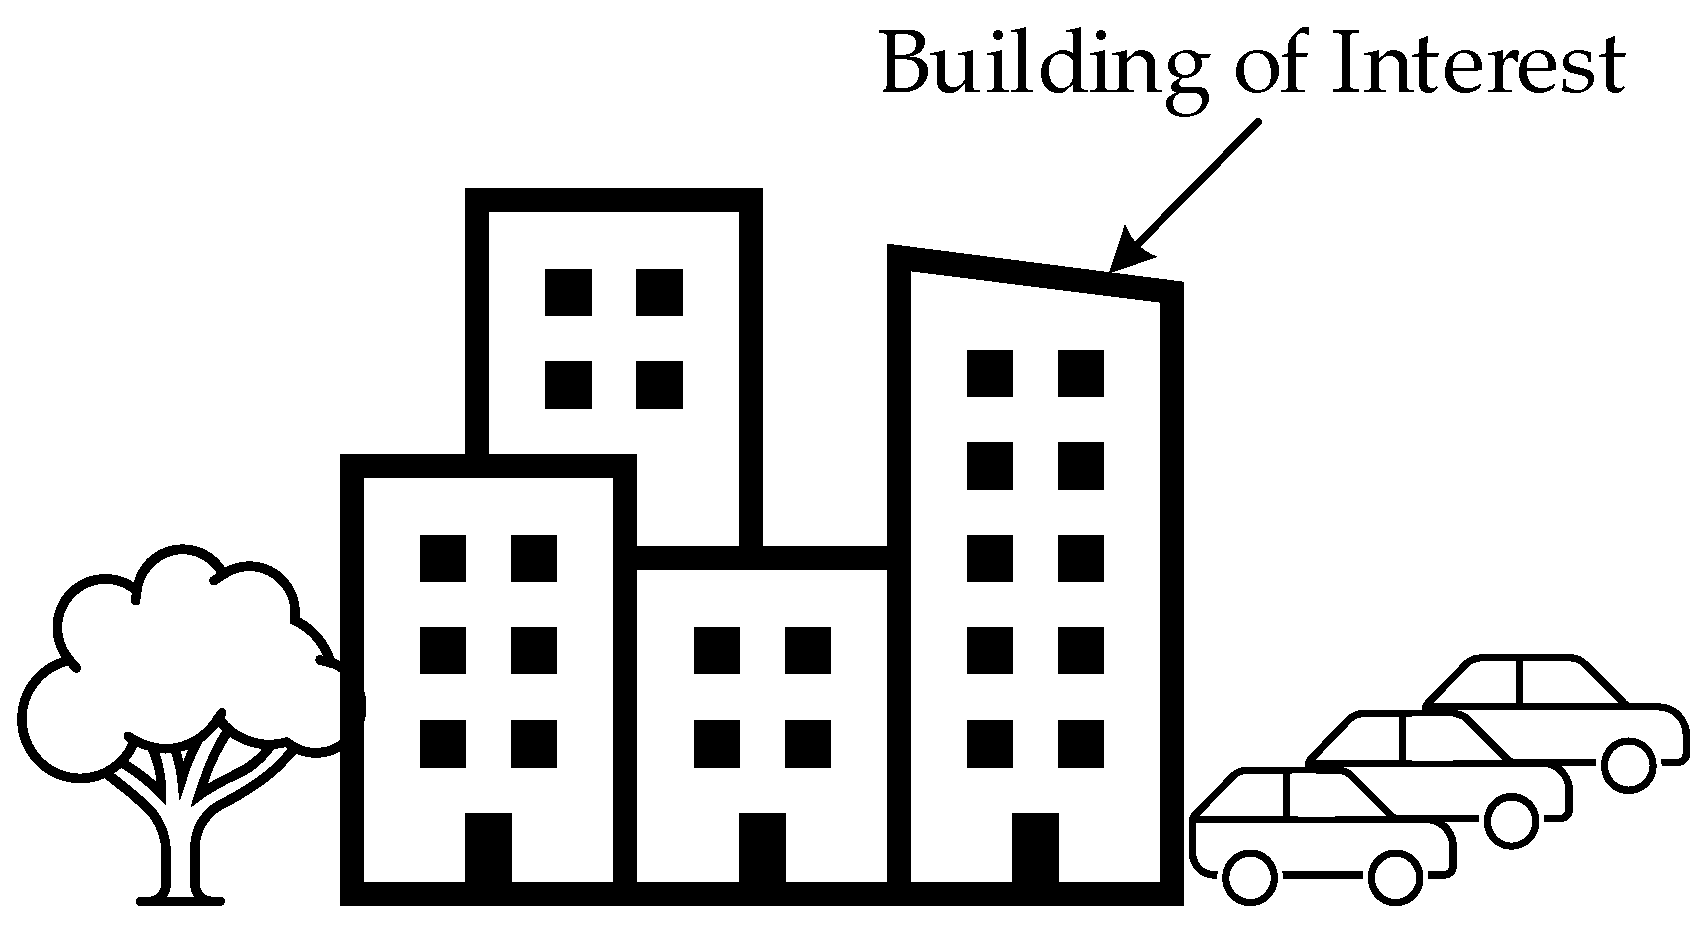
In this section, the scattering characteristics and formation of the layover area are analyzed in depth on the basis of the geometric mechanism underlying SAR imaging, and the interferometric phase characteristics of buildings in complex scenes are obtained, providing a theoretical basis for the subsequent interferometric phase optimization and height reconstruction. A “complex scene” generally refers to a scene in which there are interfering objects, such as vegetation, adjacent nontarget buildings, and other man-made objects, in a building layover area (Figure 2).
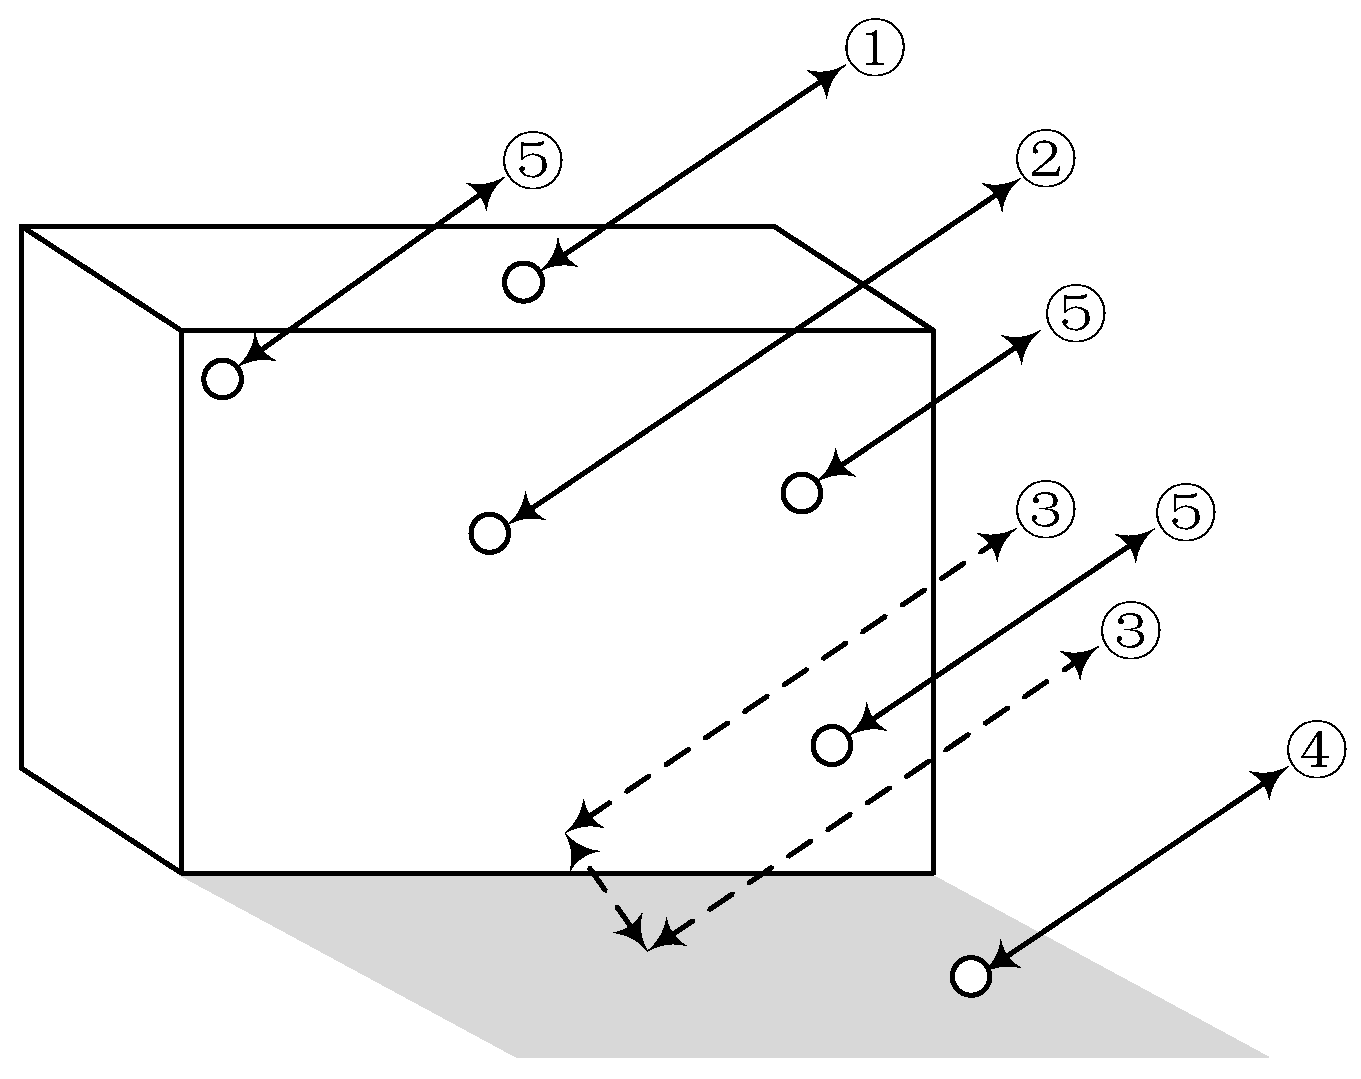
In a complex scene, the types of scattering in the building layover area include mainly the scattering from the building facade and roof as well as the strong secondary scattering from a structure with a dihedral angle formed by the building facade and the ground, which typically manifests as a prominent, bright feature in SAR images. For other nontarget buildings, the scattering mechanism is similar to that of the building of interest, but the scattering intensity is different because of differences in geometric structures and materials. In addition, volumetric scattering can be caused by canopies, and diffuse reflection can arise from vegetation. Based on the analysis of the scattering mechanism and the equivalence principle, a complex scattering model for buildings in complex scenes is established, as shown in Figure 3. In this model, the following types of scattering exist [15]:
① Equivalent surface scattering of the building roof;
② Equivalent surface scattering of the building facade;
③ Strong secondary scattering produced by the dihedral angle of the structure formed between the building facade and the ground;
④ Equivalent surface scattering of the ground;
⑤ Equivalent surface scattering from different interfering objects, including vegetation, nontarget buildings, and other man-made structures, but the specific scattering location, range, and intensity of these interfering objects cannot be determined.
By analyzing the scattering composition in Figure 3, the received signal of the same pixel with the same slant range can be expressed as follows:
s = A r + A f + A g e j 2 π λ R + i = 1 N A inter i e j 2 π λ R ,
where A r , A f , A g , and A i n t e r represent the scattering components generated by the building facade, building roof, ground and other interfering objects, respectively; R represents the slant length of the scattering point; λ represents the wavelength of the electromagnetic wave; and N represents the total number of scattering points, which is usually not fixed and unknown.
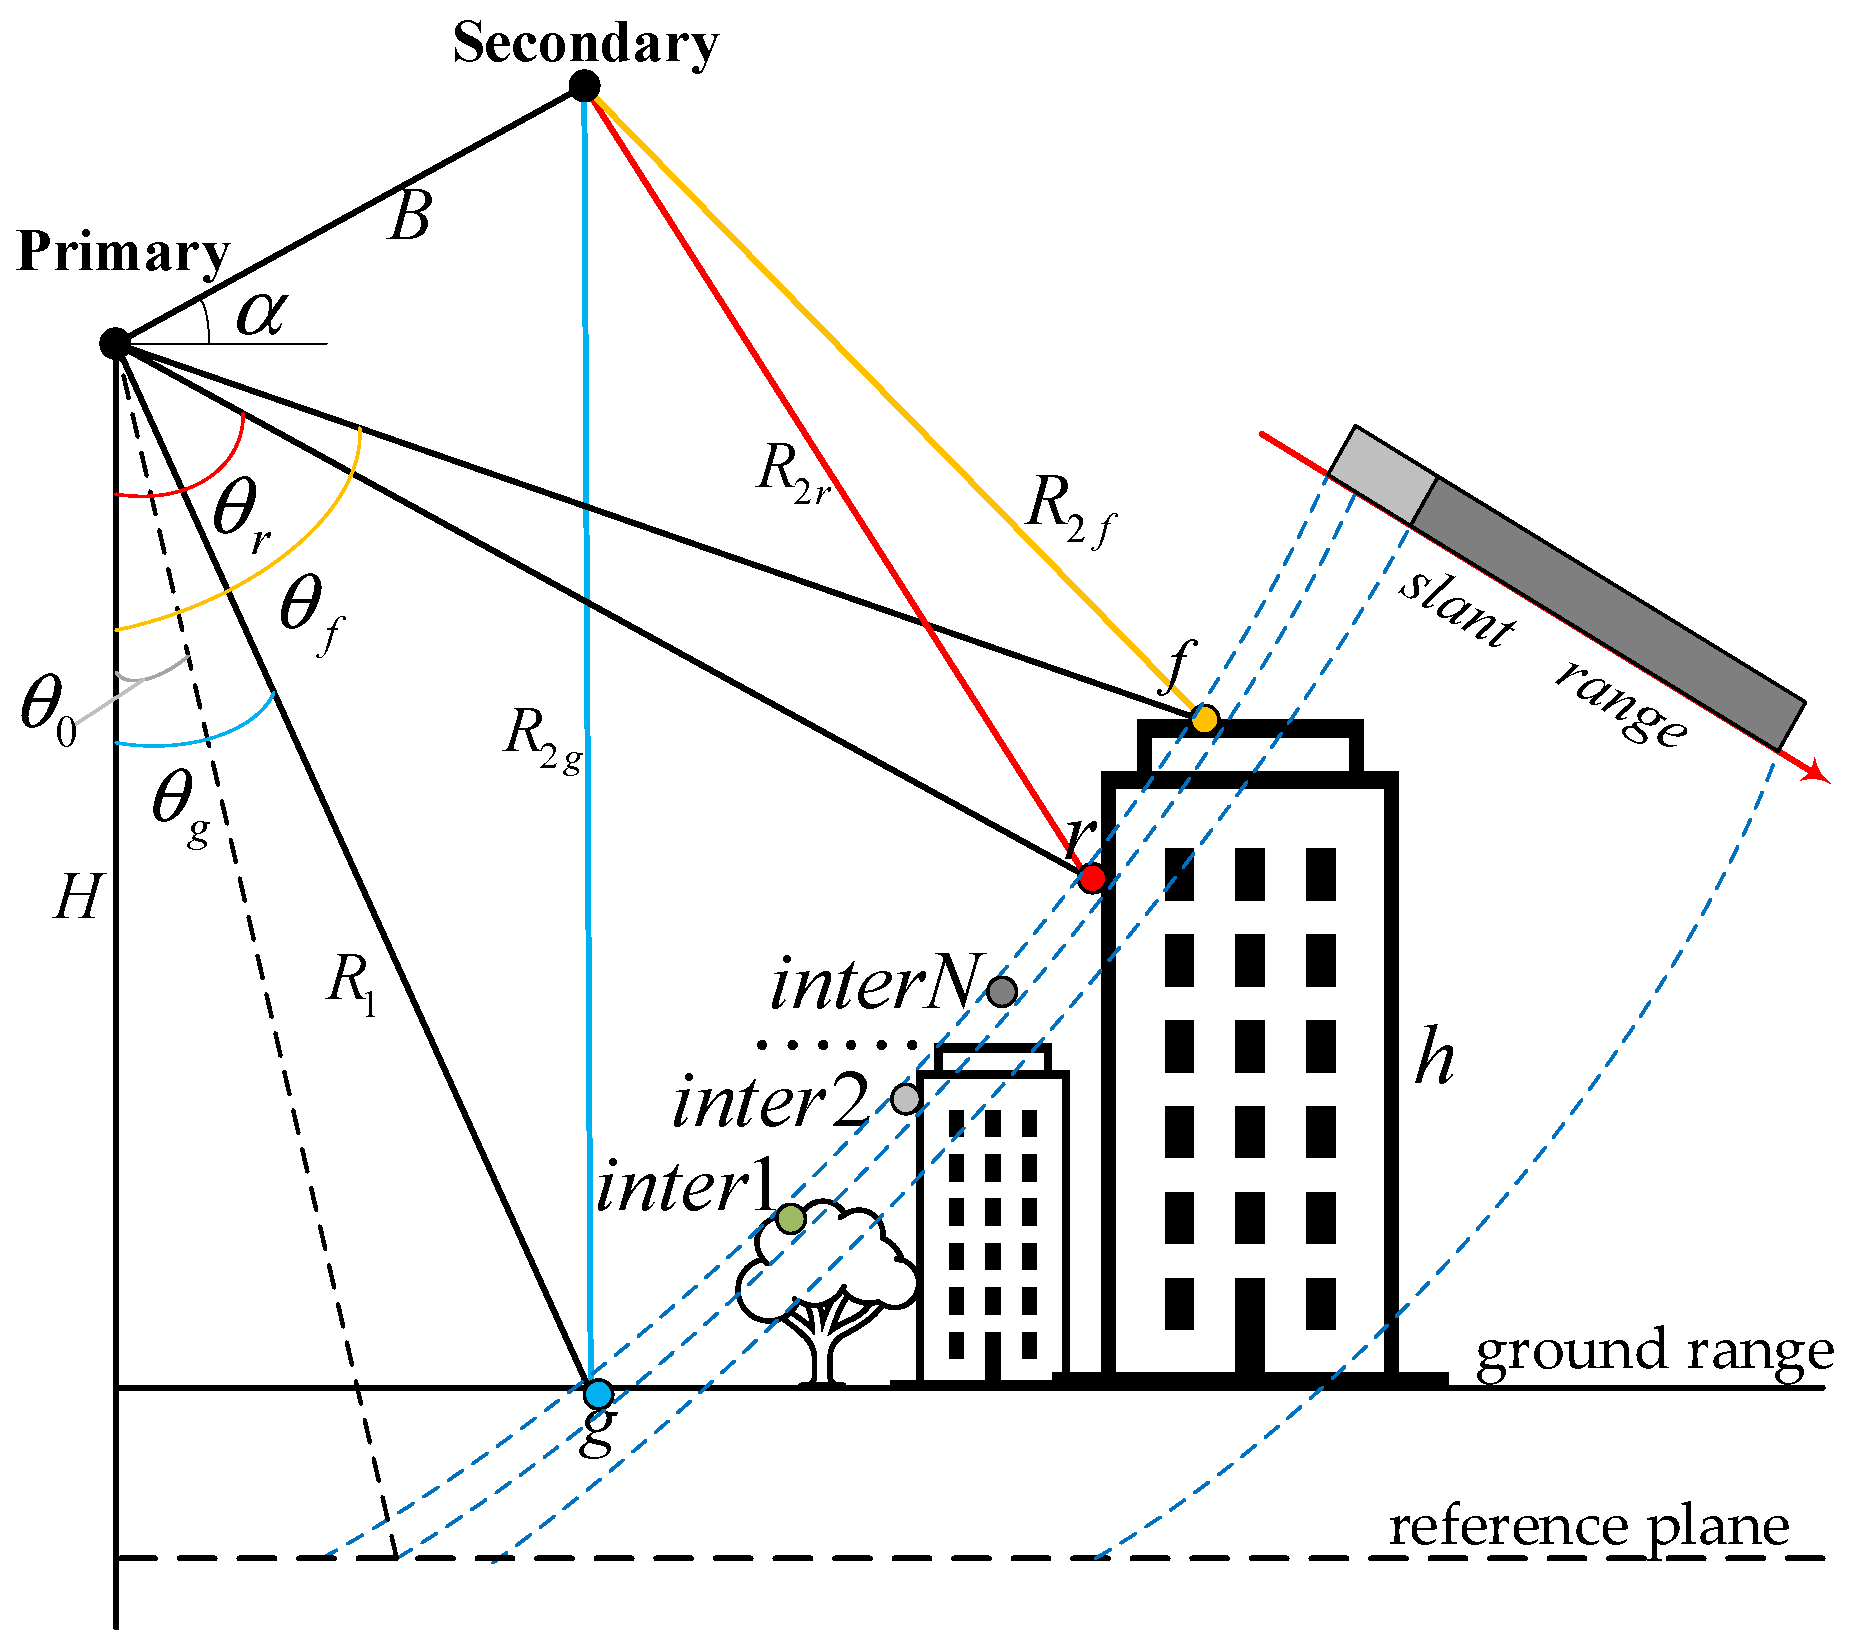
After the scattering model is extended to an InSAR system, the scattering behavior of buildings in a complex scene is as shown in Figure 4. The interferometric phase of the building layover area in the SAR image is the vector superposition of the interferometric results of multiple scattering points and not only the scattering of the building itself. Therefore, the height represented by the interferometric phase in the layover area is actually the height of an equivalent scattering point, which deviates from the height of an independent scattering point or a building facade scattering point in the layover area.
To isolate the interference phase corresponding solely to the building facade from the mixed superimposed interference phases, further analysis of the building facade interference phase is required. If only building facade scattering exists or building facade scattering predominates in the layover area, then A r A f , A g , A i n t e r holds, and the building facade interferometric model can be derived as follows [15]:
s 1 s 2 = A r 2 e j 2 π λ R 1 R 2 r A r 2 e j 2 π λ B sin ( θ 0 α ) + 2 π B cos ( θ 0 α ) λ R 1 sin θ 0 h r ,
where A r 2 represents the product of the building facade scattering intensity in the master and auxiliary images; h r represents the height of the building facade scattering point relative to the reference plane; B represents the length of the baseline; θ 0 represents the side view angle of the scattering point on the reference plane; R 1 and R 2 r represent the slant ranges of the ground scattering point and building facade scattering point, respectively; and α represents the angle between the baseline and the horizontal plane.
According to Equation (2), the interferometric phase gradient model of the building facade along the slant range direction can be further derived as follows:
Δ ϕ = 2 π B cos ( θ 0 α ) λ R 0 tan θ 0 M s l a n t + 2 π B cos ( θ 0 α ) λ R 0 sin θ 0 H R 0 2 l db 2 + 2 π B cos ( θ 1 α ) λ R 1 sin θ 1 H R 0 + M s l a n t 2 l db 2 ,
where M s l a n t is the sampling interval along the slant range direction; θ 0 and θ 1 represent the side view angles of two adjacent resolution units; R 0 and R 1 are the slant ranges of two adjacent resolution units; H is the satellite height; and l d b represents the distance from the subsatellite point to the bottom of the target building.

2.2. Identification of the Building Layover Area in SAR Images

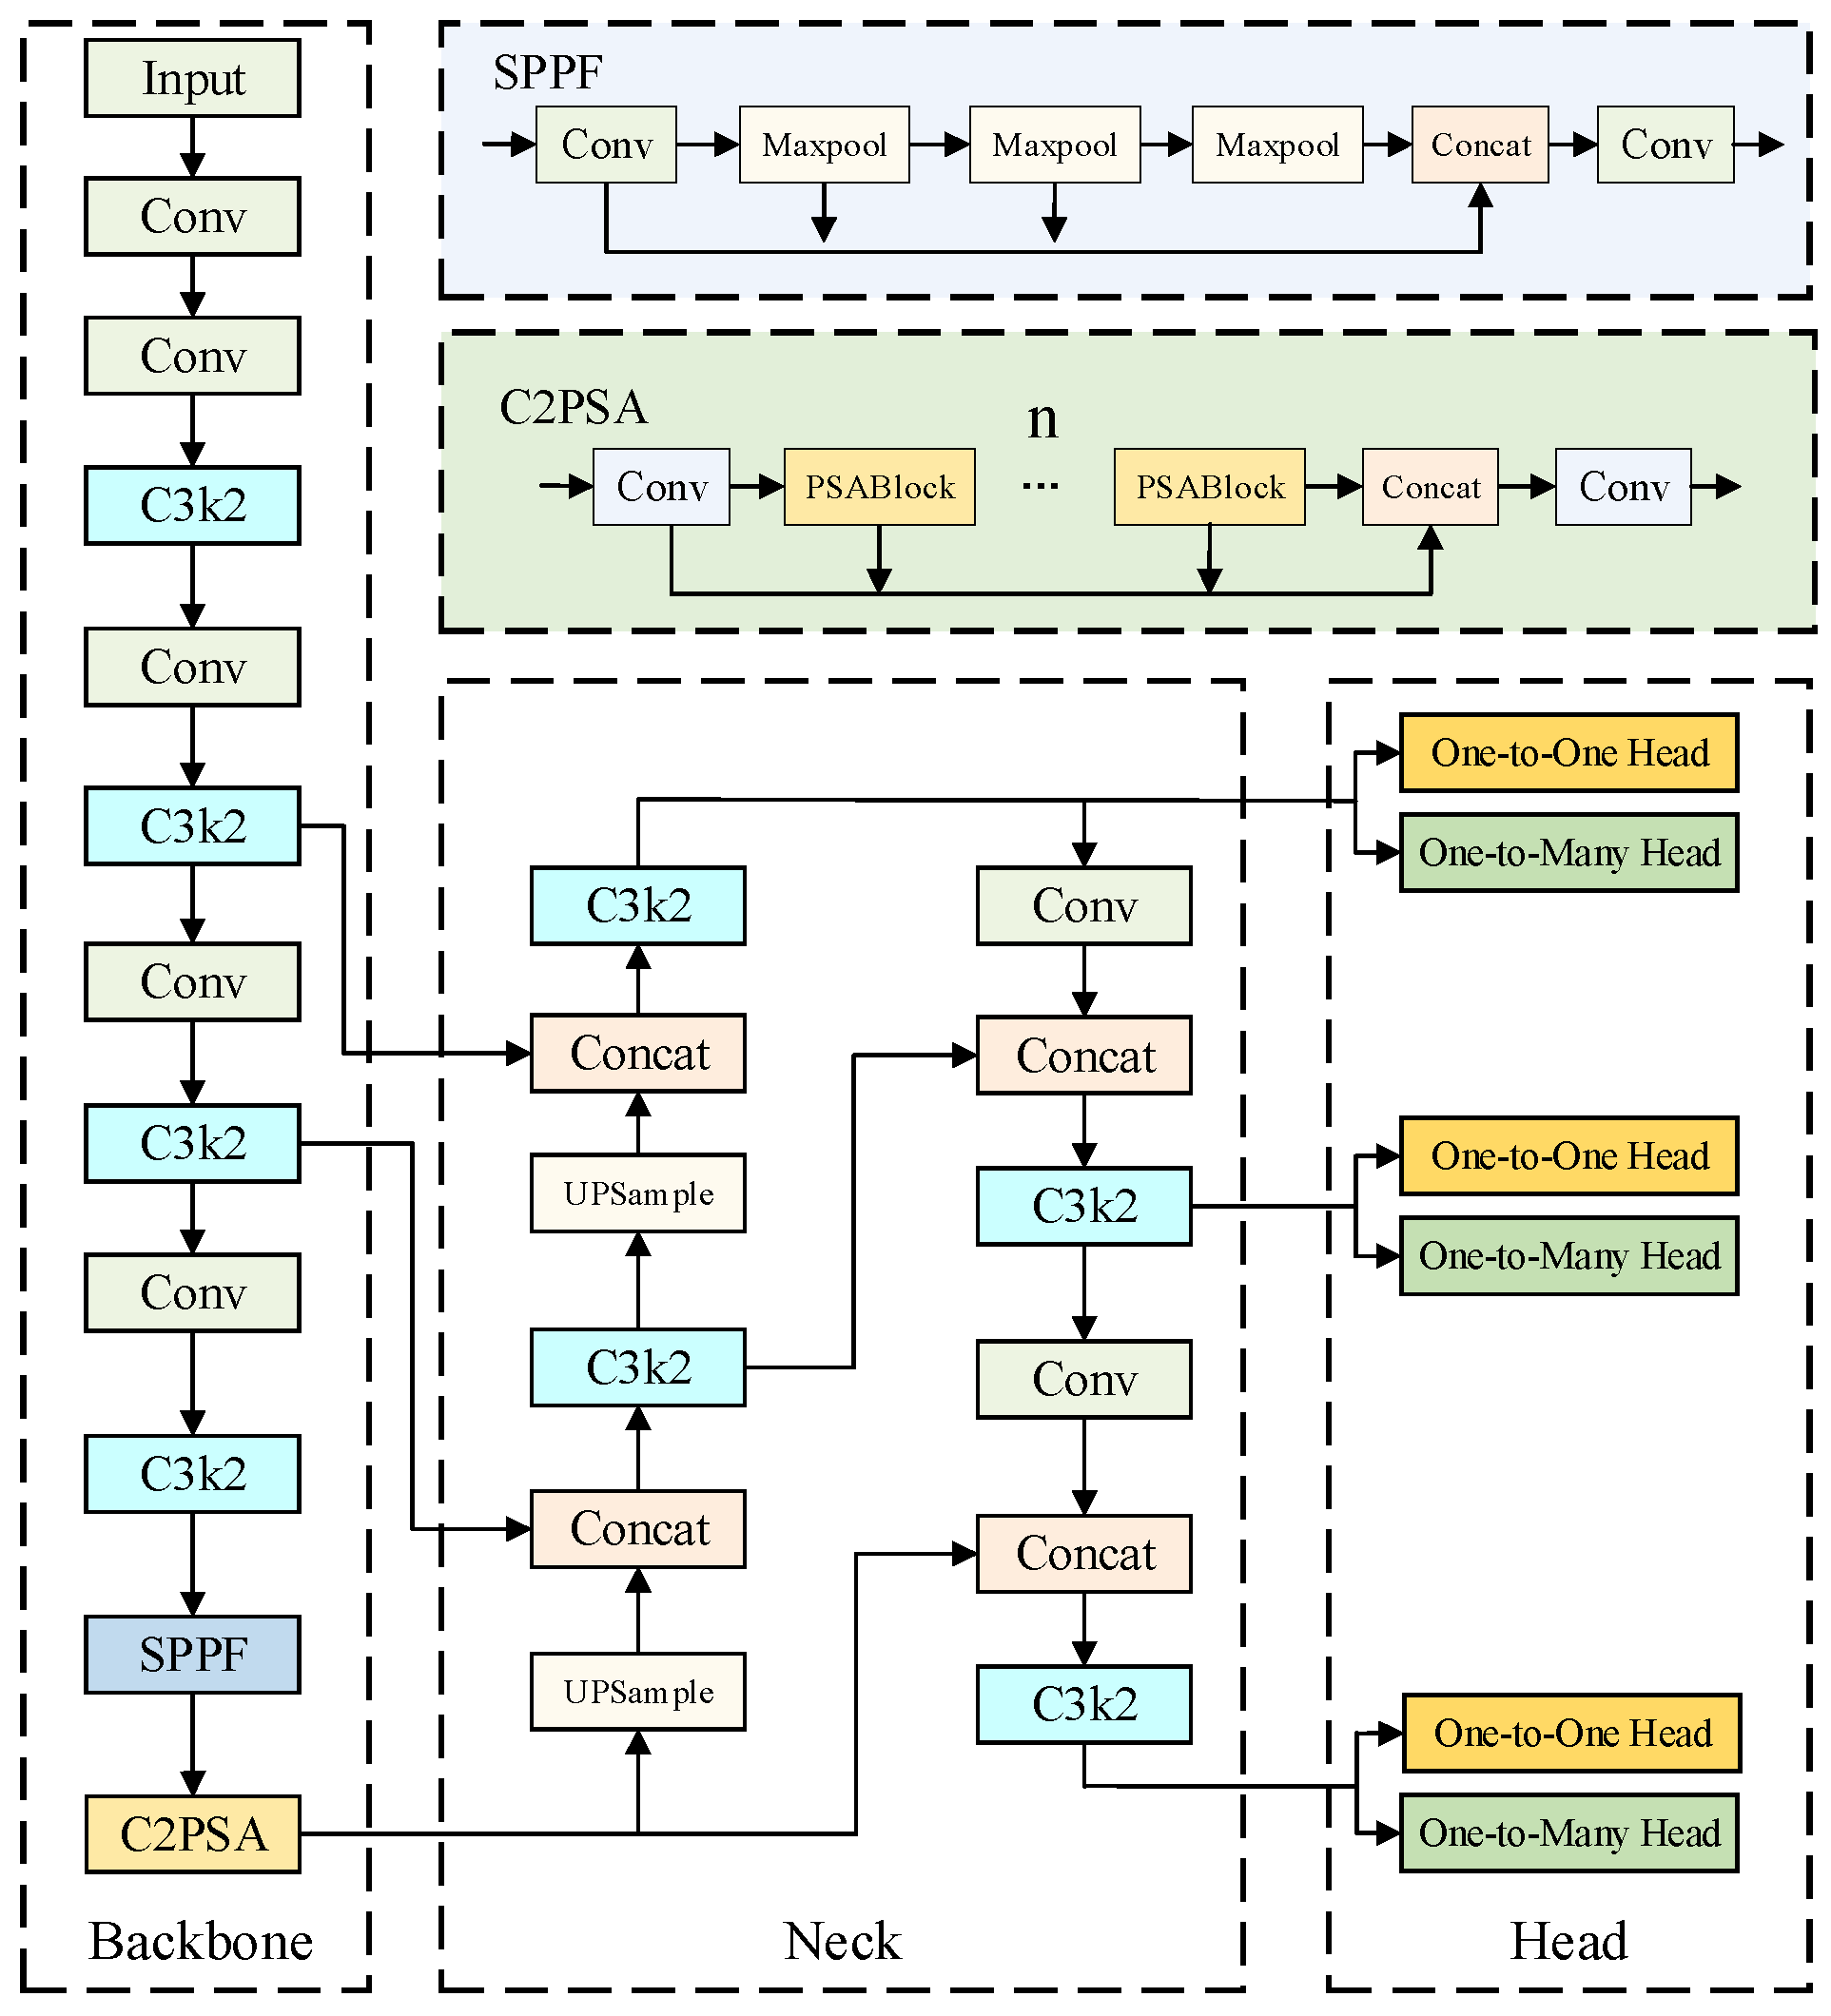
To address the limitation of traditional algorithms in achieving automated and intelligent identification of building layover areas in SAR images, this paper adopts the YOLOv11 object detection network based on the proven effectiveness of the YOLO series in SAR image target detection, as well as its advantages in detection accuracy, robustness to noise, and lightweight deployability. The network architecture of YOLOv11 is illustrated in Figure 5. Owing to the current lack of publicly available dedicated datasets, a dedicated training sample library was constructed using manual labeling in this study. The model trained on this dataset has a mean average precision (mAP) of 79.6%, which meets the requirements for the automatic and intelligent recognition of the building layover area in SAR images.
Based on the positioning results of the building layover area (i.e., the detection box coordinates) obtained in the identification stage, the corresponding areas of interest are cropped from the original SAR image and the interferogram to obtain a set of sub images of the building layover area. This operation can effectively eliminate the scattering interference from nontarget areas in a complex scene and lay a foundation for subsequent reconstruction of the interferometric phase of building facades.

2.3. Interferometric Phase Reconstruction in the Building Layover Area

Based on the analysis in Section 2.1, the original interferometric phase in the layover area cannot be directly used to obtain the building height, so correctly identifying the area dominated by building facade scattering and extracting the interferometric phase for only the building facade are necessary. Because the position and distribution of the source of the interference are unknown, the area where building facade scattering predominates is also unknown. Therefore, how to correctly identify this area and reconstruct the interferometric phase in the layover area is the key to achieving correct building height inversion in a complex scene.
According to Equation (3), the interferometric phase gradient including only the building facade can be calculated. In addition, because the characteristics of this phase gradient differ from those of the interferometric phase gradient in the mixed layover area, they can be used as the identifying feature for the area predominated by building facade scattering. During the identification process, the interferometric phase gradient in the layover area is calculated using the interferometric phase gradient model and relevant parameters and compared with the original interferometric phase gradient along the slant range direction. When the difference between the two values falls below the set threshold, the current pixel is considered to belong to the area where building facade scattering predominates; otherwise, it does not. Zhuang et al. [15] derived an optimal threshold of 0.2 rad from the statistics for building interferometric phase gradient deviations in simple scenes, and this threshold is also used in this study to ensure that the identification of the area predominated by the building facade scattering is accurate and robust.
( m , n ) R r , Δ ϕ r ( m , n ) Δ ϕ l ( m , n ) Th ( m , n ) R r , Δ ϕ r ( m , n ) Δ ϕ l ( m , n ) > Th ,
where ( m , n ) represents the coordinates of the current pixel; R f represents the area predominated by facade scattering; Δ ϕ r ( m , n ) represents the original interferometric phase gradient; and Δ ϕ l ( m , n ) indicates that the interferometric phase gradient includes only the building facade scattering.
On the basis of the identification results of the pixels predominated by building facade scattering and the original interferogram, the average position of these points along the slant range direction is calculated and set as the reference point, and the corresponding interference phase serves as the reference absolute phase. Combining the layover area identification results, the precise phase gradient calculated using Equation (3) serves as relative phase information. Finally, on the basis of the layover area detection results, the reference absolute phase, the pixel position, and the building facade interferometric phase gradient model, the complete building facade interferometric phase can be reconstructed as follows:
ϕ f ( m , n ) = k = n N ref 1 Δ ϕ f ( m , k ) + ϕ ref ( m , N ref ) , n < N ref k = N ref n 1 Δ ϕ f ( m , k ) + ϕ ref ( m , N ref ) , n > N ref ( m , n ) R layover ,
where ϕ f represents the complete building facade interferometric phase, ϕ ref and N ref represent the facade interference phase and position of the reference point, respectively, and R layover represents the detected layover area.

2.4. Quality-Guided Phase Unwrapping Method

The core of the quality-guided phase unwrapping method lies in using a quality map to guide the unwrapping process, thereby improving its accuracy and efficiency. This method first calculates a phase quality map and identifies points with high phase quality as starting points, taking their wrapped phase as the unwrapped phase. It then unwraps the neighboring phase points around these starting points that have not yet been unwrapped. The unwrapped neighboring nodes are added to a priority queue according to their phase quality. Finally, the node with the highest quality is selected from the priority queue, and the above process is repeated until all pixels have been unwrapped.

2.4.1. Quality Map Determination

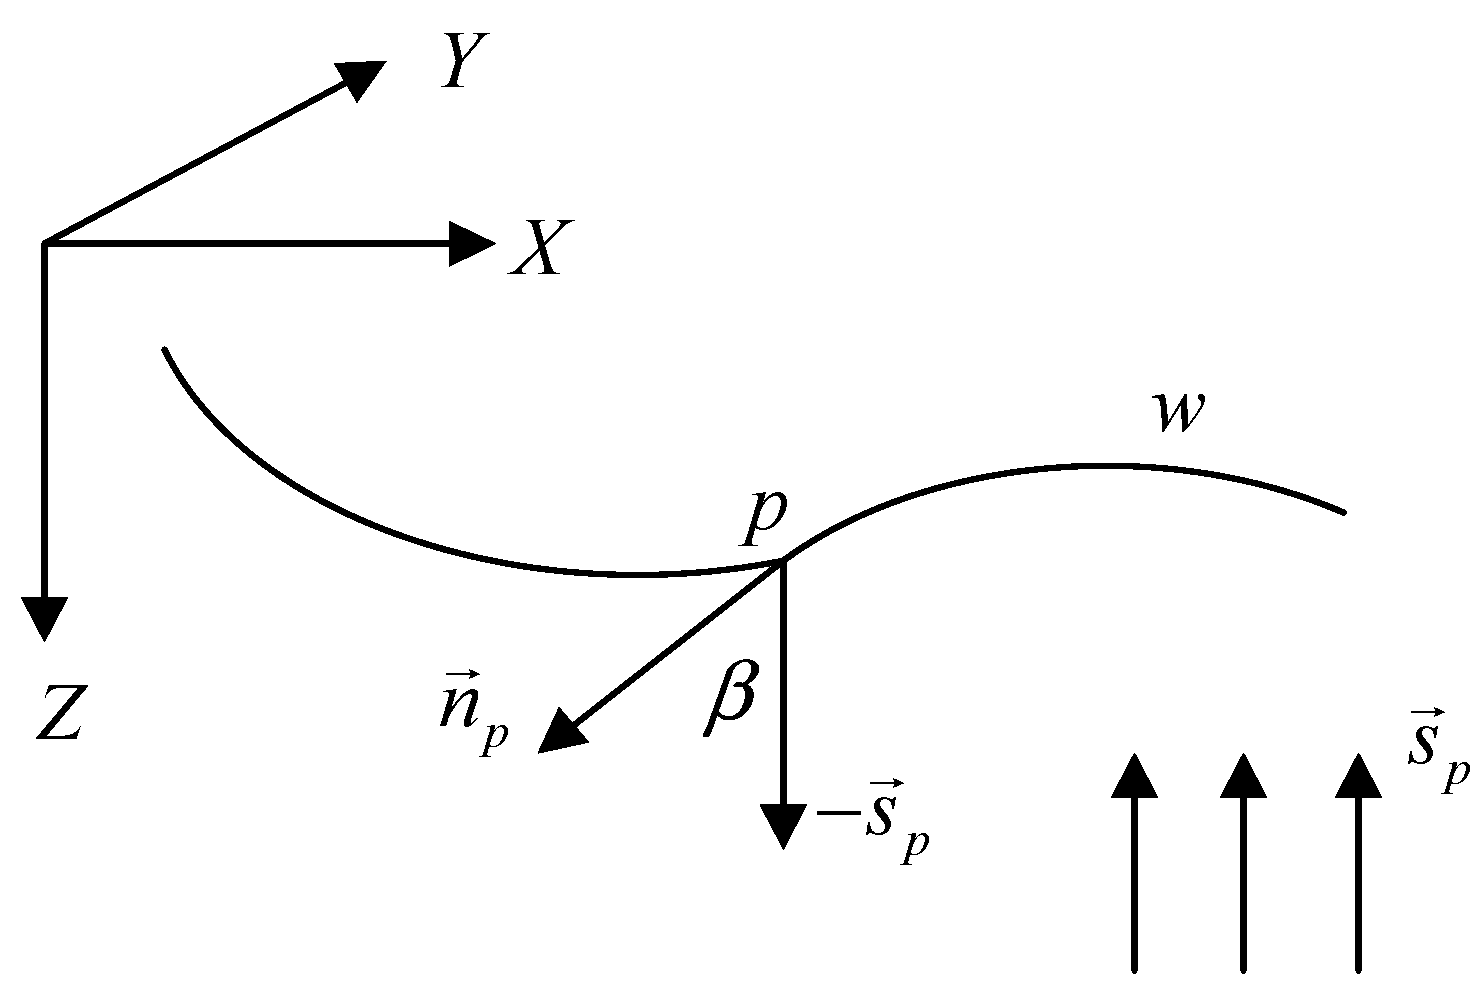
Since the surface phase distribution is a mapping of terrain height, the surface normal vector can be calculated from the unwrapped phase values. The confidence measure for a sampling point p is defined as:
c P = cos β = n p ( s p ) ,
where n p denotes the surface normal vector at point p, s p is the unit vector in the viewing direction, and β is the angle between the surface normal vector at point p and the opposite direction of the viewing direction. Figure 6 illustrates the relationship among the three.
In Figure 6, X, Y, and Z constitute the radar imaging coordinate system, with the Z-axis serving as the imaging axis. w represents the terrain elevation profile corresponding to the unwrapped phase, and the unit vector in the Z-direction is identical to vector s p . The procedure for deriving the surface normal vector at point p is as follows:
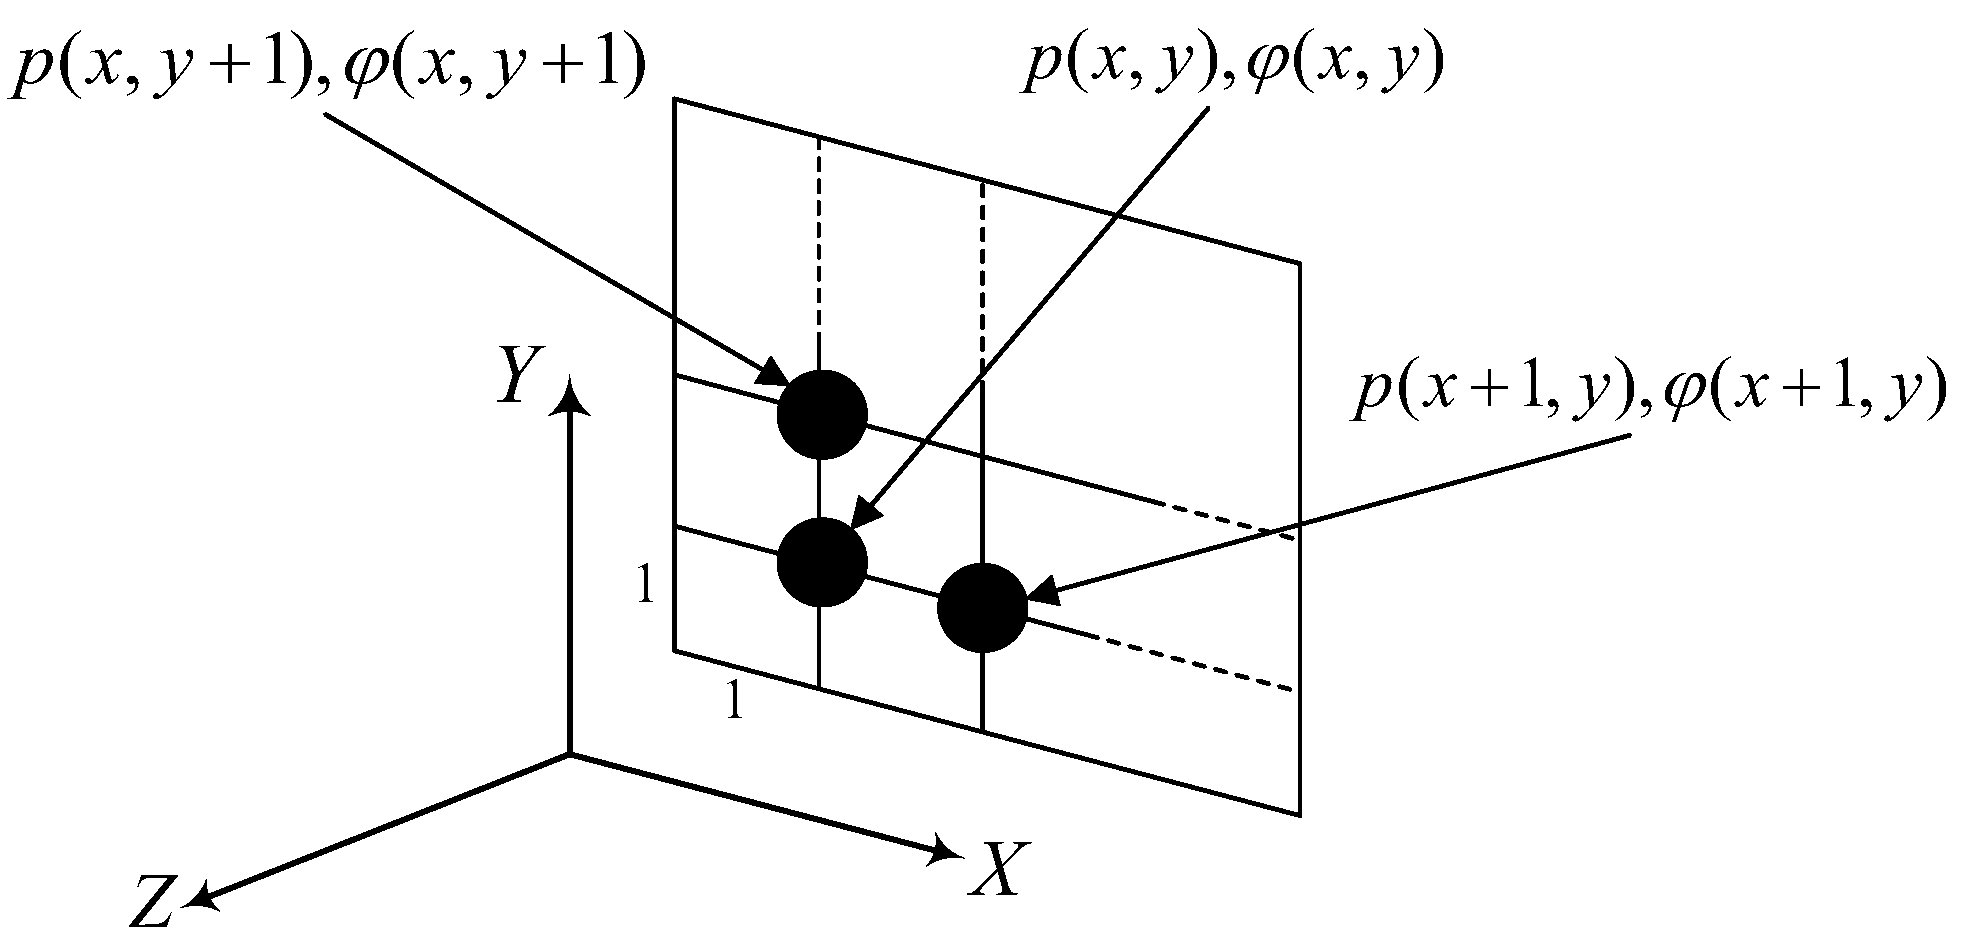
First, assume the unwrapped phase map is an m × n array, as shown in Figure 7. The normal vector n p at point p ( x , y ) ( 1 x m 1 , 1 y m 1 ) is defined as:
n p = [ p ( x + 1 , y ) p ( x , y ) ] × [ p ( x , y + 1 ) p ( x , y ) ] | [ p ( x + 1 , y ) p ( x , y ) ] × [ p ( x , y + 1 ) p ( x , y ) ] | ,
where
p ( x , y ) = x i + y j + φ ( x , y ) k p ( x + 1 , y ) = ( x + 1 ) i + y j + φ ( x + 1 , y ) k p ( x , y + 1 ) = x i + ( y + 1 ) j + φ ( x , y + 1 ) k ,
it follows from Equation (8) that:
p ( x + 1 , y ) p ( x , y ) = i + [ φ ( x + 1 , y ) φ ( x , y ) ] k p ( x , y + 1 ) p ( x , y ) = j + [ φ ( x , y + 1 ) φ ( x , y ) ] k ,
Substituting Equation (9) into Equation (7) yields:
n p = m 1 i m 2 j + k m 1 2 + m 2 2 + 1 ,
here, m 1 = φ ( x + 1 , y ) φ ( x , y ) ; φ ( x , y ) represent the unwrapped phase values; m 2 = φ ( x , y + 1 ) φ ( x , y ) ; k = s p . Substituting Equation (10) into Equation (6) yields:
c p = 1 m 1 2 + m 2 2 + 1 ,

2.4.2. Quality-Guided Algorithm

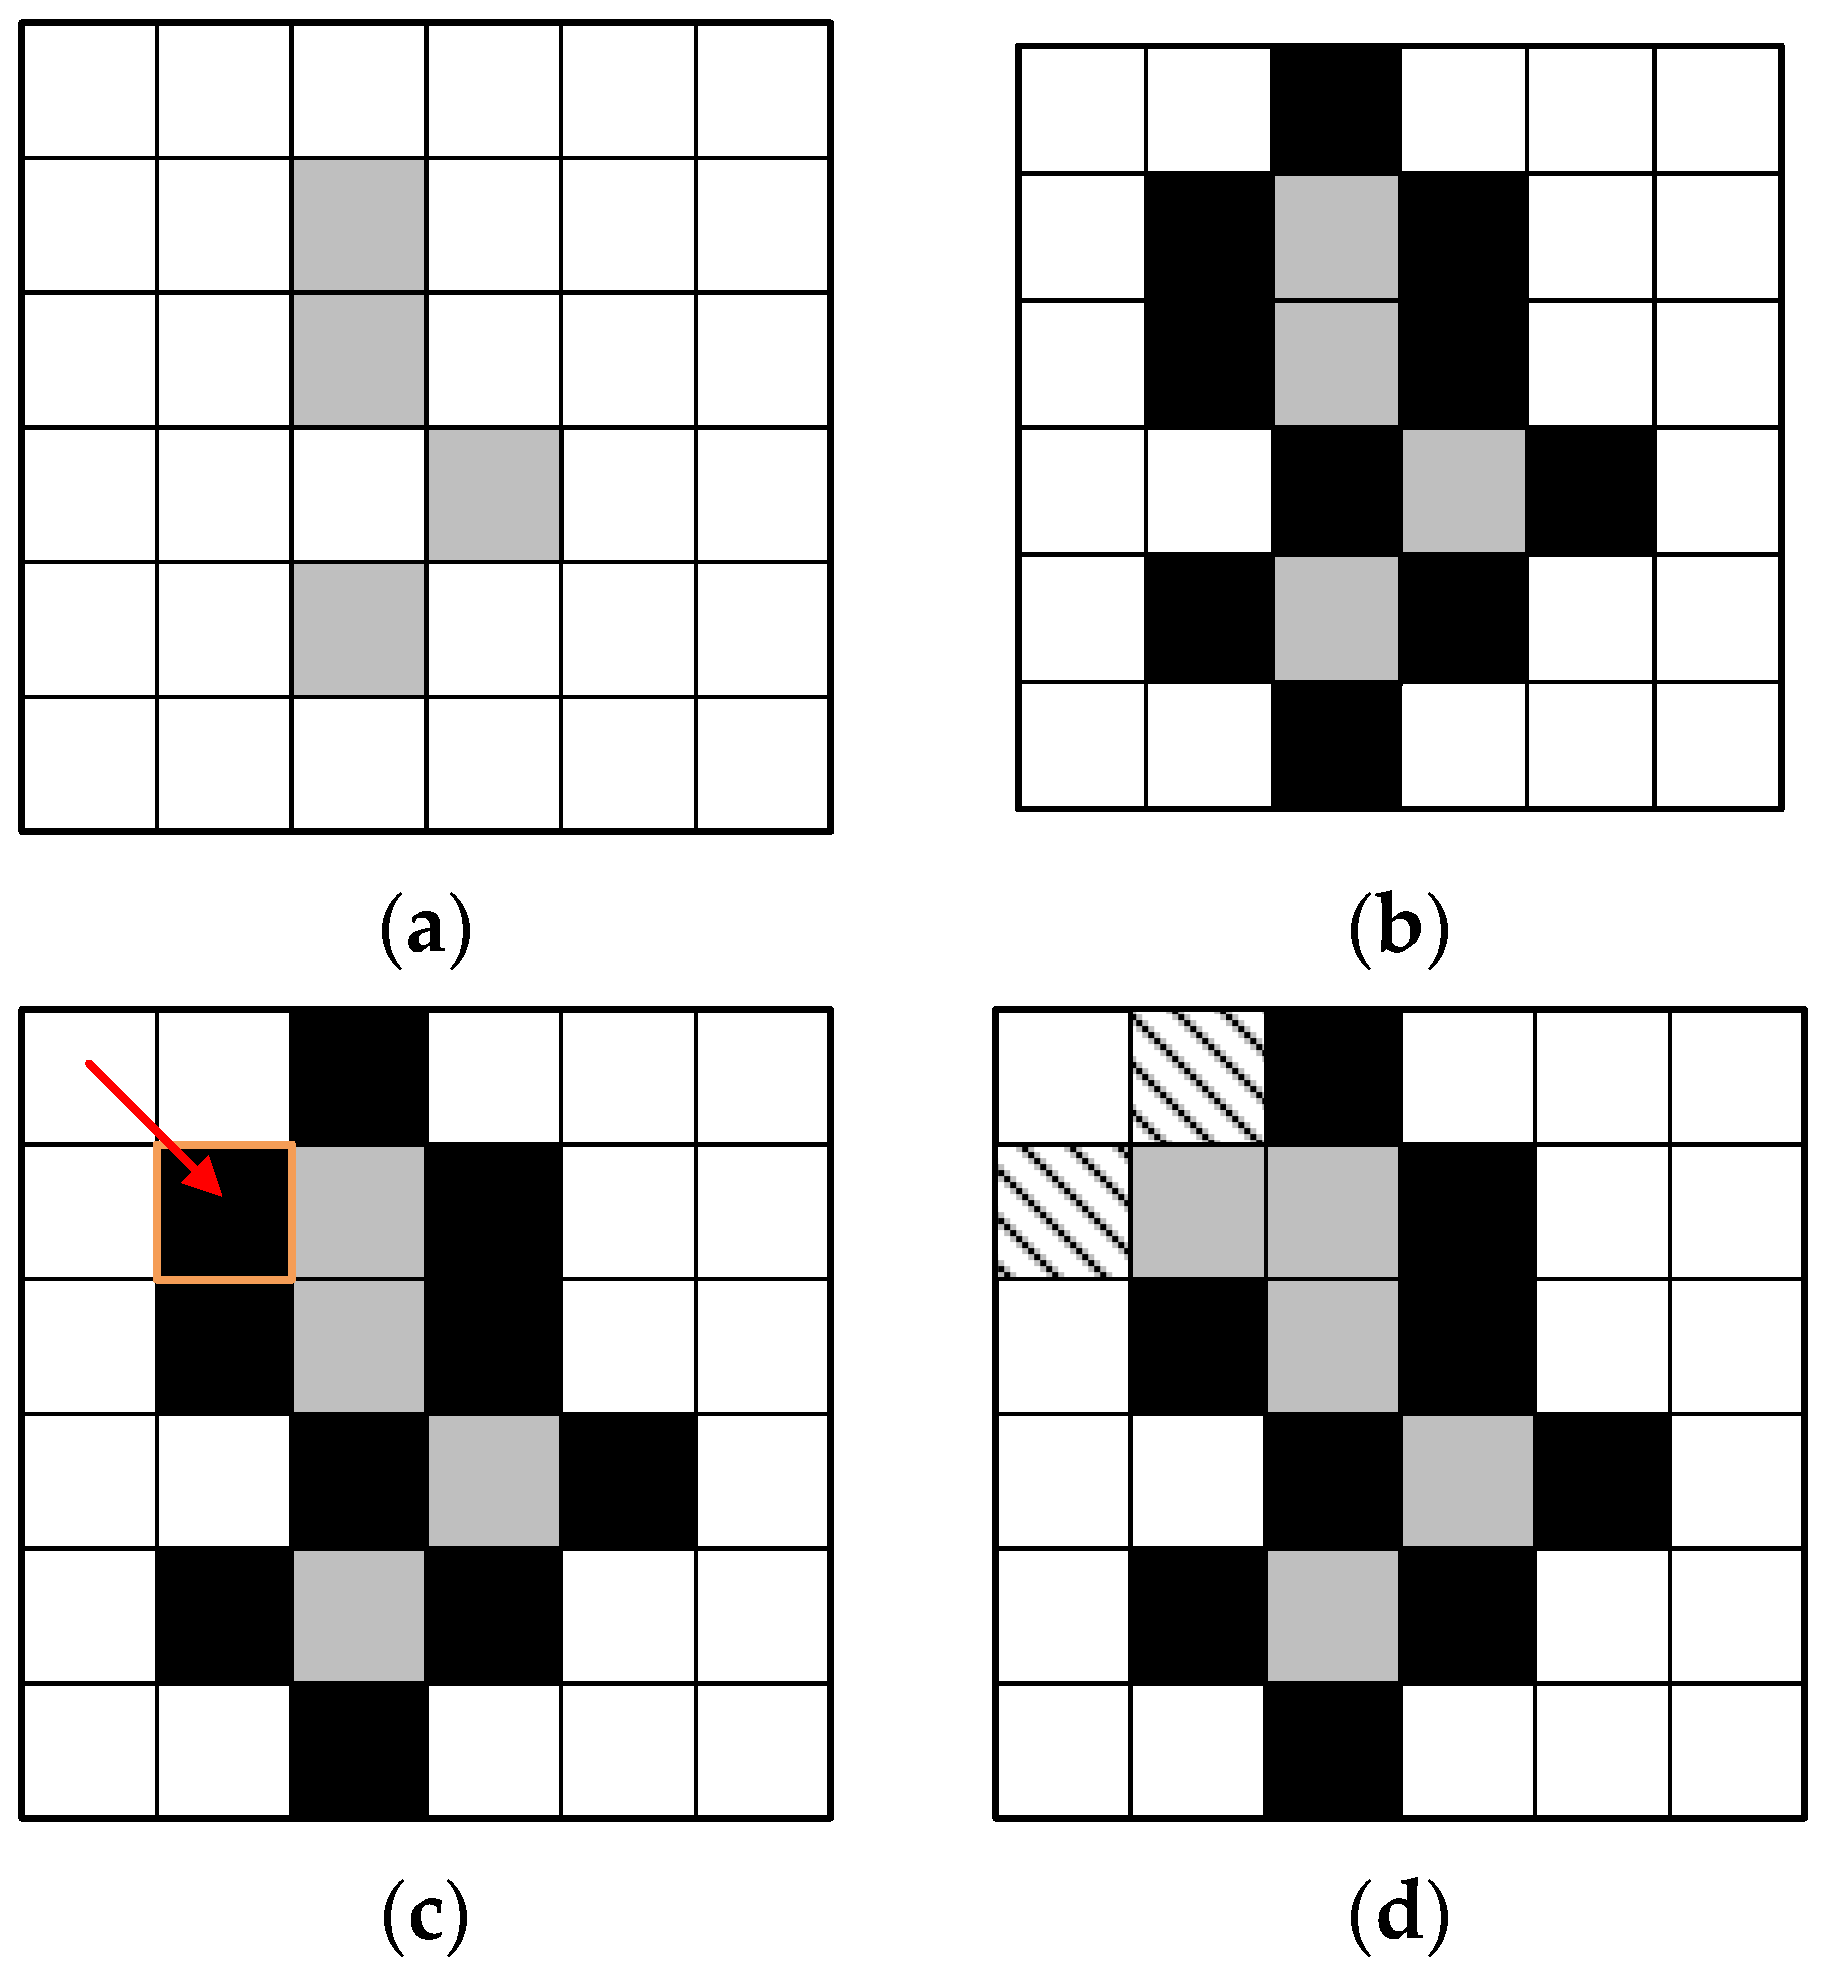
The key step of the quality-guided unwrapping method is to perform pixel diffusion under the guidance of the phase quality map. The basic procedure is as follows: starting from the highest-quality pixel, its four neighboring pixels are examined. The neighbor with the highest quality is unwrapped first, and its adjacent unwrapped neighbors are then stored in an “adjacency list.” The highest-quality pixel from this list is subsequently selected and unwrapped, after which the list is updated. This process repeats until all pixels are unwrapped. Figure 8 illustrates a schematic of the quality-guided phase unwrapping algorithm.

3. Results and Discussion

3.1. Test Environment and Data

The test environment consists of the Windows 11 operating system and the PyTorch 2.0.0 + cu118 deep learning framework. The hardware system includes an Intel(R) Core(TM) i9-14900HX processor (basic frequency of 2.20 GHz), 64 GB of random-access memory, and an NVIDIA GeForce RTX 4090 graphics card. Distributed high-resolution SAR images produced in China are used as experimental data.
To address the limitation that existing open-source datasets cannot meet the requirements for individual building extraction from SAR images, this study employs a self-constructed SAR dataset for individual building detection, providing high-quality data support for research on automated and intelligent individual building extraction from SAR imagery. The dataset construction process is as follows: First, high-resolution SAR images from a domestically developed SAR satellite were selectively collected, covering urban areas with various complex scenes (e.g., dense building distributions, vegetation, and other man-made target interferences). In the preprocessing stage, a sliding window cropping strategy (window size: 1024 × 1024 pixels, overlap rate: 60%) was applied to generate an image set for screening. After rigorous manual screening, low-quality images with severe geometric distortions or low building coverage were removed, resulting in 1493 valid images. Using the LabelME platform, building regions in the valid images were precisely annotated, yielding a total of 24,120 building samples.
In this study, a stratified random sampling hold-out method was adopted to divide the annotated building target samples into training, validation, and test sets at a ratio of 7:2:1. The partitioning process strictly adhered to the principle of data independence, ensuring that the test set remained completely unseen during the training and parameter tuning stages. Ultimately, the training set (70%) was used for model learning, the validation set (20%) for hyperparameter optimization, and the test set (10%) served as an objective benchmark for evaluating the final model’s generalization performance.

3.2. Analysis of Building Layover Area Recognition and Interferometric Phase Reconstruction and Unwrapping Results

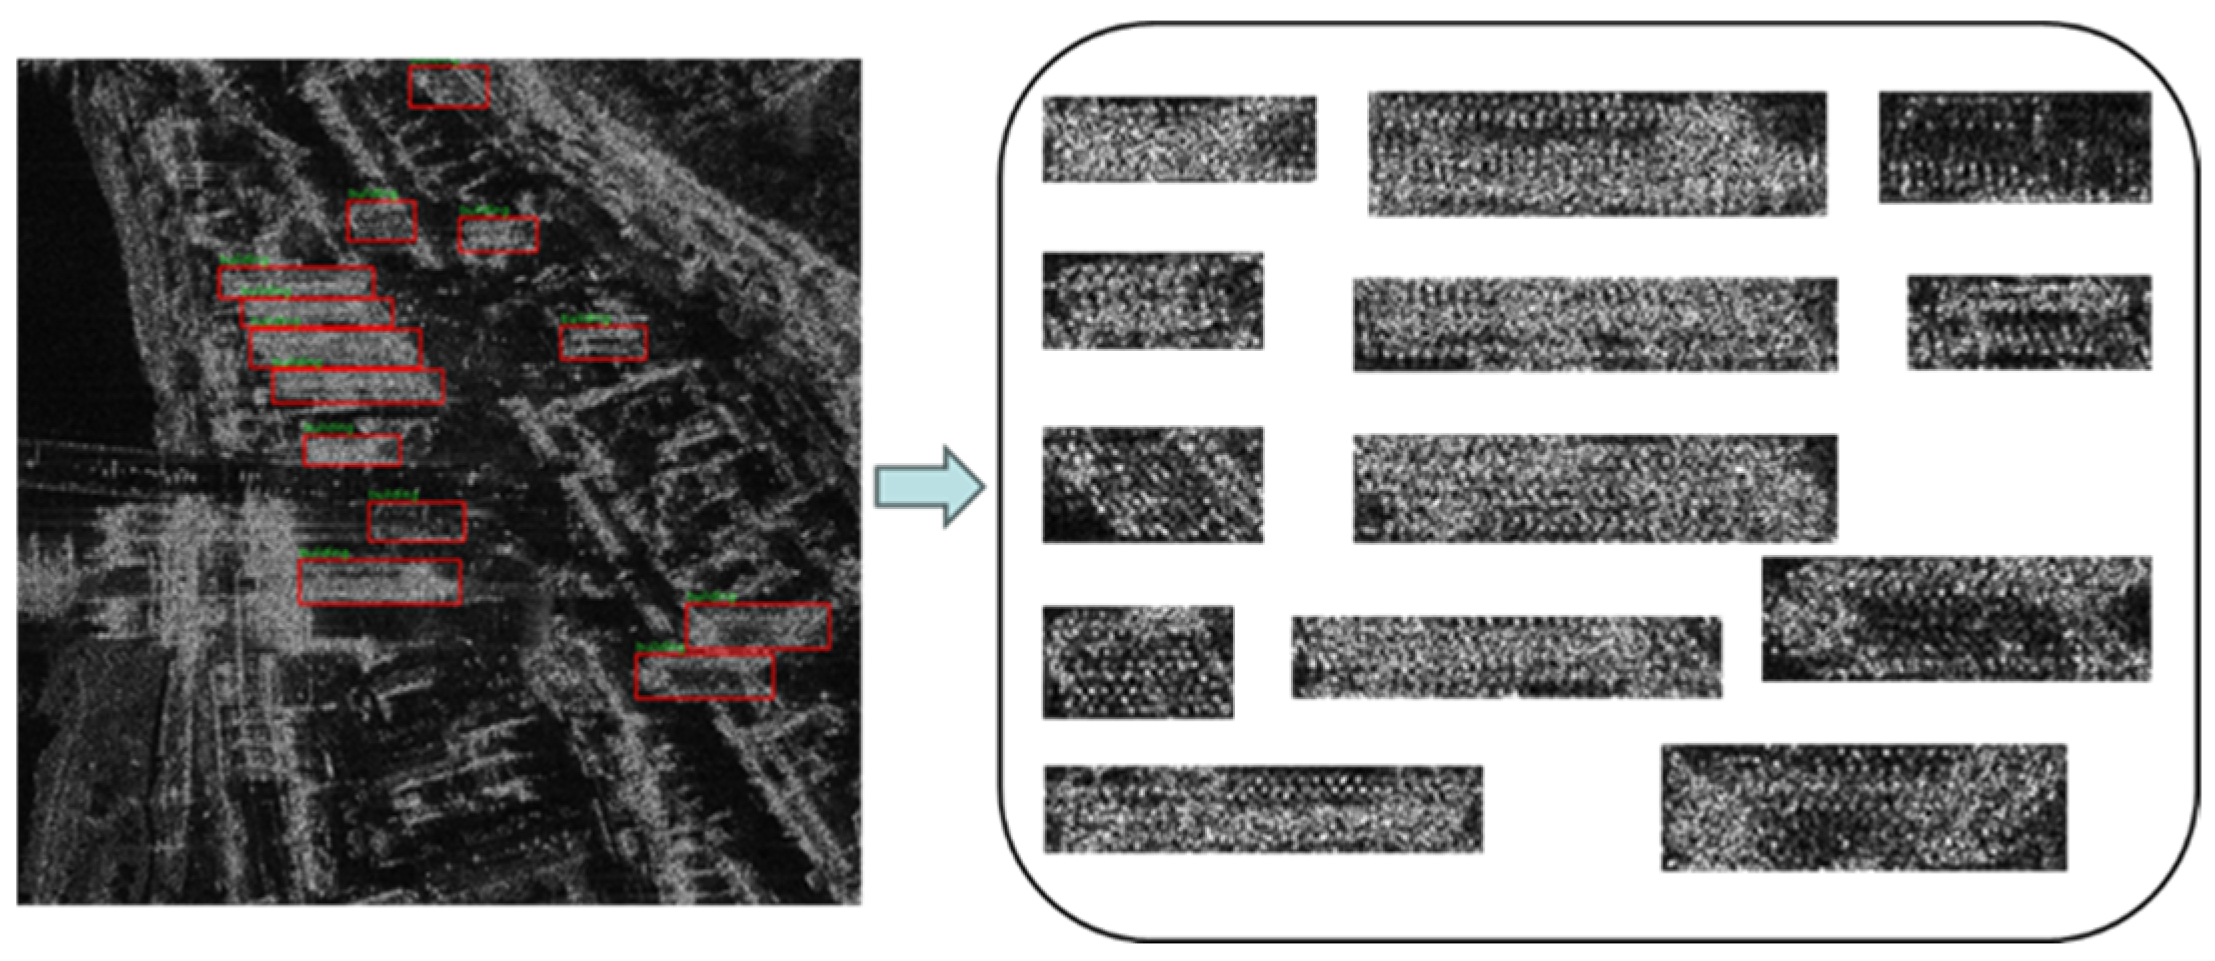
To identify building layover areas, the SAR image to be detected is first input into the detection network to automatically identify and extract the precise position information of the building layover areas in the image. An actual SAR image with typical complex ground features is selected as the experimental area. The automatic detection results, in which a total of 13 buildings are detected, are shown in Figure 9.
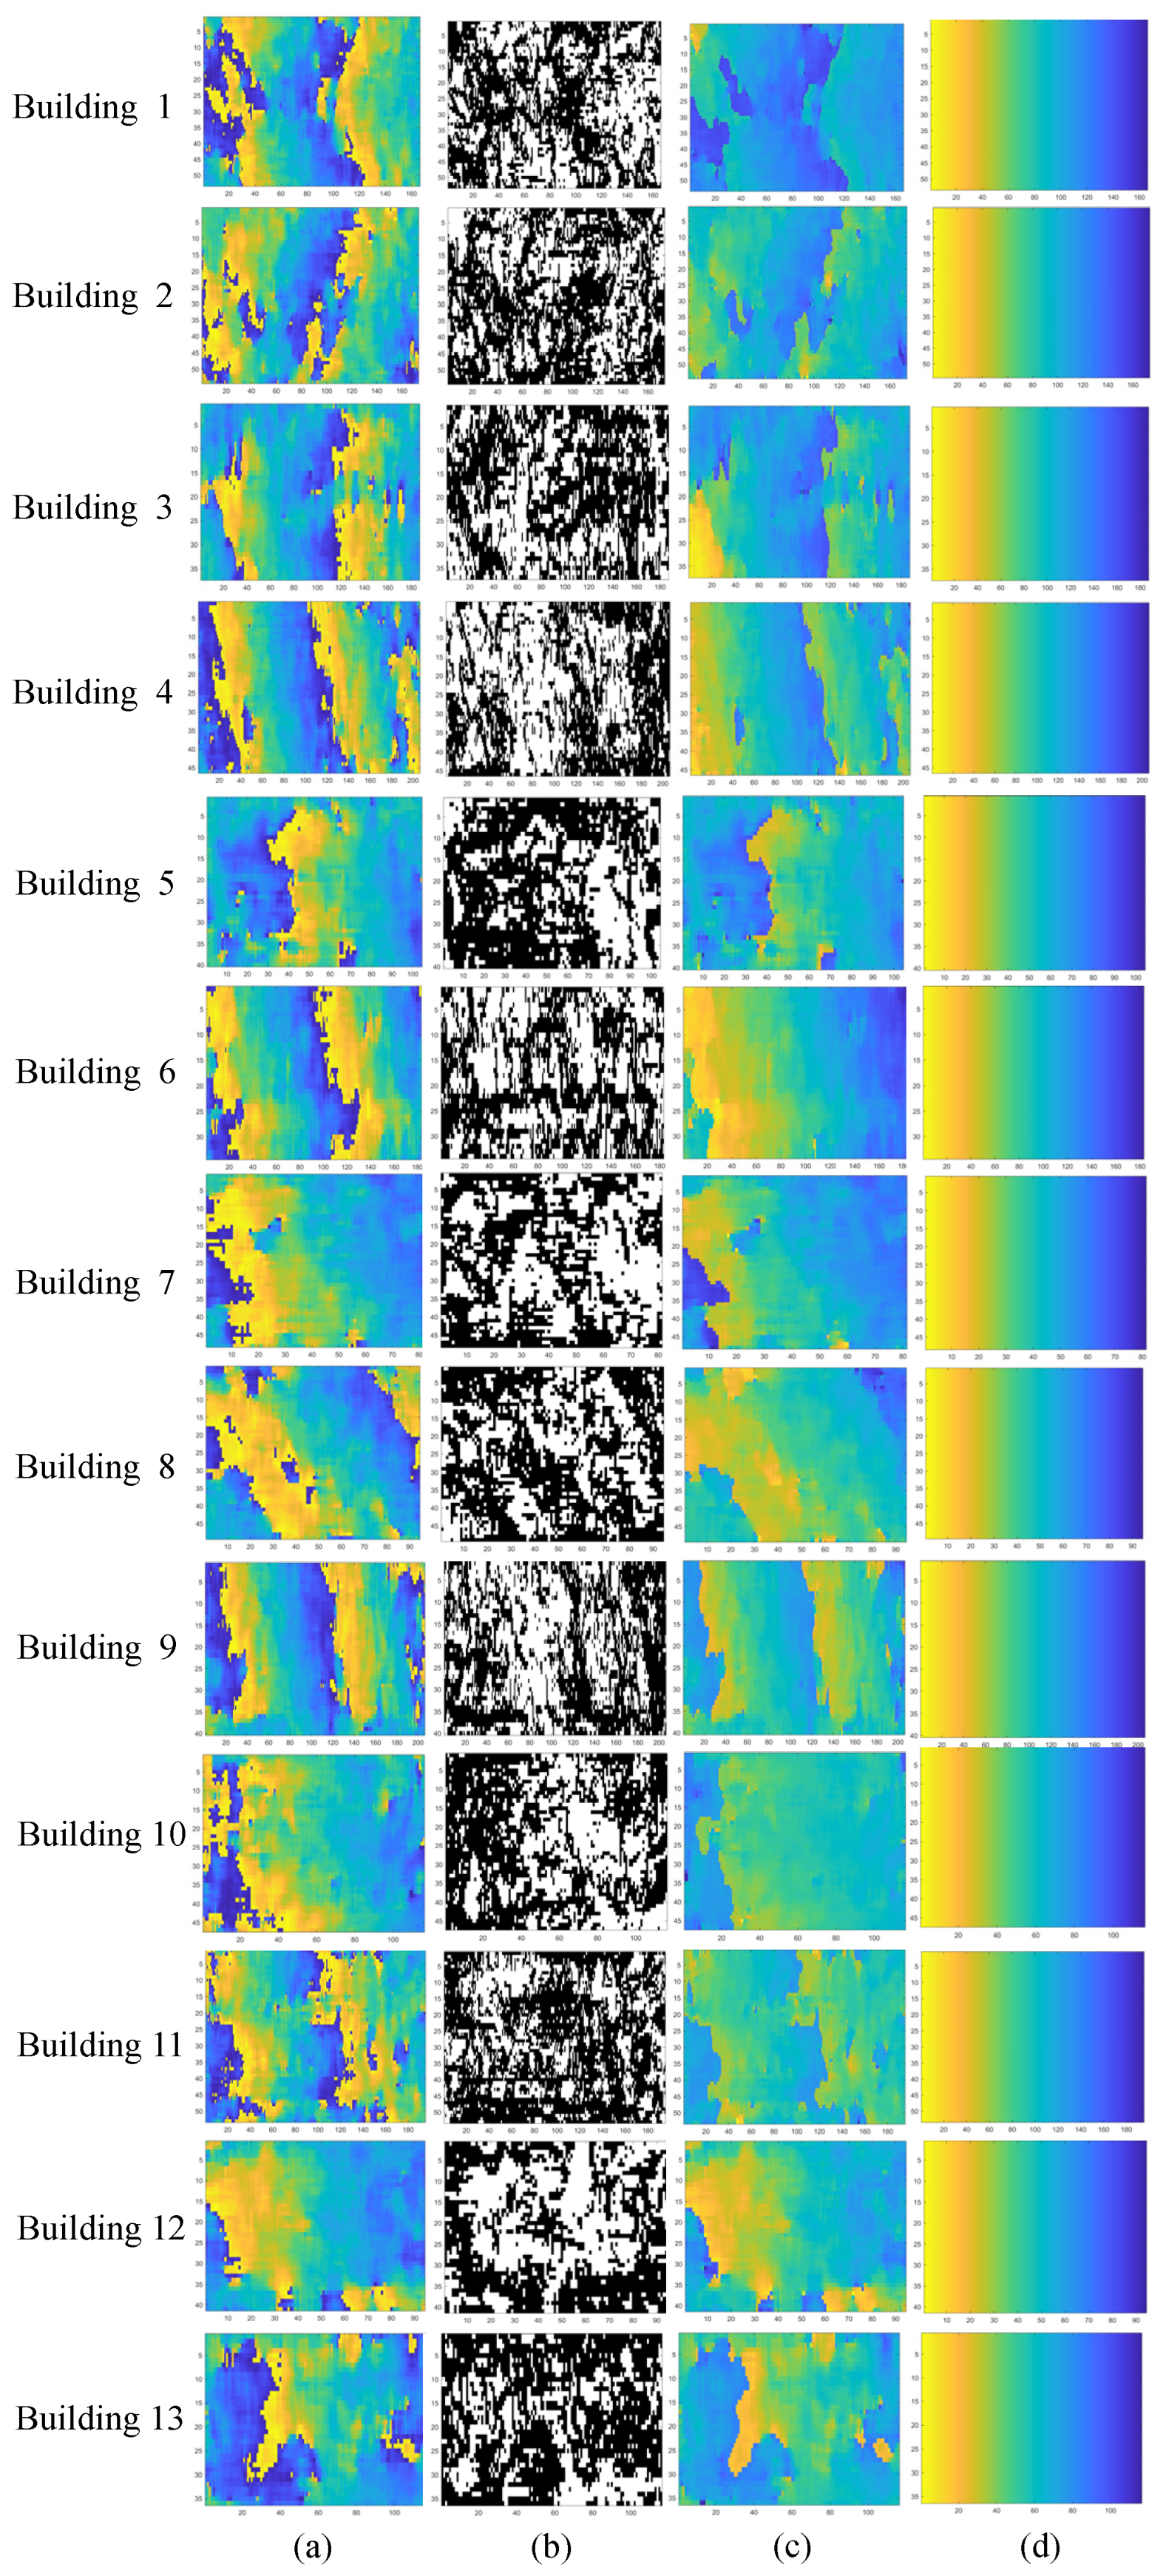
Based on the obtained location information of the layover areas, the corresponding target regions are extracted from the original interferogram, and each identified building is processed independently. By performing calculations, the pixel regions dominated by building facade scattering within each area are determined. Subsequently, following the method described in Section 2.3, the interferometric phase containing only the building facades is reconstructed. Phase unwrapping is then conducted using the quality-guided method. The processing results for each part are shown in Figure 10.
A common approach to evaluating the accuracy of phase unwrapping is to rewrap the unwrapped phase and compare it with the original wrapped phase, thereby assessing the errors introduced during the unwrapping process. In this paper, the root mean square error (RMSE) is adopted as a quantitative metric to evaluate the unwrapping results. Experimental results indicate that the RMSE of the proposed method is 0.8 × 10⁻¹⁷, which is significantly lower than that of the direct unwrapping approach, demonstrating that the proposed method achieves higher unwrapping accuracy and offers greater reliability in complex scenarios.
From the original SAR images, it can be observed that the experimental area contains buildings of diverse shapes and sizes, along with numerous interfering objects. Under such conditions, 13 buildings were successfully detected and isolated. Examining the original interferograms of these 13 building regions reveals widespread and significant phase jumps. In contrast, the reconstructed interferometric phase, which contains only building facades, shows clear improvement: the phase appears more continuous and consistent, effectively reducing the difficulty of subsequent phase unwrapping. By comparing the results with those obtained by directly unwrapping the original building-area interferograms, it is demonstrated that the proposed method achieves superior unwrapping performance, providing reliable outcomes for subsequent urban deformation monitoring and 3D reconstruction.

4. Conclusions

This paper deeply integrates the advantages of deep learning in target recognition with an analysis of the scattering mechanisms within InSAR layover areas under complex scenarios. Leveraging the YOLOv11 network, the proposed method accurately detects and localizes building layover areas. Combined with a constructed interferometric phase gradient model for building facades, it successfully identifies facade-dominated scattering regions and achieves phase reconstruction. This strategy effectively resolves the phase unwrapping challenges encountered in traditional methods caused by scatterer aliasing in layover areas and abrupt height variations in buildings. Experimental results demonstrate that the proposed method achieves correct phase unwrapping in building areas under complex scenarios. For certain inaccessible regions, it enables automated and intelligent phase unwrapping while providing relatively accurate results. Furthermore, it can provide reliable data support for key applications such as surface deformation monitoring (e.g., urban subsidence, infrastructure stability assessment) and three-dimensional urban modeling. In future work, we will further optimize the YOLOv11 network architecture to improve its detection and segmentation accuracy for irregularly shaped buildings and dense building clusters. Additionally, we will explore the integration of multi-baseline and multi-band InSAR data to overcome the limitations of single data sources in complex scenarios.

Author Contributions

Conceptualization, G.J.; Methodology, M.X. and G.J.; Investigation, M.X., H.Y. and J.W.; Writing—Original Draft, M.X.; Writing—Review and Editing, R.C.; Project Administration, G.J. and R.C. All authors have read and agreed to the published version of the manuscript.

Funding

This research was funded by National Key Research and Development Program of China, grant number 2023YFB2604001 and Excellent Young Scientists Fund of Henan Natural Science Foundation, grant number 252300421206.

Institutional Review Board Statement

Not applicable.

Informed Consent Statement

Not applicable.

Data Availability Statement

The raw data supporting the conclusions of this article will be made available by the authors on request.

Conflicts of Interest

The authors declare no conflicts of interest.

References

  1. Jin, G.W.; Xu, Q.; Zhang, H.M. Synthetic Aperture Radar Interferometry; National Defense Industry Press: Beijing, China, 2014; pp. 2–8. [Google Scholar]
  2. Jin, G.W.; Zhang, H.M.; Xu, Q. Radargrammetry; Surveying and Mapping Press: Beijing, China, 2015; pp. 15–24. [Google Scholar]
  3. Chen, X.; Zhang, S.; Qin, X.; Lin, J. Robust Two-Dimensional InSAR Phase Unwrapping via FPA and GAU Dual Attention in ResDANet. Remote. Sens. 2024, 16, 1058. [Google Scholar] [CrossRef]
  4. Calò, M.; Ruggieri, S.; Doglioni, A.; Morga, M.; Nettis, A.; Simeone, V.; Uva, G. Probabilistic-based assessment of subsidence phenomena on the existing built heritage by combining MTInSAR data and UAV photogrammetry. Struct. Infrastruct. Eng. 2024, 1–16. [Google Scholar] [CrossRef]
  5. Lin, X.; Li, Z.X.; Li, F.-F.; Hu, D.-H.; Ding, C.-B. An Adaptive Iterated Nonlocal Interferometry Filtering Method. J. Radars 2014, 3, 166–175. [Google Scholar] [CrossRef]
  6. Wang, C.; Qiu, X.; Li, F.; Lei, B. An InSAR Image Simulation and Elevation Inversion Method for Buildings. J. Radars 2020, 9, 373–385. [Google Scholar] [CrossRef]
  7. Chen, J.K.; Peng, L.X.; Qiu, X.L.; Ding, C.B.; Wu, Y.R. A 3D building reconstruction method for SAR images based on deep neural network. Sci. Sin. Informationis 2019, 49, 1606–1625. (In Chinese) [Google Scholar] [CrossRef]
  8. Li, P.X.; Yang, J.; Shi, L. Synthetic Aperture Radar Interferometry Principle and Application, 2nd ed.; Surveying and Mapping Press: Beijing, China, 2016; pp. 75–109. [Google Scholar]
  9. Hao, H.X.; Wu, L.D. PUMA-SPA: A Phase Unwrapping Method Based on PUMA and Second-Order Polynomial Approximation. IEEE Geosci. Remote Sens. Lett. 2014, 11, 1906–1910. [Google Scholar]
  10. Zhou, L.; Yu, H.; Lan, Y. Improved Branch-Cut Algorithm for Multibaseline Phase Unwrapping Using Sar Interferograms. In Proceedings of the IGARSS 2020-2020 IEEE International Geoscience and Remote Sensing Symposium, Waikoloa, HI, USA, 17 February 2021. [Google Scholar] [CrossRef]
  11. Zhu, B.; Wang, Y.; Yu, H.W. An Algorithm Measuring Urban Building Heights by Combining the PS-InSAR Technique and Two-Stage Programming Approach Framework. IEEE J. Sel. Top. Appl. Earth Obs. Remote Sens. 2023, 16, 7624–7635. [Google Scholar] [CrossRef]
  12. Wang, Q.X.; Shi, X.H.; Huang, H.F.; Dong, Z. Method of spaceborne InSAR shadow and layover phase reconstruction. Syst. Eng. Electron. 2010, 32, 699–702. [Google Scholar]
  13. Stilla, U.; Soergel, U.; Thoennessen, U. Potential and limits of InSAR data for building reconstruction in built-up areas. ISPRS J. Photogramm. Remote Sens. 2003, 58, 113–123. [Google Scholar] [CrossRef]
  14. Rossi, C.; Eineder, M. High- Resolution InSAR Building Layovers Detection and Exploitation. Geosci. Remote Sens. IEEE Trans. 2015, 53, 6457–6468. [Google Scholar] [CrossRef]
  15. Zhuang, D.; Zhang, L.; Zou, B. Interferometry Modeling and Height Reconstruction for High- Rise Buildings in Complex Scenes Based on One Single Interferogram. Geosci. Remote Sens. IEEE Trans. 2024, 62, 5206916. [Google Scholar] [CrossRef]
  16. Yang, W.; He, Y.; Zhu, Q.; Zhang, L.; Jin, L. Unwrap-Net: A deep neural network-based InSAR phase unwrapping method assisted by airborne LiDAR data. ISPRS J. Photogramm. Remote Sens. 2024, 218, 510–529. [Google Scholar] [CrossRef]
  17. Li, G.; Li, Y.; Liu, W. Improved Least Squares Phase Unwrapping Method Based on Chebyshev Filter. Appl. Sci. 2024, 14, 4894. [Google Scholar] [CrossRef]
  18. Lin, Y.H.; Zhong, H.P.; Li, H.; Xiao, J.B. A Phase Unwrapping Method for InSAS Based on Convolutional Neural Networks. J. Beijing Univ. Aeronaut. Astronaut. 2025; in press. [Google Scholar]
  19. He, Y.; Yang, W.; Zhu, Q. An InSAR phase unwrapping method based on R2AU-Net. Acta Geod. Cartogr. Sin. 2024, 53, 1001–1595. [Google Scholar]
  20. Yao, S.; He, Y.; Zhang, L.; Yang, W.; Chen, Y.; Sun, Q.; Zhao, Z.; Cao, S. A ConvLSTM neural network model for spatiotemporal prediction of mining area surface deformation based on SBAS-InSAR monitoring data. IEEE Trans. Geosci. Remote Sens. 2023, 61, 5201722. [Google Scholar] [CrossRef]
  21. Chen, C.W.; Zebker, H.A. Phase unwrapping for large SAR interferograms: Statistical segmentation and generalized network models. IEEE Trans. Geosci. Remote Sens. 2002, 40, 1709–1719. [Google Scholar] [CrossRef]
Figure 1. Flowchart of the proposed method.
Applsci 16 02372 g001
Figure 2. Schematic diagram of a complex scene.
Applsci 16 02372 g002
Figure 3. Composition of building scattering patterns in a complex scene.
Applsci 16 02372 g003
Figure 4. Scattering composition of a complex scene in an InSAR system.
Applsci 16 02372 g004
Figure 5. YOLOv11 network structure.
Applsci 16 02372 g005
Figure 6. Relationship among n p , s p and β .
Applsci 16 02372 g006
Figure 7. Schematic diagram of the unwrapped phase.
Applsci 16 02372 g007
Figure 8. Schematic of the quality-guided phase unwrapping algorithm. (a) Unwrapped region (light gray pixels); (b) adjacent pixels (black pixels); (c) the pixel indicated by the arrow is selected for unwrapping; and (d) newly added adjacent pixels (hatched pixels).
Applsci 16 02372 g008
Figure 9. Detection results of layover areas.
Applsci 16 02372 g009
Figure 10. Original interferogram and processing results: (a) Original interferometric phase over the building area; (b) schematic of the facade-scattering-dominant regions in the building area; (c) direct unwrapping result of the original interferometric phase over the building area; (d) unwrapping result of the building area obtained with the proposed method.
Applsci 16 02372 g010
Disclaimer/Publisher’s Note: The statements, opinions and data contained in all publications are solely those of the individual author(s) and contributor(s) and not of MDPI and/or the editor(s). MDPI and/or the editor(s) disclaim responsibility for any injury to people or property resulting from any ideas, methods, instructions or products referred to in the content.