
Article

Exploring the Visibility Gap Between Public Investment and Media Discourse in the Wrocław Participatory Budget


by
Patryk Mierzejewski
1,*,
Klaudiusz Tomczyk
1,
Grzegorz Chrobak
2 and
Iwona Kaczmarek
2
1
Faculty of Biology and Animal Science, Wrocław University of Environmental and Life Sciences, 50-375 Wrocław, Poland
2
Department of Systems Research, Wrocław University of Environmental and Life Sciences, 50-375 Wrocław, Poland
*
Author to whom correspondence should be addressed.
Appl. Sci. 2026, 16(5), 2265; https://doi.org/10.3390/app16052265
Submission received: 13 January 2026 / Revised: 12 February 2026 / Accepted: 23 February 2026 / Published: 26 February 2026
(This article belongs to the Special Issue AI-Based Spatial Planning and Analysis)

Abstract

The purpose of this paper is to analyze the media visibility of investments implemented in Wrocław, with a particular focus on the democratization of urban processes through the Wrocław Participatory Budget (WPB) and to study the public perception of these projects within the local information landscape. The paper presents an integrated analytical methodology combining geospatial data from the Spatial Information System of Wrocław (SIP) with textual data from the full corpus of local news articles from Wrocław. A hybrid data processing pipeline was used, including filtering of articles about Wrocław, geoparsing of location names, matching articles to investments using classic Term Frequency-Inverse Document Frequency (TF-IDF) models and embedding in language models such as HerBERT, and sentiment analysis using the XLM-T model. The results reveal strong imbalances in the visibility of WPB projects, that almost 90% of investments were not mentioned even once in the media. Temporal sentiment analysis indicated differences between categories of WPB projects. The results confirm the existence of “media deserts” and “islands of attention,” which leads to information exclusion for specific local communities and marginalized groups. This translates into asymmetry in residents’ knowledge of the real scope of the WPB program. The paper emphasizes the importance of Geographic Information System (GIS) fusion methods with natural language processing models (NLP) for urban research, and identifies directions for further analysis, including accompanying problems and limitations in the present day.

1. Introduction

1.1. The City as an Information System and the Role of Local Media

With the development of urban planning, modern metropolises operate in an information ecosystem, in which urban planning processes and residents’ social relations are inextricably linked to the circulation of data and information, and to shared visions of the city shaped by residents. Modern metropolises have evolved into complex information ecosystems, which, in Michael Batty’s New Science of Cities terms [1], marks a shift from viewing the city as a static infrastructure to treating it as a dynamic “system of systems.” As Jacques-François Thisse [2] notes, this approach represents a shift in pattern, in which the physical structure gives way to the intensity of intangible flows and interactions that define agglomeration. This perspective corresponds with Manuel Castells’ concept of the “network society” [3], indicating the dominance of the “space of flows” over the physical “space of places,” which fundamentally redefines planning processes and the way residents experience the city. The dynamic development of digital tools means that in addition to traditional administrative data describing infrastructure, investments or land use, information from public space, among others, from the media, social networks, online forums and local services, is playing an increasingly key role. It is these that co-shape collective perceptions of the city and influence public perception of local government activities. Nowadays, researchers are treating residents as “human sensors,” whose digital footprint allows them to map emotions and moods in urban spaces with a precision unattainable by traditional methods [4]. As Shelton and his co-authors point out [5], data based on user opinions is often information noise and often reproduces existing socio-spatial inequalities, creating a virtual reflection of urban segregation.

1.2. Wrocław Participatory Budget as a Tool of Participatory Democracy

In this context, an influential role is played by the participatory budget (PB), a tool of participatory democracy that has been a principal element of urban policy in Poland for more than a decade. The Wrocław Participatory Budget, which has been in operation since 2013, allows residents to co-determine the allocation of a portion of the city budget for specific investment and social projects. However, the specifics of the Polish civic budget model differ from its prototypes. Studies show that in Polish cities PB often takes the form of a mechanism to fill in gaps in basic infrastructure, or the projects themselves are quite small. As Kębłowski and Van Criekingen [6] note, these projects are dominated by hard investments, which promotes easy-to-visualize topics at the expense of complex community initiatives. In the field of urban participation and participatory budgeting, there is growing interest in both the communication and placemaking aspects, an approach that involves collaboration between the city and the local space [7]. In a study, Smaniotto [8] defines the true meaning of participatory budgeting, which must be understood not as a tool for distributing public funds, but as a process of co-creating spatial meanings and building local identity. They emphasize that projects derived from the civic budget, especially those implemented in cities such as Lisbon, Valencia or also Warsaw, often become an acceleration of social activities and initiatives that respond to the needs of residents. From a placemaking perspective, PB fosters a bond between the community and the place, while enhancing a sense of agency and belonging. Studies note that a crucial element in the effectiveness of a participatory budget is its media visibility, i.e., how projects are publicized and commented on in the local media, and what impact they have on the level of interest among residents, as well as public perception. Media narratives can reinforce positive examples of participation, as well as marginalize smaller initiatives, which can affect the balance of public discourse around civic action. According to the authors, there is a need to further develop research methods to combine media communication analysis with spatial analysis of PB projects, which would help understand public perception of investments and their role in shaping the urban landscape.

1.3. Perception Gap Between the Investment Map and Media Discourse

While data on projects, as well as their details such as cost and location, are widely available, little is known about how such investments function in local media discourse and sentiment. We therefore face the problem of a perceptual gap between the objective map of investments and their social resonance. Numerous projects, despite their relevance to local communities, remain media invisible. At the same time, other projects that are often more controversial or visually striking dominate media attention. This phenomenon finds an explanation in the theory of intermedia agenda-setting, analyzed in detail by Vliegenthart and co-worker [9]. The authors showed that editorial boards operate under conditions of uncertainty and competition, monitor each other, try to outdo each other and duplicate the same topics undertaken by other outlets, which leads to a homogenization of coverage and a focus of media attention on a narrow catalog of investments. The result is a spatial and thematic imbalance in the “visibility” of urban interventions.

1.4. Research Aim, Questions and Hypotheses

The main objective of this study is to empirically analyze the media visibility and public perception of investments that are implemented under the WPB. The study focuses on systematically linking two key types of data:
  • Geospatial data on investments, extracted from the Spatial Information System of the City of Wrocław (SIP).
  • Textual data, derived from a corpus of articles published by a major local newspaper in Wrocław.
The following research question was thus established: How does the spatial distribution and subject matter of WPB projects affect their media visibility in the local media? It was hypothesized that projects with higher visual exposure, located in the central parts of the city, are more often present in media coverage than peripheral or community-based investments.
The contribution of this study is the development of a semi-automatic methodology for combining geospatial and textual data to link urban investments with corresponding newspaper articles and spatial-semantic analysis of local discourse. The study thus brings both a methodological element (integration of Geographic Information System (GIS) and Natural Language Processing (NLP) in the context of urban research) and a cognitive element (quantitative identification of the structure of media discourse on participatory investments).

1.5. Contribution and Position in the Literature

The development of the concept of urban data science has led in recent years to a significant transformation in the way cities are analyzed and understood. Metropolises are increasingly seen as complex information systems in which real-time data generated by media, institutions and residents themselves play a key role in describing both spatial and social processes. The functioning of cities as data systems makes it possible to observe urban dynamics with high temporal and spatial resolution, which significantly expands the possibilities of analysis compared to traditional static urban models. In an article made by Djokic and co-authors [10], the authors emphasize that urban data science combines analytical tools with questions about urban functioning, while combining diverse data sources, ensuring their representativeness, and incorporating ethical considerations into research based on data generated by residents remains crucial.
Natural language processing and sentiment analysis methods are increasingly being used in the context of the analysis of contemporary urban studies, which facilitate the processing and analysis of residents’ opinions expressed in social media, local portals or reviews of public spaces. Cai [11] emphasizes that natural language processing in the context of urban planning and city planning will facilitate the identification of discussion topics and key words related to the city, as well as analysis of public sentiment and the opinions and perceptions of urban space. In his paper, the author points out that the integration of these methods with spatial data and GIS makes it possible to create dynamic models of cities, combining social and spatial dimensions. The author also shows the challenges associated with the representativeness of the data, its multilingualism and the interpretation of the semantic context itself, stressing that many linguistic models are not yet developed and well-trained enough, and there is a need to develop them to facilitate more reliable and analysis of urban discourse.
Modern urban studies are increasingly combining linguistic analysis with computer vision models, aggregating social posts with street images, with the goal of better understanding the perception of urban space. In their study, Jayedi [12] propose an approach that uses sentiment extraction from geocoded posts using natural language processing models with classification of urban environmental features from Street View images. This makes it possible to create semantic maps depicting the sentiment of residents toward specific parts of the city depending on, for example, the region of the city or the activities the city has conducted in a particular place. This facilitates the analysis of urban space as a social experience and supports the planning of investments or urban initiatives based on the sentiments of residents.
In recent years, we can observe an increase in studies combining residents’ opinions along with spatial data, allowing us to study perceptions of urban projects over both time and space. Liu [13] used social media data to analyze public perception of infrastructure investments. Combining sentiment analysis of reviews with geolocation, the authors identified spatial patterns of opinion, indicating differences in perceptions of projects depending on local context. This approach confirms the growing potential of using media-derived data to create public perception maps to reflect the emotional and semantic reception of urban investments and can help support more adaptive urban planning.
Most research on public sentiment to date has focused on readily available data from social media, such as Twitter [14]. Our study fills an important gap by shifting the burden of analysis to the full corpus of the traditional local press. This allows us to capture the official, more structured discourse that is critical to shaping the city’s long-term political agenda, and which is still rarely the subject of integrated GIS and NLP analysis.

2. Materials and Methods

2.1. Study Area and Institutional Context

The study was conducted based on the city of Wrocław, one of the largest cities in Poland and the capital of Lower Silesia, which according to the 2021 census has a population of about 675,000, while the Wrocław agglomeration alone reaches approximately 1.2 million. The city is characterized by dynamic spatial development and an extensive network of neighborhoods with a diverse urban structure. The Wrocław Participatory Budget (WPB), in operation since 2013, is one of the largest and oldest participatory mechanisms in the country. Every year, residents decide on the allocation of funds, which in recent editions have oscillated between 30 and 33 million PLN [15]. Projects are divided into city-wide and neighborhood projects, and include revitalization of parks, construction of playgrounds, road infrastructure repairs and community initiatives [16].

2.2. Data Sources

2.2.1. Municipal Investment Database (SIP Wrocław)

The primary source of data was the urban investment database from the Spatial Information System of Wrocław (SIP Wrocław). It contains a complete record of city investments implemented between 2010 and 2025. Each record is described by attributes such as start and completion date, budget item name, detailed task description, type and status of investment, value and location (in point or polygon format). A total of 812 city investments were analyzed, of which only 684 were from the period of WPB operation. From this set, based on budget attributes, a subset of 137 projects closely related to the Wrocław Participatory Budget (WPB) was extracted, which is the main focus of the visibility analysis.

2.2.2. Media Corpus from Local News Articles from Wrocław

The second pillar of the study is a corpus of newspaper articles from local newspaper in Wrocław, a major local media outlet. The initial collection included about 18,000 articles published between 2010 and 2024, but after removing duplicate articles, the number decreased to about 14,500. The data was obtained using the web scraping method, extracting metadata such as link, title, publication date, author, abstract, full content, tags and number of comments. The choice of local press rather than social media was dictated by the nature of the discourse. As Pak and Paroubek [17] note, corpora based on journalistic texts are characterized by a different linguistic structure and greater objectivity than microblogs, which is crucial for analyzing topics with a long life-cycle, such as public investment. After the filtering process, the final analytical corpus consisted of about 2600 articles.

2.2.3. Additional Spatial Data

Auxiliary datasets were used as a reference background and reference layer for spatial analysis:
  • Official administrative division in Wrocław obtained from the publicly available database of the Spatial Information System of Wrocław. This collection contains the exact contours of settlement boundaries in shapefile format. This layer served an analytical function in the study, allowing aggregation of point data (investment locations) to the level of administrative units. This allowed us to examine the density of media mentions and identify disparities in the “visibility” of individual neighborhoods.
  • Urban topology and map background (OpenStreetMap). In order to visualize the results against the actual urban structure, the OpenStreetMap (OSM) project’s open mapping data was used. They were implemented in the form of map tiles that constitute the background layer. The use of a detailed underlay of streets, green areas and urban infrastructure made it possible to interpret the location of investments in the context of the city’s morphology, facilitating the orientation of Wrocław’s topography.

2.3. Analytical Workflow

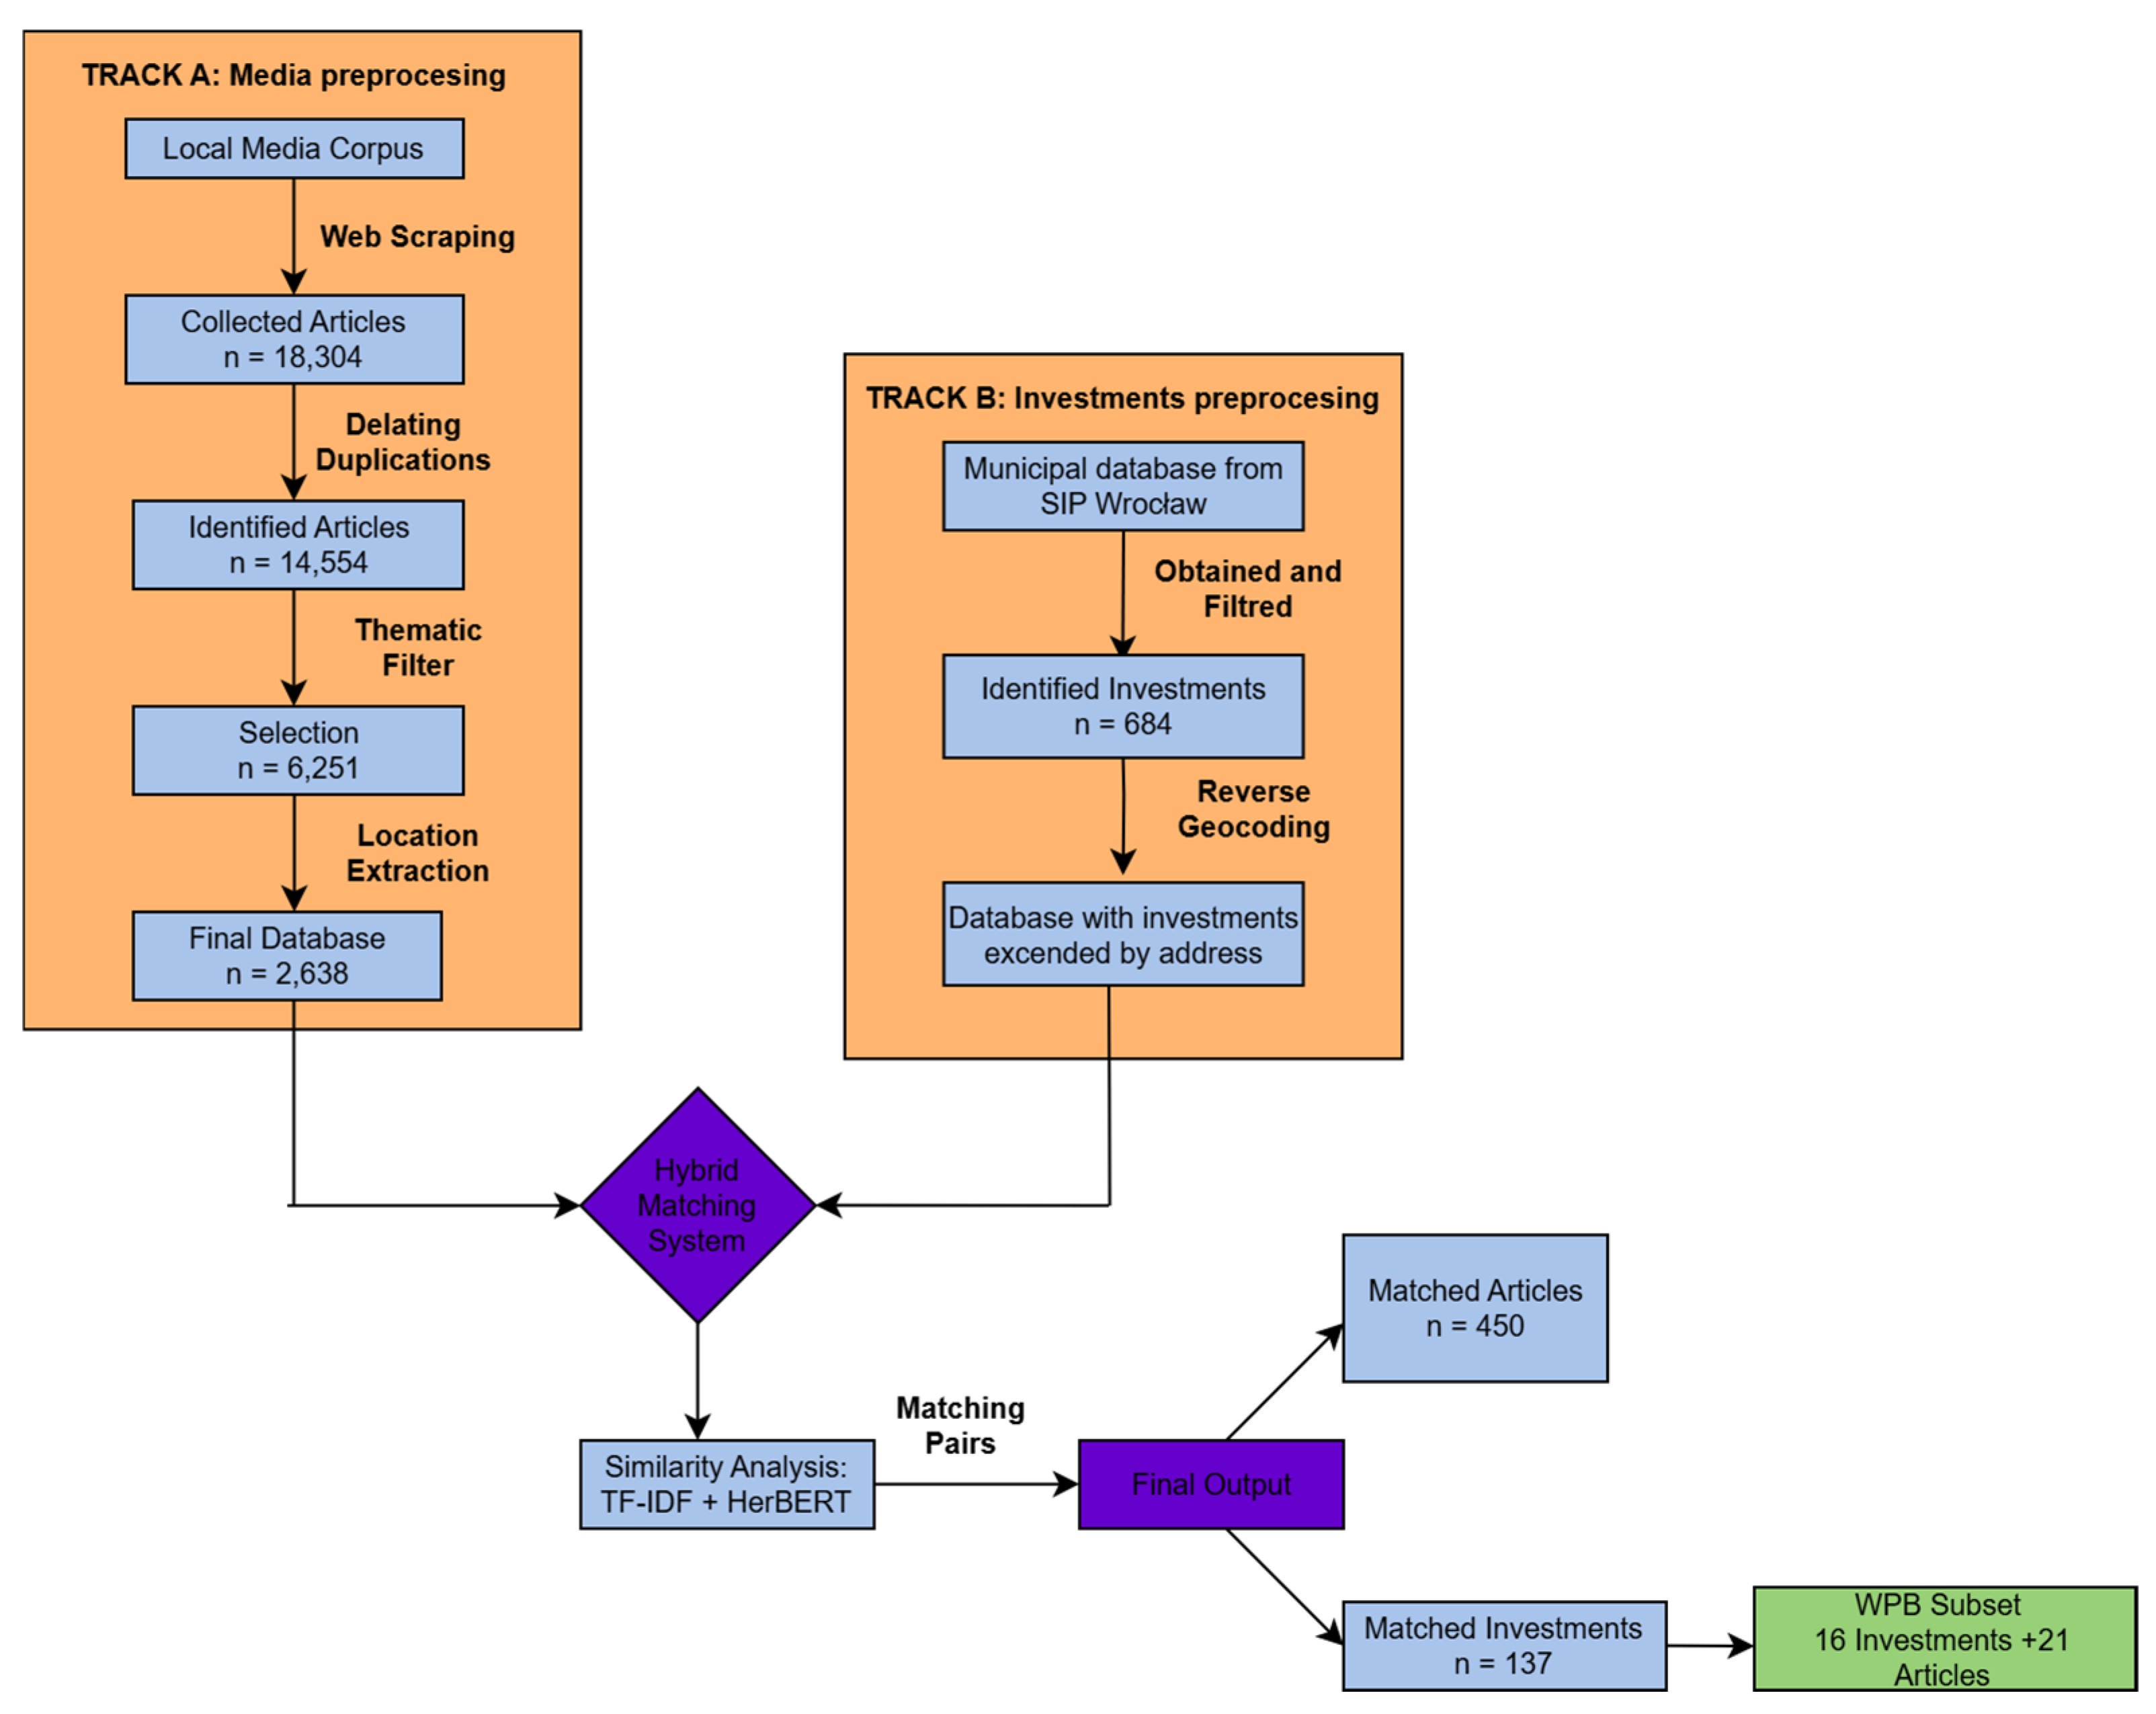
The research process was implemented based on a hybrid analytical workflow (analytical workflow), consisting of five main stages (Figure 1):

2.4. Scheme of Articles Related to Wrocław

The first stage of the analysis was the initial selection of source material, which involved filtering out articles unrelated to the city of Wrocław. In order to maximize both precision and completeness of information retrieval, three complementary techniques were used: classical regular expressions and two language models (Gemini and OpenAI). Regular expressions (regex) were developed based on sets of patterns that matched different forms of writing of names associated with Wrocław (e.g., “Wrocław”, “Wrocław”, names of districts, neighborhoods). The method was high precision but was restrictive and omitted cases that were ambiguous or written in a metaphorical context.
The generative models (Large Language Models—LMMs) of both OpenAI and Gemini were able to take into account context and capture additional information that the regex was unable to, resulting in the models falsely positively attributing items unrelated to Wrocław or partially related to Wrocław. After this filtering, each method identified about 6000 articles eligible for further analysis. In the analysis, Google Gemini (gemini-1.5-pro) and OpenAI (gpt-4o-mini) models were used. Both models were accessed via a Python API. The models performed both semantic text classification for association with Wrocław and extraction of location names in a structured format. The model received a fixed system prompt, forcing responses to be provided exclusively in structured JSON format. An article was considered Wrocław-related if it contained at least one unambiguous spatial reference to a location within the city’s administrative boundaries (e.g., a street, square, institution, housing estate, infrastructure facility). This criterion was spatial, not thematic.
It meant the presence of an anchor in a specific urban location, regardless of the overall topic of the text. Implementation details of the language models and the results of manual validation (precision/recall) are presented in Appendix A.
The result collected by the data triangulation method was once again subjected to a cleaning process, but this time targeted at eliminating content of low informational value in the context of spatial analysis. From the database were removed those articles in which the identified locations were too general, generic or had no informative value, e.g., “Wrocław”, “Odra”, ‘WKS’, “DK94”. After applying this filtering, the final article database included about 2600 articles that were of high quality and could be used for further analysis based on them.

2.5. Extraction and Geoparsing of Locations in the Media Corpus

The next step in the analysis was the extraction of location names, spatial places. This was done again using regex-based methods, LLM models (OpenAI and Gemini), but also the Geospacy library in the Python environment, which specializes in geoprocessing and geoparsing, i.e., identifying and associating place names (toponyms) with specific geographic coordinates.
During the analysis, it was observed that the method using GeoSpacy (NER models—Named Entity Recognition) has limited effectiveness in recognizing local toponyms specific to the topography of Wrocław, among others, such as the names of bridges, squares, streets and parks. Similar observations were noted by Nadeau [18] who conducted a comprehensive review of entity extraction (identification and extraction of specific information) methods, including both rule-based and statistical systems, as well as early hybrid approaches. In the article, they stressed that the effectiveness of NER models depends mainly on the characteristics of the training model, which determines the semantic range of recognizable names and the sensitivity of the model to contextual variants. Models such as those in GeoSpacy that have been trained on large, general datasets (e.g., press news primarily in English or international corpora) perform very well in standardized tests, but quite often fail when confronted with text containing proper names of a local or domain-specific nature. As a result, models based on such data have limited ability to correctly identify and extract microtoponyms and proper names operating in the local urban space, as could be seen when analyzing content about Wrocław, where there are numerous region-specific geographic names, as well as infrastructure names.
To minimizes the errors of each method of name extraction analysis, a data triangulation method was developed to ensure higher quality of the methods conducted, thus reducing errors and removing false matches of articles by any of the methods. This was achieved with the help of examining common links to articles and comparing the locations extracted by these methods.

2.6. Geocoding of Municipal Investments

In parallel with the analysis of the text corpus, data on urban investments were processed. These included the geographic coordinates (latitude and longitude) of each urban investment. This data was subjected to a reverse geocoding process, the purpose of which was to assign each set of geographic coordinates a corresponding administrative address. Thanks to this analysis, it was possible to obtain accurate information about the location of the objects on which the investment was made, including street name, building number, name of neighborhoods and other units of administrative division. The inverse geocoding process used was performed based on libraries in the Python (v3.12.0), using GeoPy (v2.4.1) with the Nominatim geocoder (OpenStreetMap), which allow integration with geolocation databases such as OpenStreetMap. Such treatments are widely used in spatial analysis and research using geographic data, as they allow automatic and precise geocoding of coordinates into text addresses. A similar approach was described, among others, by Goldberg [19], who presented both the concept and practical application of geocoding and reverse geocoding methods in the context of spatial and epidemiological analyses. According to their conclusions, such processes are a key step in the processing of spatial data, enabling its further analysis, visualization, as well as integration with other sources of information.

2.7. Matching Articles to Investments

The main task of the research was to create a semi-automatic matching of newspaper articles to specific city investments based on data from Wrocław. An approach was used that allows combining classical and neural methods of text representation. For this purpose, vector representations (embedding) were created for each item (article and city investment) and based on them text analysis was performed based on two methods: vector model and language model.
TF-IDF (Term Frequency-Inverse Document Frequency), which is a classic vector model based on word weights and how often they occurred. It has been one of the most used and cited approaches for decades due to its simplicity, interpretability and computational efficiency, which have made it the cornerstone of text analysis and information retrieval methods in many research works. In the classic approach presented by Salton [20], TF-IDF was a key component of the Vector Space Model (VSM), enabling similarity assessment, for example, by using cosine similarity between documents based on term weights. Today, the method continues to find use as a fast and effective text representation, especially in classification or sentiment analysis tasks, and as a reference for more advanced language models.
Language models based on transformer architecture have revolutionized natural language processing by enabling the creation of context-dependent word representations for the entire sentence. Their great advantage is that they can capture complex semantic and syntactic relationships, which has significantly improved performance in sentences such as sentiment analysis, text classification, as well as translation. In the case of Polish, the HerBERT model was developed by Mroczkowski [21]. The authors presented the first BERT-type model trained exclusively on large Polish corpora (including National Corpus of Polish (NCOP), Wikipedia, Free Readings, OpenSubtitles), achieving the highest results among similar models. HerBERT was developed for effective pre-training and the possibility of further tuning (fine-tuning) for specific tasks, such as sentiment analysis, topic classification and proper name recognition. Several similar language models were also used for the analysis, but after analyses, the HerBERT model proved to be the most optimal. The hybrid system generated vector representations by concatenating key fields for each entity to ensure comprehensive semantic coverage. For the media corpus, we utilized the article title, lead, full content, and identified location addresses; for the investment database, the representations included the investment name, category, task description, and geocoded administrative address. Preprocessing involved the removal of Polish function words (so-called stop-words, e.g., “i”, “na”, “z”, “w”) to enhance the semantic performance of the models.
The matching mechanism consisted of calculating similarity measures, such as cosine similarity, between these embeddings. To determine the optimal balance between precision and recall, a sensitivity analysis was conducted to select the similarity threshold, which was set empirically at 0.45. During testing, it was observed that thresholds lower than 0.45 increased false positives, often matching articles that shared a geographic location but lacked topical relevance to the specific investment. Conversely, thresholds higher than 0.45 led to false negatives, particularly by rejecting articles that correctly referenced investments but used general neighborhood toponyms instead of the precise street-level addresses found in the city database Appendix B.
This empirical calibration ensured a reliable linkage, allowing the system to connect approximately 450 articles to 180 unique urban investments, confirming the effectiveness of the hybrid approach. From this result, a final filtering step was performed to extract projects related exclusively to the Wrocław Participatory Budget (WPB), resulting in a subset of 16 investments linked to 21 matched articles.

2.8. Sentiment Analysis of Articles

The twitter-XLM-RoBERTa-base-sentiment model, described by Barbieri [22], was used for sentiment analysis. It has been trained on more than 198 million tweets in dozens of languages, making it perfectly tuned for sentiment analysis in a social media context, as it can effectively identify emotions and moods. To assess its applicability to Polish news articles, a manual validation procedure was conducted (see Appendix C).

2.9. Indicators and Visualizations

To verify the hypotheses and quantify the discourse, a set of four key indicators were defined and calculated:
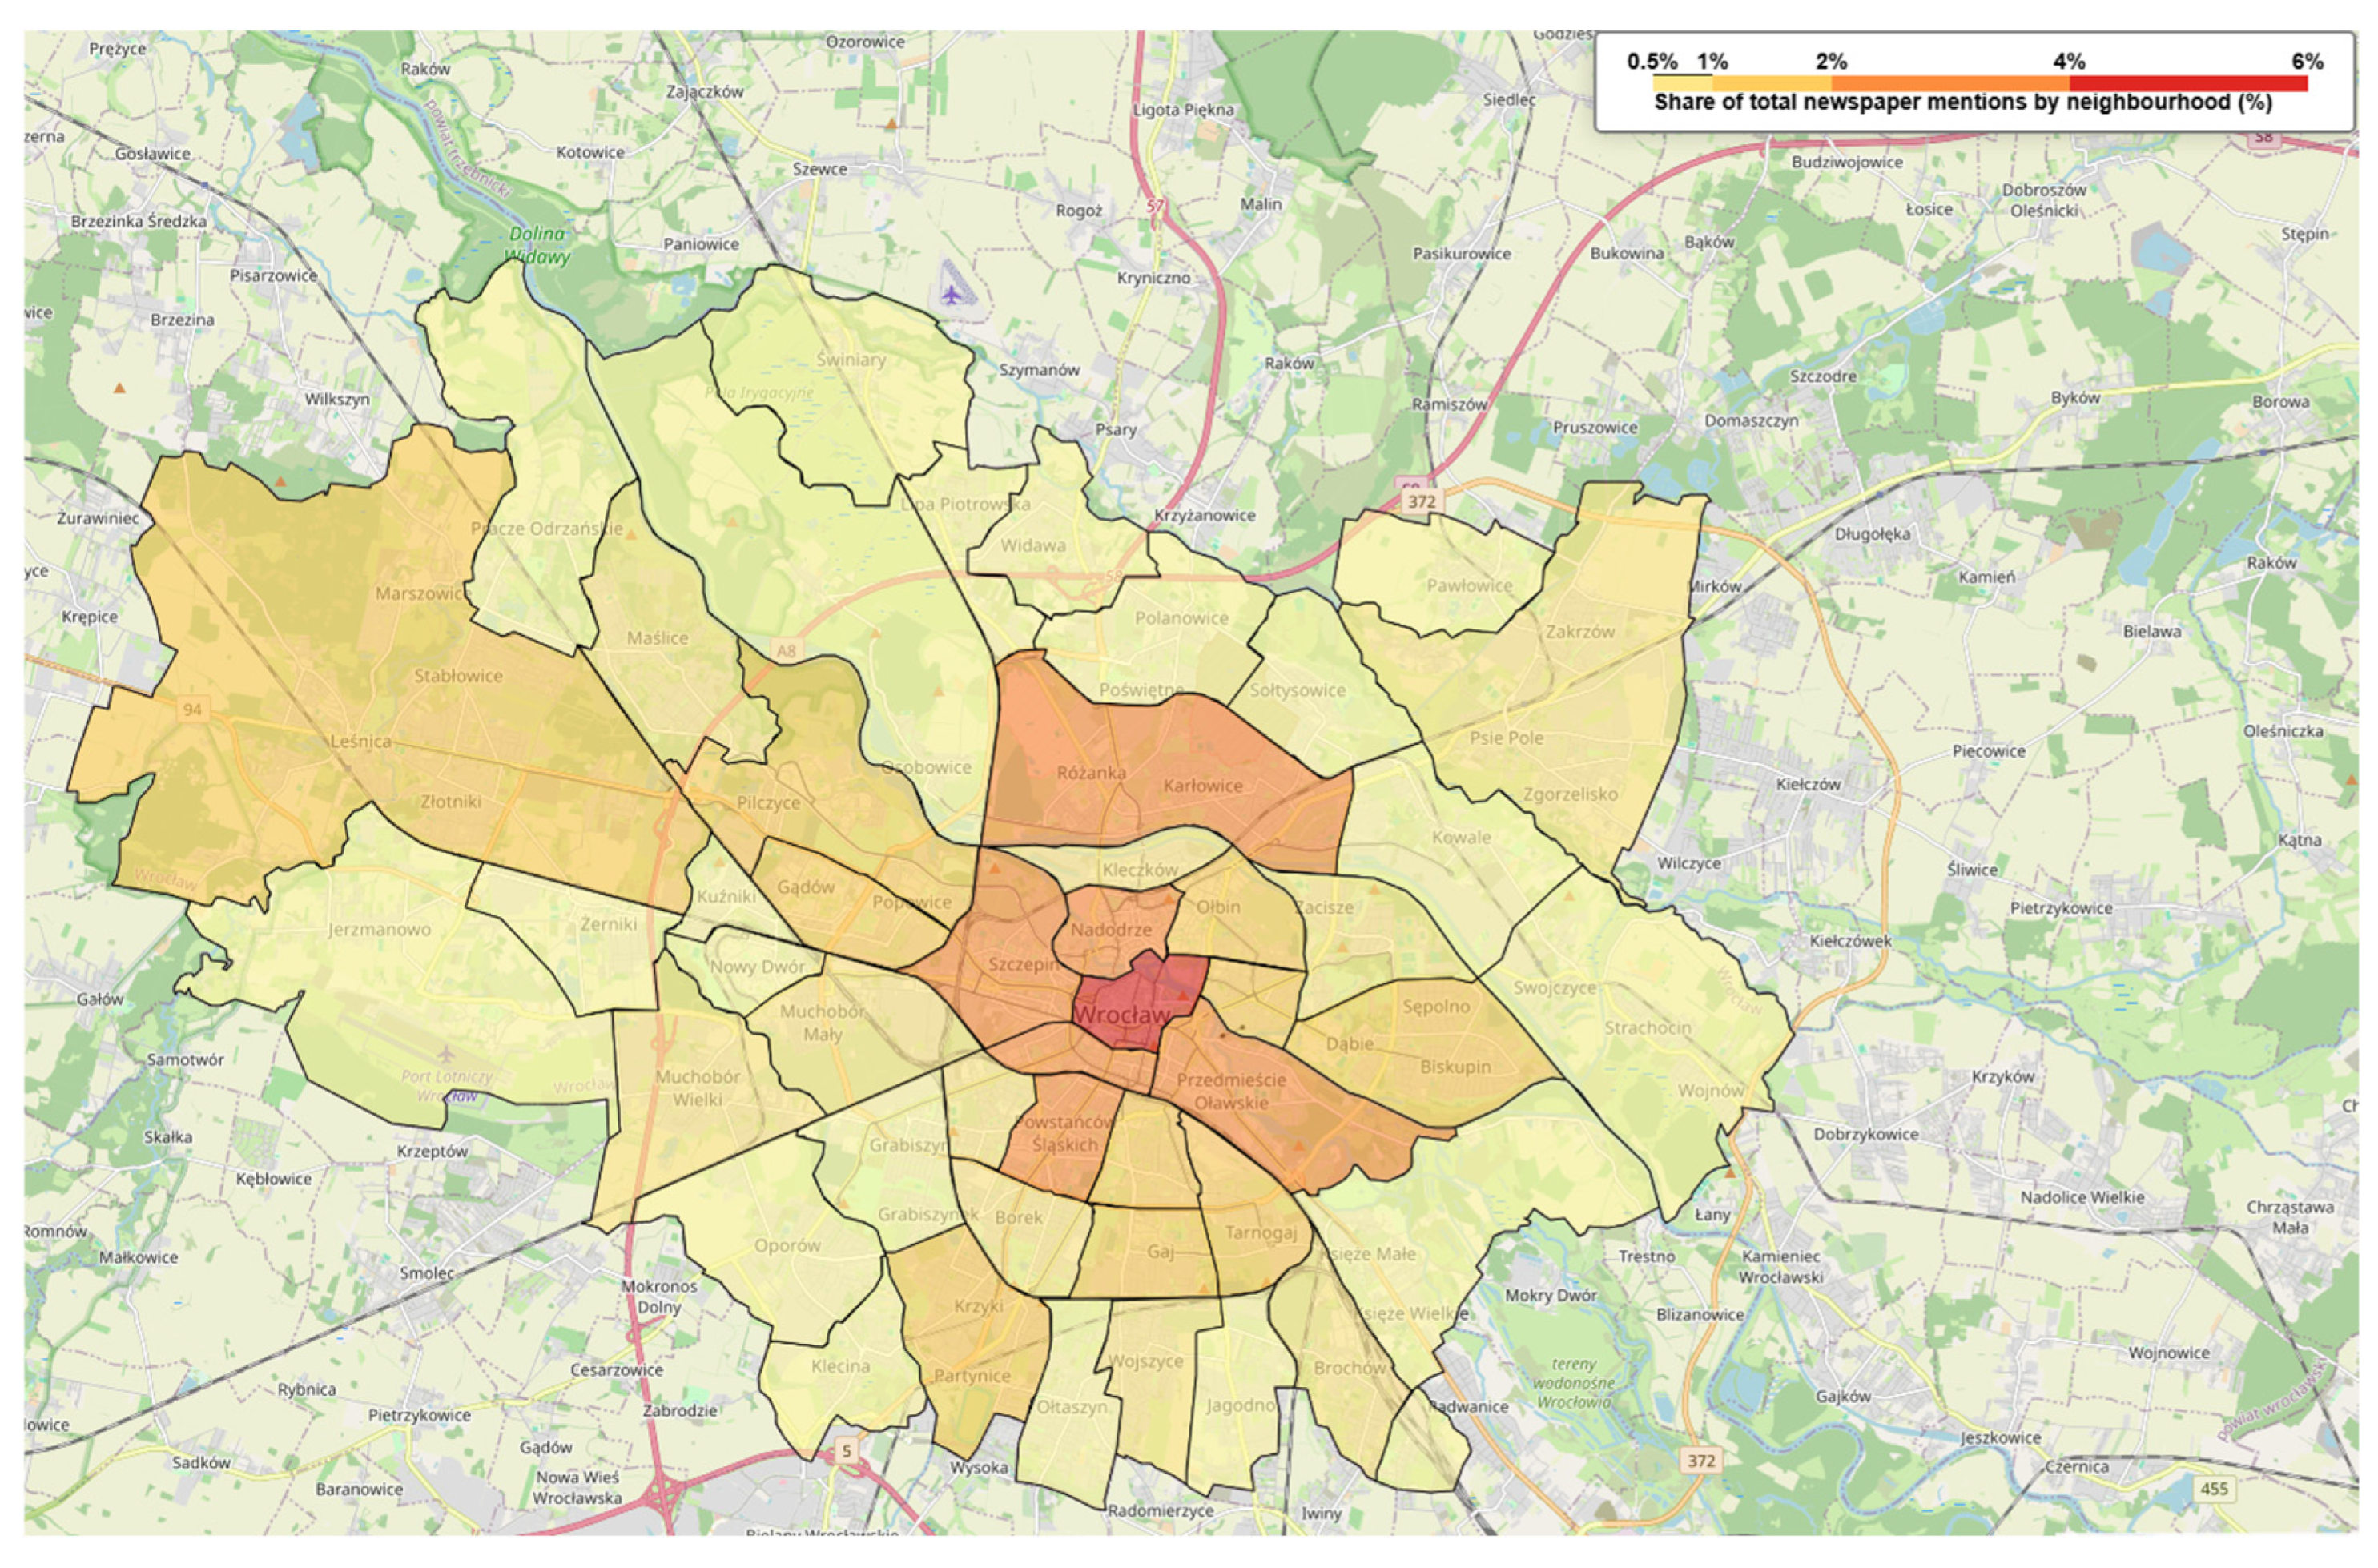
Density of mentions—This indicator was defined as the number of articles geolocated within the administrative boundaries of each settlement in Wrocław. Aggregation of spatial data made it possible to generate a heatmap, visualizing the geographic structure of the discourse. This tool was used to identify areas of media over-representation (so-called “islands of attention”) and overlooked areas, defined as “media deserts”.
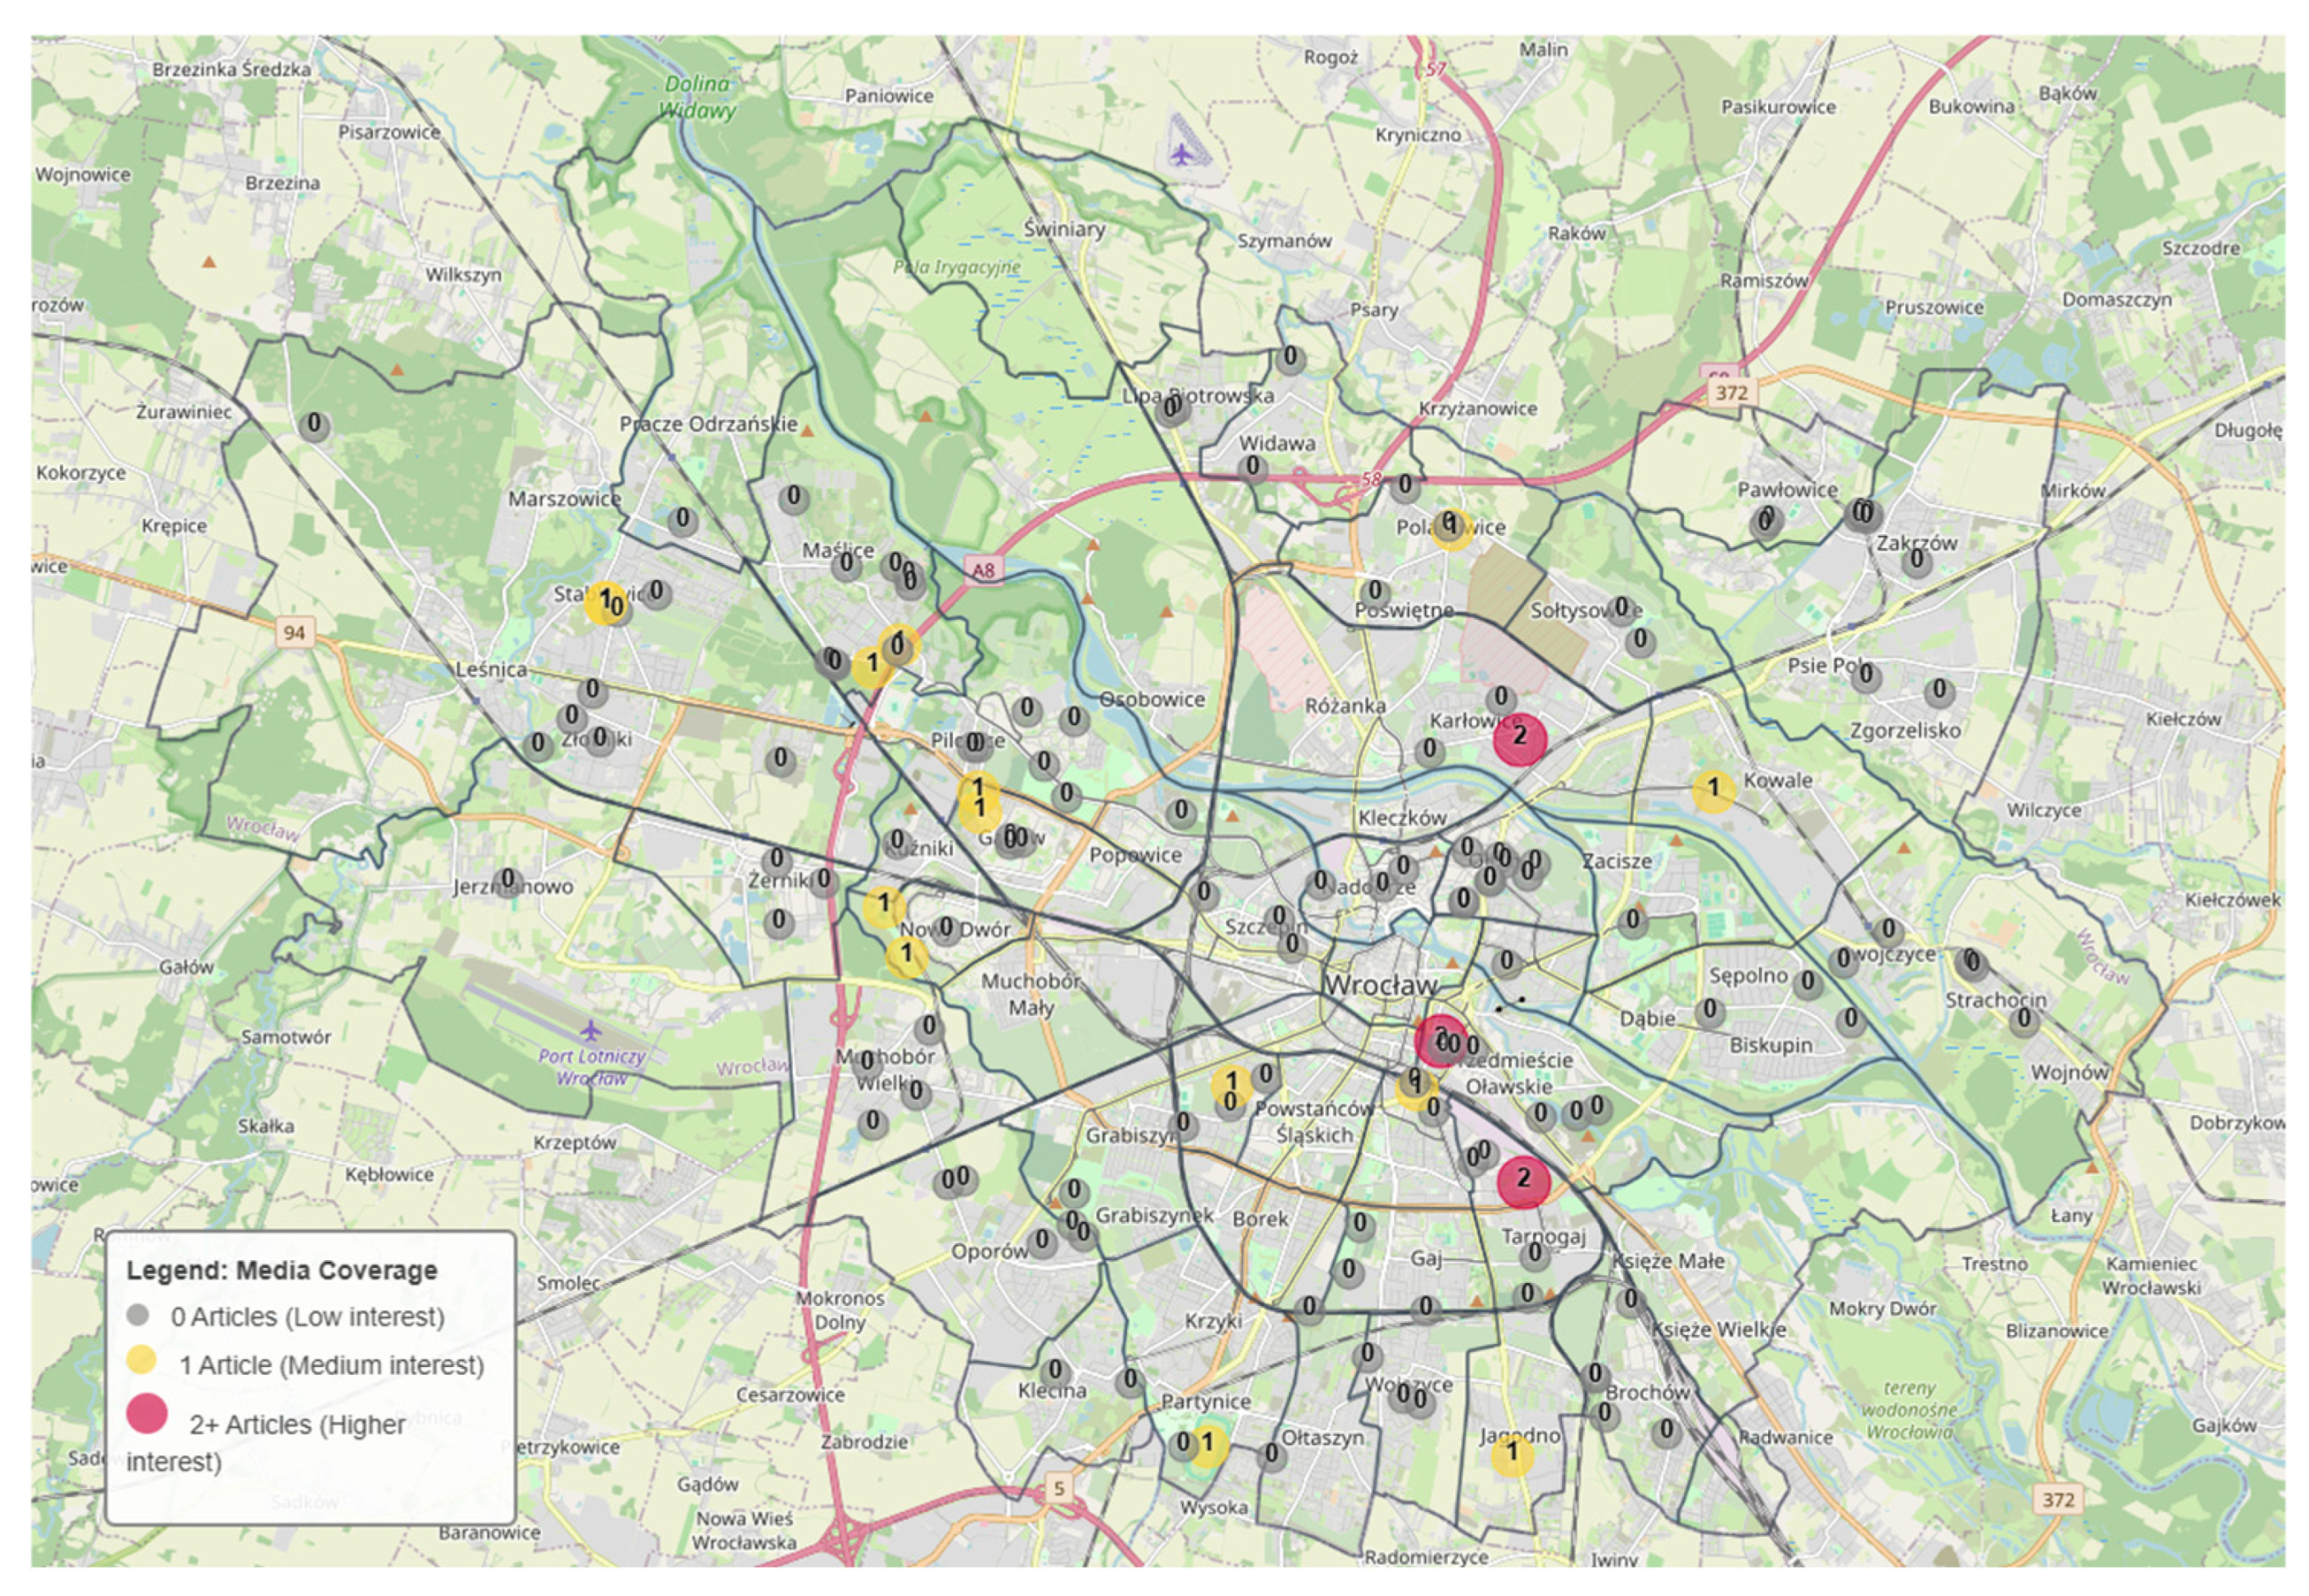
Project visibility—It consisted of categorizing WPB investments according to the number of articles devoted to them during the period under study. Differentiation thresholds were adopted: 0 (invisible investments—no mentions), 1 (incidental/low visibility) and 2+ (higher visibility). This division makes it possible to verify the hypothesis of elite media attention and statistically determine the scale of information exclusion of projects.
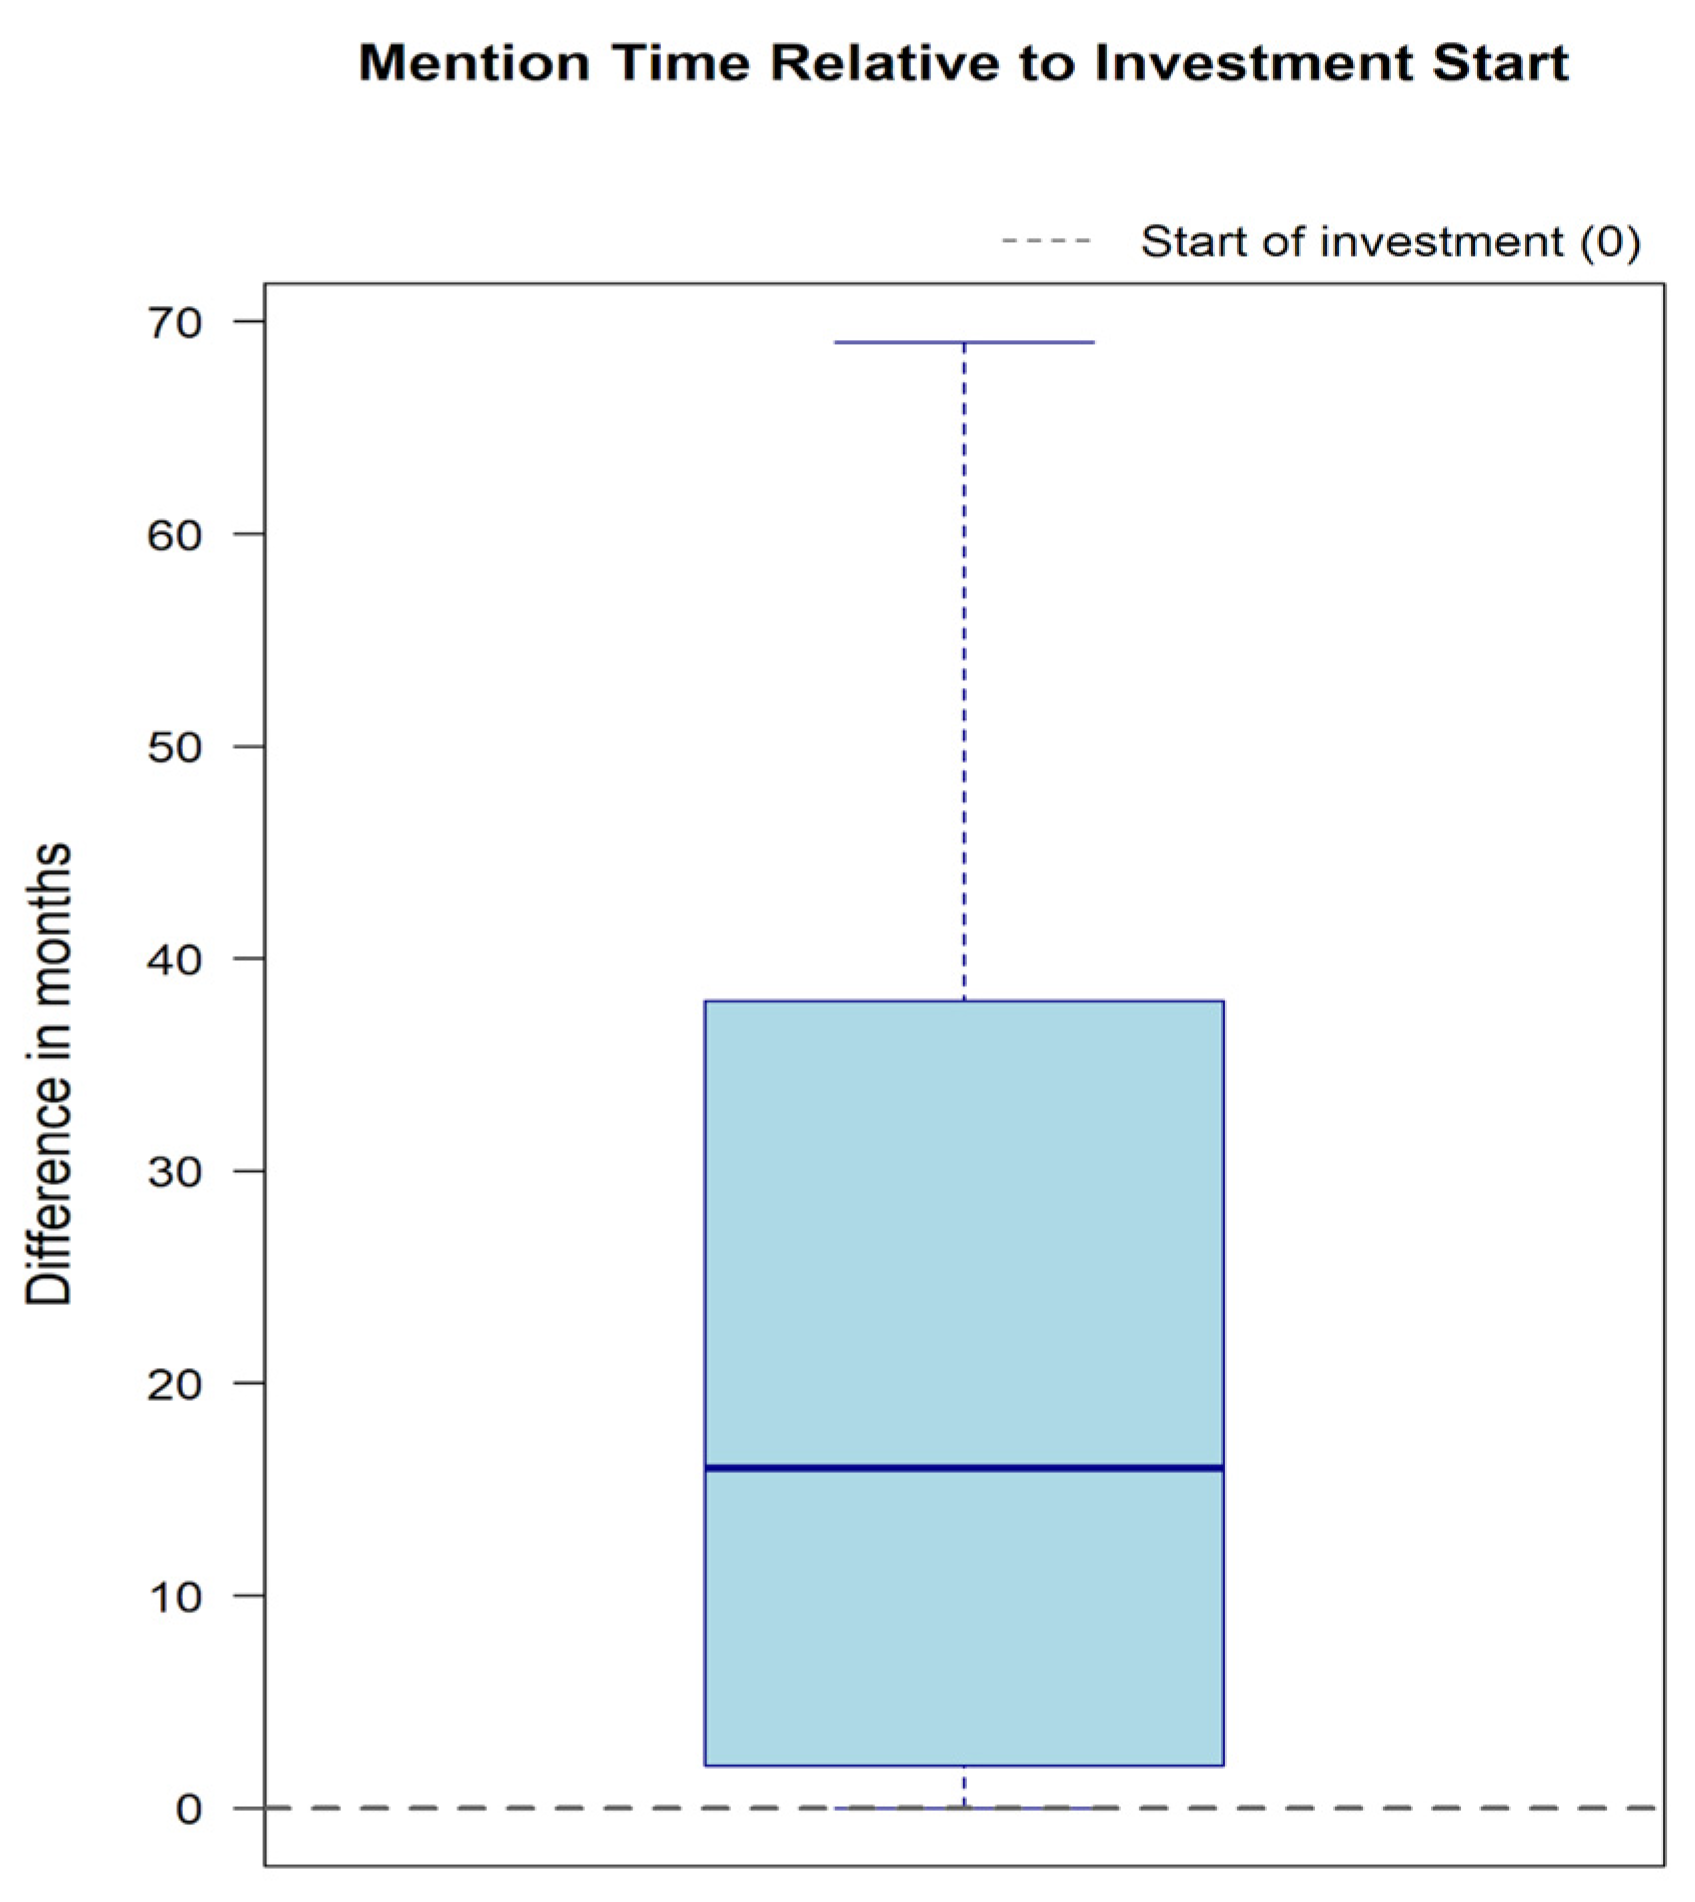
Relative publication time—Time lag was calculated as the difference in months between the date of publication of the article and the official start date of the investment, where the start of the investment was marked as a value of 0. This indicator, presented in box plots, made it possible to study the life-cycle of the topic, to determine the median lag of the media response.
Average sentiment over time—For each investment, average sentiment was calculated at monthly intervals, based on the results of the XLM-T model (normalized scale from −1 to +1, where −1 means negative, around 0 neutral, and 1 positive). The analysis was conducted across three categories: green projects, road-infrastructure projects, and other (sports/recreation). This made it possible to capture specific emotional patterns, such as the initial negative sentiment at road investments due to the inconvenience of repairs.

2.10. Validation and Limitations

The quality of the matches in the hybrid system was subjected to rigorous verification. A method of location data triangulation and manual verification of a random sample of article–investment pairs was used. This facilitated the elimination of false positive errors, such as those resulting from name homonymy or the misattribution of general geographic names (e.g., the river “Odra,” the club “WKS,” or also the mismatching of the city name itself) as specific investment locations. Expert verification was crucial to ensure the reliability of the connections between the unstructured text and the SIP-derived database.
The primary limitation of the study is the reliance of the analyses on a single media source. While this ensures consistency in the analysis of official discourse, it may not fully capture the dynamics, language and speed of response characteristics of social media (e.g., Facebook, Twitter/X). In addition, despite the use of advanced language models (HerBERT), automatic text processing carries the risk of interpretation errors in complex semantic contexts, which was minimized by rigorous data cleaning.

3. Results

3.1. Spatial Patterns of Media Activity in Wrocław—Density of Location Mentions

The resulting picture, shown in Figure 2, reveals a clear disproportion in the media narrative. We observe a strong concentration of mentions within the inner city (Old Town, Downtown, among others), forming so-called “islands of attention”. As the distance from the center increases, the intensity of media coverage decreases dramatically, leaving large areas of peripheral neighborhoods (such as Swojczyce and Swiniary) as “media deserts” in the media consciousness, which may be due to the fact that these neighborhoods are underdeveloped and far removed from the city center.

3.2. Visibility of WPB Projects in the Media Corpus—Share of Projects Covered by the Media

A matching analysis between the corpus of articles and the WPB investment database revealed a large gap in the “visibility” of Wrocław civic budget projects. According to the analysis, as many as 88% (about 120 of the 137) of the WPB projects analyzed did not see a single mention in this media corpus. This confirms the existence of extensive “media deserts” in public discourse. The remaining 12% that managed to break through in the media narrative were accompanied by specific characteristics; that is, the projects were either large (e.g., revitalizing parks or building skate parks) or they generated conflict or outrage among residents (e.g., repairing roads and sidewalks, which could generate negative perception due to road obstructions).

3.3. Spatial Distribution of Visibility: “Islands of Attention” and “Media Deserts”

The observed phenomenon finds strong support in the literature, particularly in the theory of news values formulated by Galtung and Ruge [23], where these authors defined a set of criteria that determine whether a fact will have high media coverage. According to Galtung and Ruge’s model, an event must reach a sufficient scale to be recorded by the mass media. WPB projects, which are inherently micro-local investments (e.g., yard revitalization, alley lighting, sidewalk repair), rarely reach the critical scale required to break through to the citywide agenda. Their impact is limited to a narrow group of residents, which, in theory, makes them “irrelevant” to a wide media audience. The consequences of this phenomenon are twofold. First, unequal access to information distorts the picture of the entire WPB program. The public learns only a fraction of its actual scope and diversity. Second, the marginalization of projects from the “media deserts” may lead to a sense of exclusion, as well as a lack of appreciation among local communities that actively participated in the creation and implementation of these initiatives, which in the long run may negatively affect the motivation for participation in subsequent editions of the WPB (Figure 3).

3.4. Temporal Dynamics of Discourse—Timing of Articles with Respect to the Investment Life-Cycle

The box plot shows the distribution of the time of publication of articles relative to the start of investment (Y axis expressed in months). The value “0” (dashed line) indicates the start of investment (Figure 4).
The analysis shows that almost all media mentions occur after the start of the investment. The median indicates that articles most often appear around 15–20 months after the start of the investment. The spread between the 25% and 75% quartiles suggests that the main wave of publications is concentrated between the 2nd and 40th months of the process. The upper end of the graph extends all the way to the 70th month, demonstrating that some investments generate media interest even more than 5 years after their initiation.

3.5. Distribution of Sentiment in Articles on WPB Investments

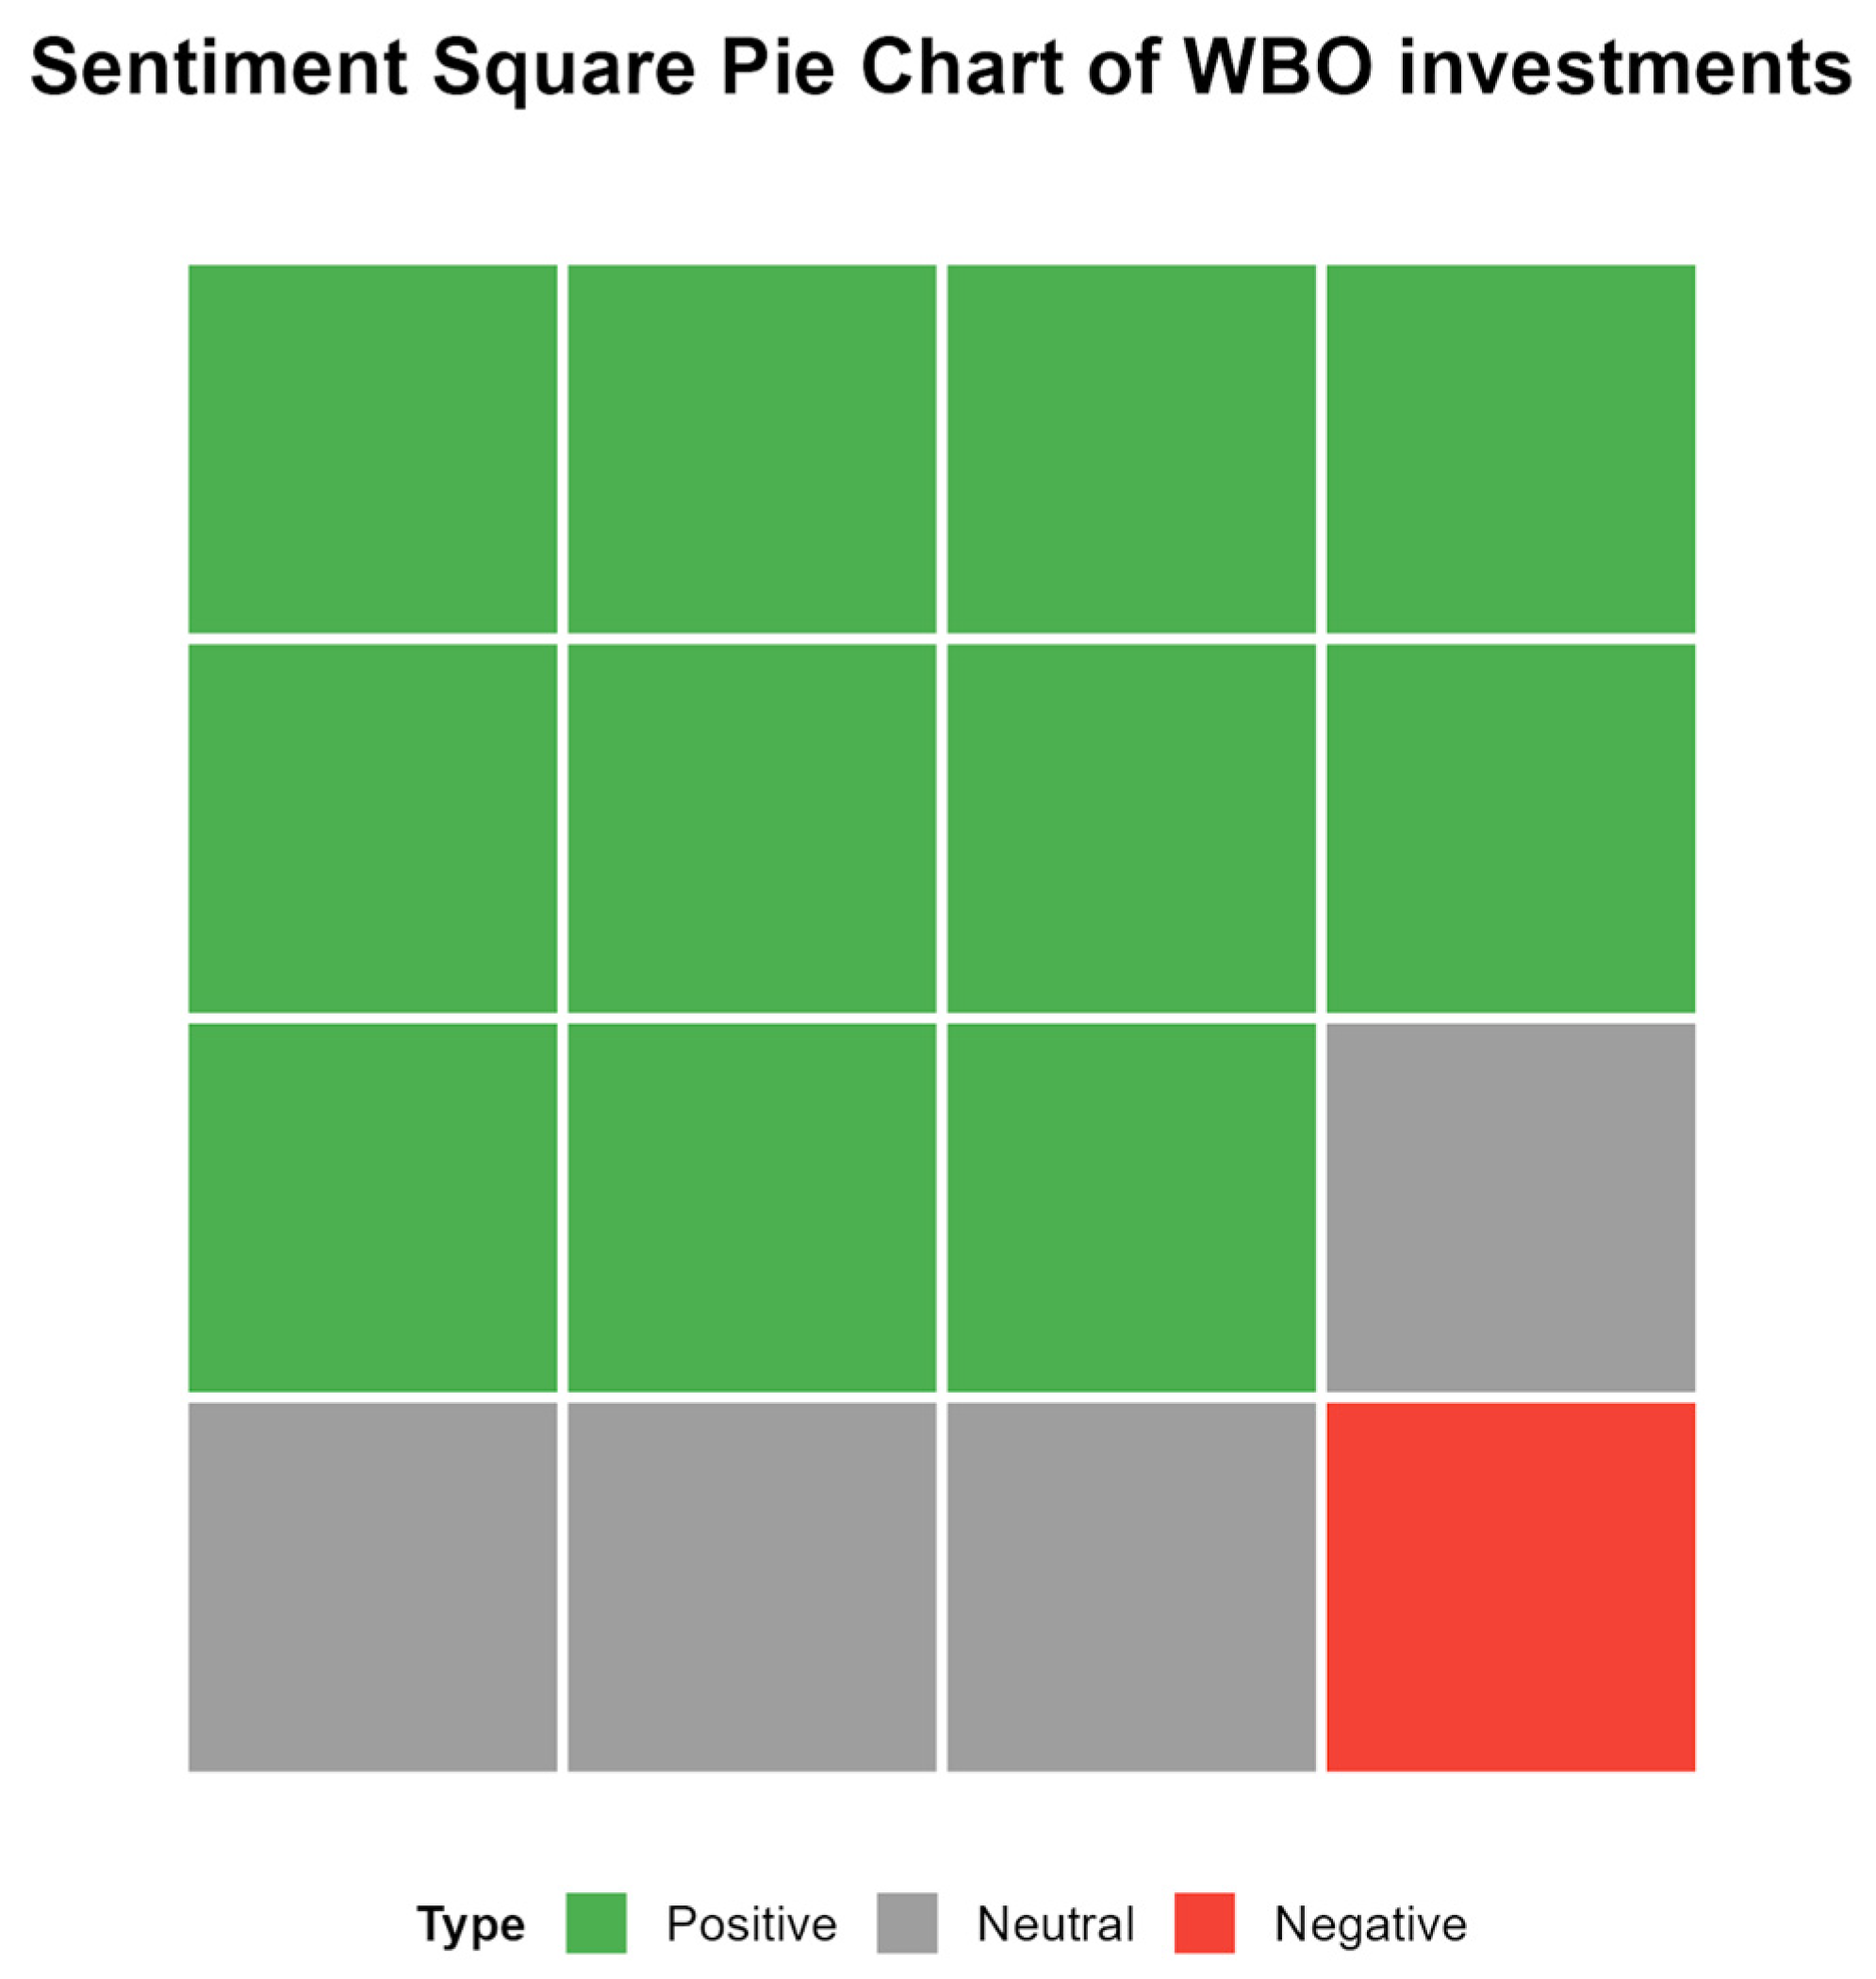
The tiled graph above illustrates the distribution of sentiment in articles about the WPB investments analyzed (Figure 5). Each of the 16 squares represents 6.25% of the total sample. The data shows a clear dominance of positive overtones (green color), which covers nearly 69% (11 of 16 squares) of all analyzed materials. Neutral overtones (gray) account for 25% of the sample, while articles of a negative nature (red) are marginal and account for only about 6% of all mentions. This suggests that ongoing projects are met with enthusiasm or approval from the public.

3.6. Sentiment Differences Across WPB Project Categories

The visual analysis made it possible to distinguish specific patterns assigned to each WPB investment category.

3.7. Road and Infrastructure Projects

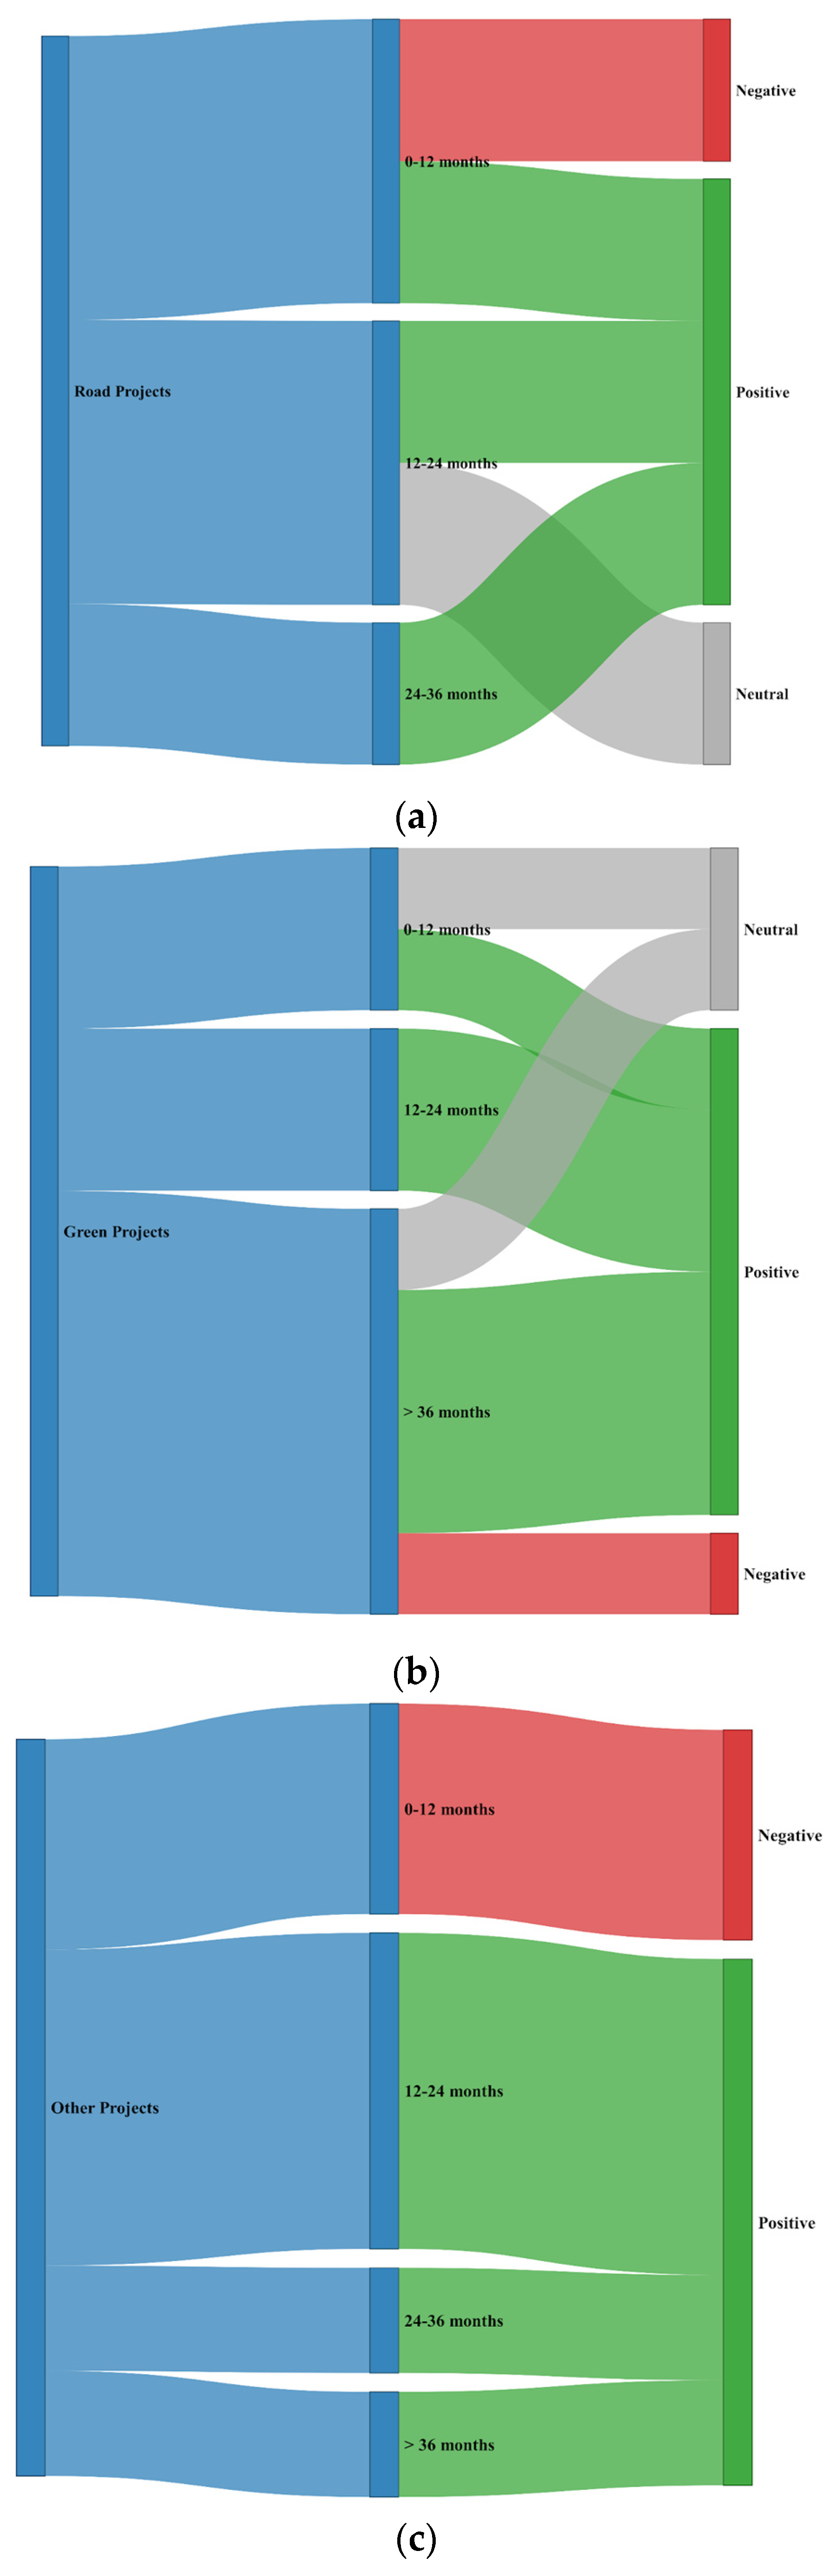
Road and infrastructure projects show the greatest dynamics of change and polarization of sentiment. In the initial phase (up to about the 12th month), there is a dominant flow of negative sentiment, which is in stark contrast to the other categories. However, in subsequent periods (from 12 to 24 months and beyond), the trend reverses, and neutral and positive opinions begin to dominate. This suggests concern and a pessimistic attitude of residents towards the renovations related to the difficulties in the city caused by the closure of some roads during the renovations (Figure 6a).

3.8. Green Projects

Green projects are initially characterized by neutral sentiment, which evolves into positive sentiment over time. The share of negative sentiment is marginal in their case and appears only marginally in the later phase of operation (Figure 6b).

3.9. Sports and Other Projects

The category of “Sports and other” projects is initially accompanied by negative sentiment, but after 12 months it changes to positive. This may suggest that people are initially negative about investments in the construction of sports fields, skateparks, etc., while over time their opinion changes, recognizing that these projects are right and have an impact on the well-being of residents (Figure 6c).

4. Discussion

4.1. Spatial and Temporal Asymmetry in Public Discourse

The synthesis of the results reveals a profound asymmetry in the public discussion concerning the Wrocław Participatory Budget (WPB). The results indicate that there are extensive “media deserts” where as many as 88% of investments did not make it into the media narrative, thus being overshadowed by everyday events, which is confirmed in the literature on the analysis of public opinion on major urban transformations (Fang [24]). The authors of the study, analyzing construction projects in context, showed that the attention of local communities is strongly focused on the potential damage (e.g., environmental or living conditions) generated during the investment process. As a result, WPB micro-projects, which are local in nature and often do not generate high-profile spatial conflicts, do not achieve the critical mass necessary to appear on the media agenda.
A temporal analysis showed specific dynamics in the development of sentiment, e.g., projects aimed at developing roads and urban infrastructure in general initially enjoyed positive sentiment, but over time this sentiment declined and became more negative. This indicates that the perception of investments is strongly correlated with the immediate needs of residents, and not only with their ultimate usefulness. Although the observed patterns of ‘media deserts’ and ‘islands of attention’ are highly suggestive, they are currently framed as exploratory. Further research involving controlled statistical models is required to account for confounding factors such as population density or the geographic centrality of districts.

4.2. Local Media and Spatial Digital Inequalities

Digital spatial inequalities, i.e., the identification of the phenomenon of so-called media deserts and the concentration of media attention on selected areas of the city, confirm the theory of “urban inequality in the media.” As Chua and co-authors [25] have shown, the digital footprint is not a neutral reflection of the city, but a reproduction of the existing socio-spatial hierarchy. The results of our analyses prove that this mechanism applies not only to spontaneous posts by residents, but also to urban media.
The thematic selectivity of this newspaper is part of a broader problem defined by Napoli and co-authors [26]. The researchers showed that information ecosystems do not cover cities evenly but systematically marginalize neighborhoods with lower socioeconomic status or less commercial potential. As a result, local media, instead of focusing on the city as a whole, focus only on a fraction of it. In this view, the observed asymmetry can be interpreted as a dysfunction of the urban information system. According to Bailey and Grossardt’s theory of structured public engagement [27], the success of democratic processes such as participatory budgeting depends on the existence of an efficient feedback loop. The lack of media “visibility” of completed investments in the peripheries interrupts this loop, which can lead to a weakening of the legitimacy of the entire WPB program and a decline in the sense of agency among residents of marginalized neighborhoods. This may exacerbate the phenomenon described by Gilbert [28]. The author points out that digital and information infrastructure often serves to strengthen the capital of privileged areas (city centers, affluent neighborhoods), while the peripheries remain in the “narrative shadow”.

4.3. Sentiment of Life-Cycle and Social Acceptance of Urban Investments

The collected data allow us to draw important conclusions about the psychology of perception of changes in urban space. The initial increase in negative sentiment observed in infrastructure projects can be interpreted as the social “costs of change,” resulting from the nuisance of the construction process or fears of interference with the existing landscape. This phenomenon is confirmed in the literature, particularly in the concept of the U-shaped social acceptance curve, described, among others, by Wolsink [29], support for investments is usually high at a general level, but drops dramatically during the planning and construction phases, only to rise again after the project is completed, when the community begins to recognize its functionality. A key addition to this model is the theory of place attachment described by Patrick Devine-Wright and his co-authors [30]; the researchers reject the NIMBY (Not In My Back Yard) stereotype, which suggests that residents have a selfish attitude towards investments, pointing out that their aversion to investments stems from fears of losing their identity and emotional connection to the landscape, as well as from fears of the inconveniences caused by the development of this space.

4.4. Value of Integrating GIS and NLP in Participatory Budgeting Research

This work contributes to the field of research on the digital footprint of cities, placing the results in the context of global urban analytics challenges such as digital spatial inequalities, automation of participation analysis, integration of GIS with NLP, and several others. The integration of GIS with NLP shows the enormous potential of natural language processing models. The analytical pipeline we have developed fits into the framework proposed notably by Vasdev [31] and subsequent studies. We have shown that the key task is to develop and improve the training of language models, as these models perform very well with obvious examples but need refinement with extraordinarily complex examples. This would allow us to go beyond simple keyword mapping. The automation of participation analysis was made possible by the use of natural language processing models to evaluate civic projects, which is in line with the trend of AI-assisted participatory planning. Similar methods for natural language analysis were used by researchers from Seoul [32], who used thematic modeling to analyze budget proposals. Our work extends this approach by analyzing not the proposals themselves, but their reception in the media. The sentiment monitoring system presented in the study fits into the framework of “Urban E-planning” defined by Nummi [33]. In his review, the author revealed the lack of and emphasized the need for a tool that combines social media “buzz” with official planning procedures. Our study fills this gap by proposing a semi-automatic analytical pipeline that supports the analysis of residents’ opinions in the decision-making process for spatial planning of future investments.

4.5. Limitations and Directions for Methodological Improvement

The main limitation of this study was that the analyses were based on only one of many media sources in Wrocław, namely the corpus of local newspaper. Although it is one of the main local media outlets, its narrative does not fully reflect the range of opinions of residents, especially those expressed on social media, which are characterized by different dynamics and language. Furthermore, the use of natural language processing models, despite their current sophistication, carried an elevated risk of generating false positives, which required rigorous verification and data cleaning.
Further research should focus on expanding the collection of articles to include articles from a variety of media, as well as social media (e.g., Facebook, Twitter/X) and local forums. This would make it possible to verify whether the phenomenon of “media deserts” also occurs in the context of other media or resident discussions. Another promising direction would be the development and thorough training of natural language processing models and multimodal models combining text and image analysis (e.g., photos of investment plans), which would provide an understanding of the perception of urban space in line with trends. Another good direction would be to examine how the narrative created by the media about investments affects turnout in voting for subsequent editions of the Participatory Budget.

5. Conclusions

The analysis showed that WPB media visibility is highly selective, with as many as 88% of projects not appearing in the studied corpus, resulting in extensive “media deserts.” Specific patterns of public reception were also identified: green projects enjoy stable support, while infrastructure investments are subject to a “U-curve,” where initial negative sentiment evolves into approval only after the work is completed.
For city management, this means the need to implement GIS and NLP-based monitoring, which would facilitate the identification of informationally excluded areas and more precise communication targeting. Awareness of the cyclical nature of public sentiment can also help to alleviate social tensions during the implementation of difficult investments, such as road projects.
The information asymmetry revealed in this study highlights critical barriers within the functioning of participatory democracy. The media invisibility of nearly 90% of WPB projects signifies a systemic exclusion of marginalized groups and breaks the essential feedback loop between the city administration and its citizens. As the local press serves as the primary forum for public discourse, leaving these investments in a “narrative shadow” prevents residents from recognizing tangible solutions that enhance local well-being. This lack of visibility not only diminishes social agency and motivation for future participation but also prevents neighborhoods from drawing inspiration from successful local initiatives. Without active countermeasures against “media deserts,” participatory budgeting risks exacerbating spatial information inequalities rather than fostering urban inclusivity.
From an urban studies perspective, it is crucial to expand future research to include several diverse sources of newspaper corpora, social media, and the use of multimodal models (text and image). Another important direction is to verify the impact of media narratives on hard behavioral data, such as turnout in subsequent elections.
This study provides an exploratory foundation for understanding spatial media bias. Future work should integrate multivariate regression models to control district population and investment scale, and further examine the relationship between media visibility and long-term voter engagement in the WPB, including the impact of media narratives on hard behavioral data such as turnout in subsequent elections.

Author Contributions

Conceptualization, P.M. and I.K.; methodology, P.M., G.C. and I.K.; validation, K.T. and I.K.; formal analysis, P.M., G.C. and I.K.; investigation, K.T.; data curation, P.M., G.C. and I.K.; writing—original draft preparation, P.M., G.C. and K.T.; writing—review and editing, P.M. and I.K.; visualization, P.M. and I.K. All authors have read and agreed to the published version of the manuscript.

Funding

Selected components of the analysis were developed within the framework of projects that have received funding from the European Union’s Horizon 2020 research and innovation program under the Marie Skłodowska-Curie grant agreement No. 101007638 (EYE—Economy bY spacE) and an international project co-financed by the Ministry of Science and Higher Education program “PMW” for the years 2022–2025; agreement no. 5239/H2020/2022/2.

Institutional Review Board Statement

Not applicable.

Informed Consent Statement

Not applicable.

Data Availability Statement

Restrictions apply to the datasets.

Conflicts of Interest

The authors declare no conflicts of interest.

Appendix A

Models used for filtering and extraction of Wrocław-related articles:
  • Google Gemini (gemini-1.5-pro, accessed [September 2025])
  • OpenAI (gpt-4o-mini, accessed [September 2025])
System prompt used for LLM-based filtering:
The following Polish-language system prompt was used for semantic classification and structured location extraction:
  • Original (Polish):
  • “Jesteś ekstraktorem lokalizacji z tekstów po polsku.
  • Zwracasz wyłącznie JSON: {“is_Wrocław_related”: true|false, “locations”: [“…”,”…”]}
  • Interesuje nas tylko Wrocław (ulice, place, mosty, dzielnice/osiedla, obiekty).
  • Jeśli brak powiązania z Wrocławiem: is_Wrocław_related=false i locations=[].”
  • English (translation):
  • “You are a location extractor for Polish-language texts.
  • Return JSON only: {‘is_Wrocław_related’: true|false, ‘locations’: [‘…’, ‘…’]}.
  • We are interested only in Wrocław (streets, squares, bridges, districts/neighbourhoods, and landmarks).
  • If there is no relation to Wrocław, set is_Wrocław_related=false and locations=[].”
Models were invoked via API with deterministic decoding settings (temperature = 0.0, max_output_tokens = 256). Inputs were truncated to 1500 characters. Malformed or invalid JSON responses were conservatively treated as negative results.
Manual validation and performance assessment:
To evaluate the reliability of the filtering and extraction pipeline, a random sample of 100 articles was manually annotated. Each article was independently labeled for:
  • Wrocław-relatedness (binary document-level classification),
  • Presence of at least one correct location within the administrative boundaries of Wrocław.
Document-level performance:
  • Precision = 0.918
  • Recall = 0.900
  • F1-score = 0.909
  • Accuracy = 0.909
Location-level performance (at least one correct location within gold-positive articles):
  • Precision = 0.933
  • Recall = 0.913
  • F1-score = 0.923
Table A1. A confusion matrix for document-level classification is provided below.
Gold PositiveGold Negative
System positive464
System negative545
Table A2. A confusion matrix for location extraction (within gold Wrocław-related articles).
Gold: ≥1 Correct LocationGold: No Correct Location
System: ≥1 correct433
System: no correct4-

Appendix B

Validation of the Matching Pipeline

To evaluate the performance of our automated matching algorithm, we conducted manual validation using a subset of 100 articles and 10 investments. The validation set was structured to evaluate both the sensitivity and the specificity of the pipeline:
Article Selection (n = 100):
  • 90 randomly selected articles from the corpus to reflect the general distribution of topics.
  • 5 articles manually identified as containing specific mentions of WPB projects (to test Recall).
  • 5 articles identified as “near-misses”—mentioning locations associated with projects (e.g., a specific park or street name) but not the investments themselves (to test Precision/False Positives).
Project Selection (n = 10):
  • 5 projects manually selected because they were known to have media coverage (corresponding to the 5 positive articles mentioned above).
  • 5 projects selected randomly from the WPB database to ensure the system does not generate “hallucinated” links for less-publicized investments.
Table A3. Confusion matrix for the matching pipeline validation.
System PositiveSystem Negative
Gold positive42
Gold negative193
Performance metrics for the matching pipeline:
  • Precision = 0.67.
  • Recall = 0.8.
  • F1-score = 0.73.
  • Accuracy = 0.97.
Error Analysis:
  • False Positives: Occurred primarily when an article discussed a specific street or park (the location of a WPB project) in a general context (e.g., municipal maintenance or different city investments) without mentioning the specific participatory budget project.
  • False Negatives: The single omission was due to a highly non-standard description of the project in the media text, which the keyword-based algorithm failed to link to the official project title.

Appendix C

Validation of the Sentiment Analysis Pipeline

Model used for sentiment analysis of news articles:
  • XLM-T model (twitter-XLM-RoBERTa-base-sentiment).
Manual validation and performance assessment: To evaluate the reliability of the sentiment analysis pipeline, a random sample of 100 articles was manually annotated by experts to establish a “manual standard” for comparison with the XLM-T model’s predictions.
Sentiment classification performance:
  • Accuracy = 0.84
Table A4. Confusion matrix for sentiment classification (n = 100).
XLM-T: PositiveXLM-T: NeutralXLM-T: Negative
Manual: Positive2500
Manual: Neutral13512
Manual: Negative1224
The validation results confirm that the XLM-T model is robust in capturing the nuances of Polish journalistic discourse. An accuracy of 84% demonstrates that the transformer-based approach is highly effective for this domain. The majority of errors (12 cases) occurred when the model predicted a “Neutral” sentiment for articles manually labeled as “Negative”. This indicates that the model sometimes adopts a more “objective” or factual stance, typical for AI trained on broad datasets, and misses subtle negative social undertones perceived by human readers in the context of urban infrastructure issues. Nevertheless, this performance justifies the use of advanced SOTA models over traditional methods.

References

  1. Batty, M. The New Science of Cities; MIT Press: Cambridge, MA, USA, 2013. [Google Scholar]
  2. Thisse, J.-F. The New Science of Cities by Michael Batty: The opinion of an economist. J. Econ. Lit. 2014, 52, 805–819. [Google Scholar] [CrossRef] [Scilit]
  3. Castells, M. The Rise of the Network Society; Blackwell: Oxford, UK, 1996. [Google Scholar]
  4. Resch, B.; Summa, A.; Sagl, G.; Zeile, P.; Exner, J.P. Urban Emotions—Geo-semantic emotion extraction from technical sensors, human sensors and crowdsourced data. In Progress in Location-Based Services 2014; Gartner, G., Huang, H., Eds.; Springer: Cham, Switzerland, 2015; pp. 199–212. [Google Scholar] [CrossRef] [Scilit]
  5. Shelton, T.; Poorthuis, A.; Zook, M. Social media and the city: Rethinking urban socio-spatial inequality using user-generated geographic information. Landsc. Urban Plan. 2015, 142, 198–211. [Google Scholar] [CrossRef] [Scilit]
  6. Kębłowski, W.; Van Criekingen, M. How “alternative” alternative urban policies really are? The case of participatory budgeting in Polish cities. Métropoles 2014, 15. [Google Scholar] [CrossRef] [Scilit]
  7. Narodowy Instytut Dziedzictwa (NID). Placemaking Jako Metoda Pracy z Lokalną Społecznością. Available online: https://samorzad.nid.pl/baza_wiedzy/placemaking-jako-metoda-pracy-z-lokalna-spolecznoscia (accessed on 18 December 2025).
  8. Smaniotto Costa, C.; García-Esparza, J.A.; Kimic, K. Participatory Budgeting and Placemaking: Concepts, Methods, and Practices. Urban Plan. 2024, 9, 7162. [Google Scholar] [CrossRef] [Scilit]
  9. Vliegenthart, R.; Walgrave, S. The contingency of intermedia agenda setting: A longitudinal study in Belgium. J. Mass Commun. Q. 2008, 85, 860–877. [Google Scholar] [CrossRef] [Scilit]
  10. Djokić, V.; Djordjević, A.; Milovanović, A. Big data and urban form: A systematic review. J. Big Data 2025, 12, 17. [Google Scholar] [CrossRef] [Scilit]
  11. Cai, M. Natural language processing for urban research: A systematic review. Heliyon 2021, 7, e06322. [Google Scholar] [CrossRef] [Scilit]
  12. Jayedi, A.; Matisziw, T.C. Urban sentiment mapping using language and vision models in spatial analysis. Front. Comput. Sci. 2025, 7, 1504523. [Google Scholar] [CrossRef] [Scilit]
  13. Liu, X.; Shuang, Q.; Xu, X.; Zheng, Z. A Spatiotemporal Analytical Framework for Dynamic Public Opinion and Sentiment Analysis on Mega Infrastructure Project. Eng. Constr. Archit. Manag. 2025. ahead of print. [Google Scholar] [CrossRef] [Scilit]
  14. Bollen, J.; Mao, H.; Pepe, A. Modeling Public Mood and Emotion: Twitter Sentiment and Socio-Economic Phenomena. In Proceedings of the Fifth International AAAI Conference on Web and Social Media (ICWSM 2011), Barcelona, Spain, 17–21 July 2011; pp. 195–202. [Google Scholar] [CrossRef] [Scilit]
  15. Bednarska-Olejniczak, D.; Olejniczak, J. Participatory budget of Wrocław as an element of Smart City 3.0 concept. In XIX. Mezinárodní Kolokvium o Regionálních Vědách; Masarykova univerzita: Brno, Czech Republic, 2016; pp. 746–753. [Google Scholar] [CrossRef] [Scilit]
  16. Skrzypczyński, R. Wrocław Civic Budget as a tool for introducing changes into the landscapes of Wrocław’s neighbourhoods. IOP Conf. Ser. Mater. Sci. Eng. 2020, 960, 042010. [Google Scholar]
  17. Pak, A.; Paroubek, P. Twitter as a Corpus for Sentiment Analysis and Opinion Mining. In Proceedings of the Seventh International Conference on Language Resources and Evaluation (LREC’10), Valletta, Malta, 17–23 May 2010; pp. 1320–1326. [Google Scholar]
  18. Nadeau, D.; Sekine, S. A Survey of Named Entity Recognition and Classification. Lingvisticae Investig. 2007, 30, 3–26. [Google Scholar] [CrossRef] [Scilit]
  19. Goldberg, D.W.; Wilson, J.P.; Knoblock, C.A. From text to geographic coordinates: The current state of geocoding. URISA J. 2007, 19, 33–46. [Google Scholar]
  20. Salton, G.; Wong, A.; Yang, C.S. A vector space model for automatic indexing. Commun. ACM 1975, 18, 613–620. [Google Scholar] [CrossRef] [Scilit]
  21. Mroczkowski, R.; Rybak, P.; Wróblewska, A.; Gawlik, I. HerBERT: Efficiently Pretrained Transformer-based Language Model for Polish. In Proceedings of the 8th Workshop on Balto-Slavic Natural Language Processing; Association for Computational Linguistics: Kyiv, Ukraine, 2021; pp. 1–10. [Google Scholar]
  22. Barbieri, F.; Espinosa Anke, L.; Camacho-Collados, J. XLM-T: Multilingual Language Models in Twitter for Sentiment Analysis and Beyond. In Proceedings of the Thirteenth Language Resources and Evaluation Conference; European Language Resources Association: Marseille, France, 2022; pp. 258–266. [Google Scholar] [CrossRef] [Scilit]
  23. Galtung, J.; Ruge, M.H. The Structure of Foreign News. J. Peace Res. 1965, 2, 64–91. [Google Scholar] [CrossRef] [Scilit]
  24. Fang, J.; Huang, D.; Xu, J. Social Risk Early Warning of Environmental Damage of Large-Scale Construction Projects in China Based on Network Governance and LSTM Model. Complexity 2020, 2020, 8863997. [Google Scholar] [CrossRef] [Scilit]
  25. Chua, A.; Servillo, L.; Marcheggiani, E.; Vande Moere, A. Mapping Cilento: Using geotagged social media data to characterize tourist flows in southern Italy. Tour. Manag. 2016, 57, 295–310. [Google Scholar] [CrossRef] [Scilit]
  26. Napoli, P.M.; Stonbely, S.; McCollough, K.; Renninger, B. Local Journalism and the Information needs of Local Communities. J. Pract. 2016, 11, 373–395. [Google Scholar] [CrossRef] [Scilit]
  27. Bailey, K.; Grossardt, T. Toward Structured Public Involvement: Justice, Geography and Collaborative Geospatial/Geovisual Decision Support Systems. Ann. Assoc. Am. Geogr. 2010, 100, 57–86. [Google Scholar] [CrossRef] [Scilit]
  28. Gilbert, M.R. Theorizing Digital and Urban Inequalities. Inf. Commun. Soc. 2010, 13, 1000–1018. [Google Scholar] [CrossRef] [Scilit]
  29. Wolsink, M. Wind Power Implementation: The Nature of Public Attitudes: Equity and Fairness Instead of ‘Backyard Motives’. Renew. Sustain. Energy Rev. 2007, 11, 1188–1207. [Google Scholar] [CrossRef] [Scilit]
  30. Devine-Wright, P. Rethinking NIMBYism: The Role of Place Attachment and Place Identity in Explaining Place-Protective Action. J. Community Appl. Soc. Psychol. 2009, 19, 426–441. [Google Scholar] [CrossRef] [Scilit]
  31. Vasdev, K. Integrating GIS with Natural Language Processing for Location-Based Insights. Int. J. Multidiscip. Res. 2024, 6, 23437. [Google Scholar] [CrossRef]
  32. Shin, B. Residents’ Voices on Proposals: Analysing a Participatory Budgeting Project in Seoul Using Topic Modelling. In Electronic Participation; Edelmann, N., Danneels, L., Novak, A.-S., Panagiotopoulos, P., Susha, I., Eds.; Lecture Notes in Computer Science; Springer: Cham, Switzerland, 2023; Volume 14153, pp. 50–64. [Google Scholar] [CrossRef] [Scilit]
  33. Nummi, P. Social Media Data Analysis in Urban e-Planning. Int. J. E-Plan. Res. 2017, 6, 18–31. [Google Scholar] [CrossRef] [Scilit]
Figure 1. Prism diagram showing the analytical pipeline.
Applsci 16 02265 g001
Figure 2. Map of the density of location mentions in the media corpus.
Applsci 16 02265 g002
Figure 3. Spatial distribution of media visibility of WPB projects.
Applsci 16 02265 g003
Figure 4. Distribution of article publication dates relative to the investment start date (in months).
Applsci 16 02265 g004
Figure 5. Tile chart showing the average sentiment for each WPB investment.
Applsci 16 02265 g005
Figure 6. (a) Graph showing differences in sentiment time for road projects. (b) Graph showing differences in sentiment time for green projects. (c) Graph showing differences in sentiment time for other projects.
Applsci 16 02265 g006
Disclaimer/Publisher’s Note: The statements, opinions and data contained in all publications are solely those of the individual author(s) and contributor(s) and not of MDPI and/or the editor(s). MDPI and/or the editor(s) disclaim responsibility for any injury to people or property resulting from any ideas, methods, instructions or products referred to in the content.