Abstract
With the increasing demand for takeaway delivery, more merchants are developing their takeaway delivery system to manage order fulfillment and enhance the consumer online experience. This study presents a mathematical model for merchant-operated takeaway delivery, using an improved ant colony algorithm integrated with K-means to cluster customer locations and determine optimal routes. We propose two fairness strategies—order quantity and travel distance—to ensure equitable workload distribution among riders. The K-means algorithm is enhanced by reallocating cluster assignments based on the nodes’ distances to all cluster centers. The simulation results demonstrate that the designed algorithm and strategies generate efficient optimal delivery plans for merchants.
1. Introduction
With the development of e-commerce, takeaway delivery, which mainly serves orders within a limited area, has become increasingly popular. The delivery person, who is named as the rider, is required to pick up the goods from the merchant node and deliver them to the consumer node directly within a short time. Normally, the pickup and delivery process should be finished within one hour after the consumer orders online. To deliver multiple goods to corresponding consumers in time, companies prioritize takeaway delivery in the order distribution and delivery route optimization process. Multiple research studies have improved takeaway delivery efficiency and consumer shopping experience [1].
To improve the consumer shopping experience in the takeaway delivery process, Teng et al. [2] established a mathematical model that considers the mutual satisfaction of merchants and customers and optimized delivery routes by integrating an insertion heuristic into a genetic algorithm. Pei et al. [3] developed an evaluation system for consumer experiences in the takeaway shopping process using a backpropagation neural network. They found that browsing, tangibility, empathy, responsiveness, reliability, and assurance significantly influence consumer satisfaction. Yeo et al. [4] analyzed how consumer experience, attitude, and behavioral intentions affect online food delivery within the contingency framework. Lang et al. [5] established a takeaway order volume prediction model by applying cloud computing resource scheduling with an improved artificial neural network. The model shows good performance in forecasting takeaway order quantity in the future. Liu et al. [6] proposed an idea about using urban taxis for takeaway food delivery, which demonstrated that food delivery can be finished by a small number of taxis within a limited time.
Order assignment and delivery path planning are the key challenges in the takeaway delivery process. Zhang et al. [7] proposed a method for solving the order selection and path optimization problem by employing water wave optimization metaheuristics and a taboo search [8], which has good performance in application. The order assignment for takeaway delivery should consider the total travel distance of the rider. The K-means cluster algorithm performs well in finding the center of data with the same character [9,10]. Recent advancements in clustering-based multimodal optimization have demonstrated effective workload balancing through algorithm hybridization [11]. Li et al. [12] designed a K-max cluster algorithm to solve the order distribution problem based on categorical data, and its effectiveness was verified using a numerical example. Je-Min et al. [13] proposed a method for dividing the delivery area based on the K-means algorithm. This method proved to be reasonable in generating a good area division result. For example, Moreno et al. [14] applied this framework to a meat distribution company’s territory design problem, integrating K-means with optimization to solve the challenge. The algorithm demonstrated strong performance in the Valparaiso case study. Ning et al. [15] proposed a takeaway order assignment model based on the clustering and route planning algorithm.
Researchers have extensively studied the traveling salesman problem (TSP) due to its computational complexity and wide applications in route optimization. In delivery route optimization, a common approach involves dividing customers into clusters and solving the TSP in each cluster. For takeaway delivery, researchers have conducted numerous studies on route optimization [16]. To obtain the optimal routes, researchers implemented particle swarm optimization [17,18], genetic algorithms [19,20], and heuristic algorithms [21], incorporating some modification strategies to solve the route optimization problem. Emerging metaheuristics combining greedy randomized search with adaptive neighborhood selection have shown particular promise in dynamic delivery environments [22]. Considering the dynamic routing environment and traffic congestion, Xu et al. [23] proposed a fissile ripple-spreading algorithm based on co-evolutionary path optimization. The designed algorithm performs well in simultaneously solving the delivery sequence and shortest path problems. Zheng et al. [24] developed an adaptive extensive neighborhood search (ALNS) algorithm for the route planning of freight buses with pickup and delivery. Xue et al. [25] designed a two-stage model using mixed-integer programming to optimize the rider scheduling for food takeaway delivery, which helps reduce the delivery cost.
Huang et al. [26] improved the ant colony algorithm by integrating a density peak clustering algorithm and a local optimization strategy. The improved algorithm performed well in solving the traveling salesman problem. Novel pheromone updating mechanisms with backtracking capabilities have recently enhanced algorithm convergence in complex routing scenarios [27]. For example, Zhang et al. [28] designed a delivery path optimization based on a clone adaptive ant colony optimization for the last-mile assignment problem. By applying a new distribution cost fitness function, the improved algorithm shows a faster convergence speed, and its results regarding the economic expenditure and delivery time are lower than other algorithms. Taking real-time traffic conditions into consideration, Liu et al. [29] proposed a hybrid ant colony system and virtual transformation method (ACS–VTM) for delivery routing optimization, where this algorithm significantly improves vehicle utilization and delivery efficiency.
With the increasing demand for takeaway delivery, merchants are inclined to hire a certain number of riders to operate the delivery process by themselves. The merchant self-operated takeaway delivery model, which has significant advantages in controlling delivery time and goods quality, is gaining increasing attention. For riders, they are more concerned about the fairness of order assignment. This paper studied the merchant self-operated takeaway delivery by dividing it into order assignment and delivery path planning. To guarantee fairness in the order assignment process, we allocated customer orders to riders based on traveling distance, order quantity, and consumer location distribution. For delivery path planning, the optimal route with the least travel distance or time should be presented to the rider in a limited timeframe, which requires the algorithm to find the optimal route with a fast convergence speed. The merchant self-operated takeaway delivery model was established, and it was solved using a framework that integrates K-means clustering with an improved ant colony optimization algorithm. The order quantity fairness and traveling distance fairness were considered during the solving process to balance the workload distribution between riders.
2. Problem Description and Assumptions
The takeaway delivery discussed in this paper refers to the process in which consumers place orders through online ordering platforms, and the goods are prepared offline and delivered to the consumers by the rider after the merchant accepts the orders. The rider receives the goods from a fixed address for merchant self-operated takeaway delivery. Its route optimization problem is a TSP to minimize the distance traveled.
When establishing the model for merchant self-operated takeaway delivery, it was assumed that:
- (1)
- Merchants have sufficient delivery capacity.
- (2)
- Most takeaway deliveries are goods with regular outer packaging, small volume, and lightweight. The capacity limit of the delivery vehicle is no longer considered.
- (3)
- The delivery distance is generally within 5 km. Most delivery vehicles are electric vehicles, and their batteries can be replaced quickly. Therefore, this paper does not consider the battery life of the delivery vehicles.
- (4)
- The number of riders K is assumed to be less than or equal to the number of orders N. When K > N, only the first N riders are each assigned one order, and the remaining riders remain untasked.
3. Model Establishment
For merchant self-operated takeaway delivery, the merchant receives the order information from the online platform. Merchants are responsible for arranging a special delivery team to complete the work. In the merchant self-operated takeaway delivery model, each rider will take goods of multiple orders within a certain period from a similar area and deliver the goods to each consumer following the route optimization result. After all delivery tasks are completed, the rider will return to the merchant’s address and wait for the next round of delivery tasks. The mathematical model for the merchant self-operated takeaway delivery is established, aiming to reasonably assign consumer orders to the rider and find the shortest delivery route.
Assuming that a rider wants to deliver goods to n customers within a specified time, the model is established as follows:
- (1)
- The decision variable xij is expressed in Equation (1). When xij is assigned as 1, it means that the rider has reached consumer node j from consumer node i. When xij is assigned as 0, it means the delivery person has not traveled from consumer node i to consumer node j.
- (2)
- The objective function is shown in Equation (2). The shorter the total distance of the rider to complete the delivery task, the higher the efficiency that can be obtained.
- (3)
- The constraints are shown in Formulas (3)–(5).Equation (3) indicates that the rider walks out from node i once, and i = 1 means the merchant node. Equation (4) implies that the rider walks into node j once. Equation (5) represents the value choice of the variable xij. With the constraint of Equations (3) and (4), each good can be delivered to its corresponding customer.
- (4)
- Considering the consumer’s location would be presented based on its latitude and longitude, the real distance between different locations was calculated according to Equation (6). The Arccos equation is used for short-distance scenarios (<5 km) due to its lower computational cost (requiring fewer trigonometric operations) and negligible precision loss (<0.01% error at 5 km) compared to the Haversine equation (requiring square roots and additional trigonometric functions), sacrificing only minor spherical curvature accuracy for significant speed gains in routing systems.where ALat and Along is the latitude and longitude of location A, Blat and BLong is the latitude and longitude of location B. R is the Earth’s radius (6371.004 km), a standard value in geodesy adopted from the International Union of Geodesy and Geophysics (IUGG) recommendations.
4. Design of the Algorithm
4.1. K-Means Algorithm
The consumer locations are distributed in a wide area. The goods delivery efficiency can be improved if each rider only serves users in a certain area. The consumer nodes should be divided into different clusters based on their location. Hierarchical, graph-based, and K-means clustering methods can be considered for the node-dividing process. Considering that the hierarchical clustering method has a high computational complexity and the graph-based method has poor scalability, the K-means clustering method, which is computationally efficient and adaptable to dynamic delivery conditions, is employed to distribute multiple consumer locations into several groups based on their distance from each other. The purpose of the K-means algorithm is to divide n data objects into k clusters to minimize the sum of the squared Euclidean distances from each data point to its cluster center [30,31,32]. The value of k can be determined upon the actual application.
The evaluation standard of the K-means algorithm is shown in Equation (7).
where k indicates how many clusters the data needs to be divided into, xi is the dataset to be classified, cj is the j-th cluster, and µj is the center of the j-th cluster.
The clustering goal is to minimize the total sum of the squared distances, which can be realized according to the flow chart, as shown in Figure 1.
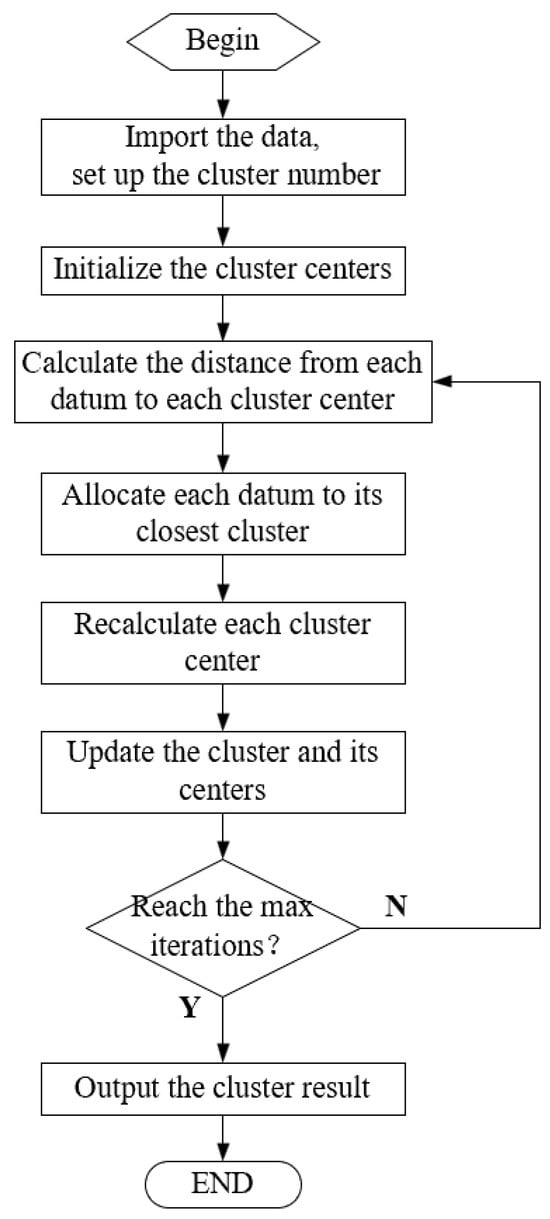
Figure 1.
The flow chart for K-means algorithm.
Step 1: Import the data that needs to be clustered, and set the value of cluster number k according to the actual application.
Step 2: Select the initial cluster centers randomly.
Step 3: Calculate the distance between each data and each cluster, and allocate each data to its closest cluster.
Step 4: Update the cluster and recalculate each cluster center to be the average of its data.
Step 5: Go back to step 3 until the result satisfies the iteration termination condition.
4.2. Improved Ant Colony Algorithm
For merchant self-operated takeaway delivery, each rider is assigned a service area defined as a cluster calculated by the K-means algorithm. As each rider has multiple destinations to traverse in their service area, it is essential to optimize the delivery routes to reduce the total distance it takes to visit all destinations. The ant colony algorithm, which has significant application in solving the capacitated vehicle routing problem (CVRP), is used to optimize the routes for the rider.
The idea of the ant colony algorithm is inspired by the fact that ants can always find the shortest path when looking for food [33,34]. Ants will leave a kind of pheromone on their walking route, which can transmit information. Ants determine the route to continue moving forward by checking the pheromone intensity on the road. The pheromone intensity will increase as more ants are walking on the route. The pheromone will evaporate over time.
The probability of ant ‘r’, which is located at node i, will choose node j as the next node, as shown in Equation (8).
where τi,j is the pheromone intensity between node i and j; ηi,j is the visibility of node j from node i, which is the reciprocal of the distance between node i and j; α is the parameter weighting the value of pheromone trail; β is the parameter that evaluates the value of visibility; Njr is the nodes that ant ‘r’ has not visited; and q represents each possible next node for the ant within the set Njr.
The algorithm tends to fall into the local optimum if the next node always chooses the node with the highest probability. The roulette strategy shown in Figure 2 is introduced to solve this problem, in which the next node selection is not entirely based on the probability value. A random number between 0 and 1 is generated by the roulette strategy, which was compared with the number calculated by Equation (8), and the number with a higher value was chosen as the probability for the following calculation.
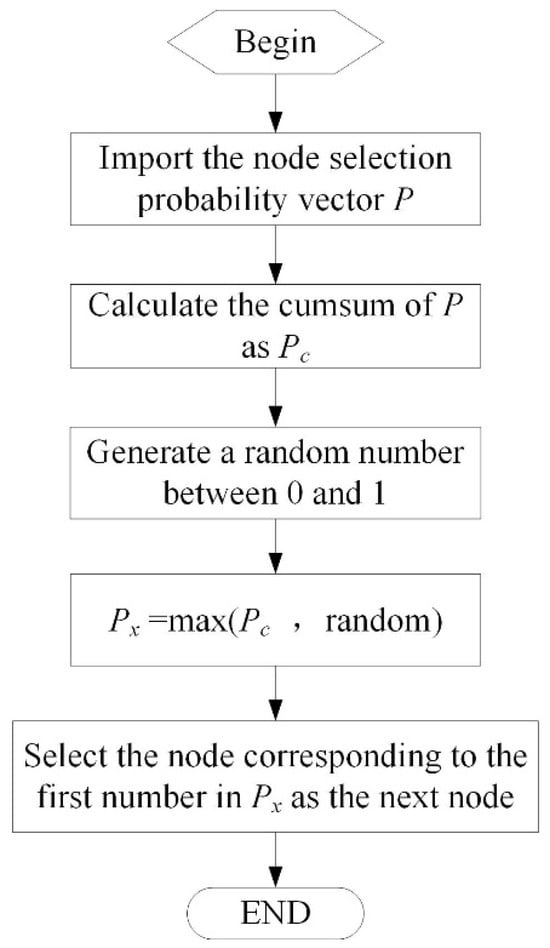
Figure 2.
The flow chart for the roulette strategy.
Some pheromones will be deposited on the road when the ant walks through it, and some pheromones on the road will also be evaporated over this time. When the ants have traversed all nodes, the pheromone intensity on the road will be updated upon its evaporation and deposition process, as shown in Equations (9) and (10).
where ρ is the coefficient to evaluate the pheromone evaporation rate, which can prevent the pheromone from unlimited accumulation; m is the number of ants; ∆τri,j is the ant ‘r’ deposited pheromone when it moves from node i to node j; Q is the total pheromone deposited by each ant; and Lr is the length of ant ‘r’ traversed routes. A higher pheromone is obtained when the route is shorter.
The flow chart of the improved ant colony algorithm is illustrated in Figure 3. The utilization of the improved ant colony algorithm to solve the route optimization problem in takeaway delivery is as follows:
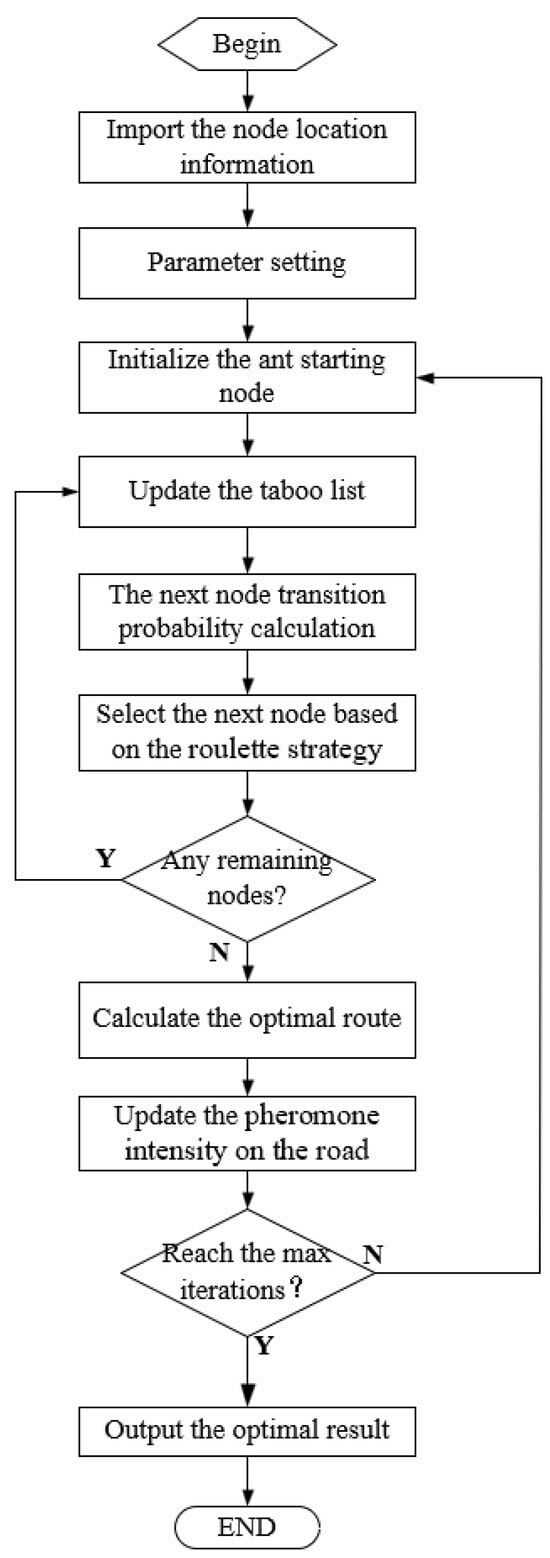
Figure 3.
The flow chart of the improved ant colony algorithm.
Step 1: Parameter setting. The setting of parameters can directly influence the convergence and efficiency of the algorithm. The parameters in the ant colony algorithm are set as shown in Table 1. Considering that the number of nodes in this research is small, the number of ants was set equal to the number of nodes to simplify the computation process.

Table 1.
Ant colony algorithm parameters setting.
The parameter values (e.g., α, β, ρ, and Q) were determined using systematic single-factor experiments, where each parameter was varied individually while keeping others constant. This method enabled the identification of values that balanced convergence speed and solution stability.
Step 2: Select a node as the starting point of the traverse randomly for each ant.
Step 3: Update the nodes that the ant has traversed in the taboo list.
Step 4: Calculate the probability of the next possible node based on Equation (7) and select the next node based on the roulette strategy. Repeat this process until all ants have traversed all nodes.
Step 5: Calculate the optimal route and update the pheromone intensity on the road.
Step 6: Repeat steps 3 to 5 until the maximum number of iterations is reached or the termination requirement is met.
Step 7: Output the optimal result.
4.3. The Order Quantity Fair Strategy
For the K-means algorithm mentioned above, the consumer location was distributed into K clusters only depending on the node’s distance from each other, and the number of nodes in each cluster was not considered in this process. Normally, each cluster of orders will be assigned to a rider, which can lead to workload differences for different riders. Merchants must ensure that each rider has the same workload to guarantee fairness. To realize the fairness of the workload distribution, researchers modified the K-means algorithm to distribute the consumer nodes into K clusters with the same number of nodes in each cluster. Each rider will finish the same number of orders in this delivery mode.
The dividing strategy is illustrated in Figure 4. The K-means clustering result is redistributed based on the number of nodes each cluster owns. If a cluster has more nodes than the average, parts of its nodes that are close to the other cluster center will be assigned to the corresponding cluster according to Equations (11) and (12).
where cmax_node is the cluster that has the maximum number of nodes, xi is the node in cluster cmax_node, xremove is the node in cluster cmax_node that is closest to the center of the other clusters, Dij is the distance between node xi in cmax_node, and cj is the cluster whose center is closest to the nodes of cluster cmax_node.
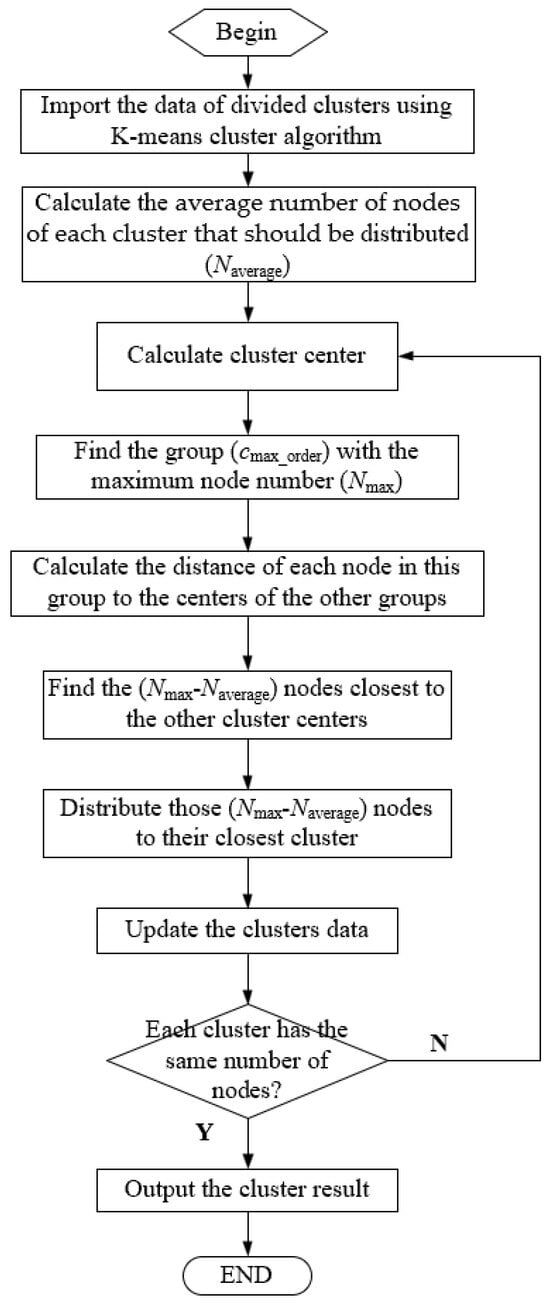
Figure 4.
The order quantity fair strategy.
The redistribution process works as follows: First, cmax_node is identified. Using Equation (11), xremove is selected. This ensures that the node is spatially closest to another cluster, justifying its reassignment. Then, Equation (12) reassigns xremove from cmax_node to cj, reducing cmax_node’s size and balancing node counts. This iterative adjustment (repeating until clusters have nearly equal node numbers) leverages spatial proximity to achieve fair order quantity distribution, with Equations (11) and (12) formalizing the node selection and reassignment logic, respectively.
4.4. The Travel Distance Fair Strategy
Considering the distance difference of the consumer location nodes, each rider’s total distance traveled may vary widely even when they deliver the same number of orders. A strategy that divides the consumer nodes based on the total travel distance is proposed based on the K-means and ant colony algorithms, as shown in Figure 5. The cluster(cmin_length) with the shortest optimal route will be found in this strategy. The nodes in the other clusters closest to the cluster’s center(cmin_length) will be redistributed to the cluster(cmin_length). This process will be repeated until the length difference of the optimal route for each cluster is under the tolerance value.
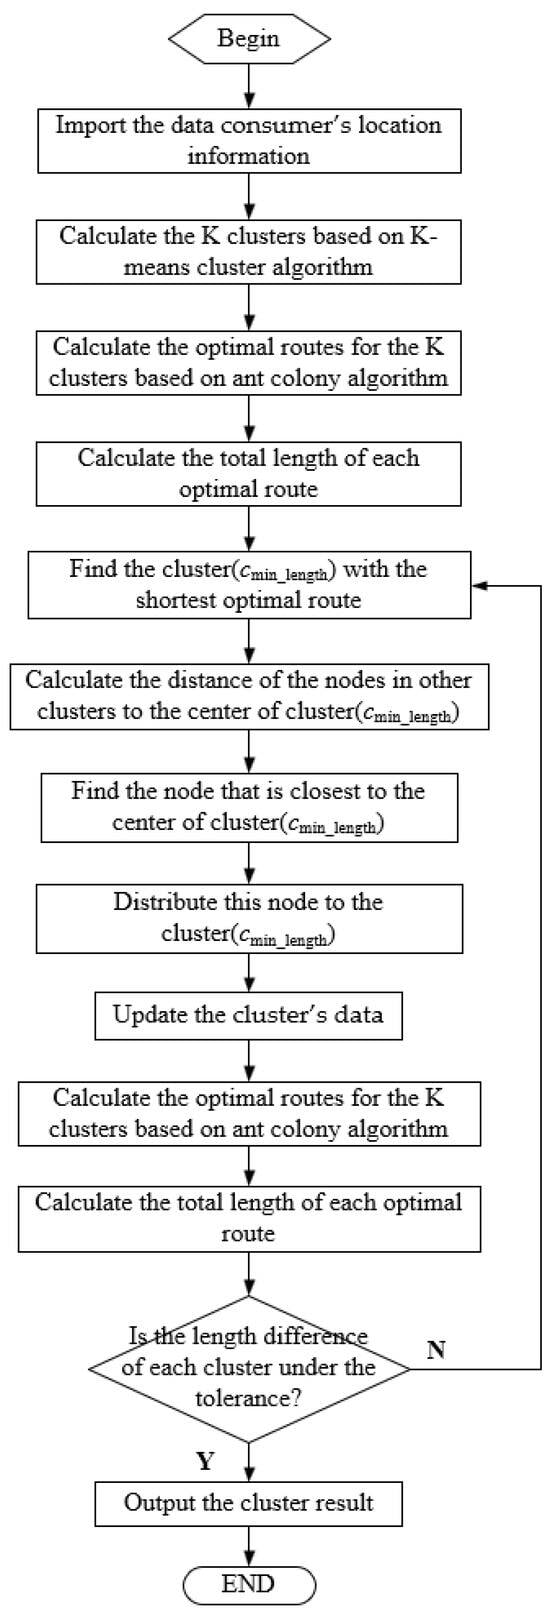
Figure 5.
The travel distance fair strategy.
5. Solution and Analysis of Examples
To evaluate the performance of the algorithm and strategy established above, the latitude and longitude locations of a merchant and its 80 consumers are shown in Table 2. The real distance between different locations would be calculated according to Equation (6) based on its latitude and longitude. We assumed that the merchant employed four riders to finish the delivery of goods.

Table 2.
The coordinate information for the 80 consumers’ locations.
5.1. The Result by K-Means and Improved Ant Colony Algorithm
The clustering result was distributed using the K-means algorithm, as shown in Table 3 and Figure 6. The 80 nodes were distributed into four clusters with different numbers of nodes in each cluster. The consumer orders in each cluster will be allocated to the corresponding rider to deliver, which means that the number of orders each rider finished would be different.

Table 3.
The clustering result using the K-means algorithm.
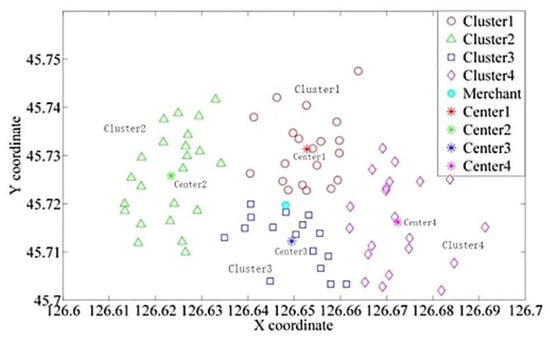
Figure 6.
The clusters distributed by the K-means algorithm.
The route for each rider was optimized based on the improved ant colony algorithm. Before each route optimization, the merchant node was added to each cluster to guarantee that the rider start node was included in the optimal route of each cluster. The optimized routes for each cluster are presented in Figure 7. It can be observed that the improved ant colony algorithm performed well in finding the best route for the rider. It can be observed from Table 3 and Figure 7 that the route length of each rider finished has a substantial difference, which means that some riders would ride longer distances than others. In Figure 7b, Figure 8b and Figure 9b, the y-axis represents the normalized route length, defined as . The reference length (100 km) represents the standardized scaling distance for comparative visualization of route optimization results.
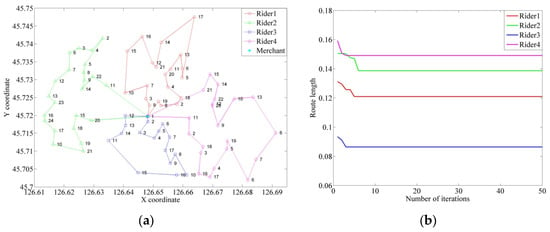
Figure 7.
The optimal result for the rider using an improved ant colony algorithm. (a) The optimal route for the rider. (b) The convergence process of the algorithm.
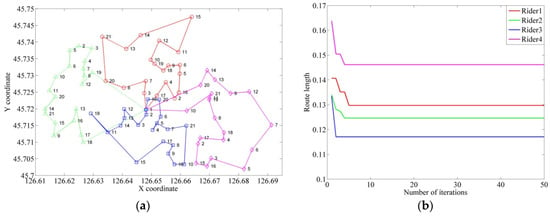
Figure 8.
The optimal result for the rider with the same number of delivered orders using the improved ant colony algorithm. (a) The optimal route for the rider. (b) The convergence process of the algorithm.
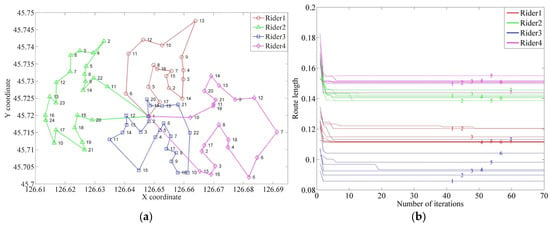
Figure 9.
The optimal result for the riders covering the close travel distance using an improved ant colony algorithm. (a) The optimal route for the rider. (b) The convergence process of the algorithm.
The difference in order quantity and delivery distance for the riders would result in unfair workload distribution. Therefore, each rider’s order quantity and delivery distance balance were considered when designing a strategy for redistributing the clusters.
5.2. The Performance of Order Quantity Fair Strategy
To assign the same number of orders to each rider, researchers redistributed the clustering results obtained by the K-means algorithm using the order quantity fairness strategy. The clustering result is shown in Table 4 and Figure 10. Each cluster was distributed to 20 nodes, and its center also changed. It can be observed from Figure 10 that two nodes in cluster 1, one node in cluster 2, and one node in cluster 3, which is close to center 3, were redistributed to cluster 3, compared to the clustering result by the K-means algorithm.

Table 4.
The clustering result redistributed by order quantity fair strategy.
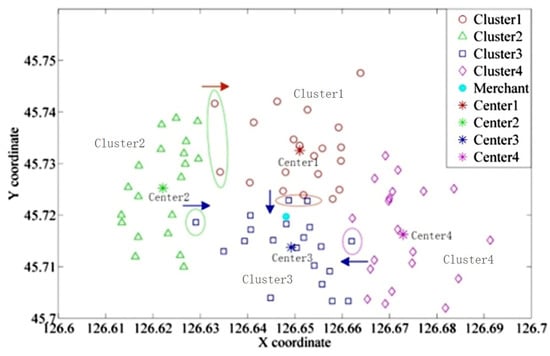
Figure 10.
The clusters redistributed by order quantity fair strategy.
The redistribution process prioritizes reassigning nodes based on their proximity to adjacent cluster centers, minimizing additional travel costs while balancing workload among riders. Nodes near cluster boundaries were reassigned to minimize travel costs and balance workload based on their proximity to adjacent cluster centers. This approach ensures minimal disruption to the overall route length while achieving equitable node distribution across riders.
Each rider was assigned 20 orders by order quantity fair strategy. The route for the rider to deliver those orders was optimized by an improved ant colony algorithm, as shown in Figure 8. The algorithm can find the optimal route in less than 10 iterations. Table 4 shows that the optimal route length with the same number of nodes would have a noticeable difference. A strategy was proposed to redistribute the K-means algorithm clustering results based on the rider’s travel distance.
5.3. The Performance of Travel Distance Fair Strategy
The K-means clustering result was redistributed by travel distance fair strategy based on the improved ant colony algorithm to balance the travel distance covered by each rider. The clustering result by constraining the travel distance difference within 0.02 was presented in Table 5 and Figure 10, where 0.02 represents the relative threshold for differences in path lengths between riders. The 0.02 tolerance (2% route difference) aligns with real-world delivery standards. As can be observed from Figure 11, compared with the clustering result of the K-means algorithm in Figure 6, four nodes in cluster 1 and one node in cluster 4, which are close to center 3, have been redistributed to cluster 3.

Table 5.
The clustering result redistributed by travel distance fair strategy.
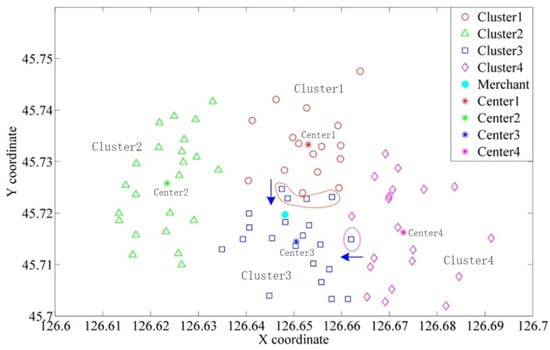
Figure 11.
The clusters redistributed by travel distance fair strategy.
To balance the travel distance of different riders, researchers optimized the route to traverse all nodes in the cluster using the improved ant colony algorithm after executing the travel distance fairness strategy. The travel distance fairness strategy would be executed several times until the optimal route travel distance difference satisfies the constraint requirement. The final optimal route is illustrated in Figure 9. As can be noticed from Figure 9b. the K-means algorithm clustering result was redistributed several times to adapt the travel distance difference.
6. Conclusions
A mathematical model for merchant self-operated takeaway delivery was established, and the rider’s delivery routes were optimized using improved K-means and an ant colony algorithm based on fair strategy. The proposed framework can be directly applied to merchant self-operated delivery systems (e.g., local restaurants or small e-commerce platforms) to optimize rider assignments in real time. By balancing workloads, it reduces rider fatigue and improves delivery efficiency, aligning with industry needs for fair labor distribution and cost savings. The main conclusions are as follows:
- (1)
- We employed an improved K-means algorithm to allocate customer orders to riders based on fairness strategies. Additionally, an ant colony algorithm enhanced by a roulette strategy was developed to generate optimal routes for riders.
- (2)
- To ensure equal order distribution, we designed an order quantity fairness strategy that redistributes K-means clustering results by considering the nodes’ distances to all cluster centers. This strategy guarantees that each rider receives a comparable number of orders.
- (3)
- In accordance with the length difference of the optimal route calculated by the ant colony algorithm, the K-means algorithm was improved to redistribute the clustering result based on the designed travel distance fair strategy to balance the travel distance covered by each rider.
- (4)
- A sample with 80 consumer locations was proposed to verify the designed algorithm’s and strategy’s performance. The results demonstrate that the order quantity fair strategy and travel distance fair strategy have a good performance in finding an optimal delivery plan for the merchant.
While the proposed framework demonstrated optimal performance in balancing workload fairness and routing efficiency, further research needs to be performed in the following areas:
- (1)
- Integration of real-time data streams for dynamic clustering and routing to enable adaptive responses to real-time order fluctuations, traffic conditions, and rider availability changes.
- (2)
- Generalization of fairness tolerance thresholds across diverse delivery environments (urban/rural) through multi-objective optimization frameworks that simultaneously balance delivery efficiency, cost, and fairness, combined with machine learning-driven context-aware calibration.
- (3)
- Scalability improvements for large-scale datasets (N > 500) in dynamic environments.
- (4)
- Empirical validation and constraint incorporation in real-world logistics systems, including vehicle capacity limits, battery range modeling, and parameter refinement against industry KPIs.
Author Contributions
Conceptualization, C.G.; Methodology, J.C. and C.G.; Software, J.C. and J.K.; Validation, J.K. and S.S.; Formal Analysis, J.C. and Y.G.; Investigation, J.K. and J.D.; Resources, S.S.; Data Curation, J.D.; Writing—Original Draft, J.C.; Writing—Review and Editing, C.G., S.S. and Y.G.; Visualization, J.D. and Y.G.; Supervision, C.G.; Funding Acquisition, C.G. All authors have read and agreed to the published version of the manuscript.
Funding
This work was supported by the Harbin Manufacturing Technology Innovation Project (No. 2023CXRCCG009), the National Natural Science Foundation of China (No. 52075090), and the Fundamental Research Funds for the Central Universities of China (No. 2572021BL01).
Institutional Review Board Statement
Not applicable.
Informed Consent Statement
Not applicable.
Data Availability Statement
The data presented in this study are available on request from the corresponding author due to privacy.
Conflicts of Interest
The authors declare no conflicts of interest.
References
- Ramanathan, J.; Subramanian, N.; Abdulrahman, M.D. Decisive Engaging Factors in Crowd Logistics: The Case of China’s Takeaway/Home Delivery Industry. In Proceedings of the 24th ISL Conference on Supply Chain Networks vs Platforms: Innovations, Challenges and Opportunities, Würzburg, Germany, 23–25 September 2019; pp. 377–383. [Google Scholar]
- Teng, R.; Hong-Bo, X.; Kang-Ning, J.; Tian-Yu, L.; Wing, L.; Li-Ning, X. Optimisation of Takeaway Delivery Routes Considering the Mutual Satisfaction of Merchants and Customers. Comput. Ind. Eng. 2021, 162, 107728. [Google Scholar] [CrossRef]
- Pei, Y.L.; Li, D.D.; Xue, W.X. The Evaluation of Customer Experience Using BP Neural Network-Taking Catering O2O Takeaway as an Example. Concurr. Comput. Pract. Exp. 2019, 32, e5515. [Google Scholar] [CrossRef]
- Yeo, V.C.S.; Goh, S.K.; Rezaei, S. Consumer Experiences, Attitude and Behavioral Intention Toward Online Food Delivery (OFD) Services. J. Retail. Consum. Serv. 2017, 35, 150–162. [Google Scholar] [CrossRef]
- Lang, K.; Zhao, Y.; Satapathy, S.C.; Agrawal, R.; García Díaz, V. Cloud Computing Resource Scheduling Based on Improved ANN Model Takeaway Order Volume Forecast. J. Intell. Fuzzy Syst. 2021, 40, 5905–5915. [Google Scholar] [CrossRef]
- Liu, Y.; Guo, B.; Chen, C.; Hu, D.; Yu, Z.; Zhang, D.; Ma, H. FooDNet: Toward an Optimized Food Delivery Network Based on Spatial Crowdsourcing. IEEE Trans. Mob. Comput. 2019, 18, 1288–1301. [Google Scholar] [CrossRef]
- Zhang, M.X.; Wu, J.Y.; Wu, X.; Zheng, Y.J. Hybrid Evolutionary Optimization for Takeaway Order Selection and Delivery Path Planning Utilizing Habit Data. Complex Intell. Syst. 2021, 7, 1919–1932. [Google Scholar] [CrossRef]
- Lai, M.; Xong, T. A Metaheuristic Method for Vehicle Routing Problem Based on Improved Ant Colony Optimization and Tabu Search. J. Ind. Manag. Optim. 2012, 8, 469–484. [Google Scholar] [CrossRef]
- Zhou, Y.; Xie, R.; Zhang, T.; Holguin-Veras, J. Joint Distribution Center Location Problem for Restaurant Industry Based on Improved K-Means Algorithm with Penalty. IEEE Access 2020, 8, 37746–37755. [Google Scholar] [CrossRef]
- Chang, Y.S.; Lee, H.J. Optimal Delivery Routing with Wider Drone-Delivery Areas Along a Shorter Truck-Route. Expert Syst. Appl. 2018, 104, 307–317. [Google Scholar] [CrossRef]
- Zou, P.; Rajora, M.; Liang, S.Y. Multimodal Optimization of Permutation Flow-Shop Scheduling Problems Using a Clustering-Genetic-Algorithm-Based Approach. Appl. Sci. 2021, 11, 3388. [Google Scholar] [CrossRef]
- Li, Z.; Tian, Y.; Bu, X.; Wu, L. Order Batching Problem of Unmanned Warehouse System and k-Max Clustering Algorithm. Comput. Integr. Manuf. Syst. 2021, 27, 1506–1517. [Google Scholar]
- Ha, J.M.; Moon, G. An Application of k-Means Clustering to Vehicle Routing Problems. J. Soc. Korea Ind. Syst. Eng. 2015, 38, 1–7. [Google Scholar] [CrossRef]
- Moreno, S.; Pereira, J.; Yushimito, W. A Hybrid K-Means and Integer Programming Method for Commercial Territory Design: A Case Study in Meat Distribution. Ann. Oper. Res. 2017, 286, 87–117. [Google Scholar] [CrossRef]
- Ning, D.; Zhu, J. Study on Assign Mode of O2O Takeaway Order Delivery Tasks. Shanghai Manag. Sci. 2018, 40, 63–66. [Google Scholar]
- Keçeci, B.; Altıparmak, F.; Kara, İ. A Mathematical Formulation and Heuristic Approach for the Heterogeneous Fixed Fleet Vehicle Routing Problem with Simultaneous Pickup and Delivery. J. Ind. Manag. Optim. 2021, 17, 1069–1100. [Google Scholar] [CrossRef]
- Ai, T.J.; Kachitvichyanukul, V. A Particle Swarm Optimization for the Vehicle Routing Problem with Simultaneous Pickup and Delivery. Comput. Oper. Res. 2009, 36, 1693–1702. [Google Scholar] [CrossRef]
- Kumar, R.S.; Kondapaneni, K.; Dixit, V.; Agoswami, L.S.; Thakur, L.S.; Tiwari, M.K. Multi-Objective Modeling of Production and Pollution Routing Problem with Time Window: A Self-Learning Particle Swarm Optimization Approach. Comput. Ind. Eng. 2016, 99, 29–40. [Google Scholar] [CrossRef]
- Baker, B.M.; Ayechew, M.A. A Genetic Algorithm for the Vehicle Routing Problem. Comput. Oper. Res. 2003, 30, 787–800. [Google Scholar] [CrossRef]
- Ibrahim, M.F.; Nurhakiki, F.R.; Utama, D.M.; Rizaki, A.A. Optimised Genetic Algorithm Crossover and Mutation Stage for Vehicle Routing Problem Pick-Up and Delivery with Time Windows. IOP Conf. Ser. Mater. Sci. Eng. 2021, 1071, 012025. [Google Scholar] [CrossRef]
- AlMuhaideb, S.; Alhussan, T.; Alamri, S.; Altwaijry, Y.; Aljarbou, L.; Alrayes, H. Optimization of Truck-Drone Parcel Delivery Using Metaheuristics. Appl. Sci. 2021, 11, 6443. [Google Scholar] [CrossRef]
- Nian, B.C. Genetic Algorithm for Heuristic Algorithms for the Vehicle Routing Problem with Simultaneous Pick-Up and Delivery. Comput. Oper. Res. 2007, 34, 578–594. [Google Scholar]
- Xu, W.; Li, J. A Fissile Ripple Spreading Algorithm to Solve Time-Dependent Vehicle Routing Problem via Coevolutionary Path Optimization. J. Adv. Transp. 2020, 2020, 8815983. [Google Scholar] [CrossRef]
- Zheng, C.; Haoxun, C.; Farouk, Y.; Bo, D. Adaptive Large Neighborhood Search Algorithm for Route Planning of Freight Buses with Pickup and Delivery. J. Ind. Manag. Optim. 2021, 17, 1771–1793. [Google Scholar]
- Xue, G.; Wang, Z.; Wang, G.; Rey, D. Optimization of Rider Scheduling for a Food Delivery Service in O2O Business. J. Adv. Transp. 2021, 2021, 5515909. [Google Scholar] [CrossRef]
- Ma, X.; Liu, C. Improved Ant Colony Algorithm for the Split Delivery Vehicle Routing Problem. Appl. Sci. 2024, 14, 5090. [Google Scholar] [CrossRef]
- Huang, R.; Ning, J.; Zhao, M.; Xie, F.; Xia, Y.; Yi, G.; Hui, G. Study of Delivery Path Optimization Solution Based on Improved Ant Colony Model. Multimed. Tools Appl. 2021, 80, 28975–28987. [Google Scholar] [CrossRef]
- Zhang, Y.; Liu, Y.; Chen, L.; Liu, Y.; Zhou, J.; Osaba, E. The Optimization of Path Planning for Express Delivery Based on Clone Adaptive Ant Colony Optimization. J. Adv. Transp. 2022, 2022, 482501. [Google Scholar] [CrossRef]
- Liu, W.; Liu, Y.; Zhang, T.; Qiu, N.; Xie, X.; Chang, X.; Chen, J. A Hybrid ACS-VTM Algorithm for the Vehicle Routing Problem with Simultaneous Delivery & Pickup and Real-Time Traffic Condition. Comput. Ind. Eng. 2021, 162, 107747. [Google Scholar]
- Jain, A.K. Data Clustering: 50 Years Beyond K-Means. Pattern Recognit. Lett. 2010, 31, 651–666. [Google Scholar] [CrossRef]
- Likas, A.; Vlassis, N.; Verbeek, J.J. The Global k-Means Clustering Algorithm. Pattern Recognit. 2003, 36, 451–461. [Google Scholar] [CrossRef]
- Hansen, P.; Ngai, E.; Cheung, B.K.; Mladenović, N. Analysis of Global k-Means, an Incremental Heuristic for Minimum Sum-of-Squares Clustering. J. Classif. 2005, 22, 287–310. [Google Scholar] [CrossRef]
- Dorigo, M.; Birattari, M.; Stützle, T. Ant Colony Optimization. IEEE Comput. Intell. Mag. 2006, 1, 28–39. [Google Scholar] [CrossRef]
- Dorigo, M.; Gambardella, L.M. Ant Colonies for the Travelling Salesman Problem. Biosystems 1997, 43, 73–81. [Google Scholar] [CrossRef] [PubMed]
Disclaimer/Publisher’s Note: The statements, opinions and data contained in all publications are solely those of the individual author(s) and contributor(s) and not of MDPI and/or the editor(s). MDPI and/or the editor(s) disclaim responsibility for any injury to people or property resulting from any ideas, methods, instructions or products referred to in the content. |
© 2025 by the authors. Licensee MDPI, Basel, Switzerland. This article is an open access article distributed under the terms and conditions of the Creative Commons Attribution (CC BY) license (https://creativecommons.org/licenses/by/4.0/).