Article

Water Vapor Characteristics of Extreme Precipitation in Yingjiang, the “Rain Pole” of Mainland China


1
Meteorological Observation Centre, China Meteorological Administration, Beijing 100081, China
2
Yunnan Atmospheric Observation Technology Support Centre, Kunming 650034, China
3
State Key Laboratory of Environment Characteristics and Effects for Near-Space, Beijing 100081, China
4
Engineering Technology Research Center for Meteorological Observation, China Meteorological Administration, Beijing 100081, China
5
Guizhou Meteorlogical Data Center, Guiyang 550002, China
*
Author to whom correspondence should be addressed.
Appl. Sci. 2026, 16(5), 2267; https://doi.org/10.3390/app16052267
Submission received: 13 January 2026 / Revised: 22 February 2026 / Accepted: 25 February 2026 / Published: 26 February 2026
(This article belongs to the Section Earth Sciences)

Abstract

In the Yingjiang area of western Yunnan, precipitation is high throughout the year, making it one of the regions with the highest annual precipitation in mainland China. Extreme rainfall in this region often triggers severe flooding, yet the key mechanism of water vapor transport underlying abnormally heavy precipitation remains unclear. This study used automatic weather station observations of precipitation, the fifth-generation atmospheric reanalysis produced by the European Centre for Medium-Range Weather Forecasts, and Global Data Assimilation System (GDAS) data to analyze, for the first time, large-scale water vapor transport, precipitation mechanisms, and the primary water vapor sources and their contributions in this region. The results show the following: In the Yingjiang area, the water vapor sources at all height levels in summer are dominated by the southwest monsoon water vapor transport pathways, such as the Bay of Bengal and the Arabian Sea, with their total contributions to specific humidity and water vapor flux exceeding 70%. This indicates that low-latitude sea areas such as the Bay of Bengal and the Arabian Sea serve as key moisture source regions for Yingjiang in the global water vapor cycle. Water vapor transport over the windward slope causes strong low-level convergence and high-level divergence phenomena, and the suction effect leads to strong upward motion near the 850 hPa level. The pseudo-equivalent potential temperature isolines tilt along the mountain slope, maintaining an unstable stratification characterized by warm, humid lower layers and cold, dry upper layers, providing favorable thermal conditions for precipitation. In addition, in the summer of 2020, abnormally high southwest seasonal wind and air transport, combined with strong low-level convergence and high-level divergence of the vertical circulation structure, were key factors causing the abnormally high precipitation. This study provides an important reference for the prediction of extreme precipitation and the early warning of rainstorm disasters in the southwest monsoon region in the context of global climate change.

1. Introduction

In recent years, as global climate change has intensified, the water vapor content in the atmosphere has continuously increased, the global water cycle has continued to strengthen, and the frequency of sustained extreme rainfall events has significantly risen, posing severe challenges to social and economic development and threatening the safety of individuals and their property [1,2]. Persistent extreme rainfall is mainly characterized by long periods of precipitation and large accumulated rainfall, which frequently leads to flooding in watershed areas and often triggers a series of secondary natural disasters, causing significant economic losses [3]. In the southwest monsoon region of China, which is an area sensitive and vulnerable to global climate change, the evolution of extreme precipitation is closely related to the abnormal fluctuations of the Indian summer monsoon, which are associated with global warming. The characteristics of regional extreme precipitation essentially reflect the regional climate system’s response to global warming. Therefore, in the context of global climate change, it is particularly important to enhance the diagnosis and prediction of persistent extreme heavy rainfall events in China’s southwest monsoon region.
Because sustained extreme rainfall can cause severe natural disasters, many scholars have conducted in-depth research on it from multiple perspectives [4,5]. However, sustained precipitation requires sufficient water vapor. Therefore, exploring the sources of water vapor and their transport mechanisms that contribute to regional precipitation anomalies is of great significance. Many scholars have studied water vapor transport during extreme precipitation events. Liang et al. [6] studied water vapor transport characteristics during the 7.20 extreme rainstorm in Zhengzhou, China, and found that the water vapor in this extreme rainfall process predominantly originated from the typhoon “fireworks” and the low-level southeast airflow channel over a time scale exceeding 30 days below 900 hPa. Li et al. [7] analyzed the characteristics and influencing mechanisms of extreme summer precipitation water vapor transport in the eastern part of Southwest China. They concluded that, during extreme precipitation periods, there are four sources of water vapor in the region, namely, the Bay of Bengal, the Arabian Sea, the western Pacific, and the northwest, with the Bay of Bengal contributing the most. Jin et al. [8] analyzed the spatiotemporal and water vapor transport characteristics of extreme summer precipitation in southern Xinjiang and found that the abnormal water vapor that caused the increase in precipitation originated from the eastern Pacific and southern Indian Oceans. The strengthening of low-level water vapor convergence and the enhancement of atmospheric convective instability were among the main reasons for the abnormal increase in precipitation in the region.
In addition, to more accurately identify the sources of water vapor and quantify their specific contributions, many scholars have begun to apply the Hybrid Single-Particle Lagrangian Integrated Trajectory (HYSPLIT) model for water vapor trajectory tracking. HYSPLIT can depict the motion trajectory of fluid particles, which facilitates in-depth analyses of the motion characteristics of the atmosphere. For example, Yang et al. [9] studied the circulation patterns and backward trajectories of water vapor in 20 typical Meiyu front precipitation processes from 2010 to 2015, as well as analyzing the water vapor source areas and transport pathways in different Meiyu processes. Shi et al. [10] used HYSPLIT technology to analyze water vapor sources during rainstorms in Tianjin, China, from 2012 to 2020. The sources could be roughly divided into four directions, with the west and southwest directions accounting for the highest proportions. Deng et al. [11] used the HYSPLIT model to simulate and cluster water vapor transport pathways in the Jianghuai Basin. They found that reductions in long-distance water vapor transport trajectories affected water vapor transport in the basin’s water vapor channels, resulting in a decrease in the net water vapor balance and precipitation.
The Yingjiang area in Yunnan Province is located at the southwestern edge of the Hengduan Mountains. Influenced by the local terrain and the water vapor transport of the southwest monsoon, this area is sensitive to global climate change. It has an annual precipitation of 4000–5000 mm, making it one of the regions with the highest precipitation in mainland China [12]. The annual precipitation at a single station in Yingjiang exceeded 5000 mm in 2020, which is very close to the precipitation in the Great Bend of the Yarlung Zangbo River—the representative region of China’s mainland precipitation extreme mentioned by Lin et al. [13]. Therefore, Yingjiang can be regarded as the “Rain Pole” of China’s mainland. Scholars have investigated the water vapor transport characteristics of extreme precipitation in western Yunnan. For example, Yang et al. [14] used the HYSPLIT model to simulate the water vapor path affecting Yunnan and found that the location of precipitation was highly correlated with its corresponding water vapor path and proportion. The water vapor pathways affecting Yunnan primarily included the inland southward route, the northward transport from the South China Sea, the southeastward movement from the plateau, and the northeast flow from the Bay of Bengal. However, they did not study water vapor transport or the vertical movement of extreme precipitation processes in complex terrain areas. Xie et al. [15] analyzed the temporal and spatial variation characteristics of rainstorms and floods in southwest China and their relationship with atmospheric circulation. They concluded that the atmosphere at 850 hPa carried substantial warm and moist airflows converging from the South China Sea, the Bay of Bengal, and the southern side of the Qinghai–Tibet Plateau, providing sufficient energy and water vapor for precipitation. Ma et al. [16] studied the weather circulation patterns and terrain influences of strong precipitation processes that occurred in Yunnan in August 2020. The above studies mostly focus on the precipitation mechanisms of extreme rainfall events in specific terrain areas and lack analyses of the water vapor transport characteristics associated with abnormally high annual precipitation in complex terrain areas, such as western Yunnan, from a long-term perspective.
To date, few studies have examined the water vapor transport characteristics of the abnormally high summer precipitation (June–August) in the Yingjiang region of China. This study is, to the best of our knowledge, the first to investigate the large-scale water vapor transport characteristics, water vapor budget, precipitation mechanisms, main water vapor sources, and their contributions in this region over the past decade. This study conducts a preliminary analysis of the causes of the abnormal precipitation in the summer of 2020 to enhance the understanding of extreme precipitation in the Yingjiang region from the perspective of water vapor and dynamic conditions and to offer a scientific basis for flood-season precipitation forecasting and rainstorm disaster early warning; additionally, it provides a typical regional case for understanding the response law of extreme precipitation in the southwest monsoon region to global climate change.

2. Materials and Methods

2.1. Material Description

The analysis in this study is primarily based on the following data:
(1)
Precipitation data: Precipitation data for Yunnan from 2014 to 2023 were obtained from the “China Ground Hourly Observation Data” and “China Ground Monthly Data,” including 126 national stations and 3665 regional stations across Yunnan, of which 1 national station and 27 regional stations are located in the Yingjiang area. These data were obtained from a meteorological big data cloud platform.
(2)
Simulation data for water vapor transport: The fifth-generation atmospheric reanalysis data, which were produced by the European Centre for Medium-Range Weather Forecasts (ERA5) and released by the European Centre for Medium-Range Weather Forecasts (ECMWF) [17], were used, with a spatial resolution of 0.25° × 0.25°. Numerous studies have verified the accuracy of ERA5 reanalysis data [18,19]. In addition, multiple studies have verified their accuracy in the Yunnan region by comparing ERA5 reanalysis data with measured data for parameters such as temperature, wind, water vapor, and tropospheric delay, thereby confirming their applicability in this area [20,21,22]. This study primarily used data on potential height, temperature, meridional wind, vertical velocity, and specific humidity from the ERA5 reanalysis data from 2014 to 2023 (data source: https://cds.climate.copernicus.eu (accessed on 10 February 2025)).
(3)
Backward trajectory simulation data: The HYSPLIT model, released by the National Environmental Forecasting Center in the United States (https://www.ready.noaa.gov/data/archives/gdas1/ (accessed on 20 February 2025)), is driven by Global Data Assimilation System (GDAS) data, with a spatial resolution of 1° × 1° and a temporal resolution of 3 h. This dataset has been available since December 2004 and can be used for HYSPLIT model-driven analysis [23,24].

2.2. Calculation of Water Vapor Flux, Budget, and Flux Divergence

Water vapor transport flux refers to the amount of water vapor passing through a specific area over a certain period of time. Water vapor transport flux is an indicator that characterizes the intensity and direction of water vapor transport, including latitudinal and meridional water vapor fluxes. The formula is as follows:
Q u = 1 g P s P t u q d P
Q v = 1 g P s P t v q d P
Here, P t is the air pressure at the top of the pressure layer (Pa), P s is the ground pressure (Pa), g is the gravitational acceleration (m·s−2), and q is the specific humidity (kg·kg−1). To calculate the overall water vapor flux, vertical integration was performed from the surface. Considering the relatively low water vapor content in the upper atmosphere, the upper limit of the integration of the overall water vapor flux was set to 200 hPa. Water vapor flux divergence represents the amount of water vapor that converges or diverges from a region per unit time, and it is calculated as follows:
D = Q = Q u x + Q v y
Here, Q is the water vapor transport flux (kg·m−1·s−1), and D is the water vapor flux divergence (kg·m−2·s−1). The difference in the overall water vapor transport flux at the boundary of a defined area is the net water vapor balance in that area, which is calculated as follows:
F u = φ 1 φ 2 Q u a d φ
F v = λ 1 λ 2 Q v a cos φ d λ
D s = ( F u , F v ) = F i F o
Here, φ 1 and φ 2 represent the latitudes of the north–south boundary; λ 1 and λ 2 represent the longitudes of the east–west boundary, respectively; and a = 6.37 × 10⁶ m is the radius of the Earth. The water vapor balance in the region is the input minus the output, where F i represents the total water vapor input, F o represents the total water vapor output, and D s represents the net water vapor balance of the region.

2.3. HYSPLIT Backward Water Vapor Trajectory Model

This study used Meteoinfo (version: 3.9.3) software integrated with the HYSPLIT model [25] to simulate water vapor trajectories. HYSPLIT’s backward trajectory simulation technology can trace the historical position of particles, thereby revealing the water vapor transmission path [26]. Simulations were conducted on the water vapor transport path 12 times per day during the summer period from 2014 to 2023, and the initial parameter settings were optimized. Considering that water vapor primarily originates from the lower troposphere and that the study area is at a relatively high altitude, the initial simulation heights were set to approximately 2000 m, 3000 m, and 4000 m (corresponding to the 800 hPa, 700 hPa, and 600 hPa isobaric surfaces, respectively), with the geographical coordinates of 24.75° N and 97.75° E selected as the starting point of the trajectory. The duration of the backward trajectory simulation was set to 96 h, and the physical parameters of each node were obtained using data interpolation techniques. The initial simulation time for all air masses was 12 h, including 00, 02, 04, 06, 08, 10, 12, 14, 16, 18, 20, and 22 UTC. By using the cluster analysis method [27] to cluster all obtained backward trajectories, representative transport paths were determined, and the contribution of water vapor transport in each channel was mathematically characterized. The formula is as follows [28]:
Q a = ( i = 1 m Q i / j = 1 n Q j ) × 100 %
Here, Q a is the water vapor contribution ratio to the path; Q i and Q j are the specific humidity and water vapor flux of the air mass upon reaching the target position, respectively; m is the number of water vapor trajectories along the path; and n is the total number of water vapor trajectories across all paths.

3. Precipitation Characteristics in the Yingjiang Area of Western Yunnan

3.1. Spatial Distribution Characteristics

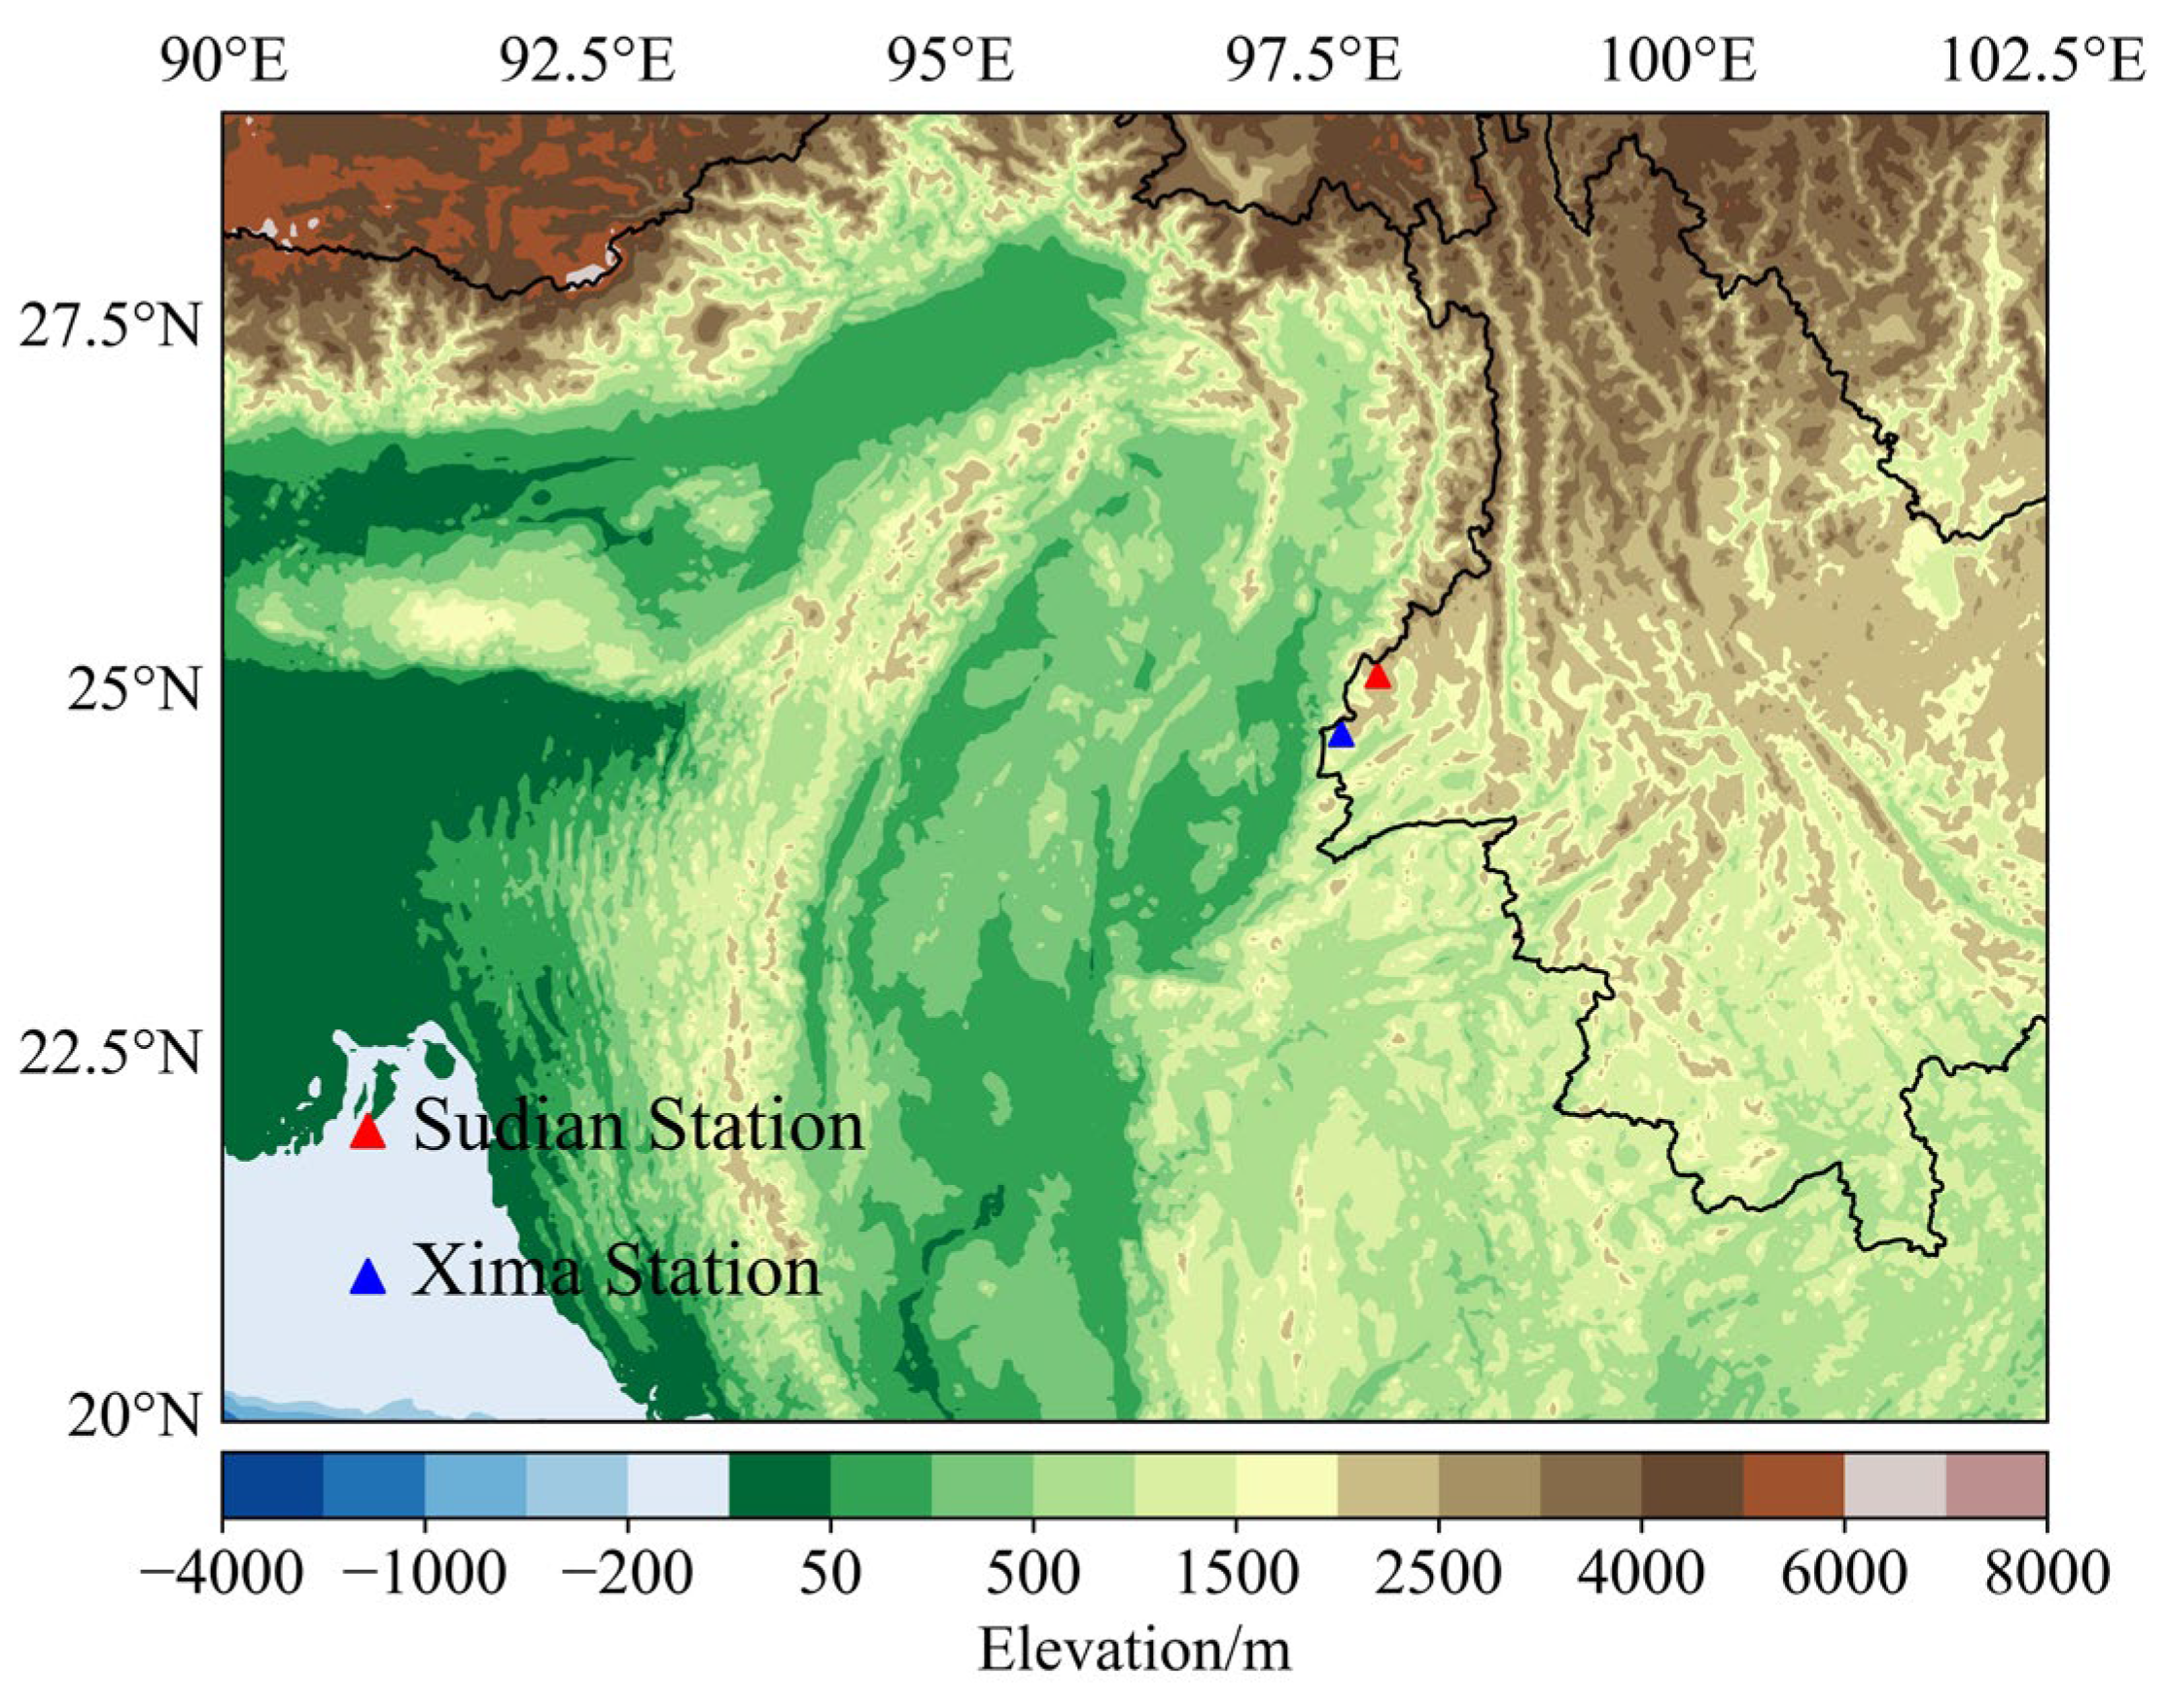
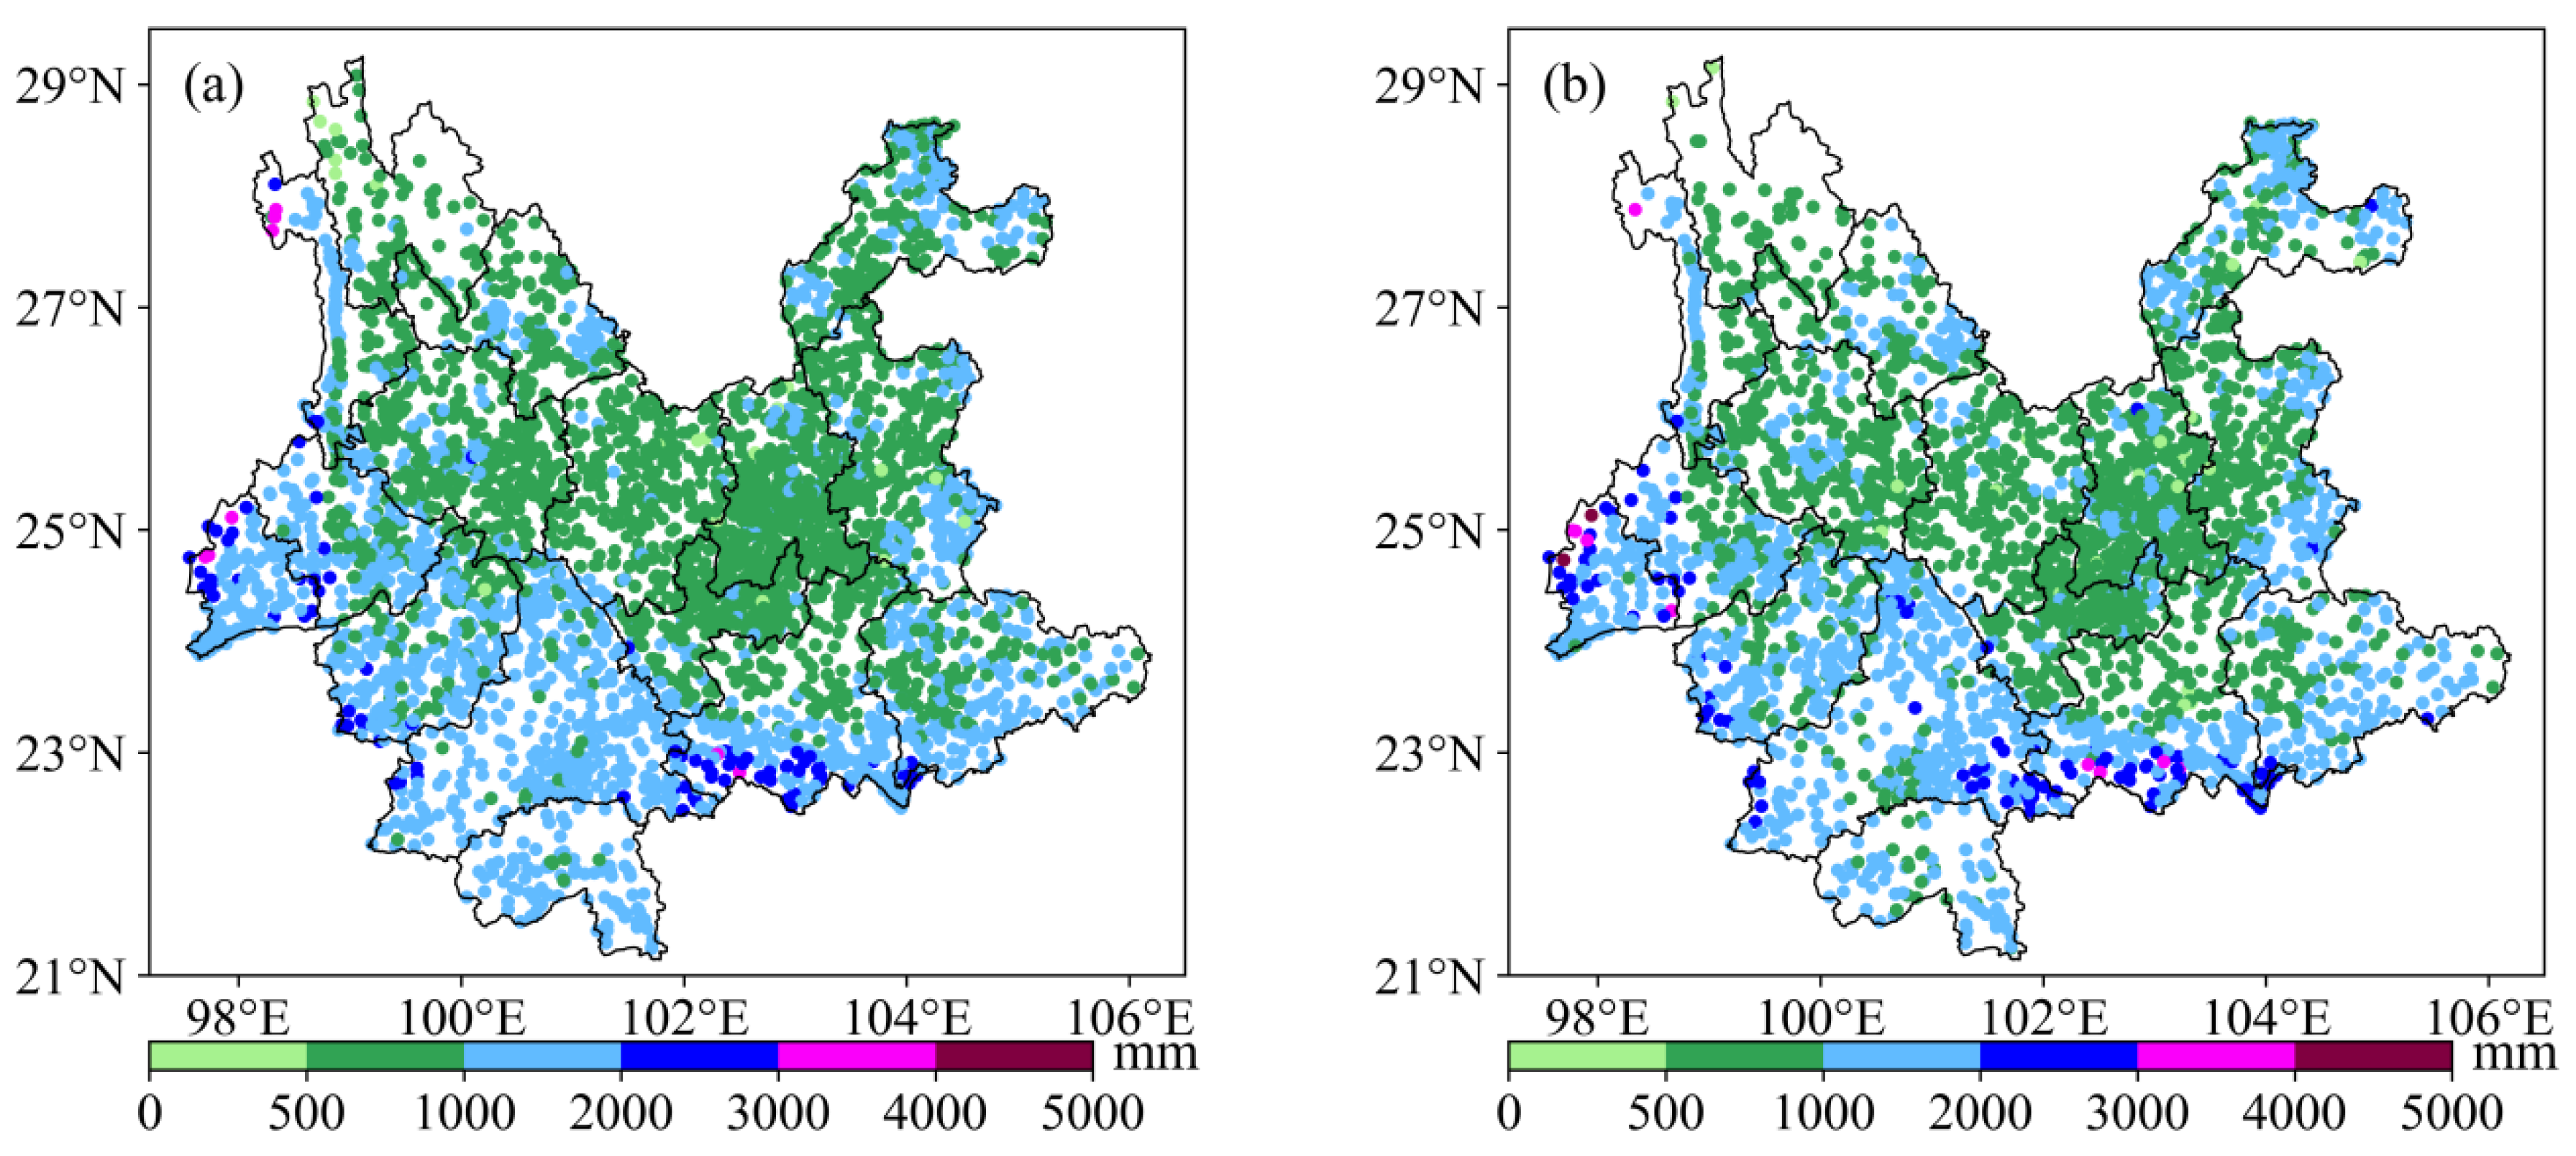
As shown in the elevation topographic map (Figure 1), Yingjiang is located to the west of the southern extension of the Gaoligong Mountains within the Hengduan Mountains area, with terrain that slopes from high in the northeast to low in the southwest. The northeast area of the Bay of Bengal features a trumpet-shaped topography, with Yingjiang located at the narrow end of this formation, which provides favorable conditions for the intrusion of warm and humid southwest airflow [29]. Figure 2 shows the spatial distribution of the average precipitation in Yunnan from 2014 to 2023, as well as that in 2020. As shown in Figure 2a, the annual average precipitation in the west and south of Yunnan is more than 2000 mm, with that in Dehong Yingjiang, Nujiang Gongshan, and Honghe Jinping being the highest, reaching more than 3000 mm, thus indicating that the precipitation in these three regions is more abnormal than that in other regions of Yunnan. Figure 2b shows the spatial distribution of precipitation in Yunnan in 2020, and it is approximately the same as that in Figure 2a; however, the precipitation in the Yingjiang area is evidently higher for the entire year. The precipitation at Xima Station (at an altitude of 1690 m) and Sudian Station (at an altitude of 1645.3 m) in Yingjiang exceeds 4000, 5028, and 4468 mm, which is close to the maximum precipitation in the south of Motuo, Tibet, and substantially exceeds the average precipitation of mainland China. This may be attributed to their being located in the cold, mountainous area of Yingjiang, which is dominated by mountains and exhibits significant elevation differences.

3.2. Temporal Variation Characteristics

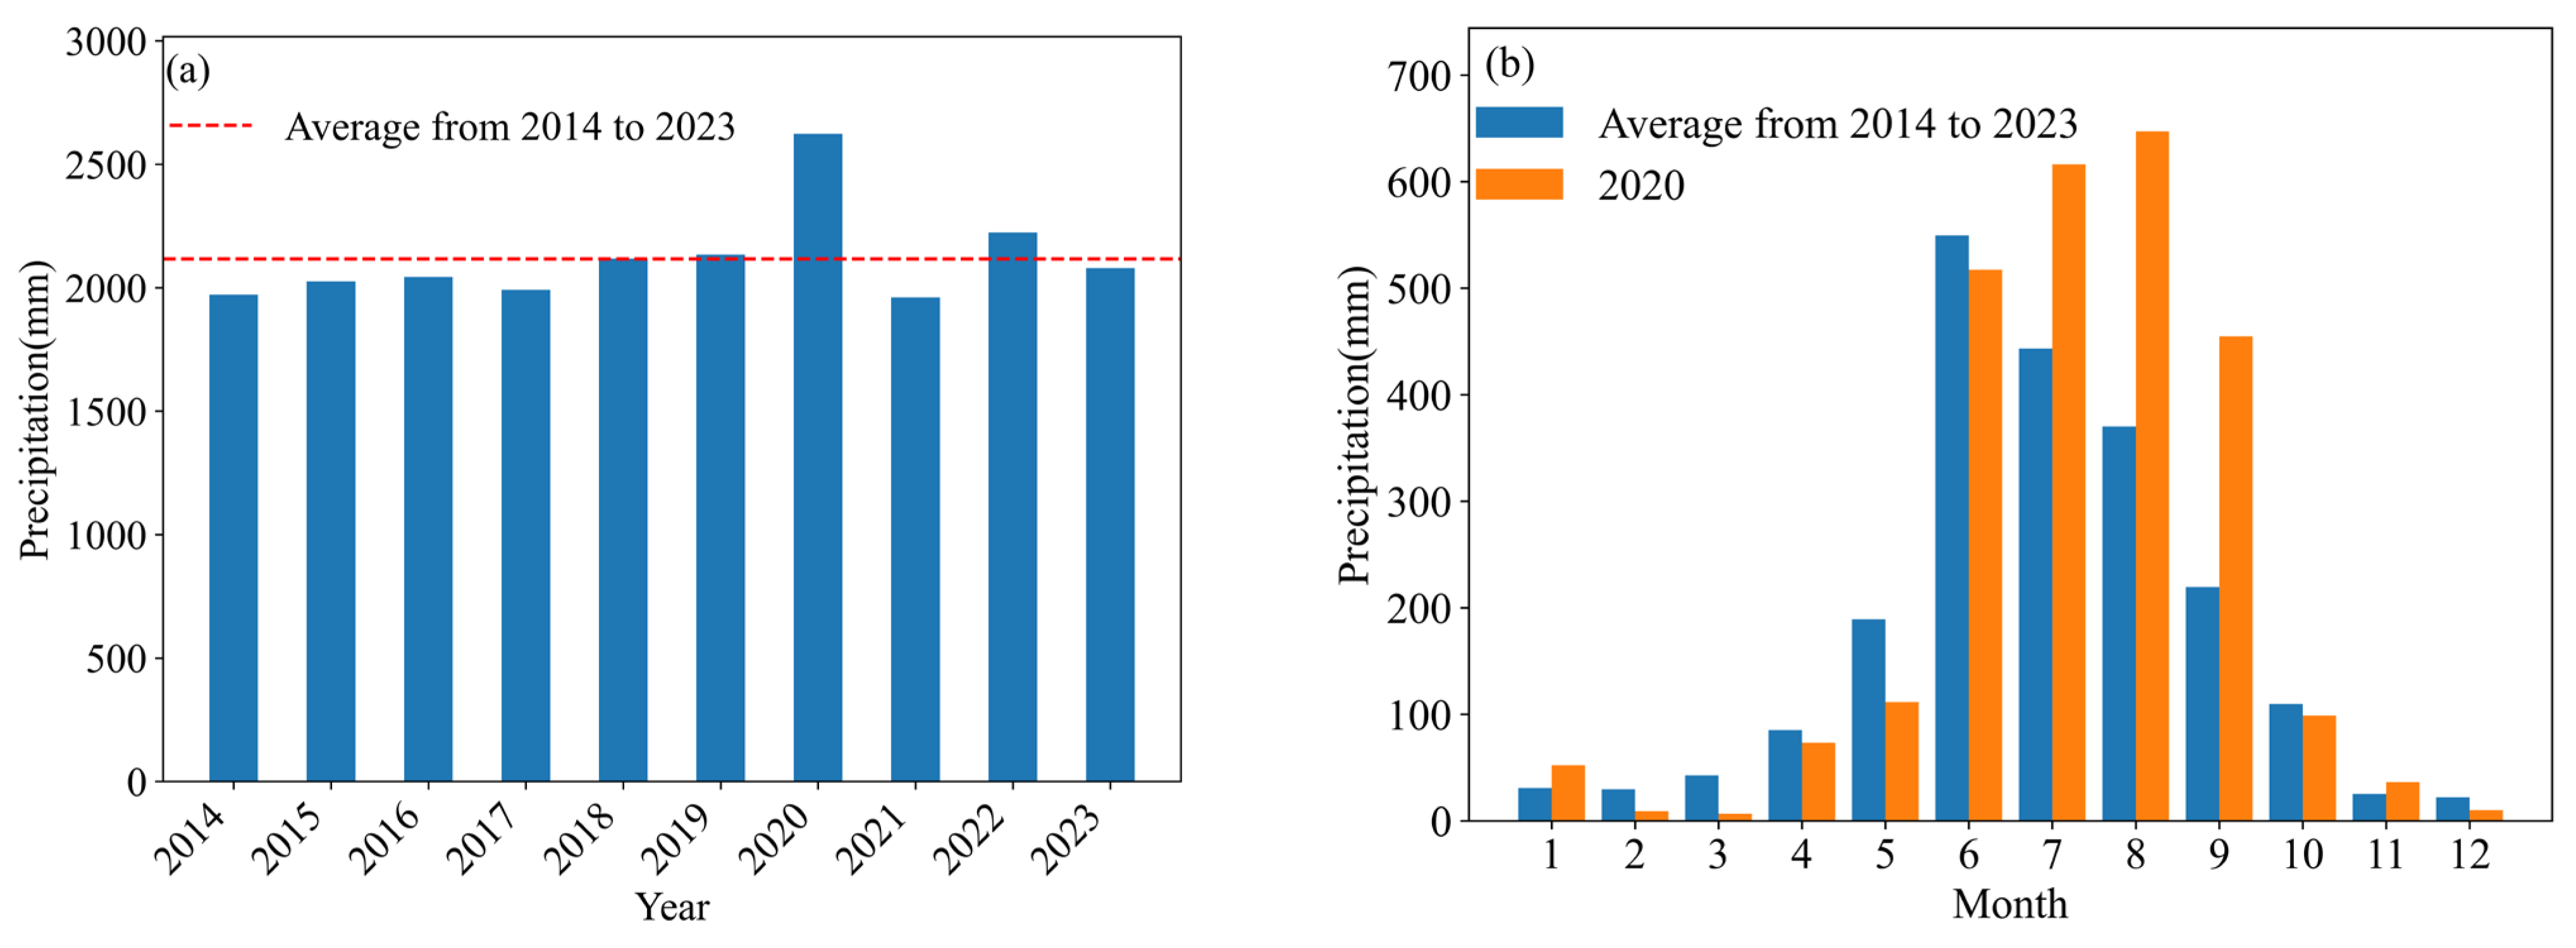
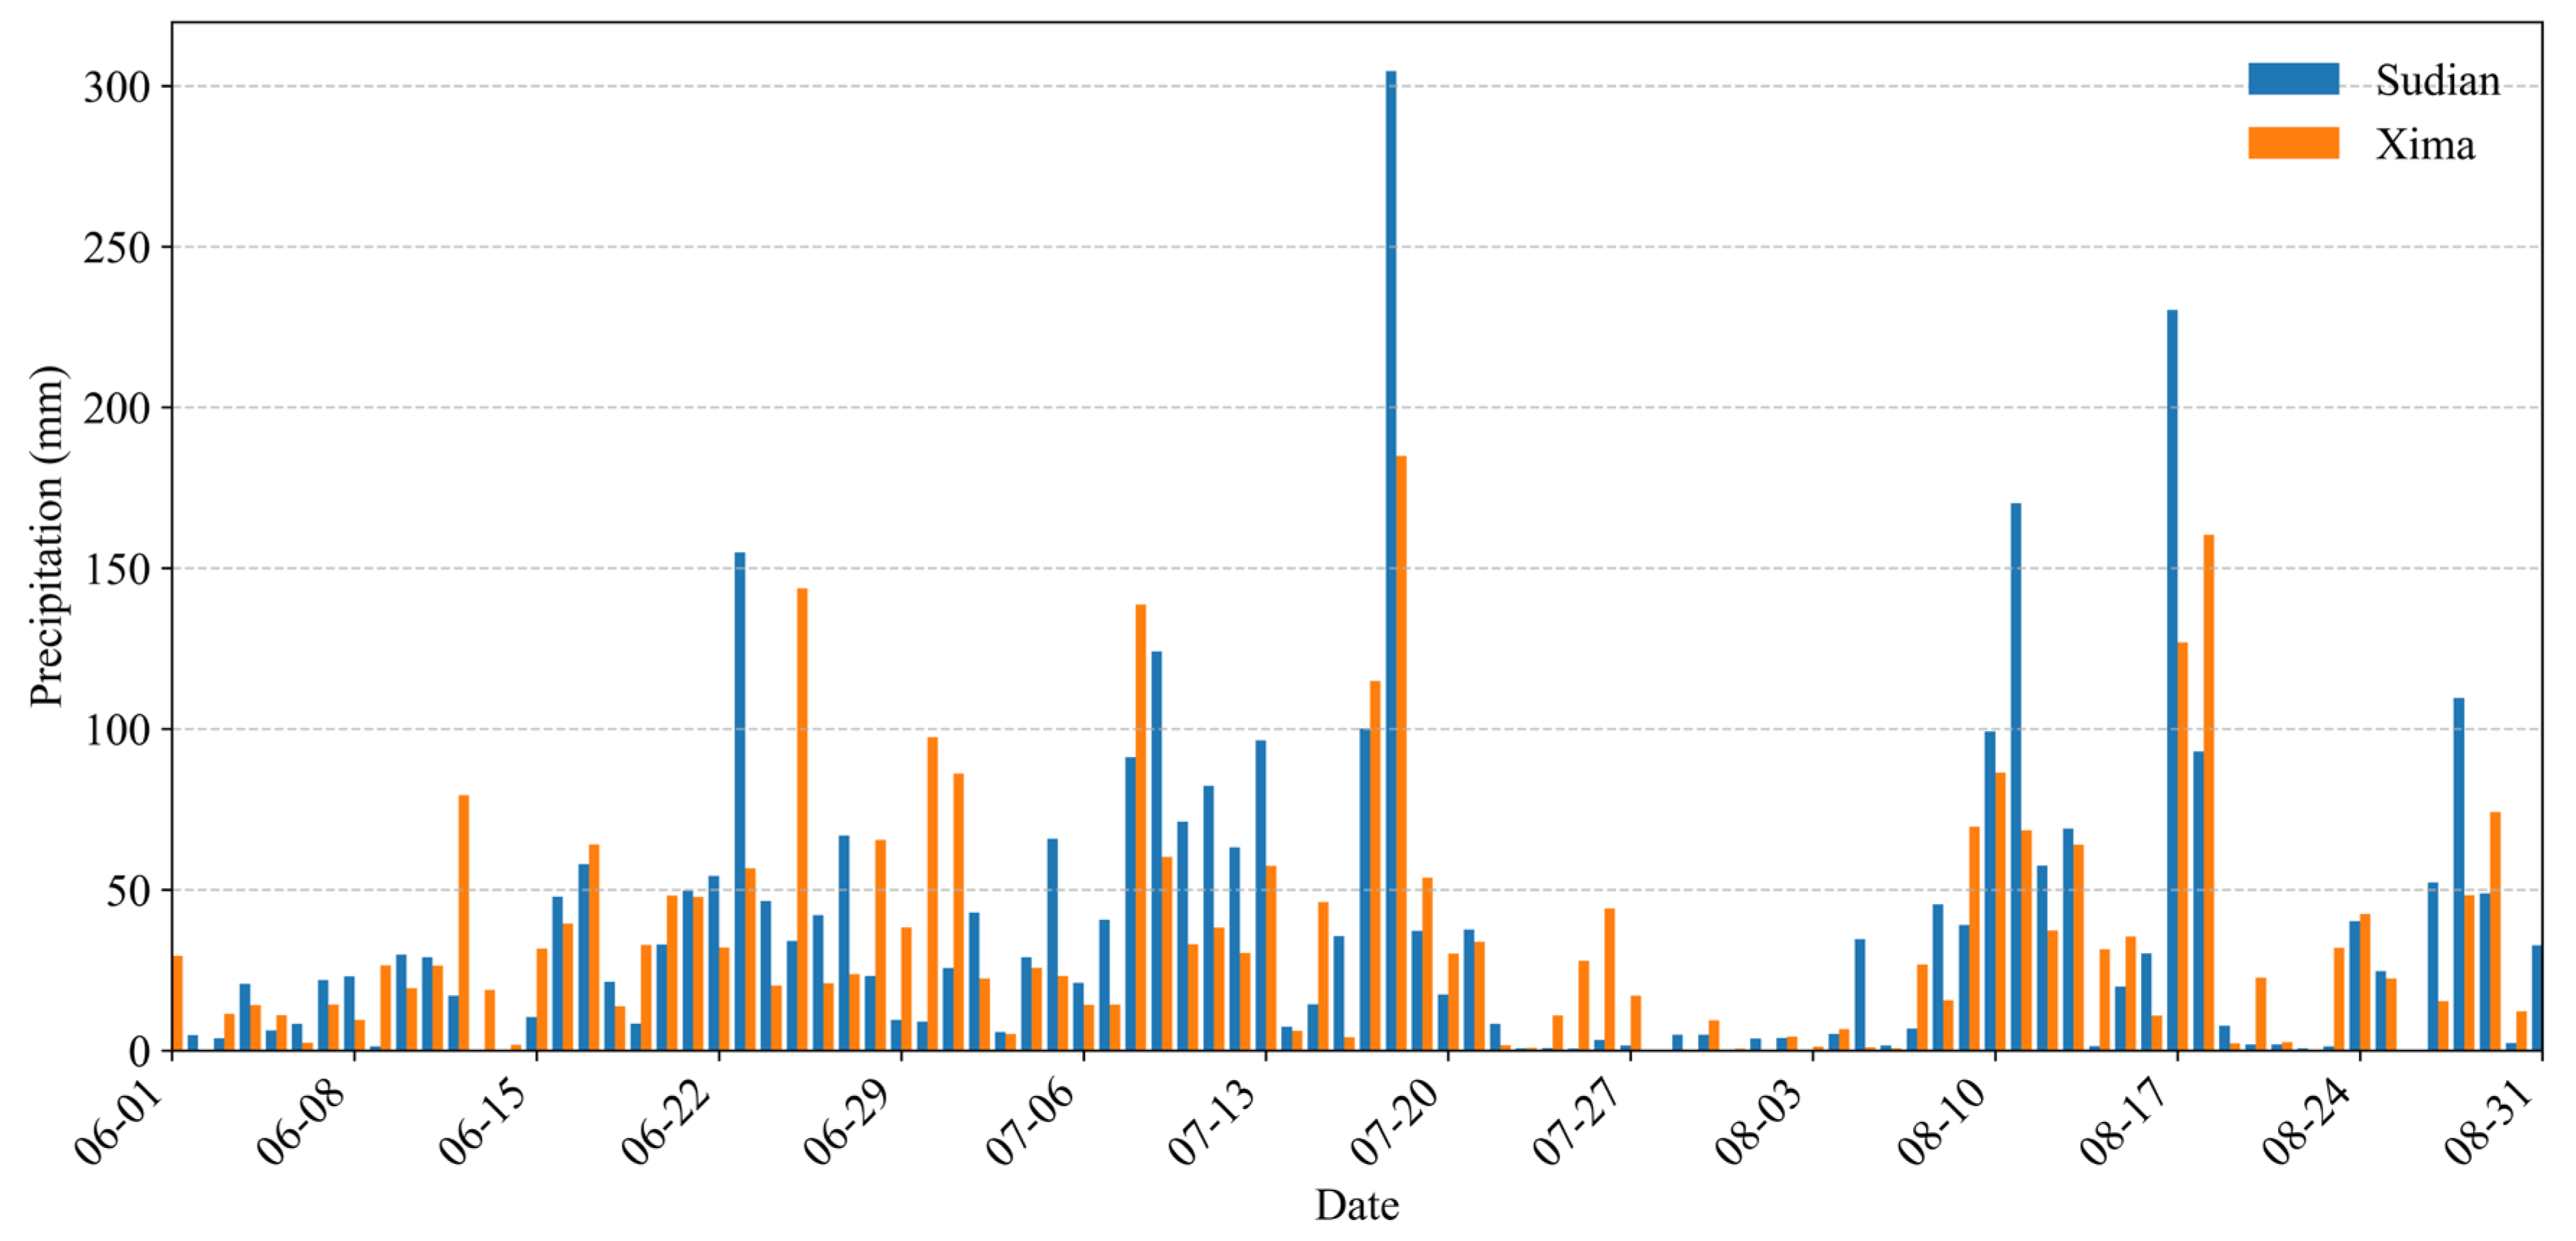
Figure 3a shows the change in the annual precipitation in Yingjiang from 2014 to 2023. The average annual precipitation in Yingjiang County was 2146.25 mm, more than 2000 mm, which indicates that the precipitation in the Yingjiang area was high throughout the year. In 2020, the average precipitation in Yingjiang County was 2623.11 mm, 476.86 mm higher than the annual value. As shown in Figure 3b, precipitation in Yingjiang was unevenly distributed throughout the year, with that in summer accounting for more than 60% of the annual value. Compared to the average precipitation from 2014 to 2023, the precipitation in the summer of 2020 was significantly higher, while that in other seasons showed minimal difference. The period of abnormal precipitation in 2020 mainly occurred in the summer. Figure 4 shows the changes in daily precipitation at Sudian and Xima Stations during the summer of 2020. As shown in the figure, the precipitation at the two stations was consistent and strongly correlated. Combined with the precipitation characteristics of Xima and Sudian Stations shown in Table 1, it can be observed that moderate-to-heavy rainfall occurred in Xima for approximately two-thirds of the time, while slightly fewer days of moderate-to-heavy rainfall occurred in Sudian (less than two-thirds); however, its daily and hourly precipitation amounts were more extreme.

4. Characteristics of Water Vapor Transport and Causes of Precipitation

4.1. Water Vapor Transport Characteristics

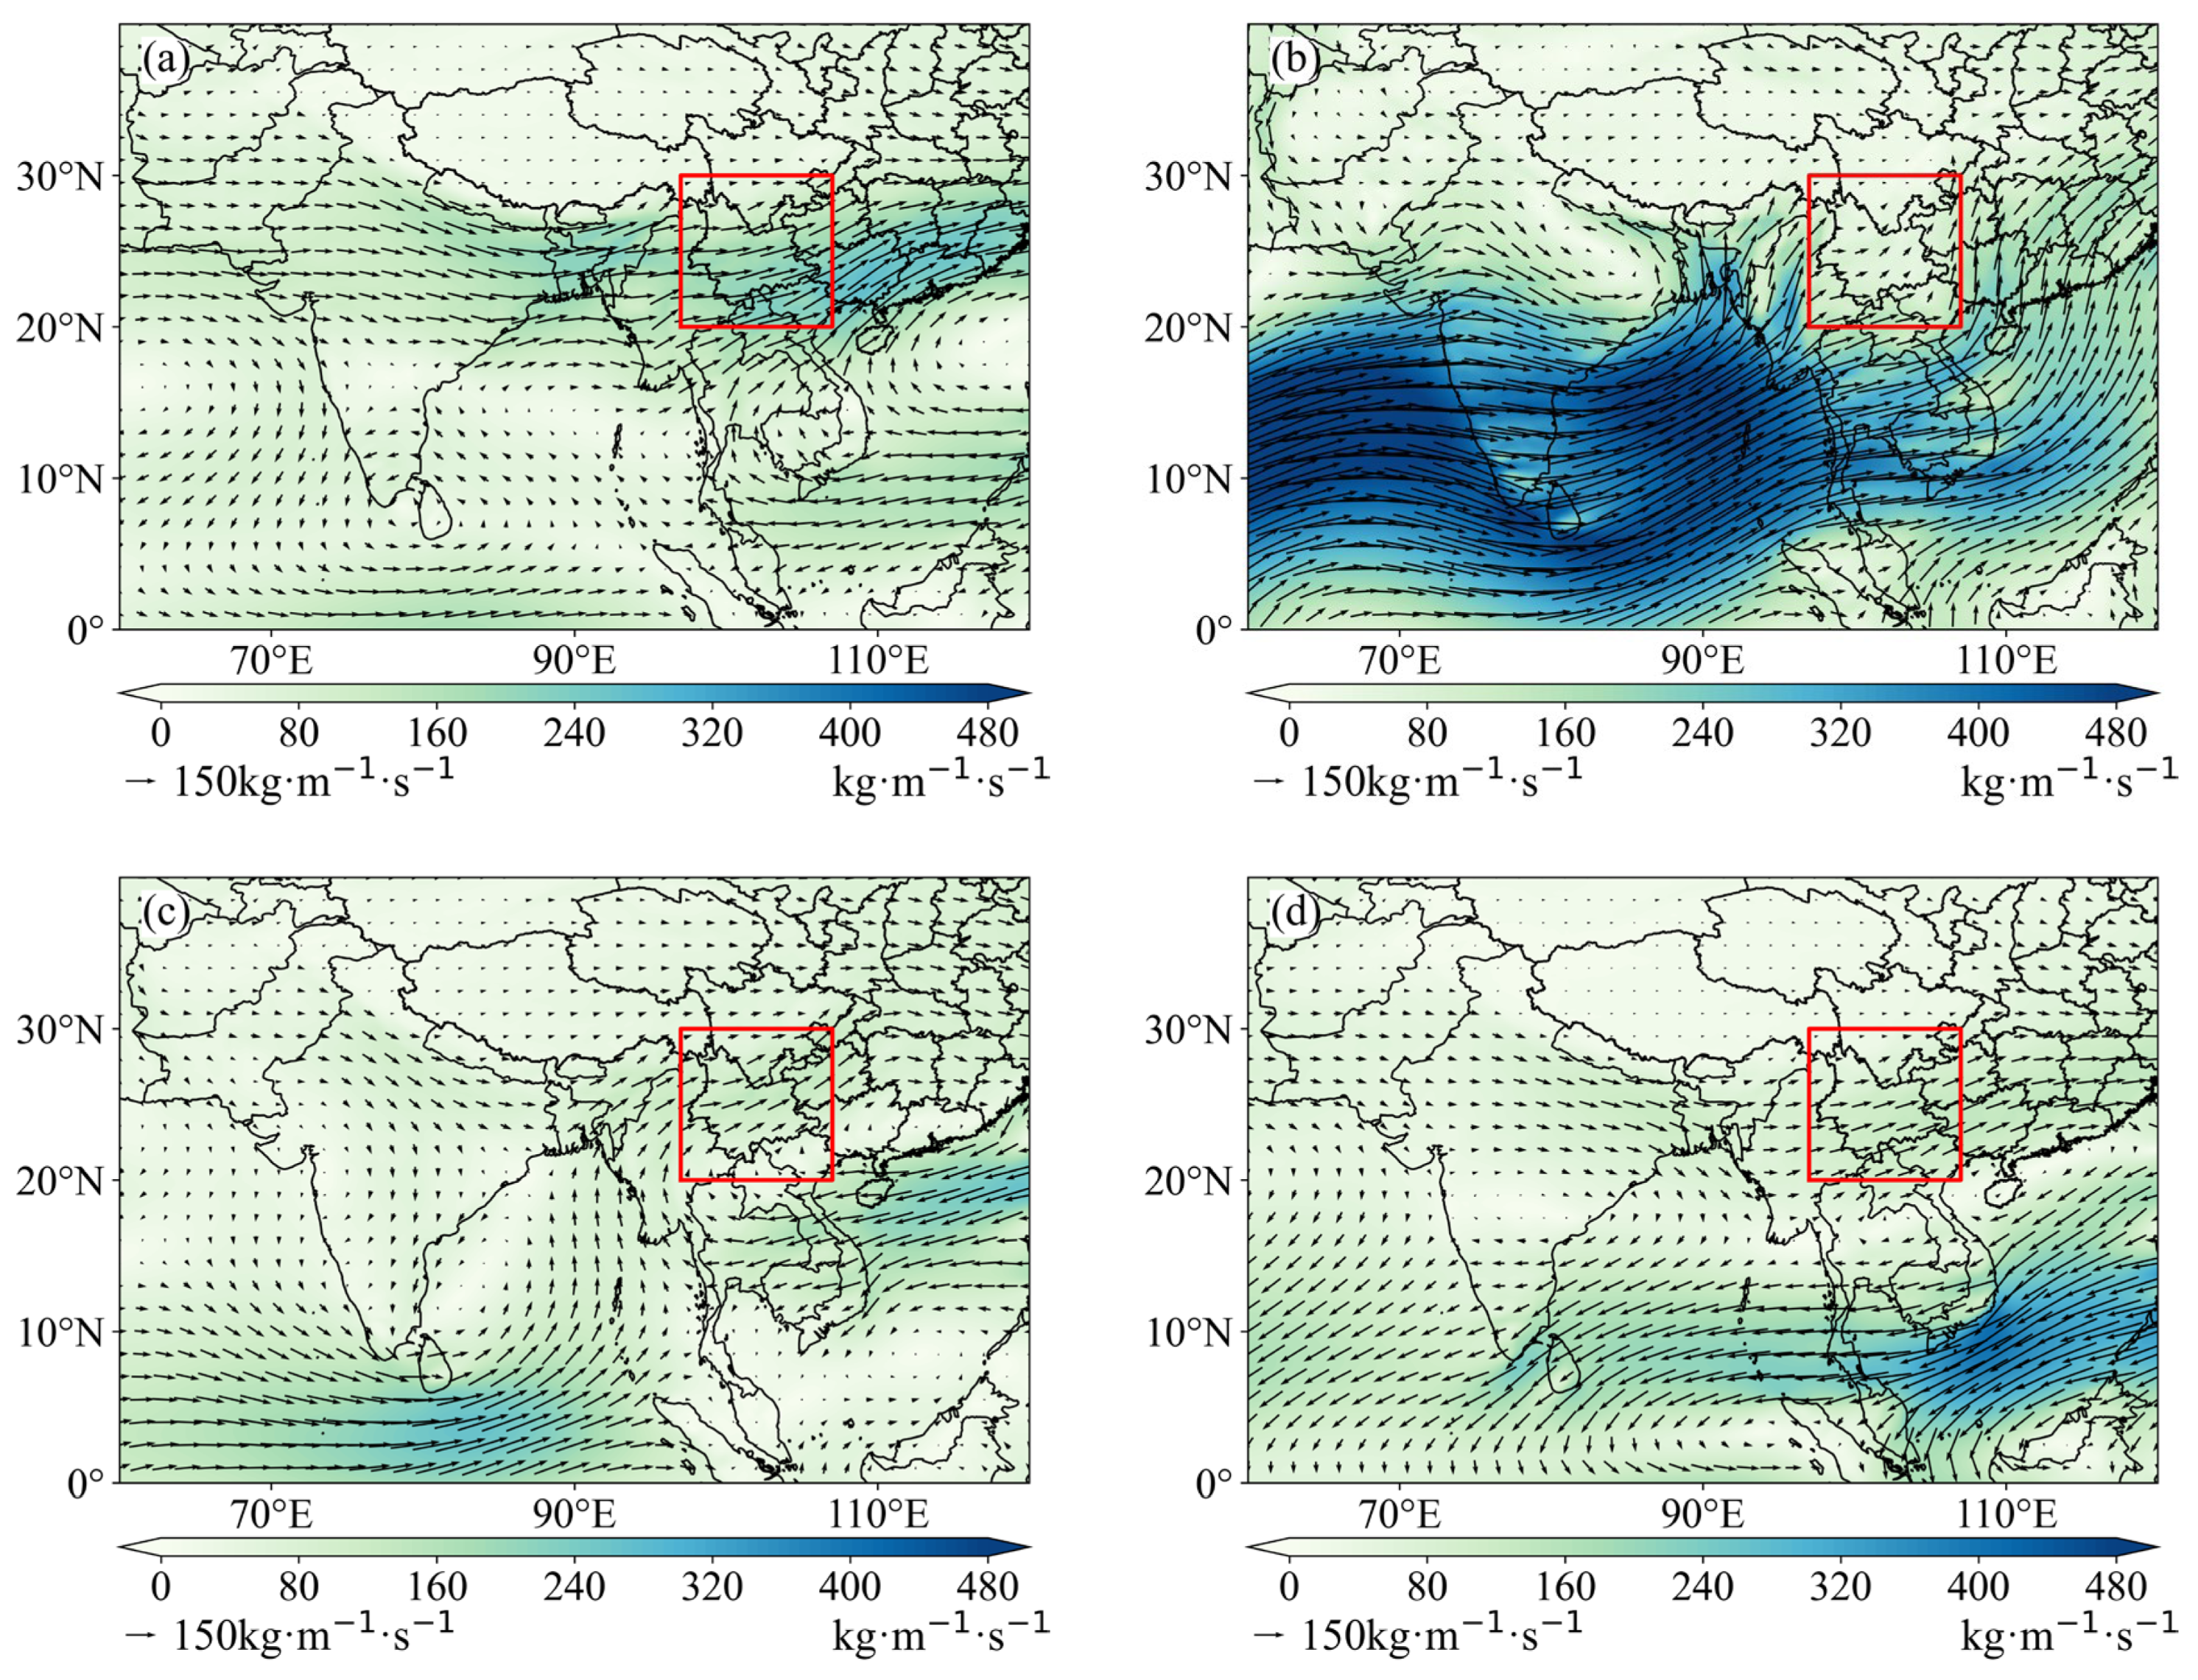
The Yingjiang area in western Yunnan Province exhibits extremely high precipitation throughout the year, especially in summer, which indicates that abundant water vapor is transported throughout the year [30,31]. Therefore, this study analyzed the characteristics of the water vapor flux in this area. Figure 5 shows the annual average water vapor flux for the entire atmospheric column in Yunnan. The average water vapor flux to Yunnan in spring was approximately 168 kg∙m−1∙s−1, and transport occurred mainly along the following two pathways: First, the mid-latitude westerly flow was blocked by the Qinghai–Tibet Plateau, leading to subtropical westerly flow water vapor transport along the southern edge of the plateau, which is an observation similar to that of existing studies [32]. Second, a weak southwest water vapor transport path formed on the northwest side of the subtropical high. Summer exhibited the highest precipitation and the most active water vapor transport. A large amount of water vapor was transported from the Arabian Sea and the Bay of Bengal to the northeast of Yunnan, forming a water vapor transport channel, and some water vapor was transported from the westerly belt south of the plateau. Notably, although the southwest monsoon prevailed in summer and the average water vapor flux in the upper reaches of Yunnan reached 310 kg∙m−1∙s−1, which was much higher than that in spring, the water vapor input into Yunnan was slightly lower than in spring, with an average water vapor flux of approximately 100 kg∙m−1∙s−1. This may be because a large amount of water vapor failed to enter the plateau due to precipitation on the windward slopes of the Hengduan Mountains caused by orographic blocking, which is largely consistent with the findings of Jin et al. [33]. Autumn is the transition period from the summer monsoon to the winter monsoon. The average water vapor flux into Yunnan was approximately 80 kg∙m−1∙s−1, and its water vapor transport path was similar to that in summer. An easterly water vapor transport stream emerged in the northwest Pacific region, which had a significant water vapor replenishment effect on the southern region of Yunnan [34]. In addition, there was westerly water vapor transport to the south of the plateau, which was weaker than in summer. In winter, there was less precipitation in Yunnan, and less water vapor was transported into the region. The average water vapor flux was approximately 87 kg∙m−1∙s−1. Only a small amount of water vapor entered Yunnan through the westerly flow at mid-latitudes and the warm moisture flow in the Indian Ocean.
In summary, the water vapor transport pathways in Yunnan show significant differences with seasonal changes. In summer, the water vapor affecting Yunnan is strongest in the upstream region and subsequently weakened by the terrain when it is transported to the southwest edge of the Hengduan Mountains in Yunnan. It is possible that a large amount of water vapor converges and is uplifted, thereby forming precipitation [35], resulting in a sharp decrease in the amount of water vapor entering the Yunnan Plateau.
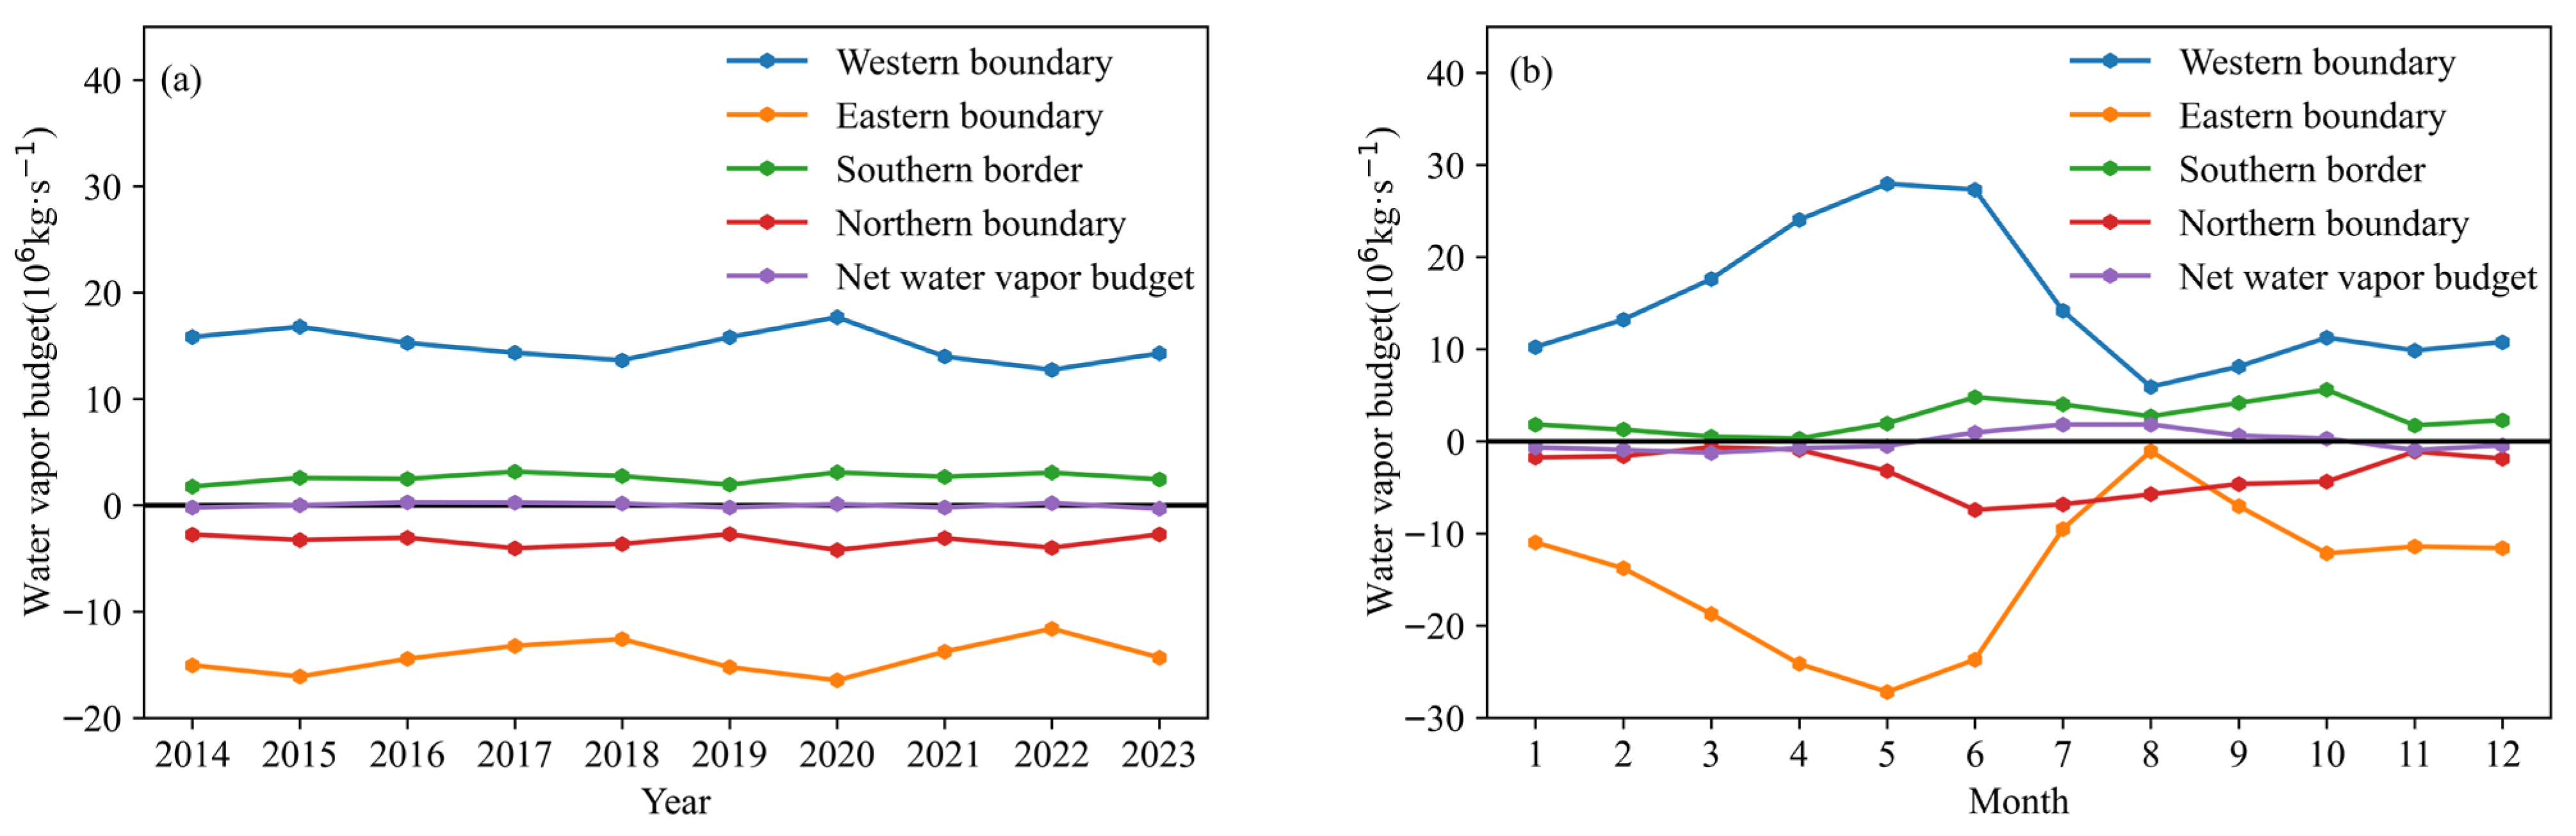
Water vapor is a necessary condition for precipitation. Therefore, this study further analyzed the influx and efflux of water vapor at each boundary to enhance the understanding of water vapor input and output in this region. Figure 6 shows the interannual and monthly changes in the water vapor budget in the Yingjiang region (97.25~98.5° E, 24.25~25.5° N). As shown in the figure, the western and southern boundaries of Yingjiang are both water vapor inputs, whereas the eastern and northern boundaries are both water vapor outputs, and the water vapor input of the western boundary is generally greater than that of the southern boundary. The water vapor input and output of the two regions are similar, and the total influx and efflux fluctuate slightly at approximately zero. The water vapor inputs of the western and southern boundaries of the two regions exhibited the maximum value in 2020, indicating that, in 2020, the water vapor from the western and southern regions was higher than usual, thereby increasing the precipitation in the region. Yingjiang experienced a large amount of water vapor transport in spring (March–May) and summer (June–August). Although the amount of water vapor input in spring was large, the total influx and efflux were less than zero or even negative, indicating that, although the amount of water vapor input was large at this time, owing to the lack of thermal or dynamic conditions, the input water vapor could not effectively trigger the precipitation process, thereby resulting in the net loss of water vapor. The summer monsoon synergistically enhanced water vapor input and dynamic uplift, promoted the conversion of water vapor into precipitation, and resulted in the net accumulation of water vapor. The water vapor budget and its changes in autumn and winter were relatively small and had little impact on the precipitation in Yingjiang.
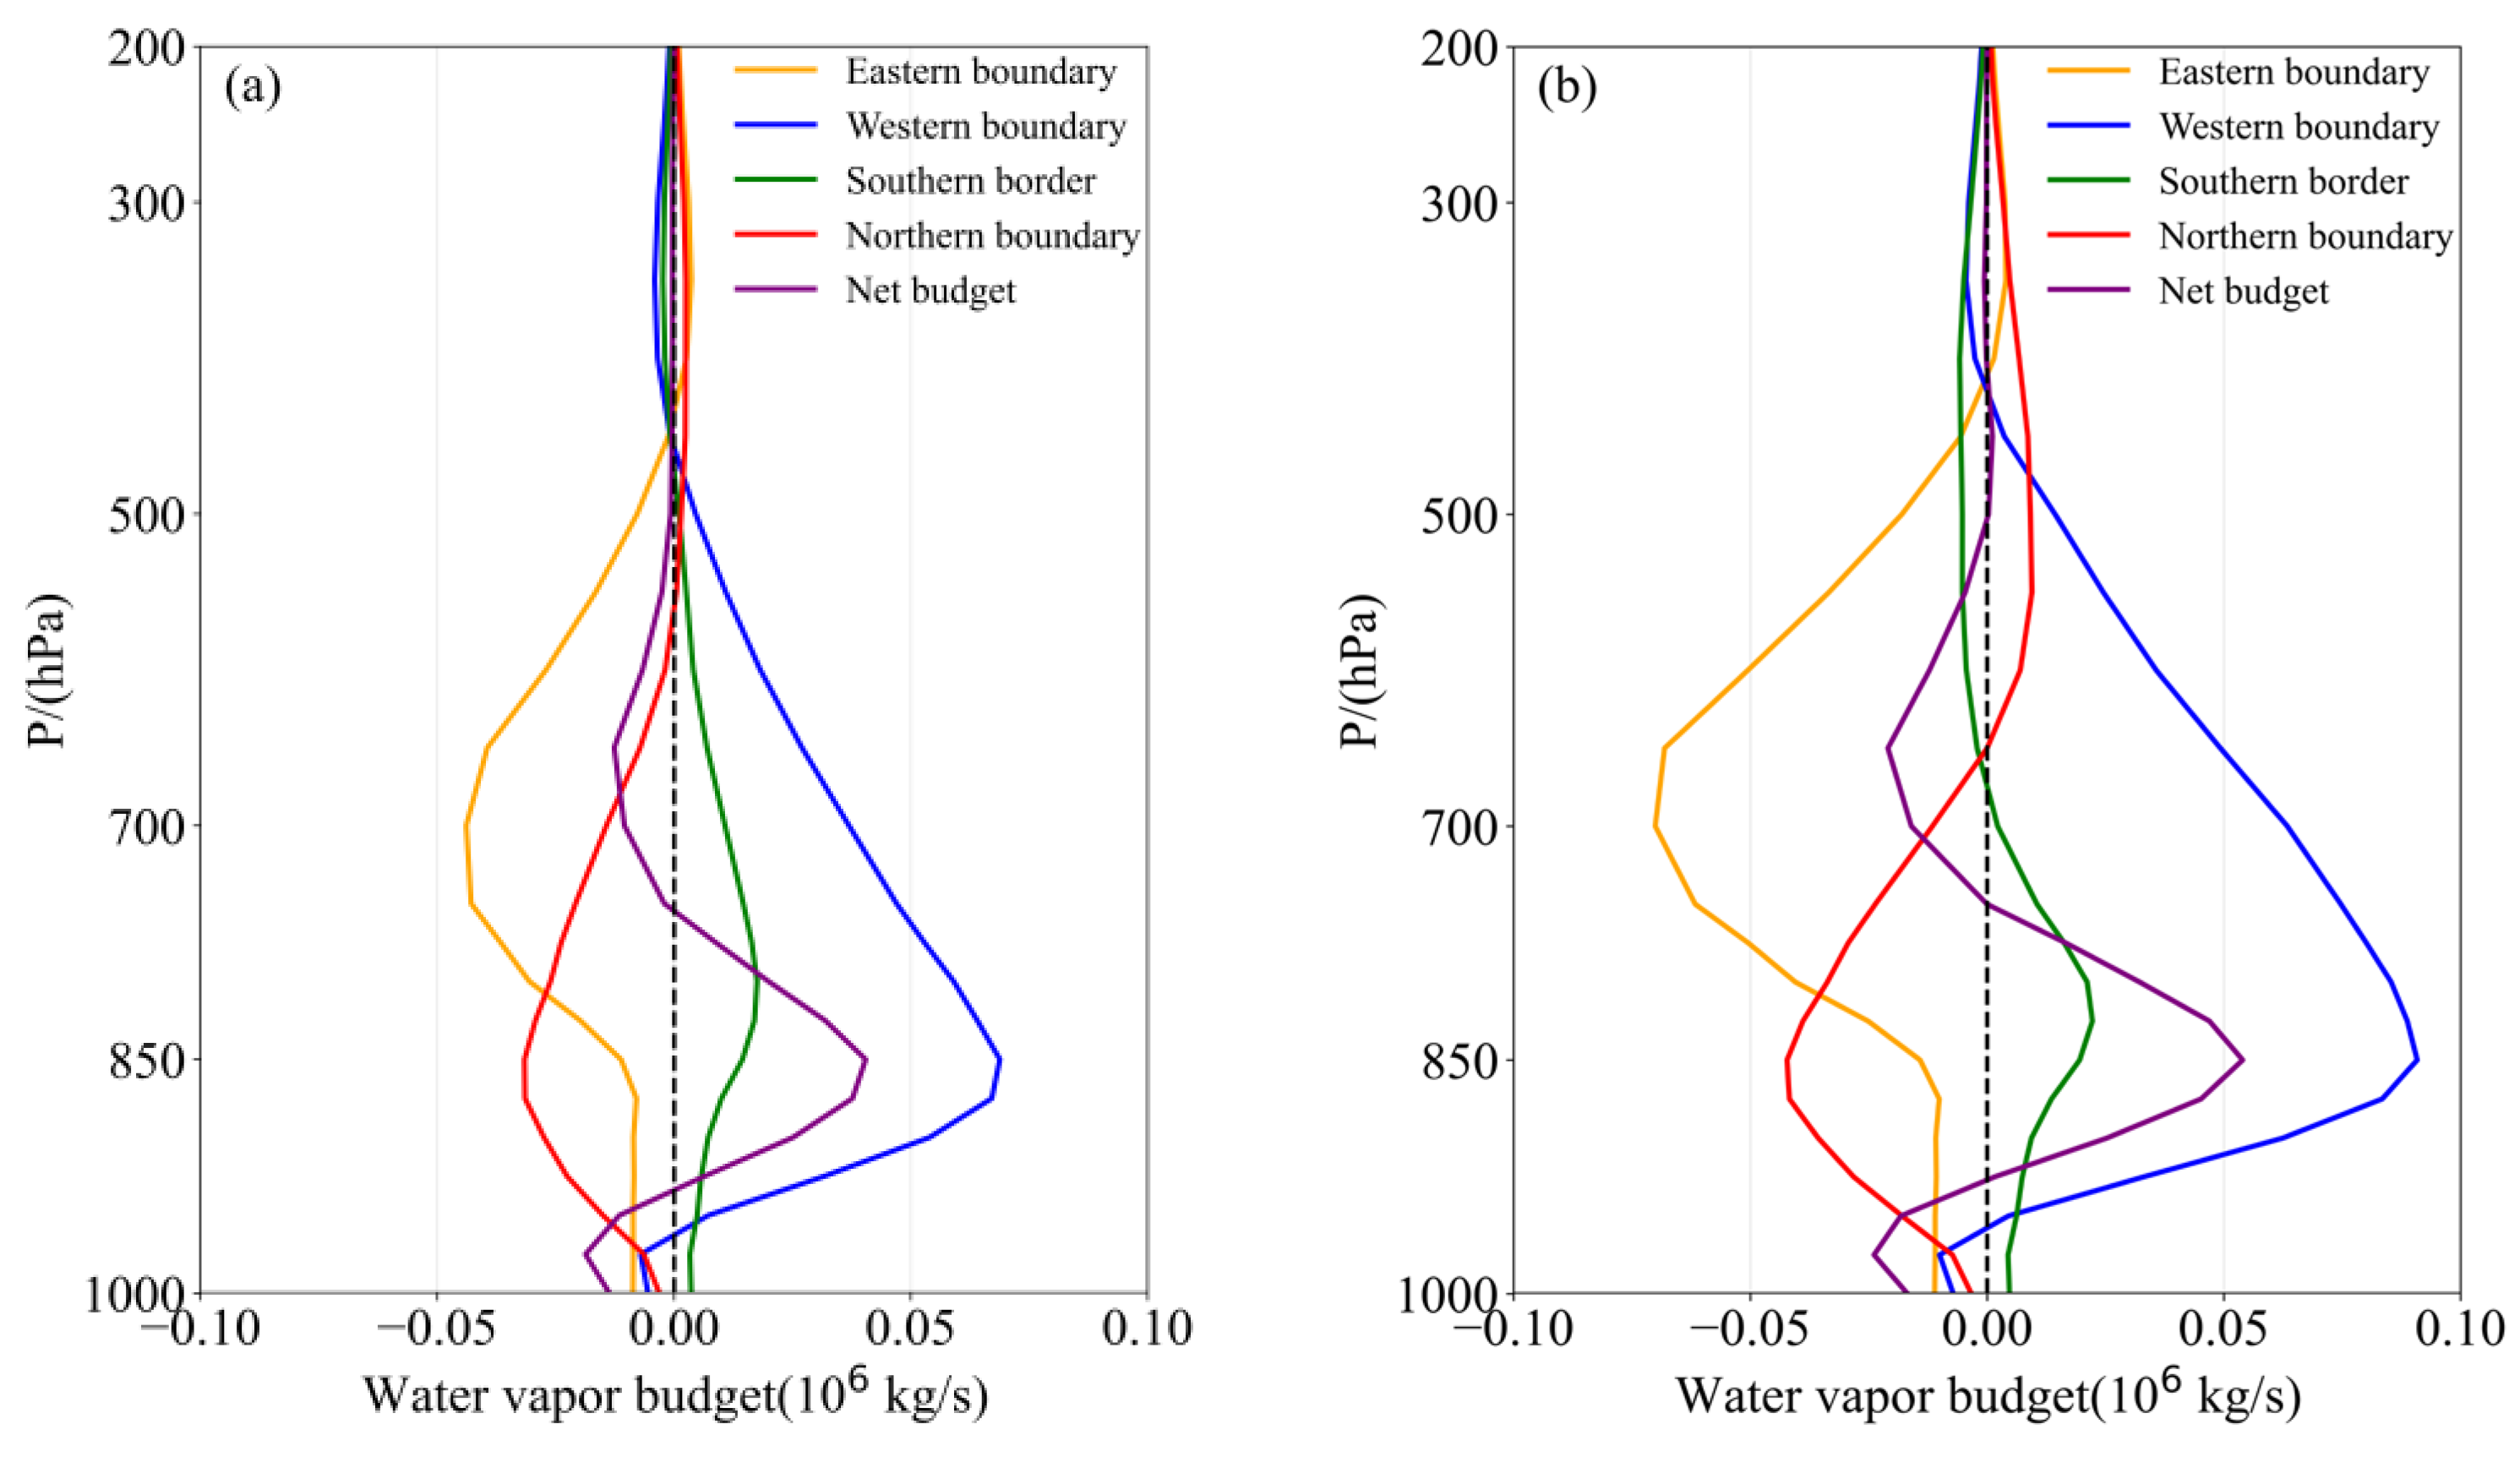
The vertical distributions of the average and net water vapor budgets at each boundary in the Yingjiang region are shown in Figure 7. From 2014 to 2023, the water vapor activity in the Yingjiang area was more active below the 500 hPa pressure layer; the western and southern boundaries had the strongest water vapor input near 850 hPa, and the eastern and northern boundaries had the strongest water vapor output near 700 hPa and 850 hPa, respectively. The water vapor budget intensity in the upper layer (above 500 hPa) was weaker than that in the middle and lower layers, and the budget curves of each boundary were closer to the zero line. The net water vapor input in the Yingjiang area was mainly located near 850 hPa, and the net water vapor output was located at approximately 700 hPa. In 2020, the “double enhancement” of water vapor input along the lower layer of the western and southern boundaries, such as the enhancement of 0.03 × 10⁶ kg/s in the western boundary and 0.01 × 10⁶ kg/s in the southern boundary, provided a sufficient water vapor source for precipitation. However, the output along the eastern boundary was blocked, which prolonged the water vapor retention time in the region and triggered a strong vertical upward movement due to terrain uplift. This rapidly increases the water vapor in the upper air for cooling and condensation, eventually leading to extreme precipitation events. This synergistic effect of “input enhancement and output retardation” is the key mechanism in the water vapor cycle that explains the abnormal precipitation in the summer of 2020.

4.2. Effect of Topography on Water Vapor Convergence

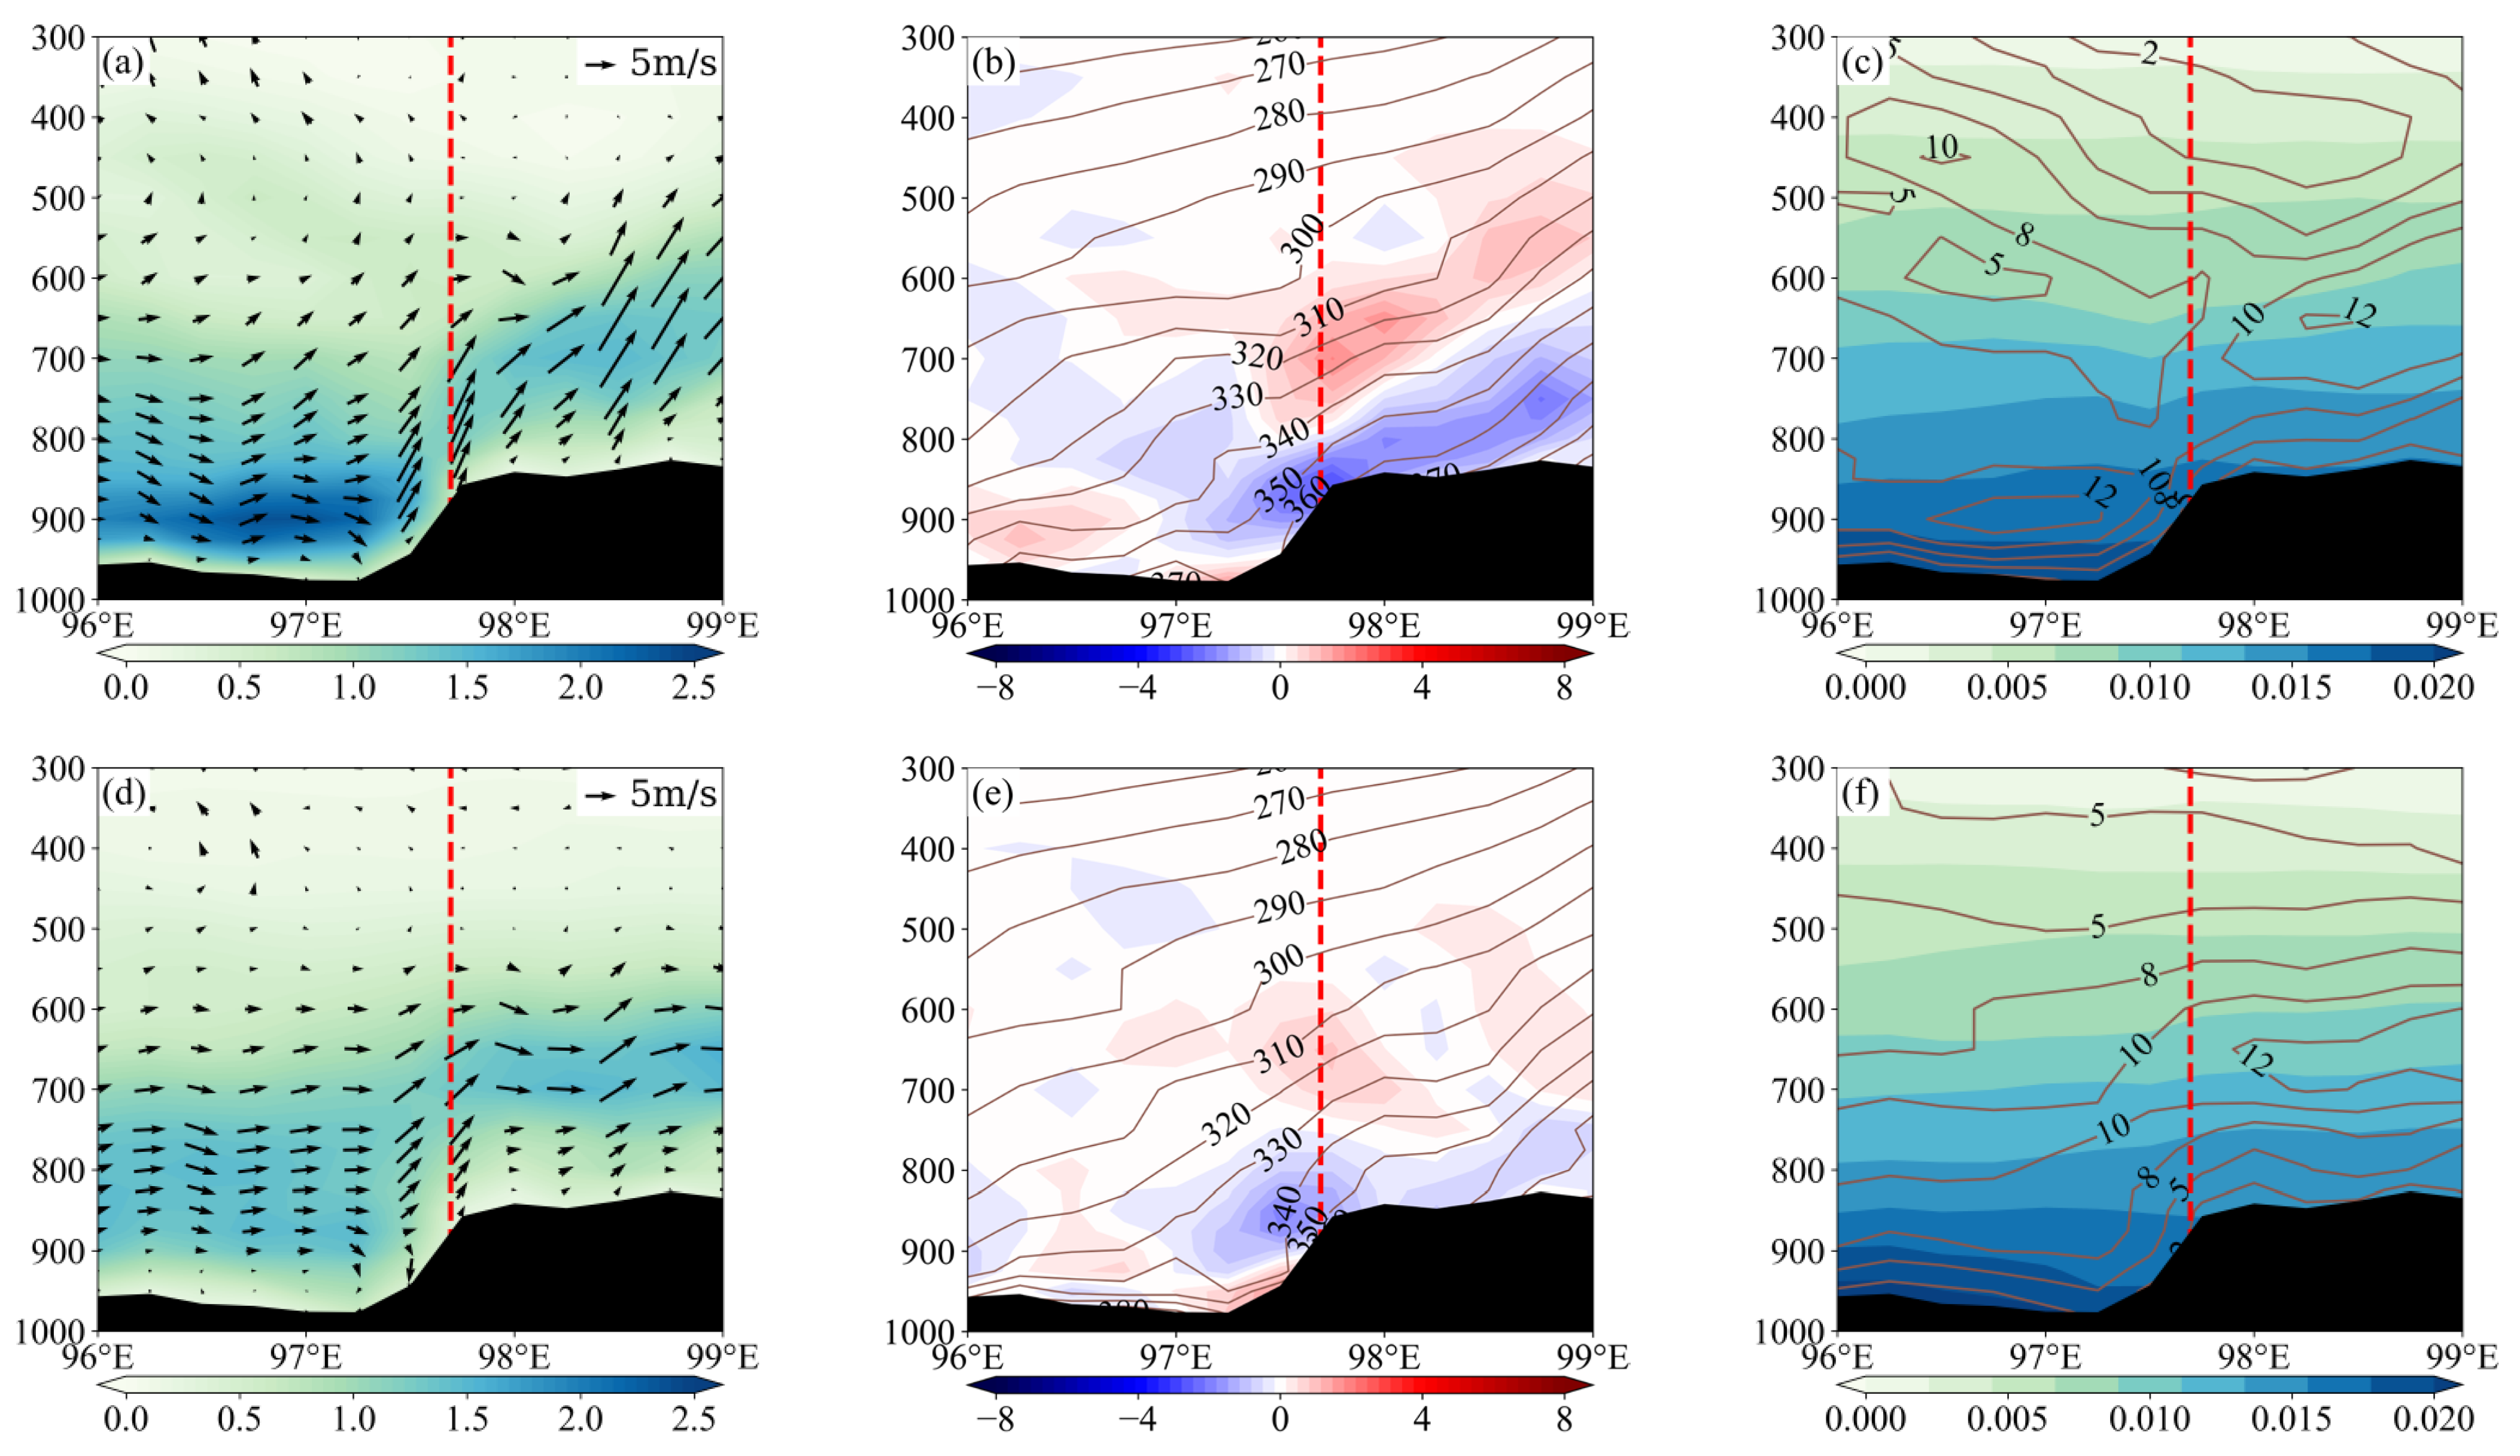
Continuous water vapor transport is required for large-scale persistent heavy rainfall, and low-level water vapor convergence is a key process in heavy rainfall [36]. The altitude difference between Xima and Sudian is large, and the terrain rises significantly, which is conducive to the forced rise of water vapor. In addition, the trumpet-mouth topography in the northern part of the Indochina Peninsula is conducive to the moist airflow of the Indian Ocean entering the region, providing suitable conditions for the water vapor source of Yingjiang. Thus, the water vapor converges and remains in the Yingjiang area. Influenced by topographic uplift, the airflow converges and rises, resulting in local thermal convection and making Yingjiang the largest precipitation center in Yunnan. To further explore the impact of Yingjiang’s topography on water vapor convergence, considering that water vapor in the region is primarily sourced from the western boundary, we analyzed the zonal vertical cross-section of water vapor flux during two heavy precipitation events that occurred on 18 July and 17–18 August 2020.
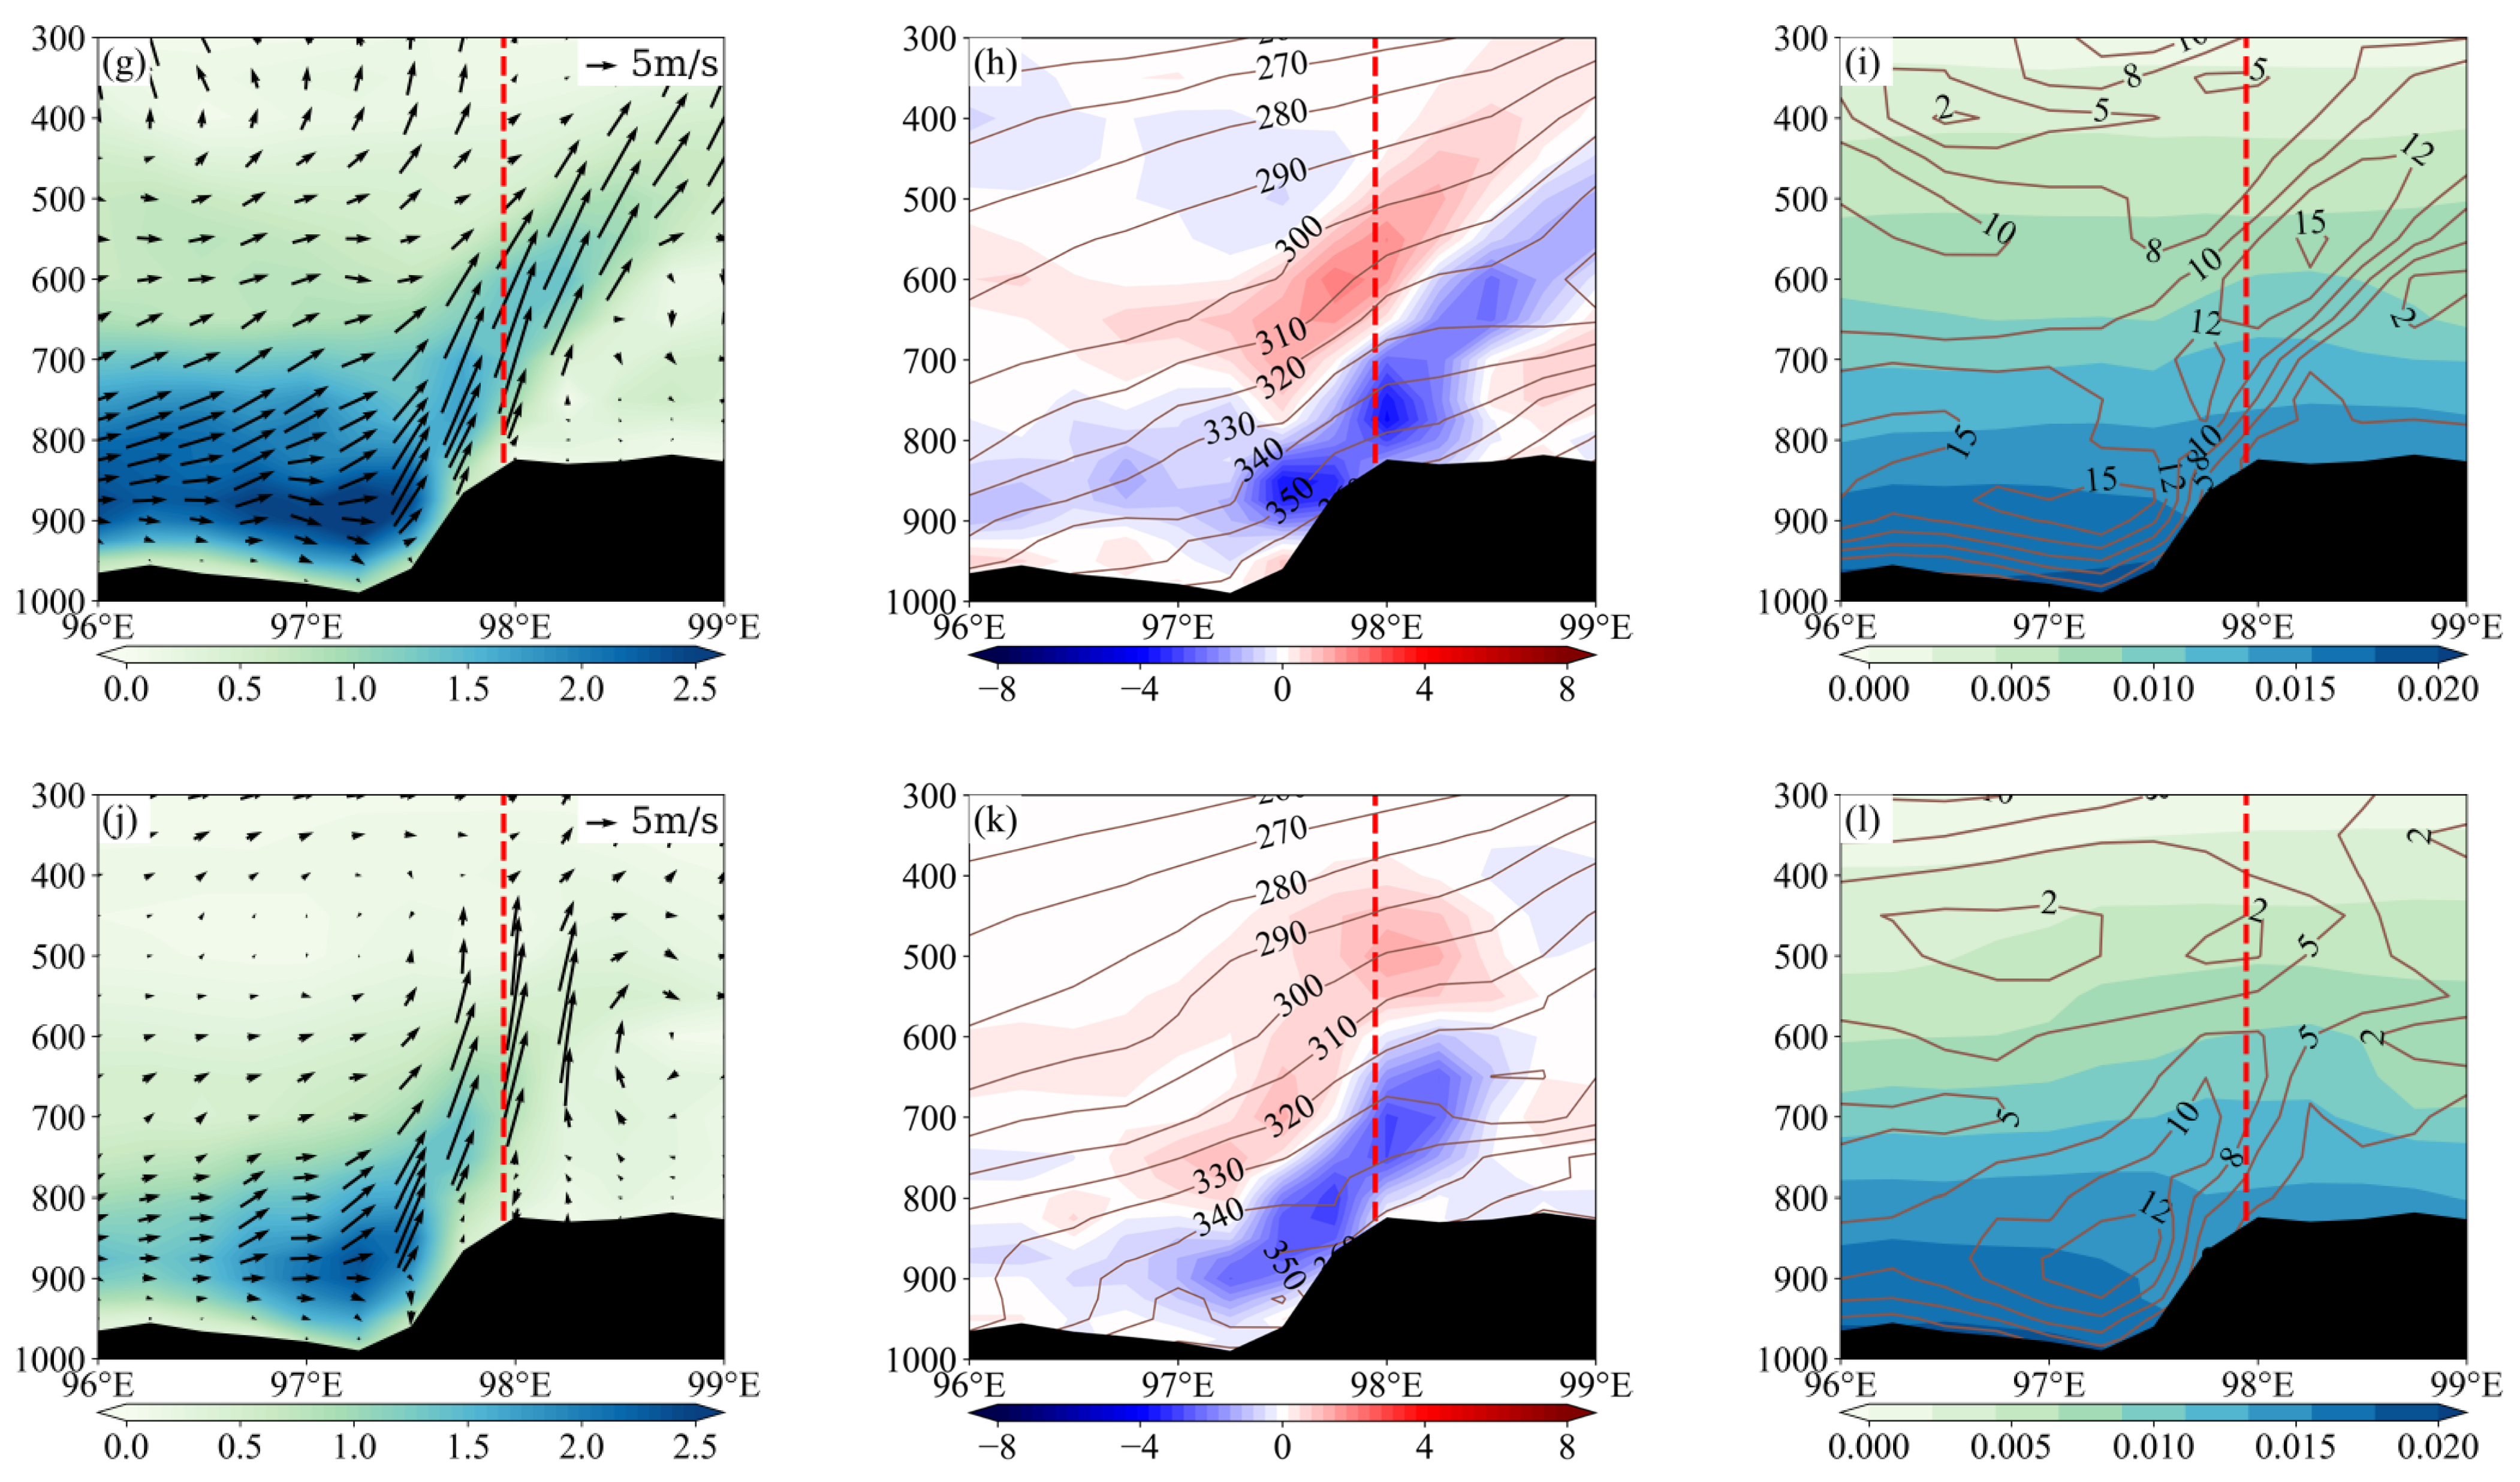
A heavy precipitation event occurred in the Yingjiang area on 18 July 2020. Precipitation began in the early morning, reached its peak at dawn, and began to weaken gradually in the morning; the main rainfall period basically ended at 12:00. As shown in Figure 8, at 03:00 on 18 July 2020, a large amount of water vapor was transported from the west side of the mountain (925~800 hPa), forming a large gradient area blocked by the terrain, resulting in inclined upward movement on the windward slope (925~650 hPa), with the strongest ascent occurring near Xima Station (Figure 8a). As shown in Figure 8b, there was an inclined convergence of water vapor between 925 and 750 hPa in front of and over the mountain. The convergence center was on the windward slope on the western side of Xima Station, reaching −2.8 kg∙hPa−1∙m−2∙s−1. Simultaneously, the velocity of the westerly airflow over the mountains gradually decreased with an increase in altitude, which may be related to surface friction [37]. Wind speed divergence occurred at 800~700 hPa, while wind direction divergence between westerly and easterly airflow occurred near Xima Station at altitudes above 500 hPa. This resulted in significant water vapor divergence at 800~500 hPa in front of and over the mountain, with a divergence center of 1.8 kg∙hPa−1∙m−2∙s−1. The terrain-induced uplift mechanism was superimposed with the above water vapor convergence and divergence processes, and a strong updraft was induced near 850 hPa through the suction effect. The strongest upward motion at 900~750 hPa was concentrated near Xima Station on the windward slope, making this area the primary precipitation area. In addition, the low-level southwest jet continuously transported warm and wet air to the windward slope, and the pseudo-equivalent potential temperature isolines tilt along the mountain, thereby maintaining the unstable stratification of warm and wet air in the lower layer and cold and dry air in the upper layer, which can provide favorable thermal conditions for precipitation (Figure 8b,e) [38]. The precipitation process weakened significantly by 12:00 on 18 July. At this time, the water vapor transport and vertical movement of the westerlies in front of the mountain weakened, and the water vapor flux decreased from approximately 2.0 kg∙hPa−1∙m−1∙s−1 to approximately 1.25 kg∙hPa−1∙m−1∙s−1. The intensity and range of the water vapor convergence and divergence over the windward slope weakened (Figure 8d,e). During this process, the wind speed and stratification-specific humidity in front of the mountain decreased, with the wind speed decreasing more significantly, which also reflects the importance of low-level rapid water and vapor transportation in front of the mountain (Figure 8c,f). A heavy precipitation event occurred in the Yingjiang area from 17 to 18 August 2020. The precipitation began to intensify at 18:00 on 17 August, reached the maximum amount at 22:00, and then began to drop; the main rainfall period basically ended after 12:00 on 18 August. At 22:00 on 17 August, a relatively deep westerly rapid-flow vapor transmission occurred at 925~700 hPa on the western side of Sudian Station. After being transported to the windward slope, it was blocked by the terrain, producing a strongly inclined upward movement. Water vapor convergence occurred at 900~750 hPa near Sudian Station in front of and over the mountain, and the convergence center reached −3.9 kg∙hPa−1∙m−2∙s−1. Water vapor divergence occurred at 725~500 hPa above the windward slope, and the divergence center reached 2.1 kg∙hPa−1∙m−2∙s−1. The continuous transportation of low-level torrential water vapor in front of the mountain and the strong uplift movement caused by the blocking of the windward slope were the main reasons for the large amount of precipitation in this area (Figure 8g,h). The characteristics of the pseudo-equivalent potential temperature isoline of the precipitation process were consistent with previous descriptions. At 12:00 on August 18, the precipitation process significantly weakened, and the low-level torrential water vapor transport between 96° E and 97° E in front of the mountain also significantly weakened. In particular, the water vapor flux between 96° E and 96.5° E weakened from approximately 2.5 kg∙hPa−1∙m−1∙s−1 to approximately 1.25 kg∙hPa−1∙m−1∙s−1, and the water vapor convergence and divergence intensity near Sudian Station also weakened (Figure 8j,k). In this process, the wind speed at 96–97° E, before the middle of the mountain, decreased significantly from 15 m/s to approximately 8~10 m/s, while the specific humidity changed slightly, indicating the necessity of water vapor transport for sustained precipitation in the region (Figure 8i,l).
The above analysis more clearly illustrates the roles of the terrain-induced forced uplift of the low-level westerly flow, blocking by the low-level convergence system, and the vertical transport of water vapor, indicating that low-level water vapor transport and terrain uplift are the key factors driving the sustained heavy rainfall in the region.

4.3. Analysis of Water Vapor Transport Source and Contribution

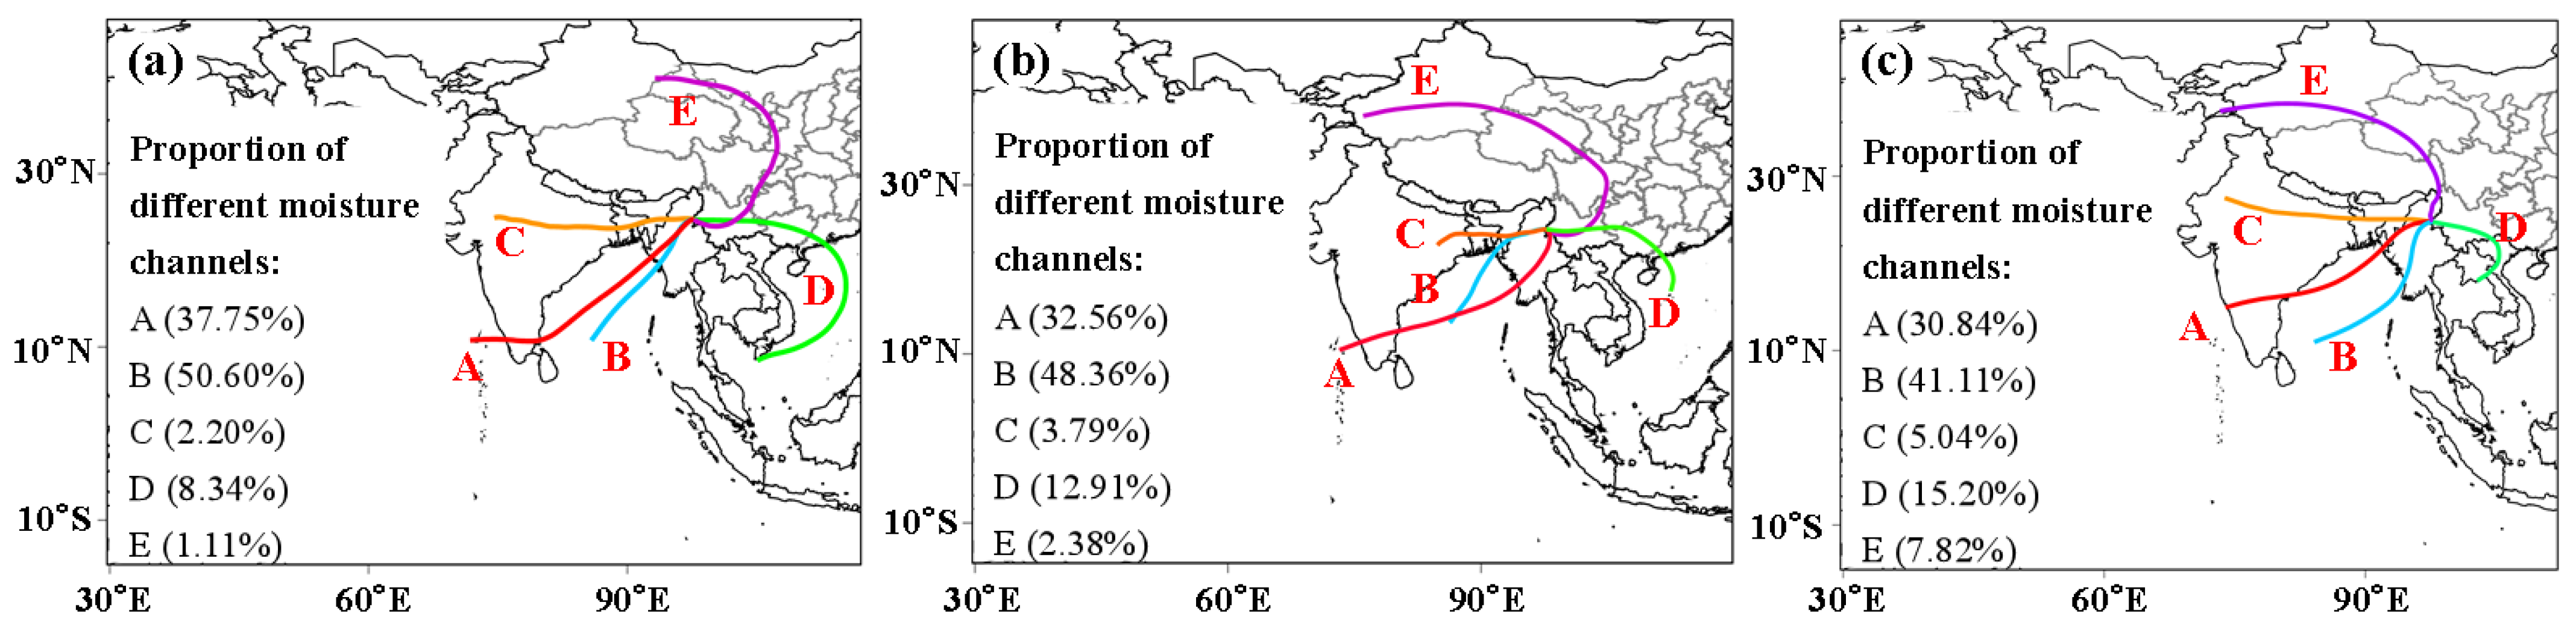
HYSPLIT is an air mass trajectory tracking model based on the Lagrange method. It can track the air mass trajectory and effectively reveal the source path of water vapor. In this study, the backward trajectories of water vapor at three levels (800 hPa, 700 hPa, and 600 hPa) in the Yingjiang area during summer from 2014 to 2023 were simulated, with 11,040 trajectories obtained for each level. The five most representative water vapor transport paths at each level were identified through trajectory clustering, as shown in Figure 9. The five water vapor channels are as follows: (A) The Arabian Sea Channel: the water vapor mainly originates from the Arabian Sea in the Indian Ocean and flows through the Bay of Bengal and the northern Indochina Peninsula into Yingjiang, Yunnan Province. (B) The Bay of Bengal Channel: the water vapor mainly originates from the Bay of Bengal and enters Yingjiang in Yunnan Province from the north of the Indochina Peninsula. (C) The Westerly Channel: the water vapor originates from the Ganges River Plain in the northeast of the Indian Peninsula and is transported eastward through the south of the Qinghai–Tibet Plateau into Yingjiang in Yunnan Province. (D) The South China Sea and Western Pacific Channel: the water vapor mainly originates from the South China Sea and the western Pacific Ocean, entering Yingjiang, Yunnan Province, via the South China Sea, the western Pacific, Guangxi, and Guangdong. (E) The Northwest Channel: the primary source of water vapor can be traced back to West Siberia, reaching Xinjiang, Qinghai, and Sichuan in China, and entering Yingjiang in Yunnan.
As can be seen in Table 2, the distribution of water vapor trajectories and channel contributions at different height levels exhibit a clear pattern: in the lower-level water vapor trajectories, the Bay of Bengal channel (5586) and the Arabian Sea channel (4168) account for the highest proportion, followed by the South China Sea and western Pacific channel (921), with the westerly belt (243) and northwest channels (122) having the fewest trajectories; the water vapor paths from the westerly belt and the southwest monsoon account for 90.55% of the total paths, while the northern paths account for only 1.11%. The Bay of Bengal channel ranks first in both specific humidity and water vapor flux contribution rates, reaching 50.79% and 51.09%, respectively, followed by the Arabian Sea channel (37.86% and 38.01%) and the South China Sea and western Pacific channel (8.2% and 8.08%). The distribution of the trajectories in the middle layer is largely consistent with that in the lower layer, with the Bay of Bengal pathway (5339 trajectories) and the Arabian Sea pathway (3595 trajectories) still accounting for the largest proportions. The South China Sea and western Pacific pathway (1425 trajectories) ranks third, while the westerly belt (418 trajectories) and the northwest pathway (263 trajectories) continue to have the fewest trajectories. The proportion of trajectories in the westerly belt and the southwest monsoon water vapor path decreases to 84.71%, while the proportion of trajectories in the northern path slightly increases to 2.38%. The Bay of Bengal pathway remains the largest contributor to specific humidity (41.14%) and water vapor flux (44.50%), with the Arabian Sea pathway (32.99% and 35.47%) and the South China Sea and western Pacific pathway (19.24% and 15.62%) contributing progressively less. The distribution of high-level water vapor trajectories follows the overall trend of the middle and lower levels, but with slight differences. The Bay of Bengal channel (4538 trajectories) and the Arabian Sea channel (3405 trajectories) remain the main sources, while the proportion of trajectories in the South China Sea and western Pacific channel (1678 trajectories) further increases. The westerly belt (556 trajectories) and the northwest channel (863 trajectories) still have the fewest trajectories. The proportion of water vapor paths in the westerly belt and the southwest monsoon continues to decline to 76.99%, while the proportion of northern paths rises to 7.82%. In terms of specific humidity and water vapor flux contribution rates, the Bay of Bengal channel has the highest specific humidity (42.36%) and water vapor flux (43.17%) contributions, followed by the Arabian Sea channel (31.52% and 31.90%) and the South China Sea and western Pacific channel (16.96% and 16.45%).
In summary, the water vapor at all levels is primarily sourced from the Bay of Bengal, the Arabian Sea, and other regions influenced by the southwest monsoon. Their combined contributions to specific humidity and water vapor flux exceed 70%, and the proportion of southwest monsoon water vapor transport at low levels is higher than that at high levels. This result is consistent with the overall pattern of large-scale water vapor transport in the Asian summer monsoon region. The southwest direction is always the main moisture input pathway for the East Asian continent, highlighting that low-latitude sea areas such as the Bay of Bengal and the Arabian Sea act as key water vapor source regions for Yingjiang in the global water vapor cycle. The dominant contribution of the southwest water vapor pathway, combined with the topographically forced pumping effect, significantly enhances the regional precipitation process. Summer precipitation in Yingjiang is highly dependent on water vapor transport from the southwest (Bay of Bengal and Arabian Sea). In the future, studies can be conducted to analyze the intensity indices of southwest water vapor transport in order to provide a reference for the monitoring, diagnosis, and prediction of summer heavy precipitation in Yingjiang.

4.4. Analysis of the Causes of Abnormal Precipitation in 2020

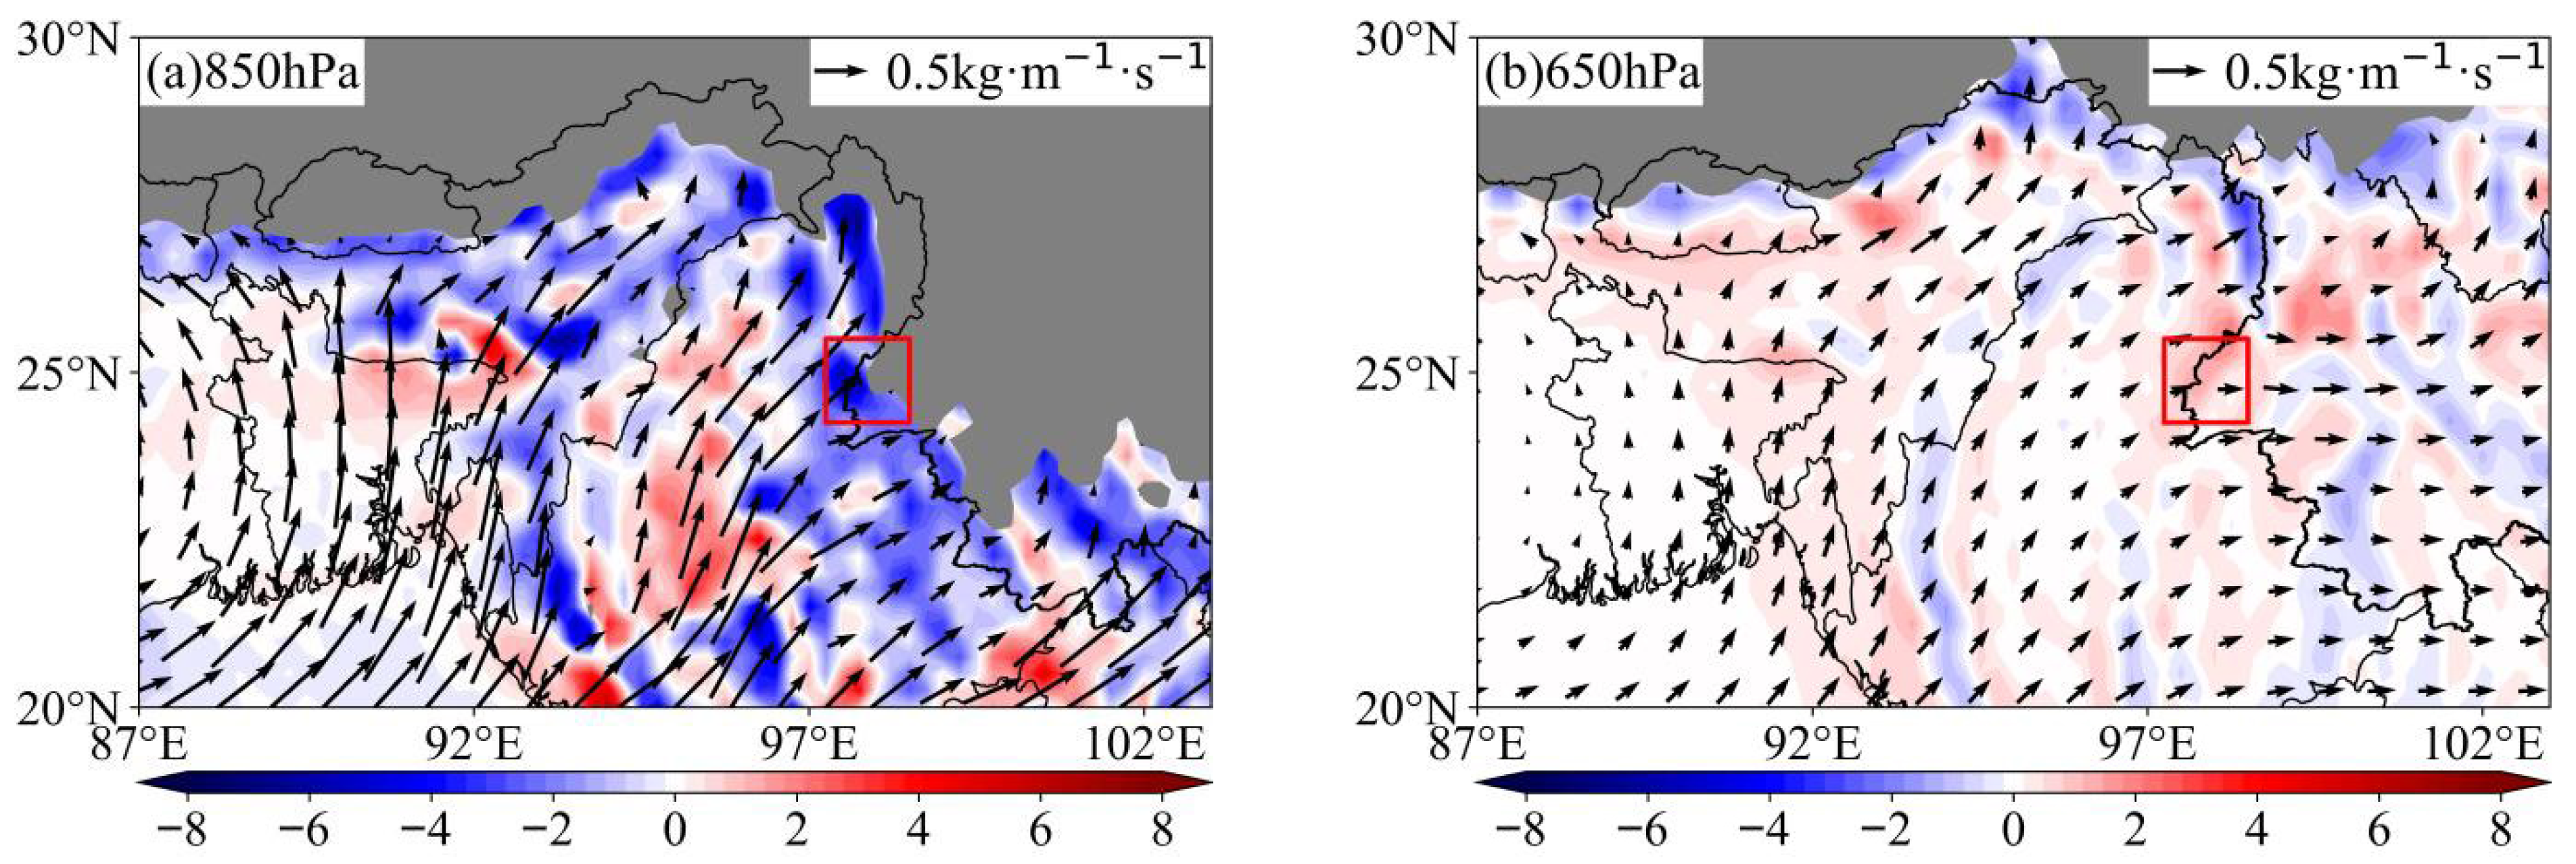
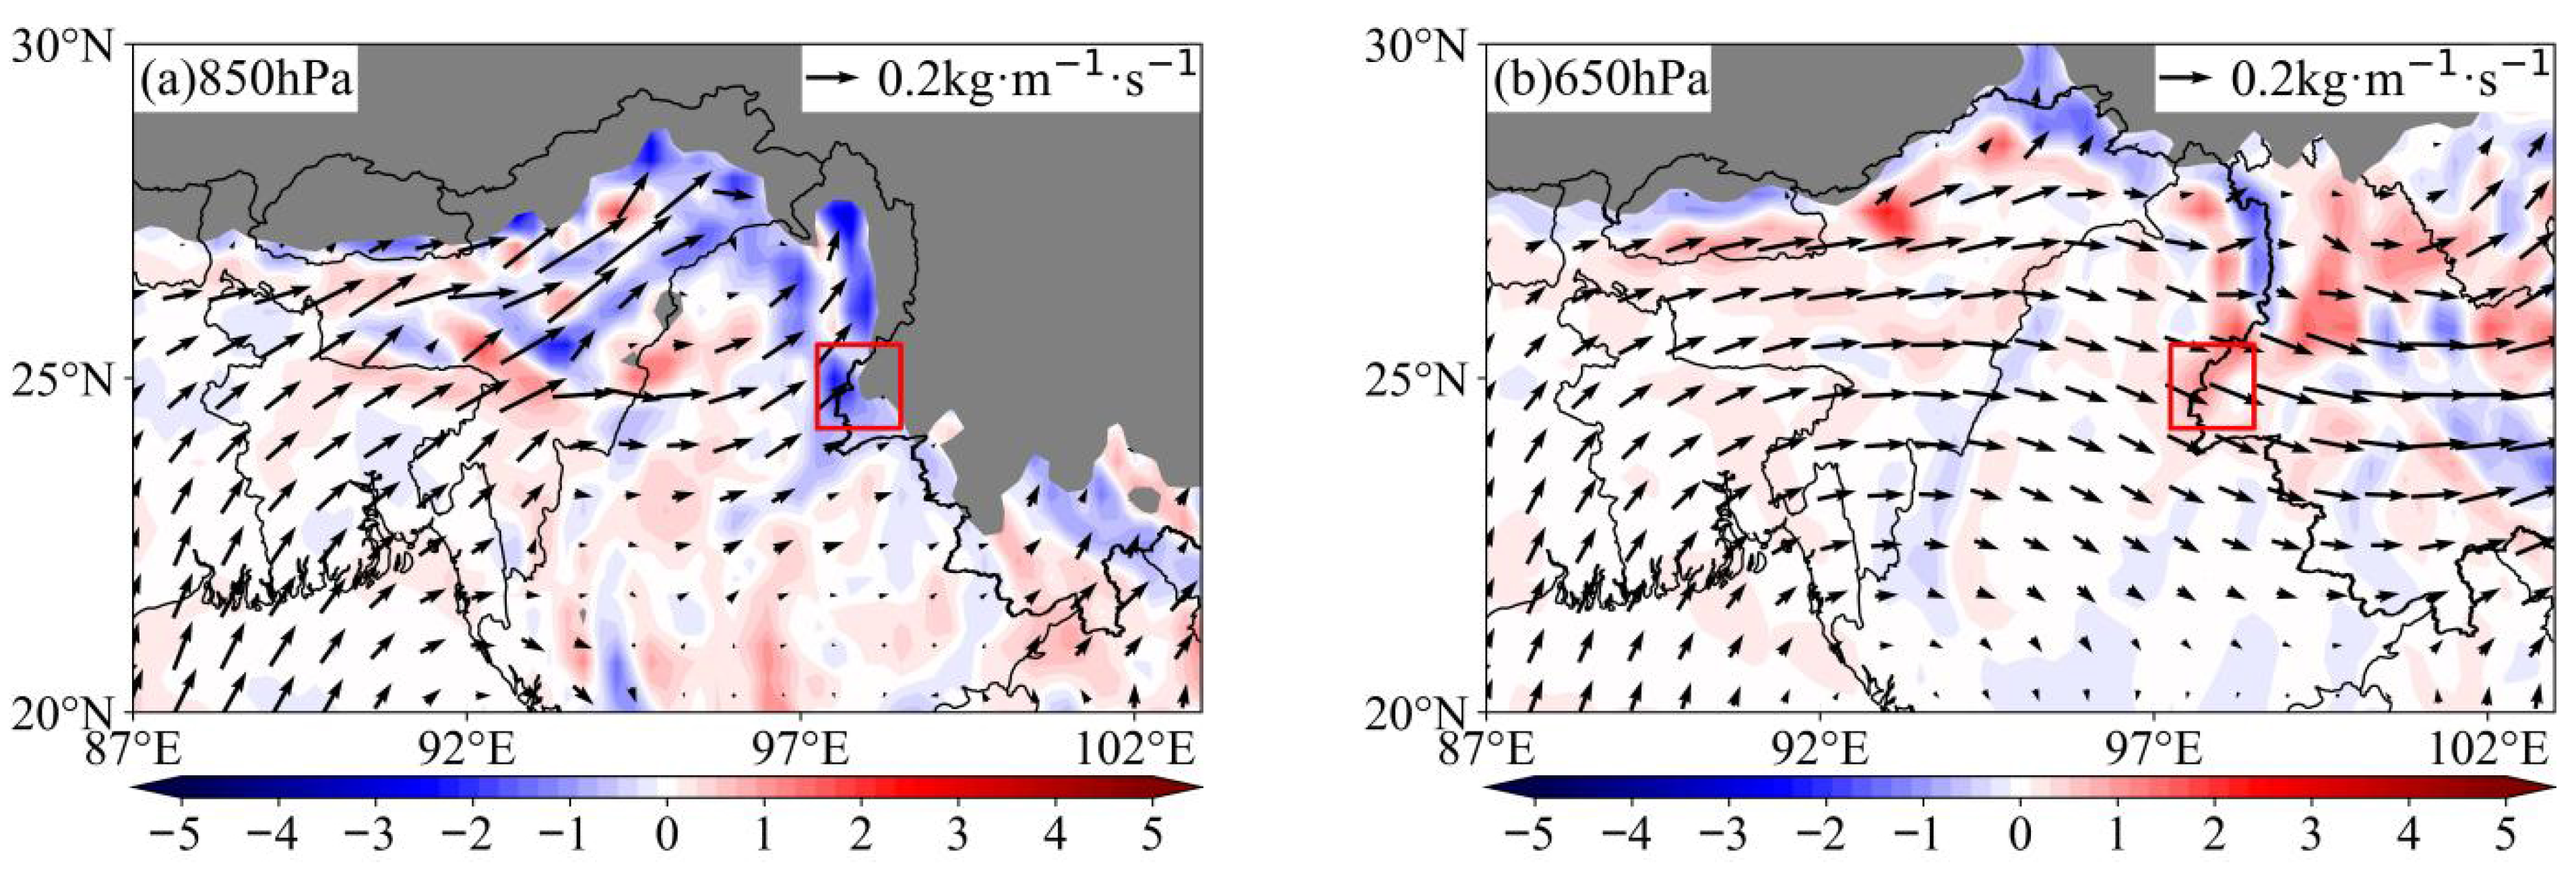
Figure 10 shows the average moisture transport flux and divergence at different altitudes during the summer in western Yunnan from 2014 to 2023. Figure 10a shows that, at an altitude of 850 hPa, there is a strong water vapor transport belt from the southwest to the northeast in the Indochina Peninsula. A large amount of water vapor is transported to the Yingjiang area in western Yunnan along the trumpet-shaped terrain north of the Indochina Peninsula, and strong water vapor convergence occurs in this area. At a height of 650 hPa, the water vapor transport intensity in Southwest China is significantly weakened and shows water vapor divergence characteristics in western Yunnan. Water vapor transport in Southwest China, along with the suction effect of low-level convergence and high-level divergence, is a key factor contributing to increased summer rainfall in Yingjiang, western Yunnan. However, precipitation in the summer of 2020 was more abnormal than that in the other years. Figure 11 shows the anomalous water vapor transport flux and divergence values at different altitudes in the summer of 2020. At 850 hPa in the lower troposphere, western Yunnan was affected by southwest monsoon water vapor transport. The southwest air, water, and vapor transport from the Bay of Bengal was approximately 0.3 kg·hPa−1·m−1·s−1 stronger than the annual average, and water vapor convergence in the Yingjiang area in western Yunnan was 2.0 kg∙hPa−1∙m−2∙s−1 stronger than the annual average. At the middle and high levels of 650 hPa, the southwest seasonal wind, water, and vapor transport in 2020 were also approximately 0.2 kg·hPa−1·m−1·s−1 stronger than the annual value, while the water vapor divergence in the Yingjiang area was approximately 1.0 kg∙hPa−1∙m−2∙s−1 stronger than the annual value. Abnormal southwest monsoon water vapor transport, combined with strong low-level convergence and high-altitude divergence, leads to sufficient precipitation and water vapor conditions in the Yingjiang region of western Yunnan, which causes extreme or abnormal precipitation in the region in summer.
Previous studies have shown that, in the winter before 2020, the sea surface temperature (SST) in the equatorial Middle East Pacific region was higher than that in normal years, and the overall SST in the tropical Indian Ocean was also elevated [25]. Notably, such sea surface temperature anomalies are not an isolated oceanic phenomenon but a typical manifestation of intensified thermal anomalies in tropical oceans against the backdrop of global climate change, which further leads to the cross-seasonal transmission of winter sea surface temperature signals to the summer atmospheric circulation through the Indian Ocean “capacitor effect”. Driven by the synergistic forcing of the preceding winter’s sea surface temperature anomalies, the western Pacific subtropical high extended significantly westward and intensified in the summer of 2020, which, in turn, triggered a prominent southwest wind anomaly from the Bay of Bengal to the northern Indochina Peninsula. Warm and moist water vapor from the Arabian Sea and the Bay of Bengal was continuously transported westward to western Yunnan via the northern Indochina Peninsula, leading to a substantial enhancement in the intensity of the southwest monsoon water vapor transport affecting the Yingjiang area and ultimately resulting in abnormally high summer precipitation in Yingjiang in 2020.

5. Conclusions

This study conducted an analysis of water vapor transport characteristics associated with excessive precipitation in the Yingjiang region of China from 2014 to 2023 and a preliminary analysis of water vapor and thermodynamic conditions during the abnormal excessive precipitation in the summer of 2020. The main conclusions are as follows:
(1)
In the Yingjiang area, the average annual precipitation exceeds 2000 mm, with that at Xima and Sudian Stations reaching 5028 mm and 4468 mm in 2020, respectively, making the region a “rain pole” in mainland China. In terms of temporal variation, precipitation in the summer accounts for more than 60% of the annual total.
(2)
Continuous low-level torrential water vapor transport and topographic uplift are the key factors causing abnormal precipitation in this area. After low-level rapid water vapor reaches Yingjiang, there is a strong phenomenon of low-level convergence and high-level divergence over the windward slope. The suction effect induces strong upward movement near the 850 hPa level. The pseudo-equivalent potential temperature isolines maintain an unstable stratification, with warm, moist conditions in the lower layer and cold, dry conditions in the middle and upper layers along the slope, providing favorable thermal conditions for precipitation.
(3)
During the summers from 2014 to 2023, the Bay of Bengal and Arabian Sea channels contributed over 70% to the specific humidity and total water vapor flux at various height levels, with the proportion of water vapor transport from the southwest monsoon in the lower levels being higher than that in the upper levels. This result is consistent with the overall pattern of large-scale water vapor transport in the Asian summer monsoon region, and low-latitude sea areas such as the Bay of Bengal and the Arabian Sea act as key moisture source regions for Yingjiang in the global water vapor cycle.
(4)
During the summer of 2020, the unusually strong southwest monsoon water and vapor transport, combined with the strong low-level convergence and high-altitude divergence in the vertical circulation, provided sufficient power and water vapor conditions for precipitation in Yingjiang, resulting in abnormally high precipitation in this region.
This study reveals the characteristics of water vapor transport, precipitation mechanisms, main water vapor sources, and their contributions in the Yingjiang area, and it provides a preliminary analysis of the causes of abnormal precipitation during the summer of 2020. In the future, numerical simulations can be employed to quantify the contributions of southwest seasonal wind, water, and vapor transport intensity to precipitation, further improving the regional precipitation prediction model and the forecast of extreme precipitation, as well as providing more accurate technical support for rainstorm disaster prediction and early warning in the Yingjiang area.

Author Contributions

Conceptualization, Y.C. and J.L.; methodology, J.L.; software, J.L.; validation, Y.C., J.L., and L.X.; formal analysis, J.L.; investigation, W.W.; resources, L.X.; data curation, W.W. and J.L.; writing—original draft preparation, J.L.; writing—review and editing, H.L.; visualization, Y.W.; supervision, Y.C.; project administration, L.X.; funding acquisition, Y.C. and B.X. All authors have read and agreed to the published version of the manuscript.

Funding

This research was funded by the Key Research and Development Program of the Yunnan Provincial Department of Science and Technology (Grant No. 202403AC100012), the National Natural Science Foundation of China (Grant No. U2142204), the Innovation and Development Project of the China Meteorological Administration (Grant No. CXFZ2024J061), and the Observational Experiment Project of the Meteorological Observation Center of China Meteorological Administration (Grant No. GCSYJH24-02).

Institutional Review Board Statement

Not applicable.

Informed Consent Statement

Not applicable.

Data Availability Statement

All data that support the findings of this study are included within the article.

Acknowledgments

The authors are grateful to the ECMWF for providing ERA5 reanalysis products and to the NCEP for providing GDAS data.

Conflicts of Interest

The authors declare no conflicts of interest.

References

  1. Li, W.; Jiang, Z.H.; Zhang, X.B.; Li, L.; Sun, Y. Additional risk in extremeprecipitation in China from 1.5 °C to 2 °C global warming levels. Sci. Bull. 2018, 63, 228–234. [Google Scholar] [CrossRef] [Scilit] [PubMed]
  2. Bao, Z.D.; Wu, Y.X.; He, W.N.; She, N.; Li, Z.J. Intensified Rainfall, Growing Floods: Projecting Urban Drainage Challenges in South-Central China Under Climate Change Scenarios. Appl. Sci. 2025, 15, 11577. [Google Scholar] [CrossRef] [Scilit]
  3. Yuk, G.M.; Zhu, J.L.; Yoon, S.K.; Kim, J.S.; Moon, Y.I. Improving Typhoon-Induced Rainfall Forecasts Based on Similar Typhoon Tracks. Appl. Sci. 2025, 15, 11597. [Google Scholar] [CrossRef] [Scilit]
  4. He, L.H.; Long, L.X.; Chen, B.Y.; Wang, Y.Q.; Geng, F.; Yan, X.J. A case study on the triggering mechanisms of localized warm-sector rainstorm. Meteorol. Atmos. Phys. 2021, 133, 1707–1717. [Google Scholar] [CrossRef] [Scilit]
  5. Sun, Q.; Abulikemu, A.; Yao, J.Q.; Mamtimin, A.; Yang, L.M.; Zeng, Y.; Li, R.Q.; An, D.W.; Li, Z.Y. A Case Study on the Convection Initiation Mechanisms of an Extreme Rainstorm over the Northern Slope of Kunlun Mountains, Xinjiang, Northwest China. Remote Sens. 2023, 15, 4505. [Google Scholar] [CrossRef] [Scilit]
  6. Liang, J.; Liu, Y.H.; Wang, H. Multi-timescale Water Vapor Transport for an Extraordinary Rainstorm in Zhengzhou, China, Impacted by Remote Tropical Cyclones on 20 July 2021. Adv. Atmos. Sci. 2025, 42, 2305–2317. [Google Scholar] [CrossRef] [Scilit]
  7. Li, Y.H.; Wu, Y.; Zhou, J.; Xiang, B.; He, J.X.; Huang, D.A. Characteristics of water vapor transport for extreme summer precipitation in the Eastern Southwest China and its impact mechanism. Atmosphere 2023, 14, 1328. [Google Scholar] [CrossRef] [Scilit]
  8. Jin, C.; He, Q.; Huang, Q. Extreme Summer Precipitation Characteristics and Associated Water Vapor Transport in Southern Xinjiang. Water 2023, 15, 2361. [Google Scholar] [CrossRef] [Scilit]
  9. Yang, H.; Xu, G.Y.; Wang, X.F.; Cui, X.G.; Wang, J.Y.; He, D.X. Quantitative analysis of water vapor transport during Mei-yu front rainstorm period over the Tibetan Plateau and Yangtze-Huai River Basin. Adv. Meteorol. 2019, 2019, 6029027. [Google Scholar] [CrossRef] [Scilit]
  10. Shi, K.F.; Lang, Q.; Huang, Y.F.; Zhao, J.; Wang, H.Z.; Chen, G.X.; Zhang, Q.; Yin, H.; Su, Y.; Wang, P. Analysis of the water-vapor sources in rainstorm processes in Tianjin city based on the trajectory method. Atmos. Sci. Lett. 2024, 25, e1196. [Google Scholar] [CrossRef] [Scilit]
  11. Deng, H.D.; Wang, Q.M.; Zhao, Y.; Zhai, J.Q.; Zhu, Y.N.; Gui, Y.P.; Wang, L.C.; Song, T.X.; Chen, X.X.; Liu, K. Effect of water vapor transport and budget on precipitation in the Yangtze-Huang-Huai-Hai River Basin. J. Hydrol. Reg. Stud. 2024, 53, 101787. [Google Scholar] [CrossRef] [Scilit]
  12. Zhao, Y.; Li, J. Dominant Synoptic Systems for Summer Precipitation over the Complex Terrain of Southwestern China. Mon. Weather Rev. 2024, 152, 2443–2460. [Google Scholar] [CrossRef] [Scilit]
  13. Lin, Z.G. China’s Climate and Its Extreme Value; The Commercial Press: Beijing, China, 1995. [Google Scholar]
  14. Yang, Q.Y.; Zhang, W.C.; Min, Y.; Zhu, L. Influence of Plateau vortex shear on the distribution of heavy rainfall and water vapor characteristics in Yunnan. Atmos. Sci. 2024, 48, 1565–1583. [Google Scholar]
  15. Xie, Q.X.; Gu, X.P.; Li, G.; Tang, T.; Li, Z.Y. Variation characteristics of rainstorms and floods in southwest China and their relationships with atmospheric circulation in the summer half-year. Atmosphere 2022, 13, 2103. [Google Scholar] [CrossRef] [Scilit]
  16. Ma, W.Q.; Chen, X.H.; Li, H.H.; Li, Y.S. Analysis on the cause and topographic impact of an extreme heavy rainfall process in Yunnan. Plateau Mt. Meteorol. Res. 2021, 41, 25–34. [Google Scholar]
  17. Hersbach, H.; Bell, B.; Berrisford, P.; Hirahara, S.; Horányi, A.; Muñoz-Sabater, J.; Nicolas, J.; Peubey, C.; Radu, R.; Schepers, D.; et al. The ERA5 global reanalysis. Q. J. R. Meteorol. Soc. 2020, 146, 1999–2049. [Google Scholar] [CrossRef] [Scilit]
  18. Zhu, D.T.; Zhang, K.F.; Yang, L.; Wu, S.Q.; Li, L.J. Evaluation and Calibration of MODIS Near-Infrared Precipitable Water Vapor over China Using GNSS Observations and ERA-5 Reanalysis Dataset. Remote Sens. 2021, 13, 2761. [Google Scholar] [CrossRef] [Scilit]
  19. Du, M.K.; Huang, K.M.; Zhang, S.D.; Huang, C.M.; Gong, Y.; Yi, F. Water vapor anomaly over the tropical western Pacific in El Nio winters from radiosonde and satellite observations and ERA5 reanalysis data. Atmos. Chem. Phys. 2021, 21, 13553–13569. [Google Scholar] [CrossRef] [Scilit]
  20. Han, Y.J.; Yang, Q.K.; Liu, N.; Zhang, K.; Qing, C.; Li, C.B.; Wu, X.Q.; Luo, T. Analysis of wind-speed profiles and optical turbulence above Gaomeigu and the Tibetan Plateau using ERA5 data. Mon. Not. R. Astron. Soc. 2021, 501, 4692–4702. [Google Scholar] [CrossRef] [Scilit]
  21. Huang, L.K.; Wang, X.; Xiong, S.; Li, J.Y.; Liu, L.L.; Mo, Z.X.; Fu, B.L.; He, H.C. High-precision GNSS PWV retrieval using dense GNSS sites and in-situ meteorological observations for the evaluation of MERRA-2 and ERA5 reanalysis products over China. Atmos. Res. 2022, 276, 106247. [Google Scholar] [CrossRef] [Scilit]
  22. Meng, X.Y.; Jin, S.G.; Liu, C.; Zhang, G.J.; Zhang, Y.L. A high precision 3-D tropospheric delay model over China using ERA5 data. Adv. Space Res. 2025, 75, 2599–2613. [Google Scholar] [CrossRef] [Scilit]
  23. Li, M.S.; Wang, L.Z.; Chang, N.; Gong, M.; Ma, Y.M.; Yang, Y.X.; Chen, X.L.; Han, C.B.; Sun, F.L. Characteristics of the water vapor transport in the canyon area of the southeastern Tibetan Plateau. Water 2021, 13, 3620. [Google Scholar] [CrossRef] [Scilit]
  24. Nan, X.J.; Lin, W.L.; He, X.L.; Lei, Y.; Andrea, M. PM10 Observed at a Meteorological Station in Beijing: Historical Trend and Implications. J. Trop. Meteorol. 2022, 28, 207–217. [Google Scholar]
  25. Draxler, R.R.; Hess, G.D. An overview of the HYSPLIT 4modelling system for trajectories, dispersion and de position. Aust. Meteor. Mag. 1998, 47, 295–308. [Google Scholar]
  26. Guo, X.Y.; Wang, L.; Tian, L.; Zhang, L.; Zhao, W.L. Quantitative identification of moisture sources over the Tibetan Plateau: Spatial distributions and temporal variabilities. J. Clim. 2025, 38, 263–276. [Google Scholar] [CrossRef] [Scilit]
  27. Fang, C.S.; Gao, J.L.; Wang, D.L.; Wang, D.S.; Wang, J. Optimization of stepwise clustering algorithm in backward trajectory analysis. Neural Comput. Appl. 2020, 32, 109–115. [Google Scholar] [CrossRef] [Scilit]
  28. Li, Y.H.; Huang, D.A.; Lu, C.H.; Xiang, B.; Zhou, J.; He, J.X. Moisture Sources and Their Contributions to Summer Precipitation in the East of Southwest China. J. Trop. Meteorol. 2023, 29, 153–167. [Google Scholar]
  29. Wang, J.; De, Q.Y.Z.; Dan, Z.; Wang, Y.; De, J.B.M.; Chen, G.Y.; Tian, Y.J. Analysis on precipitation characteristics and causes of “rain pit” in Tibet from 2012 to 2018. Meteorol. Sci. Technol. 2021, 49, 211–217. [Google Scholar]
  30. Gimeno, L.; Dominguez, F.; Nieto, R.; Trigo, R.; Drumond, A.; Reason, C.; Taschetto, A.; Ramos, A.; Kumar, R.; Marengo, J. Major mechanisms of atmospheric moisture transport and their role in extreme precipitation events. Annu. Rev. Environ. Resour. 2016, 41, 117–141. [Google Scholar] [CrossRef] [Scilit]
  31. Zhang, Y.; Han, Y.; Xuan, Y.; Zhou, H.; Gao, H.; Yang, N. Quantifying the influence of atmospheric rivers on rainfall over the Jianghuai River Basin during the 2022 Mei-yu season. Q. J. R. Meteorol. Soc. 2024, 150, 3182–3195. [Google Scholar] [CrossRef] [Scilit]
  32. Zhao, Y.; Li, J.; Ren, L.W.; Li, N.N.; Li, P.X. Fine-Scale Characteristics and Dominant Synoptic Factors of Spring Precipitation Over Complex Terrain of the Southeastern Tibetan Plateau. J. Geophys. Res. Atmos. 2023, 128, e2022JD038352. [Google Scholar] [CrossRef] [Scilit]
  33. Jin, L.L.; Wang, L.; Wang, Y.; Li, Z.J. Local and systematic precipitation in Tengchong of the Hengduan mountains. Clim. Dyn. 2025, 63, 446. [Google Scholar] [CrossRef] [Scilit]
  34. Wan, Y.X.; Yan, H.M.; Jin, Y.; Peng, Q.Y. Characteristics of water vapor transport over the low latitude plateau and its impact on Yunnan climate. Plateau Meteorol. 2020, 39, 925–934. [Google Scholar]
  35. Lei, S.Y.; Yu, S.J.; Sun, J.L.; Wang, Z.X.; Liao, Y.Z. A methodology for the prediction of extreme precipitation in complex terrains: A case study of central Southwest China. Water 2024, 16, 427. [Google Scholar] [CrossRef] [Scilit]
  36. Tian, Y.; Yao, R.; Zhao, E.R.; Yao, Q.; Pan, X.L. The space conceptual models and water vapor characteristics of typical rainstorms during plum rain season. Adv. Meteorol. 2022, 2022, 6971110. [Google Scholar] [CrossRef] [Scilit]
  37. Yao, X.P.; Huang, Y.F.; Bao, X.H.; Li, R.Y.; Zhou, Y.X.; Ma, J.L. Characteristics of Extreme Heavy Rainfall and water vapor conditions in North China on July 23. Acta Meteorol. Sin. 2024, 82, 585–599. [Google Scholar]
  38. Knippertz, P.; Martin, J.E. Tropical plumes and extreme precipitation in subtropical and tropical West Africa. Q. J. R. Meteorol. Soc. A J. Atmos. Sci. Appl. Meteorol. Phys. Oceanogr. 2005, 131, 2337–2365. [Google Scholar] [CrossRef] [Scilit]
Figure 1. Topography of the northeastern area of the Bay of Bengal.
Applsci 16 02267 g001
Figure 2. Average precipitation distribution in Yunnan from 2014 to 2023 (a) and in 2020 (b).
Applsci 16 02267 g002
Figure 3. Interannual (a) and monthly variations (b) in precipitation in Yingjiang from 2014 to 2023.
Applsci 16 02267 g003
Figure 4. Daily precipitation at Xima and Sudian Stations in the summer of 2020.
Applsci 16 02267 g004
Figure 5. The average water vapor flux in spring (a), summer (b), autumn (c), and winter (d) in Yunnan from 2014 to 2023. The red box indicates the location of Yunnan (97~107° E, 20~30° N).
Applsci 16 02267 g005
Figure 6. Interannual (a) and monthly average variations (b) in the water vapor budget in Yingjiang from 2014 to 2023.
Applsci 16 02267 g006
Figure 7. Vertical distribution of average and net water vapor budgets at each boundary in the Yingjiang region from 2014 to 2023 (a) and in 2020 (b).
Applsci 16 02267 g007
Figure 8. The vertical profiles of water vapor transport during summer extreme precipitation in Yingjiang in 2020: (a,d,g,j) Water vapor flux (shadow, unit: kg∙hPa−1∙m−1∙s−1) and vertical circulation (μ, ω   ×   100, vector). (b,e,h,k) Moisture flux divergence (shadow, unit: kg∙hPa−1∙m−2∙s−1) and pseudo-equivalent potential temperature (isoline, unit: K). (c,f,i,l) Specific humidity (shadow, unit: kg∙kg−1) and wind speed (isoline, unit: m/s). Panels (ac) and (df) show the section along 24.75° N at 03:00 and 12:00 on 18 July, respectively; the red line indicates the longitude of Xima Station. Panels (gi) and (jl) show sections along 25° N at 22:00 on 17 August and 12:00 on 18 August, respectively; the red line indicates the longitude of Sudian Station.
Applsci 16 02267 g008aApplsci 16 02267 g008b
Figure 9. Spatial distribution and proportion of water vapor channels in the lower (a), middle (b), and upper (c) levels.
Applsci 16 02267 g009
Figure 10. Water vapor transport flux (vector, kg·hPa−1·m−1·s−1) and divergence (shadow, kg·hPa−1·m−2·s−1) at 850 hPa (a) and 650 hPa (b) in summer in western Yunnan from 2014 to 2023. The gray shadow in the figure represents the current barometric layer terrain, and the red box represents the location of Yingjiang (97.25~98.5° E, 24.25~25.5° N).
Applsci 16 02267 g010
Figure 11. Water vapor transport flux (vector, kg·hPa−1·m−1·s−1) and divergence (shadow, kg·hPa−1·m−2·s−1) at 850 hPa (a) and 650 hPa (b) in the summer of 2020 in western Yunnan. The gray shadow in the figure represents the current pressure layer terrain, and the red box represents the location of Yingjiang (97.25~98.5° E, 24.25~25.5° N).
Applsci 16 02267 g011
Table 1. Statistics of precipitation characteristics at Xima and Sudian Stations in the summer of 2020.
StationDaysExtreme Daily Maximum PrecipitationHourly Maximum PrecipitationNumber of Times Hourly Precipitation Reached ≥10 mm
RainstormHeavy RainModerate Rainmmmm
Xima212622184.945.9104
Sudian212312304.670.688
Table 2. Total number of tracks, specific humidity, and water vapor flux contribution rate of each water vapor channel.
Physical QuantityArabian Sea ChannelBay of Bengal ChannelWesterly ChannelSouth China Sea and Western Pacific ChannelNorthwest Channel
Lower levelTotal number of tracks/piece41685586243921122
Specific humidity contribution rate37.86%50.79%2.23%8.20%0.92%
Contribution rate of water vapor flux38.01%51.09%2.31%8.08%0.51%
Middle levelTotal number of tracks/piece359553394181425263
Specific humidity contribution rate32.99%41.14%3.40%19.24%3.23%
Contribution rate of water vapor flux35.47%44.50%2.41%15.62%2.00%
High levelTotal number of tracks/piece340545385561678863
Specific humidity contribution rate31.52%42.36%3.35%16.96%5.81%
Contribution rate of water vapor flux31.90%43.17%3.64%16.45%4.84%
Disclaimer/Publisher’s Note: The statements, opinions and data contained in all publications are solely those of the individual author(s) and contributor(s) and not of MDPI and/or the editor(s). MDPI and/or the editor(s) disclaim responsibility for any injury to people or property resulting from any ideas, methods, instructions or products referred to in the content.