1. Introduction
Future fusion reactors operating on deuterium–tritium (D–T) fuel will produce intense, high-energy neutron fluxes within the plasma chamber and surrounding components [
1]. The irradiation with 14.1 MeV neutrons leads to degradation of the material and changes in the mechanical and thermal properties of structural and functional materials. Moreover, neutron irradiation leads to material activation with the generation of radioactive isotopes that produce ionizing radiation even after reactor shutdown.
The decay of these activated materials generates the SDDR, mainly through gamma-ray emission. Such residual radiations can induce a considerable radiological hazard to personnel working in the vicinity of the tokamak building, including port cells and maintenance areas. Combined with surface contamination of plasma-facing components, this requires the use of remote handling systems for in-vessel maintenance in the DEMO fusion reactor. Nevertheless, access to activated structures inside the tokamak remains a critical issue for inspections, repairs, and replacement operations [
2].
A comprehensive understanding of the radiation environment during post-operation and maintenance scenarios is therefore essential to ensure radiation protection and safe working conditions. This study presents the detailed SDDR analyses for the in-vessel region of the DEMO’s VV during various irradiation scenarios. The reference operational mode corresponds to the DEMO base scenario, as described in the following sections [
3].
The SDDR refers to the photon dose field that is built after plasma shutdown, arising from the radioactive decay of activated materials. Accurate prediction of the SDDR is crucial for assessing the radiological conditions of the reactor and for defining the safe access times for maintenance activities following plasma shutdown [
4].
In this work, the SDDR calculations were performed for different irradiation durations at the nominal fusion power of 2000 MW. The simulated decay operation periods include 1 day, 3 days, 1 week, 2 weeks, 1 month, 2 months, 3 months, 6 months, 9 months, and 1 year of continuous operation. Following reactor shutdown, the residual dose rates were assessed at cooling intervals: 1 h, 1 day, 1 week, and 1 month. These timeframes capture both the period immediately after shutdown phase, dominated by short-lived activation products, and the transition toward medium- and long-term decay conditions.
Additionally, several alternative irradiation scenarios were suggested and investigated, including pulsed and continuous operation modes, as well as different neutron source types—D–T and D–D plasmas—to assess their respective impacts on activation behaviour and the SDDR distributions.
2. The SDDR Limits and Radiation Safety Conditions
In the fusion reactors, the materials located close to the plasma chamber—such as structural supports, breeding blankets, and divertor—are subjected to intense neutron fluxes during operation. The SDDR limits in the tokamaks are established to ensure that radiation levels within accessible areas—particularly maintenance zones, port cells, and diagnostic galleries—remain below acceptable thresholds for occupational exposure. Typically, these limits are guided by international radiological protection standards, maintaining personnel exposure below 100 µSv/h during maintenance activities [
5]. The annual maximum dose for routine work of service personnel is 50 millisieverts per year [
6]. This threshold minimizes cumulative radiation doses to workers and supports compliance with safety regulations governing nuclear facilities.
The quantity referred to as dose rate and expressed in Sv/h corresponds to the SDDR. Specifically, it represents the ambient dose equivalent rate—
H ∗ (10)—produced by gamma radiation emitted from activated materials after reactor shutdown. This is a radiological protection quantity intended to estimate the dose that would be received by the human body in a radiation field. The use of sieverts accounts for the biological effectiveness of the radiation and allows direct comparison with radiological protection limits. Although the photon transport calculations are performed within different structural materials, the reported SDDRs do not represent the absorbed dose in those materials. Instead, the material regions act as sources of decay gamma radiation, while the dose is evaluated using appropriate dose conversion coefficients corresponding to human exposure [
7].
Therefore, throughout the manuscript, the term dose rate refers exclusively to the gamma-induced shutdown dose rate (SDDR) in terms of ambient dose equivalent rate, evaluated for radiological safety and maintenance considerations following shutdown.
The SDDR limits are used to provide the information for the remote handling systems, shielding requirements, and maintenance scheduling, because the areas with high SDDRs will be inaccessible without the remotely controlled equipment. The advanced computational methods, such as the Rigorous-2-Step (R2S) calculations, are used to predict the SDDR by simulating the neutron activation and subsequent decay photon emissions
The definition of the SDDR limits is essential for several aspects of the reactor’s engineering and operation. It directly influences the design of the remote handling systems, determines the dimensions and the composition of the biological shielding, and defines maintenance scheduling. The areas subjected to the high residual dose rates require the remote or the fully automated maintenance procedures, whereas zones with lower SDDR may permit controlled human access.
In the case of the DEMO tokamak, several dose rate limits have been established [
8] to guide the classification of the maintenance and access conditions:
5 mSv/hr—reference emergency maintenance,
100 μSv/hr—reference short-term maintenance,
10 μSv/hr—reference routine maintenance,
1 μSv/hr—reference safe access.
These thresholds serve as key design targets for the assessment of radiation safety and determining accessibility during and after reactor operation.
3. The Irradiation Scenario and Neutron Source Definition
This section should provide a concise and precise description of the experimental results, their interpretation, as well as the experimental conclusions that can be drawn.
The neutron source intensity generated by the D–T plasma source in the DEMO model was set to 7.1 × 10
20 neutrons per second, corresponding to the fusion power of 2000 MW [
9]. This represents the nominal full-power operational condition of the DEMO reactor and serves as the reference basis for the activation and the SDDR calculations.
The irradiation scenarios considered in this study are derived from the Phase 1 DEMO operation scheme, representing the early operational stage of the reactor. To comprehensively evaluate the SDDR evolution under varying operational and neutron production conditions, four principal scenarios were analyzed [
10]:
The detailed assessment of the SDDR evolution during the initial operational phase (the first several days after the start of the tokomak operation).
Characterization of the dose rate buildup and decay over time.
- 2.
The reduced-power scenario (30% of the nominal power):
- 3.
The Pulsed Operation Mode:
- 4.
The D–D Neutron Source Irradiation:
The characterization of the activation products generated by the deuterium–deuterium (D–D) fusion neutrons.
The comparative analysis with the D–T neutron spectrum to quantify the activation differences.
The evaluation of the ITER-like initial operational phase employing the D–D neutron source.
This multi-scenario framework enables the comprehensive understanding of SDDR behaviour across the range of the reactor’s operating modes. The results support the optimization of the maintenance scheduling, the shielding design, and the safety planning for the future DEMO operation phases and similar fusion power plant configurations.
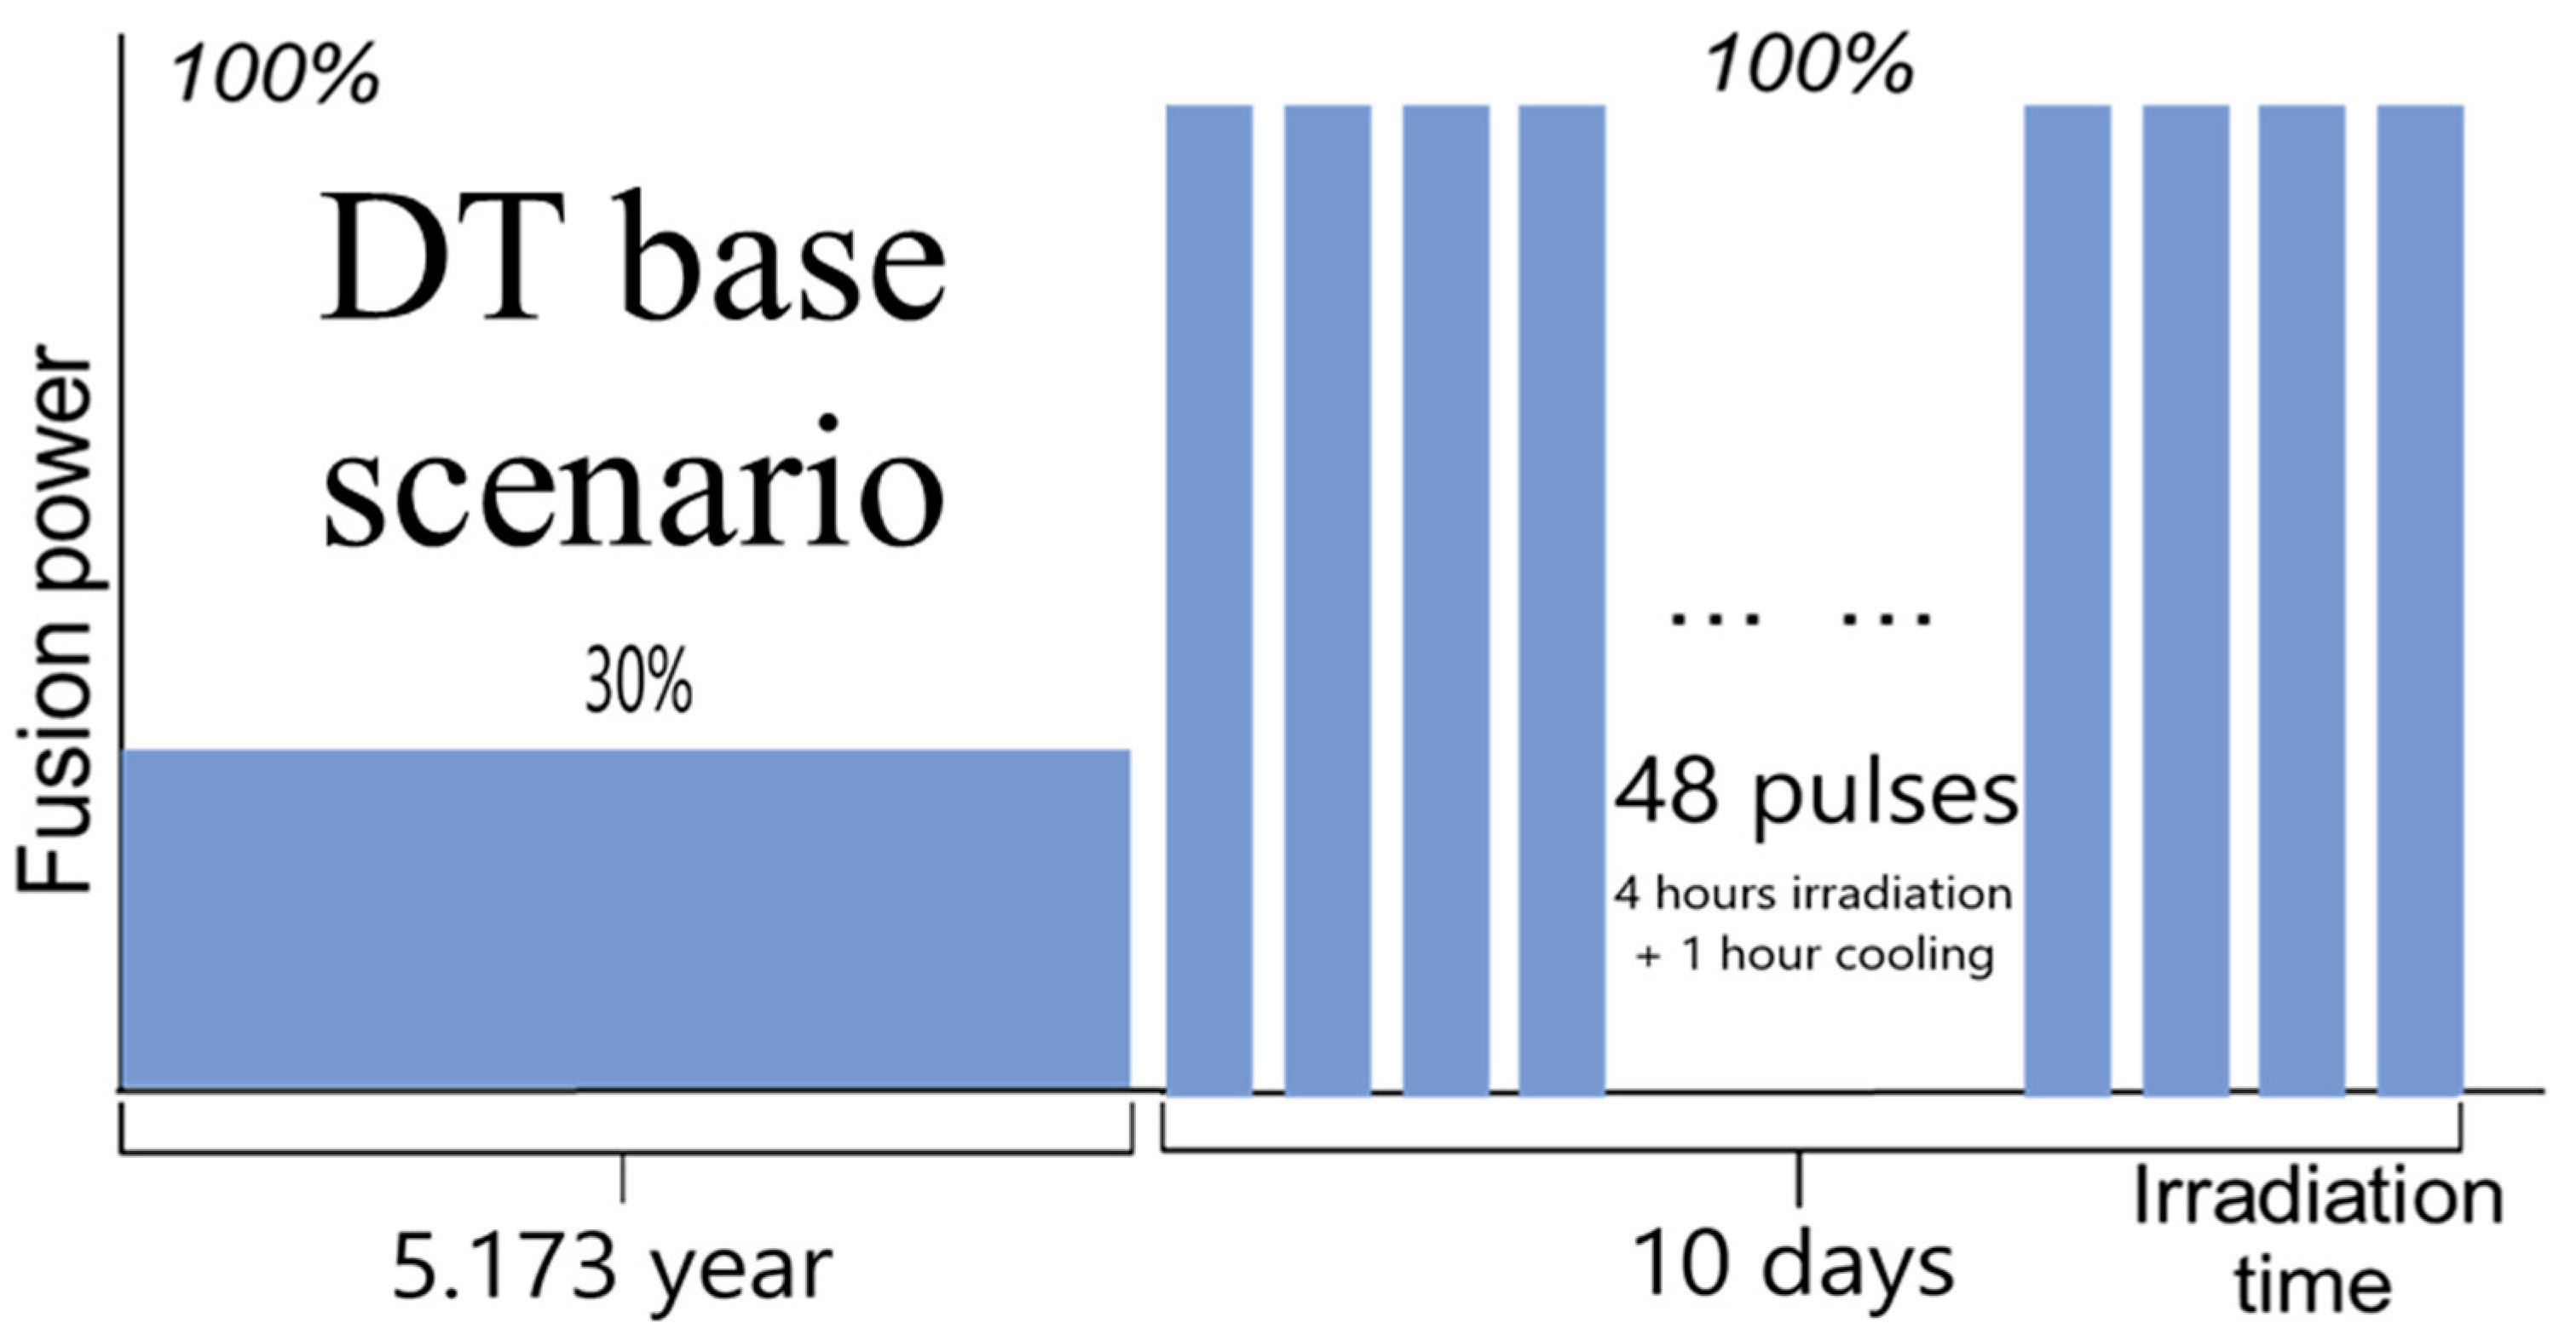
The irradiation operation scenario for Phase 1 of the DEMO reactor (the D–T Base scenario) is defined as follows:
The continuous operation for approximately 5.2 years at 30% of the nominal fusion power, followed by 10 days of pulsed operation consisting of 48 pulses, each lasting 4 h at the full 2000 MW fusion power with a 1 h cooling interval between pulses.
Figure 1 schematically shows the neutron irradiation during 5.2 calendar years or 1.56 full power years (fpy), assuming 30% availability factor of the DEMO fusion facility. This irradiation phase represents the operational stage of DEMO, during which neutron exposure accumulates intermittently according to the assumed duty cycle. The use of full power years allows the complex time structure of operation and shutdown periods to be expressed in terms of an equivalent continuous irradiation at nominal fusion power. The defined irradiation history serves as the input for subsequent activation calculations, determining the buildup of radionuclide inventories in structural and blanket materials and, consequently, the evolution of decay gamma sources after shutdown.
Additionally, this work considers several alternative irradiation scenarios featuring the different plasma neutron sources and pulse durations:
The D–T pulsed mode (10% of the full power—200 MW).
Different amounts and durations of the D–T pulses.
The D–D pulse with 2 MW of the fusion power, which is equivalent to 0.1% of the nominal D–T fusion power of the DEMO facility.
The pulse durations varied between 30 min and 4 h for each pulse. This study also investigates SDDR evolution during the D–D neutron source operation, representing ITER’s initial testing phase [
11]. Compared to the standard D–T conditions, the D–D phase generates lower-energy neutrons (2.45 MeV) and results in significantly reduced material activation. The analysis focuses on SDDR evolution, comparing activation profiles, short- and medium-lived isotope contributions, and the resulting personnel access limitations within the reactor environment.
4. The Nuclear Analysis
To evaluate the SDDR, a combination of Monte Carlo transport and activation analysis codes was employed. A neutron flux, energy spectra, and the dose rate distributions across the DEMO tokamak were calculated using MCNP code [
12], a main tool used in EUROfusion, ITER [
13], JET [
14], and other projects, which demonstrated its reliability in both fission and fusion applications.
The general methodology for the SDDR evaluation in the fusion systems is summarized as follows:
The neutron transport simulations (flux and spectra) performed with MCNP using the JEFF-3.3 nuclear data library [
15].
Definition of multiple irradiation scenarios, including varying operation times, pulse durations, and fusion power levels (for both D–T and D–D neutron sources).
Material composition for each mesh tally flux voxel was determined by calculating its spatial overlap with the materials of the DEMO neutronic geometry model [
16].
The activation calculations using FISPACT-II [
17] in combination with the R2Smesh methodology [
18], employing a 175-group VITAMIN-J energy structure [
19].
The shutdown photon transport simulations with the modified MCNP version, utilizing the MCPLIB84 gamma cross-section library [
20].
Post-processing and analysis of the dose rate results for the various operational and cooling periods.
The JEFF-3.3 data library was consistently applied for the neutron transport in MCNP simulations, while the EAF-2010 library [
21] was adopted for activation analyses in FISPACT-II as part of the R2Smesh workflow. For the photon transport, the MCPLIB84 library provided accurate modelling of decay gamma interactions, ensuring consistency and reliability across all computational stages.
All calculations were performed using the MPI version of the MCNP code [
22] and executed on the CINECA high-performance computing (HPC) cluster [
23], where each compute node consists of 256 CPU cores with 768 GB of memory. Depending on the computational requirements of a given iteration step, between 1 and 10 nodes were typically employed for a single calculation. Owing to the large size of the neutron flux and energy spectra mesh tally data, the simulations required the use of variable numbers of compute nodes and CPUs. This approach was necessary to overcome memory allocation limitations associated with high-resolution mesh tallies.
For all simulations, the total number of particle histories was set to NPS = 1010, ensuring adequate statistical convergence. The relative statistical uncertainty of the tallied quantities was below 10% across all regions of interest, which is considered acceptable for neutron transport and activation analyses. The use of parallel computation allowed for efficient handling of the computational load while maintaining consistent accuracy across different tally configurations.
5. A Neutronic Model
A 11°25′ DEMO neutronic sector model, including detailed representations of blanket areas, upper, equatorial, and lower ports, was provided by EUROfusion [
24].
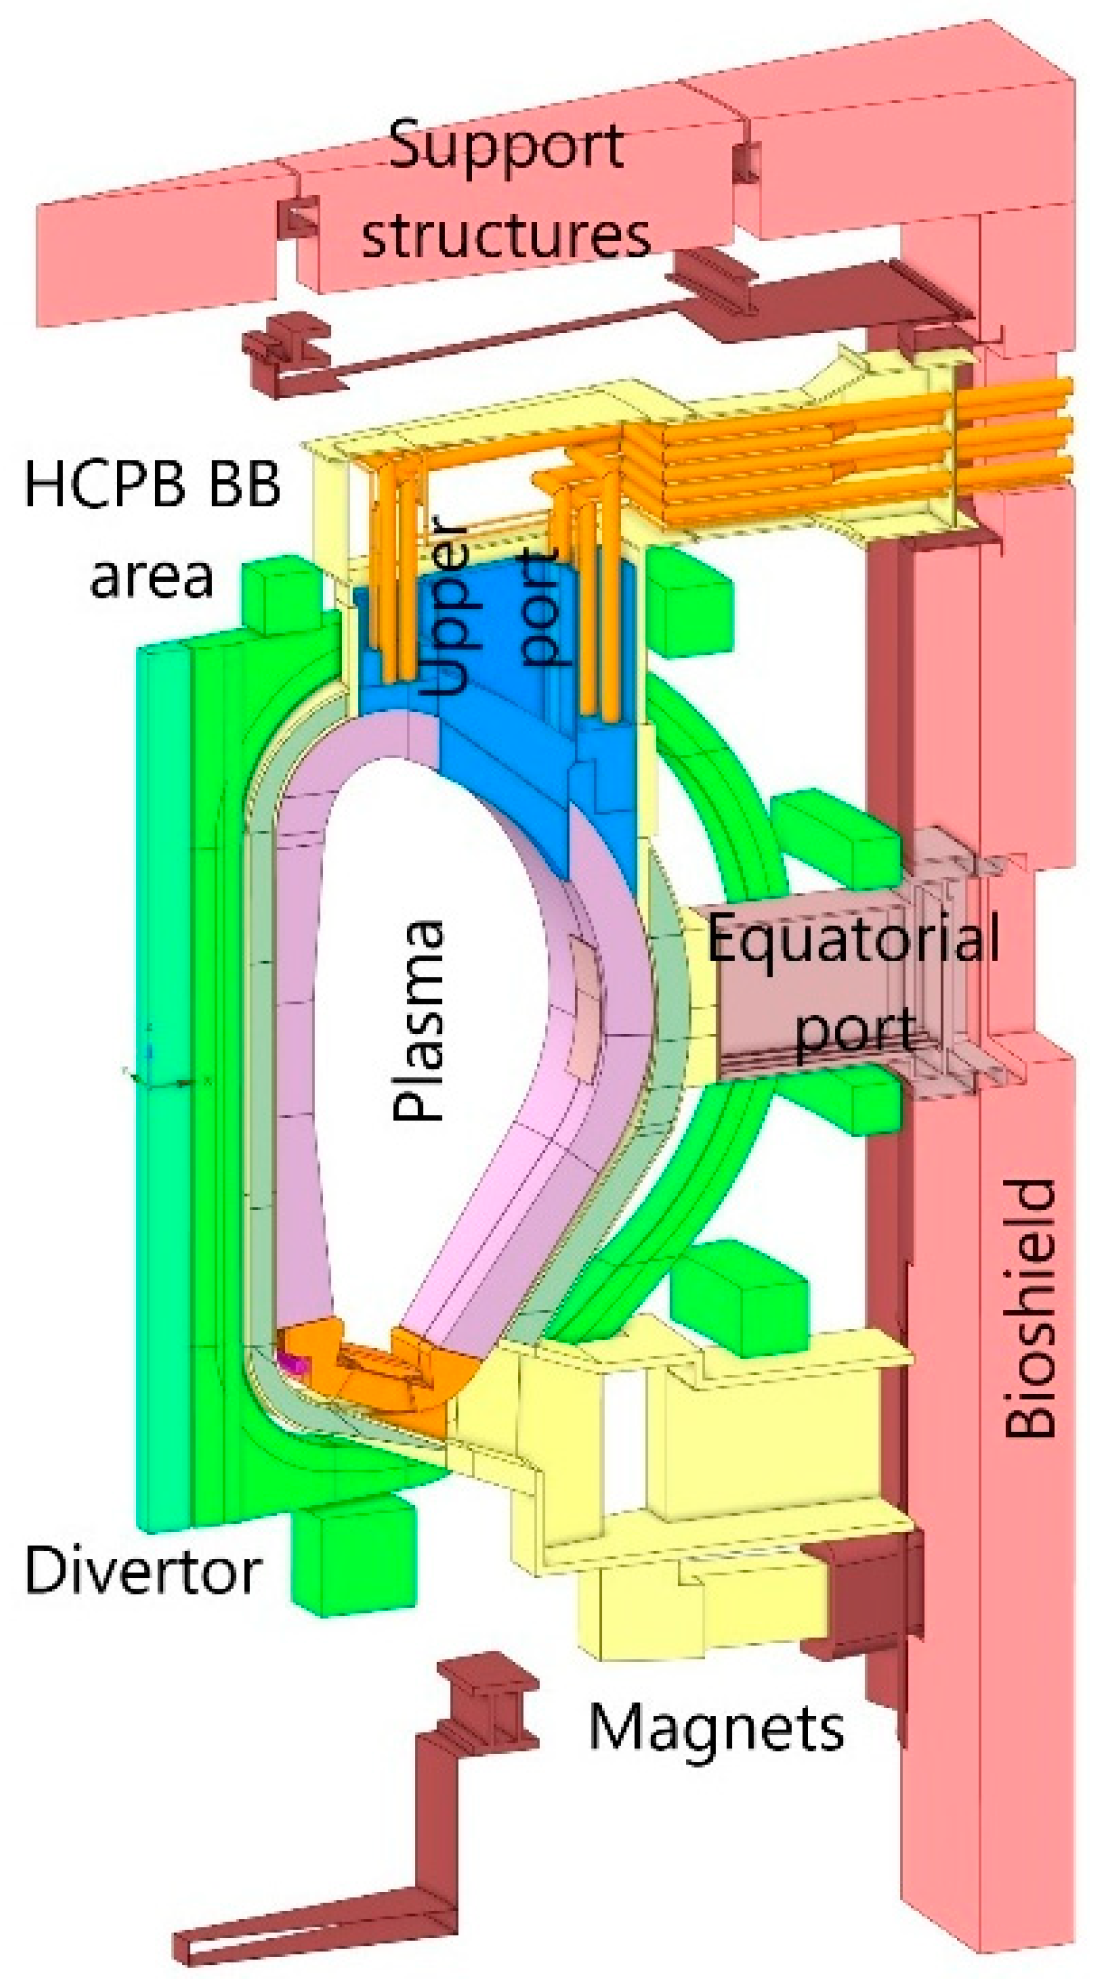
The CAD model shown in
Figure 2 is a base version of the DEMO geometry used in the 2019 neutron analysis [
25]. In the figure, different regions of the tokamak—such as the port extensions, bioshield plug, coolant tubes, and structural elements—are displayed in different colours for clarity. The model incorporates the Helium-Cooled Pebble Bed (HCPB) Breeding Blanket (BB) module [
26] and the divertor assembly, representing key in-vessel components that dominate the neutron interaction and the activation behaviour.
The HCPB blanket is the solid breeder concept under development for the European DEMO fusion power plant. It employs lithium orthosilicate (Li
4SiO
4) pebbles with lithium metatitanate (Li
2TiO
3) enriched with 60% of Li6 as a tritium breeder, packed within a steel container and cooled by high-pressure helium gas. The HCPB blanket uses EUROFER steel, a reduced-activation ferritic-martensitic steel, as the structural material, joining mechanical robustness, low neutron activation, and good compatibility with the helium and ceramic materials. Beryllium or beryllium–titanium alloys are often integrated as neutron multipliers, enhancing a tritium breeding ratio (TBR) by reflecting and moderating the high-energy neutrons. Ongoing studies focus on improving the blanket’s neutronic performance, optimizing thermal–hydraulic behaviour, and ensuring long-term material stability under the pulsed irradiations. The HCPB modular architecture offers advantages in manufacturability, safety, and maintenance compared with liquid breeder systems, positioning it as a strong candidate for a DEMO baseline blanket concept [
27].
To determine the neutron transport characteristics essential for the SDDR analysis, it is necessary to evaluate the neutron flux and energy spectra data with high spatial and energy resolution and low statistical uncertainty throughout the DEMO geometry. Achieving this level of resolution inevitably results in a very large volume of mesh tally data, particularly when fine spatial discretization and extended energy group structures are employed. The neutron transport simulations demand substantial computational resources, including large memory allocation and parallel processing, to maintain acceptable statistical errors across all regions of interest.
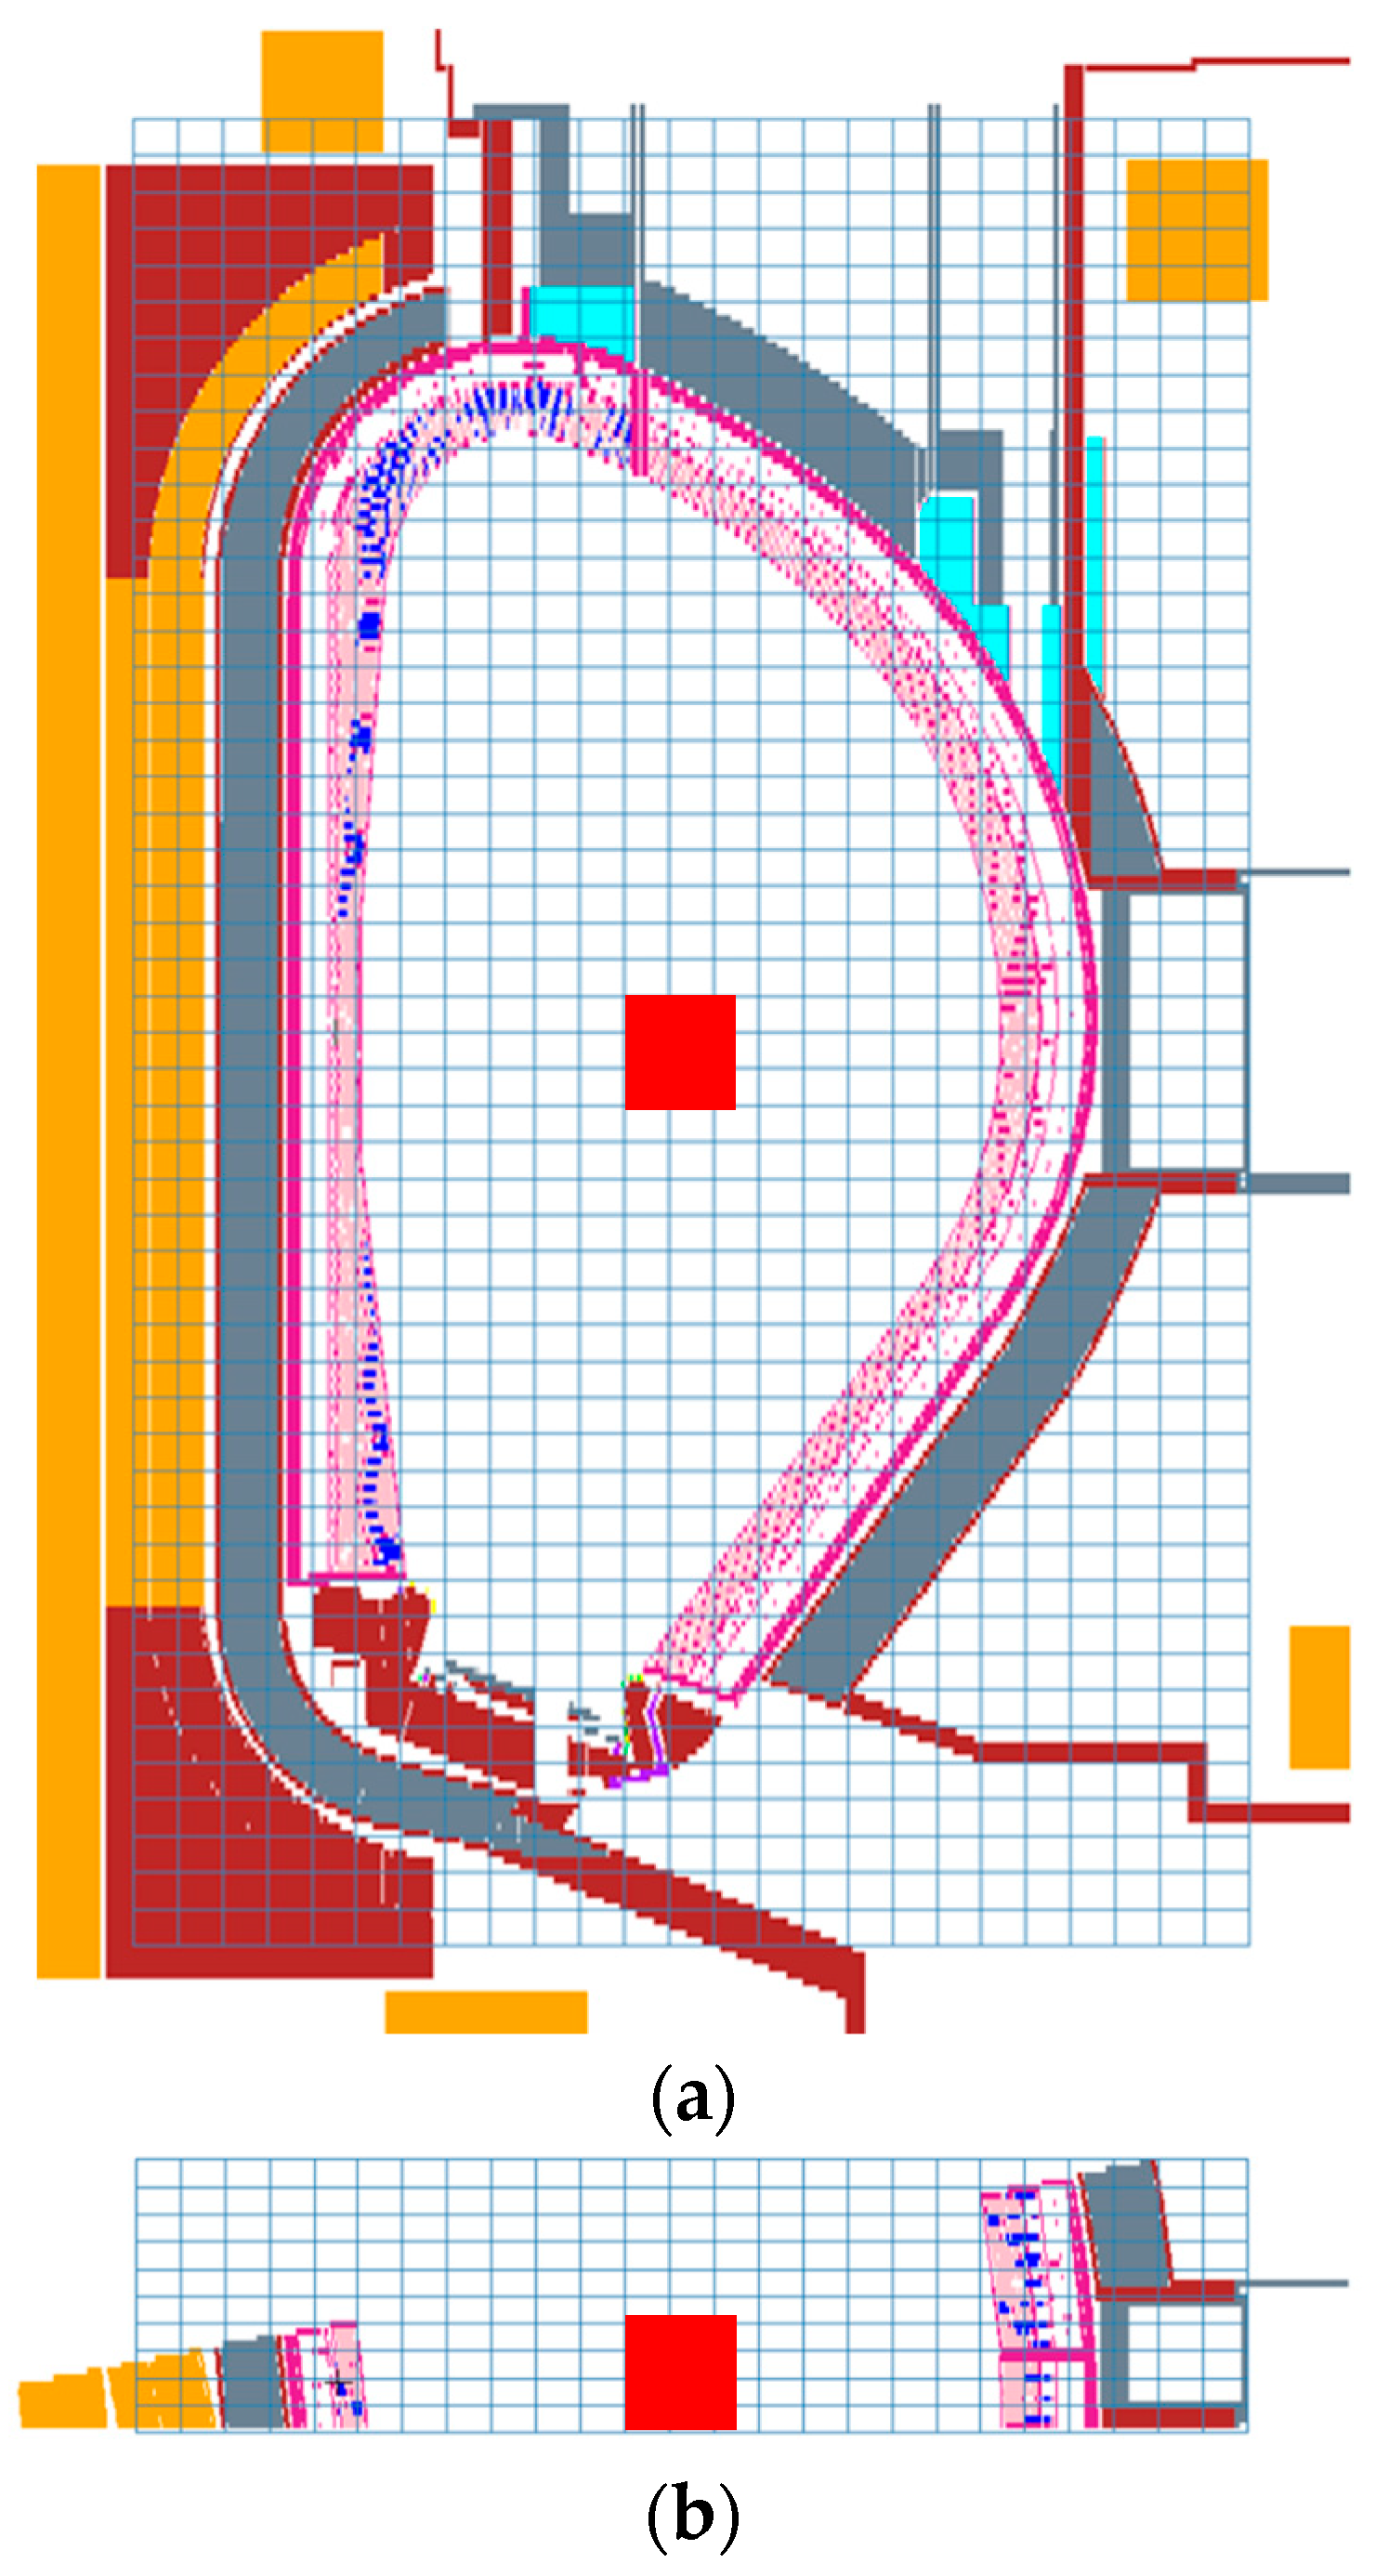
Figure 3 shows a spatial arrangement of the mesh tallies applied to evaluate the neutron flux distribution and the energy spectra. These quantities form the basis for the subsequent activation and decay gamma calculations. The 5 × 5 × 5 cm
3 voxel mesh was used for the fine-resolution neutron flux mapping, while the 15 × 15 × 15 cm
3 mesh was employed for the neutron spectra with 175 energy groups to optimize computational efficiency [
28].
In the central region of the VV, the dedicated 50 × 50 × 50 cm
3 voxel, shown as a red square in
Figure 3, was defined for the final SDDR evaluation. This central tally region enables the dose rate assessment, which is particularly relevant for the maintenance access studies and the shielding optimization.
Regarding the neutron source definition used in the calculations, the SDEF card in MCNP was generated based on plasma source information, with the assistance of the TRANSGEN code [
29]. This code was used to convert plasma-related data into a format suitable for Monte Carlo neutron transport simulations, providing the spatial, angular, and energy characteristics of the neutron source.
For the evaluation of the SDDR, gamma-ray decay sources were derived from FISPACT activation calculations. The resulting radionuclide inventories and decay gamma spectra were subsequently processed using the R2Smesh utility, which enabled the generation of spatially resolved gamma source distributions compatible with MCNP.
6. Results
Following the simulations for the multiple irradiation scenarios and the pulse configurations, the results are presented in a comparative framework to highlight variations in the dose rate behaviour under the different operating conditions. A comprehensive sensitivity analysis was performed to identify the scenarios that lead to the critical SDDR values, which could potentially restrict personnel access or impact component longevity.
The analysis particularly focuses on the relationship between the neutron flux intensity, the irradiation duration, and the cooling time, establishing thresholds beyond which the dose rates exceed the operational safety limits. These findings guide the development of mitigation strategies, such as improved shielding arrangements, optimized duty cycles, and the refined operational scheduling—ensuring both the structural integrity of the DEMO components and the radiological safety of the maintenance operations [
30].
6.1. The Neutron Flux and Decay Gamma Source Intensity
The neutron flux distributions for the DEMO tokamak model were evaluated for the two fusion neutron sources—D–T and D–D—to characterize the radiation environment under the distinct operational regimes. The D–T neutron source was normalized to the total nominal fusion power of 2000 MW, corresponding to the design performance of the DEMO in its full-power operational phase. In contrast, the D–D neutron source was normalized to the fusion power of 2 MW, reflecting the substantially lower neutron yield and the energy output characteristic of the D–D fusion reactions under the comparable plasma conditions. Additionally, the other D–T neutron sources were provided with 10 and 30% of the nominal thermonuclear fusion power—200 and 600 MW, respectively.
For the purposes of this study, the dedicated D–D neutron source model was developed and implemented within the DEMO geometry. This source definition ensured proper normalization and the accurate spatial representation of the 2 MW D–D reaction environment. Such modelling is essential for assessing the influence of lower-energy (2.45 MeV) D–D neutrons on the activation, the material damage, and the subsequent SDDRs, particularly during early reactor commissioning or the low-power operation phases, which will be applied in the first ITER plasma pulses.
6.1.1. The D–T Neutron Source (2000 MW)
The D–T fusion reaction remains the primary operational mode for the next-generation tokamaks such as DEMO, owing to its higher reaction cross-section and greater neutron yield (14.1 MeV neutrons) compared to the D–D fusion. Consequently, the neutron flux resulting from the D–T plasma operation is several orders of magnitude higher, leading to a greater energy deposition, material activation, and tritium breeding within the blanket modules [
31].
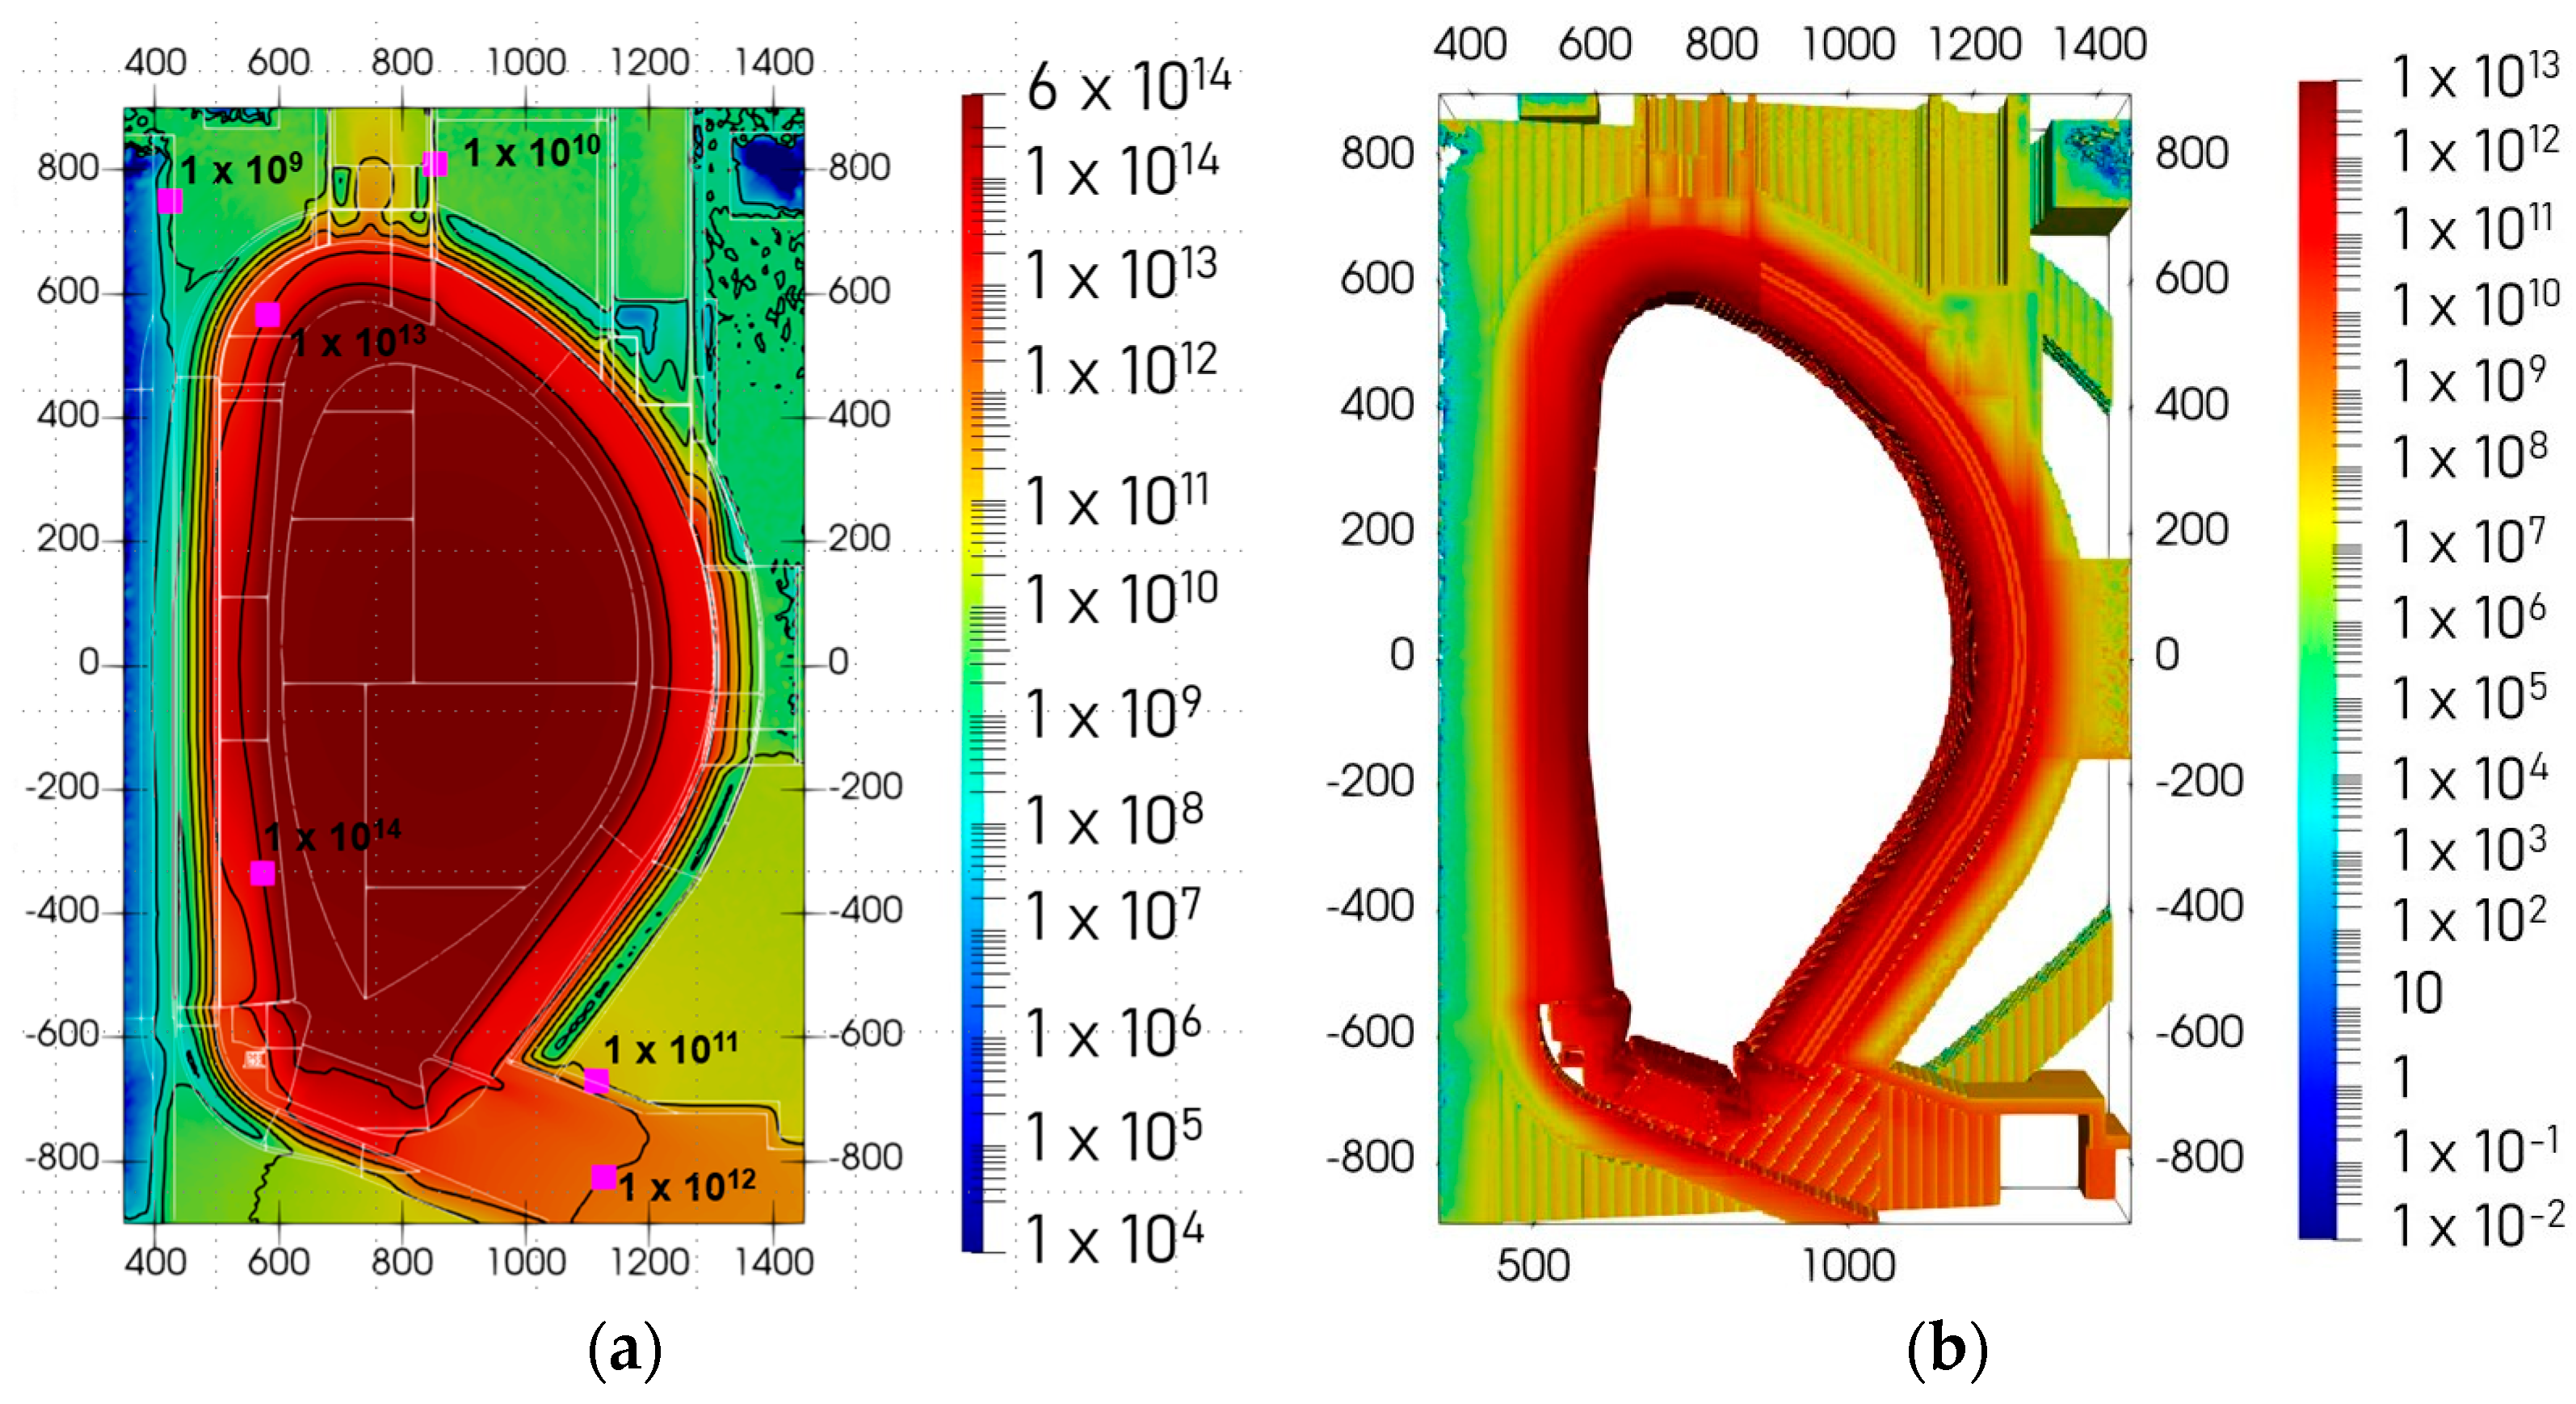
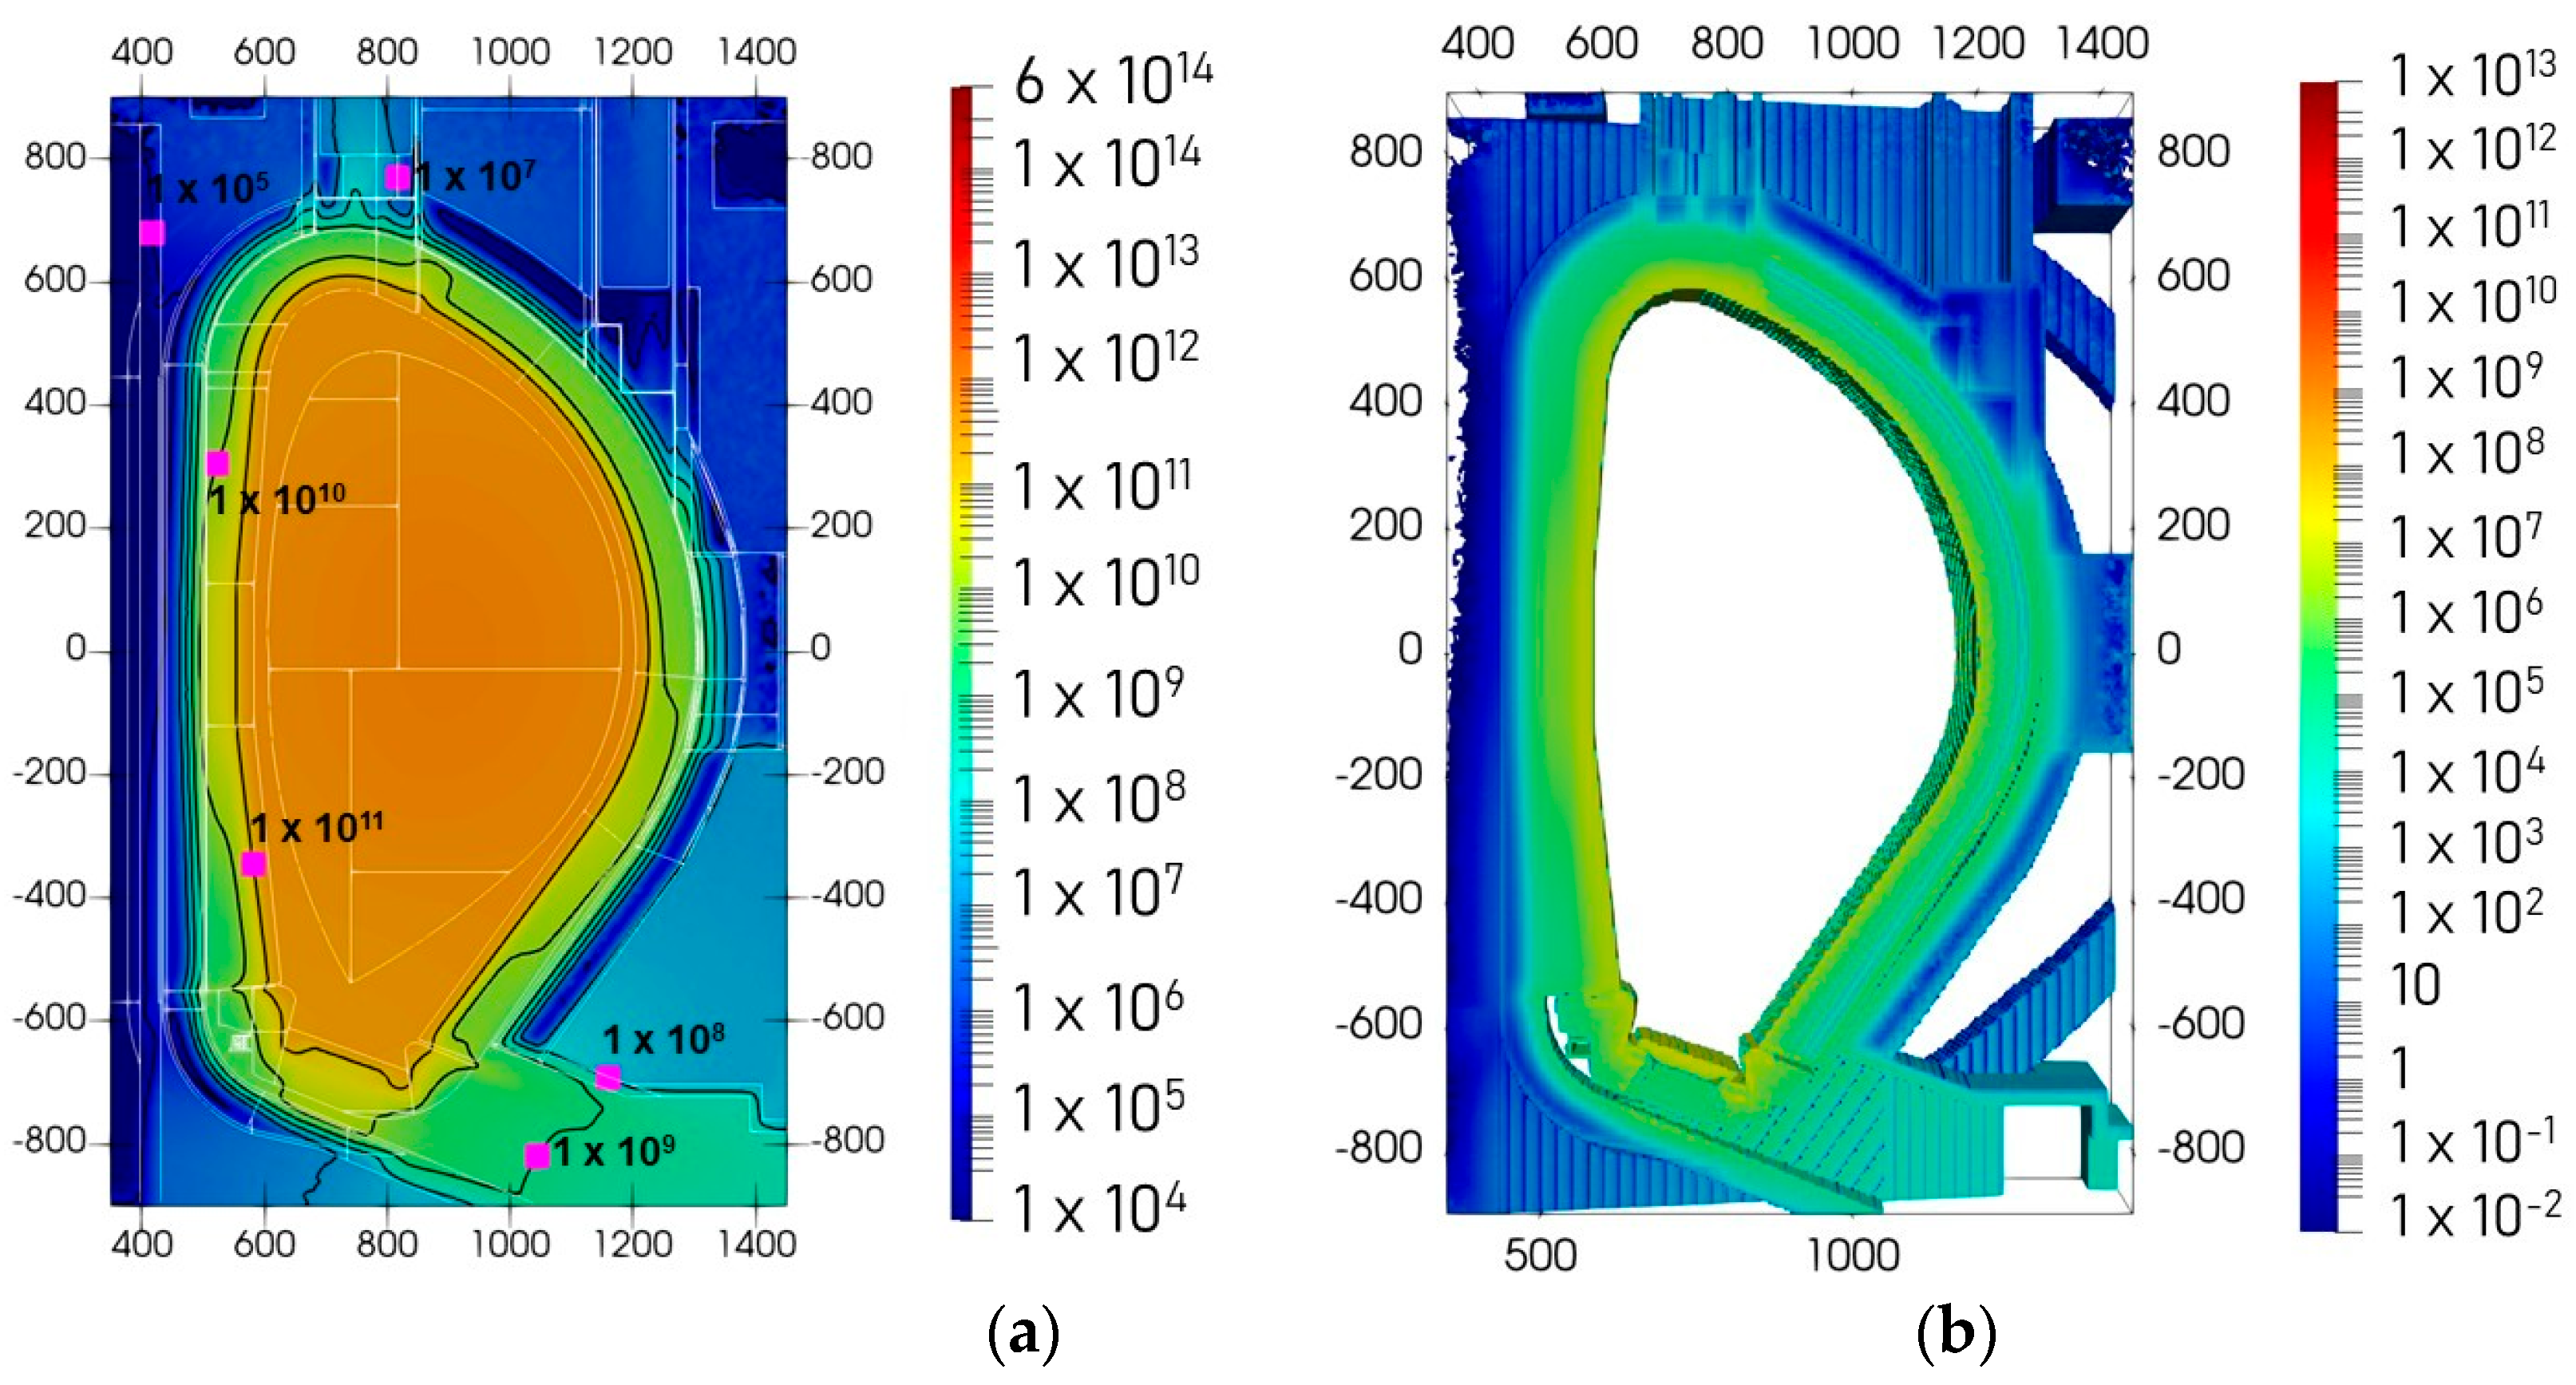
Figure 4 presents the calculated neutron flux distribution (left) and the corresponding decay gamma source distribution after 12 days of cooling (right) for the base D–T irradiation scenario.
The neutron flux plot illustrates the spatial distribution of the neutron intensity throughout the VV and adjacent structures, presented on a logarithmic scale ranging from 104 to above 1014 n·cm−2·s−1. Elevated flux regions are clearly observed in the plasma core and in the breeding blanket zones—the neutron flux reaches values of the order of 1014 n·cm−2·s−1, where neutron moderation, tritium production, and energy transfer predominantly occur. The data reveals a key design feature of the breeding blanket. While the neutron flux from the plasma to the central solenoid decreases by 4 orders of magnitude, the gamma decay source intensity drops down by more than 8 orders of magnitude over the same region. This disproportionate reduction in the gamma radiation highlights that the BB’s composition of heavy metals is specifically intended for gamma-ray shielding.
The accompanying decay gamma map reveals the secondary photon field generated as a result of the neutron activation in the structural and shielding materials [
32]. These photons contribute to the SDDR and must be carefully considered in safety and maintenance planning. It shows the spatial distribution of the decay gamma source intensity within the DEMO tokamak cross-section, displayed on a logarithmic scale from 10
−2 to 10
13 1/sec. The highest intensity, exceeding 10
11–10
12, is concentrated in the in-vessel region and immediately adjacent structural components, reflecting intense activation of materials exposed to the primary neutron and gamma fluxes. A clear radial attenuation of the gamma intensity is observed through the BB and VV, indicating the combined effect of neutron shielding and reduced activation in outer structures. Beyond the VV, the intensity decreases by several orders of magnitude, reaching values below 10
6 in shielded areas. Despite substantial shielding, residual gamma radiation inside the VV remains extremely high even after 12 days of shutdown.
Together, these distributions provide a comprehensive understanding of the neutronic behaviour inside the DEMO VV during the D–T plasma operation and serve as a benchmark for evaluating alternative operation modes, such as the D–D-based testing or the reduced-power scenarios.
6.1.2. The D–D Neutron Source (2 MW)
The D–D fusion reaction, although significantly less efficient in the terms of the neutron production compared to the D–T reaction, remains of considerable scientific and practical interest. Its relevance stems from potential applications in alternative fusion fuel cycles and its inherent safety advantages, particularly during the early operational phases, the testing campaigns, or the maintenance scenarios where the reduced activation and the radiation levels are desirable. The analysis of the neutron flux distributions and the decay gamma sources for both the D–T and the D–D reactions provides the critical data essential for the engineering design and the operational maintenance of the DEMO. While the D–T reaction is confirmed as the dominant source of the fusion power, this study underscores the critical importance of the accounting for the D–D neutrons. Their contribution, particularly to the radiation fields in the central solenoid and other peripheral components, is non-negligible and must be incorporated into the shielding calculations, safety protocols, and maintenance schedule planning to ensure the machine’s viability and longevity.
The neutron flux distribution obtained for the D–D source clearly reflects its lower fusion power (2 MW) and reduced neutron yield, resulting in flux values several orders of magnitude below those observed for the D–T operation. Despite this, the D–D plasma operation offers a valuable experimental platform for validating diagnostics, assessing material behaviour under the low-flux conditions, and developing operational procedures for the initial phases of the DEMO or ITER-like plasma starting phases.
The implementation of a dedicated D–D neutron source model within the DEMO geometry highlights the importance of investigating alternative fusion operation regimes. However, the D–D and D–T fusion reactions produce neutrons with fundamentally different energies and yields: 2.45 MeV for D–D and 14.1 MeV for D–T. The D–D neutron source was normalized to a total neutron power of 2 MW, providing a well-defined reference case for comparison with the 2000 MW D–T scenario. This normalization enables a consistent analysis of the impact of neutron energy spectra on energy deposition and material activation. The higher-energy neutrons produced in the D–T reaction lead to deeper penetration, increased inelastic scattering, and enhanced threshold reactions, resulting in a substantially different spatial distribution of deposited energy and activation products compared to the D–D case. The lower-energy D–D neutrons deposit energy more locally and induce fewer high-threshold reactions, leading to reduced activation and lower shutdown dose rates.
Consequently, this approach provides information on the scaling of radiation effects across different fusion modes, emphasizing the dominant role of the neutron energy and spectral characteristics.
Figure 5a shows the neutron flux distribution within the DEMO geometry during D–D source operation. The flux exhibits similar strong spatial gradient, with the highest neutron flux levels concentrated in the plasma-facing and FW regions, reaching values on the order of 10
10–10
11 n·cm
−2·s
−1, which is 3–4 orders of magnitude less than when irradiated with a D–T source. The D–D neutrons have reduced penetration capability and a lower probability of inducing high-threshold nuclear reactions, leading to diminished neutron flux throughout the structural materials. Despite the lower flux levels, the overall spatial distribution remains qualitatively similar, indicating that the geometry and material configuration of DEMO continue to determine neutron transport and attenuation.
Figure 5b presents the decay gamma source intensity after 12 days of cooling, derived from activation calculations. The highest decay gamma intensities are localized in the activated structural and blanket materials, where neutron-induced reactions have produced radionuclides with half-lives relevant to this cooling time. Peak values reach up to approximately 10
6–10
7 1/sec, while outer regions show a substantial reduction.
The neutron flux determines the activation pattern during irradiation; the post-shutdown radiological environment is governed by the decay gamma sources generated in activated components. After 12 days of cooling, short-lived isotopes have largely decayed, and the gamma field is dominated by radionuclides with intermediate half-lives, leading to smoother spatial gradients compared to the operational neutron flux.
6.2. The SDDR During the Base Irradiation Scenario
6.2.1. The Continuous Irradiation
This section presents the SDDR results obtained after the termination of DEMO reactor operation at full fusion power. The analysis covers the range of cooling time intervals (from 1 h to 1 month) and the continuous irradiation durations (from 1 day to 1 year), providing a comprehensive understanding of radiation field evolution in the VV region.
Table 1 summarizes the SDDR values (in Sv/h) across the different combinations of the irradiation and cooling times. Each column corresponds to a fixed total continuous irradiation time, ranging from 1 day to 1 year, while each row in the column indicates the cooling intervals after shutdown (1 h, 1 day, 1 week, 1 month). For example, the first column shows the SDDR values obtained after 1 day of continuous irradiation, evaluated at four different cooling times (1 h, 1 day, 1 week, and 1 month), and the same structure applies to the remaining columns. This structured approach enables the identification of the trends in the dose rate attenuation.
In the initial cooling period—within the first few hours and days after the shutdown—the radiation field is dominated by short-lived activation products, primarily Nitrogen-16 (
16N) and Sodium-24 (
24Na) [
33]. These isotopes, formed in a water coolant and in steel components, respectively, emit high-energy gamma radiation, but they decay rapidly, leading to the steep initial reduction in the SDDR.
As the cooling time extends from weeks to several months, the SDDR decreases significantly. Medium-lived radionuclides such as Cobalt-60 (
60Co) and Manganese-56 (
56Mn) begin to dominate, sustaining the elevated gamma dose rates. Beyond the approximately six months of cooling time, long-lived isotopes such as Cesium-137 (
137Cs), Nickel-59 (
59Ni), and various activated corrosion products determine the residual dose levels, which can continue for several years [
34].
Even after one day of the full power mode, the calculated SDDR within the VV exceeds tens of sieverts per hour after one month of cooling—far beyond any safe limit for direct human access. With the increasing irradiation duration (from days to months), the SDDR levels rise almost proportionally due to the cumulative build-up of the activation products, particularly within the steel structures and cooling channels.
6.2.2. The D–T Base Scenario (The Full Power Operation)
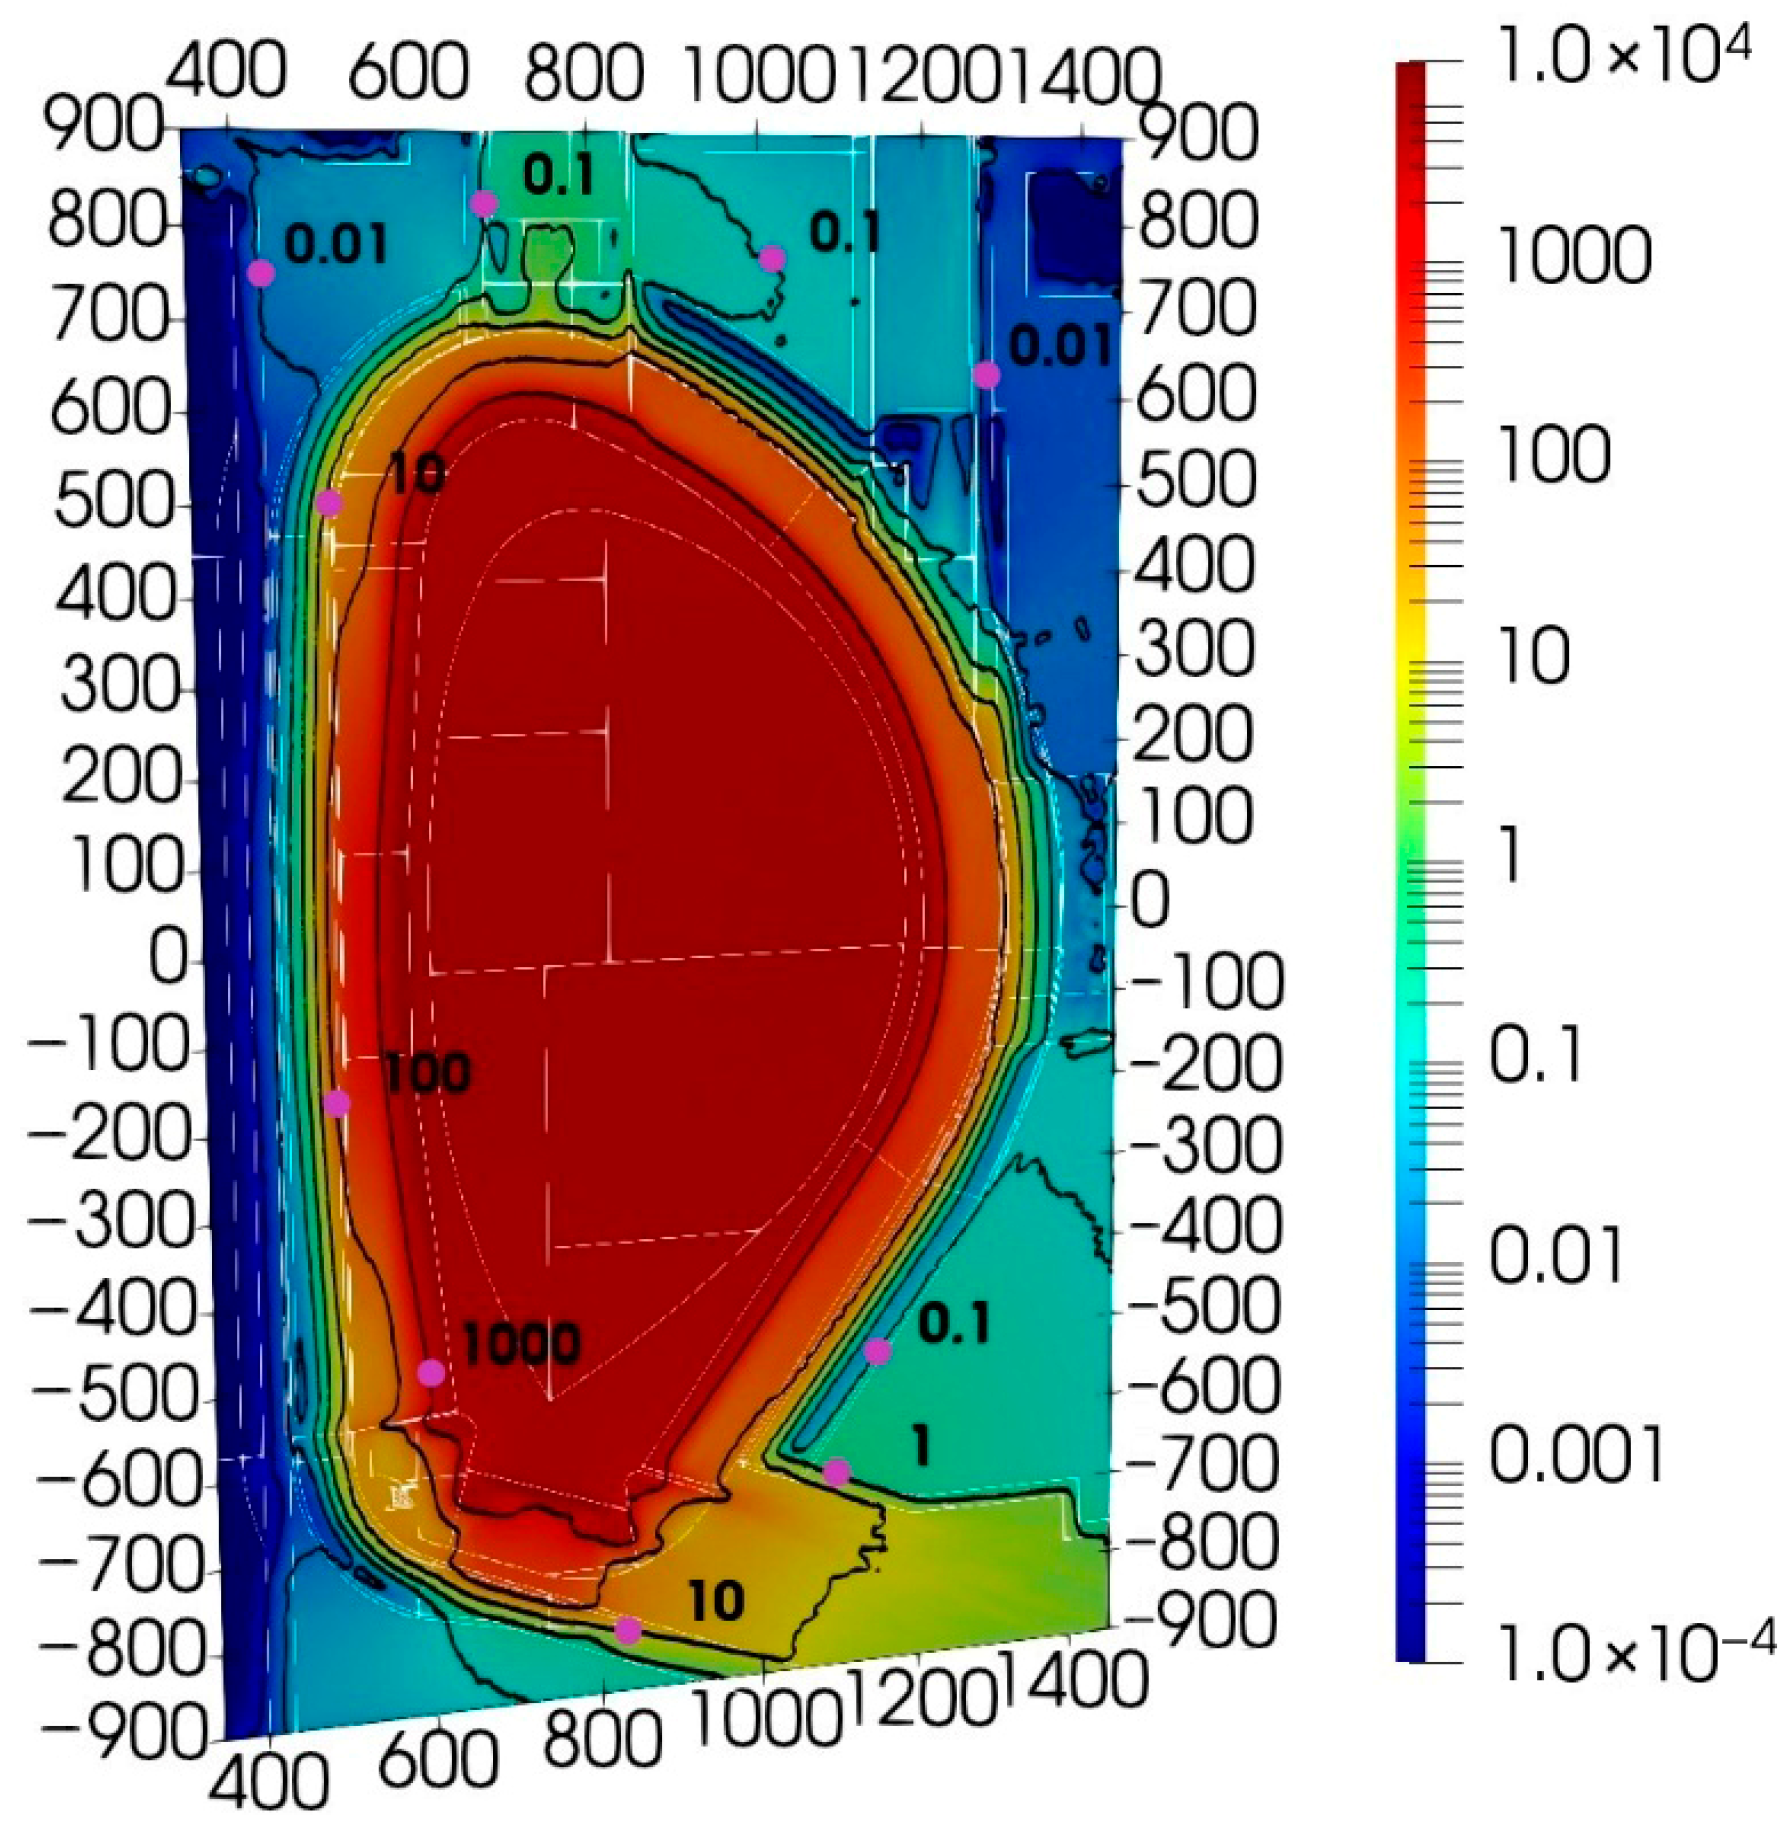
Figure 6 presents the SDDR spatial distribution with isolines for the D–T Base irradiation scenario in the DEMO model after 12 days of cooling. The results indicate extremely high dose rate regions, particularly within the inner wall of the VV, the BB modules, and the divertor assemblies. The localized dose rates inside the VV reach several kilo sieverts per hour (kSv/h), even after extended cooling, confirming the intense activation of the structural and the shielding materials by the 14.1 MeV neutrons from the D–T fusion plasma.
The spatial maps further show that while ex-vessel areas—such as the port extensions and the areas near bioshield regions—experience significantly lower dose rates (below ~0.1 Sv/h), the in-vessel components remain inaccessible for many years post-operation. This necessitates the exclusive use of remote handling and automated maintenance systems for the DEMO, consistent with the ITER’s design philosophy [
35].
The results clearly demonstrate that the SDDRs are highly sensitive to the neutron flux gradients and the material composition, with stainless steels (rich in Fe, Ni, and Co) being major sources of long-term activation. These findings underline the critical importance of a material optimization and the shielding design to mitigate the SDDRs, reduce maintenance downtime, and ensure compliance with the future fusion facility safety standards.
The data presented in
Figure 6 play an important role for the definition of the design and the safety strategy of the DEMO tokamak and the future fusion reactors. A detailed visualization of the SDDR radiation environment enables engineers to identify the critical regions within the reactor structure that demand enhanced shielding, material improvements, or design modifications. Moreover, the figure serves as an important validation reference for the computational models used in the SDDR prediction, ensuring that the simulation methodologies accurately capture the complex interaction between neutron activation, decay photon transport, and geometry effects. This validation is essential for developing reliable tools that support design optimization and regulatory compliance [
36].
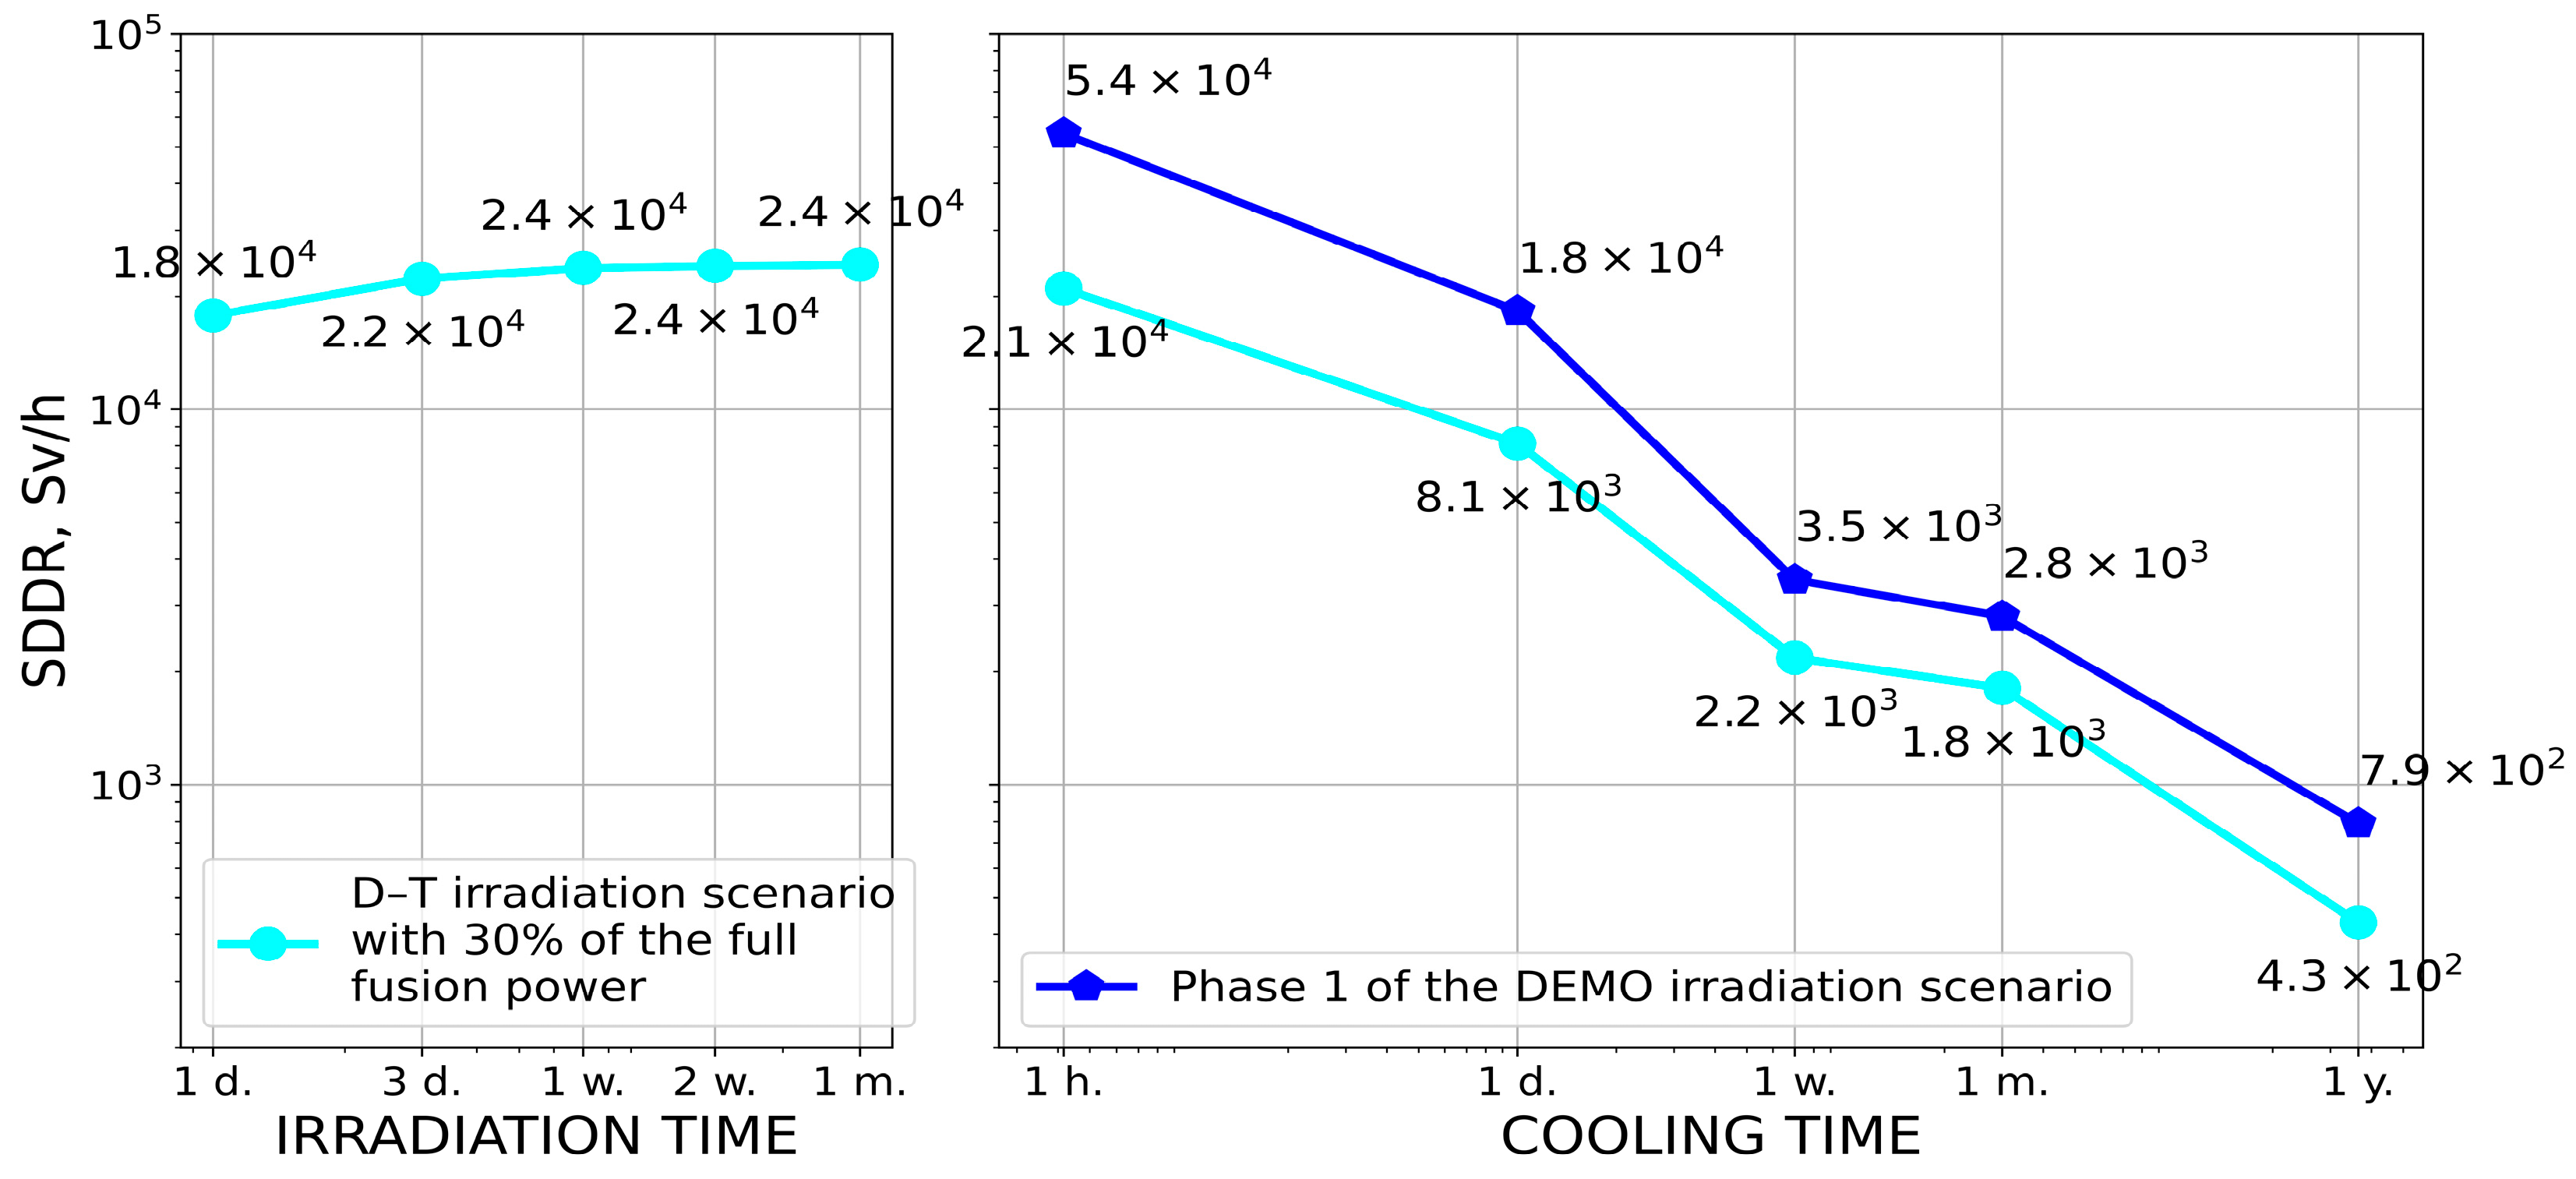
Figure 7 presents the SDDR evolution in the centre of the VV during both the irradiation and cooling phases for the two operational cases: Phase 1 of the DEMO irradiation (blue line) and the reduced-power continuous scenario, demonstrating irradiation with 30% of the nominal D–T power (600 MW) (turquoise line). The SDDRs during irradiation time (left part of
Figure 7) increases slightly with irradiation time, reaching levels of approximately 20–25 kSv/h after several weeks of operation. The SDDRs are essentially identical for both scenarios, as both cases correspond to the same effective fusion power level. This indicates that, during irradiation, the activation buildup at the VV centre rapidly approaches a quasi-saturation state dominated by short-lived radionuclides. In contrast, the cooling phase (right part of
Figure 7) shows a pronounced divergence between the two scenarios. Immediately after shutdown (1 h of cooling), the Phase 1 irradiation case exhibits a significantly higher SDDR (54 kSv/h) compared to the reduced-power continuous irradiation case (21 kSv/h). This difference reflects the larger accumulated neutron fluence in Phase 1 of the DEMO irradiation, which leads to a higher inventory of activation products contributing to the decay gamma field. At longer cooling times (months to one year), the SDDR is dominated by long-lived activation products, and the reduced-power scenario consistently results in lower dose rates, reaching values below 1 kSv/h after one year of cooling.
The results demonstrate that even after one year of cooling, the SDDR in the VV centre remains extremely high—on the order of hundreds of sieverts per hour (Sv/h). This persistent radiation intensity highlights the severe activation of the in-vessel materials and the necessity for long-term remote handling solutions, as direct human access remains impossible for a long time after the reactor’s shutdown.
The analysis underscores the significant challenges of managing residual radiation in high-power fusion environments, especially during maintenance, inspection, and decommissioning operations. These results emphasize the importance of adopting advanced low-activation structural materials, optimized blanket and divertor configurations, and innovative shielding strategies to minimize the dose rates and facilitate safer maintenance access.
Future work should focus on exploring enhanced cooling mechanisms, alternative material compositions, and optimized operational schedules to further reduce long-term activation and improve the maintainability of the fusion reactor systems. Such studies are essential for ensuring that the DEMO and the next-generation fusion power plants can operate safely, efficiently, and in full compliance with the international radiological protection standards.
6.2.3. A Different Operation Modes of the Irradiation
The in-depth analysis was performed to evaluate the SDDRs across multiple operational scenarios with different power levels, irradiation duration, and pulse frequency. The objective was to understand how these operational parameters affect the residual radiation behaviour and the cooling-time dependence of the dose rates within the DEMO VV.
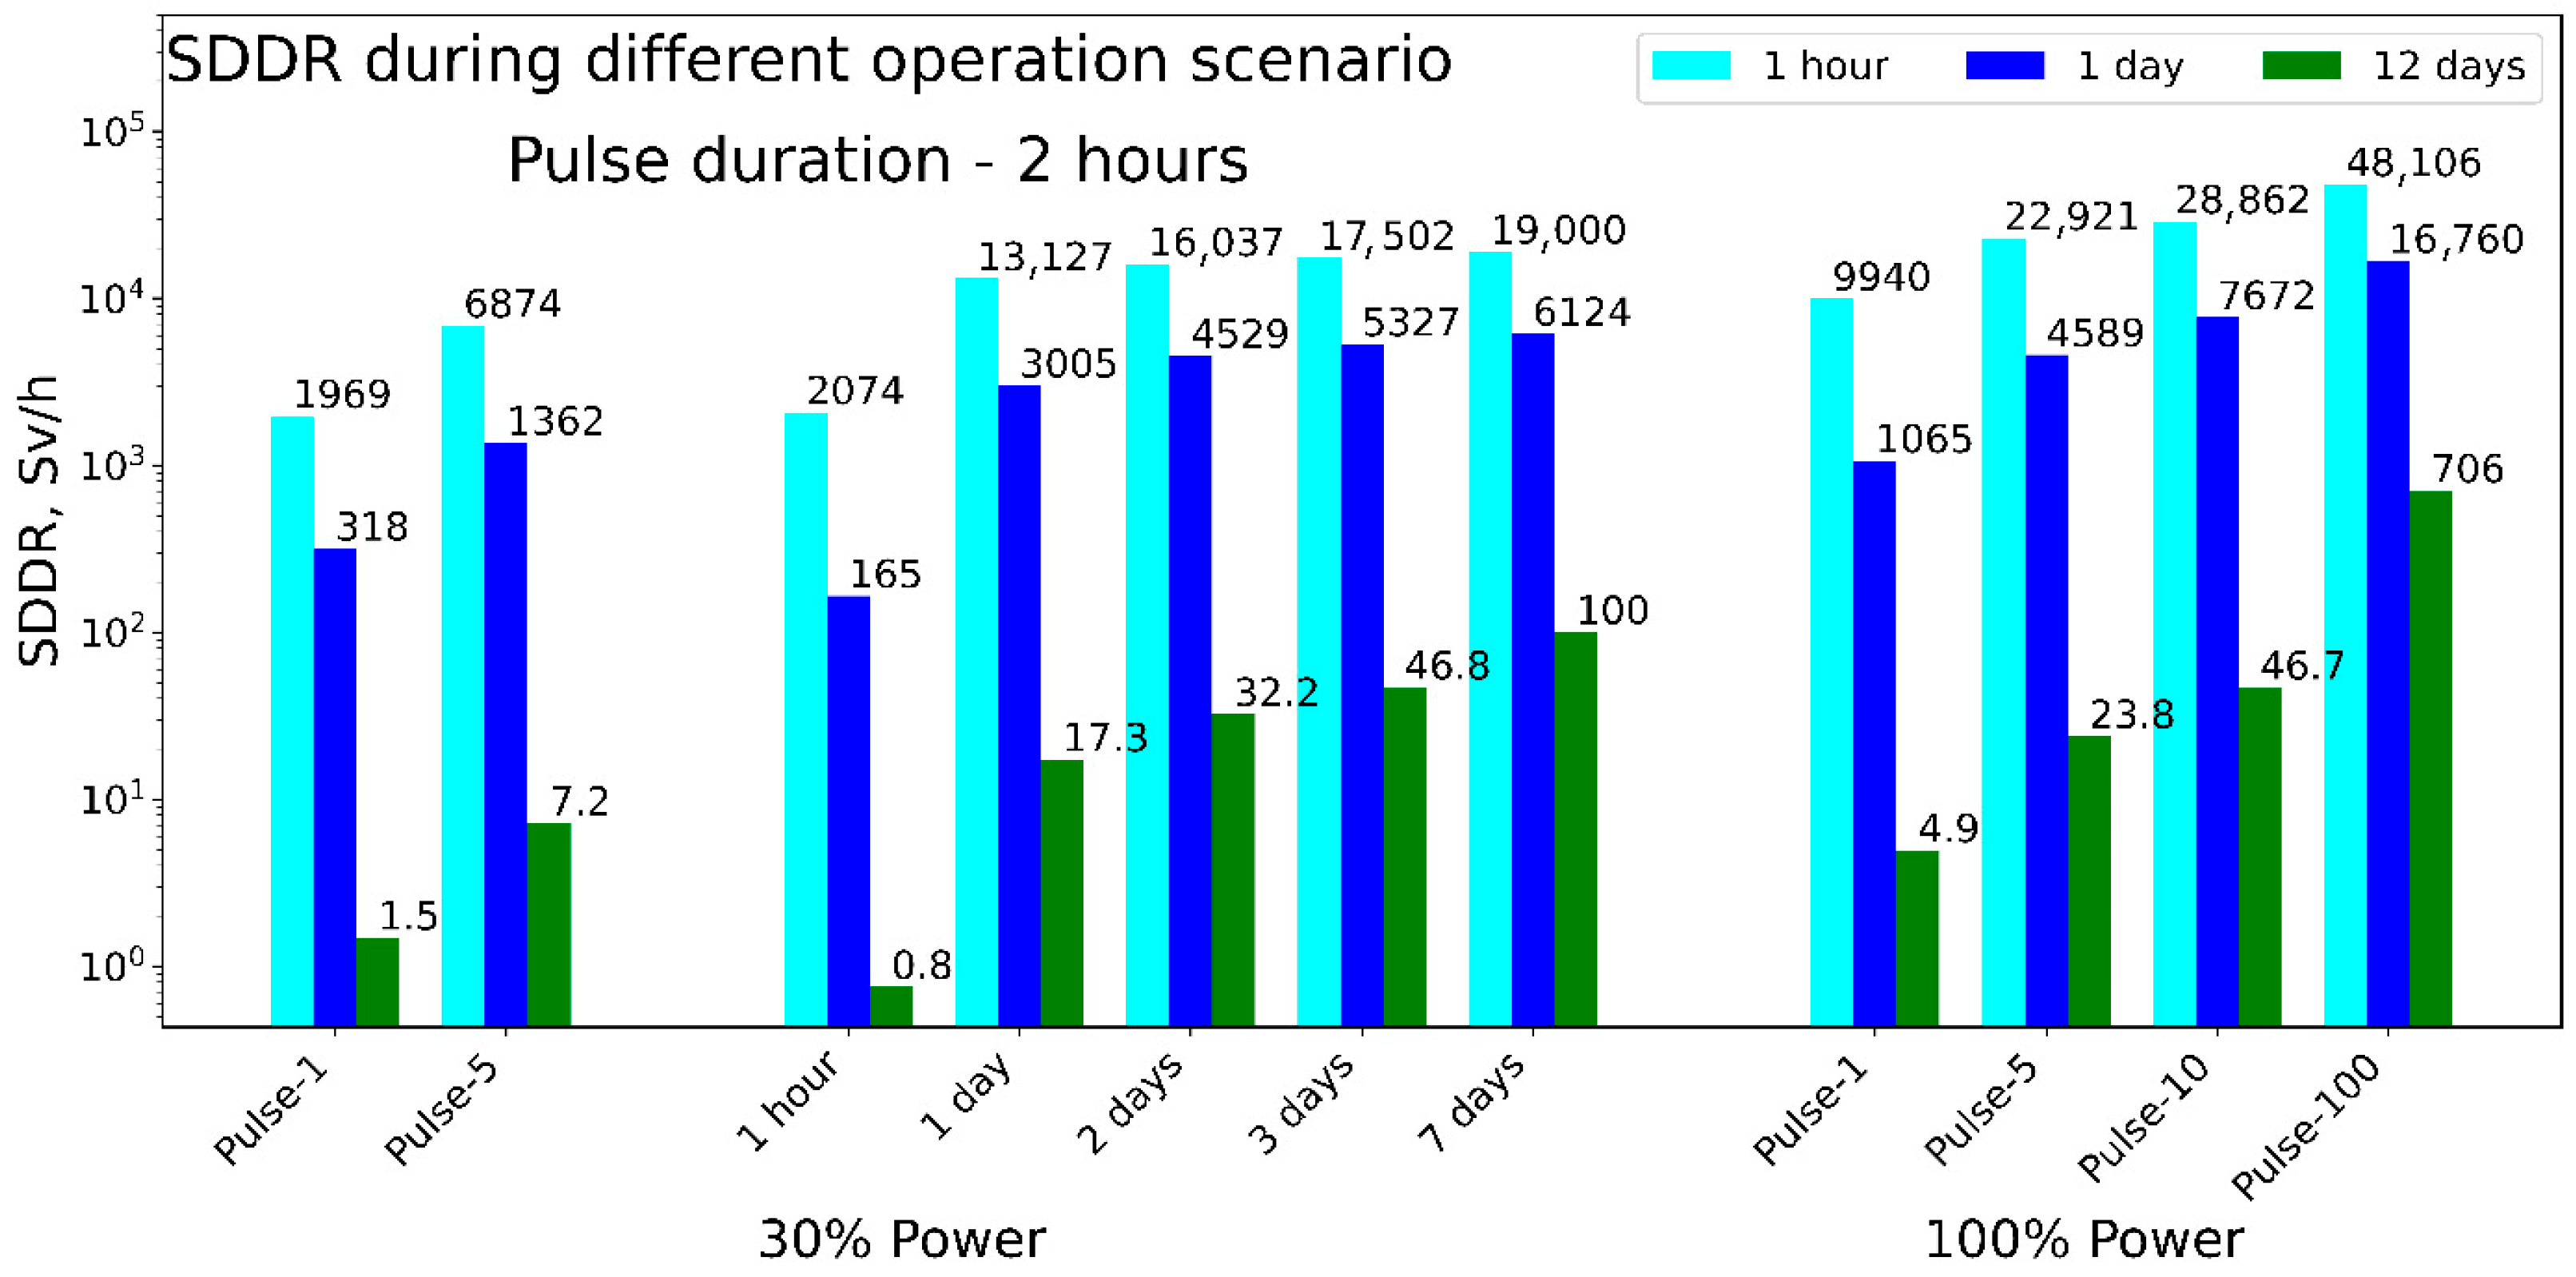
This study considered cooling intervals of 1 h, 1 day, and 12 days after the shutdown, with the fixed pulse duration of 2 h for all cases. This systematic approach enables the comparative assessment of the radiation environment under the different operating conditions and provides essential guidance for maintenance planning and safety assessments.
Figure 8 summarizes the range of the irradiation schemes analyzed:
The power intensity: The full-power operation (2000 MW, 100%) and the reduced-power mode (30% of the total fusion power);
The operation type: The continuous irradiation (1 h, 1 day, 2 days, 3 days, 7 days) and the pulsed irradiation (1, 5, 10, 100 pulses).
Each dataset represents the SDDR results calculated after 1 h (turquoise bars), 1 day (blue bars), and 12 days (green bars) of cooling.
The results clearly indicate that the shorter irradiation durations and the lower power levels yield proportionally lower SDDR values. The lowest dose rate was observed after 1 h of continuous irradiation at 30% power, confirming the strong dependence of activation on total neutron fluence. However, even under these mild conditions, the dose rate after 12 days of cooling remained around 1 Sv/h, which is orders of magnitude above the permissible limits for human access. Consequently, any in-vessel intervention would require remote handling systems and robotic tools, even after extended cooling times.
The comparison between the continuous and the pulsed irradiation shows that the multiple short pulses result in cumulative activation effects similar to continuous exposure when total neutron fluence is comparable. This suggests that pulsed operation alone does not substantially mitigate long-term activation unless combined with the lower power levels or the shorter total exposure times.
6.2.4. A Comparison of the D–D Scenario
The D–D neutron source plays a crucial role in the development, in the testing, and in the operation of the fusion facilities such as the ITER and the DEMO, serving as a key intermediate step between a non-nuclear commissioning and the full-power D–T operation. Although the D–D fusion produces a much lower neutron yield and energy (2.45 MeV compared to 14.1 MeV for the D–T), it provides an invaluable platform for validating system performance, safety protocols, and component behaviour in the neutron environment—but without the extreme activation and tritium-handling challenges associated with D–T fusion.
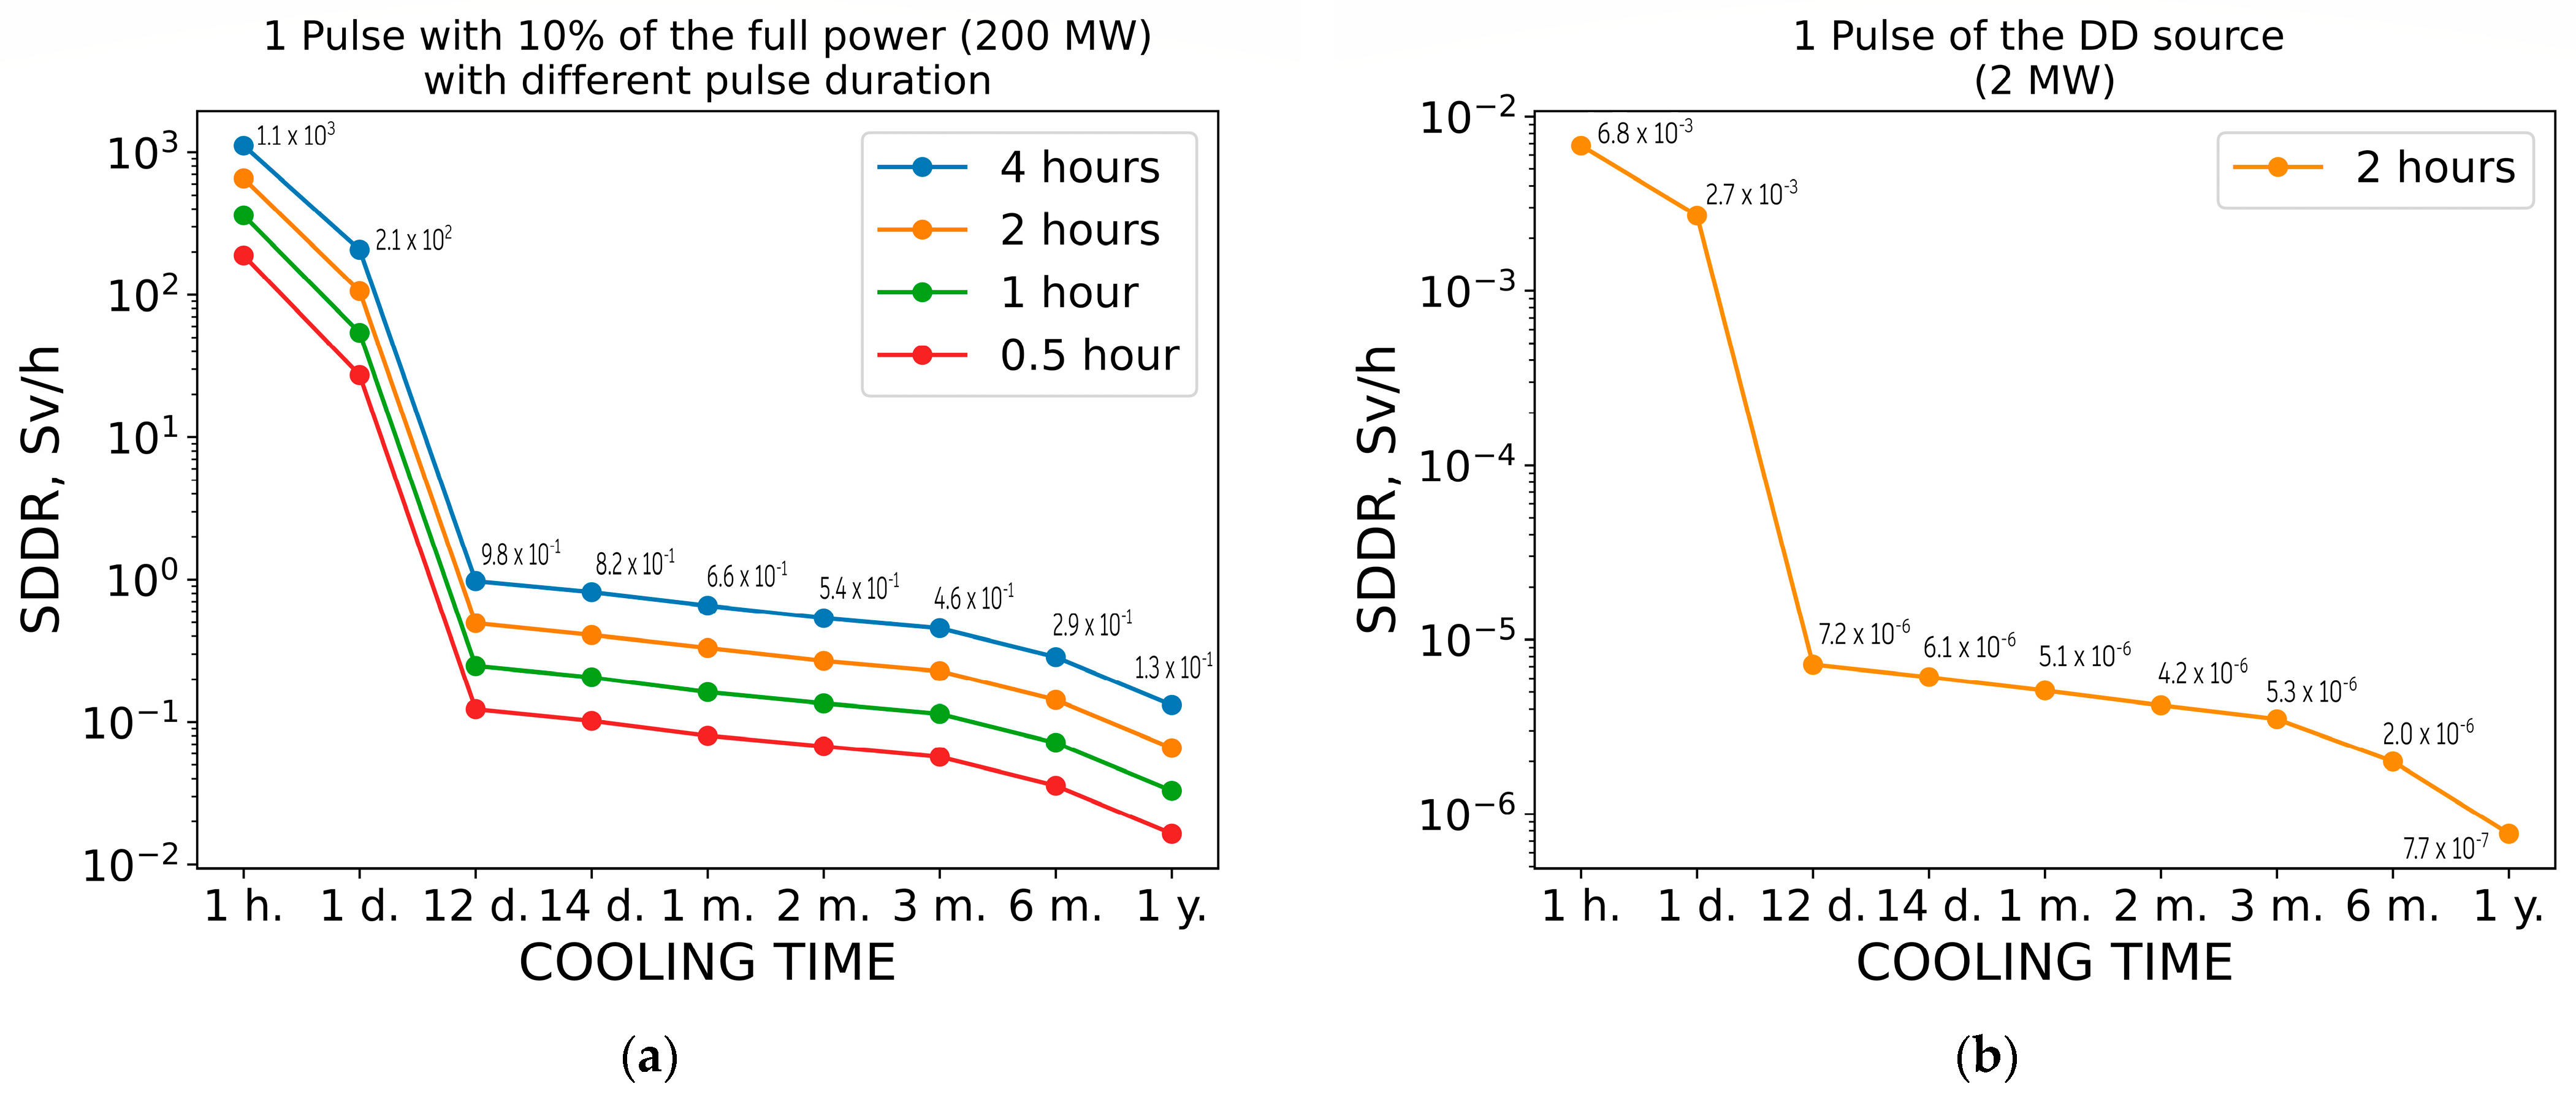
The figures below show the SDDR data for the two reduced power sources: the D–T with 10% of rated power (200 MW) and the D–D with 2 MW of the fusion power. The data for the D–T source are presented for the different irradiation pulse durations.
Figure 9 presents the SDDR analysis for the single pulse with the different durations under D–T and a single 2 h pulse of the D–D neutron sources. The results show that the pulse duration strongly influences the SDDRs—the longer pulses produce the higher initial dose rates due to the increased neutron activation. The very large fall-off in the SDDR between 1 day and 12 days of cooling is entirely due to the decay behaviour of short-lived activation products. Immediately following a high-power pulse, nuclides whose half-lives range from a few minutes up to a few days (
24Na,
56Mn,
58Co and similar species) dominate the radiation field. Over the first 24 h, these radionuclides emit intensely, but by the time the cooling period extends up to 12 days their inventories have decayed by more than 99 % in many cases.
In the D–T neutron case, the SDDR rises precisely with the pulse duration, reflecting the higher neutron yield (14.1 MeV neutrons) and the greater material activation potential of the D–T fusion. Conversely, the D–D neutron irradiation results in SDDR values that are approximately six orders of the magnitude lower than those from the D–T pulses. This huge reduction is taken from the lower-energy neutrons (2.45 MeV) produced in the D–D fusion and their significantly smaller activation cross-sections.
Although the D–D operation drastically reduces long-term activation and residual SDDRs, the short-lived isotopes still dominate the radiation field immediately after the shutdown, maintaining the non-negligible dose levels during the first few hours. Nonetheless, the comparatively low SDDR in the D–D scenarios offers distinct operational advantages, including simplified maintenance, reduced shielding requirements, and shorter cooling times before limited access becomes possible.
The D–D scenarios present safer testing and the commissioning phase for the DEMO-like reactors, supporting system calibration, diagnostic validation, and maintenance procedure development under lower-radiation conditions.
7. Discussion
The calculation of the SDDR for the DEMO tokamak is very important for the safety assessment and operational planning of the fusion power systems. The accurate estimation of the radiation levels is essential for defining safe maintenance conditions, optimizing shielding layouts, and guiding the design of remote handling and inspection systems. A detailed understanding of SDDR behaviour enables the establishment of realistic access schedules and protection strategies for both personnel and equipment.
7.1. The D–T Irradiation Scenario
For all analyzed D–T irradiation scenarios, safe human access inside the VV remains infeasible due to extremely high SDDR levels. Even after extended cooling periods—ranging from days to years—the dose rates exceed the 5 mSv/h safety threshold by several orders of magnitude. Within the VV, SDDR values can reach several kSv/h, while outside the VV they generally remain below 0.1 Sv/h. Such extreme radiation levels impose big challenges not only for personnel access but also for radiation-hardened robotic systems, highlighting the complexity of maintenance and decommissioning operations under high-power D–T conditions.
7.2. The Reduced D–T Irradiation Scenario
The reduced-power D–T operation shows a clear correlation between fusion power and SDDR intensity. For example, a 0.5 h pulse at 10% of full D–T power (200 MW) results in the SDDR values exceeding 0.1 Sv/h after 12 days of cooling, remaining well above occupational access limits. Preliminary estimates indicate that further power reduction to approximately 2 MW could potentially lower the SDDR to levels compatible with limited in-vessel access. However, confirmation of this scenario requires additional modelling, particularly concerning activation product inventories, decay gamma emission, and shielding effectiveness.
7.3. The D–D Irradiation Scenario
The D–D neutron source scenario demonstrates significantly lower activation potential compared to the D–T operation. A 2 h pulse at 2 MW results in the SDDR values below 5 µSv/h after 12 days of cooling, well within the 10 µSv/h limit for routine maintenance access. This significant reduction is primarily due to the lower neutron energy (2.45 MeV) and reduced neutron yield associated with the D–D reactions, which strongly suppress high-threshold activation reactions and long-lived radionuclide production. These findings emphasize the suitability of the D–D operation phases for commissioning, calibration, and early diagnostic testing in fusion devices such as ITER and DEMO.
8. Conclusions
This study demonstrates that the SDDR levels in the DEMO are strongly dependent on both fusion reaction type and operational scenario. While the high-power D–T operation is indispensable for achieving commercial fusion performance, it leads to extreme radiation fields, effectively prohibiting human access inside the VV and significantly constraining maintenance strategies.
In contrast, reduced-power D–T operation offers limited improvements, with the SDDR values remaining above acceptable access thresholds unless fusion power is reduced to very low levels. The D–D operation scenario, however, provides a viable low-activation regime, enabling safe access after relatively short cooling times and significantly reducing long-term radiological hazards.
Future developments should focus on minimizing the SDDR through material optimization, advanced shielding concepts, and optimized operational scheduling. The combination of low-activation materials, shorter irradiation cycles, and enhanced cooling strategies can further mitigate radiation exposure risks. Additionally, continued progress in activation modelling, particularly in Rigorous-2-Step methodologies and nuclear data libraries, will improve the predictive accuracy of the SDDR assessments.
The results indicate that a hybrid operational strategy, combining the D–D and the D–T fusion phases, may provide an optimal pathway toward achieving both high fusion performance and robust safety margins in next-generation fusion reactors.




 ,
,