Article

Response Surface Methodology-Based Optimization of Ultrasound-Assisted Extraction from Comarum palustre L.: Chemical Composition and Antioxidant Properties

1
Student Scientific Club at the Department of Cosmetic and Pharmaceutical Chemistry, Pomeranian Medical University in Szczecin, PL-70111 Szczecin, Poland
2
Department of Organic Chemical Technology and Polymer Materials, Faculty of Chemical Technology and Engineering, West Pomeranian University of Technology in Szczecin, PL-70322 Szczecin, Poland
3
Department of Cosmetic and Pharmaceutical Chemistry, Pomeranian Medical University in Szczecin, PL-70111 Szczecin, Poland
*
Authors to whom correspondence should be addressed.
Appl. Sci. 2026, 16(4), 1893; https://doi.org/10.3390/app16041893
Submission received: 8 January 2026 / Revised: 10 February 2026 / Accepted: 11 February 2026 / Published: 13 February 2026

Abstract

Recently, plant raw materials, which are a source of valuable secondary metabolites such as polyphenols and terpenoids with antioxidant properties, have been gaining increasing importance in cosmetology as key active ingredients in plant extracts. One such species is Comarum palustre L. (C. palustre), traditionally valued mainly for its anti-inflammatory and regenerative properties, and more recently also for its antioxidant activity. The aim of the study was to evaluate the impact and optimize the technological parameters of the C. palustre extraction process using response surface methodology (RSM). The factors analyzed included extraction time (2–10 min) and the volumetric concentrations of aqueous solvent solutions—ethanol (Et), isopropanol (Ipa), and acetone (Ac)—ranging from 20 to 100% v/v. The process was optimized taking into account antioxidant activity (determined based on the ability to neutralize free radicals using the DPPH method and reduce Fe3+ ions using the FRAP method), chelating activity (assessed based on the ability to bind Fe2+ ions using the ferrozine method), total polyphenol content (TPC, determined by the Folin–Ciocalteu method), and the extraction yield of neophytadiene (NFD) and phytol—active compounds with proven antioxidant properties, analyzed by GC-MS. The use of optimal technological parameters, including a 5-min extraction time and a 50% (v/v) concentration of aqueous solvent solutions (acetone, ethanol, and isopropanol), made it possible to obtain an extract from C. palustre herb characterized by the following properties: antioxidant activity > 120 mg Tx/L (DPPH), Fe3+ ion reduction capacity > 25 mmol Fe2+/L (FRAP), chelating activity > 330 mg Fe2+/L (ferrozine method), and total polyphenol content exceeding 6 g GAE/L (Folin–Ciocalteu method). Maximum extraction yields for phytol (phytol > 40 mg/kg) and neophytadiene (NFD > 20 mg/kg) were obtained in GC-MS analyses using Et, Ipa, and Ac at concentrations exceeding 60 and 100% v/v, respectively. The results obtained confirm the validity of using the C. palustre herb extraction optimization process to obtain extracts with maximum content of polyphenols and terpenoids, such as neophytadiene and phytol, which have significant antioxidant potential. The optimization of the extraction process of this raw material, which has not been subjected to such procedures so far and, as a result, has had limited application in cosmetic preparations, may significantly contribute to increasing interest and wider use of C. palustre in the cosmetics industry.

1. Introduction

Marsh cinquefoil, the utilized common name for C. palustre, is a perennial plant of the rose family (Rosaceae) that grows natively in the temperate climatic zone of the Northern Hemisphere, which includes Europe, Asia, and North America [1]. It is common in Poland to find it in damp and marshy areas, such as along lake beaches, on peat bogs, and in wet meadows. It requires soils that are acidic, damp, and have a lot of peat and clay. In its natural habitat, the plant has long rhizomes that let it reproduce vegetatively, which is why it is a common part of marsh vegetation. The plant usually grows to be 30 to 60 cm tall and has spreading rhizomes from which branches grow above ground. The leaves are odd-pinnate, and the leaflets are oval-shaped and have hairs on the bottom that make them seem silver-gray. The bright purple blooms bloom from June to August, making this plant suitable for use as an adornment in gardens with wet soil [1]. These botanical and ecological characteristics are closely linked to the plant’s rich profile of secondary metabolites, which form the basis of its traditional medicinal use. People in Northern Europe and Asia have utilized the herb in traditional medicine for a long time. Traditionally, infusions made from its rhizomes and aerial portions were used to help with inflammation, rheumatic disorders, joint discomfort, and skin infections [2]. Because it contains tannins, it also has astringent and antibacterial qualities. Recent studies validate that extracts from C. palustre have anti-inflammatory and antioxidant properties, along with potential antidiabetic benefits [3,4,5].
Extracts derived from plant materials provide a significant supply of bioactive chemicals, whose chemical variety dictates a broad spectrum of biological activities, including antioxidant action. Comarum palustre L. is a species that has been used in traditional medicine for a long time. It is a noteworthy plant resource because it has phenolic secondary metabolites and other compounds. The profile includes aliphatic derivatives (alcohols, aldehydes, and carboxylic acids), fatty acids, terpenoids (sesquiterpenes, diterpenoids, ketones, and alcohols), phenylpropanoids, phytosterols, and nitrogen-containing compounds [6,7,8,9]. The existing research unequivocally demonstrates that C. palustre is a raw material unusually abundant in phenolic compounds, chiefly ellagitannins and flavonoids [10]. Olennikov et al. [11] did a thorough investigation on polyphenolic composition, revealing a diverse array of ellagitannins, including agrimoniin, potentillin, pedunculagin (α and β), casuarinin, and sanguiin H-6. The research also found many flavonoids, mostly kaempferol and kaempferol-3-O-rutinoside, and quercetin glycosides such as astragalin, isoquercitrin, rutin, and quercetin-3-O-galactoside. The identification of proanthocyanidins, catechins, and epicatechins expands the phenolic profile of the plant, substantiating its significant antioxidant and anti-inflammatory capabilities. The results indicate that the aqueous and ethanolic extracts of C. palustre contain a complex polyphenolic matrix characteristic of the Rosaceae family [12]. The phytochemical composition undoubtedly contributes to the traditionally recognized medicinal actions of the raw material, particularly its anti-inflammatory and astringent properties [5]. In this context, it is pertinent to reference the foundational botanical and pharmacognostic research of Kashchenko [13], which represents one of the earliest accounts of the composition of raw materials from the genus Potentilla and related taxa in traditional Russian and Siberian phytotherapy. Kashchenko [13] emphasized the importance of tannin components, particularly ellagitannins, as the principal factors influencing the astringent and anti-inflammatory properties of marsh plant raw materials. Although modern experimental techniques are lacking in his study, it provides a substantial historical foundation for future chemical research.
The composition of volatile metabolites in C. palustre is far less studied in the literature compared to its well-characterized polyphenol profile. The most comprehensive data on secondary and primary metabolites are from the research conducted by Strugar et al. [14], who used the GC-MS method and equipment to discover chemicals in both the aerial and subterranean portions of the plant. The authors recorded 933 metabolite signals, of which 120 were clearly recognized. Quantitative research revealed that organic acids and their derivatives (such as citric, malic, and fumaric acids), alcohols, some esters, and simple carbohydrates were predominant. The quantitative analysis revealed high levels of chemicals from the carboxylic acid and sugar categories, but the presence of traditionally recognized volatile compounds (terpenes, monoterpenes, and sesquiterpenes) was negligible or nonexistent [14].
Marsh cinquefoil, the common name for C. palustre, is a perennial plant in the rose family (Rosaceae) that is native to the temperate regions of the Northern Hemisphere, including Europe, Asia, and North America [1]. It is common in Poland to find it in damp and marshy areas, such as along lake beaches, on peat bogs, and in wet meadows. It requires soils that are acidic, damp, and have a lot of peat and clay. In its natural habitat, the plant has long rhizomes that let it reproduce vegetatively, which is why it is a common part of marsh vegetation. The plant usually grows to be 30 to 60 cm tall and has spreading rhizomes from which branches grow above ground. The leaves are odd-pinnate, and the leaflets are oval-shaped and have hairs on the bottom that make them seem silver-gray. The bright purple blooms bloom from June to August, making this plant good for use as an adornment in gardens with wet soil [1]. Traditional methods use infusions made from its rhizomes and aerial portions to help with inflammation, rheumatic disorders, joint discomfort, and skin infections [2]. Because it contains tannins, it also has astringent and antibacterial qualities. Recent studies validate that extracts from C. palustre have anti-inflammatory and antioxidant properties, along with potential antidiabetic benefits [3,4,5].
Ultrasound-assisted extraction (UAE) combined with response surface methodology (RSM) enables process parameter optimization, resulting in maximum recovery of bioactive compounds [15,16]. The literature on the subject indicates that the method of extracting bioactive compounds from plant materials has a significant impact on their content and composition, particularly with regard to polyphenols and flavonoids. Traditional methods, such as maceration or Soxhlet extraction, are usually time-consuming, require large amounts of solvent, and can lead to the degradation of sensitive compounds. Therefore, there is growing interest in assisted techniques such as ultrasonic, microwave, or supercritical CO2 extraction, which increase process efficiency while maintaining the stability of bioactive components [15,16].
Polyphenols present in the tested raw material, especially those containing hydroxyl groups in the aromatic rings, exhibit a strong ability to neutralize reactive oxygen species (ROS) [17]. Their mechanism of action is based primarily on the phenomenon of free radical scavenging and the termination of oxidation chain reactions [18,19]. The presence of phenolic –OH groups allows for easy hydrogen atom transfer, which leads to the conversion of reactive ROS, such as hydroxyl radicals (•OH), peroxyl radicals (ROO•), and singlet oxygen (^1O2), into less reactive forms. As a result of this process, the polyphenol is converted into a phenoxyl radical, which, thanks to the extensive delocalization of the unpaired electron within the aromatic system, is much more stable than typical oxygen radicals [17,20,21]. This delocalization occurs especially in polyphenols containing a system of conjugated bonds and additional electron donor groups (e.g., –OCH3), which further enhances their antioxidant potential [22]. Phenoxy radicals do not initiate further oxidative reactions, thus stopping the propagation of chain reactions. Under certain conditions, they can also dimerize or form more stable oligomeric structures, which enhances the effect of neutralizing oxidative stress. For this reason, polyphenols such as phenolic acids, flavonoids, and flavanols, present in the tested raw material, play a key role in protecting cells from ROS by directly scavenging radicals, stabilizing the resulting phenoxy radicals, interrupting the chain reactions of lipid peroxidation, and regenerating other antioxidants, such as vitamin C [23,24].
The aim of this study was to evaluate the impact and optimize the technological parameters of the C. palustre herb extraction process in order to obtain extracts with high antioxidant activity and maximum content of key secondary metabolites. Using response surface methodology (RSM), the impact of two process variables was analyzed: extraction time and the volume concentration of aqueous solutions of ethanol, isopropanol, and acetone on the properties of the extracts obtained. The optimization was aimed at maximizing antioxidant activity (DPPH, FRAP, ChA), total polyphenol content (TPC), and the extraction yield of selected terpenoids, i.e., neophytadiene and phytol, due to their documented antioxidant properties and potential cosmetic applications.

2. Materials and Methods

2.1. Materials

The plant material (i.e., C. palustre herb) came from the herbal company Dary Natury (Zielony Zakątek, Grodzisk, Poland). The plant materials obtained were stored in sealed containers at room temperature in a darkened place at the Pomeranian Medical University (Szczecin, Poland).

2.2. Chemicals

6-Hydroxy-2,5,7,8-tetramethylchroman-2-carboxylic acid (Trolox, Tx), 2,2-diphenyl-1-picrylhydrazyl (DPPH), and 2,4,6-tripyridyl-s-triazine (TPTZ) were purchased from Sigma-Aldrich (Merck Group, St. Louis, MO, USA). Acetone, ethyl alcohol, and isopropyl alcohol were obtained from Chempur (Piekary Śląskie, Poland). The Folin–Ciocalteu reagent was supplied by Merck (Darmstadt, Germany). Iron(II) sulfate heptahydrate, iron(II) sulfate(VI), ferrozine, iron(III) chloride, and gallic acid were obtained from Merck (Darmstadt, Germany). Chempur (Piekary Śląskie, Poland) supplied n-octanol, octane, dipotassium hydrogen phosphate, sodium phosphate dibasic dihydrate, barium hydroxide, magnesium(II) sulfate heptahydrate, orthophosphoric acid, potassium hydroxide, sodium hydroxide, iron(III) chloride hexahydrate, ammonium chloride, calcium chloride dihydrate, potassium dihydrogen phosphate, methanol, and 96% ethanol. Thermo Scientific (Białystok, Poland) provided AAPH (2,2′-azobis(2-methylpropionamidine) dichlorohydrate, 98%), while fluorescein sodium salt was obtained from Angene (Białystok, Poland). All reagents were of analytical grade.

2.3. Obtaining C. palustre Extract

C. palustre herb was subjected to granulometric standardization prior to extraction. The material was sieved using a laboratory analytical sieve to obtain a fraction with a particle size of <250 μm. In subsequent stages of the research, only the fine-grained fraction was used, which resulted in an increase in the contact area between the material and the solvent and an increase in the efficiency of the extraction process. The extracts were prepared using three solvents: isopropanol, ethanol, and acetone. 5 g of raw material was weighed into each conical flask, followed by the addition of 100 g of solvent. The flasks were then placed in an FSF-031S ultrasonic bath (ChemLand, Stargard, Poland). Ultrasound-assisted extraction was performed at a nominal frequency of 40 kHz for three different durations, 2, 4, and 10 min, to evaluate the effect of cavitation time on the efficiency of the process. After sonication, the extracts were immediately centrifuged in an MPW-260R laboratory centrifuge (MPW Med. Instruments, Warszawa, Poland), which allowed for effective separation of the plant sediment and obtaining clear solutions. The extract was then poured into tightly sealed test tubes. The samples were stored in conditions of limited light exposure, at room temperature, until further phytochemical analyses and activity determinations were performed.

2.4. GC–MS Analysis of C. palustre Extract

The extraction efficiency of C. palustre herb in terms of neophytadiene (NFD yield) and phytol (phytol yield) was assessed using gas chromatography coupled with mass spectrometry (GC-MS), using a Shimadzu GC-MS-QP2020 NX (Shimadzu, San Jose, CA, USA) equipped with a Shimadzu SH-I-5MS column (30 m × 0.25 mm × 0.25 μm) [25]. Details of the method are described in Supplement S1.1. It was assumed that the detector response to phytol and 1-octanol, as well as to neophytadiene and cetane, is comparable [26,27]. Quantitative analysis was performed by adding 1-octanol and cetane as internal standards to the extracts, using their known concentrations in the range of 2 to 10 mg/L. The identification of neophytadiene and phytol was performed by comparing the recorded mass spectra with data contained in the NIST 2020 library.
The determination was carried out as (1):
C p h y t o l   = C 1 - o c t a n o l   · S p h y t o l     S 1 - o c t a n o l   C n e o p h y t a d i e n e = C c e t a n e   · S n e o p h y t a d i e n e   S c e t a n e  
where
Cphytol—phytol concentration [mg/L],
Cneophytadiene—neophytadiene concentration [mg/L],
C1-octanol—1-octanol concentration [mg/L],
Ccetane—cetane concentration [mg/L],
Sphytol—surface area of phytol,
Sneophytadiene—surface area of neophytadiene,
S1-octanol—surface area of 1-octanol,
Scetane—surface area of cetane.

2.5. Determination of Antioxidant Activity Using the DPPH Method

The antioxidant capacity of C. palustre extracts was assessed using the DPPH (2,2-diphenyl-1-picrylhydrazyl) free radical reduction method [28]. The measurement was performed using a Thermo Scientific GENESYS 50 spectrophotometer (Thermo Fisher Scientific Inc., Waltham, MA, USA) at a wavelength of λ = 517 nm. Details of the method are described in Supplement S1.2. Trolox was used as the reference compound. The antioxidant activity results are given in mg Tx/L, calculated based on the calibration curve: y = −1.0321x + 1.1342, R2 = 0.997.

2.6. Determination of Antioxidant Activity Using the FRAP Method

The reducing capacity of iron ions was assessed using the FRAP (Ferric Reducing Antioxidant Power) test, which measures the ability of antioxidants to reduce Fe3+ ions to Fe2+ in the presence of the complexing reagent TPTZ (2,4,6-tripyridyl-s-triazine) [28]. A full description of the procedure can be found in Supplement S1.3. The ability of extracts to reduce Fe3+ ions to Fe2+, determined by the FRAP method, is presented as the concentration of Fe2+ in millimoles per liter of extract (mmol Fe2+/L). Prior to FRAP analysis, extracts were diluted to ensure that the concentration of reduced Fe2+ ions did not exceed the stoichiometric limit of the FRAP reagent. This guaranteed that the measurement remained within the linear range and that the Fe3+ to Fe2+ reduction was not constrained by reagent depletion.

2.7. Determination of Total Polyphenol Content Using the Folin–Ciocalteu Method

The total polyphenol content (TPC) in extracts was determined using the Folin–Ciocalteu method, employing a GENESYS 50 spectrophotometer (Thermo Scientific) at a wavelength of λ = 750 nm, with gallic acid as the reference compound [29]. A detailed description of the procedure can be found in Supplement S1.4. The results are given in g GAE/L of extract, based on the calibration curve: y = 0.0075x, R2 = 0.997.

2.8. Evaluation of Fe2+ Ion Chelating Activity

The Fe2+-chelating capacity of the extracts was evaluated using the ferrozine assay as described previously [24]. Heavy metal ions, including divalent iron, are known to initiate undesirable oxidation processes involving lipids and polyphenols, leading to deterioration of product quality and accelerated degradation of active constituents in formulations. Extracts exhibiting chelating activity are capable of binding these metal ions, thereby improving formulation stability by limiting metal-catalyzed oxidative reactions.
Since metal ions interact with components present in cosmetic formulations and may accelerate their degradation, extracts capable of chelating Fe2+ act as protective chelators. By reducing the pool of free catalytic metal ions, they help maintain the chemical stability of active compounds and prevent the formation of reactive oxygen species, a key mechanism contributing to oxidative damage [30,31]. The detailed analytical procedure applied in this study is provided in Supplement S1.5.
The chelating activity (ChA) of Fe2+ ions was calculated using the following Formula (2):
C h A = C F e 2 + r . s .   C F e 2 + t . s .   ·   V s   V E  
where
ChA—chelating activity of Fe2+ [mg/L],
CFe2+r.s.—concentration of Fe2+ ions in the reference sample [mg/L],
CFe2+t.s.—concentration of Fe2+ ions in the tested sample [mg/L],
Vs—total volume of solution introduced into volumetric flasks [L],
VE—volume of extract introduced into volumetric flasks [L].
The ability to chelate Fe2+ ions, determined using the ferrozine method, was expressed as the concentration of Fe2+ in milligrams per liter of extract (mg Fe2+/L).

2.9. Optimization of C. palustre Extraction Using Response Surface Methodology

Mathematical optimization of the C. palustre herb extraction process using ultrasound-assisted methods was performed using a central composite design (CCD) [32]. In order to obtain the most precise mathematical description of the C. palustre herb extraction process, the following technological parameters were taken into account: extraction time (2–10 min) and volume concentration of aqueous solvent solutions: acetone (Ac), ethanol (Et), and isopropanol (Ipa) in the range of 20–100% v/v, with a constant plant material content of 5 g/100 mL. The tests were carried out for three solvents that are highly miscible with water: acetone, ethanol, and isopropanol [33]. Actual input values were used for the calculations. Preliminary experiments performed using the one-factor-at-a-time (OFAT) method demonstrated that these parameters—extraction time and the volumetric concentrations of aqueous solutions of ethanol, isopropanol, and acetone—exerted the most statistically significant effects on antioxidant activity, total phenolic content (TPC), and terpenoid yield. The initial range of solvent concentrations (20–100% v/v) was prepared as a series of dilutions. From this range, three representative concentrations were selected for the experimental design: 20%, 60%, and 100% v/v. These concentrations reflect low, intermediate, and high proportions of organic solvent in the extraction mixture.
Based on the experimental results, a significance analysis was performed, and response surface regression functions describing the extraction process of C. palustre herb were determined. Based on the obtained regression models, the optimal parameters of this process were determined. The ranges of variability of the input variables were as follows: X1 (t, extraction time): 2–10 min and X2 (volume concentration of aqueous solvent solutions: acetone, ethanol, isopropanol): 20–100% v/v. At this stage of the study, the optimal range of concentrations of the tested solvents and the extraction time were determined.
The main surface response functions describing the extraction process of C. palustre herb included antioxidant activity (assessed based on the ability to neutralize free radicals using the DPPH method and reduce Fe3+ ions using the FRAP method), chelating activity (determined by the ability to bind Fe2+ ions using the ferrozine method), total polyphenol content (TPC, determined using the Folin–Ciocalteu method), and the extraction yield of neophytadiene (NFD) and phytol, analyzed using GC-MS. Contour plots were prepared using Statistica 13.3 PL software (StatSoft, Krakow, Poland), which was then used for further analysis.
The analysis of the obtained response surface models demonstrated that solvent solutions at 50% v/v provided the most efficient extraction conditions across the antioxidant activity, chelating activity, total polyphenol content, and the extraction yield of neophytadiene (NFD) and phytol. Therefore, 50% v/v was selected as the optimal extraction concentration for subsequent antioxidant assays.
Multiple regression analysis was used to determine the regression model describing the impact of individual independent variables on the extraction process responses. This method made it possible to determine the significance of individual factors and their interactions, as well as to determine regression equations describing the response surfaces [34]. Statistical analyses were performed on data expressed using actual (non-coded) factor values, which enabled direct interpretation of the impact of individual process variables on model responses.
The influence of normalized independent factors (Xi, Xj) of the C. palustre herb extraction process on the value of the response function (Yi) was presented using a second-degree algebraic polynomial (3):
  Y i = a 0 + i = 1 n a i 1 · X i + i = 1 n a i 2 · X i 2 + i = 1 n 1 j = i + 1 n a i j · X i · X j
where
Xi—extraction time, t (1); volumetric concentration of aqueous solvent solutions: acetone (Ac), ethanol (Et), and isopropanol (Ipa), VCASS (2);
ai—regression coefficients;
Y1—antioxidant activity, DPPH (1);
Y2—antioxidant activity, FRAP (2);
Y3—chelating activity, ChA (3);
Y4—total polyphenol content, TPC (4);
Y5—extraction yield relative to neophytadiene, NFD yield (5);
Y6—extraction yield relative to phytol, phytol yield (6).
The regression coefficients of the polynomial model were estimated using the least-squares method with matrix calculus, based on normalized input variables. Because the experimental design did not include replicated center points, pure experimental error could not be determined. Consequently, the reported mean square error (MS) reflects the residual variance of the fitted regression model.
To evaluate extraction efficiency, experiments were performed under the previously optimized conditions using a solvent concentration of 50% v/v. Four raw-material concentrations were tested: 0.5, 1, 2, and 5 g/100 mL. The relationship between total polyphenol content (TPC) and raw-material concentration (Z) was described using Equation (4):
T P C = T P C m a x · K · Z 1 + K · Z
where
TPCmax—maximum TPC concentration in the extract [mmol/L],
K—extraction equilibrium constant [L/g],
Z—concentration of the material undergoing extraction [g/L].
The course of the fitted curves, defining the TPC yield according to Equation (4), shows the relationship between the solvent concentration and the efficiency of polyphenol extraction (5):
U = T P C Z
Equations (4) and (5) show that (6):
T P C = T P C m a x · K 1 + K · Z
Substituting Z = 0 into Equation (6) allows the maximum TPC yield for the respective solvent to be calculated.

2.10. Statistical Analysis

Using the least squares method with matrix calculus, regression coefficients were determined for normalized input variables. A central composite design (CCD) was prepared to optimize the C. palustre process. Contour plots and an experimental design were created using Statistica 13.3 PL software 7 (StatSoft, Krakow, Poland). A one-way analysis of variance (ANOVA) was used for statistical analysis of the optimization process. The ANOVA test was used to check the adequacy of the tested function. The results are presented as mean ± standard deviation (SD). Statistical calculations were performed using Statistica 13.3 PL software 7 (StatSoft, Krakow, Poland).

3. Results

3.1. Experimental Results and Regression Model Analysis

The regression coefficients (a0–a5) and the model quality indicators (R2, AdjR2, MS) for all analyzed responses (DPPH, FRAP, ChA, TPC, NFD yield, phytol yield) are presented in Table 1. The models were fitted separately for each solvent (ethanol, isopropanol, acetone). Table 1 summarizes the regression coefficients along with the correlation coefficient of the surface area relative to the experimental points.
Table 1 presents the regression equation coefficients (a0–a5) and the model quality parameters for the analyzed responses—DPPH, FRAP, ChA, TPC, NFD yield, and phytol yield—obtained for each solvent (ethanol, isopropanol, and acetone). The regression models show good numerical fit to the experimental data points; however, due to the absence of replicated center points, their predictive reliability cannot be fully evaluated. The adjusted coefficients (AdjR2) vary considerably among the responses and solvents, showing both moderate and very high values, which reflects the differing complexity and variability of each response. The best model performance was observed for NFD yield and phytol yield (R2 > 0.995), as well as for TPC and FRAP (R2 > 0.97), indicating strong predictive accuracy for these responses. The mean square error (MS) values were lowest for the FRAP and TPC models (0.00826–6.93), confirming their stability in describing the influence of extraction time and solvent concentration. It should be noted that, due to the absence of replicated center points in the experimental design, the MS values represent model residuals and not pure experimental error.
Table 2 presents experimental design along with the results of individual experiments.

3.2. Effect of Solvent Concentration and Extraction Time

Table 3 presents the extreme values of independent variables (extraction time and volume concentrations of aqueous solvent solutions: acetone, ethanol, and isopropanol) and the corresponding response values—DPPH, FRAP, ChA, TPC, NFD yield, and phytol yield—determined for the extraction process of C. palustre using ethanol, isopropanol, and acetone as extractants.
Table 3 presents the extreme values of the independent variables—extraction time and the volume concentration of aqueous solvent solutions (VCASS)—together with the corresponding response values obtained for the extraction of C. palustre using ethanol (Et), isopropanol (Ipa), and acetone (Ac). The analyzed responses include antioxidant activity indices (DPPH, FRAP, ChA), total polyphenol content (TPC), as well as neophytadiene (NFD yield) and phytol yield. For each solvent, the extraction time (min) and VCASS (% v/v) at which the extreme response values were observed are provided.
The responses did not follow a uniform trend across all parameters. For the antioxidant and polyphenol responses (DPPH, FRAP, ChA, TPC), the function values exhibited a non-monotonic behavior with clear maxima at approximately 50% v/v of Et, Ipa, and Ac. In contrast, the lipophilic responses (NFD and phytol yield) showed a monotonic increase with increasing solvent concentration, with the highest values occurring at the upper end of the tested range. The results clearly confirm the significant influence of both the type of solvent and the extraction conditions on the properties of the obtained extracts, which emphasizes the need to adapt the process to the expected antioxidant activity, polyphenol content, and extraction yield towards neophytadiene and phytol (strongly lipophilic compounds with a log p value exceeding 7) (Table 3).
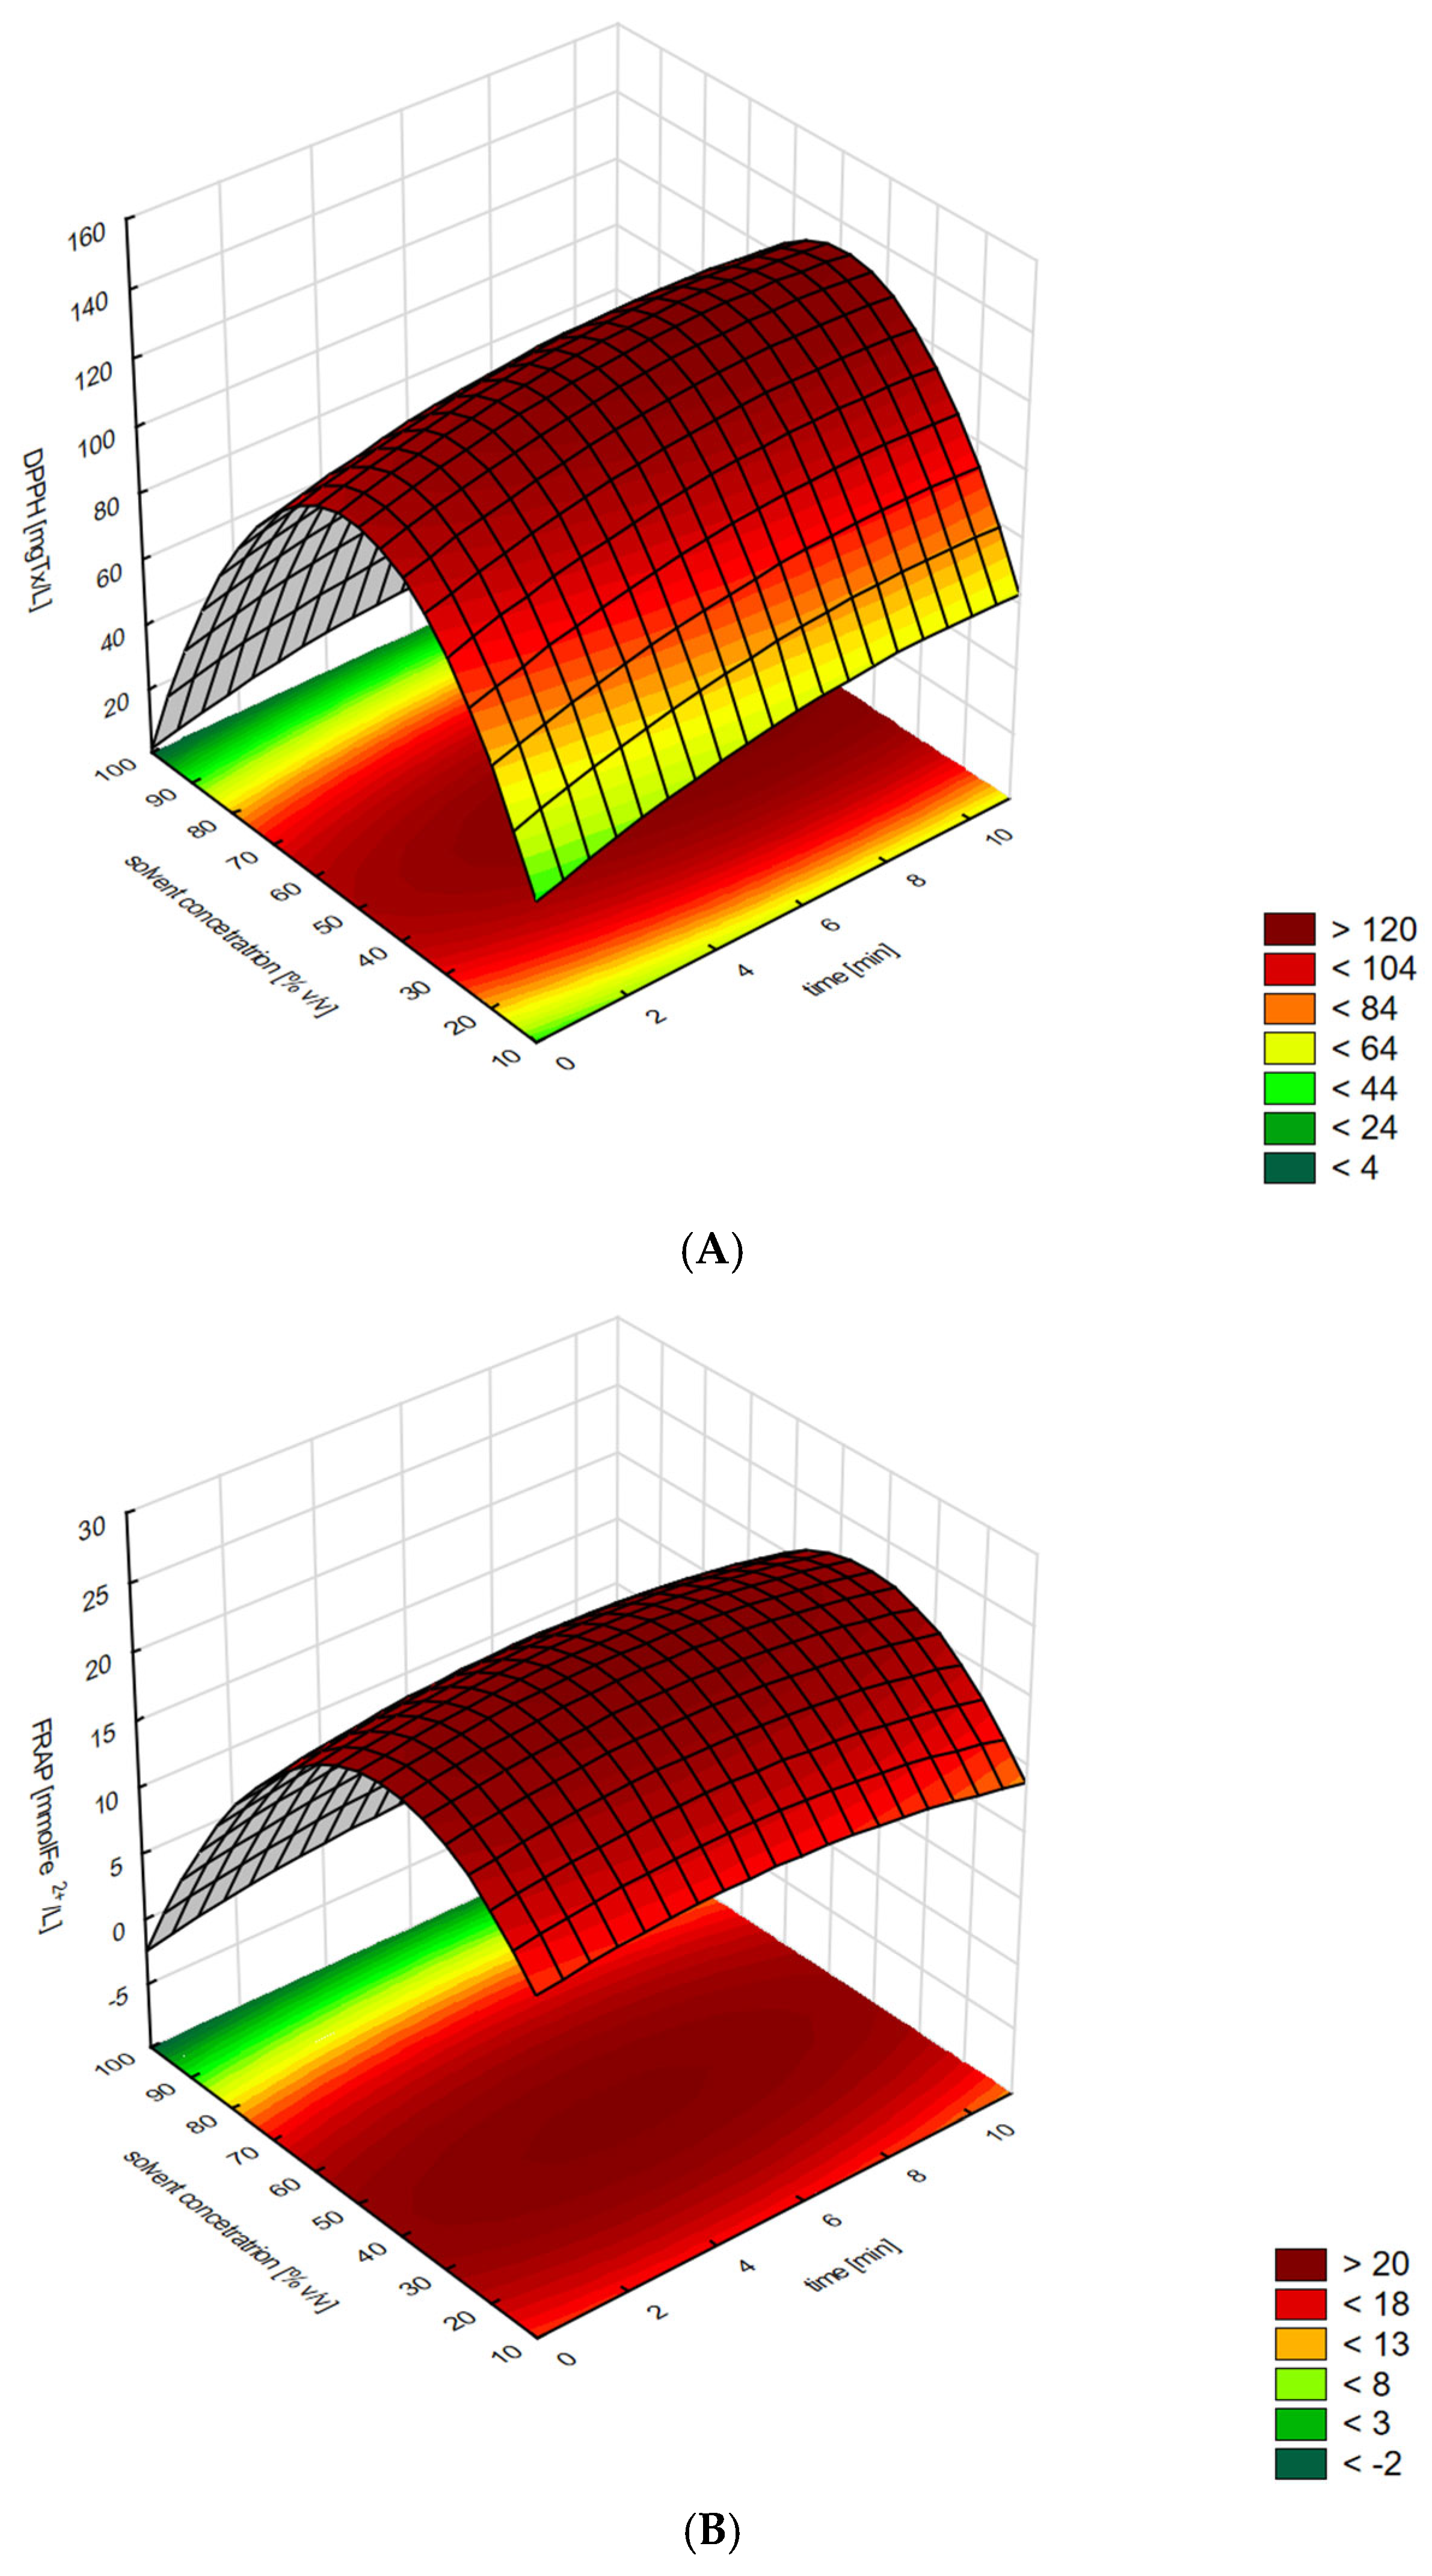
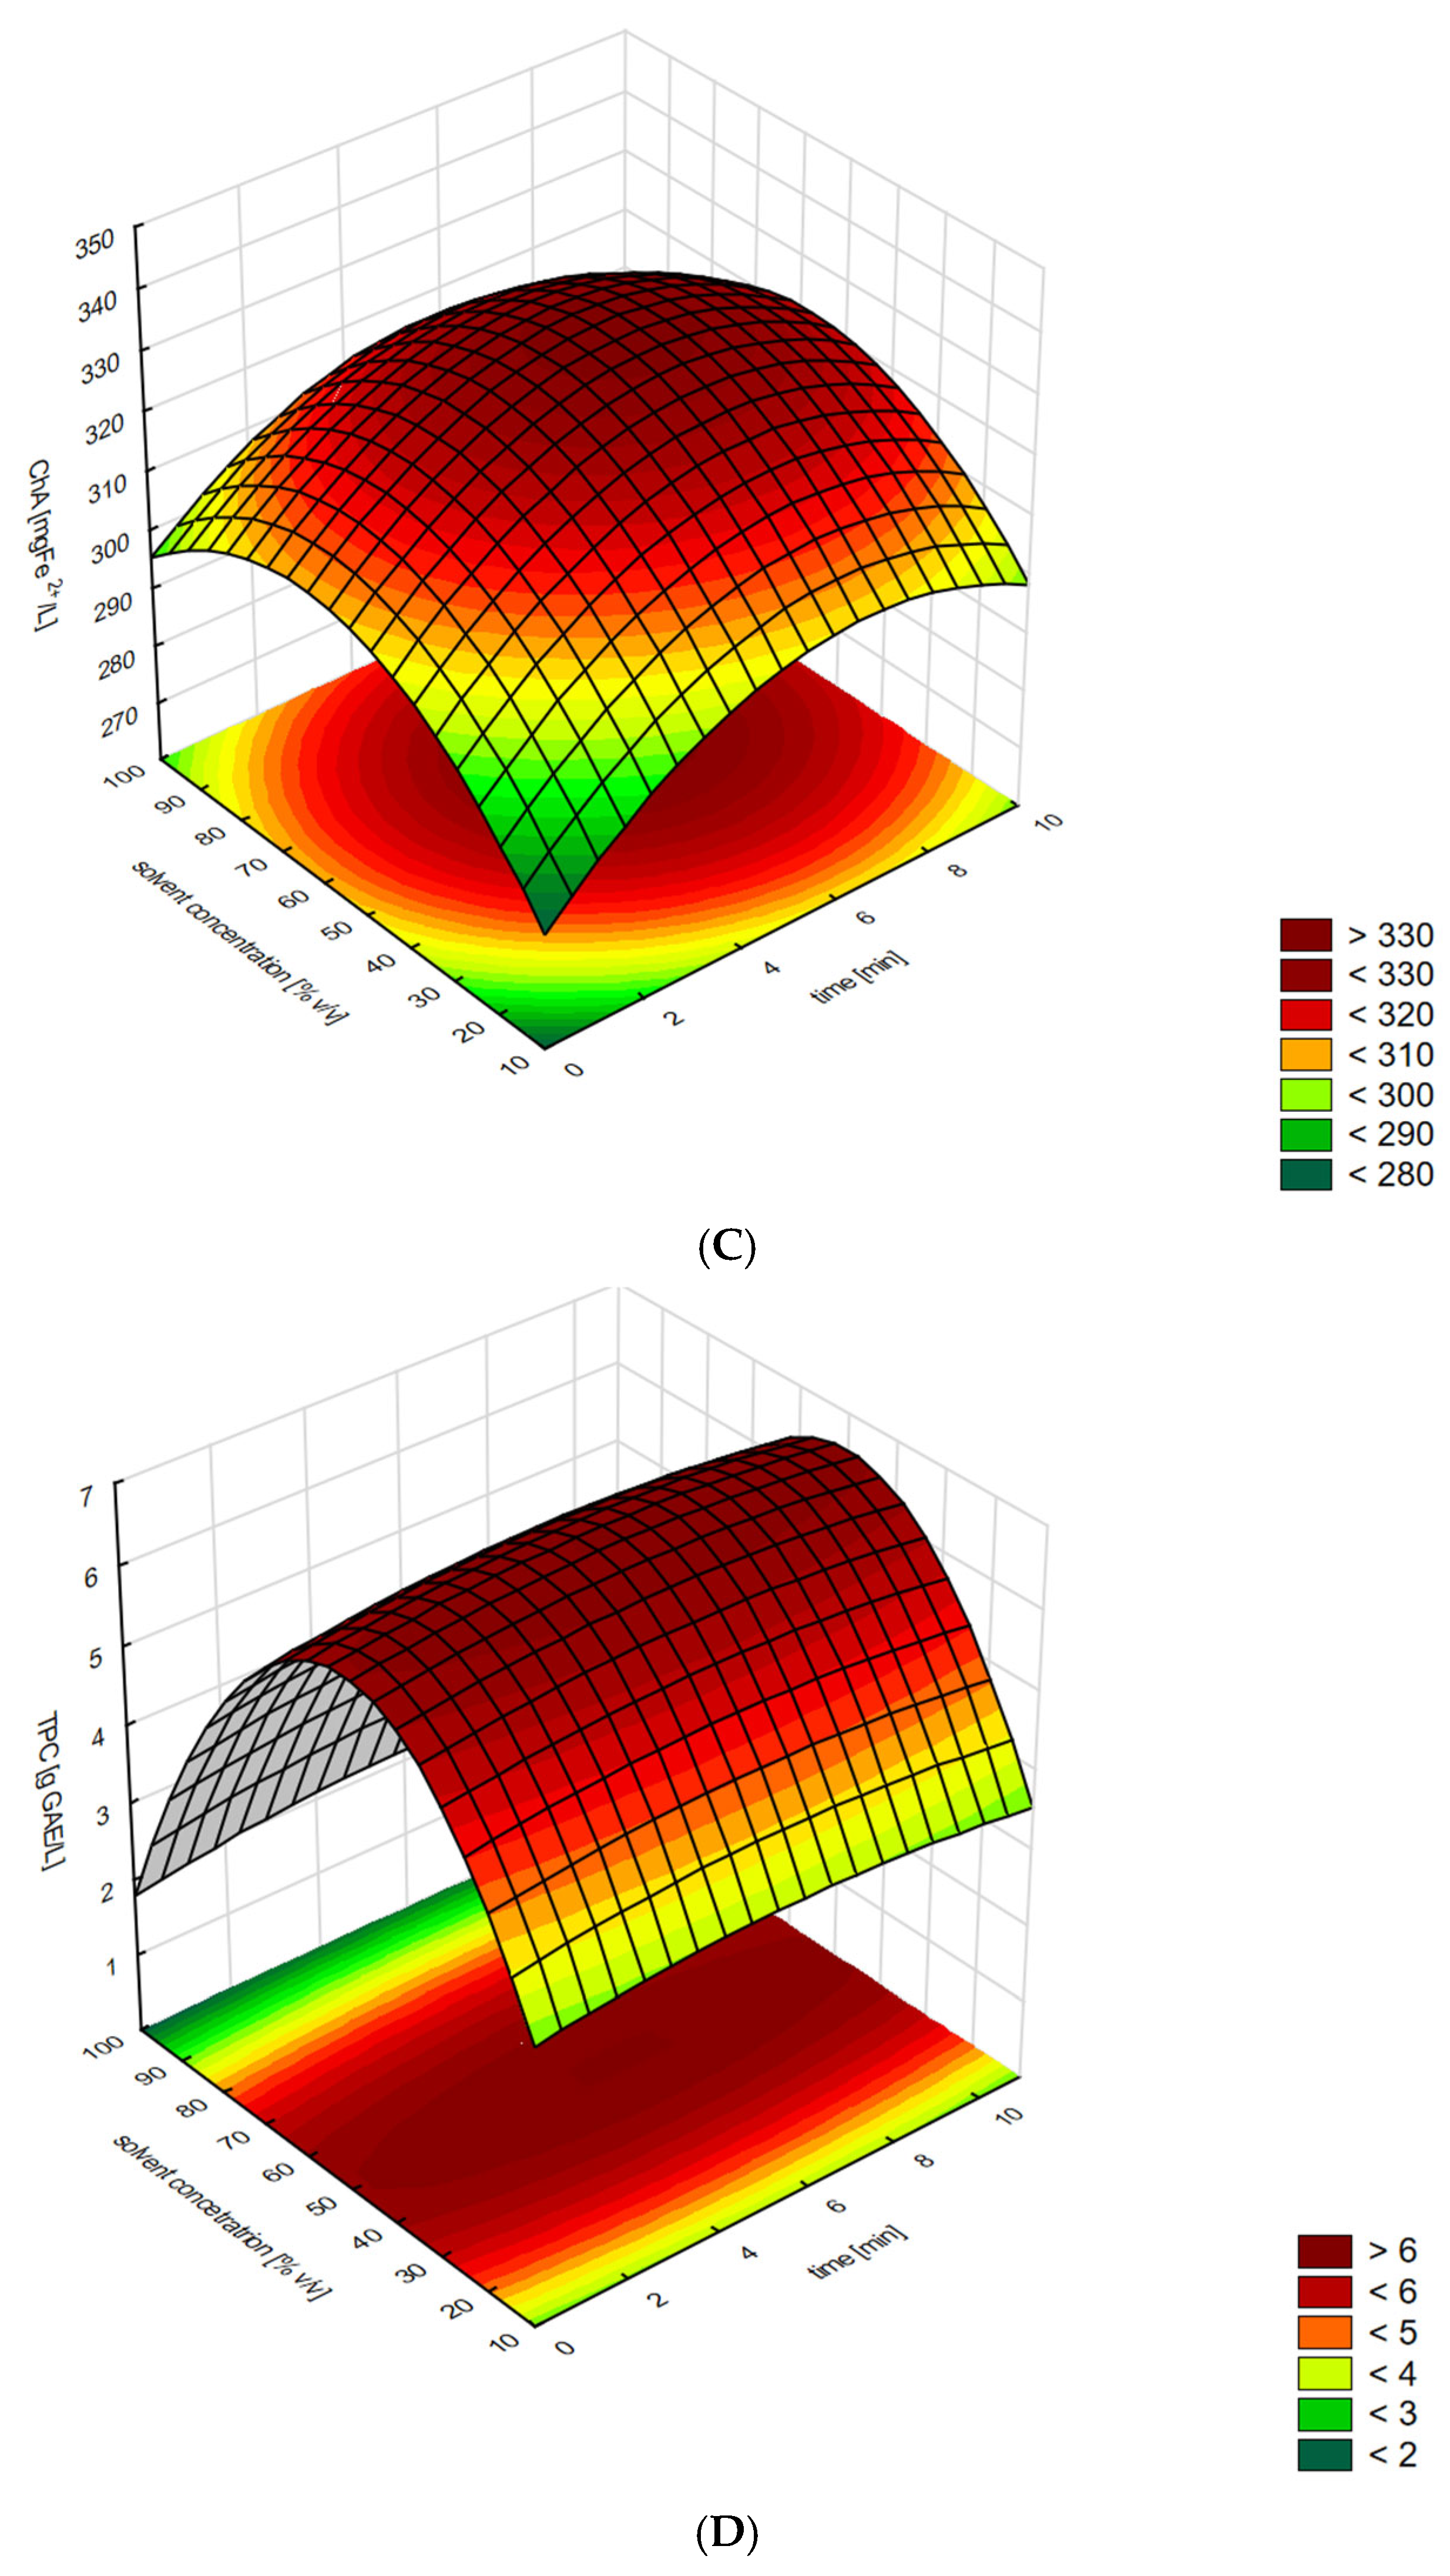
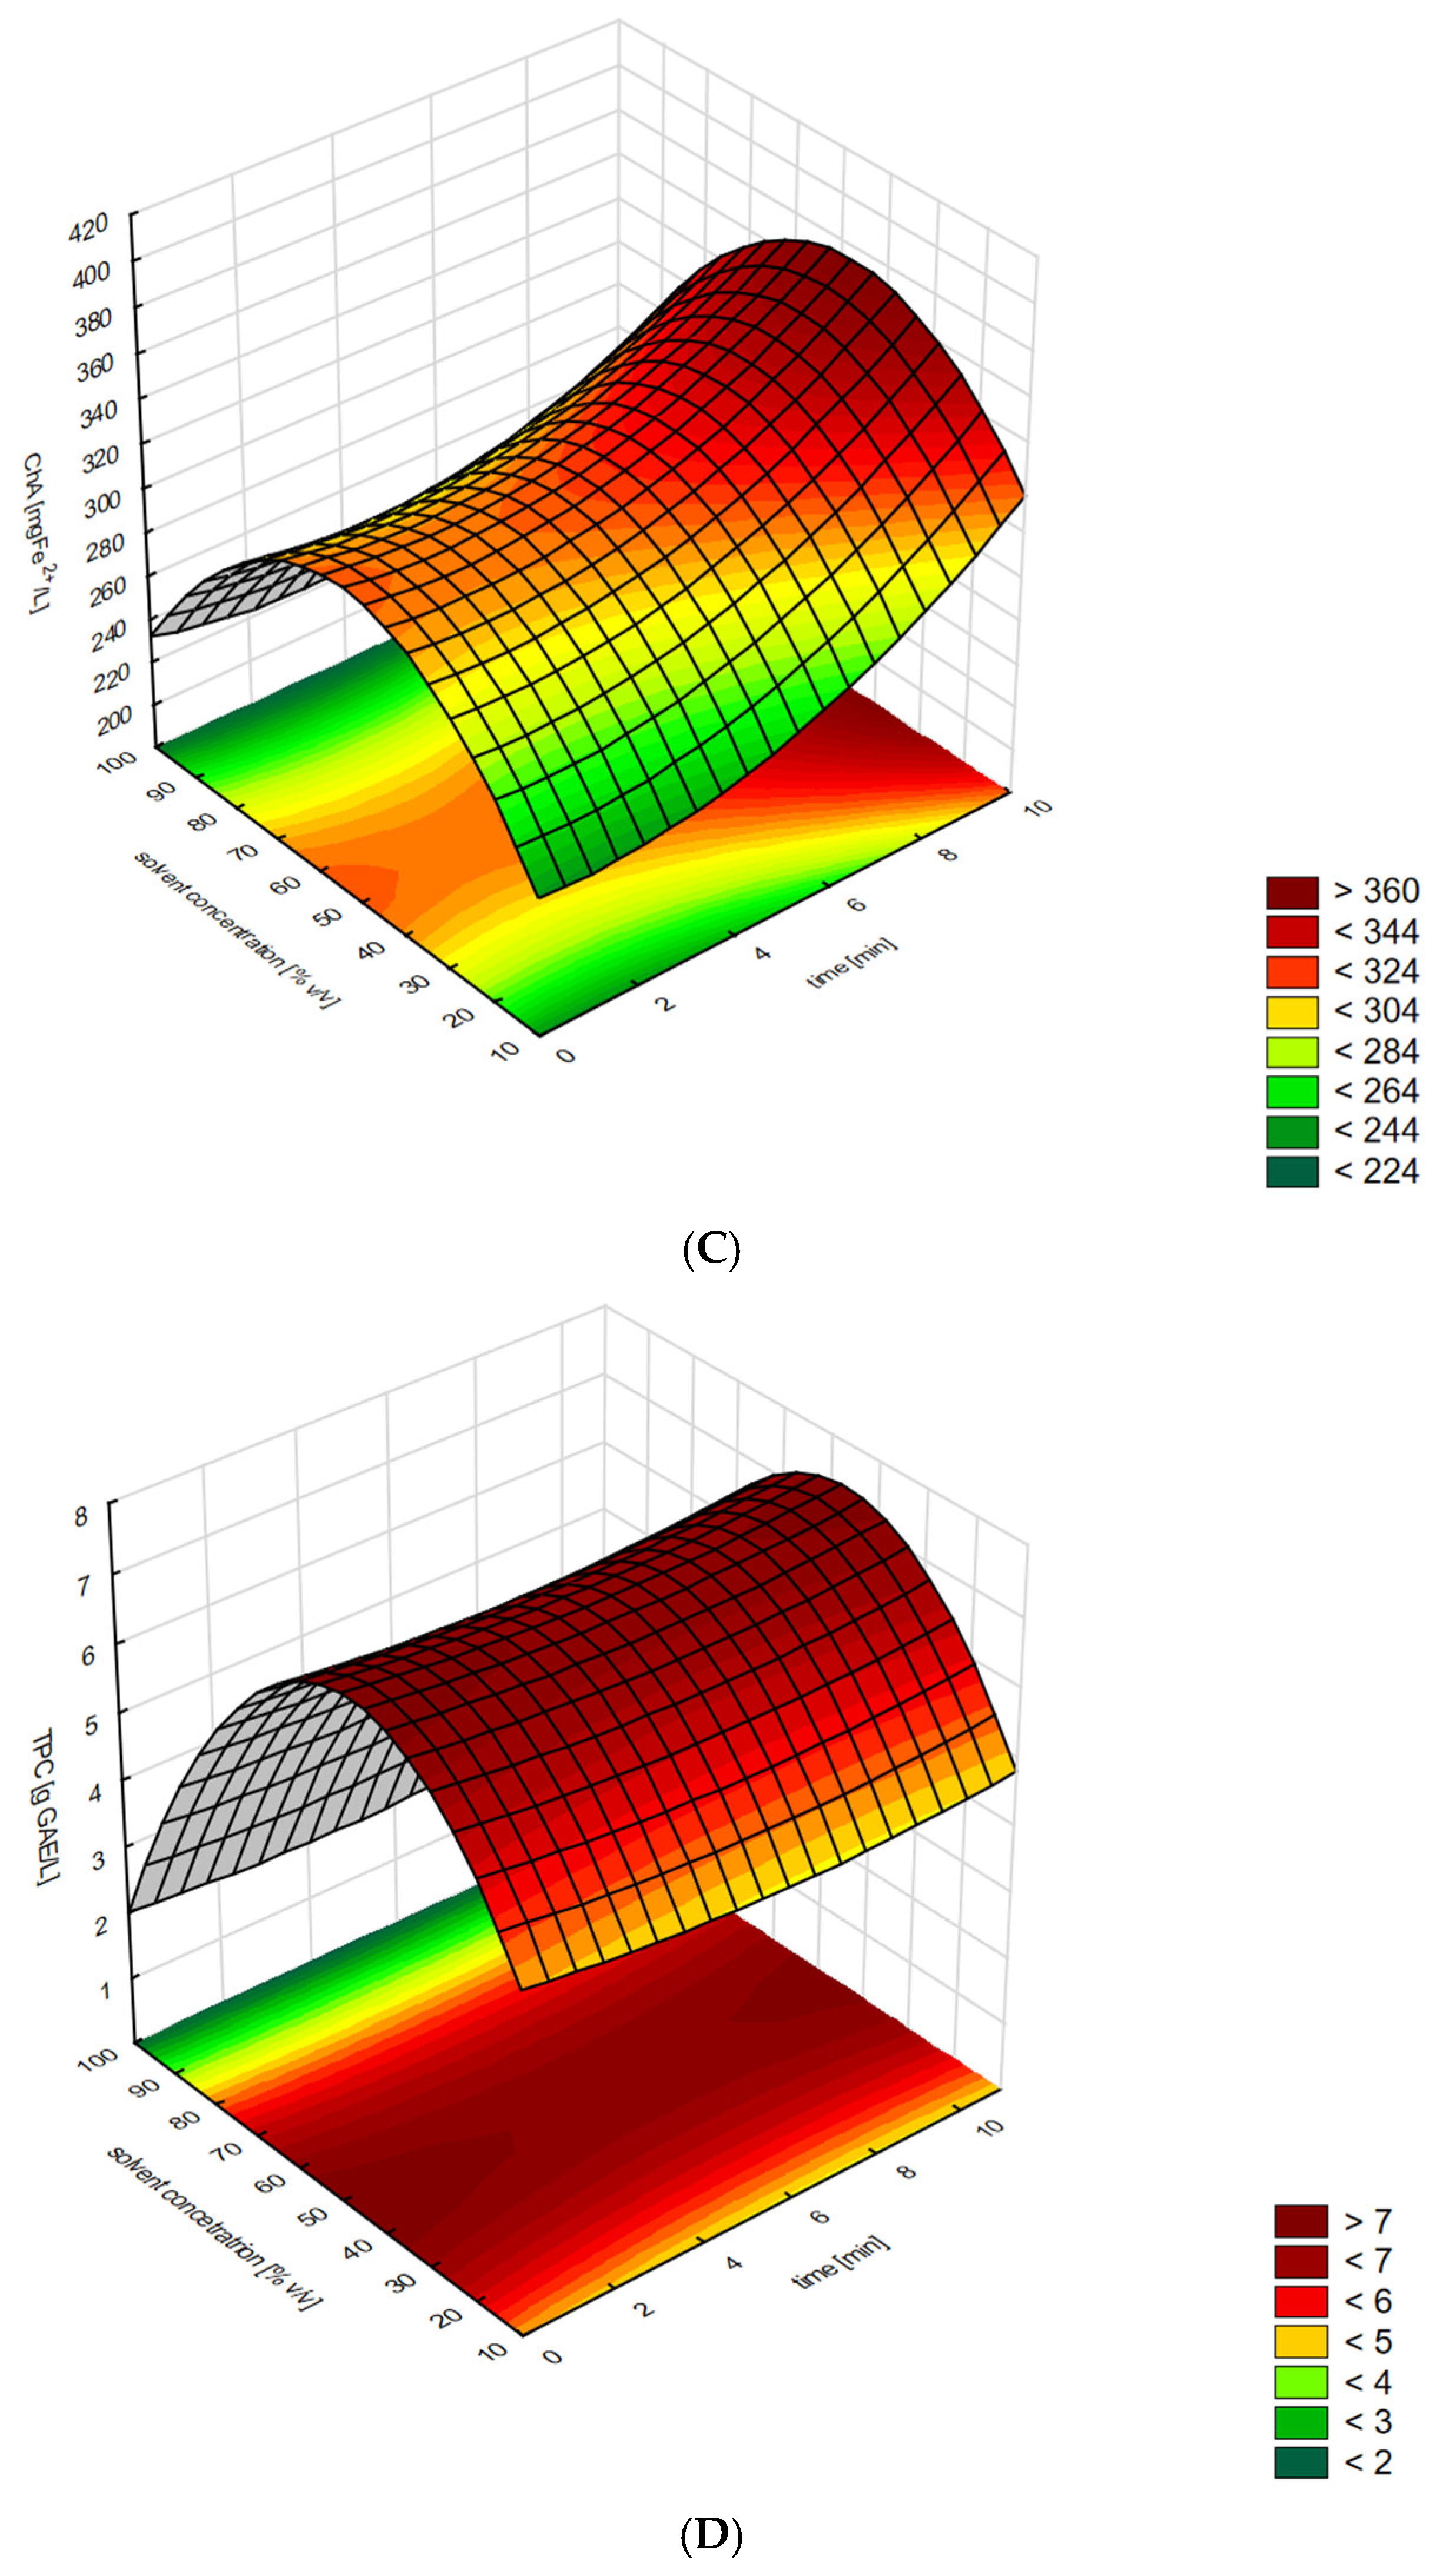
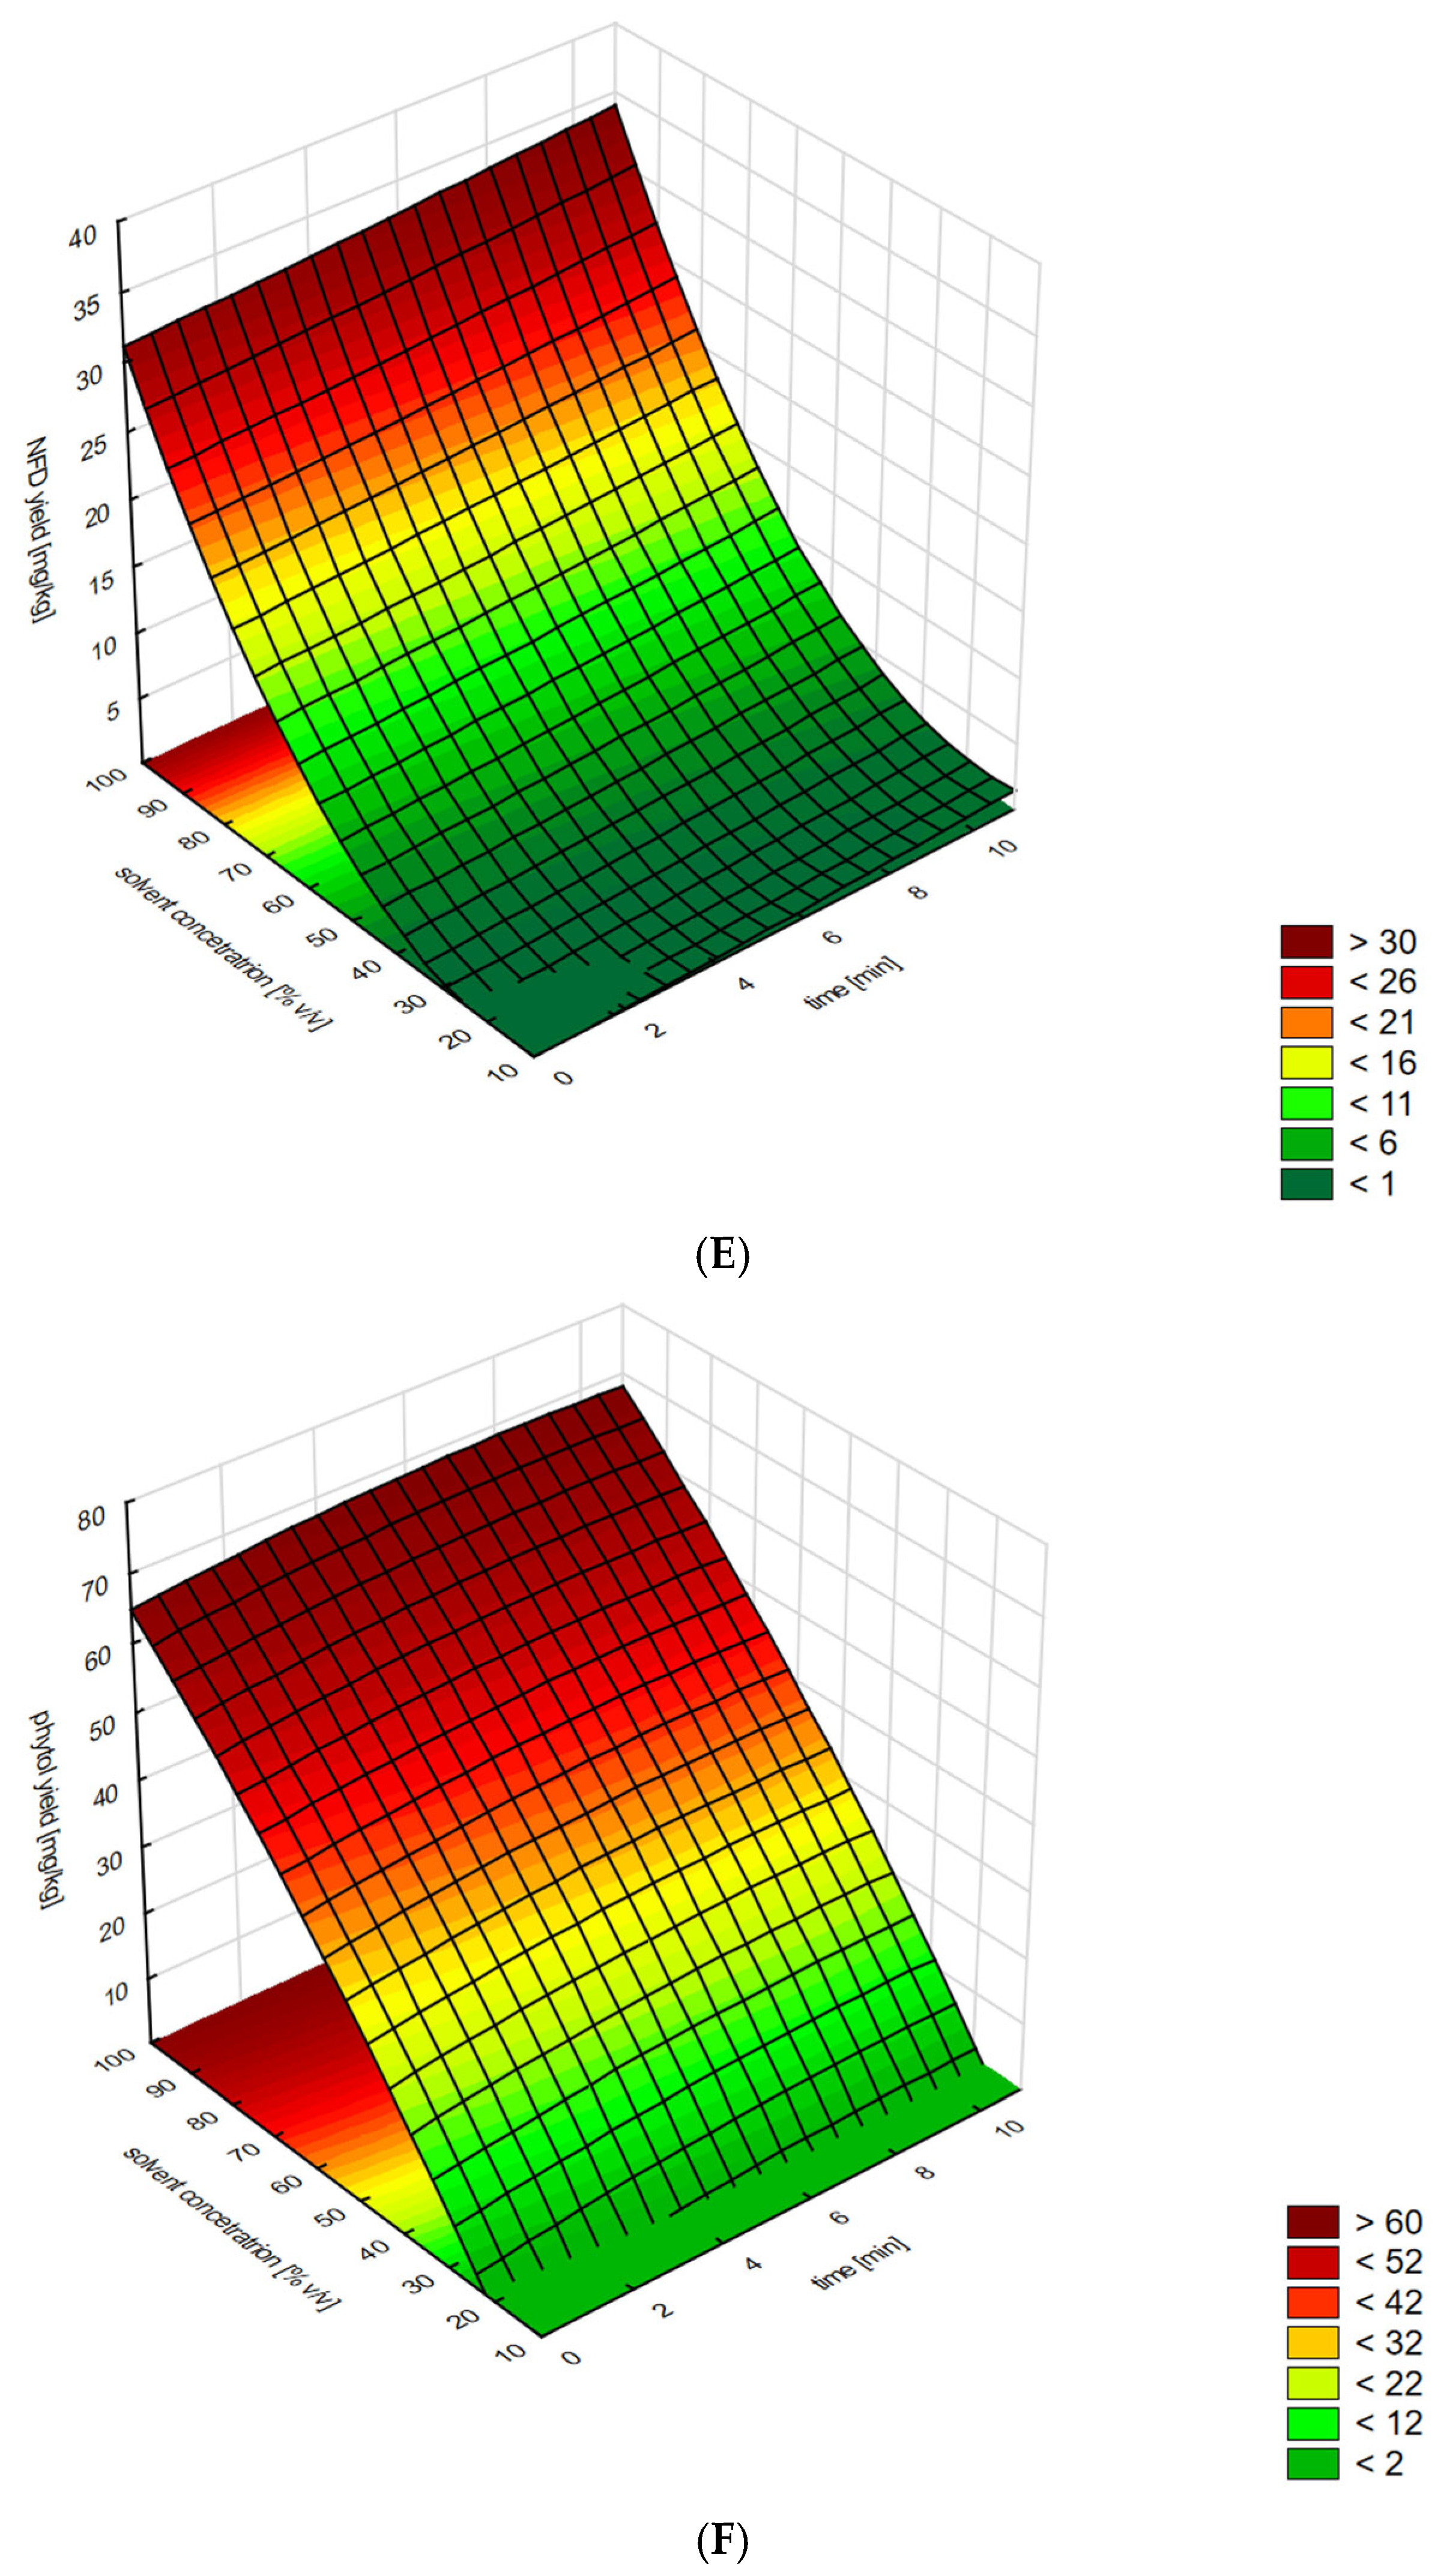
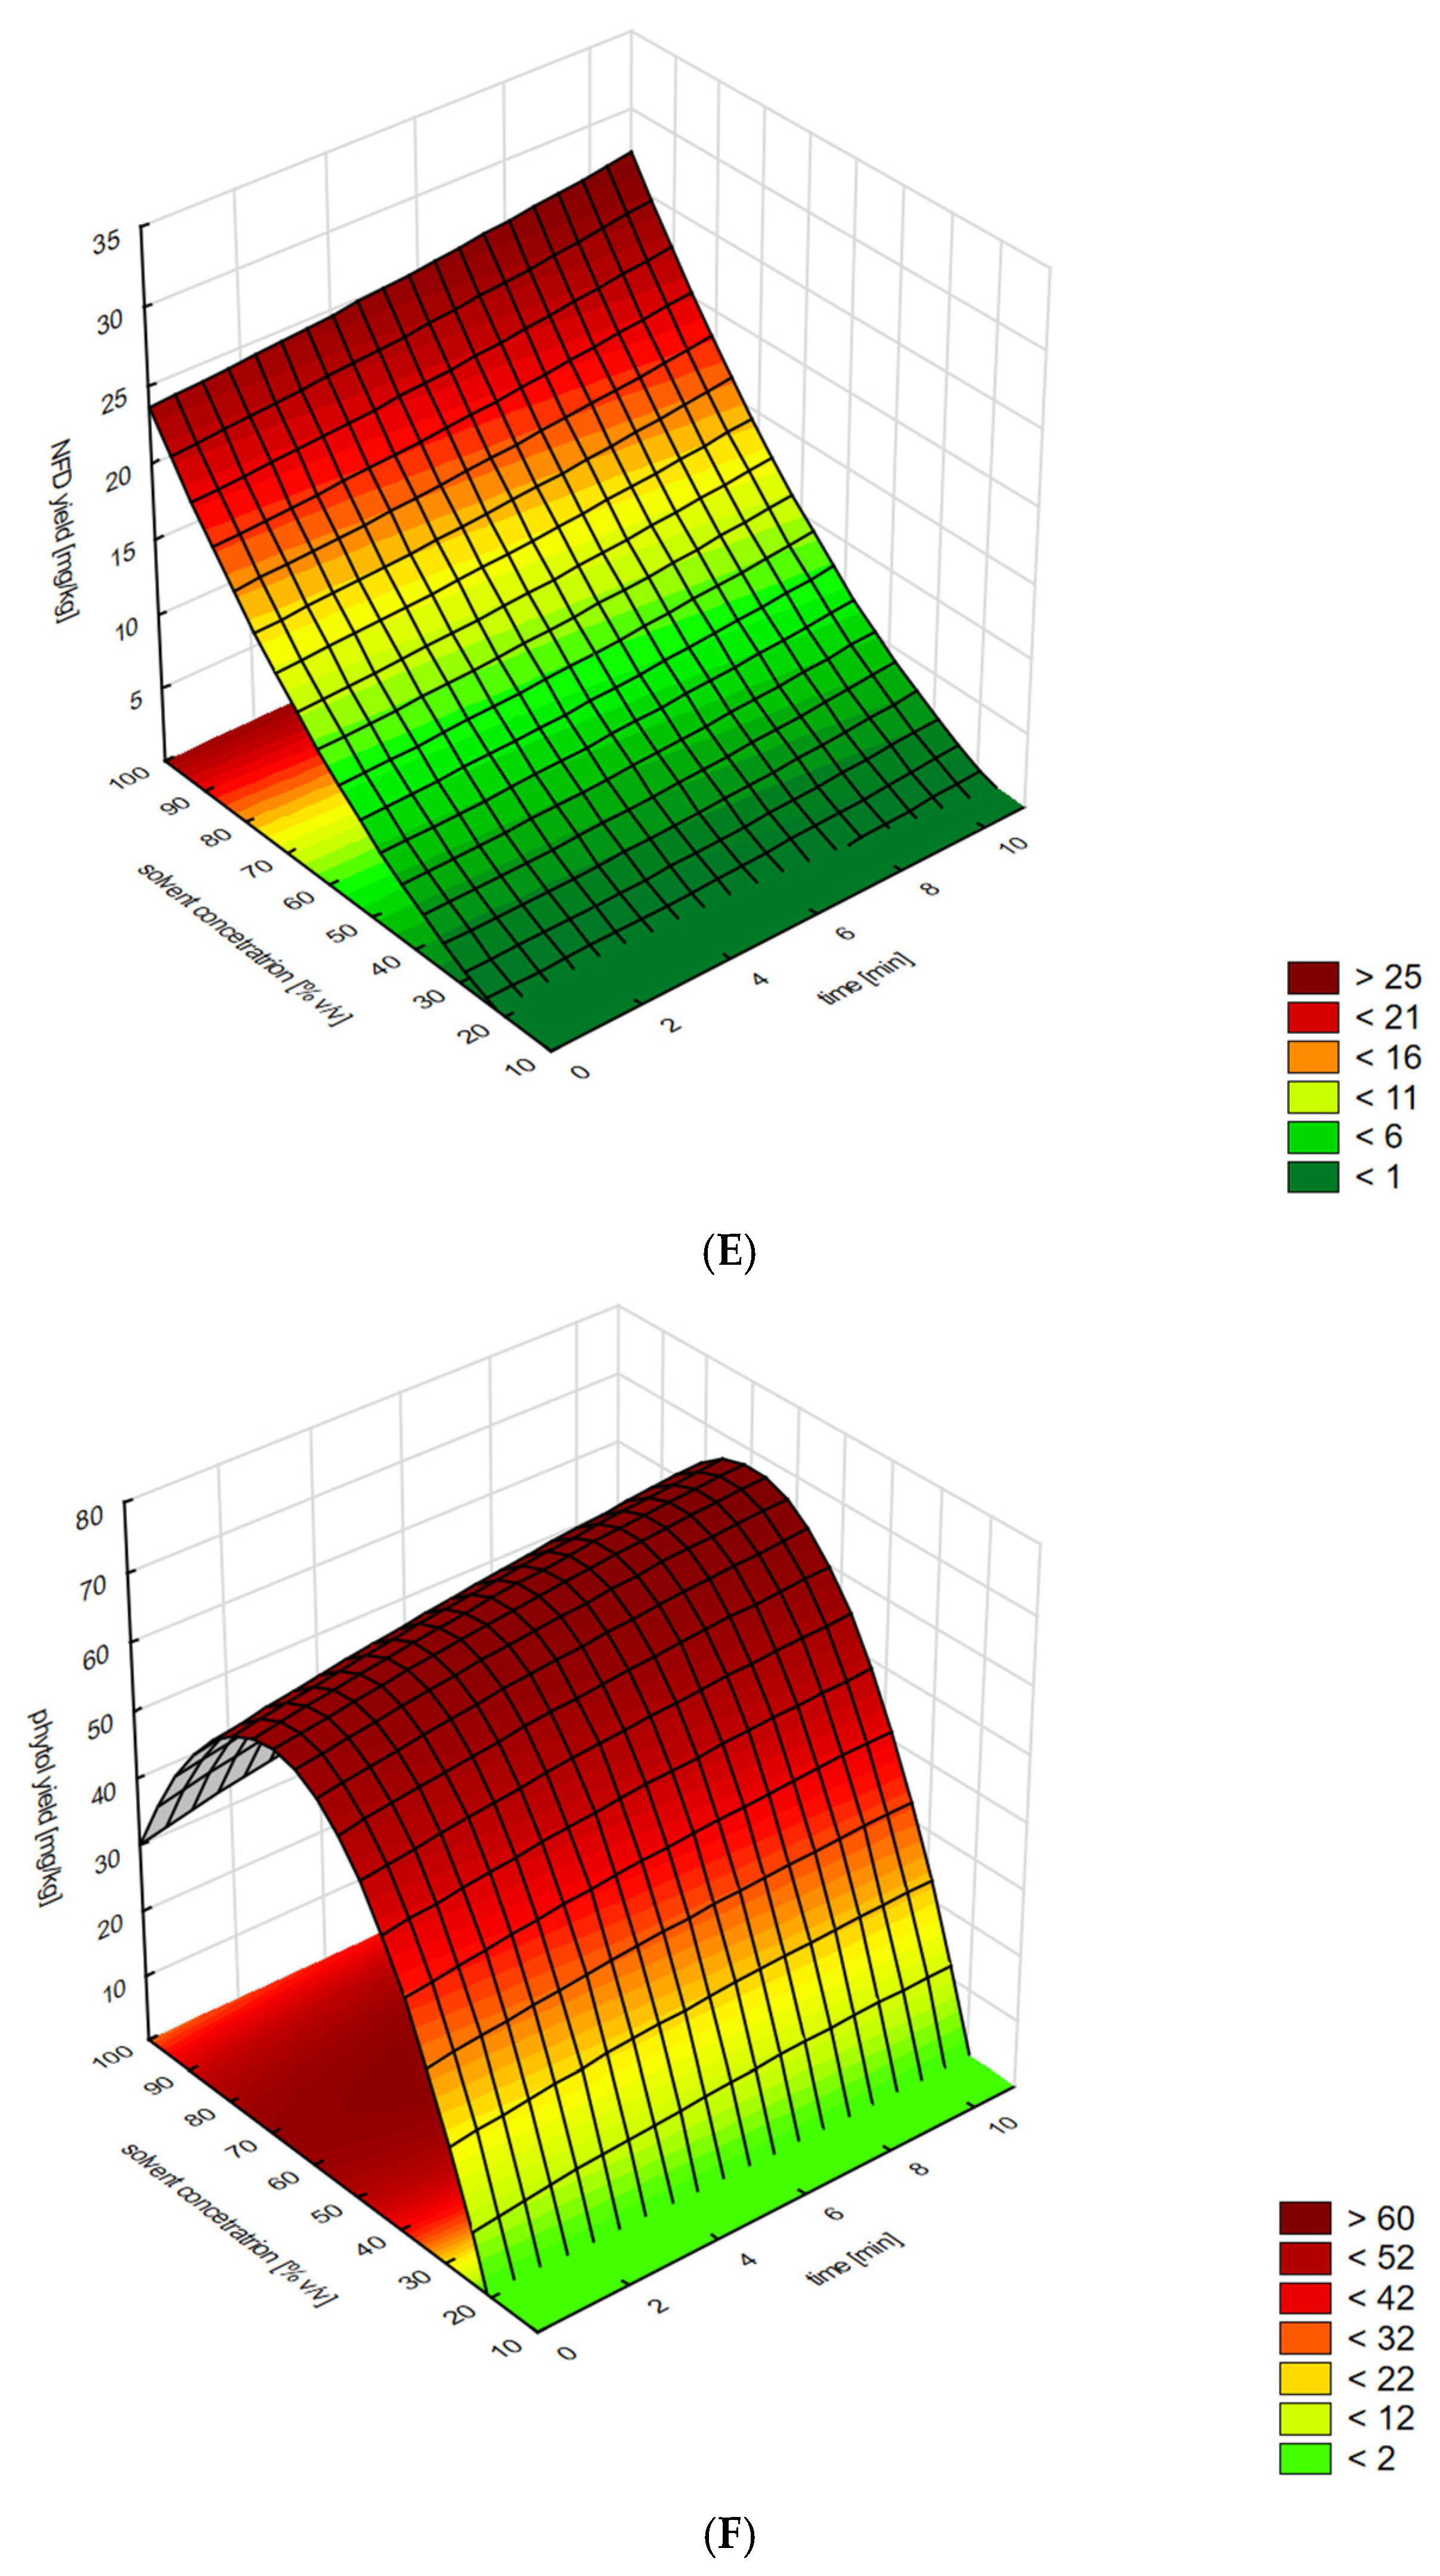
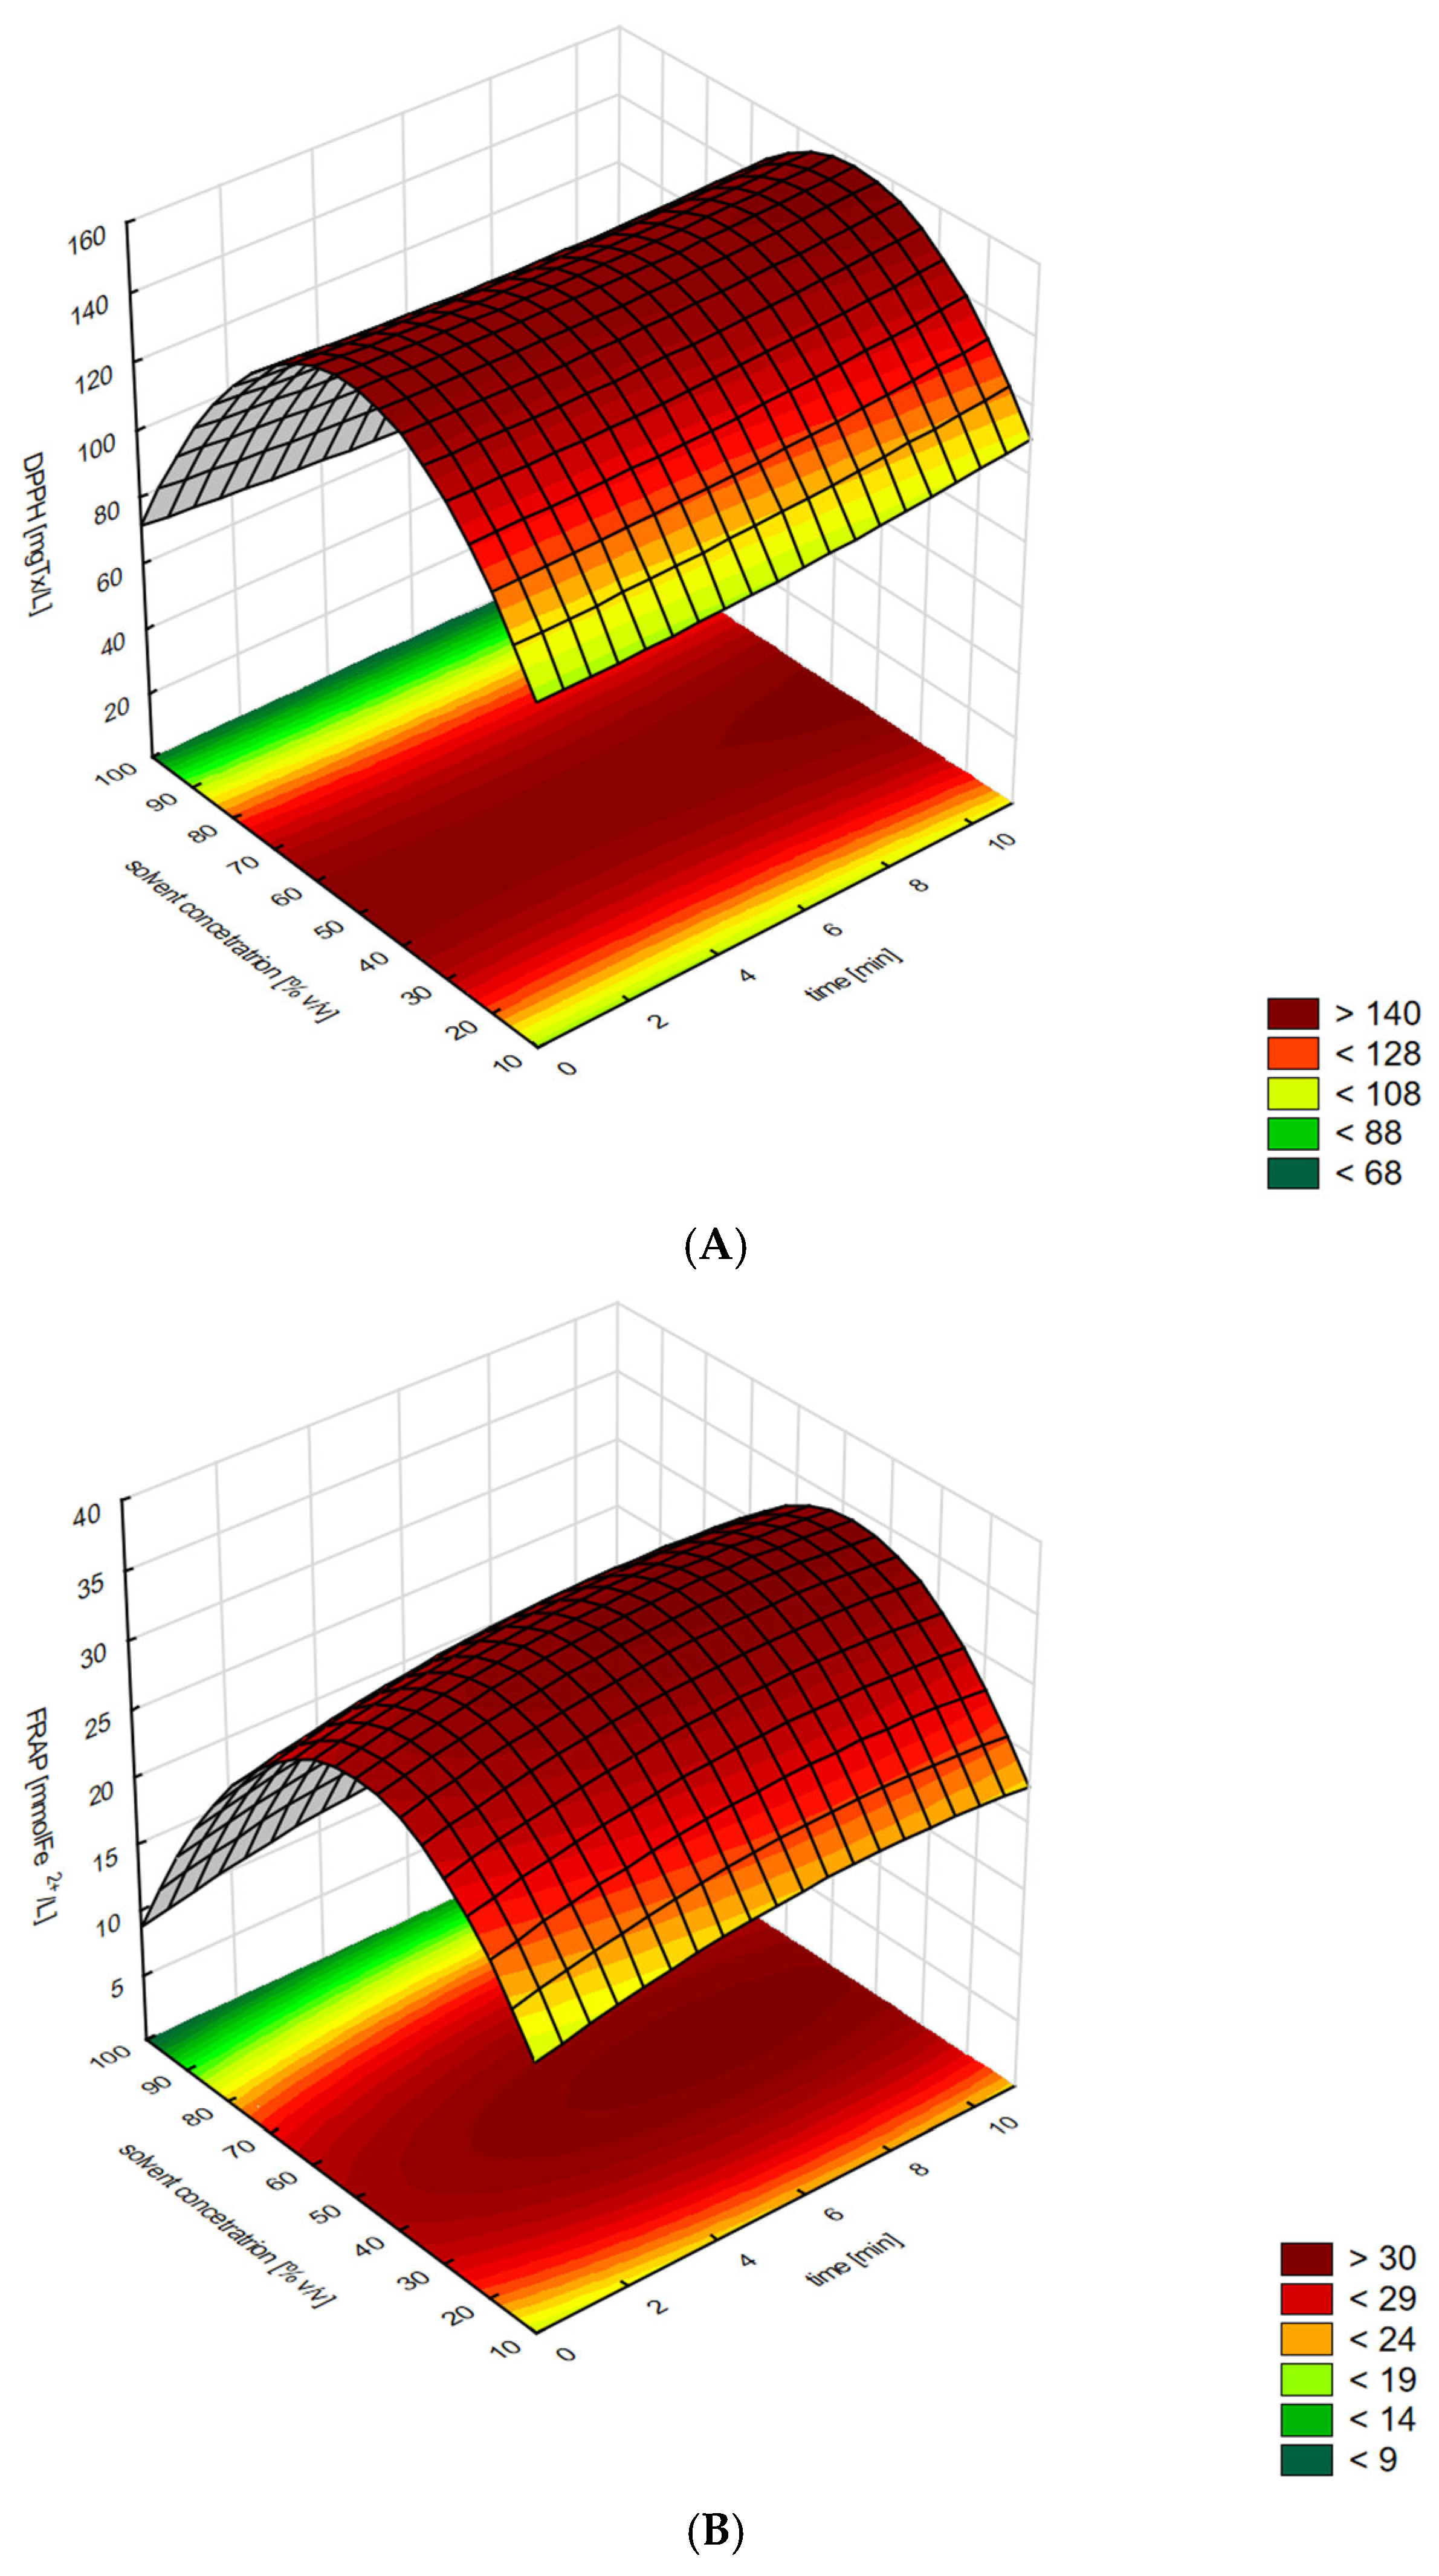
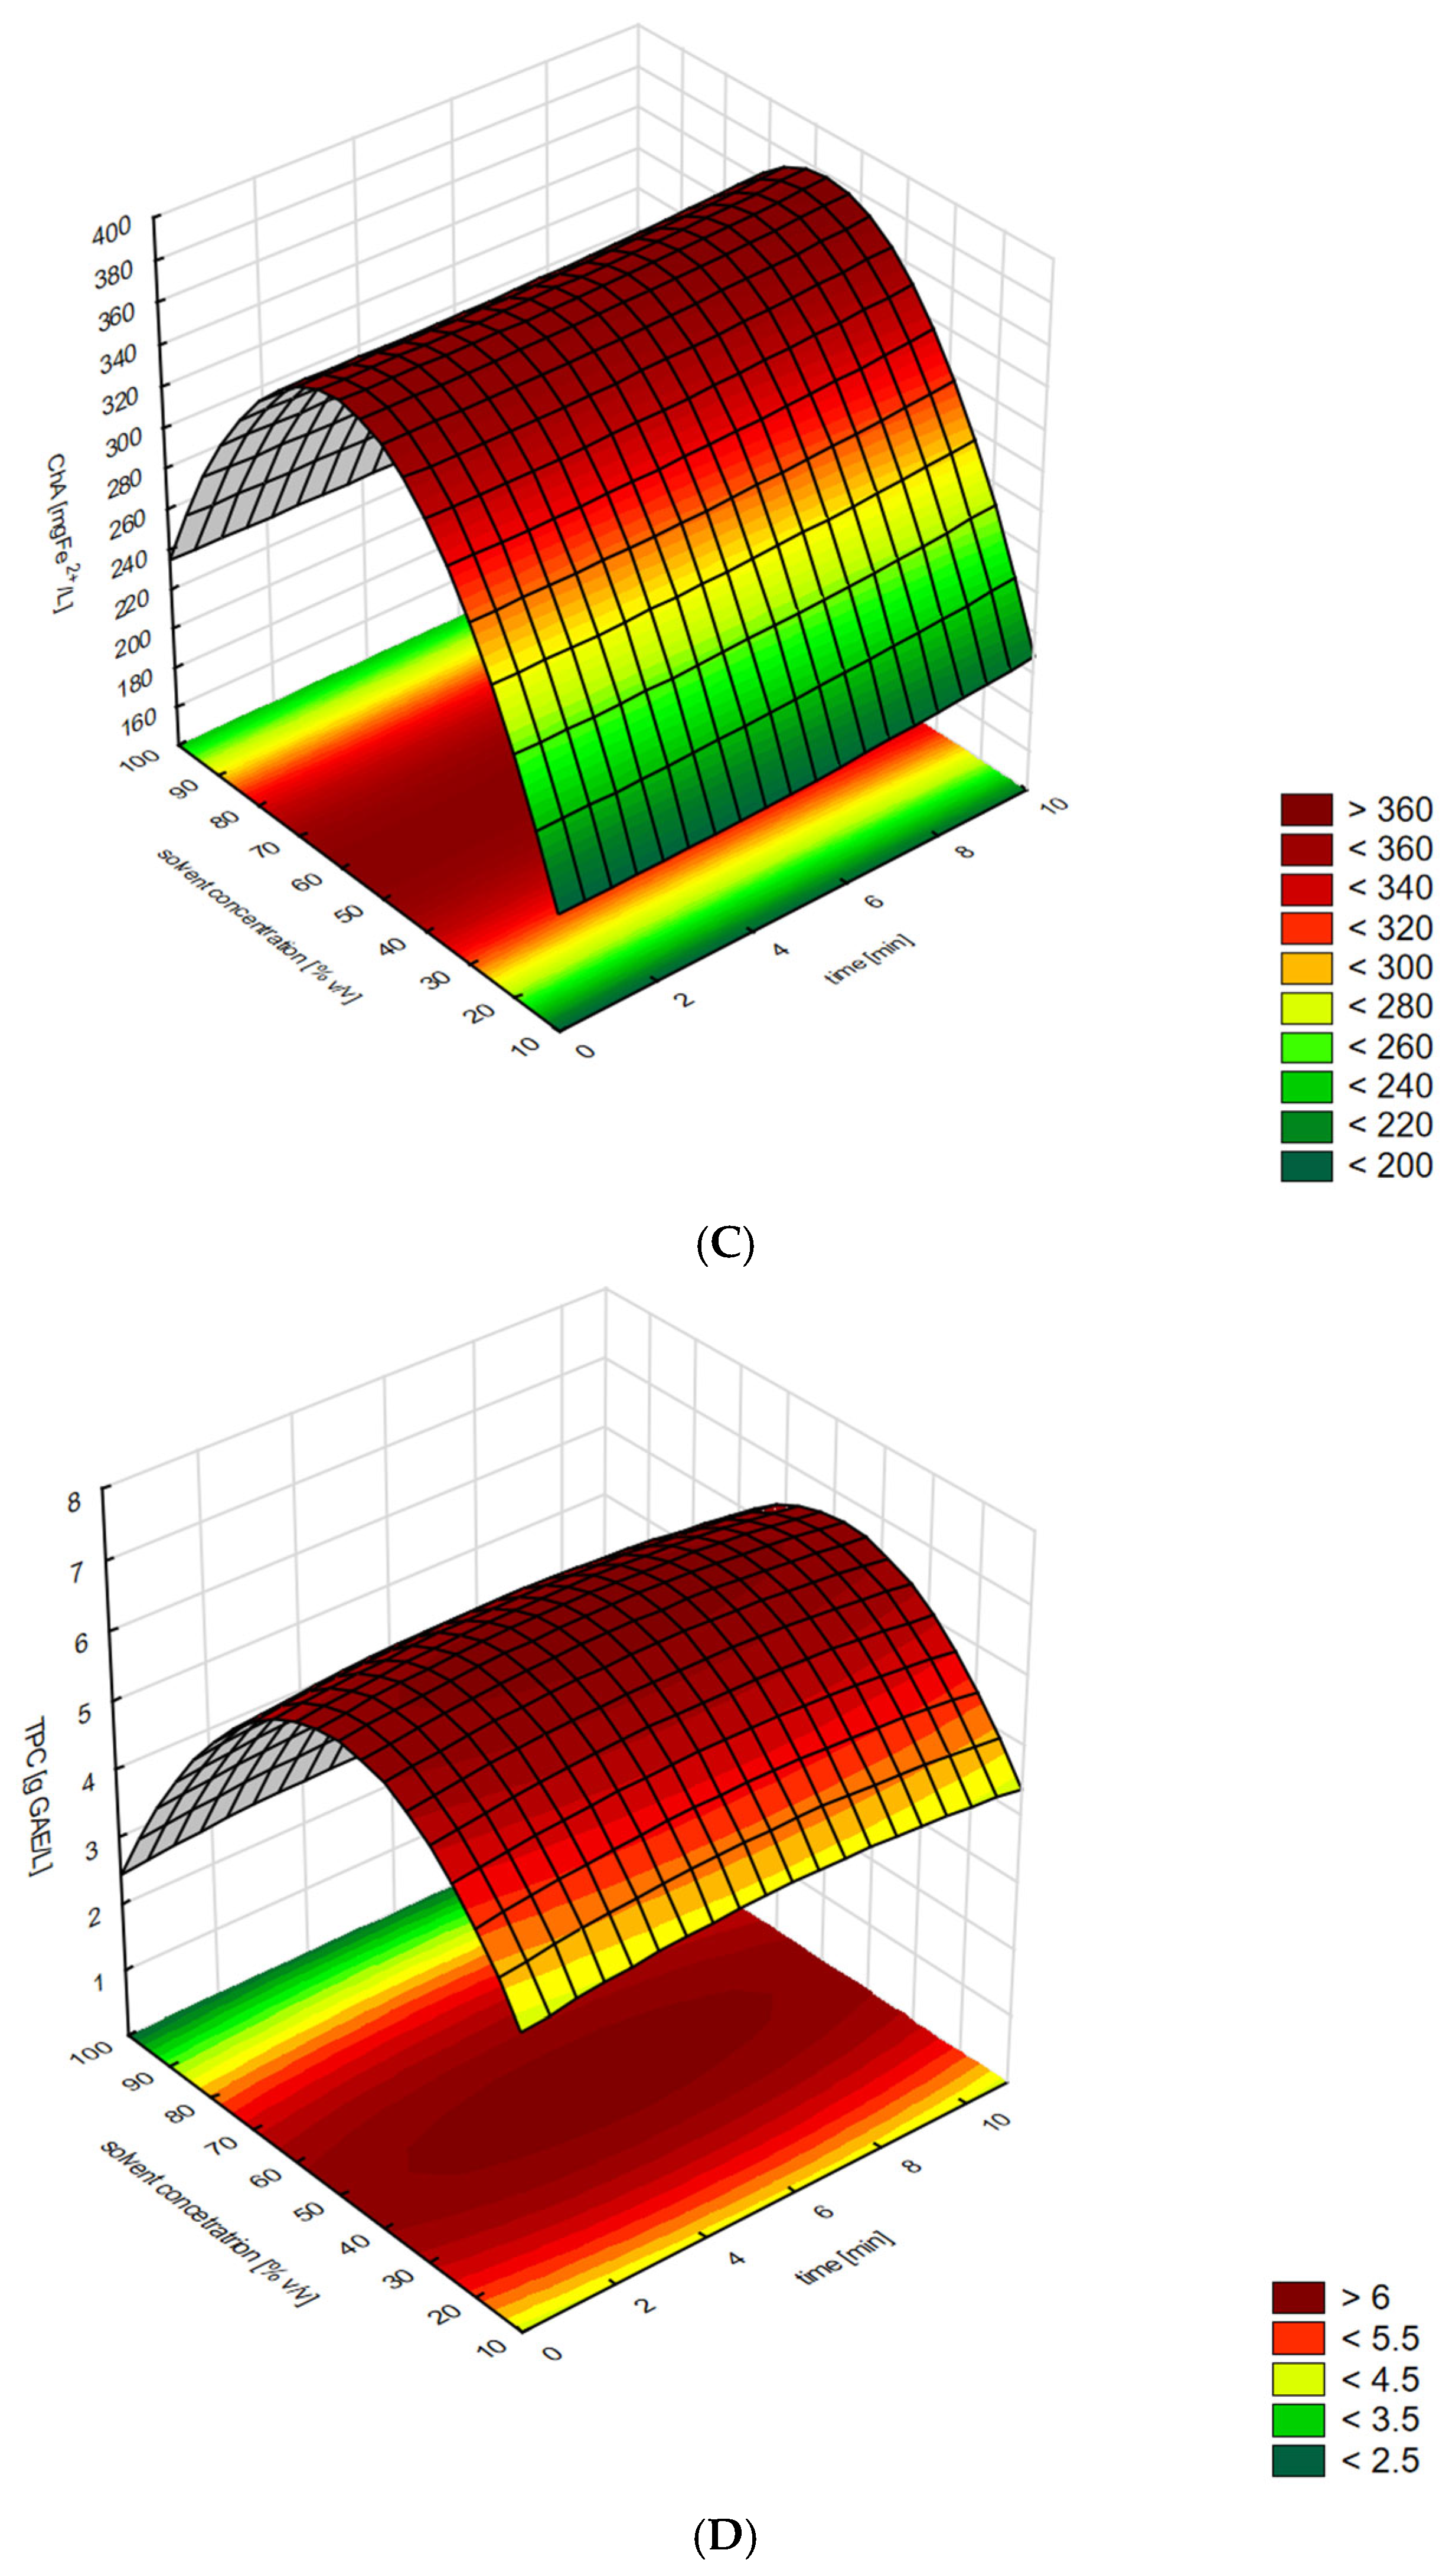
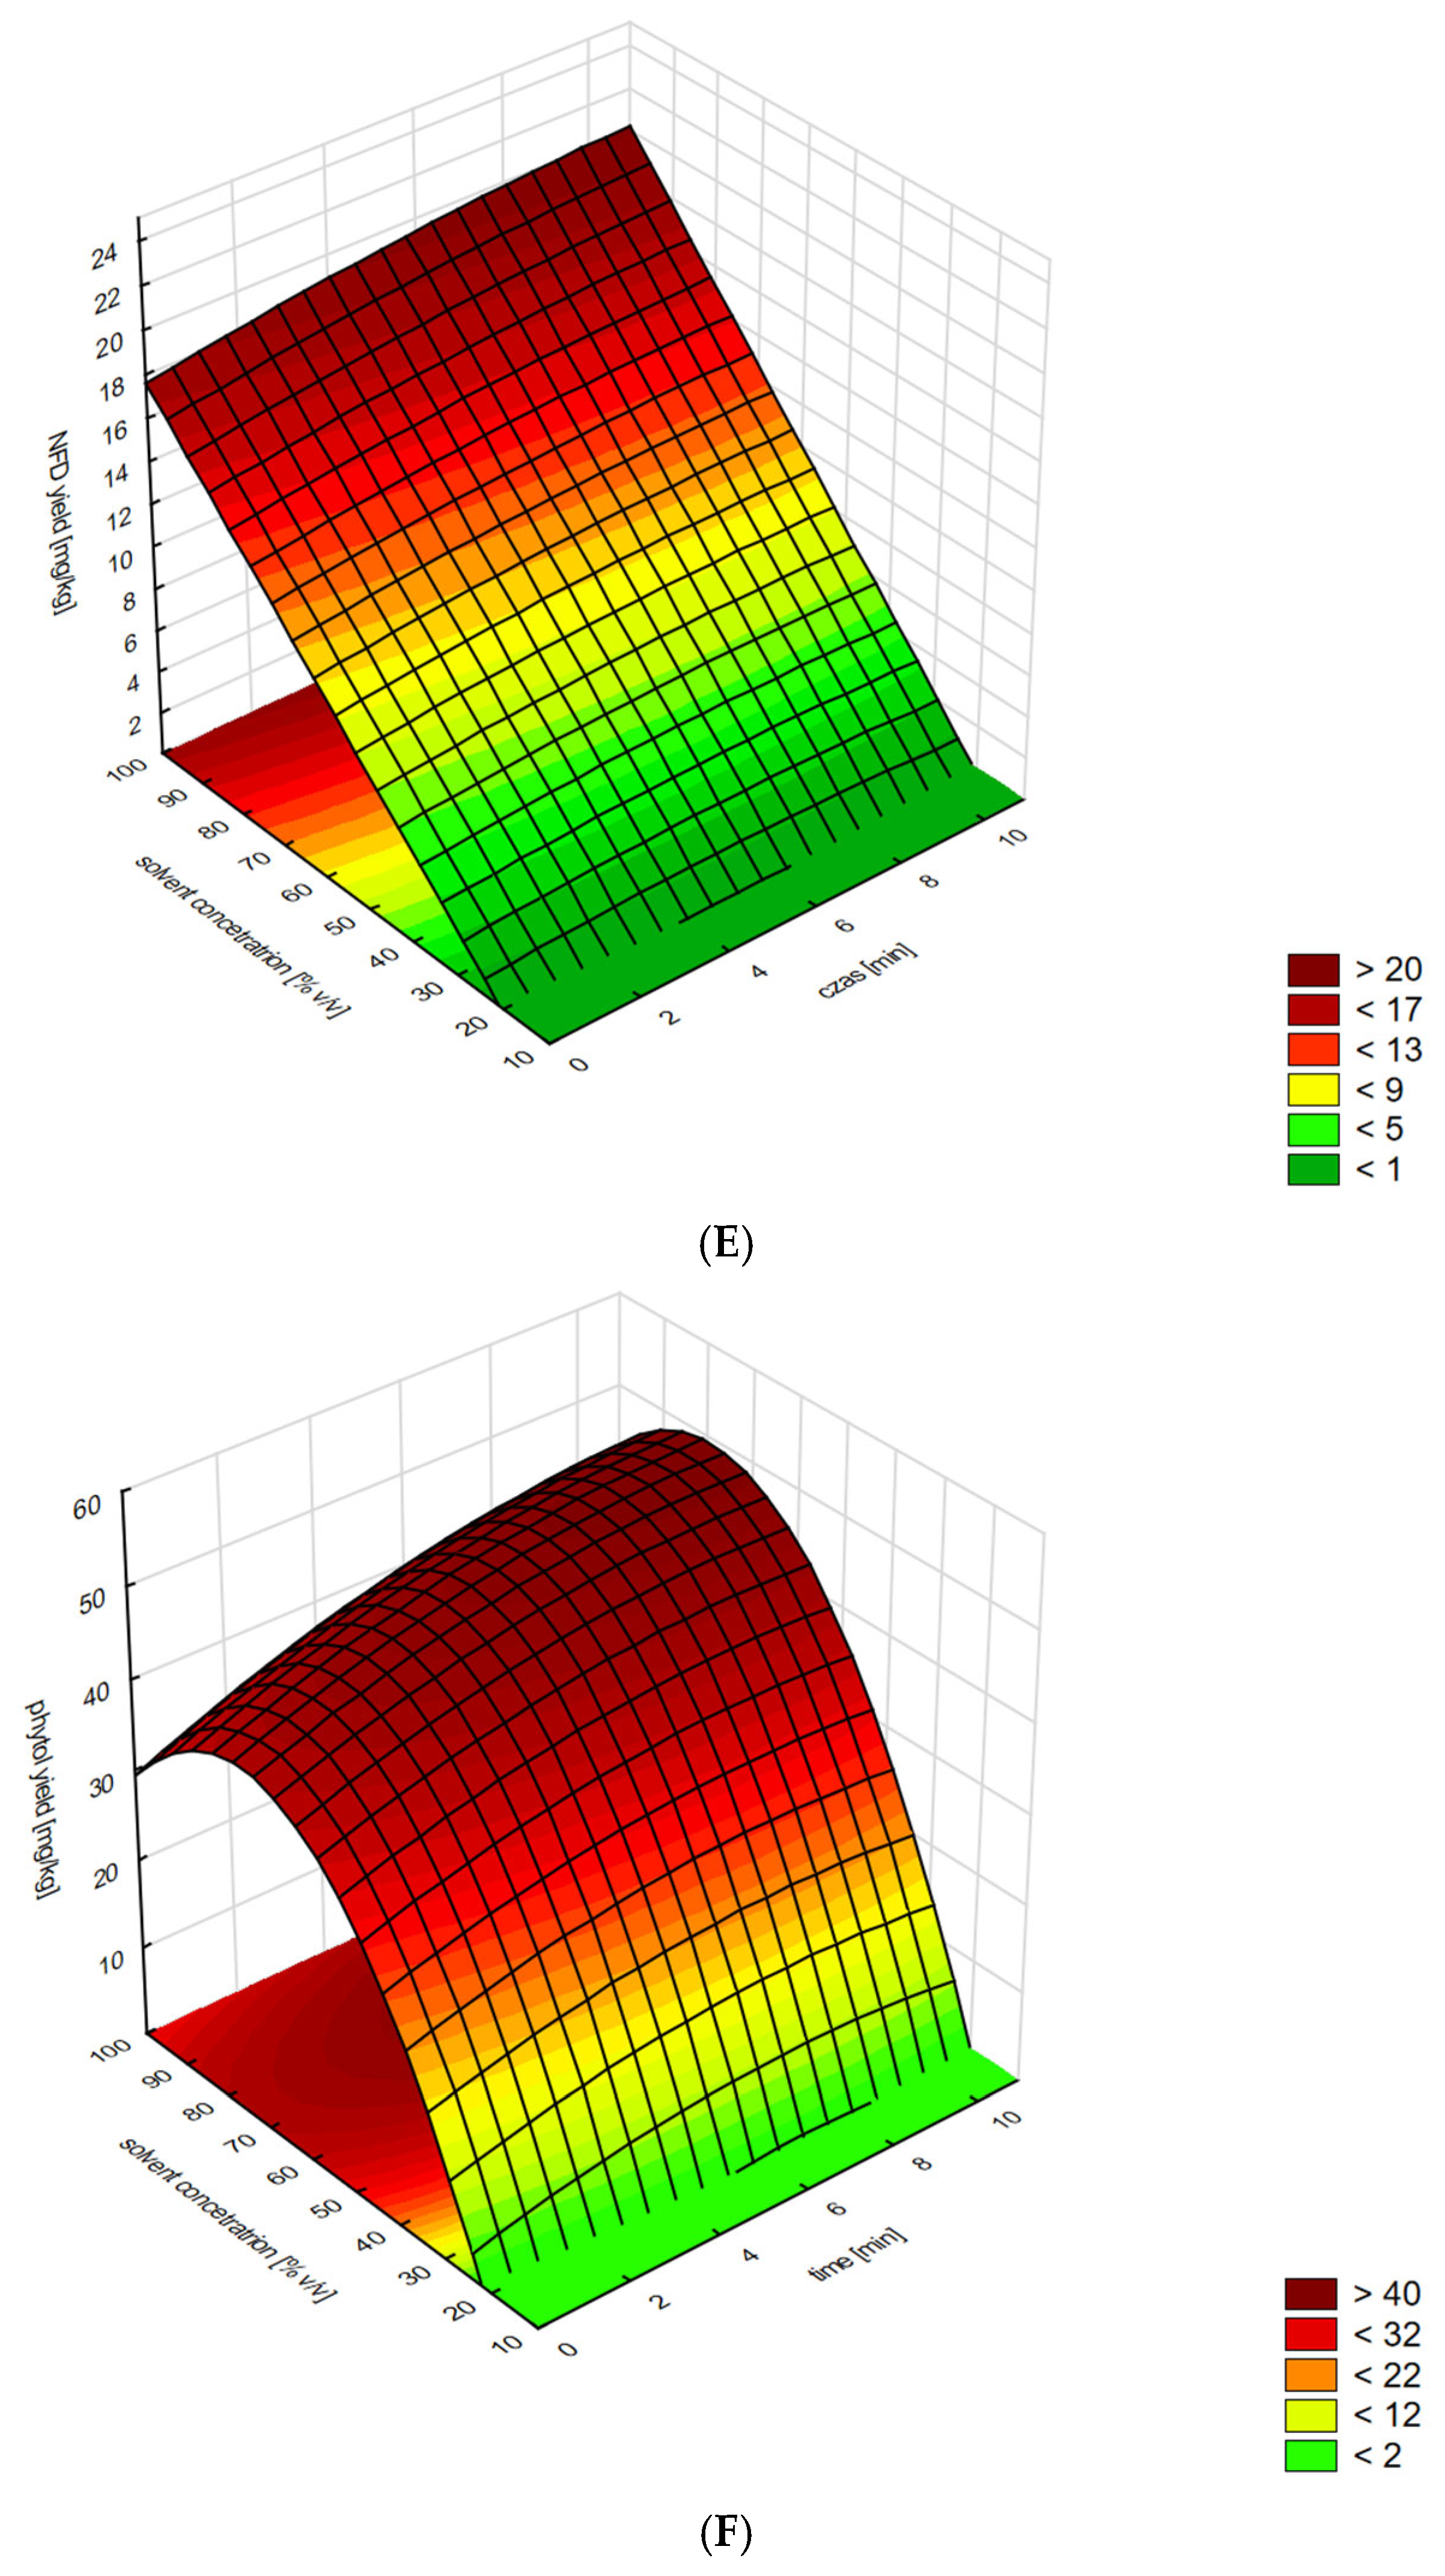
Figure 1, Figure 2 and Figure 3 show changes in antioxidant activity (DPPH), Fe3+ to Fe2+ reduction capacity (FRAP), Fe2+ ion chelating activity (ChA), total polyphenol content (TPC), neophytadiene (NFD yield), and phytol (phytol yield) extraction efficiency depending on the solvent used: ethanol, isopropanol, or acetone.
Negative predicted values (e.g., −0.87 mg/kg) result from the mathematical form of the second-degree polynomial and do not represent physically meaningful extraction yields. These values occur at the edges of the design space, where the response surface loses physical interpretability.
For the antioxidant and polyphenol parameters (DPPH, FRAP, ChA, and TPC), the response surfaces exhibited a non-monotonic behavior, with clear maxima at moderate solvent concentrations of approximately 50% v/v and an extraction time of 5 min. Depending on the solvent, the peak values exceeded 120 mg Tx/L for DPPH, 25 mmol Fe2+/L for FRAP, 330 mg Fe2+/L for chelating activity, and 6 g GAE/L for TPC (Figure 1A–D, Figure 2A–D and Figure 3A–D). These findings indicate that binary alcohol–water mixtures enhance the extraction of polar antioxidant constituents due to improved solubility and diffusion of phenolic compounds in partially aqueous media. In contrast, the extraction of the nonpolar terpenoid neophytadiene (NFD) increased monotonically with solvent concentration. Maximum NFD yields (>20 mg/kg) were recorded at the highest tested concentrations (100% v/v) of ethanol, isopropanol, and acetone (Figure 1E, Figure 2E and Figure 3E; Table 3), and no optimum was reached within the experimental range (20–100% v/v), consistent with its hydrophobic nature. Phytol displayed an intermediate extraction pattern. For ethanol, the response increased steadily throughout the tested range, suggesting that the optimum likely lies beyond 100% v/v. For isopropanol and acetone, well-defined maxima were observed at 69% v/v and 79% v/v, respectively (Figure 1F, Figure 2F and Figure 3F; Table 3). This behavior reflects the amphiphilic character of phytol: its hydroxyl group enables favorable interactions with limited amounts of water in the solvent mixture, which enhances solubility up to a certain point. At very high alcohol concentrations these interactions weaken, leading to declining or plateauing extraction efficiency. The solvent concentration was the dominant factor governing extraction efficiency, whereas extraction time had only a minor impact. Antioxidant-related responses (TPC, DPPH, FRAP, ChA) showed distinct maxima at approximately 50% v/v, whereas lipophilic responses (NFD and phytol) increased with rising solvent concentration or exhibited maxima at higher alcohol levels, depending on the compound.
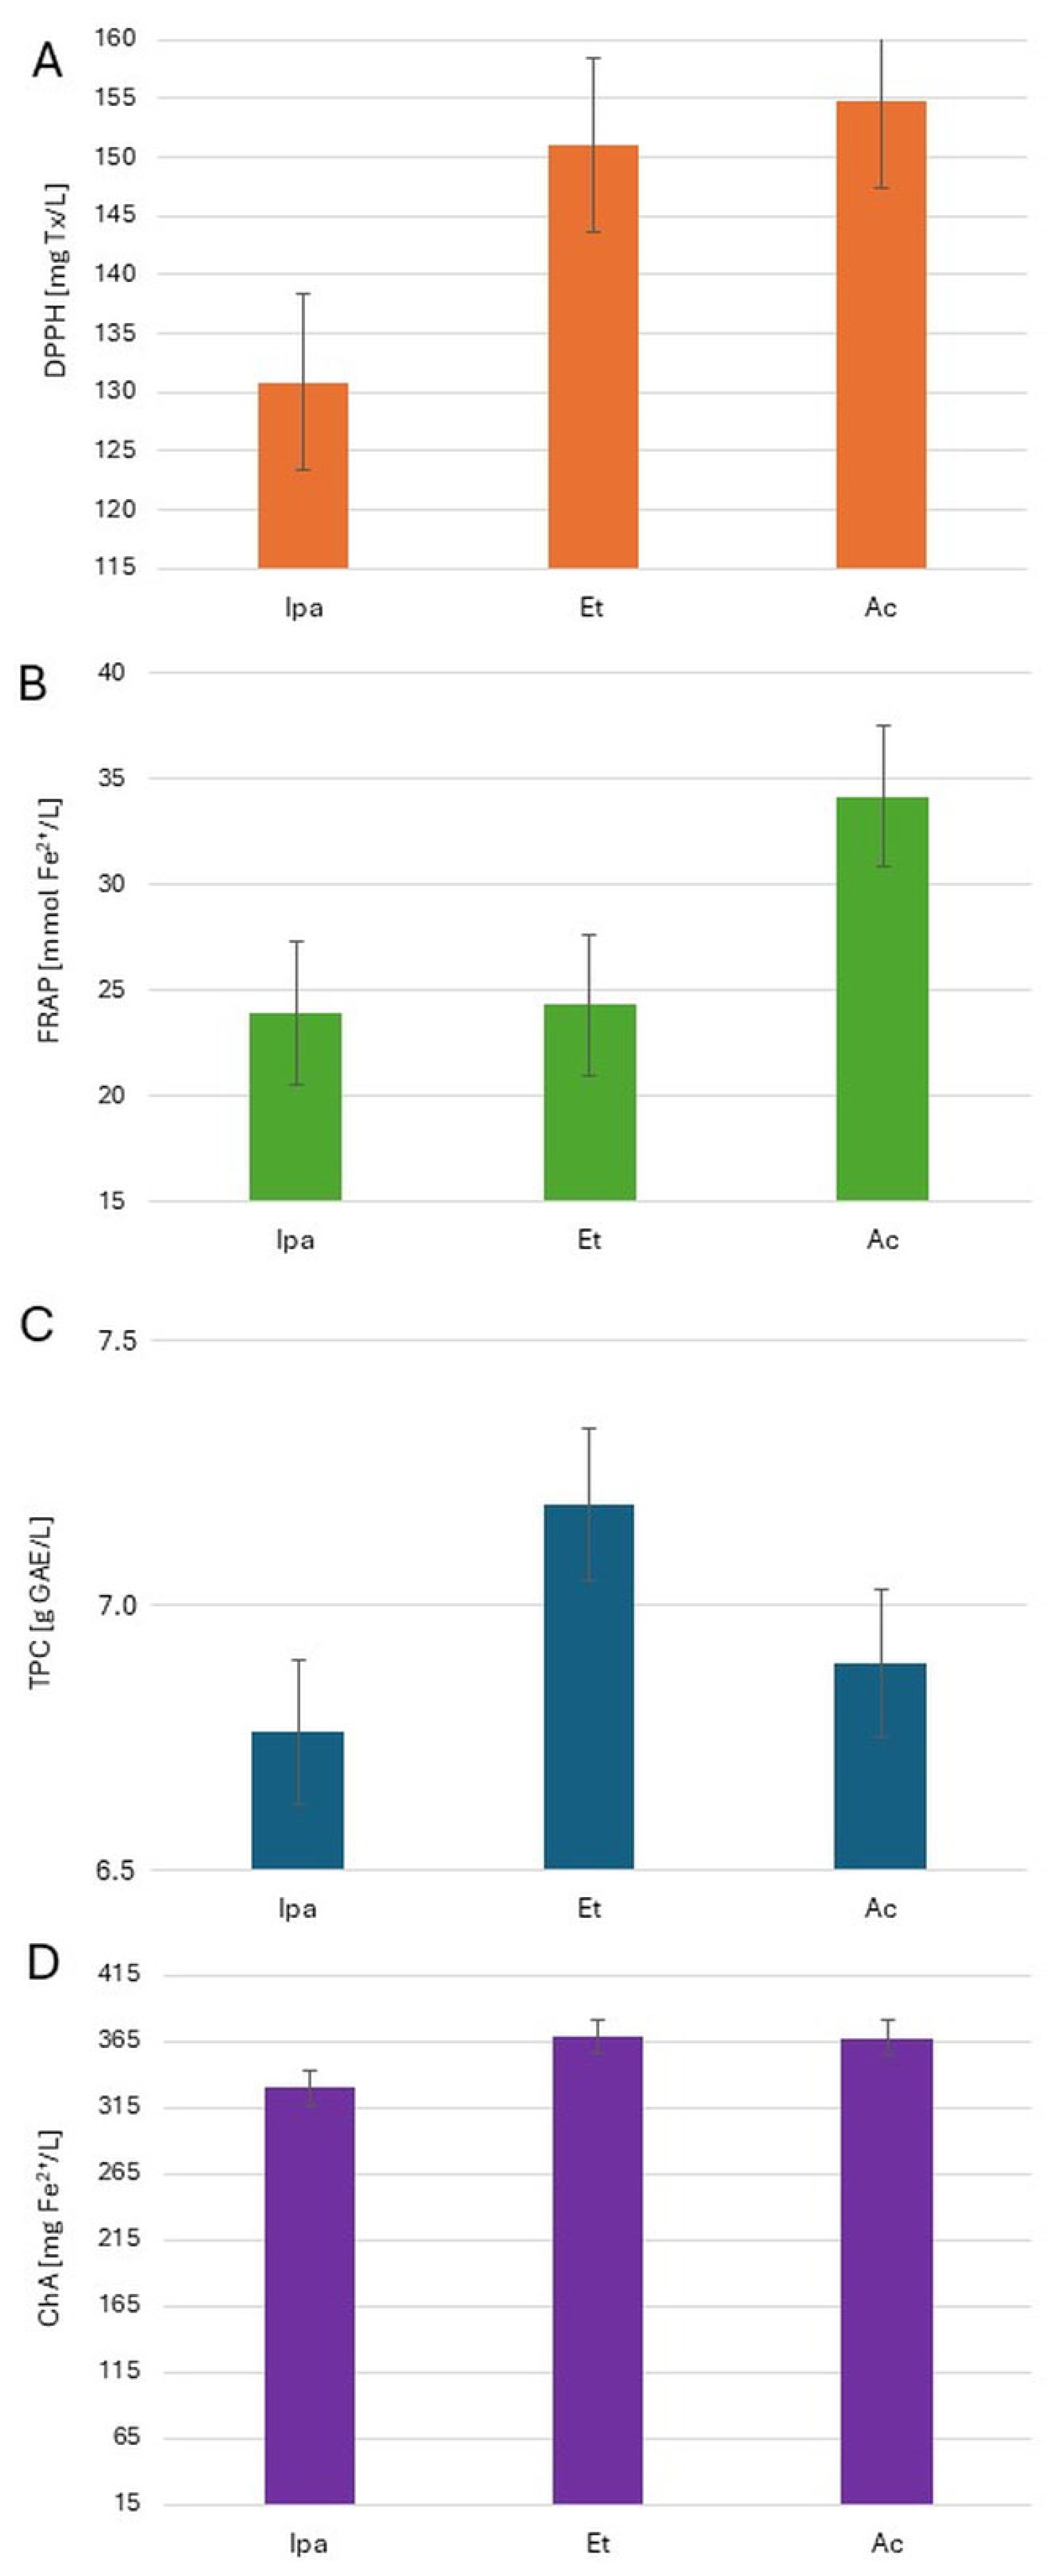
Comparison of extraction efficiency for the solvents used under the accepted optimal conditions, i.e., solvent concentration (Et, Ipa, Ac) at 50% v/v and extraction time of 5 min, for the parameters TPC, DPPH, and FRAP (Figure 4).
Figure 4 shows the extraction efficiency of isopropanol (Ipa), ethanol (Et), and acetone (Ac) under the optimized conditions of 50% (v/v) solvent concentration and 5 min extraction time. The results are presented for four analytical parameters: DPPH, FRAP, total polyphenol content (TPC), and chelating activity (ChA). Acetone gave the highest values for DPPH (155 ± 7 mg Tx/L) and FRAP (34 ± 3 mmol Fe2+/L). Ethanol yielded slightly lower DPPH (151 ± 7 mg Tx/L) and FRAP values (24 ± 3 mmol Fe2+/L) but provided the highest TPC (7.2 ± 0.6 g GAE/L) and chelating activity (368 ± 11 mg Fe2+/L). Isopropanol showed the lowest results for all parameters, including DPPH (130 ± 7 mg Tx/L), FRAP (24 ± 3 mmol Fe2+/L), TPC (6.8 ± 0.6 g GAE/L), and chelating activity (329 ± 11 mg Fe2+/L).

3.3. Extraction Efficiency

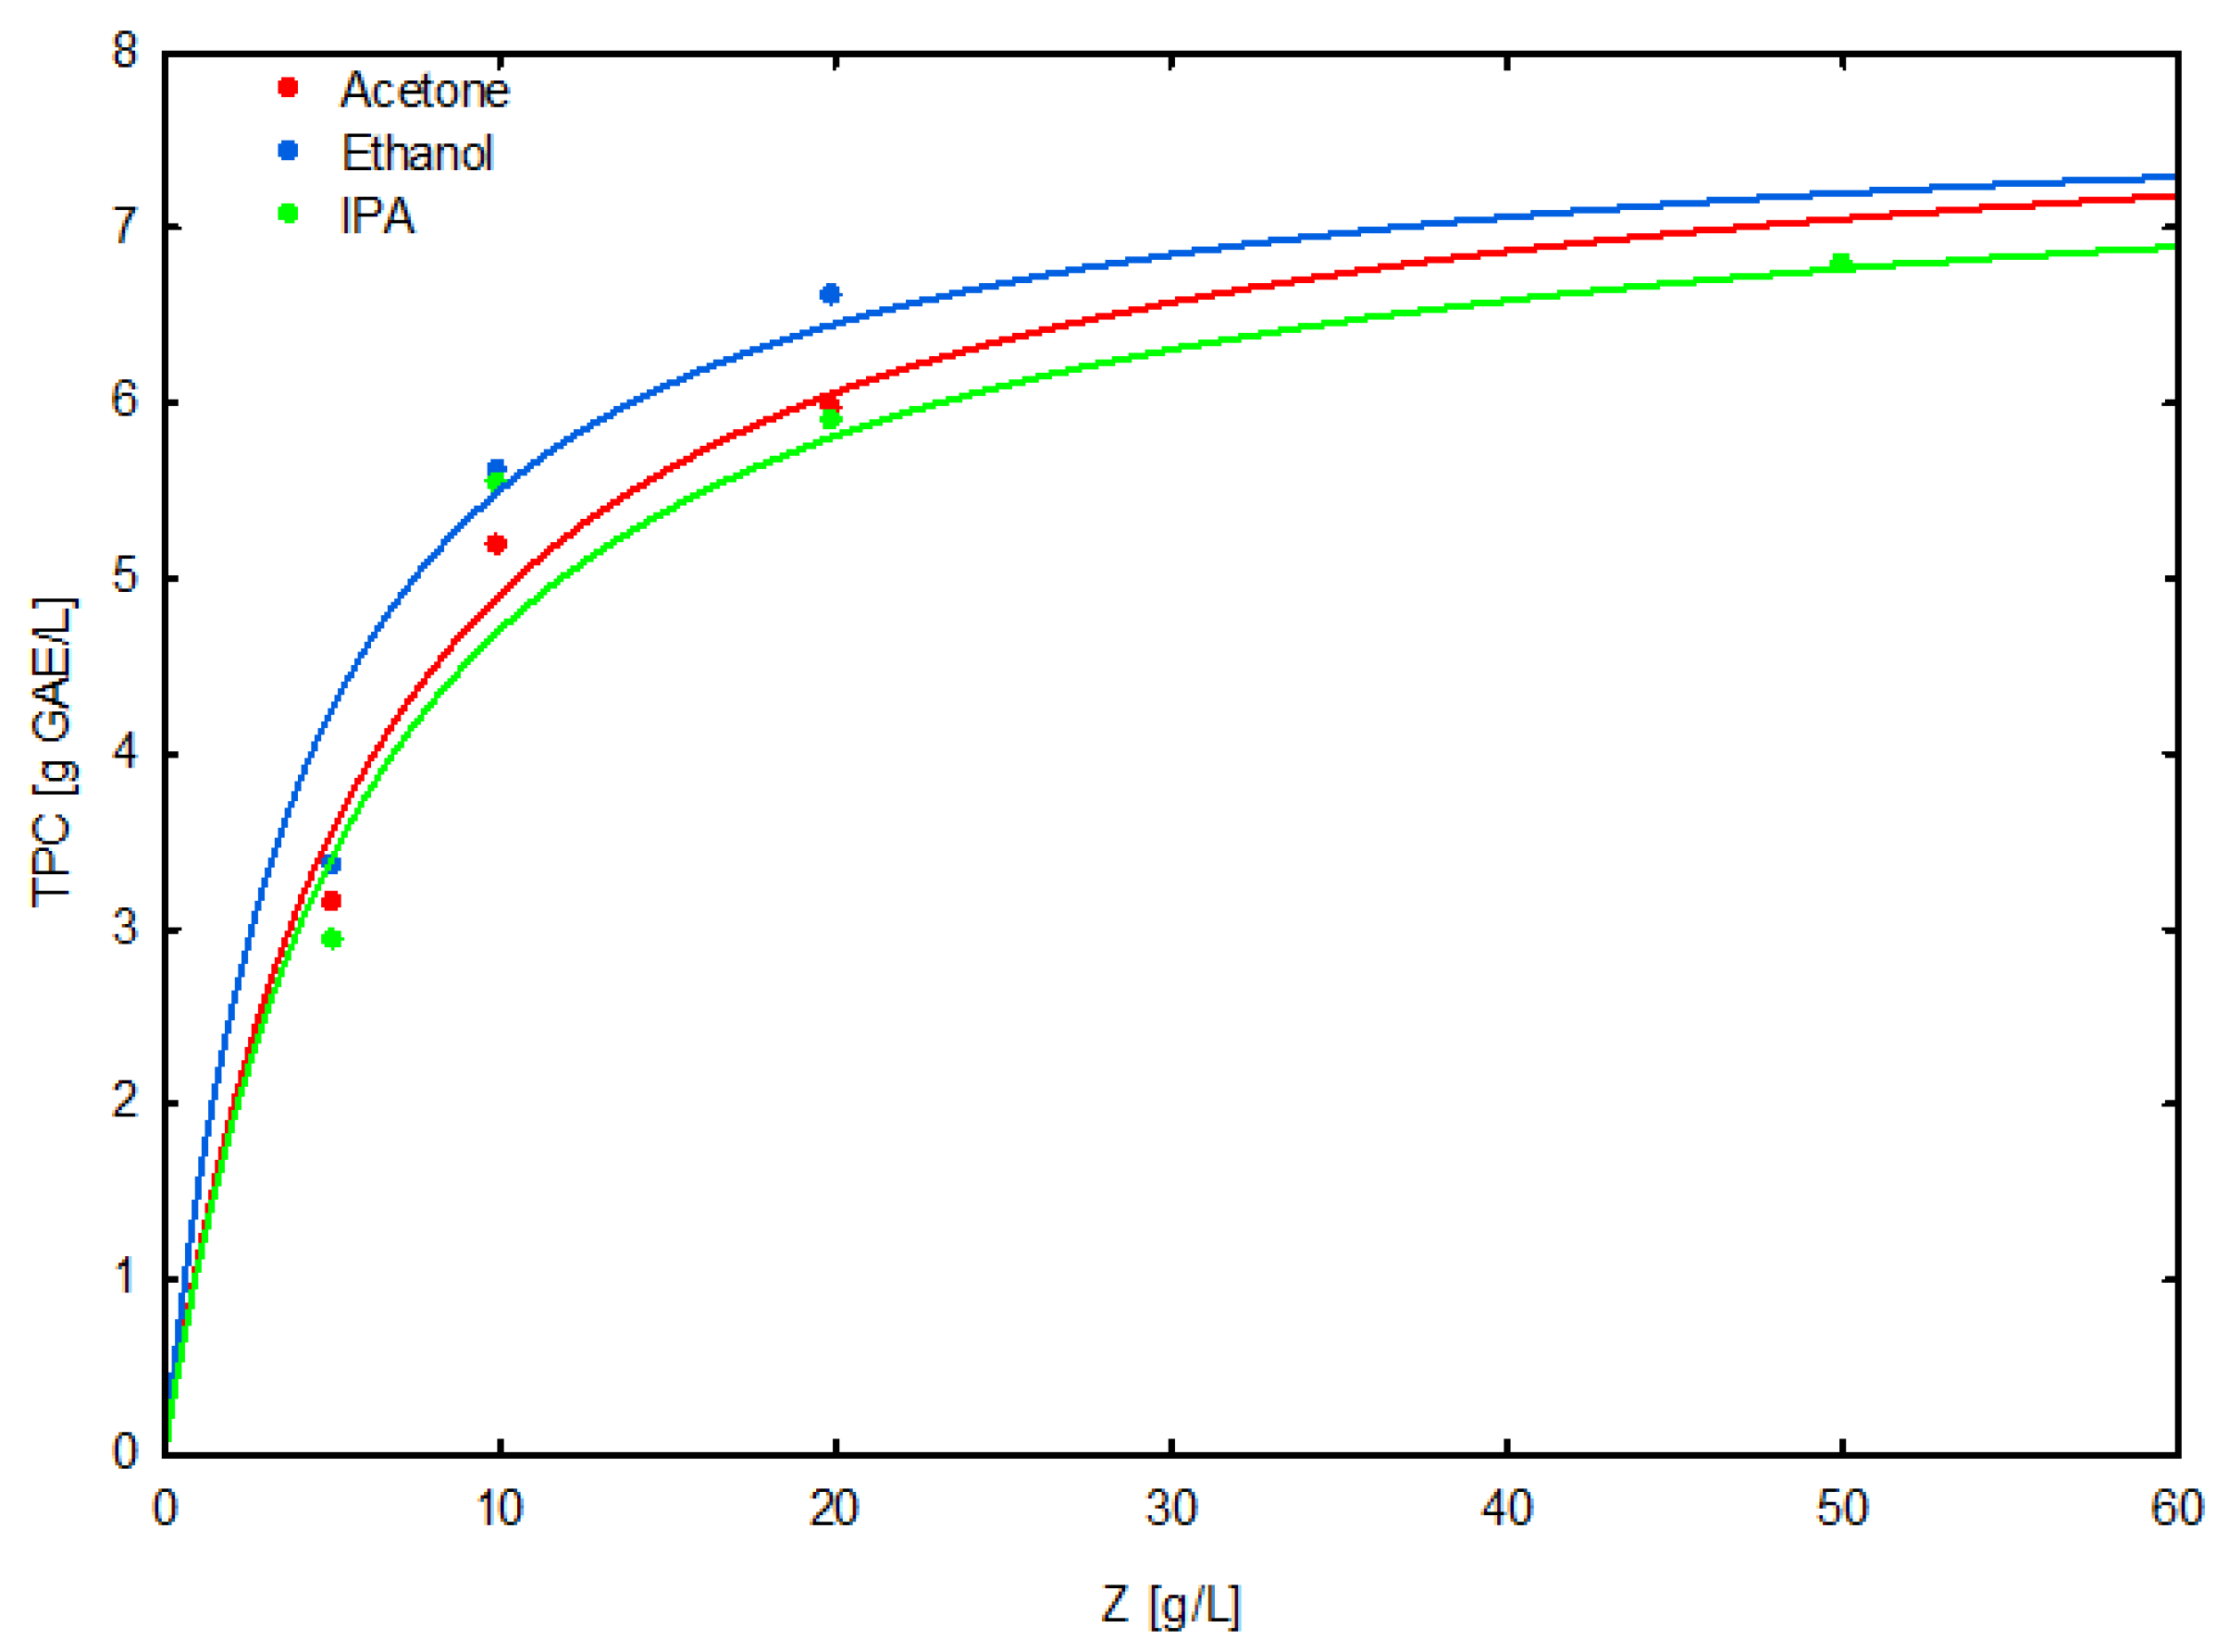
Figure 5 shows the relationship between the total polyphenol content (TPC) and the concentration of the extracted material for the solvents used in the extraction of C. palustre (Et, Ipa, Ac).
Figure 5 shows the relationship between the total phenolic content (TPC) and the amount of raw material for three solvents: ethanol, isopropanol, and acetone. An increase in TPC is observed with increasing material concentration, but above 0.2 g/100 mL, the rate of increase decreases, indicating that extraction equilibrium is approaching. The highest TPC values were obtained for ethanol (approx. 7 g GAE/L at 5 g/100 mL), lower for isopropanol (approx. 6 g GAE/L), and acetone (approx. 6.5 g GAE/L). The results confirm the high efficiency of ethanol-water mixtures in the isolation of phenolic compounds [35].
The values of the parameters of Equation (4) and the calculated maximum yield are presented in Table 4.
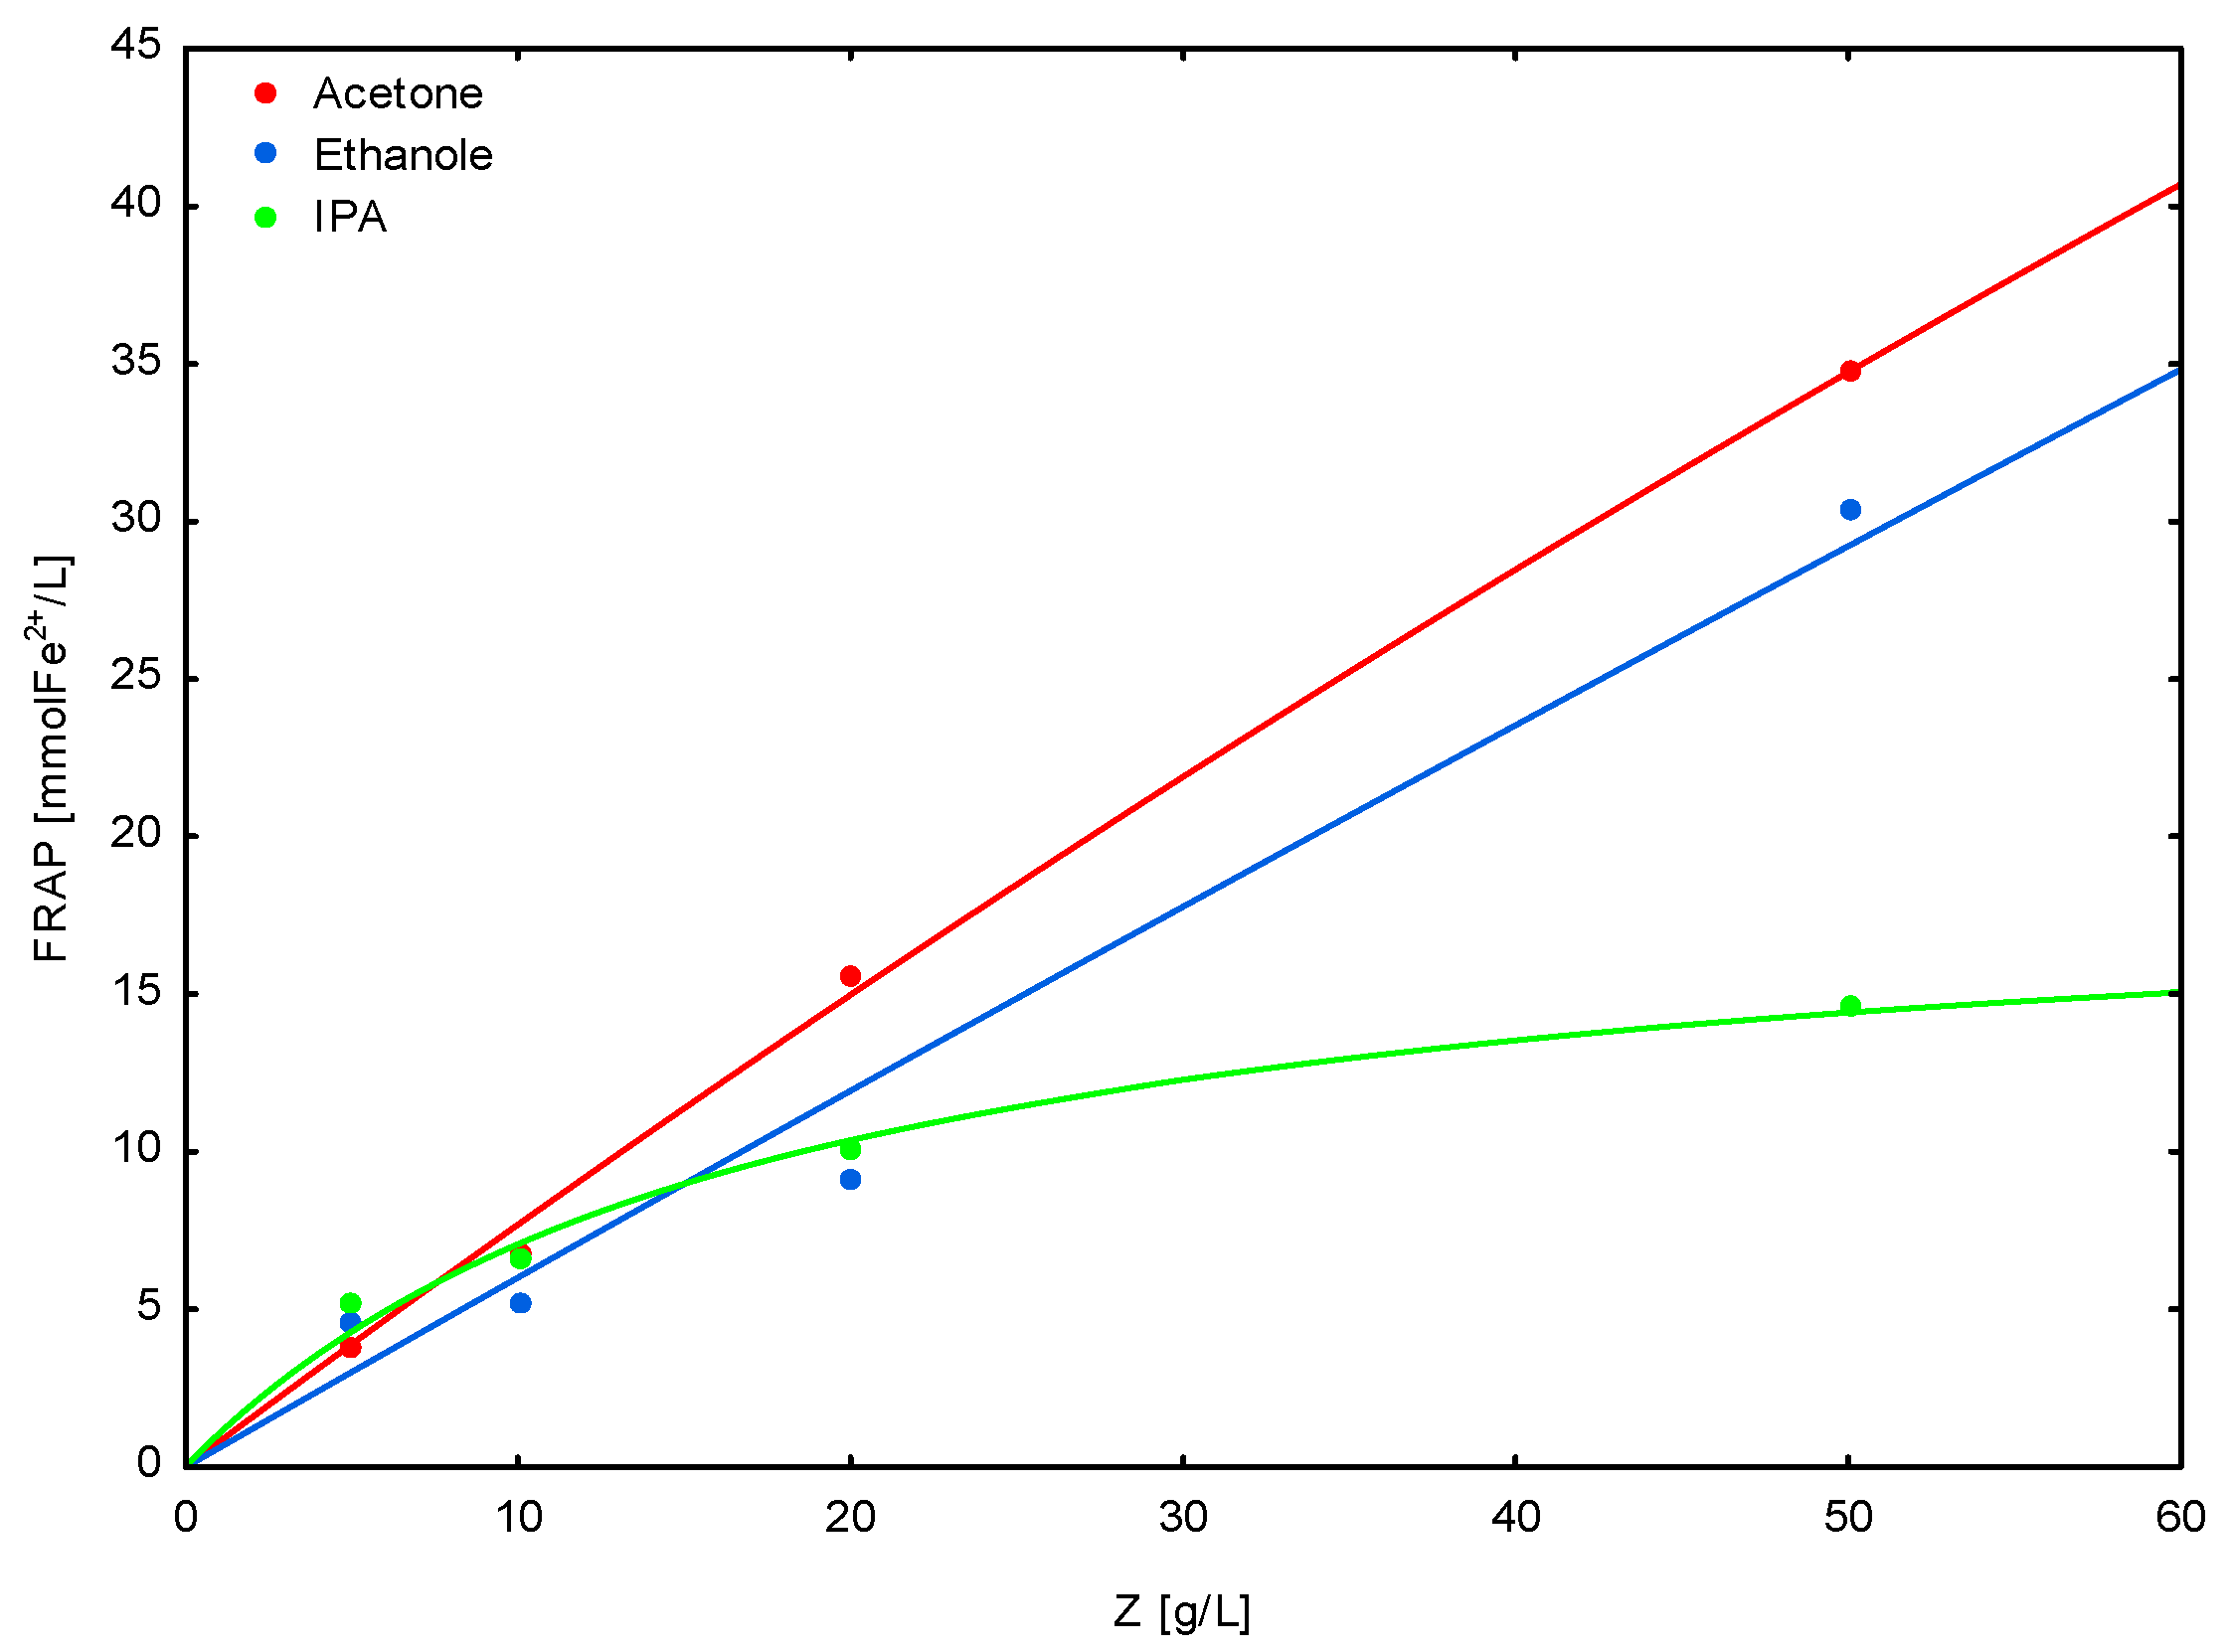
Table 4 presents the parameters of the mathematical model describing the TPC extraction process, including the maximum polyphenol content in the extract (TPCmax), the extraction equilibrium constant (K), and the maximum yield (Umax). The variation in the values of these parameters between solvents indicates a significant influence of their physicochemical properties on the course of the process. The highest Umax values obtained for ethanol (1.8 g GAE/g) confirm its high efficiency per unit mass of raw material. The differences in the values of the extraction equilibrium constant reflect the varying affinity of polyphenols to the liquid phase, resulting from the physicochemical properties of the solvents used. A low value of the equilibrium constant K (as observed for acetone) indicates low extraction efficiency at low raw-material concentrations, despite the solvent’s high total extraction capacity. This behavior is typical for complex phytochemical matrices. Higher K values for ethanol indicate its greater ability to solubilize phenolic compounds compared to isopropanol and acetone, which correlates with their polarity and ability to form hydrogen bonds [35]. Table 4 also includes parameters of the model describing the extraction of compounds responsible for free radical scavenging activity, as determined by the DPPH assay. The high Umax values obtained for isopropanol (95 mg Tx/g) suggest that, despite its lower total polyphenol content, this solvent promotes the isolation of compounds capable of reducing the DPPH free radical. Higher equilibrium constant (K) values for isopropanol (1.9 L/g) compared to ethanol (1.4 L/g) and acetone (1.7 L/g) further confirm its greater ability to solubilize compounds responsible for antioxidant activity (Table 4) [36]. The FRAPmax values shown in Table 4 correspond to the limiting values for Z →- > ∞. The value of 847 mmol Fe2+/L represents a theoretical asymptote of the fitted saturation curve and cannot be interpreted as an experimentally achievable FRAP value. The optimization studies included an analysis of the effect of solvent concentration and extraction time at the technically highest possible concentration of raw material Z = 50 g/L. The value of 847 mmol Fe2+/L is a parameter of the equilibrium equation, which allows the degree of extraction towards a given parameter, e.g., FRAP activity, to be determined. It should be emphasized that the FRAPmax value of 847 mmol/L obtained from the fitted model does not represent an experimentally achievable concentration. This value corresponds to the theoretical asymptote of the saturation-type equation (Equation (5)) for Z → ∞. In practice, FRAP measurements are performed on diluted extracts, and the maximum experimentally observed values (e.g., ca. 35 mmol Fe2+/L at 50 g/L, Figure 6) remain fully consistent with the stoichiometric limit imposed by the 0.02 M FeCl3 reagent concentration used in the assay. Therefore, FRAPmax should be interpreted strictly as a mathematical parameter describing curve shape, not as a physically attainable extraction yield. Table 4 therefore provides model parameters describing the extraction of compounds responsible for reduction activity measured by the FRAP method. The highest FRAPmax values were obtained for ethanol, which indicates its high efficiency in extracting compounds capable of reducing Fe3+ ions. The observed differences between solvents reflect the different affinities of these compounds to the liquid phase. The model parameters show good agreement with the experimental data, which confirms the reliability of the process description used. The highest ChAmax values were obtained for acetone, confirming its high efficiency in extracting compounds responsible for chelating Fe2+ ions. The observed differences between solvents reflect the different affinities of these compounds to the liquid phase. The model parameters show good agreement with the experimental data, which confirms the reliability of the process description used (Table 4).
Table 5 summarizes the extraction degrees obtained for TPC, DPPH, FRAP, and ChA enabling a comparison of the effectiveness of the solvents used.
A clear trend is observed in all assays: as the amount of raw material increases, the percentage extraction decreases. This effect results from the limited solvent capacity and progressive saturation of the liquid phase, a phenomenon typical of liquid–solid extraction processes and relevant for process optimization. The highest extraction degrees were obtained at the lowest concentration of plant material (0.5 g/100 mL), indicating more efficient utilization of the solvent. The values presented in Table 5 also provide insight into the extraction of compounds responsible for free radical scavenging activity (DPPH). The extraction degree for these compounds was markedly lower than for TPC—at 5 g/L, it reached only 11% (acetone), 13% (ethanol), and 9% (isopropanol), and decreased to approximately 1% for all solvents at 50 g/L. This rapid decline confirms the fast saturation of the solvent with the DPPH-active fraction and indicates that these compounds represent a distinct chemical group, not directly corresponding to the total polyphenol content. Table 5 further shows the extraction degree of compounds responsible for reducing Fe3+ ions (FRAP). In extracts obtained using ethanol and acetone, the values indicate nearly complete extraction within the entire concentration range studied. Thus, although the model may generate values exceeding physically achievable limits, these results should be interpreted as representing approximately 100% extraction. The decrease in extraction at higher concentrations results from solvent saturation with reducing compounds, while the very low values for isopropanol confirm its limited ability to extract Fe3+ reducing constituents. Based on the same dataset, the extraction degree of Fe2+ chelating compounds (ChA) was also determined. The highest values were obtained for acetone and isopropanol extracts, indicating their high efficiency throughout the studied concentration range. As in other cases, the reduced efficiency at the highest concentrations of plant material is most likely associated with saturation of the solvent with chelating compounds.
Figure 6 shows the relationship between the FRAP parameter values for the solvents used as a function of the concentration of the extracted material.
Figure 6 shows the relationship between the reducing capacity of C. palustre extracts, determined using the FRAP method, and the concentration of plant material. With an increase in the amount of raw material, a systematic increase in FRAP values is observed, especially for acetone and ethanol extracts, where the use of 50% solutions of these solvents causes an almost linear increase in the parameter. This indicates the high efficiency of the extraction of compounds capable of reducing Fe3+ ions to Fe2+. The lower values obtained for 50% isopropanol and the non-linear nature of the relationship (in accordance with Equation (4)) indicate limited extraction of compounds with reducing properties. The convergence of the FRAP trend with the DPPH test results confirms the multi-mechanism nature of the antioxidant activity of polyphenols present in C. palustre. In the case of extraction assessed by the FRAP method, the use of 50% acetone and ethanol solutions causes a linear increase in the parameter value, while for isopropanol a nonlinear relationship is observed, described by Equation (4) [36].
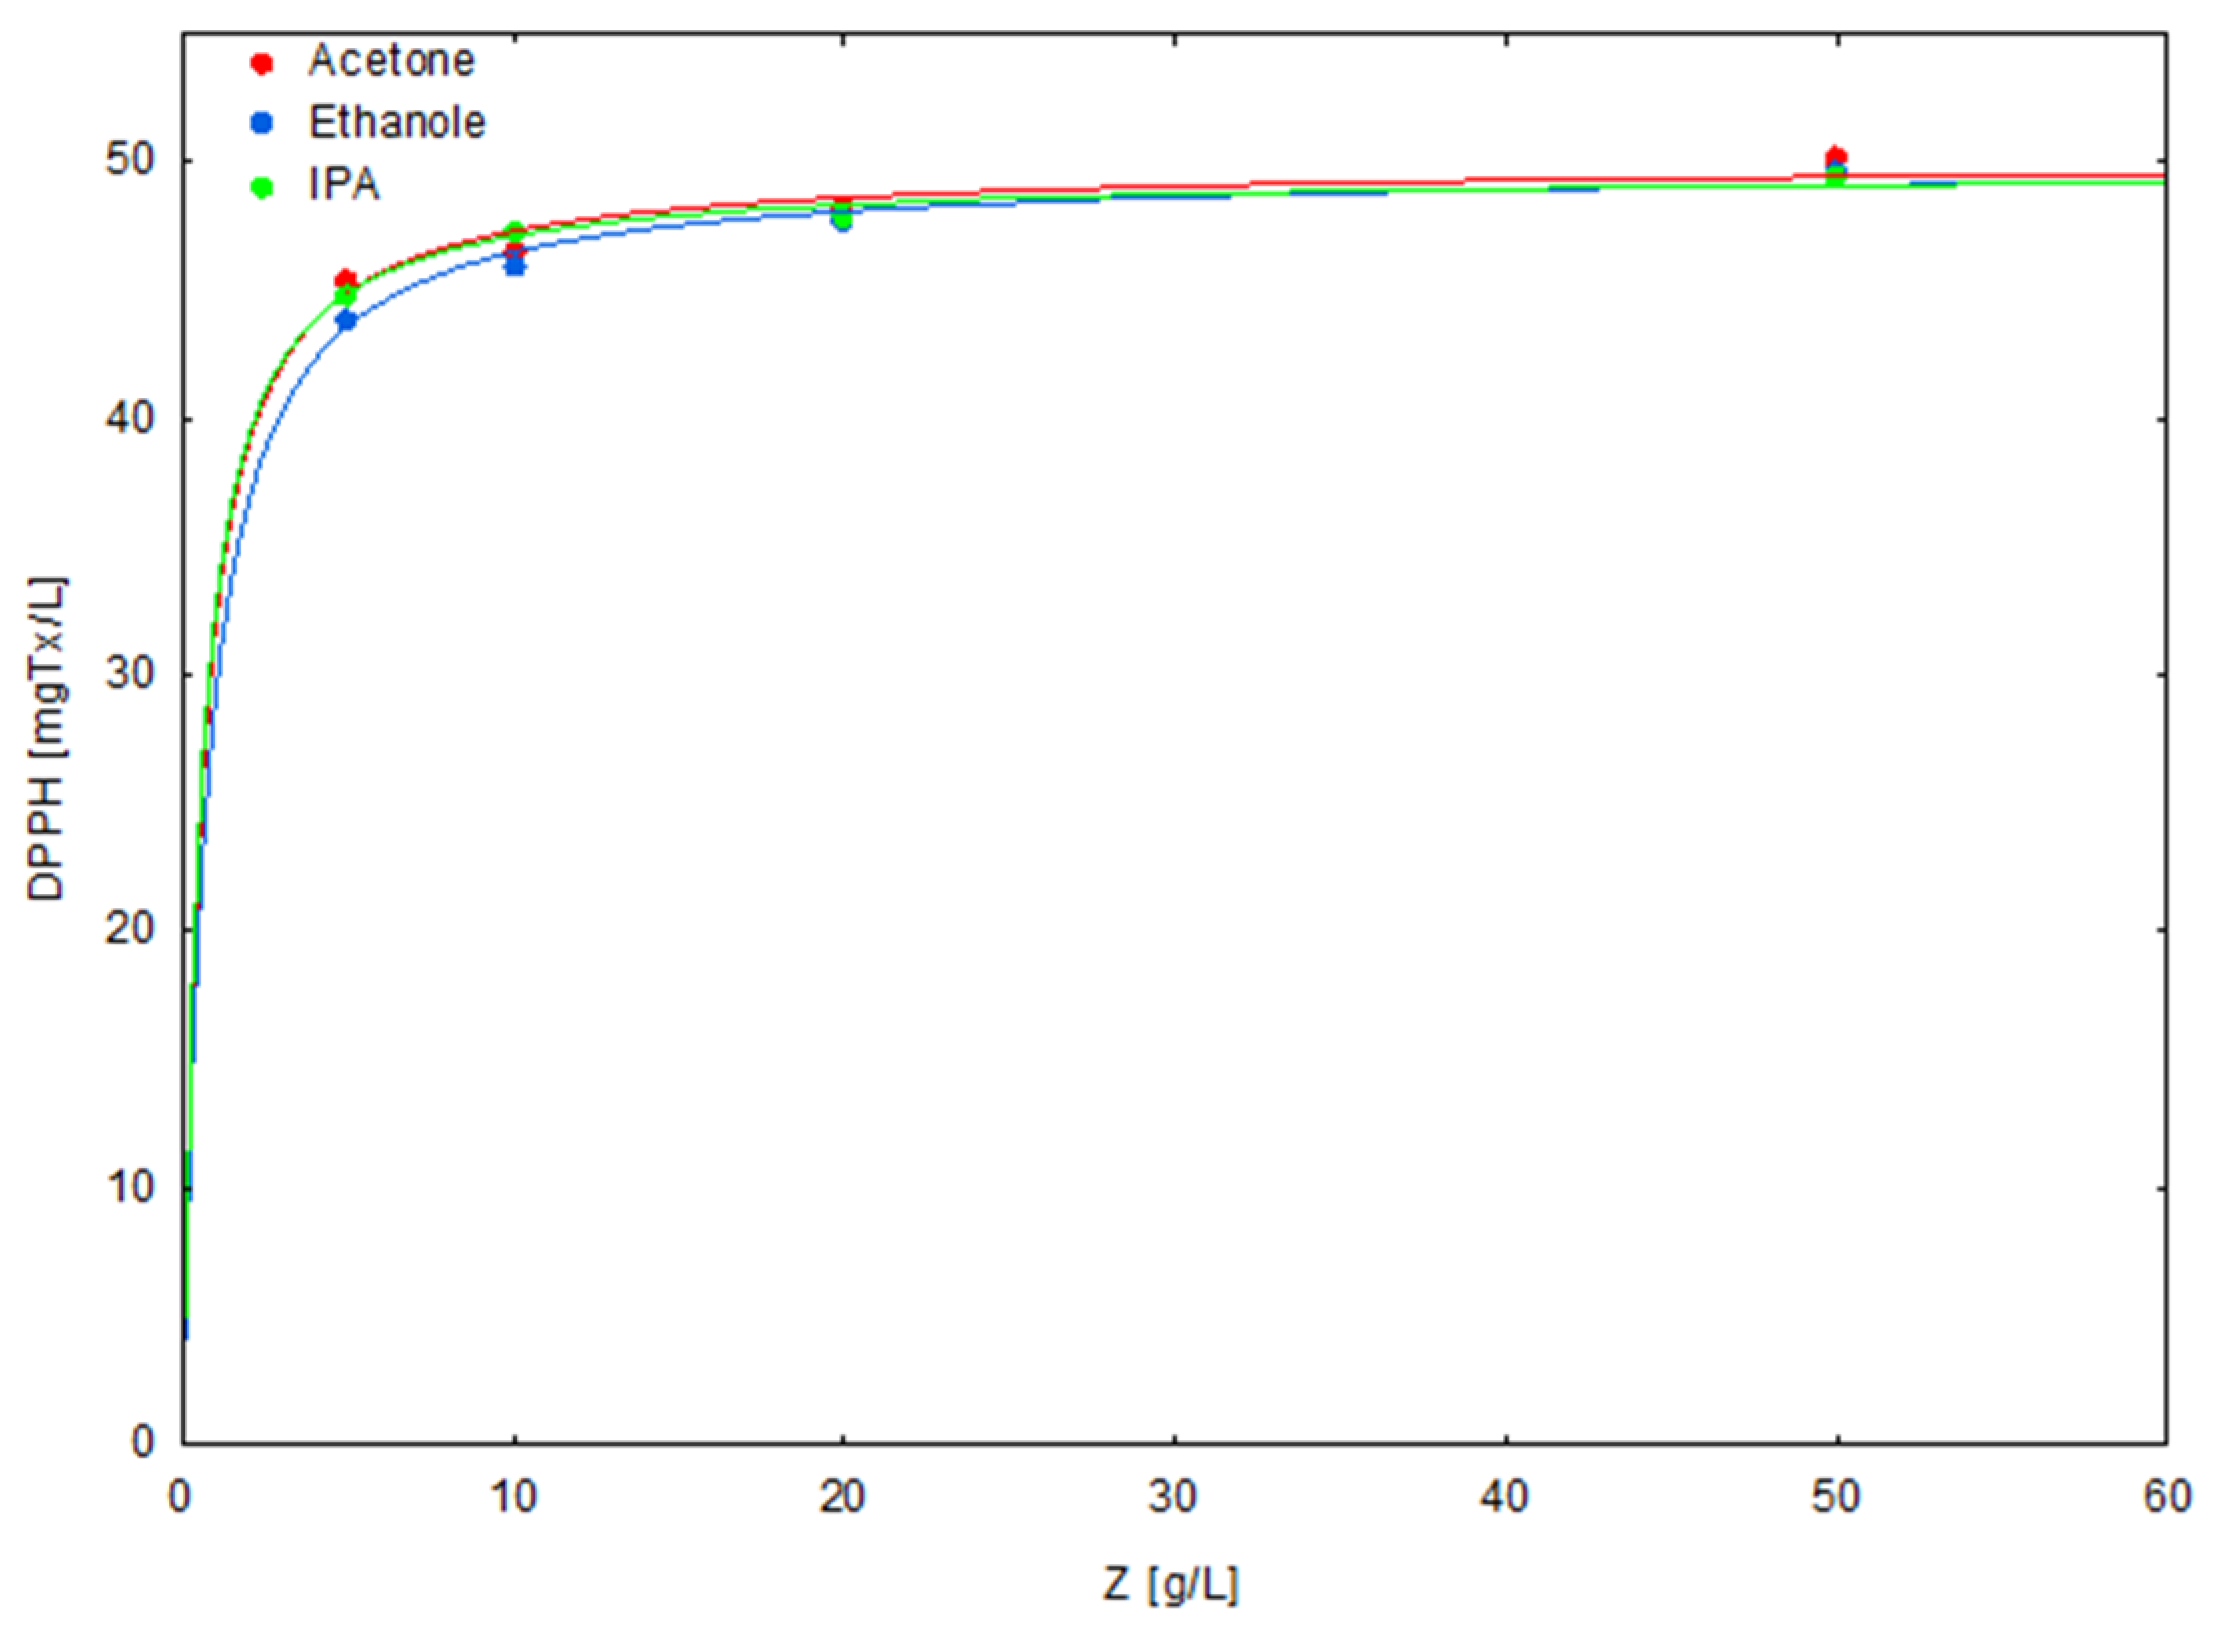
Figure 7 shows the correlation between antioxidant activity (DPPH) and the concentration of the extracted material for the solvents: ethanol, isopropanol, and acetone used for the extraction of C. palustre.
Figure 7 shows the relationship between DPPH free radical scavenging capacity (mg Tx/L) and the concentration of C. palustre raw material used for extraction with different solvents. As the amount of material increases, antioxidant activity increases, reaching a plateau at concentrations above approximately 20 mg Tx/L. The highest antioxidant activity values were obtained for acetone extracts (approx. 52 mg Tx/L), slightly lower for ethanol and isopropanol (approx. 50 mg Tx/L). However, the degree of extraction (Table 5) is lower than in the case of TPC, which indicates that the activity assessed by the DPPH test is determined by a specific fraction of compounds with a high DPPH radical reduction capacity, rather than by the total polyphenol content. The lack of a linear correlation between TPC and DPPH suggests selective extraction of compounds with high antioxidant potential, rather than uniform release of the entire pool of polyphenols [37].
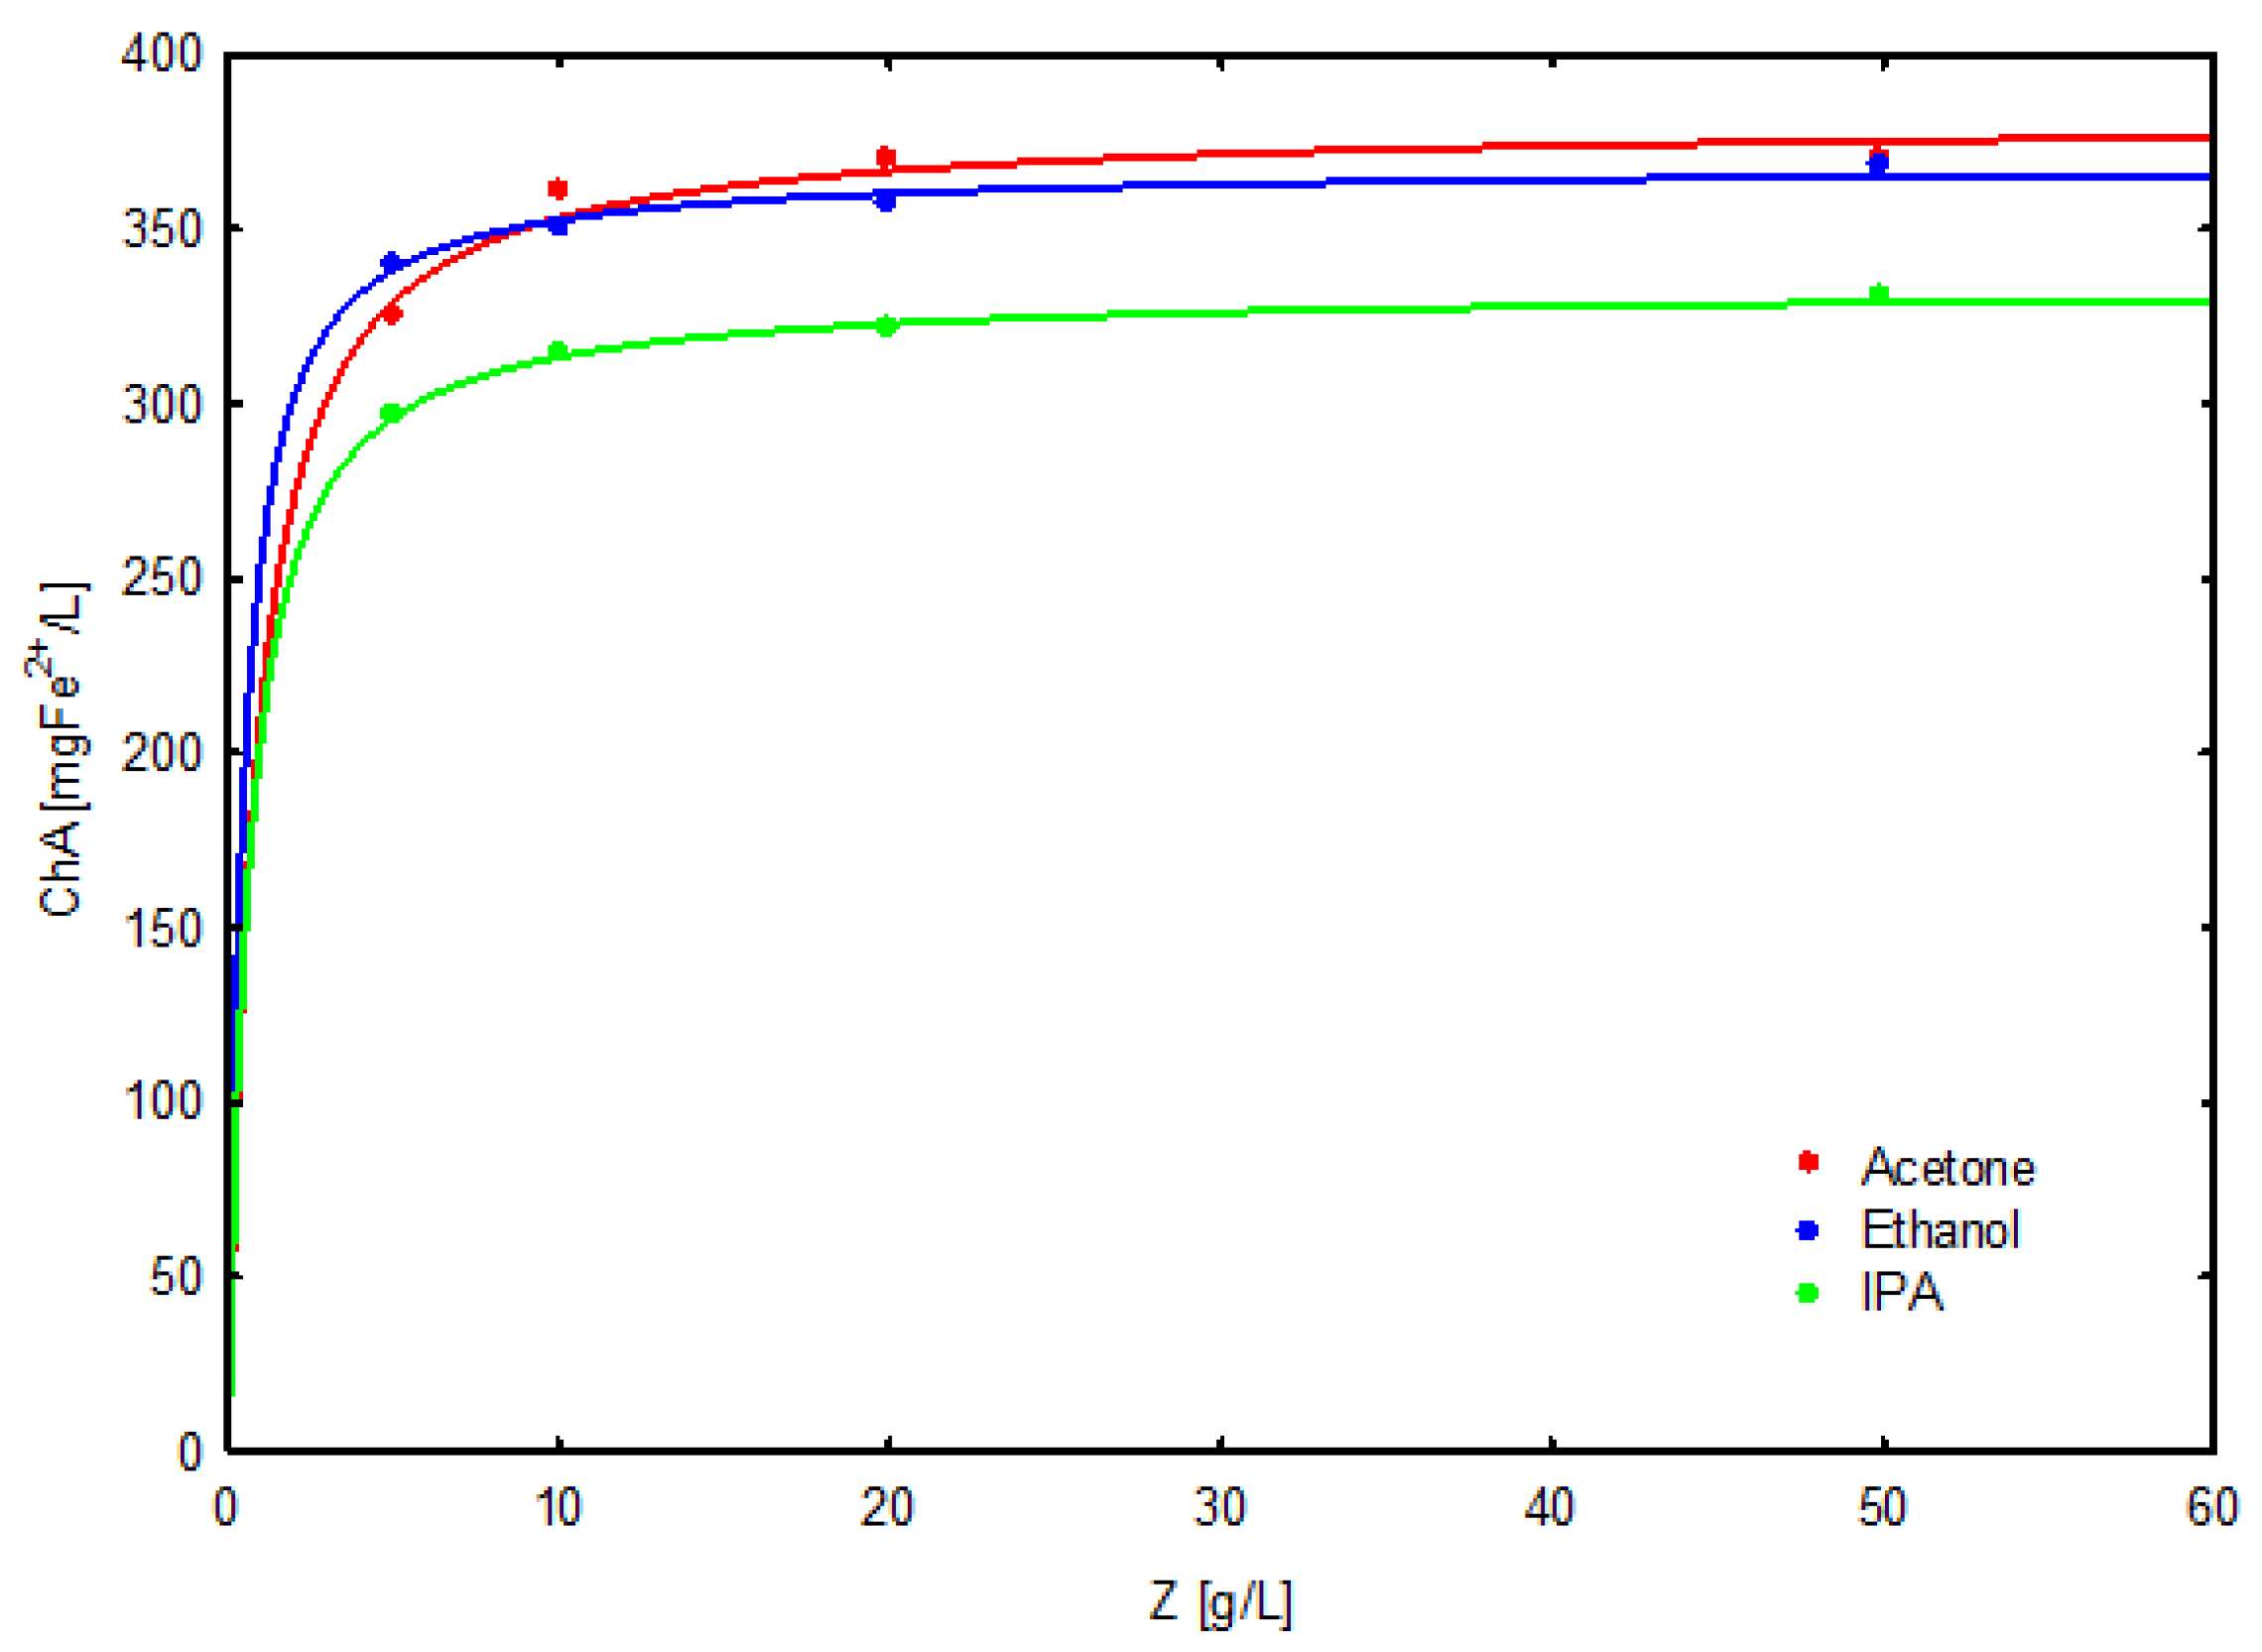
Figure 8 shows the dependence of the ChA parameter value for the solvents used as a function of the concentration of the extracted material.
Figure 8 shows the relationship between the chelating activity (ChA) of C. palustre extracts and the concentration of plant material used in the extraction process. For all solvents, an increase in raw material concentration results in a rapid rise in ChA values, followed by a clear tendency toward saturation. The highest ChA values are observed for acetone extracts, followed by ethanol, while isopropanol shows the lowest extraction efficiency of compounds capable of binding Fe2+ ions. The asymptotic character of the curves indicates that the extraction of chelating components approaches equilibrium as the solvent becomes saturated with active compounds (Figure 8).

4. Discussion

Comparison of the effectiveness of extraction using solvents—ethanol (Et), isopropanol (Ipa), and acetone (Ac)—under optimal conditions (Et, Ipa, and Ac concentration at 50% v/v and extraction time of 5 min), for the DPPH, FRAP, TPC, and ChA parameters, showed significant differences in the antioxidant activity of the extracts obtained from C. palustre. The highest DPPH and FRAP values were recorded for extraction using acetone as the extractant. In turn, the use of ethanol made it possible to obtain extracts characterized by the highest total polyphenol content (TPC), which confirms its high efficiency in isolating this group of compounds (Figure 1A–D, Figure 2A–D and Figure 3A–D) [38,39]. The obtained regression models are descriptive of the experimental data and can support preliminary optimization within the tested conditions; however, due to the lack of center-point replicates, their predictive performance beyond the experimental region cannot be confirmed (Table 1). The implications of the results indicate that the use of predictive models enables the design of extraction processes in a more efficient manner, reducing costs and operation time, and allows the parameters to be adjusted to obtain extracts with a specific bioactive profile. Furthermore, the ability to predict the isolation efficiency of lipophilic and hydrophilic compounds opens up prospects for applications in the food, cosmetics, and pharmaceutical industries, where products with high antioxidant activity and stability are required (Table 1). Analysis of extreme values and response surfaces indicates that the main factor determining the effectiveness of C. palustre extraction is the concentration of the solvent. For antioxidant parameters (DPPH, FRAP, ChA) and total polyphenol content (TPC), optimal conditions include moderate concentrations of ethanol, isopropanol, or acetone (approx. 50% v/v) and a short extraction time (approx. 5 min), which allows for the highest antioxidant activity and polyphenol content values (Figure 1A–D, Figure 2A–D and Figure 3A–D). The high Fe2+ chelating capacity of C. palustre extracts (>330 mg Fe2+/L) is consistent with findings for Rubus matsumuranus [13], whose leaves also show strong antioxidant and chelating activity. This effect has been attributed primarily to phenolic compounds—especially ellagitannins, gallotannins, and flavonoids (quercetin and kaempferol derivatives, catechin, epicatechin), which effectively form complexes with Fe2+ ions. In R. matsumuranus, these compounds also determine overall antioxidant capacity, combining both radical-scavenging and metal-chelating mechanisms. Seasonal studies further indicate that the content of key phenolics varies with plant development: gallic acid derivatives peak in May, catechins and flavonols during flowering in July, and ellagitannins (e.g., lambertianin C, sangwina H6) also reach maximum levels at this stage, followed by increased ellagic acid during fruiting due to tannin hydrolysis. These patterns support the conclusion that the composition of phenolic compounds strongly influences the chelating behavior observed in C. palustre extracts [13].
The mathematical model parameters (TPCmax, K, Umax) confirm clear solvent-dependent selectivity in the extraction of phenolic compounds. Ethanol exhibited the highest Umax (0.76 mmol/g) and the highest equilibrium constant K, indicating its superior ability to solubilize a broad spectrum of phenolics compared to isopropanol and acetone (Table 4). As the amount of C. palustre increased, the percentage extraction of TPC dropped markedly—from 48%, 37%, and 46% at 5 g/L to 10%, 7%, and 11% at 50 g/L—reflecting solvent saturation and diffusion limitations (Table 5). This pattern is consistent with literature showing that medium-polarity alcohol–water mixtures are most effective for phenolic extraction [35]. TPC increased with raw-material concentration for all solvents but plateaued above 0.2 g/100 mL, confirming extraction equilibrium (Figure 5), a trend widely reported for phenolic systems [40]. Ethanol produced the highest TPC (7 g GAE/L), followed by isopropanol and acetone, supporting previous findings that ethanol–water mixtures extract diverse phenolic subclasses with high efficiency [35]. In contrast, DPPH activity reached a plateau above 20 g/L, with acetone showing the highest values (52 mg Tx/L) (Figure 7). The low extraction degree for DPPH compared to TPC (Table 5) suggests that radical-scavenging activity depends on a specific phenolic fraction rather than total polyphenol content, consistent with earlier studies on selective extraction of highly active phenolics [28]. Isopropanol showed a higher Umax in the DPPH test (95 mg Tx/g) and the highest K value (1.9 L/g), indicating enhanced solubilization of redox-active compounds despite its lower TPC—an effect also observed in optimized extraction studies [28]. FRAP values increased with solvent concentration and were highest for acetone and ethanol, indicating efficient extraction of Fe3+ reducing compounds (Figure 6). The convergence of FRAP and DPPH trends demonstrates that antioxidant activity in C. palustre is governed by selective enrichment of compounds with strong reducing potential rather than by total polyphenol levels [41]. The results clearly demonstrate solvent selectivity in extracting Fe3+ reducing and antioxidant compounds. Ethanol produced the highest FRAPmax values, while ethanol and acetone showed consistently high extraction efficiency across all concentration ranges, confirming earlier observations for C. palustre [28]. The reduced efficiency at higher solid loadings reflects solvent saturation. Literature consistently indicates that extraction yield strongly influences TPC, TFC, and antioxidant activity (DPPH, FRAP) [41,42]. Importantly, these relationships are non-linear: increases in TPC do not always proportionally enhance radical-scavenging activity because different phenolic subclasses contribute unequally to the DPPH mechanism [41]. Our results for R. matsumuranus are consistent with this non-linearity. Studies on N. leucophylla further confirm that solvent polarity determines the bioactive profile of extracts. Methanol (a highly polar solvent) yielded the highest TPC, TFC, DPPH, and FRAP values, whereas less polar chloroform and hexane produced significantly weaker extraction of phenolics [41]. Extraction technique also modulates selectivity: Soxhlet enhanced TPC and FRAP due to continuous warm solvent flow, while ultrasound-assisted extraction favored flavonoid release (higher TFC), illustrating the differential sensitivity of compound classes to mass-transfer intensification. For nonpolar compounds such as neophytadiene (NFD) and phytol, our models correctly predicted maximum yields at 100% organic solvent. Both compounds have very high log p values (phytol ~8; NFD ~9), indicating strong lipophilicity and poor solubility in aqueous mixtures. Therefore, only pure organic solvents can effectively dissolve and extract them. Similar patterns have been documented in optimized extraction of lipophilic terpenoids from A. atropilosus, where ultrasound-assisted extraction combined with RSM enabled high yields of hydrophobic compounds such as β-sitosterol and lupeol [43]. These findings corroborate the mechanistic rationale behind our model predictions for NFD and phytol.
Studies on the Geraniaceae family show that many species possess strong antibacterial, antifungal, and immunomodulatory properties linked to terpene-rich volatile fractions, particularly neophytadiene and phytol. GC–MS profiles consistently indicate high phytol abundance in extracts from Geranium sanguineum (17.8%), G. robertianum (19.3%), and G. pyrenaicum (10.4%). Other species such as G. palustre and G. columbinum also contain notable amounts of phytol (9.9–29.5%) and neophytadiene (8.9–10.5%), despite differences in dominant terpene classes. Even in G. lucidum, where sesquiterpenes prevail, phytol remains a major contributor to the bioactive profile, supporting the cosmetic and antioxidant potential of these extracts [44,45,46]. For lipophilic compounds such as neophytadiene and phytol, our results confirm a monotonic increase in extraction yield with increasing solvent concentration, consistent with their high log p values. Maximum responses occur above 60% v/v, and for neophytadiene even beyond the tested range (>100% v/v). Phytol shows local maxima at 69–79% v/v (isopropanol, acetone), likely due to the slight solubility-enhancing effect of limited water content. These patterns highlight the need to tailor extraction conditions depending on whether the goal is high antioxidant activity (TPC, DPPH) or efficient isolation of lipophilic terpenoids (Figure 1E,F, Figure 2E,F and Figure 3E,F). Similar relationships were observed by Luo et al. [47], who identified phytol and neophytadiene as key components in methanol and chloroform extracts of Meyna laxiflora. Their presence contributed to marked antioxidant activity, with the methanol extract showing 48.88% ± 0.60 DPPH inhibition at 1 µg/mL and a low IC50 of 31.60 µg/mL—values comparable to ascorbic acid [48]. The antioxidant potential is consistent with known properties of phytol, which effectively scavenges reactive oxygen species and protects lipids from peroxidation [49,50].
Neophytadiene also exhibits anti-inflammatory and antioxidant activity, further enhancing the overall protective potential of the extracts [45,46]. In C. palustre, the presence of neophytadiene and phytol is particularly valuable for cosmetic applications, as both terpenoids counteract oxidative-stress-induced skin aging and show antibacterial effects. Their activity suggests that these compounds largely determine the biological value of the raw material and support its use in protective and regenerative cosmetic formulations [47,51]. Similar observations were reported by Shaikha et al. [52], who identified high levels of neophytadiene (11.02%) and phytol (6.0%) in methanol extracts of Coffea simplicifolia. These terpenoids contributed substantially to the extract’s antioxidant capacity, with DPPH scavenging activity increasing from 46.18% RSA at 20 µg/mL to 85.05% RSA at 100 µg/mL [52]. This strong activity reflects the synergistic action of phytochemicals, among which terpenoids play a central role [53,54].

5. Study Limitations

It should be noted that the experimental design did not include replicated center points, which prevented the estimation of pure experimental error and made the calculation of the Lack-of-Fit (LoF) statistic impossible. As a consequence, the mean square error (MS) in all ANOVA tables represents only the residual variance of the fitted model and cannot be interpreted as pure error. Therefore, the regression models should be considered descriptive of the experimental data rather than fully predictive within the design space. This limitation also indicates the potential risk of over-modeling and emphasizes the necessity of additional center-point replicates in future studies to validate model robustness and predictive reliability. The FRAPmax parameter obtained from the model is a mathematical projection and exceeds the stoichiometric capacity of the FRAP reagent. It should therefore be treated only as a curve-fitting parameter rather than a physically achievable maximum. The RSM polynomial model can generate non-physical negative values outside the optimal range, so it should not be extrapolated to boundary conditions.

6. Conclusions

The extraction of C. palustre was optimized using Response Surface Methodology (RSM) to evaluate the effects of solvent concentration and extraction time on antioxidant activity (DPPH, FRAP, ChA), total phenolic content (TPC), and the yields of the lipophilic terpenoids neophytadiene (NFD) and phytol. Solvent concentration was the dominant factor influencing all analytical parameters.
Across all assays, solvent effectiveness followed the order: Acetone > Ethanol > Isopropanol. Acetone produced the highest FRAP values and the strongest DPPH activity. Ethanol resulted in the greatest TPC values, intermediate FRAP activity, and the highest ChA, whereas isopropanol was consistently the least effective solvent.
Extraction behavior of lipophilic terpenoids aligned with their physicochemical properties. Yields of both NFD and phytol increased with solvent concentration, reflecting their high log p values. NFD required neat (100%) organic solvent, as its extraction was limited by the presence of water. Phytol reached maximum yields above 60% v/v solvent, consistent with limited water interactions due to its hydroxyl group. GC–MS analysis confirmed the presence of both terpenoids in optimized extracts, indicating potential biological relevance. Literature describing their antioxidants and antibacterial activities suggests the possible use of C. palustre extracts in cosmetic applications.
Given the extract’s antioxidant capacity, high polyphenolic content, and terpenoid profile, further research is needed to evaluate topical applicability. Future work should include ex vivo skin penetration studies of active ingredients through the skin using the ex vivo method and quantitative analysis of individual phenolic acids using the HPLC technique.
Future research should include replicated center points to enable proper Lack-of-Fit evaluation.

Supplementary Materials

The following supporting information can be downloaded at: https://www.mdpi.com/article/10.3390/app16041893/s1, S1.1. GC–MS Analysis of C. palustre Extract; S1.2. Assessment of Antioxidant Activity Using the DPPH Method; S1.3. Assessment of Antioxidant Activity Using the FRAP Method; S1.4. Determination of Total Polyphenol Content Using the Folin–Ciocalteu Method; S1.5. Evaluation of Fe2+ Ion Chelating Activity.

Author Contributions

Conceptualizations, O.T., Ł.K., E.K. and R.P.; methodology, O.T., A.M., Ł.K., E.K. and R.P.; software, O.T. and R.P.; formal analysis, O.T., Ł.K., E.K. and R.P.; investigation, O.T., Ł.K., E.K. and R.P.; resources, O.T., A.M., Ł.K., E.K. and R.P.; data curation, O.T., Ł.K., E.K. and R.P.; writing—original draft preparation, O.T. and E.K.; writing—reviewing and editing, O.T. and E.K.; visualization, O.T., A.M., Ł.K., E.K. and R.P.; supervision, Ł.K., E.K. and R.P.; project administration, O.T., Ł.K., E.K. and R.P.; funding acquisition, O.T., Ł.K., E.K. and R.P. All authors have read and agreed to the published version of the manuscript.

Funding

This research received no external funding.

Institutional Review Board Statement

Not applicable.

Informed Consent Statement

Not applicable.

Data Availability Statement

Most of the data are provided in this work. Other data that support the findings of this study are available from the corresponding author upon reasonable request.

Conflicts of Interest

The authors declare no conflicts of interest.

References

  1. Somme, L.; Mayer, C.; Raspé, O.; Jacquemart, A.-L. Influence of spatial distribution and size of clones on the realized outcrossing rate of the marsh cinquefoil (Comarum palustre). Ann. Bot. 2014, 113, 477–487. [Google Scholar] [CrossRef]
  2. Rengasamy, K.R.R.; Mahomoodally, M.F.; Joaheer, T.; Zhang, Y. A systematic review of traditionally used herbs and animal-derived products as potential analgesics. Curr. Neuropharmacol. 2021, 19, 553–588. [Google Scholar] [CrossRef]
  3. Das, G.; Das, S.; Talukdar, A.D.; Venil, C.K.; Bose, S.; Banerjee, S.; Shin, H.-S.; Gutiérrez-Grijalva, E.P.; Heredia, J.B.; Patra, J.K. Pharmacology and ethnomedicinal potential of selected plants species from Apiaceae (Umbelliferae). Curr. Comput. Aided Drug Des. 2023, 26, 256–288. [Google Scholar] [CrossRef]
  4. Ajebli, M.; Eddouks, M. The promising role of plant tannins as bioactive antidiabetic agents. Curr. Med. Chem. 2019, 26, 4852–4884. [Google Scholar] [CrossRef]
  5. Singh, S.; Semwal, B.C.; Sharma, H.; Sharma, D. Impact of phytomolecules with nanotechnology on the treatment of inflammation. Curr. Bioact. Compd. 2023, 19, e070823219471. [Google Scholar] [CrossRef]
  6. Strugar, J.; Povydysh, M. Chemical components of Comarum palustre L. and their biological activity. Med. Pharmaceut. J. Puls 2020, 22, 126–140. [Google Scholar] [CrossRef]
  7. Strugar, Y.; Orlova, A.A.; Ponkratova, A.A.; Whaley, A.K.; Povydysh, M.N. Isolation of individual compounds from the aerial part of Comarum palustre L. and structure elucidation using spectroscopic methods. Drug Dev. Regist. 2022, 11, 177–184. [Google Scholar] [CrossRef]
  8. Pobłocka-Olech, L.; Isidorov, V.A.; Krauze-Baranowska, M. Characterization of secondary metabolites of leaf buds of Populus species using GC–MS and 2D-HPTLC with antioxidant activity assessment. Int. J. Mol. Sci. 2024, 25, 3971. [Google Scholar] [CrossRef]
  9. Ahmad, S.; Ullah, F.; Sadiq, A.; Ayaz, M.; Imran, M.; Ali, I.; Zeb, A.; Ullah, F.; Shah, M.R. Chemical composition and antioxidant and anticholinesterase potentials of Rumex hastatus essential oil. BMC Complement. Altern. Med. 2016, 16, 29. [Google Scholar] [CrossRef] [PubMed]
  10. Szadkowska, D.; Chłopecka, M.; Strawa, J.W.; Jakimiuk, K.; Augustynowicz, D.; Tomczyk, M.; Mendel, M. Effects of Cirsium palustre extracts and their main flavonoids on colon motility: An ex vivo study. Int. J. Mol. Sci. 2023, 24, 17283. [Google Scholar] [CrossRef]
  11. Olennikov, D.N. Ellagitannins and other phenolic compounds from Comarum palustre. Chem. Nat. Compd. 2016, 52, 721–723. [Google Scholar] [CrossRef]
  12. Sila, D.N.; Van Buggenhout, S.; Duvetter, T.; Fraeye, I.; De Roeck, A.; Van Loey, A.; Hendrickx, M. Pectins in processed fruits and vegetables: Part II. Structure–function relationships. Compr. Rev. Food Sci. Food Saf. 2009, 8, 86–104. [Google Scholar] [CrossRef]
  13. Kashchenko, N.I.; Olennikov, D.N.; Chirikova, N.K. Metabolites of Siberian raspberries: LC–MS profile and antioxidant activity. Plants 2021, 10, 2317. [Google Scholar] [CrossRef]
  14. Strugar, J.; Orlova, A.A.; Povydysh, M.N. Comparative GC–MS analysis of above- and underground metabolites of Comarum palustre L. Drug Dev. Regist. 2021, 10, 95–103. [Google Scholar] [CrossRef]
  15. Ahmed, T.; Rana, M.R.; Hossain, M.A.; Ullah, S.; Suzauddula, M. Optimization of ultrasound-assisted extraction of Hibiscus sabdariffa calyces by RSM. Biomass Convers. Biorefinery 2024, 14, 28985–28999. [Google Scholar] [CrossRef]
  16. Drouet, S.; Leclerc, E.A.; Garros, L.; Tungmunnithum, D.; Kabra, A.; Abbasi, B.H.; Lainé, É.; Hano, C. Green ultrasound-assisted extraction of flavonolignans from Silybum marianum. Antioxidants 2019, 8, 304. [Google Scholar] [CrossRef]
  17. Rao, M.J.; Zheng, B. Role of polyphenols in abiotic stress tolerance. Antioxidants 2025, 14, 74. [Google Scholar] [CrossRef]
  18. Frade, J.; Ferreira, N.; Barbosa, R.; Laranjinha, J. Mechanisms of neuroprotection by polyphenols. Curr. Med. Chem. Cent. Nerv. Syst. Agents 2005, 5, 307–318. [Google Scholar] [CrossRef]
  19. Korkina, L.; De Luca, C.; Kostyuk, V.; Pastore, S. Plant polyphenols and tumors: From mechanisms to therapies. Curr. Med. Chem. 2009, 16, 3943–3965. [Google Scholar] [CrossRef] [PubMed]
  20. Foti, M.C. Antioxidant properties of phenols. J. Pharm. Pharmacol. 2007, 59, 1673–1685. [Google Scholar] [CrossRef] [PubMed]
  21. Priyadarsini, K.I.; Maity, D.K.; Naik, G.H.; Kumar, M.S.; Unnikrishnan, M.K.; Satav, J.G.; Mohan, H. Role of phenolic O–H and methylene hydrogen on free radical reactions and antioxidant activity of curcumin. Free Radic. Biol. Med. 2003, 35, 475–484. [Google Scholar] [CrossRef] [PubMed]
  22. Leopoldini, M.; Russo, N.; Toscano, M. The molecular basis of the working mechanism of natural polyphenolic antioxidants. Food Chem. 2011, 125, 288–306. [Google Scholar] [CrossRef]
  23. Amić, A.; Marković, Z.; Dimitrić Marković, J.M.; Milenković, D.; Stepanić, V. Antioxidative potential of ferulic acid phenoxyl radical. Phytochemistry 2020, 170, 112218. [Google Scholar] [CrossRef]
  24. Aboul-Enein, H.Y.; Kruk, I.; Kładna, A.; Lichszteld, K.; Michalska, T. Scavenging effects of phenolic compounds on reactive oxygen species. Biopolymers 2007, 86, 222–230. [Google Scholar] [CrossRef]
  25. Kucharski, Ł.; Kucharska, E.; Muzykiewicz-Szymańska, A.; Nowak, A.; Pełech, R. Chemical composition, antioxidant potential and antimicrobial activity of novel antiseptic lotion from Betula pendula Roth leaves. Appl. Sci. 2025, 15, 3658. [Google Scholar] [CrossRef]
  26. Krauß, S.; Vetter, W. Phytol and phytyl fatty acid esters: Occurrence, concentrations and relevance. Eur. J. Lipid Sci. Technol. 2018, 120, 1700387. [Google Scholar] [CrossRef]
  27. Gamero-Pasadas, A.; Alcaide, I.V.; Rios, J.J.; Constante, E.G.; Vicario, I.M.; León-Camacho, M. Characterization and quantification of the hydrocarbon fraction of subcutaneous fresh fat of Iberian pig by offline combination of HPLC and GC. J. Chromatogr. A 2006, 1123, 82–91. [Google Scholar] [CrossRef]
  28. Muzykiewicz-Szymańska, A.; Kucharska, E.; Pełech, R.; Nowak, A.; Jakubczyk, K.; Kucharski, Ł. Optimization of ultrasound-assisted extraction for polyphenols and antioxidant activity of Sanguisorba officinalis aerial parts using RSM. Appl. Sci. 2024, 14, 9579. [Google Scholar] [CrossRef]
  29. Kucharska, E.; Wachura, D.; Elchiev, I.; Bilewicz, P.; Gąsiorowski, M.; Pełech, R. Co-fermentation of dandelion leaves (Taraxaci folium) as a strategy to increase antioxidant activity of fermented cosmetic raw materials. Appl. Sci. 2025, 15, 9021. [Google Scholar] [CrossRef]
  30. Karamać, M.; Pegg, R.B. Limitations of the tetramethylmurexide assay for investigating Fe(II) chelation activity of phenolic compounds. J. Agric. Food Chem. 2009, 57, 6425–6431. [Google Scholar] [CrossRef]
  31. Gülçin, İ.; Alwasel, S.H. Metal ions, metal chelators and metal chelating assay as antioxidant method. Processes 2022, 10, 132. [Google Scholar] [CrossRef]
  32. Izadiyan, P.; Hemmateenejad, B. Multi-response optimization of factors affecting ultrasonic extraction from Iranian basil using CCD. Food Chem. 2016, 190, 864–870. [Google Scholar] [CrossRef]
  33. Li, C.; Li, Y.; Gao, X.; Lv, H. Solubility of rutaecarpine in aqueous mixtures of methanol, ethanol, isopropanol and acetone. J. Chem. Thermodyn. 2020, 151, 106253. [Google Scholar] [CrossRef]
  34. Maheswari, C.; Priyanka, E.B.; Thangavel, S.; Vignesh, S.V.R.; Poongodi, C. Multiple regression analysis for prediction of extraction efficiency in mining using industrial IoT. Prod. Eng. 2020, 14, 457–471. [Google Scholar] [CrossRef]
  35. Dai, J.; Mumper, R.J. Plant phenolics: Extraction, analysis, and antioxidant/anticancer properties. Molecules 2010, 15, 7313–7352. [Google Scholar] [CrossRef]
  36. Kiss, A.; Papp, V.A.; Pál, A.; Prokisch, J.; Mirani, S.; Toth, B.E.; Alshaal, T. Comparative study on antioxidant capacity of diverse food matrices. Antioxidants 2025, 14, 317. [Google Scholar] [CrossRef] [PubMed]
  37. Nakilcioğlu-Taş, E.; Ötleş, S. Influence of extraction solvents on phenolic composition and antioxidant capacity of fig seeds. An. Acad. Bras. Ciênc. 2021, 93, e20190526. [Google Scholar] [CrossRef] [PubMed]
  38. Mohammed, E.A.; Abdalla, I.G.; Alfawaz, M.A.; Mohammed, M.A.; Al Maiman, S.A.; Osman, M.A.; Yagoub, A.E.G.A.; Hassan, A.B. Effects of extraction solvents on phenolics and antioxidant activity in aerial parts of root vegetables. Agriculture 2022, 12, 1820. [Google Scholar] [CrossRef]
  39. Sun, C.; Wu, Z.; Wang, Z.; Zhang, H. Effect of ethanol/water solvents on phenolic profiles and antioxidant properties of Beijing propolis. Evid. Based Complement. Altern. Med. 2015, 2015, 595393. [Google Scholar] [CrossRef]
  40. Nowak, A.; Klimowicz, A.; Duchnik, W.; Kucharski, Ł.; Florkowska, K.; Muzykiewicz, A.; Wira, D.; Zielonkabrzezicka, J.; Siedłowska, A.; Nadarzewska, K. Application of green extraction to evaluate antioxidant capacity of fireweed. Herba Pol. 2019, 65, 18–30. [Google Scholar] [CrossRef]
  41. Sharma, A.; Cannoo, D.S. Comparative effects of solvents on polyphenols and antioxidant activity of Nepeta leucophylla. J. Food Biochem. 2017, 41, e12337. [Google Scholar] [CrossRef]
  42. Zulkifli, S.A.; Abd Gani, S.S.; Zaidan, U.H.; Halmi, M.I.E. Optimization of phenolic content and antioxidant activity of pitaya seed extract. Molecules 2020, 25, 787. [Google Scholar] [CrossRef] [PubMed]
  43. Alam, P.; Siddiqui, N.; Alqahtani, A.; Haque, A.; Basudan, A.O.; Alqasoumi, I.S.; AL Mishari, A.A.; Khan, M.U. RSM-based optimization of ultrasound extraction of β-sitosterol and lupeol from Astragalus atropilosus. Asian Pac. J. Trop. Biomed. 2020, 10, 281. [Google Scholar] [CrossRef]
  44. Ilić, M.D.; Marčetić, M.D.; Zlatković, B.K.; Lakušić, B.S.; Kovačević, N.N.; Drobac, M.M. Volatile compounds of eight Geranium species from Serbia. Chem. Biodivers. 2020, 17, e1900544. [Google Scholar] [CrossRef] [PubMed]
  45. Rajeswaran, S.; Rajan, D.K. Neophytadiene: Biological activities and drug development prospects. Phytomedicine 2025, 143, 156872. [Google Scholar] [CrossRef]
  46. Hasballah, K.; Murniana, M.; Diah, M.; Rusly, R.; Fadlia, Y.; Amna, U.; Husni, M. Antibacterial, antioxidant and anti-aging activities of Cassia siamea extract. Narra X 2025, 3, e236. [Google Scholar] [CrossRef]
  47. Luo, H.; Cao, G.; Luo, C.; Tan, D.; Vong, C.T.; Xu, Y.; Wang, S.; Lu, H.; Wang, Y.; Jing, W. Emerging pharmacotherapy for inflammatory bowel diseases. Pharmacol. Res. 2022, 178, 106146. [Google Scholar] [CrossRef]
  48. Ibe, C.I.; Ajaegbu, E.E.; Ajaghaku, A.A.; Eze, P.M.; Onyeka, I.P.; Ezugwu, C.O.; Okoye, F.B.C. Antioxidant potential of Piliostigma thonningii extracts. Phytomedicine Plus 2022, 2, 100335. [Google Scholar] [CrossRef]
  49. Costa, J.; Islam, M.; Santos, P.; Ferreira, P.B.; Oliveira, G.L.S.; Alencar, M.V.O.B.; Paz, M.F.C.J.; Ferreira, É.L.F.; Feitosa, C.M.; Citó, A.M.G.L.; et al. Evaluation of antioxidant activity of phytol in preclinical models. Curr. Pharm. Biotechnol. 2016, 17, 1278–1284. [Google Scholar] [CrossRef]
  50. Alencar, M.V.O.B.; Islam, M.T.; Ali, E.S.; Santos, J.V.O.; Paz, M.F.C.J.; Sousa, J.M.C.; Dantas, S.M.M.; Mishra, S.K.; Cavalcante, A.A.C.M. Toxic and cytotoxic activities of phytol: A systematic review. Anti Cancer Agents Med. Chem. 2019, 18, 1828–1837. [Google Scholar] [CrossRef]
  51. Mohamad Said, K.A.; Mohamed Amin, M.A. Overview of response surface methodology in extraction processes. J. Adv. Sci. Res. 2016, 2, 161. [Google Scholar] [CrossRef]
  52. Shaikh, H.Y.; Niazi, S.K.; Bepari, A.; Assiri, R.A. Phytochemical screening, GC–MS profiling and antioxidant activity of Cleome simplicifolia. Appl. Sci. 2023, 14, 46. [Google Scholar] [CrossRef]
  53. Chen, X.; Li, H.; Zhang, B.; Deng, Z. Synergistic and antagonistic antioxidant interactions of dietary phytochemical combinations. Crit. Rev. Food Sci. Nutr. 2022, 62, 5658–5677. [Google Scholar] [CrossRef] [PubMed]
  54. Graßmann, J. Terpenoids as plant antioxidants. In Vitamins & Hormones; Elsevier: San Diego, CA, USA, 2005; Volume 72, pp. 505–535. [Google Scholar] [CrossRef]
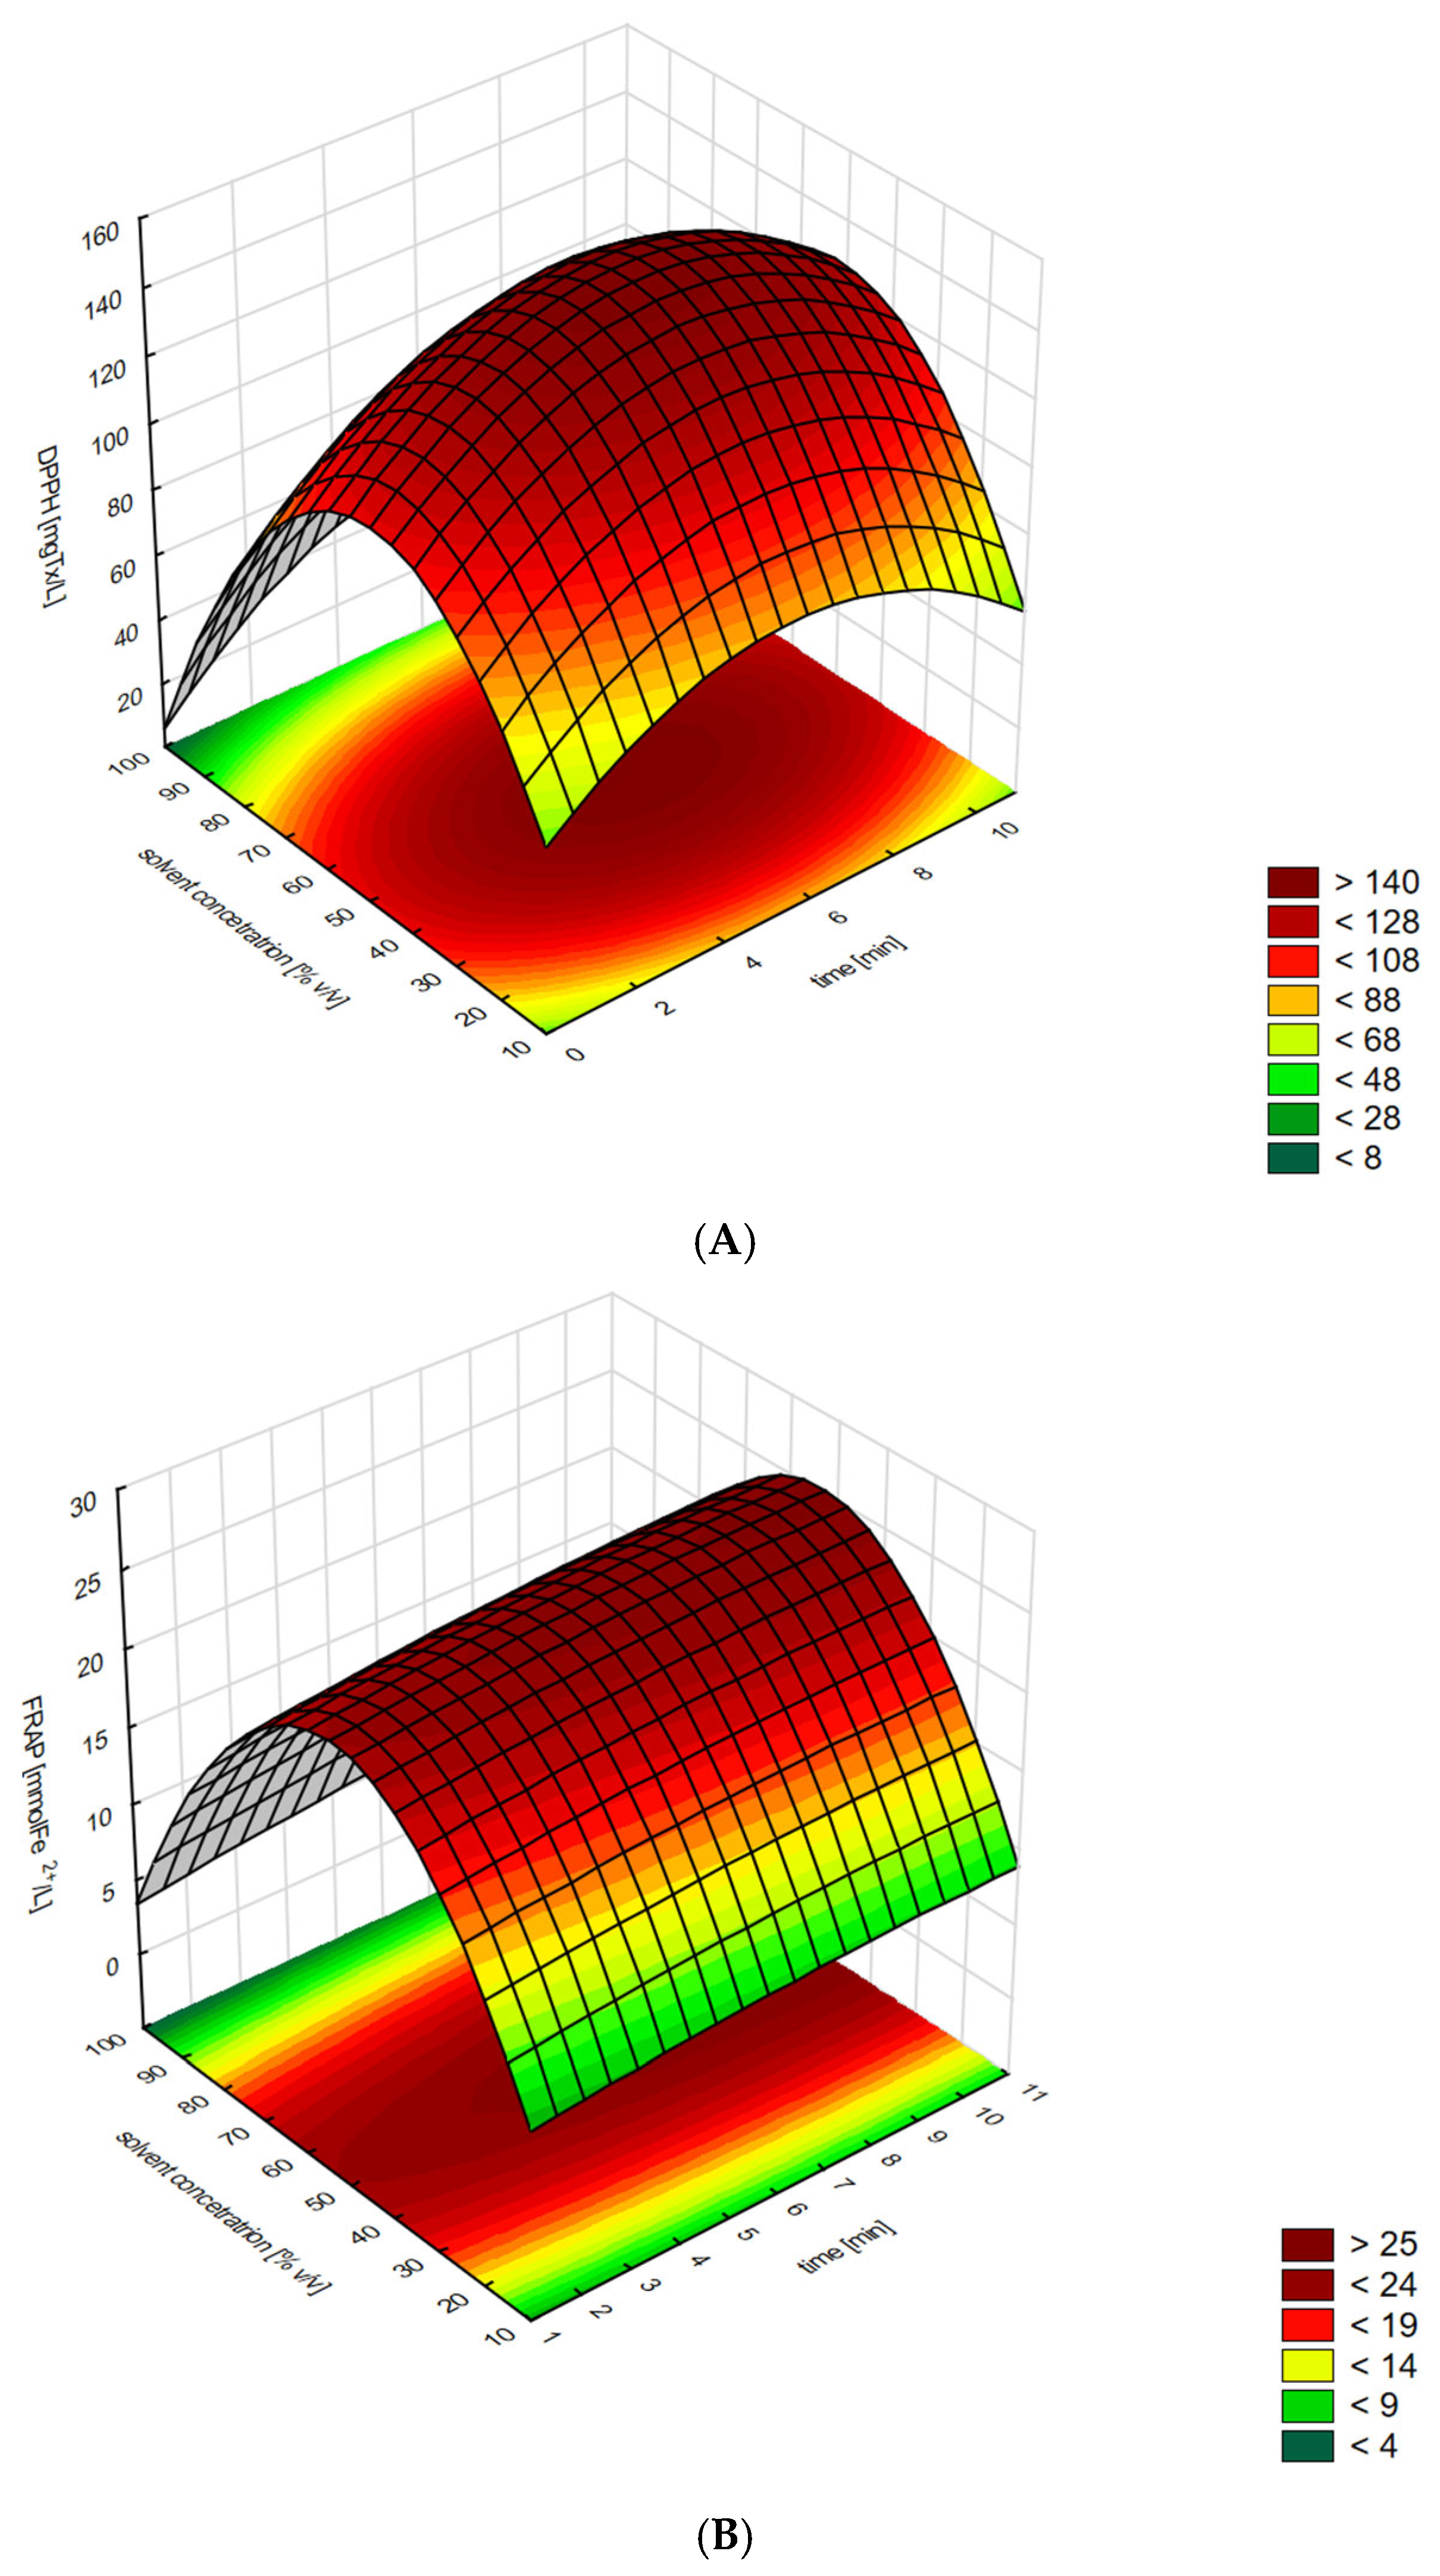
Figure 1. Effects of ethanol based on solvent extraction concentration and extraction time (constant process parameters: raw material concentration 5 g/100 mL, extraction temperature 30 °C): (A): changes in antioxidant activity (DPPH); (B): changes in antioxidant activity (FRAP); (C): changes in chelating activity (ChA); (D): changes in total polyphenol content (TPC); (E): changes in extraction yield relative to neophytadiene (NFD yield); (F): changes in extraction yield relative to phytol (phytol yield).
Applsci 16 01893 g001aApplsci 16 01893 g001bApplsci 16 01893 g001c
Figure 2. Effects of isopropanol based on solvent extraction concentration and extraction time (constant process parameters: raw material concentration 5 g/100 mL, extraction temperature 30 °C): (A): changes in antioxidant activity (DPPH); (B): changes in antioxidant activity (FRAP); (C): changes in chelating activity (ChA); (D): changes in total polyphenol content (TPC); (E): changes in extraction yield relative to neophytadiene (NFD yield); (F): changes in extraction yield relative to phytol (phytol yield).
Applsci 16 01893 g002aApplsci 16 01893 g002bApplsci 16 01893 g002c
Figure 3. Effects of acetone based on solvent extraction concentration and extraction time (constant process parameters: raw material concentration 5 g/100 mL, extraction temperature 30 °C): (A): changes in antioxidant activity (DPPH); (B): changes in antioxidant activity (FRAP); (C): changes in chelating activity (ChA); (D): changes in total polyphenol content (TPC); (E): changes in extraction yield relative to neophytadiene (NFD yield); (F): changes in phytol extraction yield (phytol yield).
Applsci 16 01893 g003aApplsci 16 01893 g003bApplsci 16 01893 g003c
Figure 4. The effectiveness of extraction using solvents of isopropanol (Ipa), ethanol (Et), and acetone (Ac) was compared under optimal conditions for the following parameters: (A) DPPH free radical scavenging ability (DPPH), (B) Fe3+ ion reduction ability to Fe2+ (FRAP), (C) total polyphenol content (TPC), and (D) Fe2+ chelating activity (ChA); values represent mean ± SD (n = 3).
Applsci 16 01893 g004
Figure 5. Dependence of TCP size for the solvents used as a function of the concentration of the extracted material.
Applsci 16 01893 g005
Figure 6. Dependence of the FRAP parameter value for the solvents used as a function of the concentration of the extracted material.
Applsci 16 01893 g006
Figure 7. Dependence of DPPH value for the solvents used as a function of the concentration of the extracted material.
Applsci 16 01893 g007
Figure 8. Dependence of the ChA parameter value for the solvents used as a function of the concentration of the extracted material.
Applsci 16 01893 g008
Table 1. Regression equation coefficients (a0–a5) and values of the correlation coefficient (R2), adjusted correlation coefficient (AdjR2), and mean square error (MS) for the analyzed responses: DPPH, FRAP, ChA, TPC, NFD yield, and phytol yield, at a raw material concentration of 5 g/100 mL in ethanol, isopropanol, isopropanol, and acetone.
Coefficient
Values
DPPHFRAPChATPCNFD YieldPhytol Yield
Et
a021.26135−1.42321197.5194913.4775220.993680−24.1630
a111.201690.381222.55863083−0.1069160.0745941.0016
a2−1.04017−0.020180.5968953790.0073960.004753−0.0505
a33.877730.916004.16489730.173557−0.1572061.1365
a4−0.04035−0.00873−0.038395514−0.0018810.004589−0.0025
a50.027080.00155−0.04732688380.0003600.001392−0.0014
R20.7290.9610.8760.9970.99990.999
AdjR20.2780.8970.6700.9910.99970.998
MS12004.656090.02990.05221.25
Ipa
a00.5942589.574522267.6054361.866399−1.60699−64.9306
a14.8099570.4980448.361714680.084739−0.104170.5067
a2−0.255645−0.060496−0.638252427−0.0080590.01042−0.0328
a34.6016130.6255491.284848480.1854630.022813.6524
a4−0.045933−0.007460−0.0100904145−0.0018620.00229−0.0270
a5−0.0105980.002948−0.01126058030.0002230.003130.0098
R20.9940.9980.8080.9980.9950.996
AdjR20.9850.9940.4880.9960.9850.990
MS37.30.65758.80.01461.817.32
Ac
a070.6530112.81055118.0679382.952643−4.67227−40.0304
a10.203700.85791−0.05884911560.0991090.072531.0719
a20.06894−0.054900.112060177−0.008495−0.01295−0.0944
a33.394880.776988.786909290.1527460.223662.1093
a4−0.03386−0.00817−0.0761885401−0.001579−0.00001−0.0142
a5−0.014680.00001−0.0068130287−0.0001390.003120.0124
R20.9990.9730.9970.9990.9990.996
AdjR20.9970.9280.9930.9970.9970.990
MS3.496.9329.10.008260.1784.06
Table 2. Experimental plan and results of the C. palustre herb extraction process, considering coded and actual values of independent variables.
X1X2Y1Y2Y3Y4Y5Y6
tVCASSDPPHFRAPChATPCNFD
Yield
Phytol Yield
[min][% v/v][mg Tx/L][mmol Fe2+/L][mg Fe2+/L][g GAE/L][mg/kg][mg/kg]
Et
2208719303600
260137213227846
210069924342863
62015415279600
660121242577940
610060829131946
10207414327413
1060113273937632
1010060927431334
Ipa
2208520306600
2601122130972557
210012−23162734
6209320340500
660882124872462
610086125121039
10203722309500
10601322531862668
1010037−111021040
Ac
22012530273600
260153292987937
2100681136532235
62012727355500
660149332677945
6100681234132039
102013129262700
1060226363956728
10100551023621343
X1—t: extraction time [min]; X2—VCASS: volumetric concentration of aqueous solvent solutions—ethanol (Et), isopropanol (Ipa), and acetone (Ac) [% v/v]; Y1—DPPH: DPPH radical scavenging activity [mg Tx/L]; Y2—FRAP: reduce Fe3+ ions to Fe2+ [mmol Fe2+/L]; Y3—ChA: chelating activity [mg Fe2+/L]; Y4—TPC: total polyphenol content [g GAE/L]; Y5—NFD yield: neophytadiene yield [mg/kg]; Y6—phytol yield: phytol yield [mg/kg].
Table 3. Extreme values of independent variables and corresponding response values: DPPH, FRAP, ChA, TPC, NFD yield, and phytol yield.
DPPH
[mg Tx/L]
FRAP
[mmol Fe2+/L]
ChA
[mg Fe2+/L]
TPC
[g GAE/L]
NFD Yield [mg/kg]Phytol Yield
[mg/kg]
Et
Time [min]61126−117
VCASS [% v/v]5053524719228
Extreme responses152253157.2−0.87109
Ipa
Time [min]8566618
VCASS [% v/v]49436050−971
Extreme responses134243316.7−269
Ac
Time [min]4825−7611
VCASS [% v/v]49475848−65579
Extreme responses155353716.9−8049
VCASS—volume concentration of an aqueous solution of a selected solvent: acetone (Ac), ethanol (Et), and isopropanol (Ipa).
Table 4. The values of the parameters of Equation (4) and the maximum extraction yields for TPC, DPPH, FRAP, and ChA obtained using acetone, ethanol, and isopropanol.
ParameterAcetoneEthanolIsopropanol
TPCmax [mmol/L]7.67.87.6
K [L/g]0.170.240.17
Umax [mmol/g]1.31.81.3
DPPHmax [mgTx/L]505050
K [L/g]1.71.41.9
Umax [mgTx/g]857095
* FRAPmax [mmol Fe2+/L]84728819
K [L/g]0.000710.00270.057
Umax [mmol Fe2+/g]0.600.781.08
ChAmax [mg Fe2+/L]368381333
K [L/g]2.271.261.6
Umax [mg Fe2+/g]835480533
* FRAPmax represents a theoretical model asymptote (Z → ∞) and does not correspond to a physically attainable iron-reduction yield.
Table 5. TPC, DPPH, FRAP, and ChA extraction rate.
Z [g/L]Extraction Degree [%]
TPC
EthanolAcetoneIsopropanol
5374846
10314044
20182323
5071011
DPPH
EthanolAcetoneIsopropanol
513119
10755
20333
50111
FRAP
EthanolAcetoneIsopropanol
51009795
10878761
207610047
501008927
ChA
EthanolAcetoneIsopropanol
58.11411
104.27.55.9
202.13.83.0
500.91.51.2
Disclaimer/Publisher’s Note: The statements, opinions and data contained in all publications are solely those of the individual author(s) and contributor(s) and not of MDPI and/or the editor(s). MDPI and/or the editor(s) disclaim responsibility for any injury to people or property resulting from any ideas, methods, instructions or products referred to in the content.