Article

The Influence of Structural Design Parameters on the Retention Force and Interference-Fit Reliability of Connecting Rod Bushings

1
School of Energy and Power Engineering, North University of China, Taiyuan 030051, China
2
China North Engine Research Institute, Tianjin 300400, China
3
School of Mechanical Engineering, North University of China, Taiyuan 030051, China
*
Author to whom correspondence should be addressed.
Appl. Sci. 2026, 16(4), 1843; https://doi.org/10.3390/app16041843
Submission received: 2 January 2026 / Revised: 6 February 2026 / Accepted: 10 February 2026 / Published: 12 February 2026
(This article belongs to the Special Issue Mechanical Engineering Reliability Optimization Design)

Featured Application

This study establishes a quantitative design mapping between structural parameters, safe interference ranges, and retention force for diesel engine connecting rod bushings, with direct practical applications in heavy-duty equipment manufacturing. The determined allowable interference range and retention force variation trend can be directly applied to the structural optimization and assembly process control of connecting rod bushings for commercial vehicles, construction machinery, and marine diesel engines. For bushings with “large inner diameter, thin wall, and narrow width” configurations, the proposed strict tolerance control criteria provide actionable guidance for improving connection reliability and mitigating loosening failures. Additionally, the parametric design framework is scalable to similar interference-fit components (e.g., piston pins, hydraulic cylinder bushings), offering a cost-effective solution for enhancing the operational safety and service life of heavy-duty equipment.

Abstract

Connecting rod bushing loosening in diesel engines is a critical failure mode that causes accelerated wear and potential catastrophic damage. This study systematically examines the effects of key structural parameters—inner diameter, wall thickness, and width—on the retention force of interference fits. Employing theoretical analysis and finite element simulation (assuming a dry friction coefficient μ = 0.2 for steel–bronze), this work predicts an optimal interference range of 0.08–0.11 mm, corresponding to a theoretical retention force of 33.61–46.25 kN. A limited experiment validated the model at lower interference levels, but the proposed range remains a model-derived prediction awaiting extensive verification. Simulation-based parametric analysis quantified the influence of each factor: retention force decreases by ~2 kN per 2 mm increase in inner diameter, increases by ~3 kN per 0.25 mm increase in wall thickness (the most significant parameter), and increases by 1.3 kN per 1 mm increase in width. These findings establish a predictive, simulation-driven design framework for guiding bushing design and assembly control in heavy-duty applications, with the explicit understanding that its core outputs are model-predicted and require experimental confirmation.

1. Introduction

As diesel engines are core power units in heavy-duty vehicles, construction machinery, and marine equipment, their reliability is critical to overall system performance, operational safety, and industrial production efficiency [1,2,3,4]. A key component within these engines is the connecting rod bushing—a vital friction-pair element in the crank-connecting rod mechanism that performs the dual function of transmitting complex alternating loads and protecting the connecting rod small-end interface. The integrity of its interference-fit connection with the small end is fundamental to ensuring stable operational performance [5,6]. Under actual service conditions, the bushing endures continuous high temperatures, high pressures, and severe vibrations, which impose significant demands on its structural integrity and assembly stability. Despite its critical role, bushing loosening failures occur frequently in engineering practice: such failures not only precipitate lubrication failure and accelerated wear but may also trigger catastrophic events such as cylinder pounding [7,8]. Consequently, bushing loosening represents a key technical bottleneck impeding the development of highly reliable diesel engines.
To address this engineering challenge, scholars have conducted in-depth research from multiple perspectives. First, in the areas of interference-fit design and structural parameter optimization, studies have primarily focused on determining a reasonable interference range, optimizing key structural dimensions, and improving assembly processes [9,10]. As the core parameter, the interference value must strike a balance between providing sufficient contact pressure for torque transmission and avoiding plastic yielding of the components, forming a clear “design window”. Finite element simulations and theoretical analyses have defined suitable interference ranges for bushings made of different materials, revealing that both insufficient and excessive interference accelerate the loosening process through different mechanisms [11,12]. Furthermore, the bushing’s oil groove design, wall thickness uniformity, and the machining accuracy of the connecting rod small-end bore (such as cylindricity and surface roughness) have been proven to critically affect the uniformity of contact pressure distribution and assembly consistency. Insufficient accuracy is a primary cause of increased failure dispersion in mass production [13,14,15].
Secondly, the influence of the operating temperature field and its thermal failure mechanisms is another key research focus. High-temperature environments reduce the strength of the bushing material. More critically, the mismatch in thermal expansion coefficients between the bushing and the connecting rod small end leads to non-uniform thermal deformation, which irreversibly weakens or even relaxes the initial contact pressure of the interference fit. Experimental data indicate that the push-out force of the bushing significantly decreases after reaching a specific temperature threshold. Furthermore, after repeated thermal cycles, the relaxation of residual stresses and the degradation of surface properties further compromise the stability of the connection and may induce additional wear [16,17].
Additionally, prospective analysis from the perspectives of system dynamics and reliability provides a theoretical basis for preventing loosening. By constructing multi-body dynamics models of the crank-connecting rod mechanism, the complex load spectrum borne by the bushing can be precisely obtained, providing boundary conditions for strength design [18,19,20]. Combining finite element analysis with probabilistic statistical methods (e.g., reliability assessment) can quantify the effects of design parameter and material property variations, thereby validating the safety margin and robustness of the interference-fit design under alternating loads in a probabilistic sense. This represents a shift in design philosophy from failure remediation to proactive prevention [21,22].
In summary, existing research has laid a solid foundation by addressing interference design, thermo-mechanical coupling, and system-level analysis. However, a significant gap remains: most studies treat key bushing structural parameters—such as inner diameter, wall thickness, and width—as fixed. Consequently, there is a lack of systematic understanding regarding the quantitative influence of these geometric parameters on the retention force and its stability under dynamic loads. A comprehensive design mapping that explicitly links structural parameters to allowable interference and resulting retention force performance is also absent.
To bridge this gap and address persistent small-end bushing loosening, this study establishes a systematic parametric finite element analysis (FEA) framework using the ABAQUS 6.14-4 software platform. A refined FEA model of the connecting rod small end, bushing, and piston pin assembly is developed to systematically investigate the influence of three critical geometric parameters (inner diameter, wall thickness, width) on retention force. The findings aim to establish a parametric design framework for engine connecting rod bushings, providing actionable engineering guidance for structural optimization and interference-fit assembly process control. Ultimately, this work seeks to effectively control bushing loosening failure risks, extend engine service life, and offer scalable references for similar interference-fit components in heavy-duty equipment.

2. Finite Element Model Development, Verification and Validation

2.1. Interference-Fit Finite Element Model

The primary objective of this study is to analyze the macroscopic mechanical behavior of the interference fit interface between the bushing outer surface and the connecting rod small-end bore. Therefore, to ensure computational efficiency and convergence, reasonable simplifications were applied to the model: the guiding chamfers and oil holes on the bushing inner diameter were omitted. This simplification allows the analysis to focus on the overall distribution of interfacial contact pressure and the trend of edge yielding. It should be noted that the stress concentration arising from the sharp edges in the model represents the theoretical worst-case scenario for an interference fit with an ideal sharp corner. In actual components, the presence of minor process radii or rounding would mitigate this peak stress. Consequently, the conclusions drawn from this model regarding the risk of edge yielding are conservative.
The connecting rod small end measured 74 mm in outer diameter, 49 mm in inner diameter, and 34 mm in length, and incorporated an 8° incline. The connecting rod bush featured an inner diameter of 44 mm and a wall thickness of 2.5 mm. The piston pin dimensions were 43 mm (outer diameter), 23 mm (inner diameter), and 80 mm (length). Subsequently, a three-dimensional solid model of the complete assembly was created in SolidWorks 2020.

2.1.1. Material Property Definitions

The connecting rod bushing is manufactured from QSn7-0.2 tin bronze via power spinning. This process enhances the alloy’s mechanical properties and high-temperature resistance, enabling it to withstand the instantaneous high pressure from cylinder gas combustion and the reciprocating inertial loads on the connecting rod. The material parameters for the connecting rod small end and the bushing, obtained from the literature, are summarized in Table 1 [23,24,25,26,27].
According to literature reports on the high-temperature tensile properties of power-spun tin bronze, the yield strengths at room temperature, 150 °C, 200 °C, and 250 °C were determined and are presented in Table 2 [23,24,25,26,27].

2.1.2. Contact Surface Settings

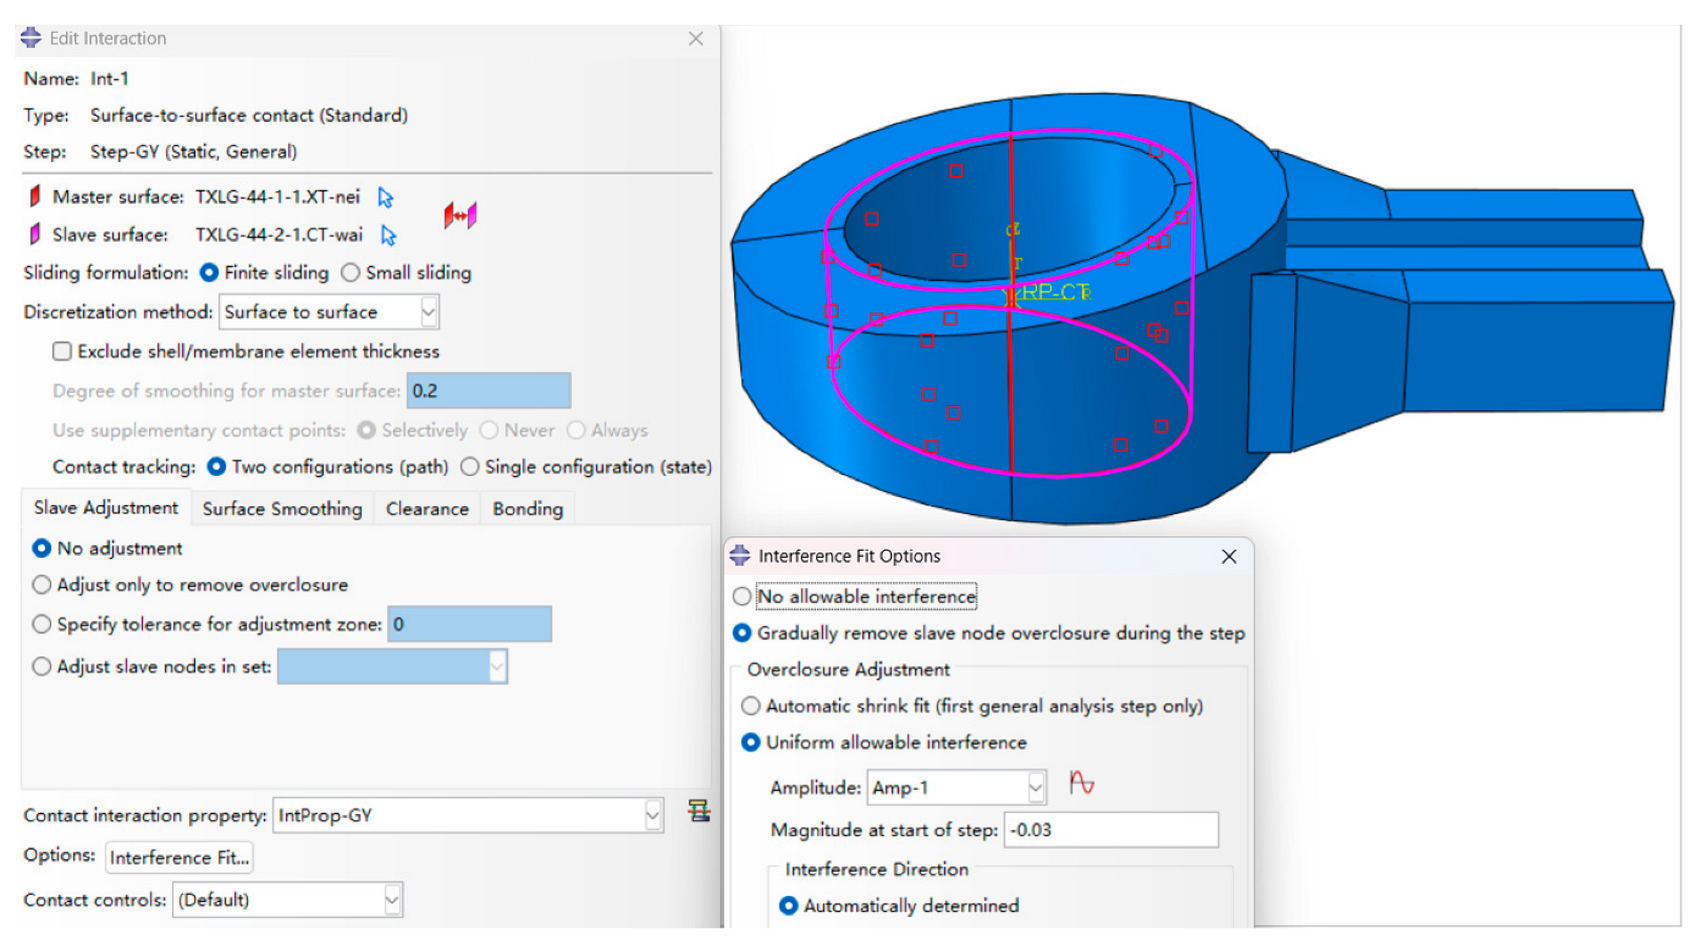
The inner surface of the connecting rod small end bore was designated as the master surface, and the outer surface of the bushing as the slave surface. This establishes a rigid-to-flexible contact pair between the components. The contact properties were defined as follows: tangential behavior employed the Coulomb friction model with a coefficient of 0.2; normal behavior was set to “Hard” contact, allowing separation after contact. For the interference fit, a finite sliding formulation was used. The interference magnitude was defined by specifying a negative value in the “Interference” option. These settings are illustrated in Figure 1.

2.1.3. Boundary Conditions

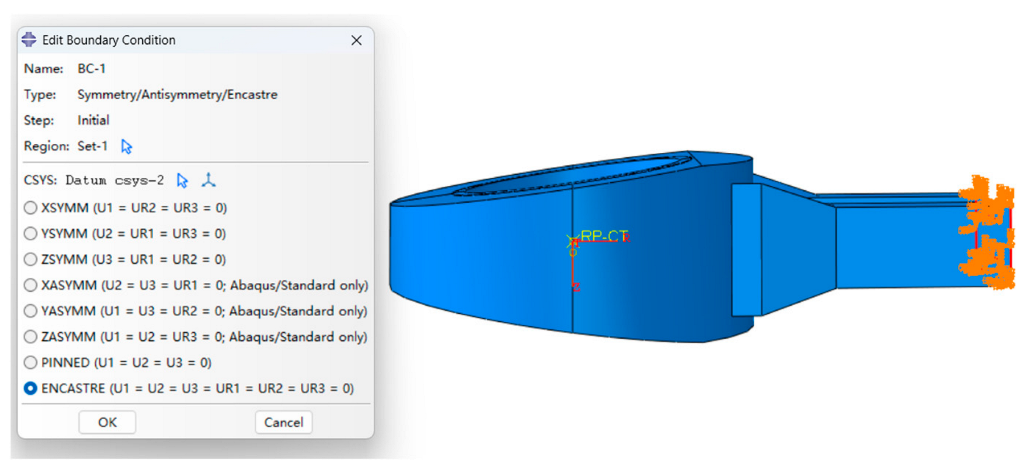
To simulate the interference fit between the connecting rod small end and the bushing, the following boundary conditions were applied: the bottom end of the connecting rod was fully constrained, representing its fixed state in the actual assembly. Additionally, a cylindrical coordinate system was established at the bushing center. Its radial (R) direction was oriented toward the connecting rod body. These boundary conditions are illustrated in Figure 2.

2.1.4. Mesh Generation

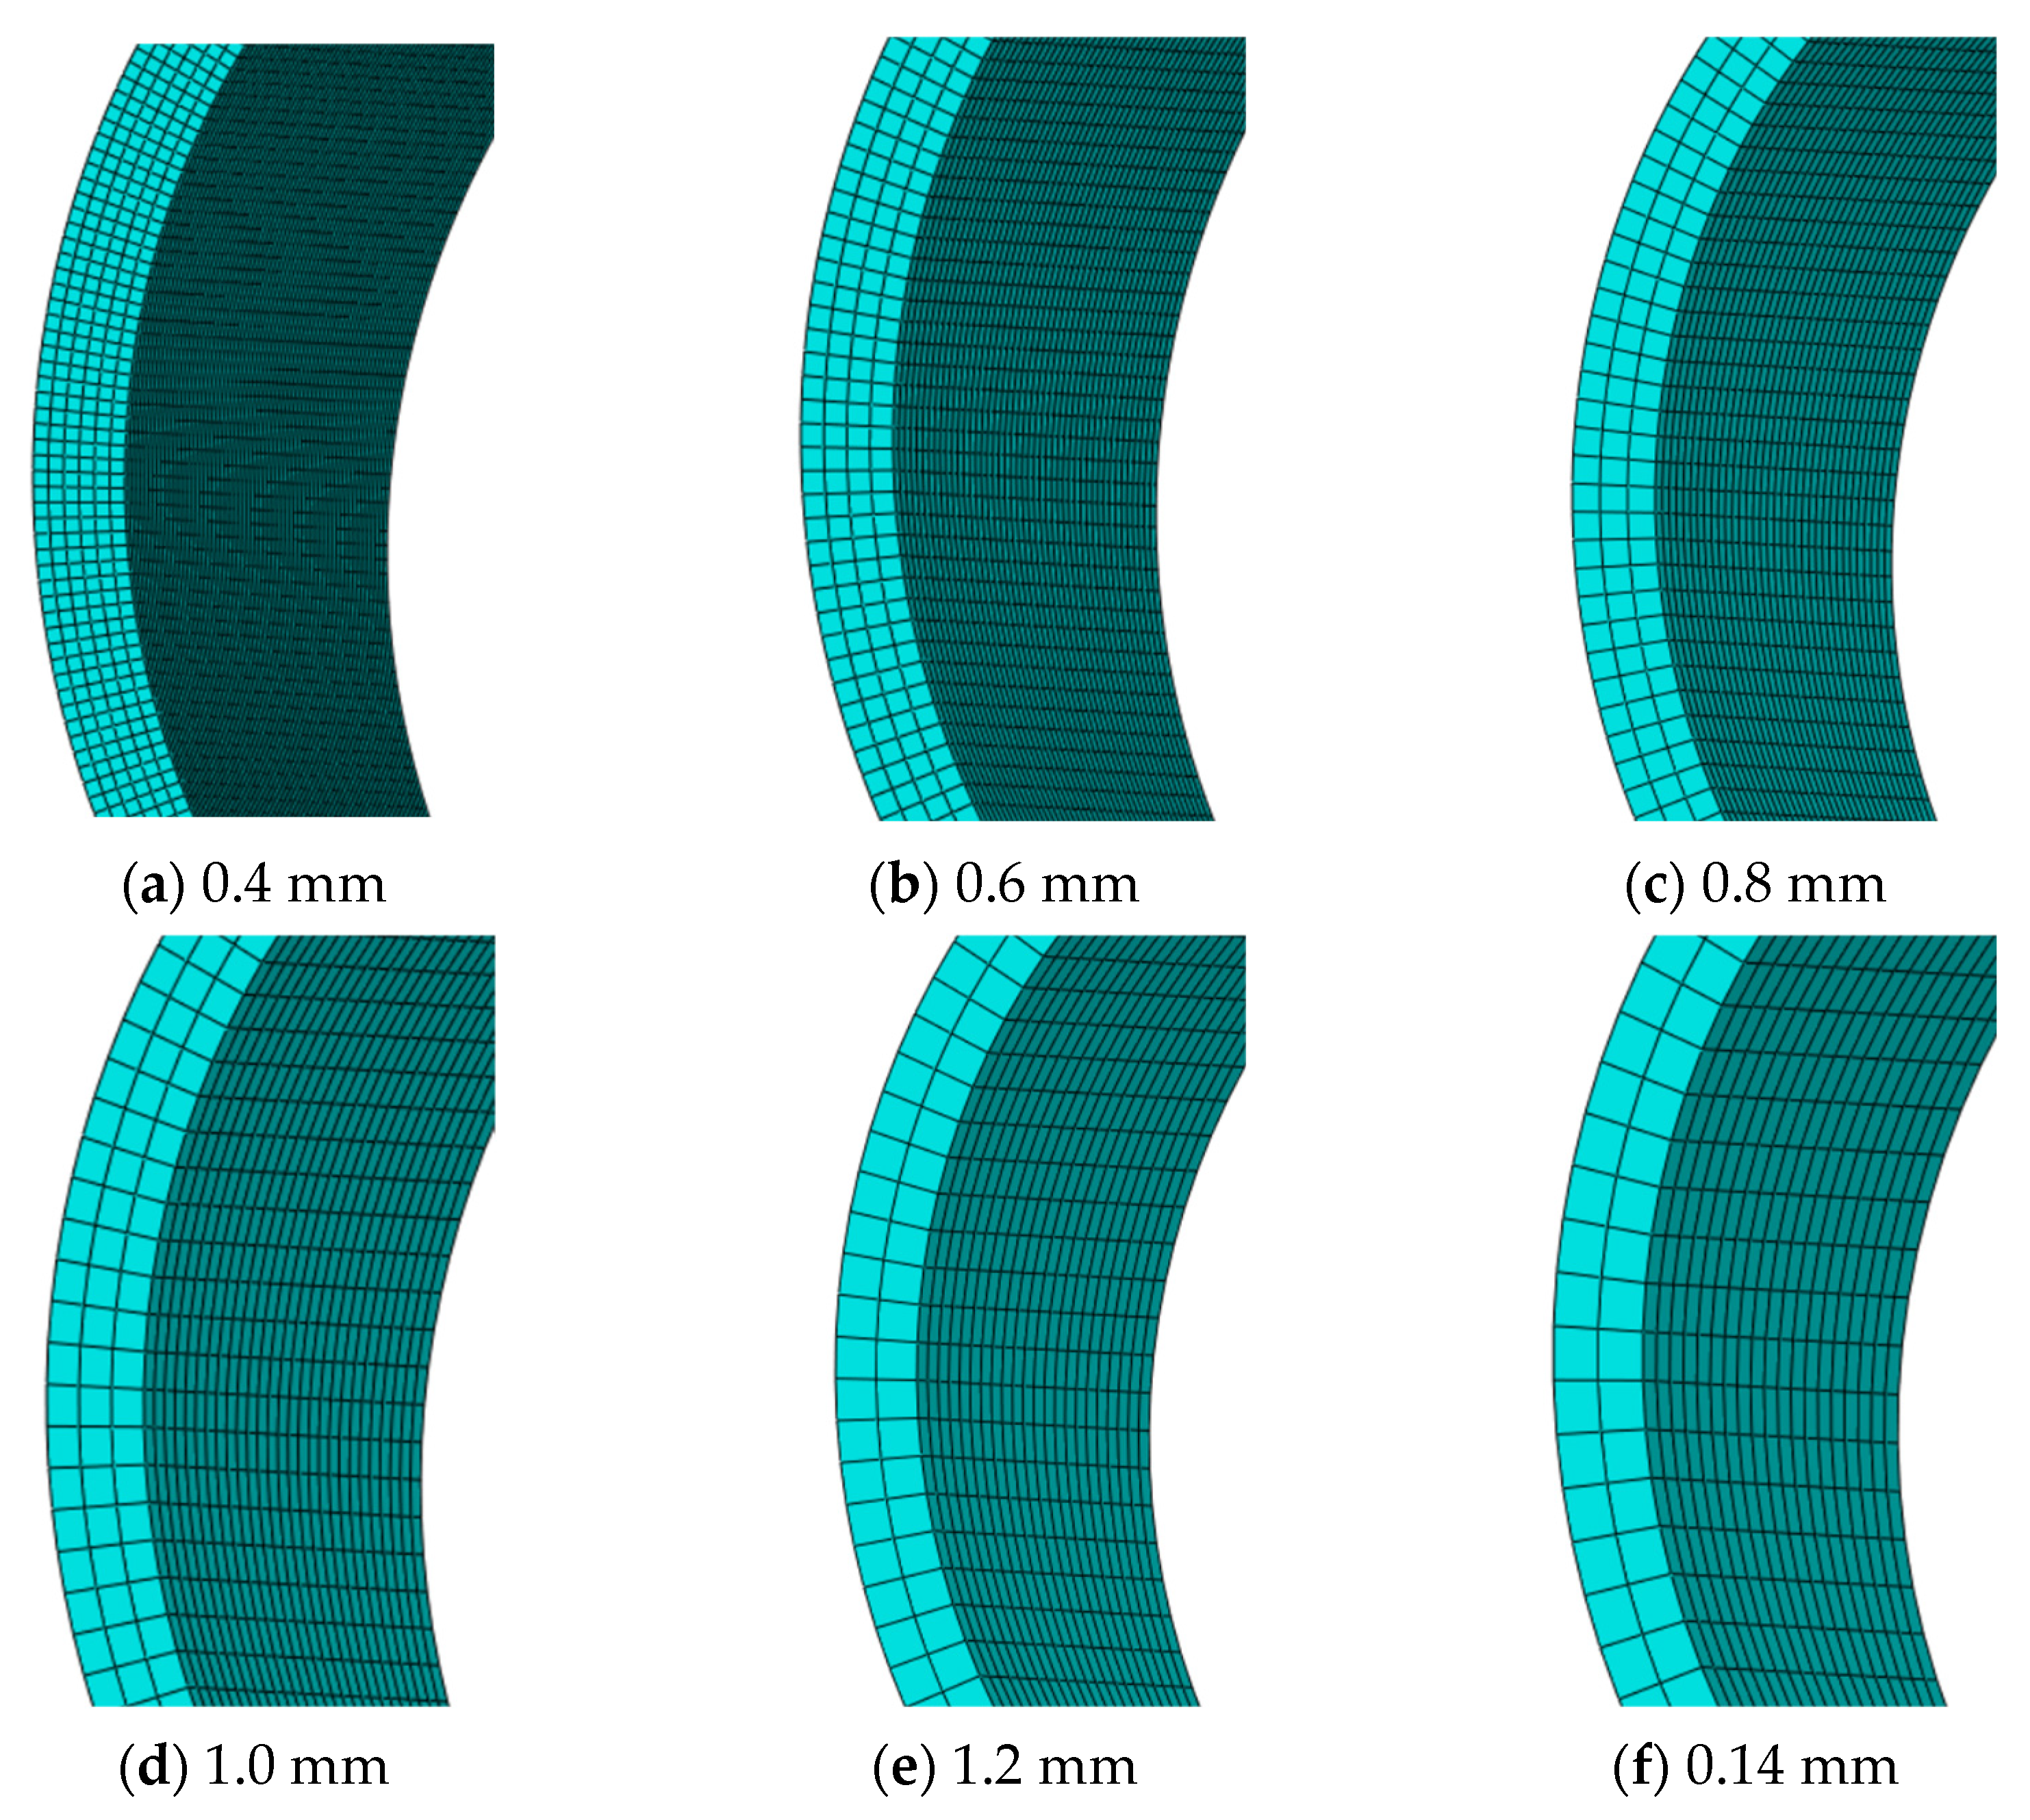
As the analysis primarily focuses on the connecting rod bushing, a coarser mesh was deemed sufficient for the connecting rod small end. The connecting rod bushing was meshed with hexahedral elements. In contrast, the connecting rod small end was discretized with tetrahedral elements due to its more complex geometry. To balance computational efficiency with accuracy, a mesh convergence study was conducted on the bushing using six global element sizes: 0.4, 0.6, 0.8, 1.0, 1.2, and 1.4 mm. All meshes employed C3D8R elements (8-node linear brick elements with reduced integration). The resulting meshes for selected element sizes are presented in Figure 3.
Interference fit simulations were performed using the six mesh configurations of the bushing. The resulting contact stresses on the bushing outer surface, for defined interferences of 0.03 mm and 0.11 mm, are summarized in Table 3 for comparison across the different element sizes.
For the 0.03 mm interference case, as the element size decreased from 1.4 mm to 1.0 mm, the maximum contact stress converged to a stable range of 22.2–22.3 MPa. The difference between results obtained with 0.8 mm (22.24 MPa) and 1.0 mm (22.26 MPa) element sizes was negligible (0.09%), confirming solution convergence. When the element size increased beyond 1.0 mm to 1.2 mm and 1.4 mm, the maximum contact stress rose significantly to 26.06 MPa and 27.79 MPa, respectively, indicating that overly coarse meshes introduce artificial stress concentration and reduce accuracy.
The minimum contact stress at 0.8 mm (11.90 MPa) also fell within the stable range observed across all element sizes (11.74–12.27 MPa), with no anomalous fluctuations. At this mesh size, the deviation between simulated maximum stress and theoretical pressure (14.60 MPa) was well controlled, effectively avoiding both artificial stress concentration from excessively dense meshes and inaccuracy from overly coarse meshes.
In terms of computational efficiency, the 0.8 mm mesh (18,768 elements) required far fewer elements than the 0.4 mm (147,132 elements) and 0.6 mm (43,920 elements) meshes, significantly lowering computational cost. Compared to the coarser 1.2 mm (5368 elements) and 1.4 mm (3952 elements) meshes, the 0.8 mm mesh increased the element count by approximately 3–4 times but delivered substantially improved stability and accuracy, representing an optimal balance between computational expense and result fidelity.
A similar convergence trend was observed for the 0.11 mm interference case, where the 0.8 mm mesh produced stable maximum (93.33 MPa) and minimum (47.58 MPa) contact stresses. Therefore, the 0.8 mm element size was selected for all subsequent finite element simulations in this study.
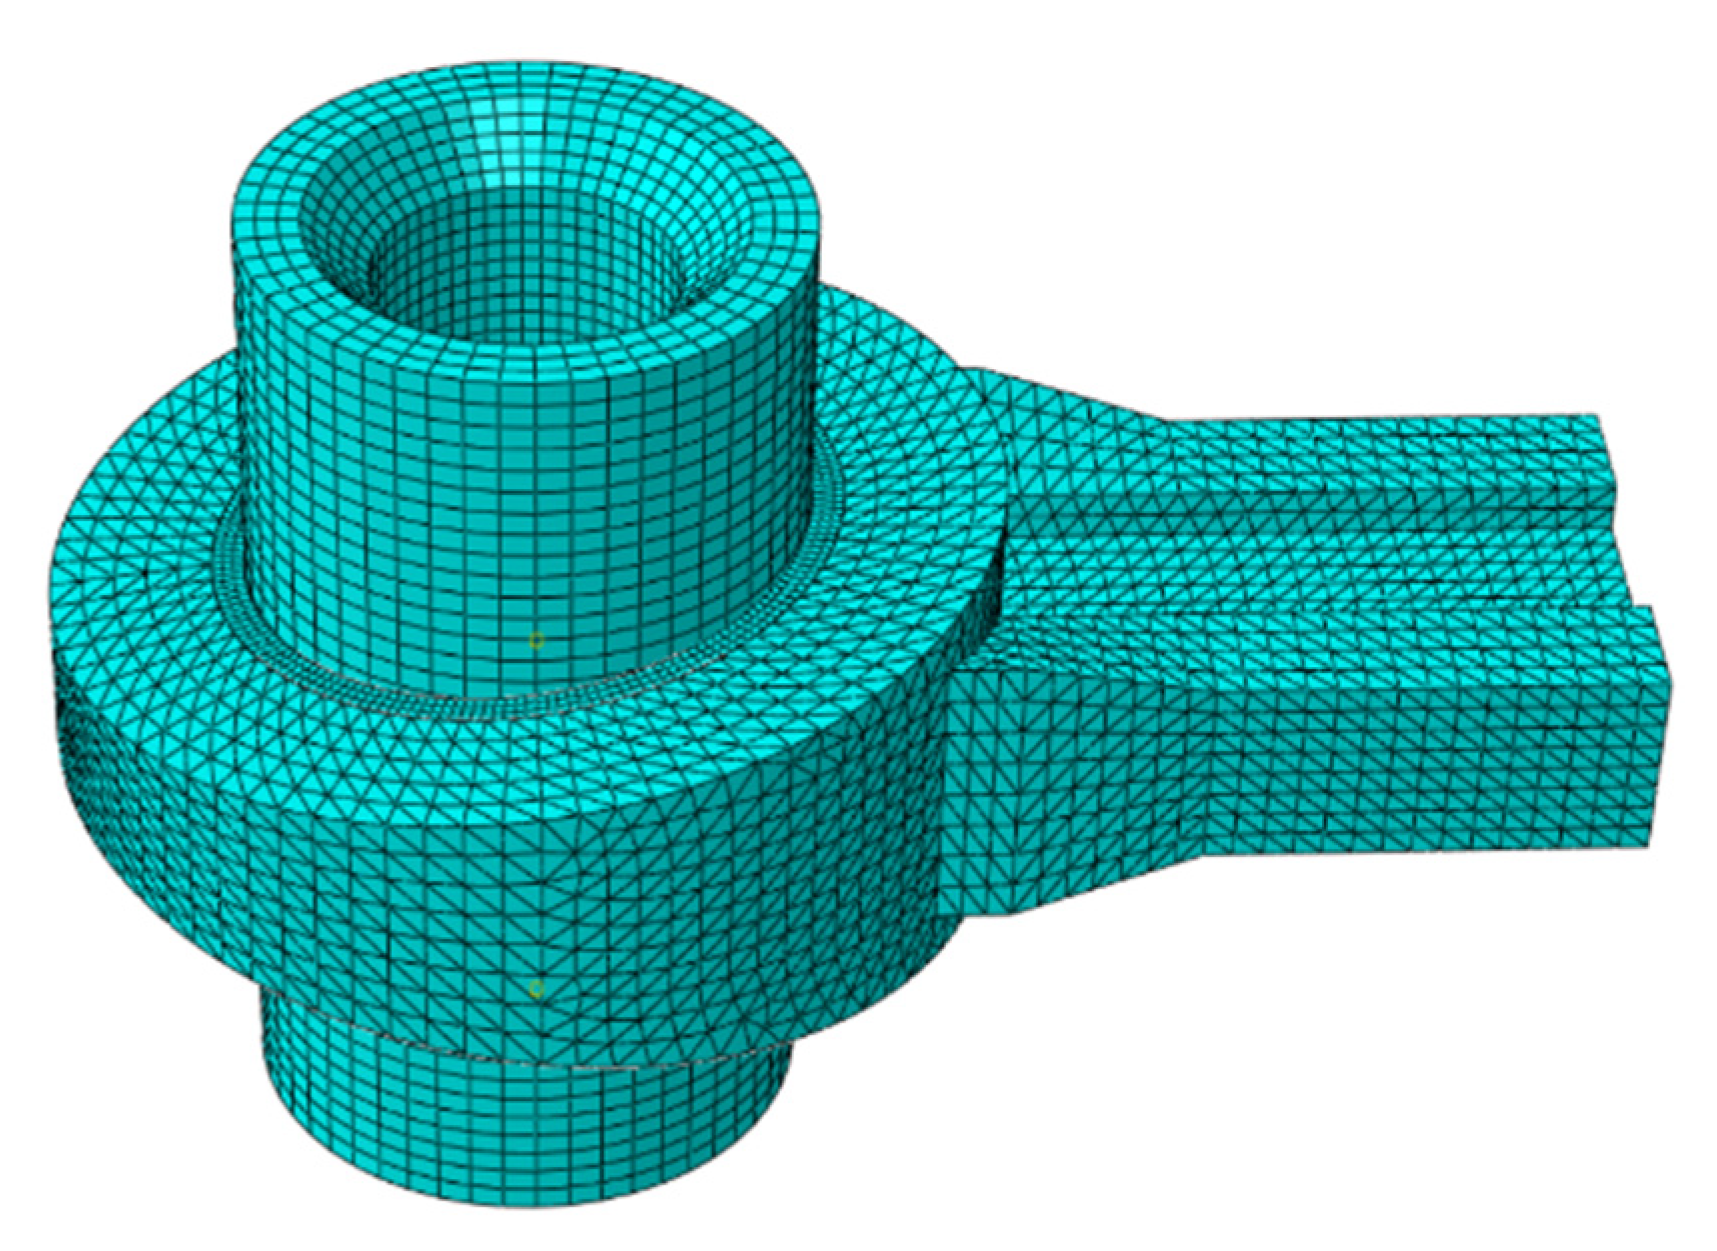
Based on the mesh convergence study, the connecting rod bushing was meshed with C3D8R elements at a size of 0.8 mm, resulting in 18,768 elements. The connecting rod small end was discretized using C3D10 elements at a coarser size of 2.2 mm, totaling 57,198 elements. The piston pin was modeled with C3D8R elements at a size of 2.0 mm, comprising 10,608 elements. The final assembled finite element model, depicting the mesh of all components, is presented in Figure 4.

2.1.5. Preliminary Verification: Theory vs. Simulation

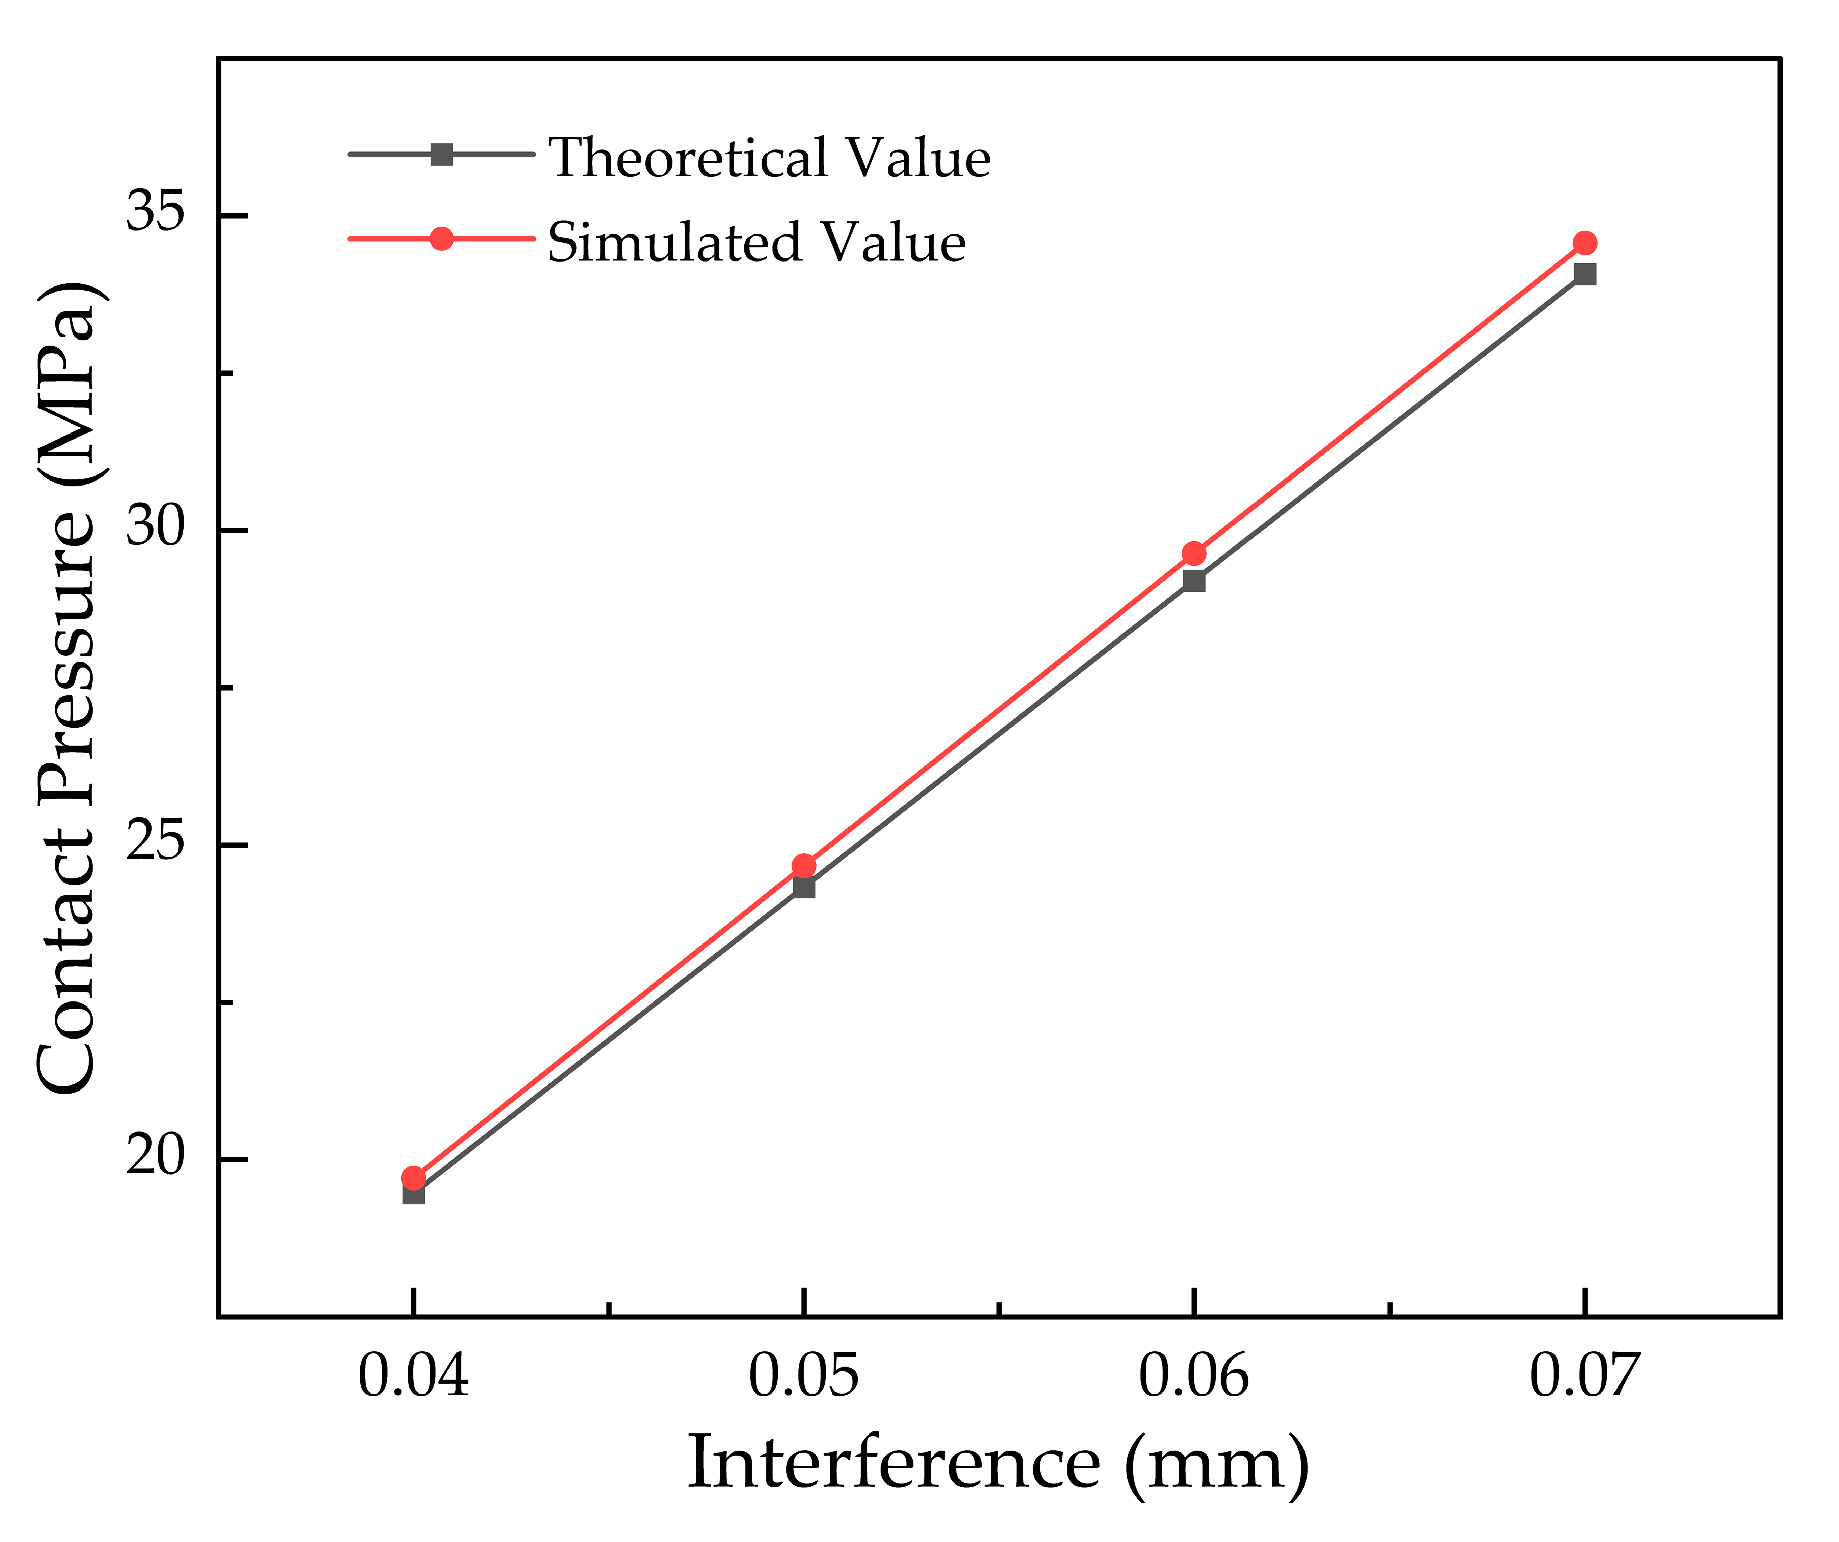
As a preliminary verification step, the finite element model was used to simulate interference fits with magnitudes from 0.04 to 0.07 mm in 0.01 mm increments. The resulting contact pressures were benchmarked against theoretical predictions derived from Lamé’s equations (thick-walled cylinder theory) [23,24,25,26,27]. This process confirmed the correctness of the model’s core assumptions and boundary settings, thus establishing a theoretically sound foundation for further experimental work.
The theoretical contact pressure for the interference fit is derived from the thick-walled cylinder theory and is expressed as follows:
p = Δ r 1 1 E 1 r 1 2 + r 2 2 r 2 2 r 1 2 + ν 1 + 1 E 2 r 1 2 + r 3 2 r 1 2 r 3 2 ν 2
where r 1 is the inner radius of the connecting rod small end; r 2 is the outer radius of the connecting rod small end; r 3 is the inner radius of the connecting rod bushing; E 1 and E 2 are the elastic moduli of the connecting rod small end and the bushing, respectively; ν 1 and ν 2 are the Poisson’s ratios of the connecting rod small end and the bushing, respectively; Δ is the interference between the connecting rod small end and the bushing.
As evidenced by the data in Table 4 and Figure 5, the simulated contact pressures for interference fits between 0.04 mm and 0.07 mm align closely with theoretical values, exhibiting a maximum relative error of 1.5%. This close agreement confirms the model’s mechanical rationale.
The research methodology is software-agnostic, relying on finite element principles universally supported by platforms like ANSYS 2020 R2, LS-DYNA R11.2.2, and COMSOL 6.2. These include: (1) standard elastic–plastic material models, (2) Coulomb friction and “hard” contact definitions, (3) basic boundary condition and interference fit modules, and (4) conventional meshing and convergence studies. ABAQUS was merely chosen for its solver efficacy and interface; the work does not rely on any of its exclusive features. Consequently, the specific parameters and analysis sequence are fully reproducible in other FEA environments.

2.2. Retention Force Simulation Model

The simulation of bushing push-out and retention force calculation was performed in two sequential analysis steps. First, the interference fit between the bushing and the connecting rod small end was simulated. Subsequently, the bushing was displaced axially, and the resulting contact reaction force—namely, the axial retention (push-out) force—was extracted from the model.

2.2.1. Retention Force Simulation Boundary Conditions

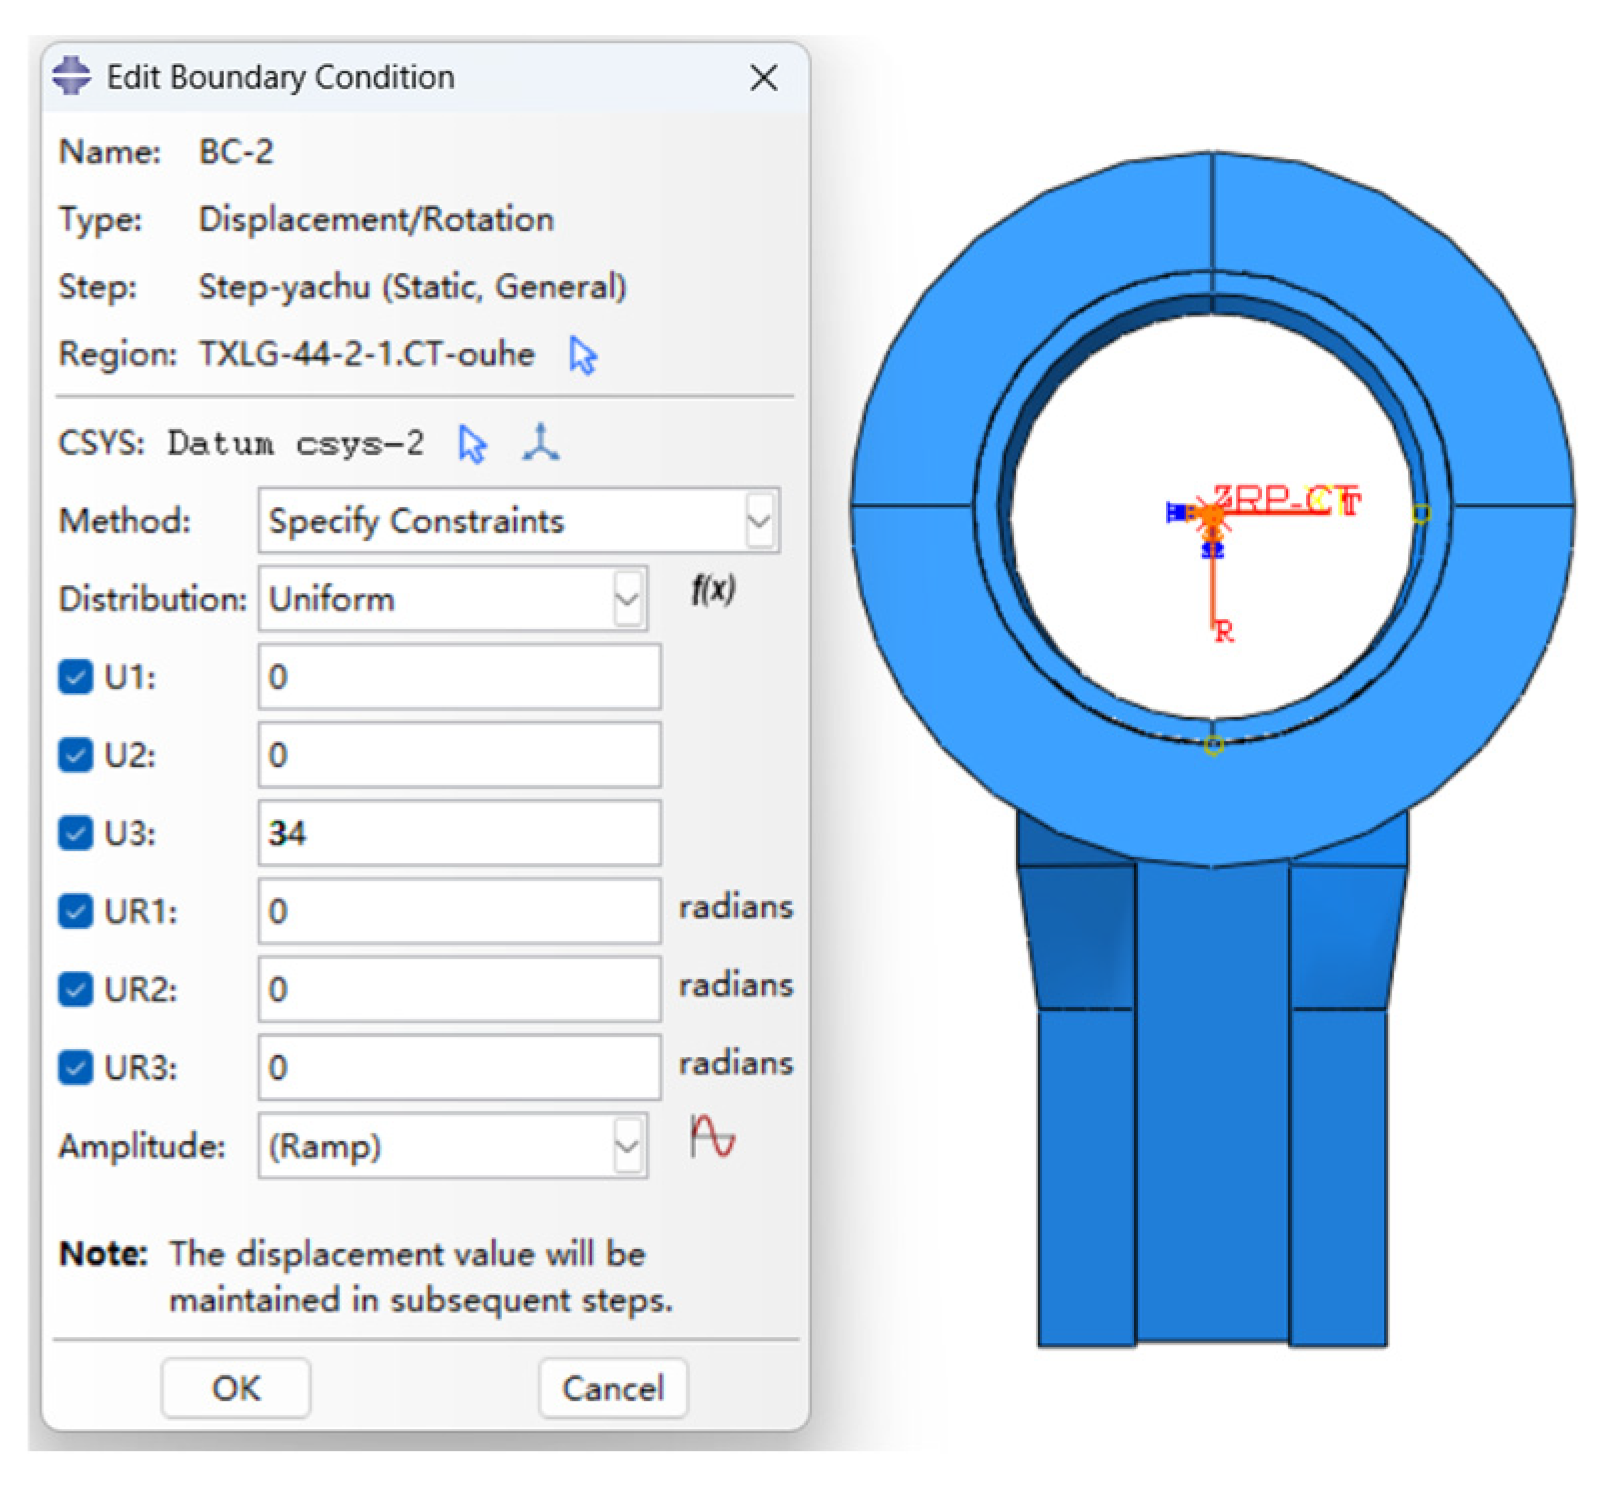
First, a coupling point was defined at the center of the bushing and kinematically coupled to its entire upper surface. Then, in a second analysis step, a prescribed displacement boundary condition was applied to this coupling point. A displacement of 34 mm was prescribed in the axial direction (U3), resulting in a downward motion of the bushing during the simulation, as illustrated in Figure 6.

2.2.2. Theoretical Benchmark, Model Verification and Experimental Validation

To validate the retention force simulation model, the simulated retention force is benchmarked against its theoretical counterpart under identical interference conditions. A low relative error between the two confirms the model’s reliability and, concurrently, provides a theoretical foundation for designing subsequent bushing push-out experiments.
The maximum theoretical push-out force F max is determined by the product of the frictional shear stress at the interface and the effective contact area during axial displacement. As the bushing is displaced by a distance h , the effective contact area S is given by:
S = π d ( L h )
where d is the nominal inner diameter of the connecting rod small end; L is the axial contact width of the bushing (equivalently, the width of the small end bore); h is the axial displacement ( 0 h L ).
The retention force F at the interface is given by:
F = p 0 S μ
where p is the average contact pressure due to the interference fit, μ is the coefficient of friction between the tin bronze bushing and the alloy steel bore, and S is the effective contact area. For the steel–bronze pair under dry conditions, μ typically ranges from 0.1 to 0.3. A value of μ = 0.2 , consistent with typical literature values [23,24,25,26,27], is adopted for this study, and all analyses and results presented herein are based on this assumed friction coefficient.
Table 5 summarizes the relative error between the theoretical and simulated retention forces for interference values from 0.04 mm to 0.07 mm. All values are rounded to two significant figures.
The relative errors between theoretical and simulated retention forces, all below 4% (Table 5), confirm the accuracy of the simulation. Thus, the push-out model is validated, thereby providing a reliable basis for the subsequent parametric analysis.

2.2.3. The Key Validation Step: Comprehensive Experimental Testing of the Model

To further validate the accuracy of the finite element retention force model under practical conditions and to verify the subsequent parametric simulation results, a physical push-out test was conducted on an actual bushing assembly. This test was performed under dry, room-temperature conditions solely for the purpose of calibrating and validating the retention force model.
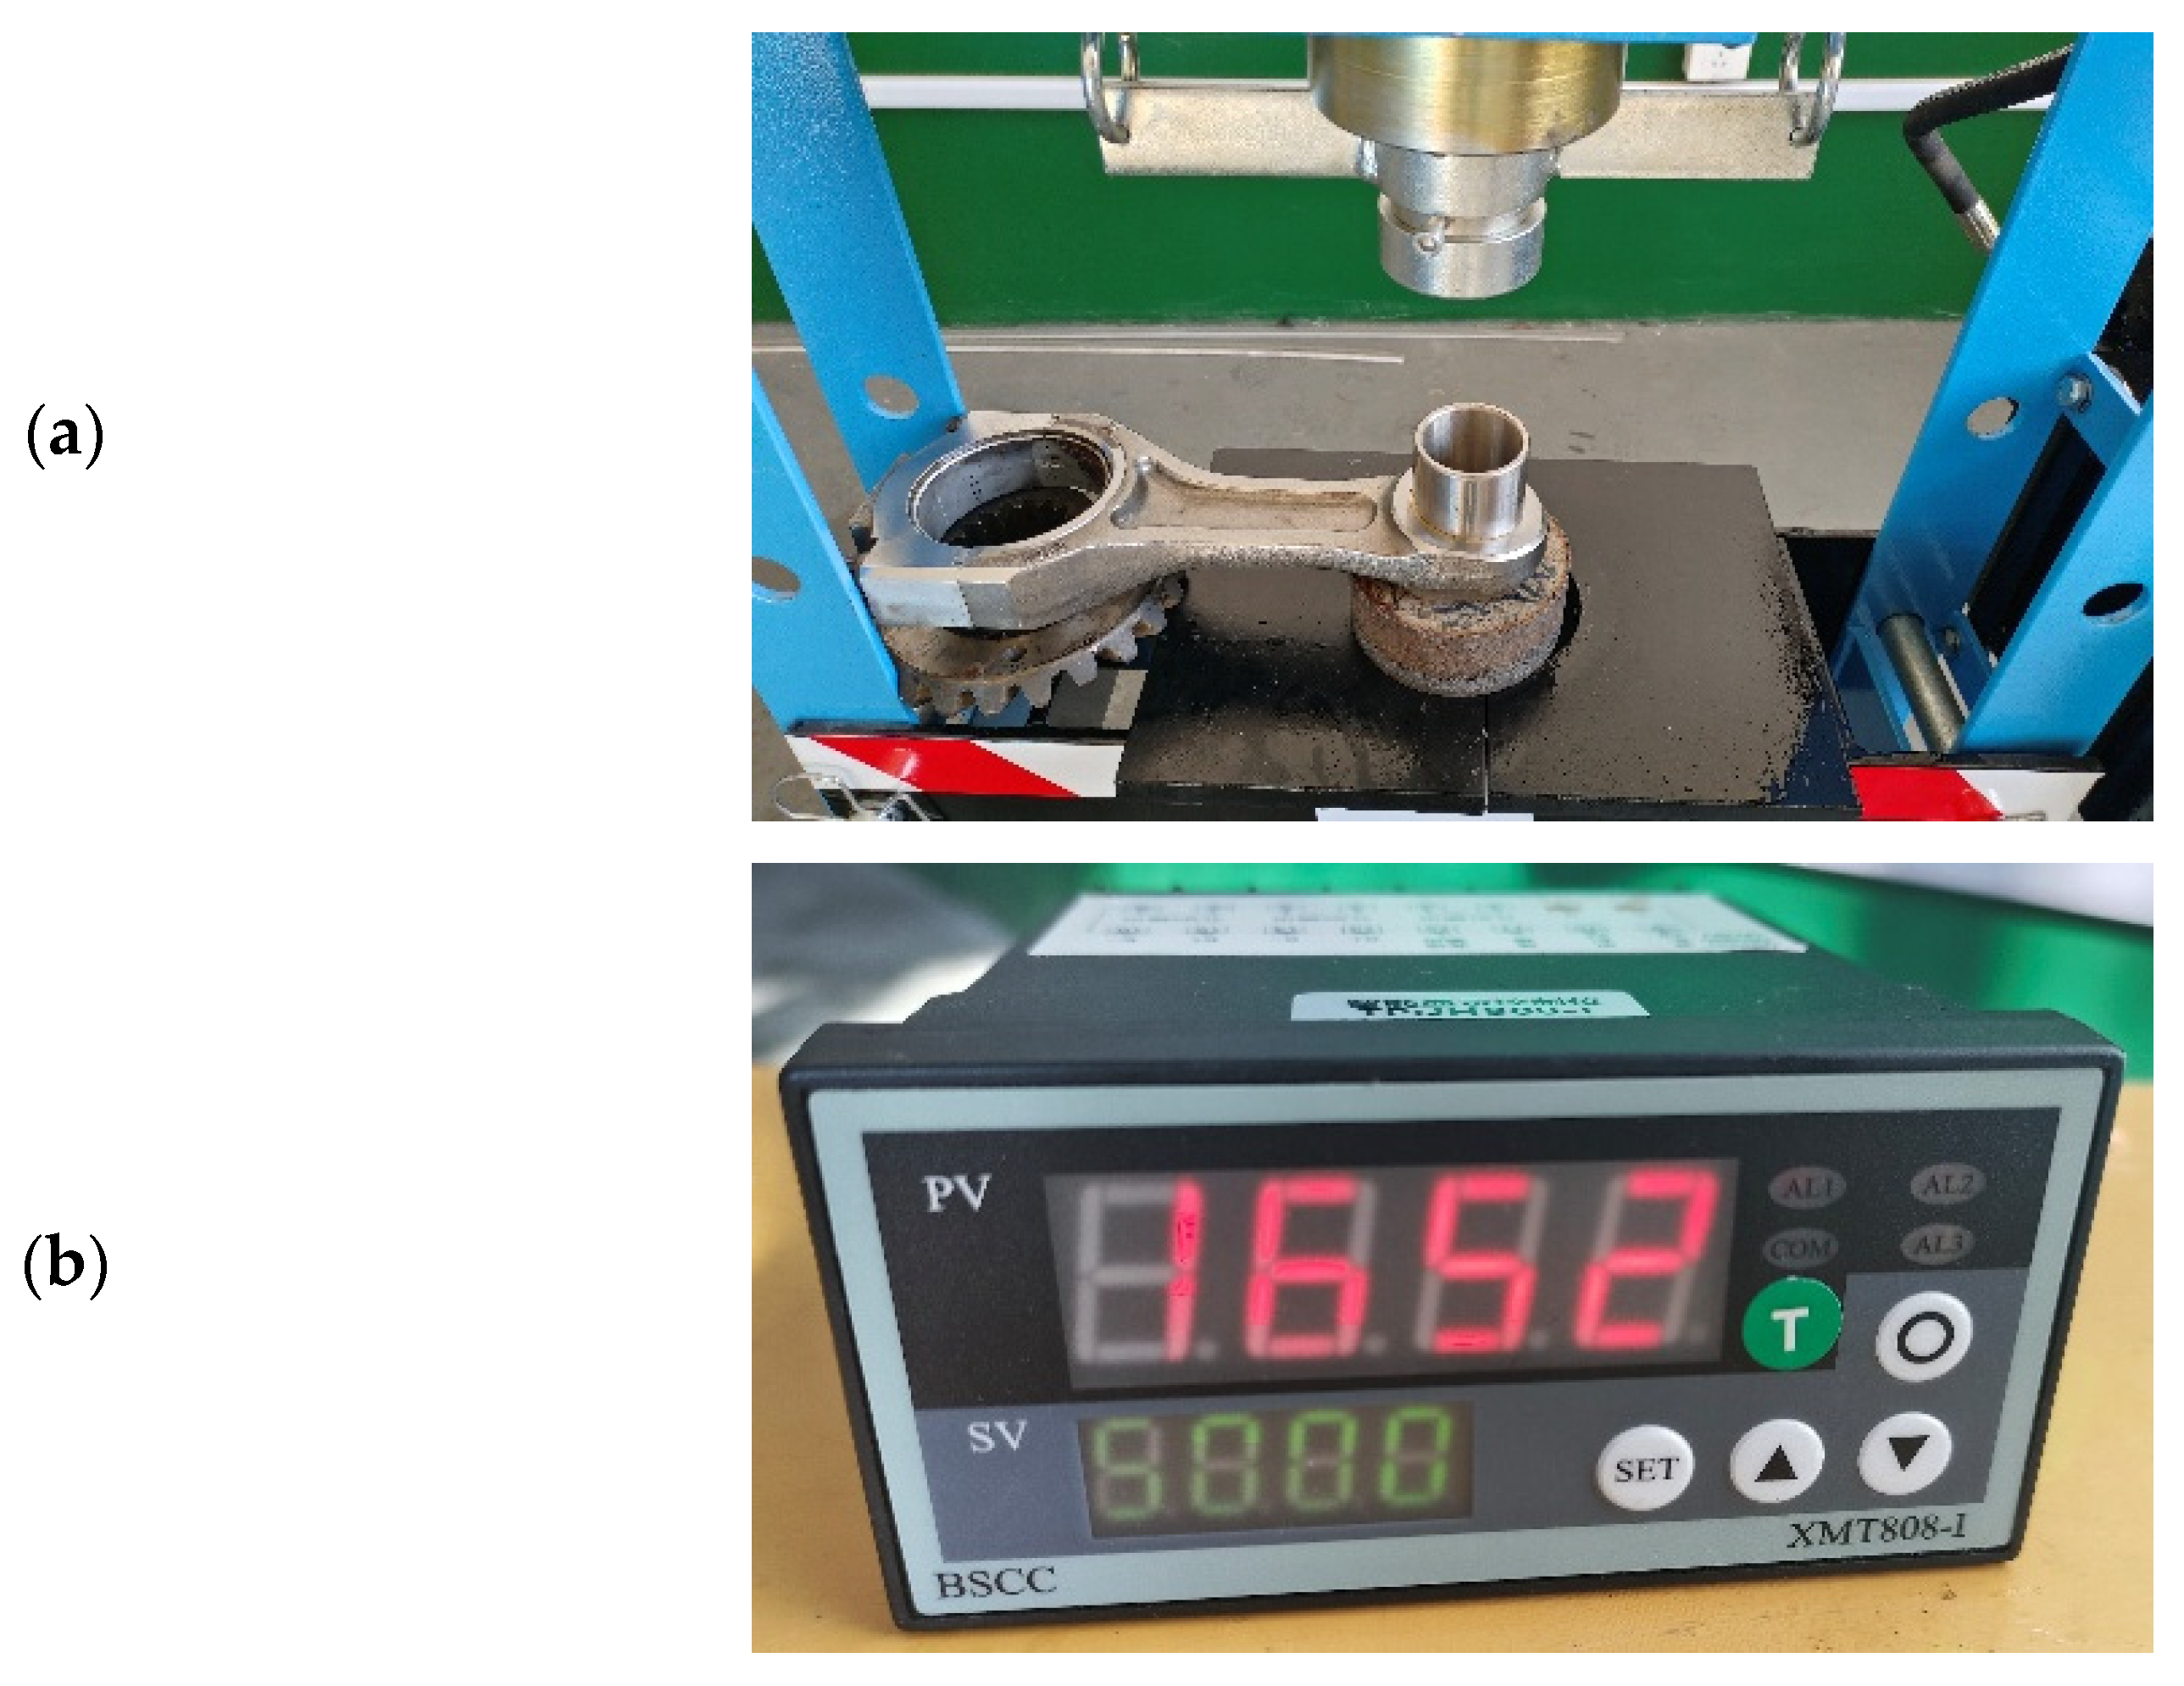
The test setup consisted of an MSY-20T hydraulic press (maximum capacity: 60 MPa), a calibrated pressure sensor (maximum capacity: 5 tons), and an XMT808-I intelligent display controller. The pressure sensor was calibrated prior to testing, achieving a maximum accuracy error of 0.3%, which met the experimental requirements. The test procedure was as follows: (1) The hydraulic press was activated to bring its ram into contact with the pressure sensor. (2) Pressure was continuously applied to displace the bushing axially until it was completely pushed out from the connecting rod small end. (3) The force readings from the pressure sensor were recorded in real time, and the peak value—corresponding to the bushing retention force—was identified.
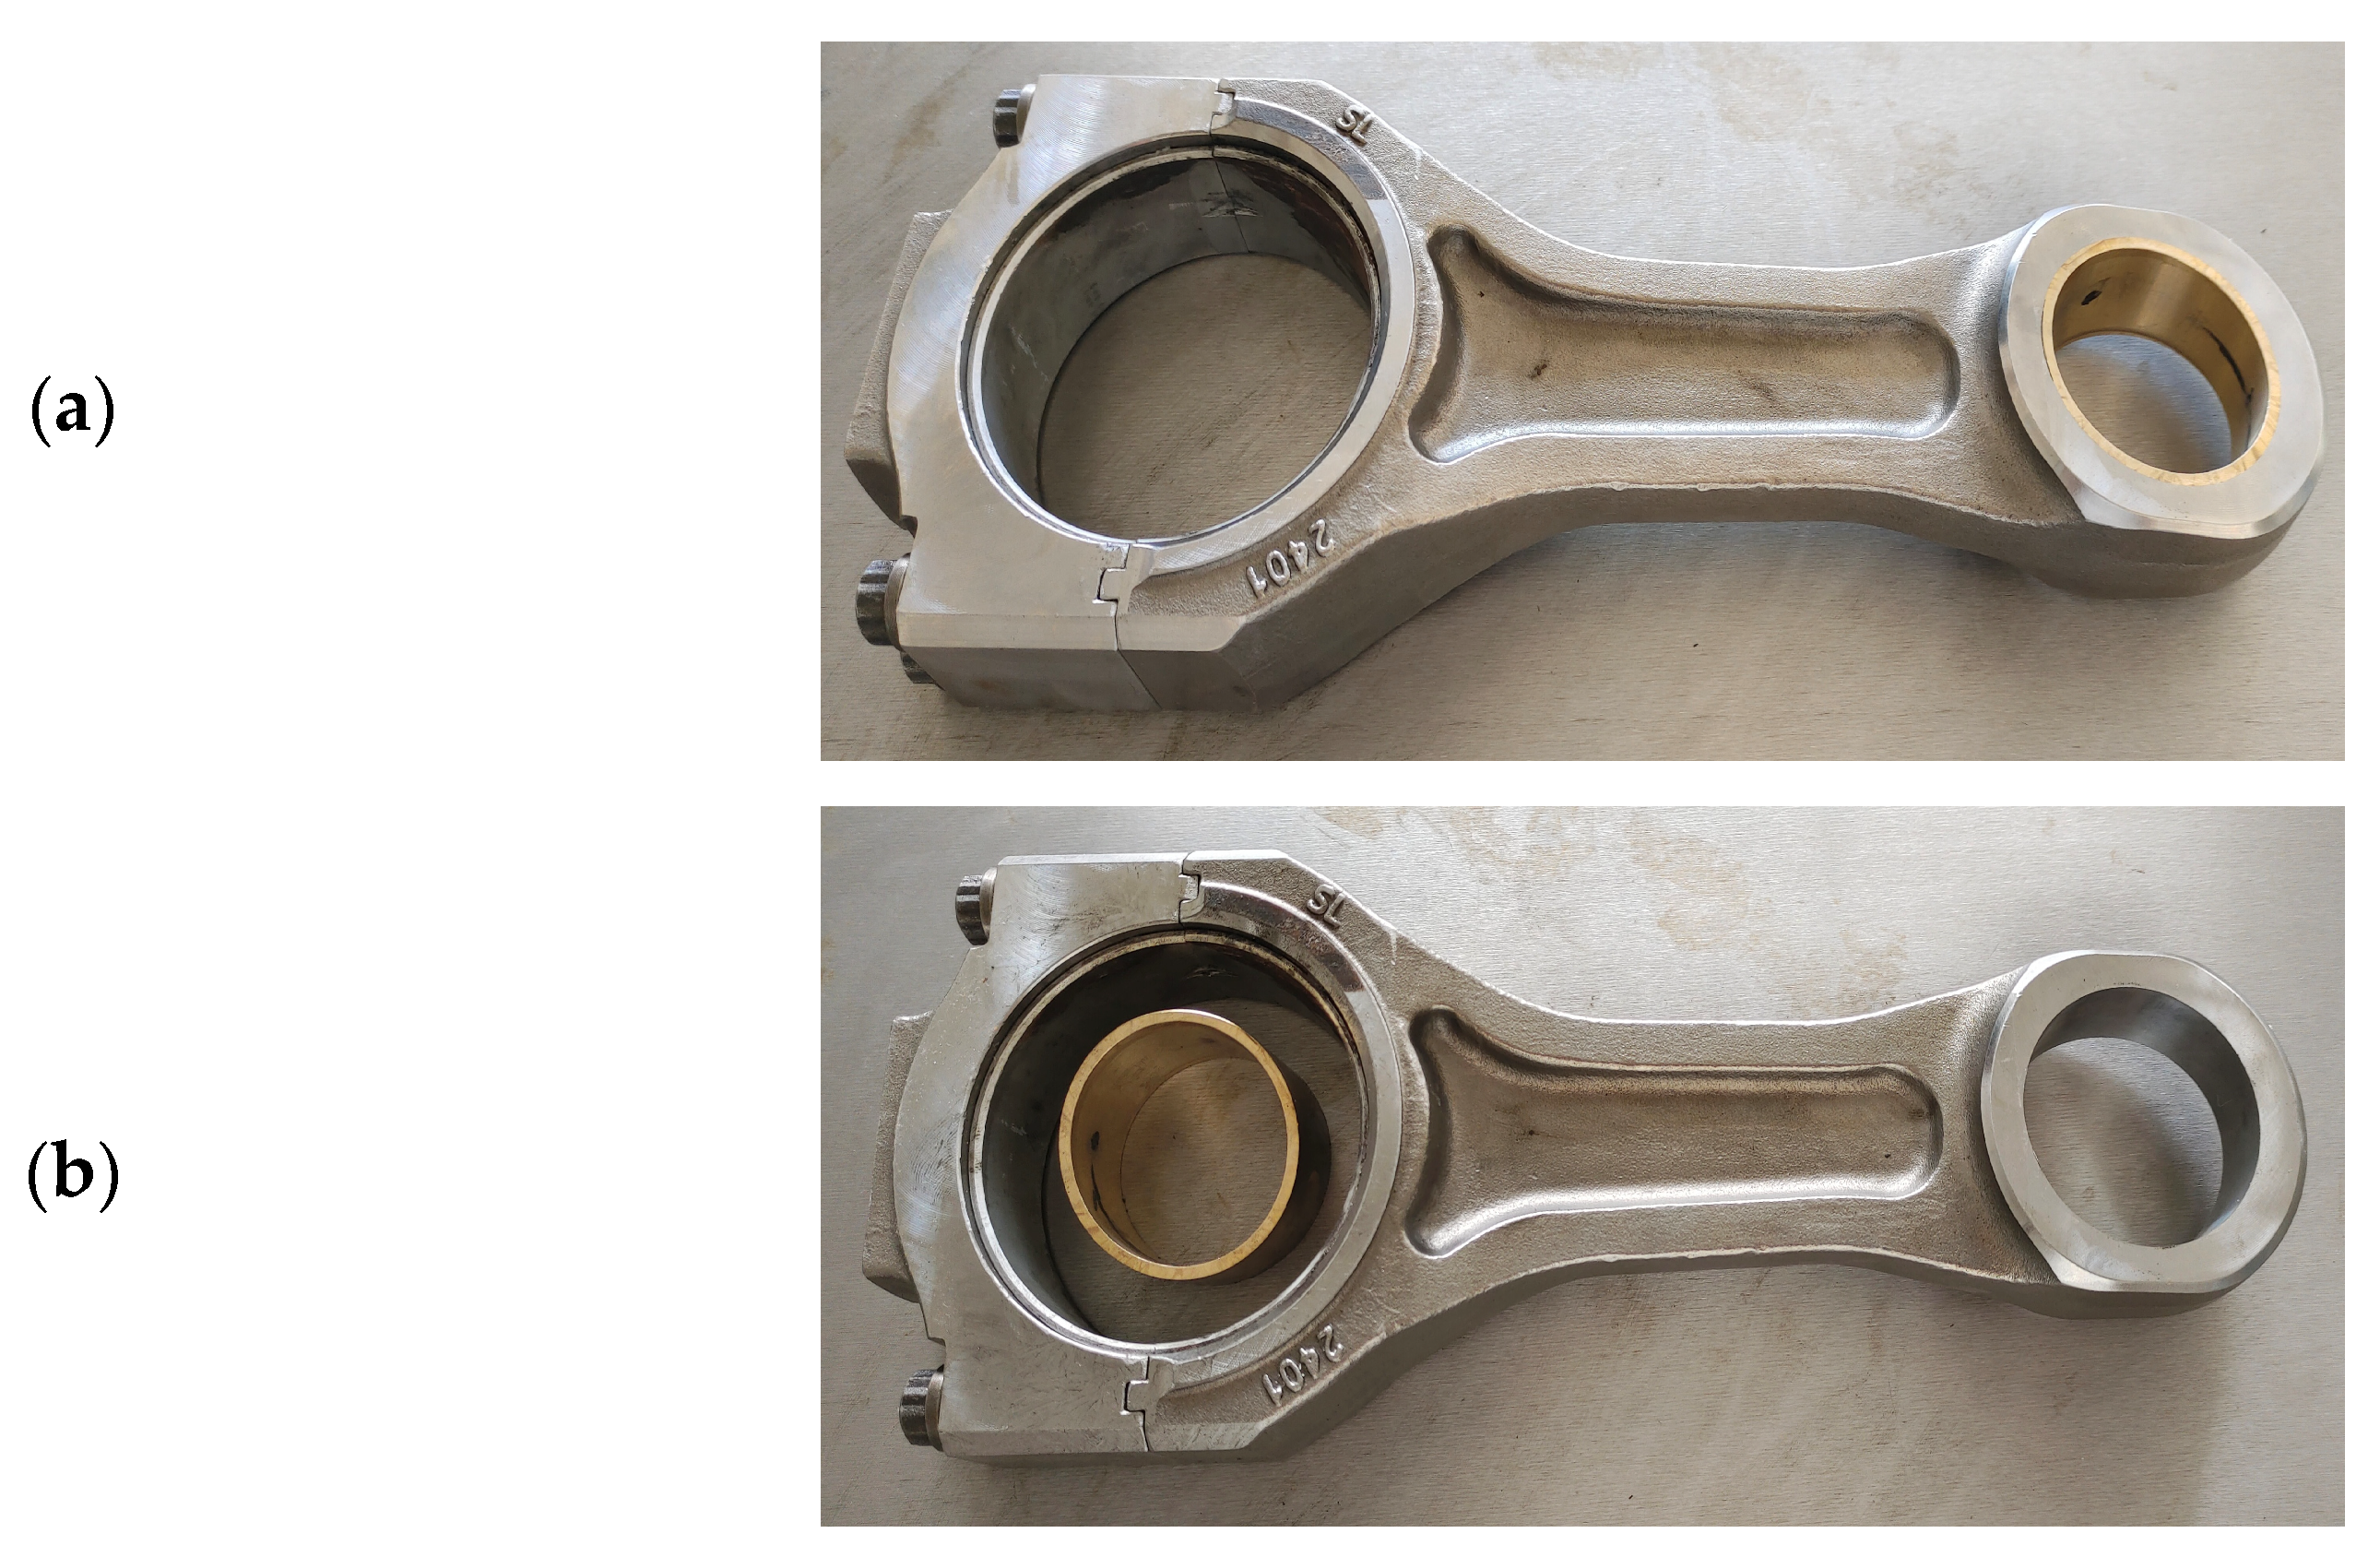
Figure 7 is a schematic diagram of the specimen before and after the bushing is pressed in. As indicated in Figure 8b, the peak push-out force for a bushing with an interference of 0.04 mm was obtained from the test setup’s intelligent display. The readings in kilograms (kg) were converted to Newtons (N), yielding a maximum retention force of 16,520 N.
To further validate the reliability of the retention force model, the experimentally measured force was compared against both the theoretical and simulated values. The relative errors between experimental–theoretical and experimental–simulated results were calculated and are presented in Table 6, with all values rounded to two decimal places.
Experimental validation was performed on manufactured bushing assemblies with interferences of 0.04 mm and 0.05 mm. Retention forces were measured via a hydraulic press with a calibrated sensor (accuracy ± 0.3%). Comparative analysis (Table 6) yielded the following results: the maximum error between experiment and simulation was 1.2%; the maximum discrepancy between experiment and theory was ≤2.1%. Both values are within the accepted 5% engineering tolerance. Good agreement between experimental and simulated results confirms the experimental validation of the model, while consistency between theoretical and simulated outcomes supports its numerical verification. Together, they demonstrate the reliability and predictive accuracy of the proposed finite element model.

3. Determination of the Retention Force Range

3.1. Determination of the Interference Fit Range

FEA simulations for the connecting rod bushing were performed under two distinct conditions to determine a safe operational interference range: 1. Assembly Condition: Simulating the press-fit process with no external constraints or loads applied. 2. Peak Operating Condition: Simulating the engine firing load, with the connecting rod small end fixed and the peak combustion pressure applied. For both conditions, key outputs including the contact pressure, von Mises stress (VMS), and Equivalent Plastic Strain (EPS) on the bushing outer surface were analyzed to establish the allowable interference limits.

3.1.1. Theoretical Interference Range Calculation

(1)
Contact Pressure of the Interference Fit between the Connecting Rod Small End and the Bushing
The 182 kN load adopted in this derivation is a radial compressive force applied to both ends of the piston pin, which is transmitted to the inner surface of the bushing through the lubricating oil film, consistent with the actual force transfer mechanism of the diesel engine connecting rod bushing. The targeted failure mode is circumferential micro-slip at the bushing–rod interface, which further evolves into axial loosening of the bushing. The asymmetric oil film pressure distribution induced by the radial load generates a net circumferential moment at the interference fit interface, which tends to drive circumferential micro-slip; the minimum contact pressure is thus derived to resist this moment and prevent initial loosening.
The frictional force acting between the small end of the connecting rod and its bushing [23,24,25,26,27]:
f = K μ
where μ is the friction coefficient between the bushing and the small end, and K represents the peak radial load of 182 kN, which corresponds to the maximum oil film pressure in the test. This formula calculates the total frictional force at the interference fit interface, which provides the resistance to prevent relative slip between the bushing and the small end.
To resist the circumferential moment induced by the 182 kN radial load (the core driving factor of bushing micro-slip), the frictional force needs to transmit a corresponding resistance torque. The maximum torque transmissible by the contact surface of the interference fit is given by [23,24,25,26,27]:
T = f r
where r is the contact radius at the interface between the connecting rod small end and the bushing, with a value of 24.5 mm.
To ensure the reliability of the bushing connection, two independent conditions must be satisfied: preventing interfacial micro-slip and preventing plastic yielding of the bushing. Based on this, a safe design window for the contact pressure p can be established: p min p p max . The derivation logic and parameter definitions are as follows:
  • Basic Assumptions:
    • Interface Model: The contact between the bushing and the connecting rod small hole follows Coulomb’s friction law, with a constant static friction coefficient μ .
    • Simplified Design Calculation: For ease of design, the contact pressure p generated by the interference fit is assumed to be uniformly distributed over the nominal cylindrical surface.
    • Loading Condition: Micro-slip is driven by the radial force K generated under the engine’s peak operating load. This force is equivalent to a driving torque T acting on the mating surface, which tends to rotate the bushing.
    • Strength Condition: The bushing material is an ideal elastic–plastic body with a yield strength σ s . Preventing plastic failure corresponds to controlling the maximum contact pressure.
  • Key Physical Quantities:
    • Radial Load K: The radial force acting on the bushing due to peak cylinder pressure, serving as a known input under operating conditions.
    • Driving Torque T: The torque induced by the radial load K that tends to rotate the bushing ( T = K · e , where e is the effective lever arm), serving as the input for the anti-slip condition calculation.
    • Contact Pressure p: The radial pressure resulting from the interference fit, acting as the core variable linking mechanical design and frictional behavior.
    • Friction Coefficient μ: The static friction coefficient of the mating pair (alloy steel–tin bronze), a critical material interface property parameter (taken as μ = 0.2 in this study).
Derivation of Minimum Pressure p min (Anti-Slip Condition): To prevent the bushing from rotating under the driving torque T, the maximum static friction torque provided by the contact surface must be no less than T.
For a cylindrical surface with radius r 1 , contact length l , and uniform pressure p , the maximum static friction torque is:
T friction , max = 0 2 π μ p ( r 1 d θ l ) r = 2 π μ   p r 1 2 l T
This formula represents the ultimate torque that can be transmitted by the contact surface between the small end of the connecting rod and the bushing under a given pressure p and a friction coefficient μ = 0.2 . It serves as the essential link between the normal clamping force (generated by the interference fit) and the tangential load-bearing capacity (which resists rotational slip).
From this, the minimum interference fit pressure required to prevent fretting slip of the bushing can be derived as:
P min = 2 T μ π d 2 l
where d is the small end inner diameter and l is the contact length. Substituting the torque T (from Equation (5)) and the above parameters into this formula yields the minimum contact pressure required to prevent circumferential micro-slip.
Determination of Maximum Pressure p max (Yield Condition): The maximum contact pressure occurs when the equivalent stress under load reaches the respective material’s yield strength. This limiting pressure is given by [23,24,25,26,27]:
P max = t σ s r 3
where t is the bushing wall thickness (2.5 mm), σ s is the yield strength of the bushing material (approximately 620 MPa), and r 3 is the inner radius of the bushing. This formula ensures the contact pressure does not exceed the material’s yield capacity, avoiding permanent deformation of the bushing.
Combining the above equations, the contact pressure range for the tin bronze QSn7-0.2 bushing manufactured by the high-pressure spin forming process is determined to be 34.77–66.67 MPa.
(2)
Theoretical Calculation of the Bushing Interference
The contact pressure range of 34.77–66.67 MPa is obtained from Equations (4)–(8). Substituting this range into Equation (8) yields a theoretical interference range of 0.07–0.14 mm.
Δ = r 1 1 E 1 r 1 2 + r 2 2 r 2 2 r 1 2 + ν 1 + 1 E 2 r 1 2 + r 3 2 r 1 2 r 3 2 ν 2 p
where = interference; r 1 = small end inner radius (24.5 mm); r 2 = small end outer radius (37.0 mm); r 3 = bushing inner radius (22.0 mm); E 1 , E 2 = elastic moduli (209 GPa, 129 GPa); ν 1 , ν 2 = Poisson’s ratios (0.29, 0.27); and p = average contact pressure on the bushing outer surface.
To elucidate the logical flow from operational loads and material properties to the final design specification, the roles of all key parameters are categorized and summarized in Table 7.

3.1.2. Simulation Analysis Under Assembly Conditions

Based on the established finite element model and the theoretically calculated interference range of 0.07–0.14 mm, a series of simulations was performed. The interference was varied from 0.07 mm to 0.14 mm in increments of 0.01 mm to assess the connection reliability under each condition.
The bushing loosening failure criteria were defined as follows:
  • Minimum Interference Criterion: At the lower bound of the interference range, the contact pressure on the bushing outer surface must exceed 34.77 MPa. This ensures sufficient frictional resistance to transmit the peak operational load of 182 kN without slippage.
  • Maximum Interference Criterion: At the upper bound, the EPS in the bushing must be negligible, ensuring the material remains within its elastic limit to avoid permanent deformation or damage.
The simulation results at the lower and upper bounds of the theoretical interference range (0.07 mm and 0.14 mm) were analyzed to assess their viability.
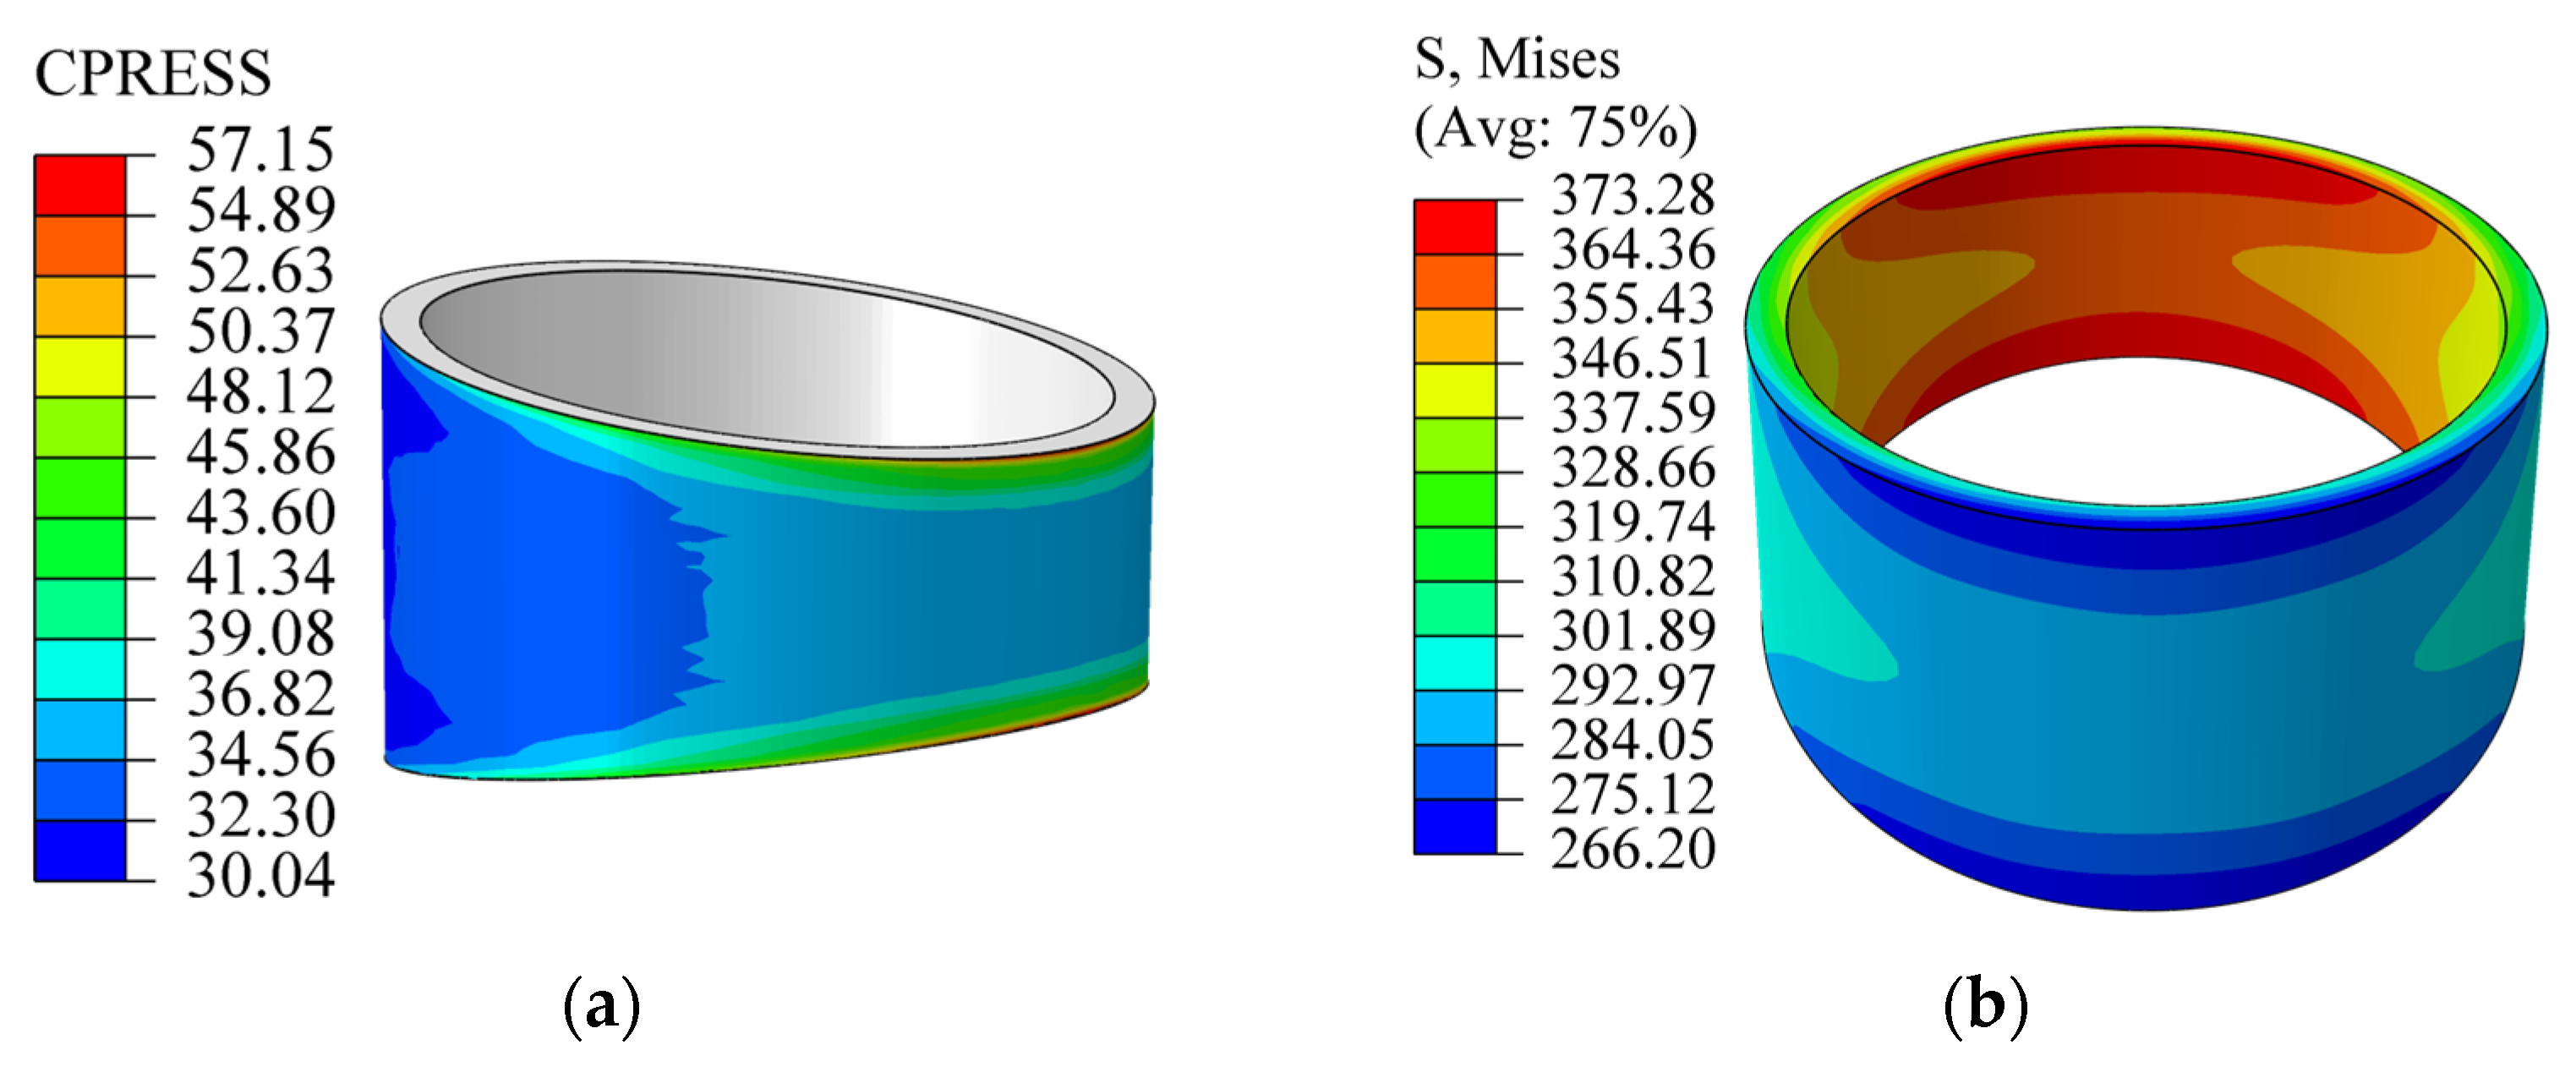
  • At 0.07 mm Interference: As depicted in Figure 9a, the minimum contact pressure on the bushing outer surface is 30.04 MPa, falling below the required theoretical minimum of 34.77 MPa. This insufficient pressure occurs primarily in the larger cross-section region of the trapezoidal bushing. Consequently, an interference of 0.07 mm is inadequate to prevent slippage under the design load. The maximum contact pressure is localized at the upper and lower edges of the smaller cross-section, which is a typical stress-concentration feature at the edge of an interference-fit junction. Figure 9b shows that the maximum VMS reaches 373.28 MPa. This stress is concentrated on the inner surface of the bushing’s smaller cross-section, exhibiting an I-shaped distribution pattern.
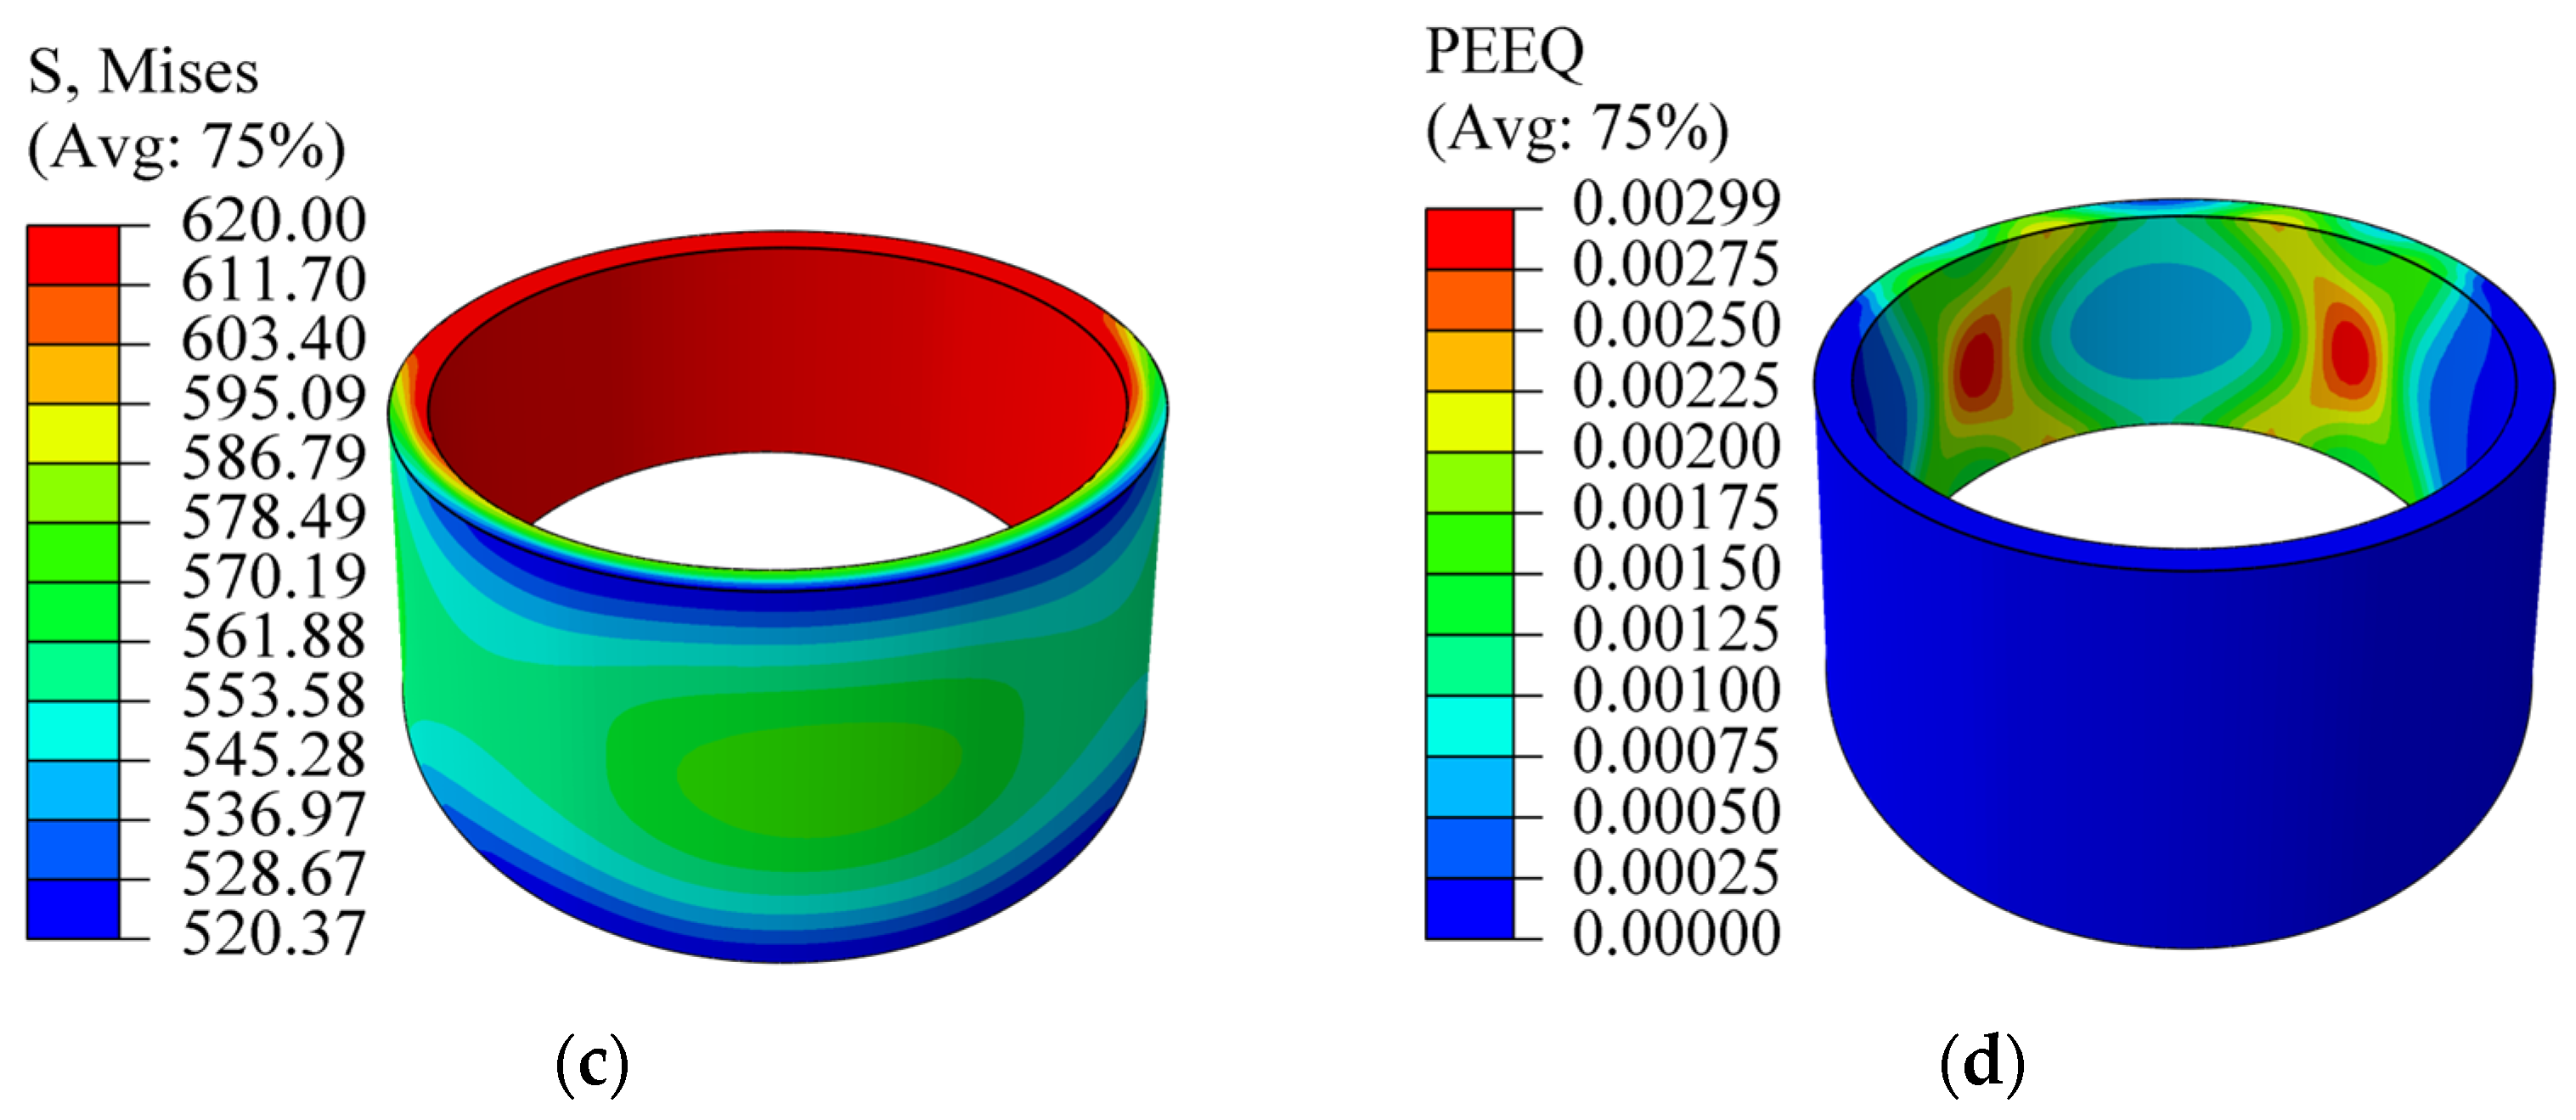
  • At 0.14 mm Interference: Stress and Plasticity: Figure 9c,d indicate that the maximum VMS exceeds the yield strength (620 MPa) of the tin bronze bushing material. Significant plastic deformation occurs on the inner wall of the smaller cross-section, with a maximum EPS of 0.00299. Since this interference level induces yielding and permanent deformation, a value of 0.14 mm is unacceptable for a safe, elastic design.
Conclusion: Both the lower bound (0.07 mm) and upper bound (0.14 mm) of the initial theoretical range fail to meet the design criteria—one due to insufficient contact pressure and the other due to material yielding.
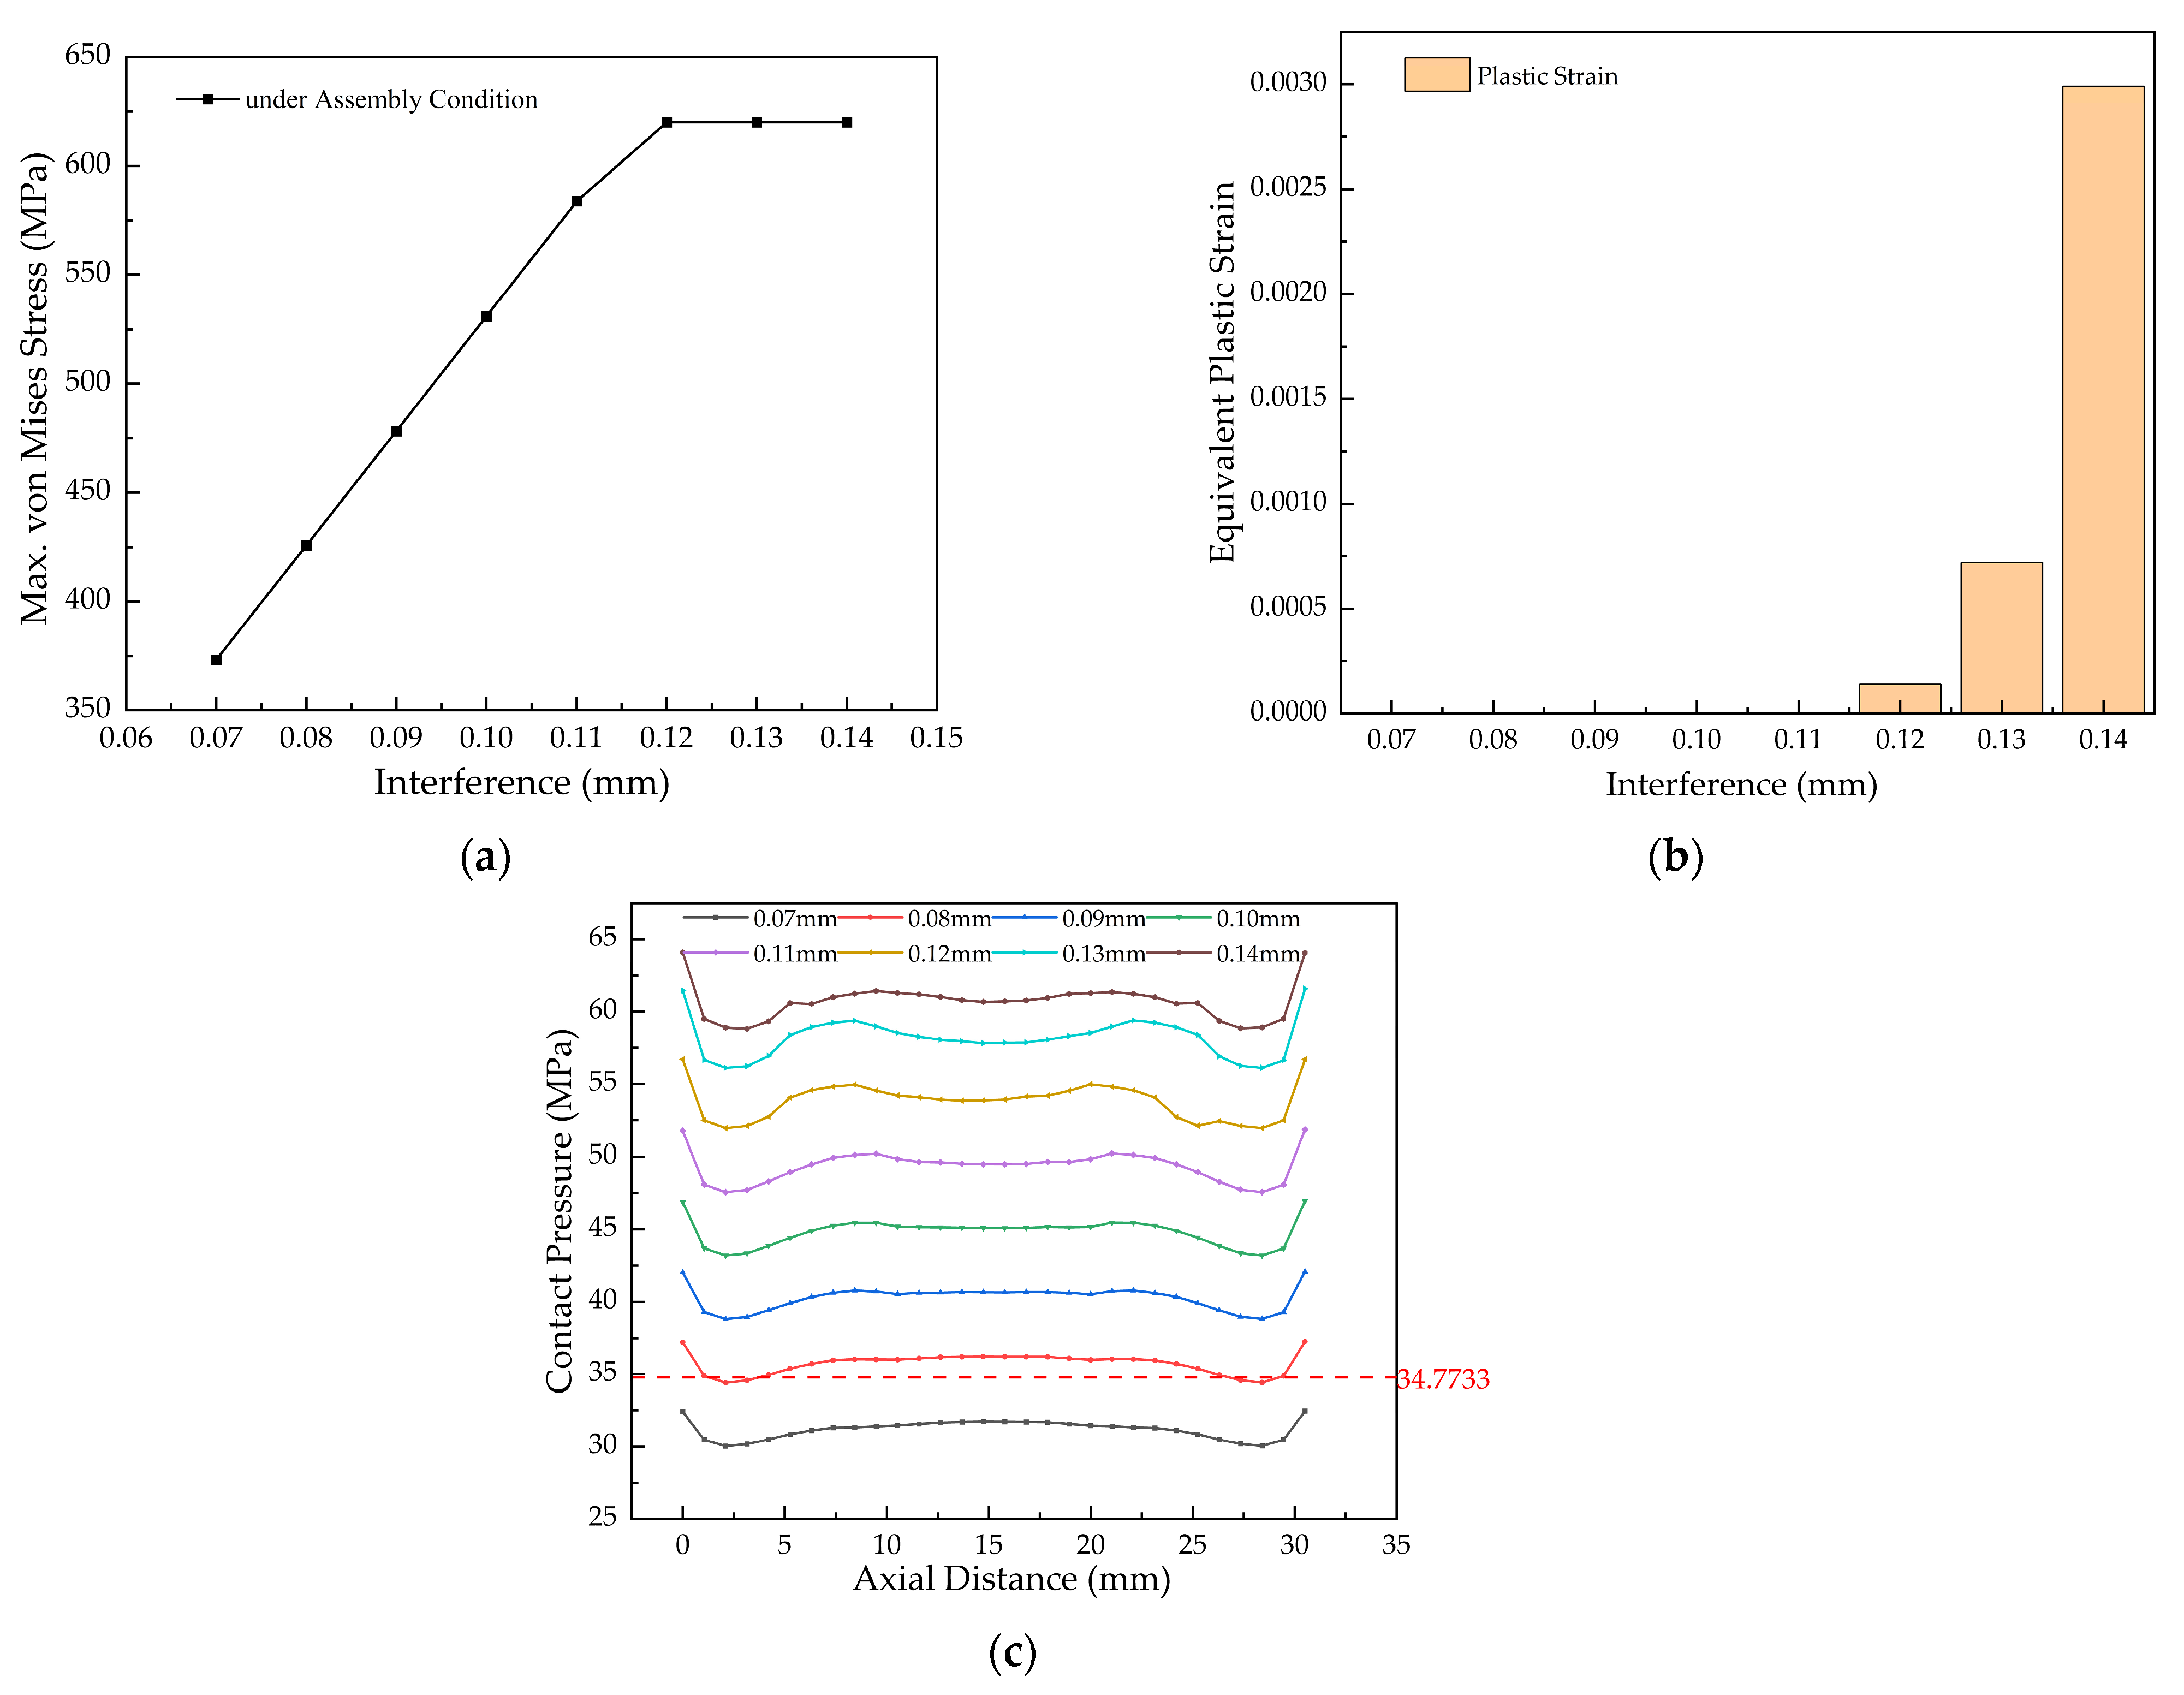
Figure 10 presents the simulated results across the interference range of 0.07 to 0.14 mm, showing curves for the maximum VMS, EPS, and outer-surface contact pressure of the bushing.
Analysis of Figure 10 yields the following insights for determining the safe interference range: Figure 10a shows that the maximum VMS in the bushing increases linearly with interference until reaching the material yield strength (620 MPa) at 0.12 mm interference. Beyond this point, the onset of plastic deformation alters the stress trend. The stress increases by 246.72 MPa as interference rises from 0.07 mm to 0.12 mm. Figure 10b confirms that plastic strain occurs once the yield strength is exceeded, with a maximum value of 0.00299 observed at 0.14 mm interference. The contact pressure distribution (Figure 10c) is consistent across the range: higher at both axial ends and uniform in the middle. Although the pressure at 0.08 mm interference (34.42 MPa) is marginally below the theoretical minimum (34.77 MPa), this occurs only over a negligible portion of the contact area. Therefore, 0.08 mm is considered acceptable. Increasing interference to 0.14 mm raises the contact pressure to 58.82 MPa (an increase of 28.78 MPa compared to 0.07 mm), confirming that greater interference enhances connection reliability within the elastic design limits. Based on this analysis, interference values of 0.07 mm (insufficient contact pressure) and 0.12–0.14 mm (causing yielding and plastic strain) are excluded from the allowable range.
Based on the preceding analysis, a safe interference range of 0.08–0.11 mm is established for assembly. This range ensures reliable performance without risk of loosening.

3.1.3. Simulation Analysis Under Peak Combustion Pressure

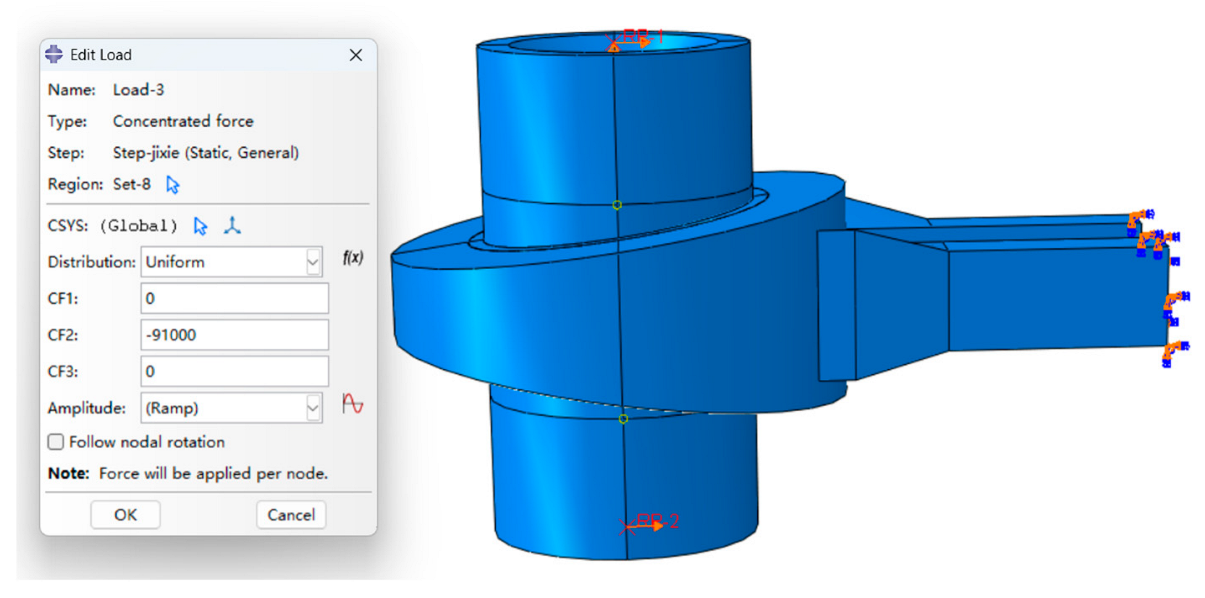
The combustion pressure moment corresponds to the most critical operational load case for the connecting rod bushing, inducing peak equivalent stress. To simulate this load case, the mechanical load was applied equivalently to both ends of the piston pin. This was achieved by defining a coupling point at each pin end, kinematically coupled to its respective end face. Subsequently, a radial load of 91 kN was applied to these coupling points. The specific loading configuration is illustrated in the corresponding Figure 11. The piston pin was constrained in the axial direction only, with all other degrees of freedom left unconstrained. This setup was designed to enhance simulation accuracy, thereby providing a reliable basis for subsequent analysis.
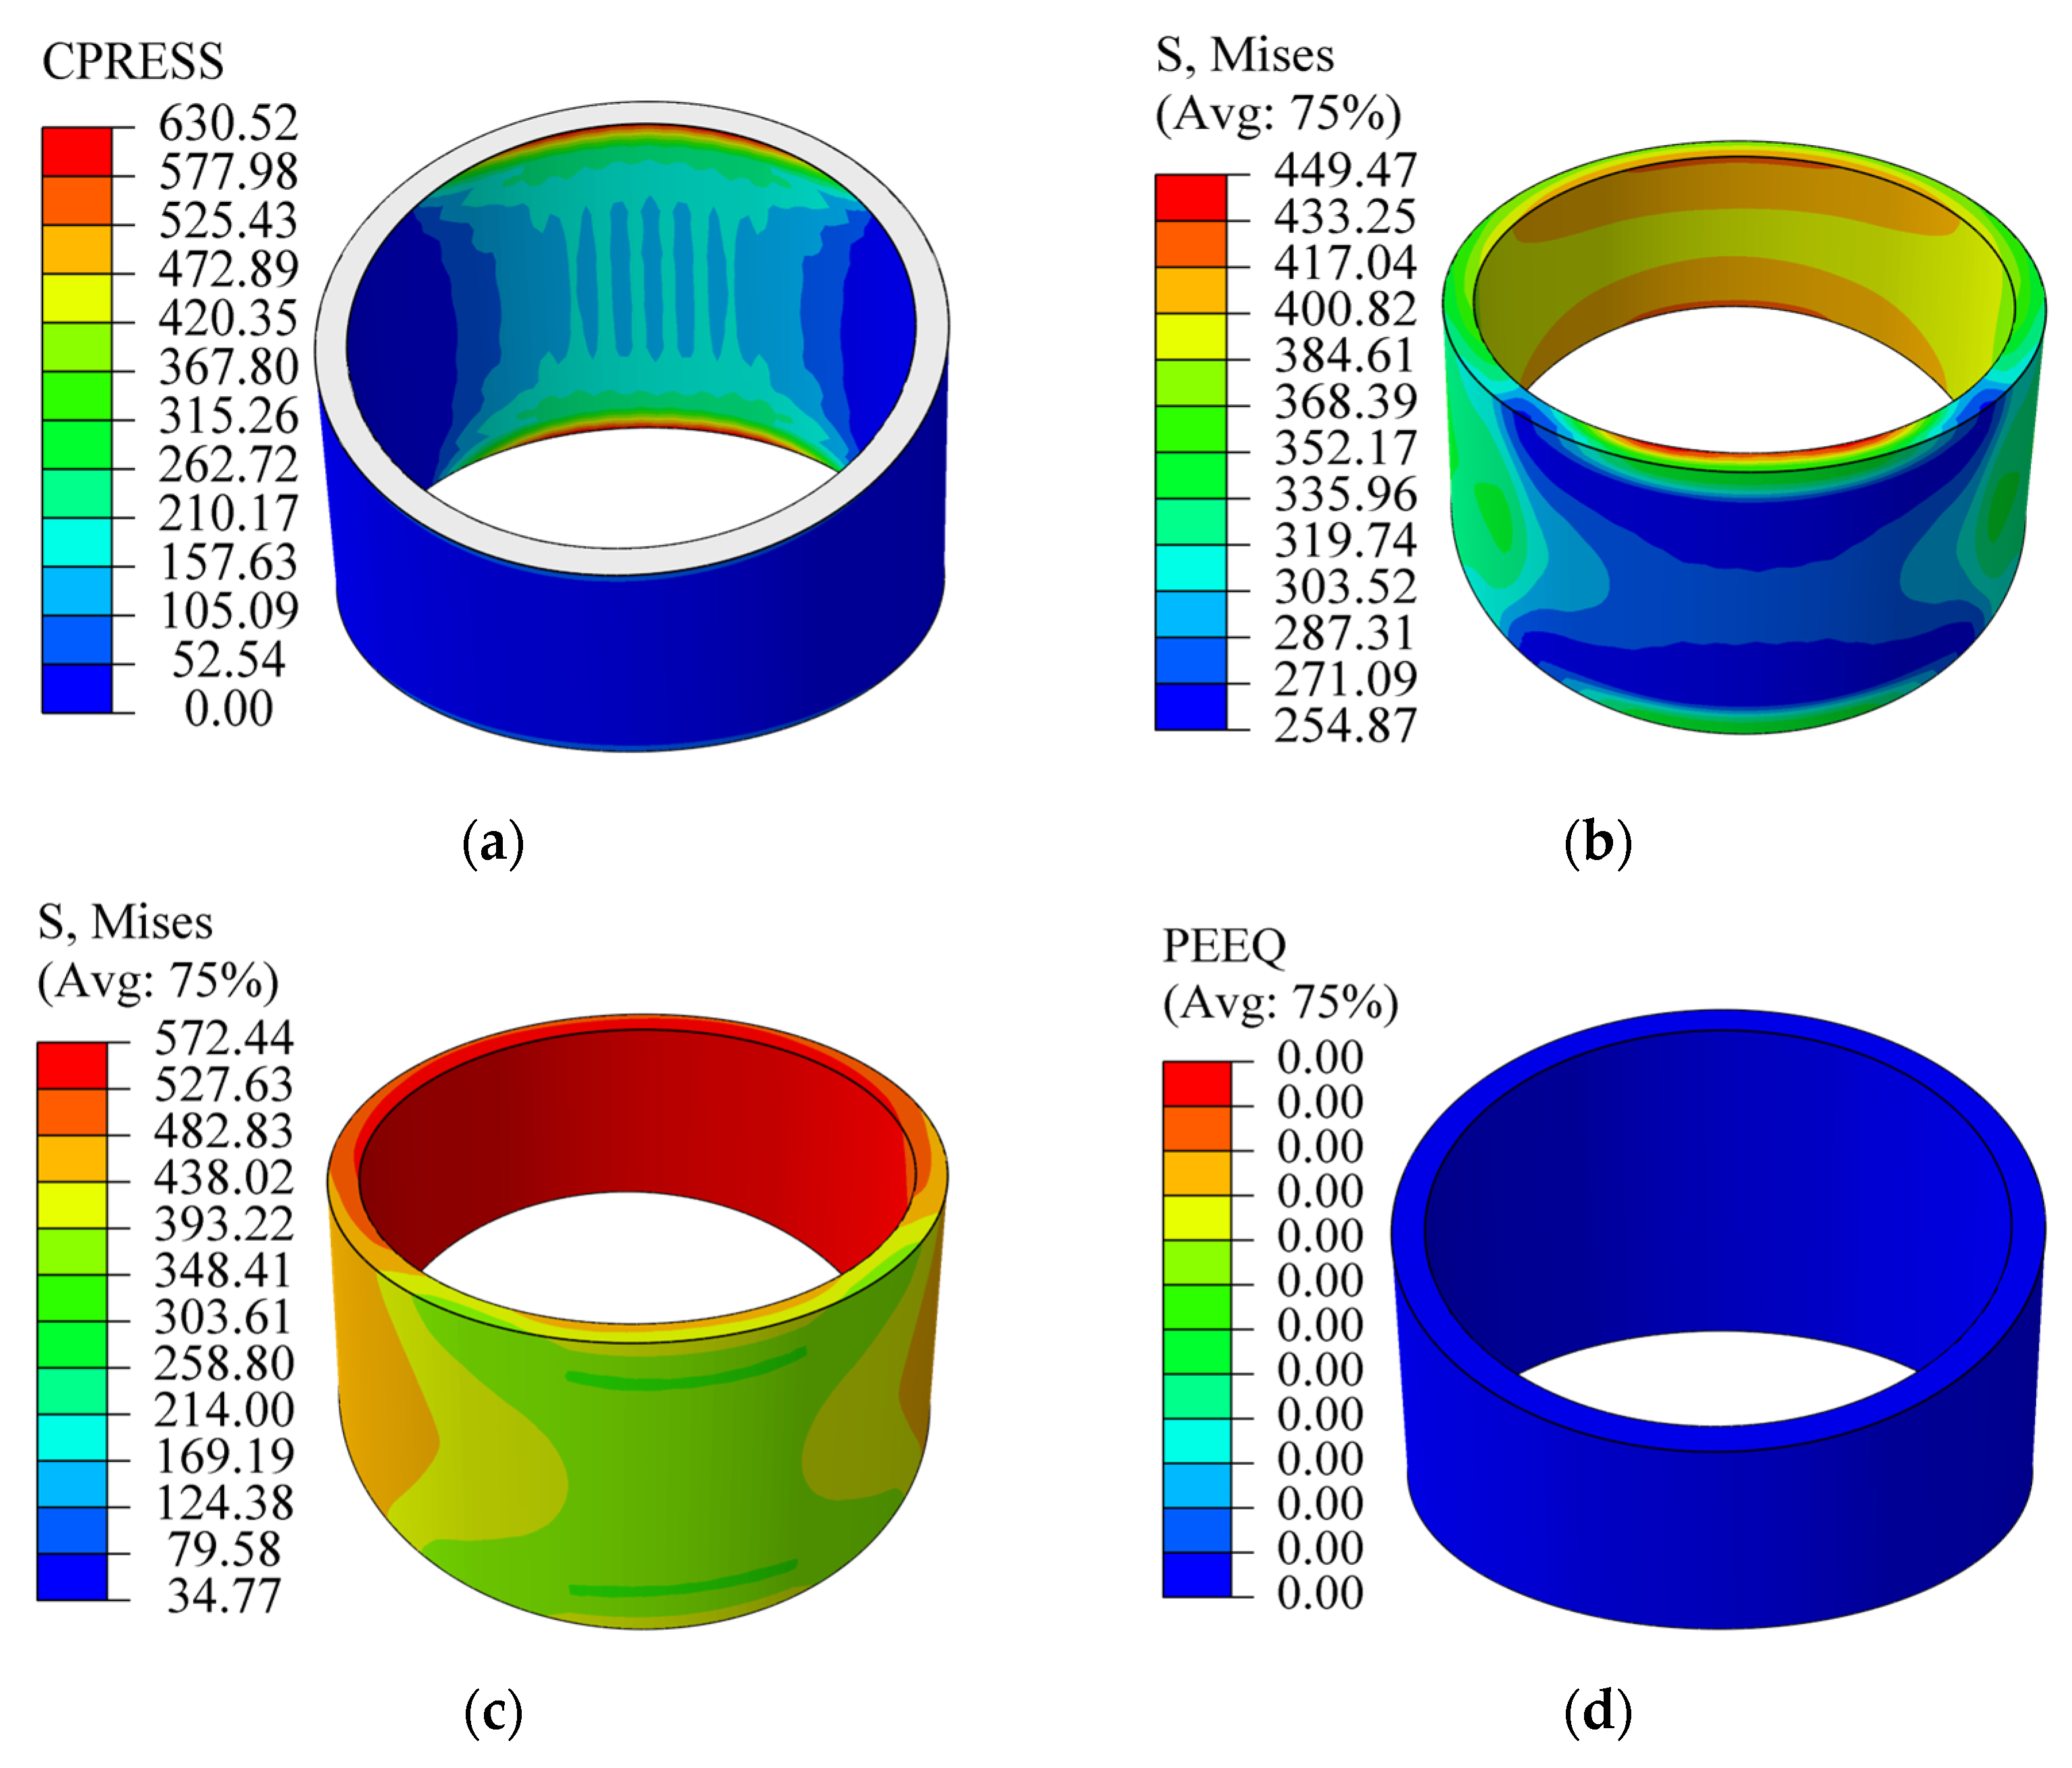
Under peak combustion pressure conditions, the applied load causes bending deformation of the piston pin, fundamentally altering the load transfer and stress state of the bushing assembly. As shown in Figure 12a, the bending of the piston pin results in contact with the bushing only at the end adjacent to the connecting rod, with the contact area covering approximately one-quarter of the axial length of the bushing. Within this contact zone, the contact pressure distribution is non-uniform: it reaches a maximum of 630.52 MPa at the upper and lower edges of the inner surface of the bushing, while being lower in the central region. The remaining three-quarters of the inner surface of the bushing experience zero contact pressure.
This localized loading leads to a characteristic stress distribution. Figure 12b indicates that the maximum VMS (449.47 MPa) occurs at the edges of the inner surface within the contact zone. A secondary stress concentration (417.25 MPa) is observed at the edges of the smaller trapezoidal cross-section of the bushing. The axial stress distribution is symmetric, being higher at both ends and lower in the middle. The elevated stress at the edges is a characteristic mechanical response at the junction of an interference fit. Numerical results for the upper limit of the allowable interference range (0.11 mm) confirm its structural safety. Figure 12c shows that the maximum VMS is 572.47 MPa, located in the smaller cross-section and still below the material yield strength. Importantly, Figure 12d shows zero equivalent plastic strain (EPS) over the entire domain, confirming that the bushing remains fully elastic under this extreme interference condition and will not undergo plastic deformation or loosening failure.
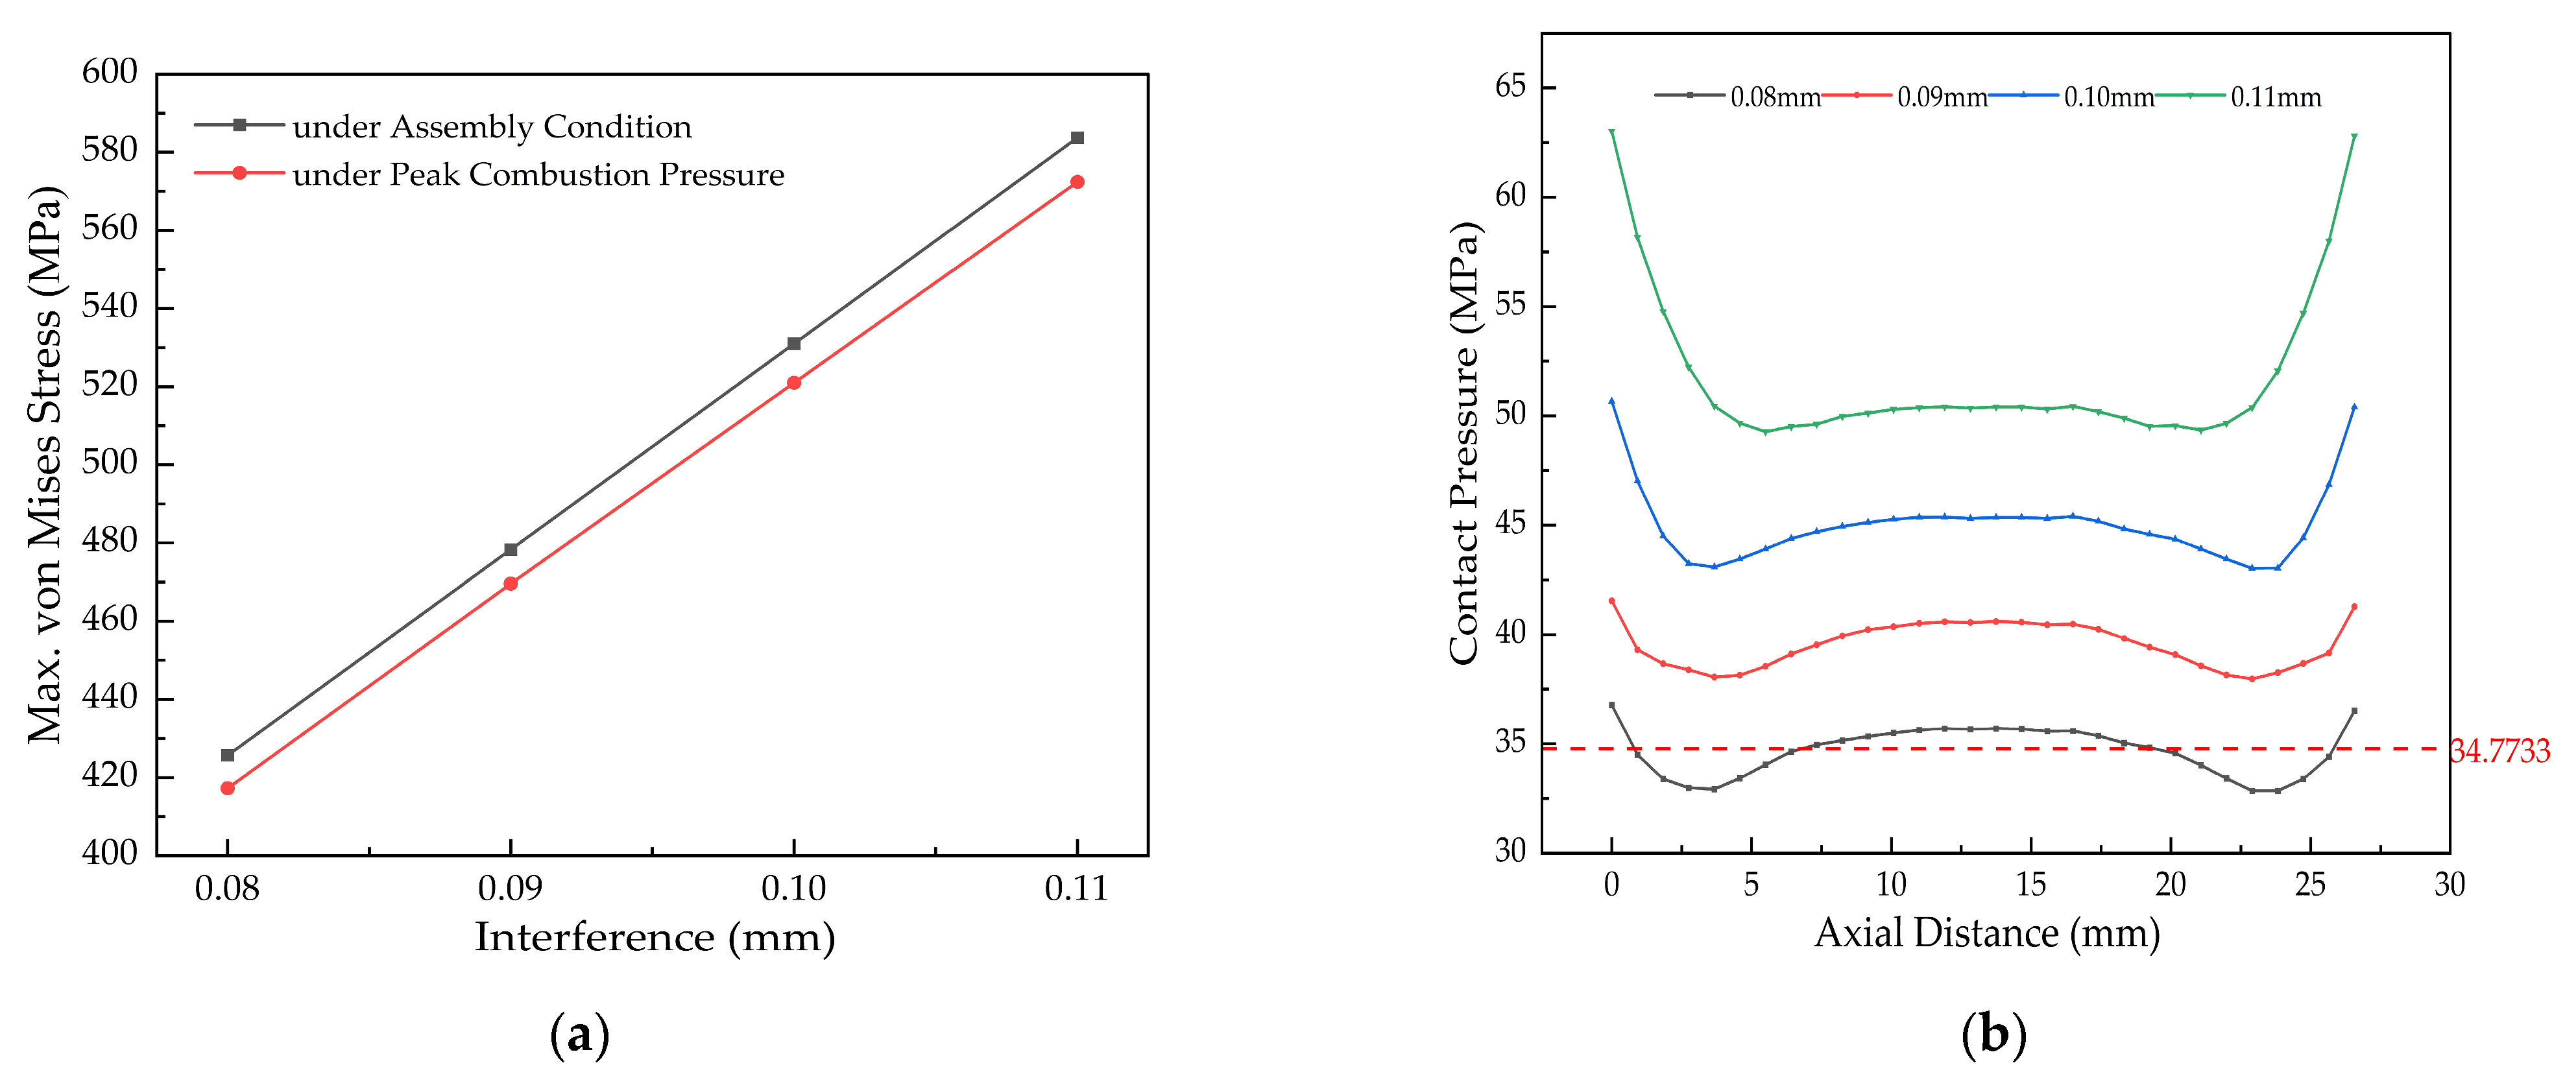
Figure 13a indicates that under mechanical load, the maximum VMS in the bushing decreases by approximately 10 MPa compared to the assembly-only condition. This reduction is attributed to a slight elliptical deformation of the connecting rod small end under combustion pressure, which elongates along the load direction. This deformation alleviates the localized assembly-induced constraint, promoting a more uniform load distribution and thus reducing the local peak stress.
As shown in Figure 13b, at 0.08 mm interference, the minimum contact pressure is 32.85 MPa. Although marginally below the required 34.77 MPa, this occurs over a negligible area. The pressure across the remainder of the surface sufficiently exceeds the requirement, ensuring no loosening. In contrast, at 0.11 mm interference, the minimum contact pressure rises significantly to 49.52 MPa—an increase of about 17 MPa—which further enhances connection security.
Based on the simulation results under the assumed conditions, the allowable interference range for the connecting rod bushing under peak combustion pressure is predicted to be 0.08–0.11 mm. This model-derived range is theoretically capable of ensuring reliable assembly without loosening failure under the simulated load case. It should be noted that this conclusion is obtained from finite element analysis, and the proposed interference range has not been fully validated by comprehensive experiments.

3.2. Determination of the Retention Force Range

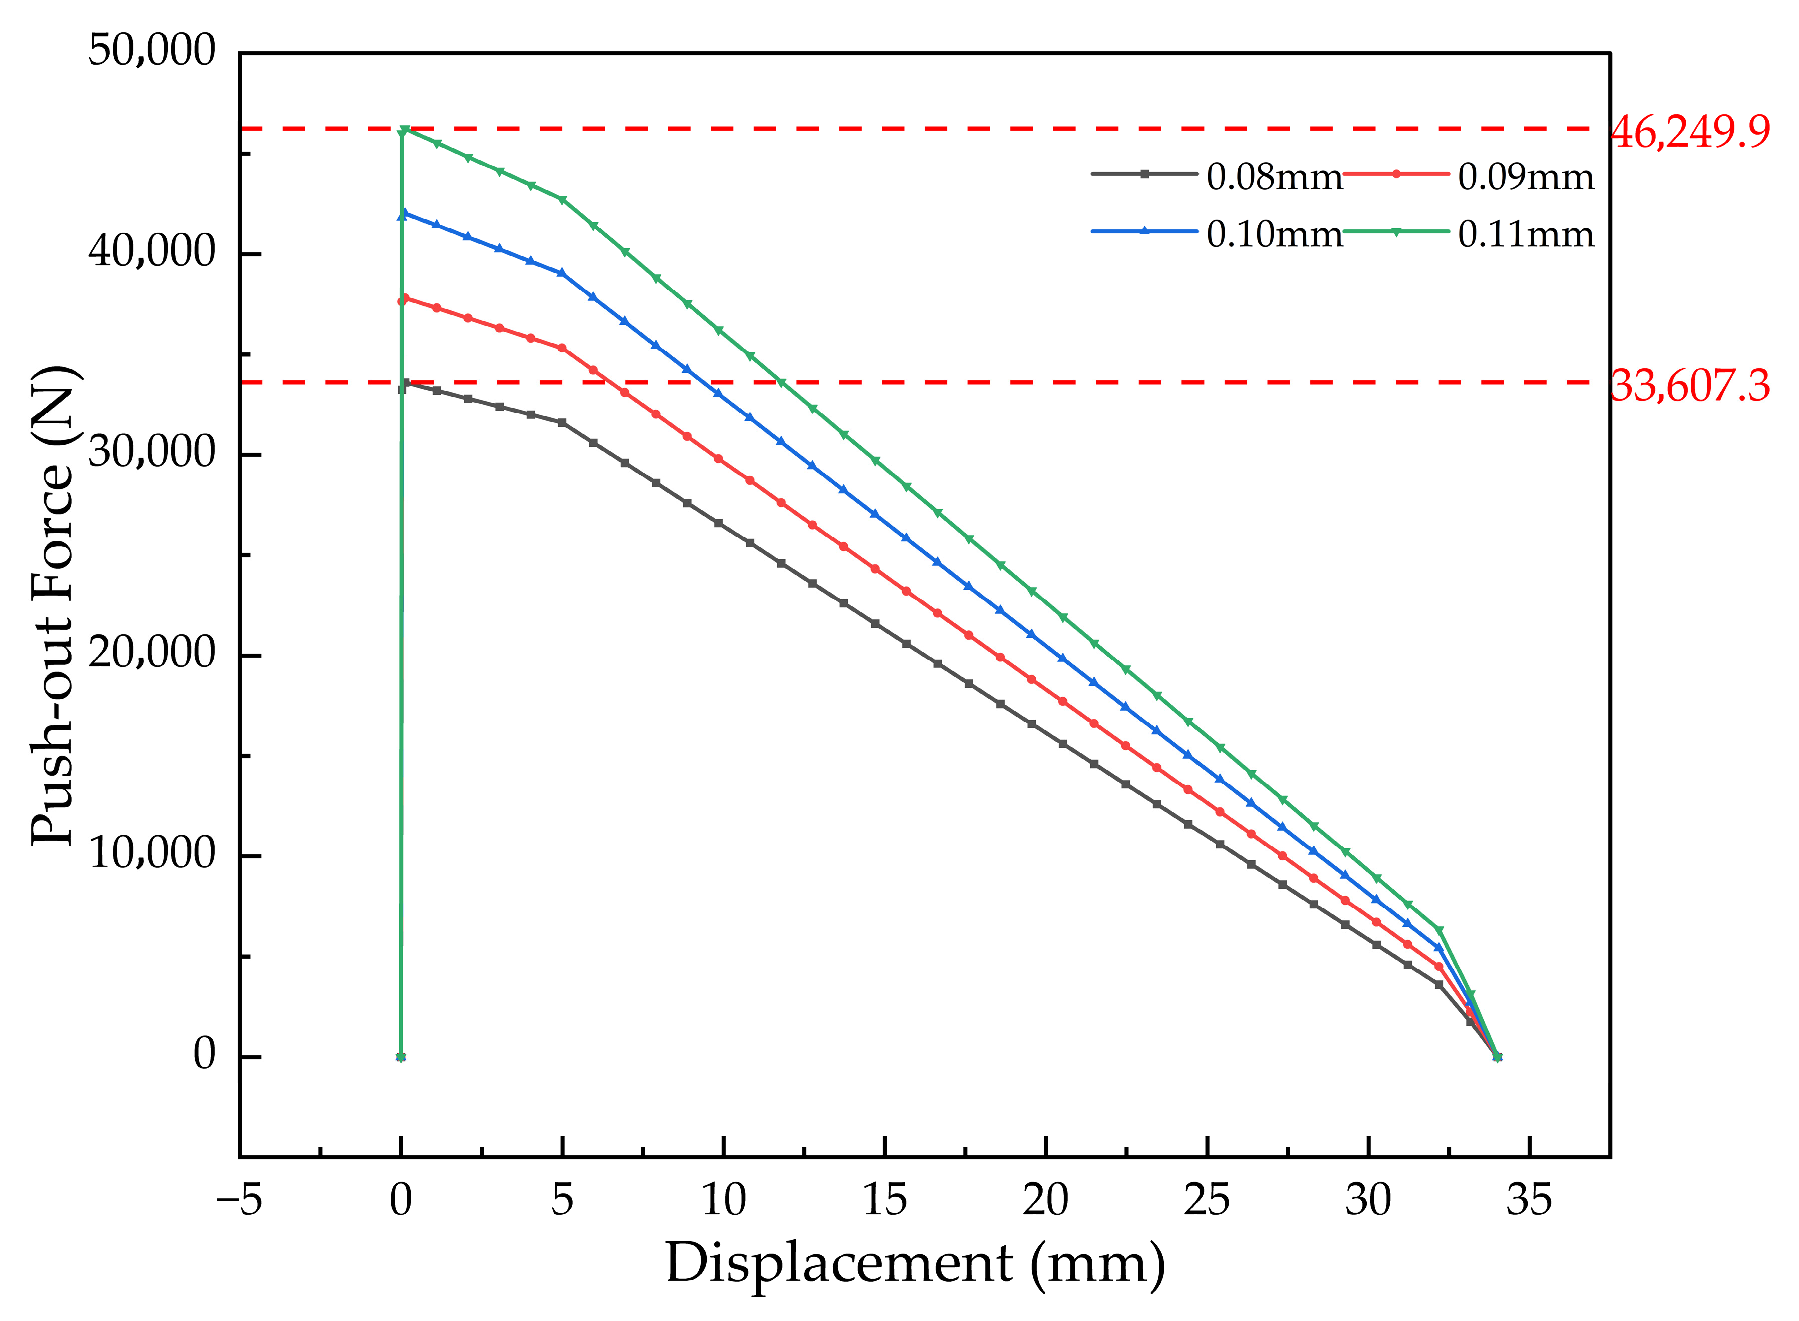
Based on the work above, the optimal interference range for reliable bushing performance under both assembly and operating conditions is 0.08–0.11 mm. Accordingly, push-out simulations were conducted across this range to obtain the corresponding retention force, the results of which are presented in Figure 14.
Figure 14 shows that for a bushing with 0.08 mm interference, the push-out force attains its peak value of 33.61 kN at the onset of displacement. The force then decreases continuously with further displacement until it drops to zero upon complete ejection of the bushing. The push-out force versus displacement curves for all interference levels within the 0.08–0.11 mm range exhibit a consistent pattern. Notably, at the upper limit of this range (0.11 mm interference), the simulated retention force reaches 46.25 kN.
Based on the simulation model, the optimal retention force range corresponding to the predicted 0.08–0.11 mm interference is derived to be 33.61–46.25 kN. This range is a model-based estimate that requires further experimental confirmation to validate its suitability for practical application.

3.3. Comparative Analysis with Existing Research

This section aims to determine the safe interference fit range and retention force interval for a connecting rod bushing with typical structural parameters. Based on integrated theoretical verification, finite element simulation, and experimental validation, the key conclusions are drawn. These results are further compared with relevant literature to clarify the academic value and innovative contributions of the present study.
Existing research on the optimal interference fit range exhibits notable limitations: For instance, Marmorini et al. [28] proposed a general range of 0.05–0.10 mm, which does not account for peak operational loads (e.g., the 182 kN combustion pressure in this study), thereby increasing the risk of loosening under high-load conditions. Similarly, the range of 0.06–0.09 mm proposed by Xiao et al. [29] for small inner-diameter bushings is not directly applicable to the complex “large inner-diameter, thin-wall” structures considered here. In contrast, the safe range of 0.08–0.11 mm determined in this study incorporates dynamic operational loads as constraints and establishes a mapping between structural parameters and the interference fit range. This approach addresses the common shortcomings of existing studies—often detached from actual operating conditions and employing a “one-size-fits-all” criterion—making it particularly suitable for heavy-duty diesel engine applications.
Regarding retention force, the thermal cycling experiments by Liu et al. [30] focused solely on its degradation due to temperature increase and did not clarify the effective range under dynamic loads. Similarly, Jiang et al. [31], using thermo-elastoplastic theory, emphasized residual stress relaxation but overlooked the influence of peak combustion pressure. The retention force range of 33.61–46.25 kN established in this study ensures the lower limit meets anti-slip requirements under dynamic loads, while the upper limit prevents plastic deformation from excessive interference. This provides a complementary perspective to studies focused primarily on static conditions.

4. Influence of Bushing Structural Parameters on Retention Force

Following the limited experimental verification of the interference-fit and push-out force models, this section investigates the influence of key bushing structural parameters. The validated simulation model is employed to systematically vary three geometric parameters—inner diameter, wall thickness, and width—and calculate the corresponding retention force for each configuration. Analysis of these simulation results reveals the quantitative influence and trends of these parameters on retention force. This parametric study, conducted primarily through simulation, aims to provide theoretical insights and predictive design data for optimizing engine connecting rod bushings to mitigate loosening failure, with the understanding that its conclusions are derived from and bounded by the model’s assumptions.

4.1. Determining the Interference Range for Varied Structural Parameters

4.1.1. Theoretical Calculation of the Interference Range

(1)
Theoretical Interference Range for Bushings with Different Inner Diameters
The theoretical interference range was calculated for bushings with inner diameters of 40 mm, 42 mm, 46 mm, and 48 mm using Equations (4)–(8). The results are summarized in Table 8.
The results indicate that the allowable interference range shifts to slightly higher values for larger inner diameters (46 mm and 48 mm). This trend occurs because, for a constant wall thickness, a larger inner diameter reduces the radial stiffness of the bushing. Consequently, a marginally greater interference is required to generate the contact pressure necessary for load transfer while still ensuring that stresses remain within the material’s yield strength limit.
(2)
Theoretical Interference Range for Bushings with Different Wall Thicknesses
The theoretical interference range was calculated for bushings with wall thicknesses of 2 mm, 2.25 mm, 2.75 mm, and 3 mm, with the results summarized in Table 9.
The results indicate that increasing the bushing wall thickness increases its radial stiffness. This higher stiffness results in greater contact pressure under the same interference fit, thereby reducing the minimum required interference to achieve effective load transfer. At the same time, the higher stiffness allows the bushing to withstand larger interference before yielding, thus widening the allowable interference range. Consequently, the overall allowable interference range broadens with increasing wall thickness.
(3)
Theoretical Interference Range for Bushings with Different Widths
The theoretical interference range was calculated for bushings with widths of 32 mm, 33 mm, 35 mm, and 36 mm, and the results are presented in Table 10.
The results indicate that increasing the bushing width enlarges the load-bearing contact area. This expansion promotes a more uniform contact pressure distribution, which consequently reduces the minimum required contact pressure for effective load transfer. In contrast to inner diameter and wall thickness, the allowable interference range remains largely unaffected by changes in width, indicating that width has a comparatively minor influence on this parameter.

4.1.2. Interference Range Simulation for Different Bushing Inner Diameters

(1)
Simulation Analysis under Assembly Conditions
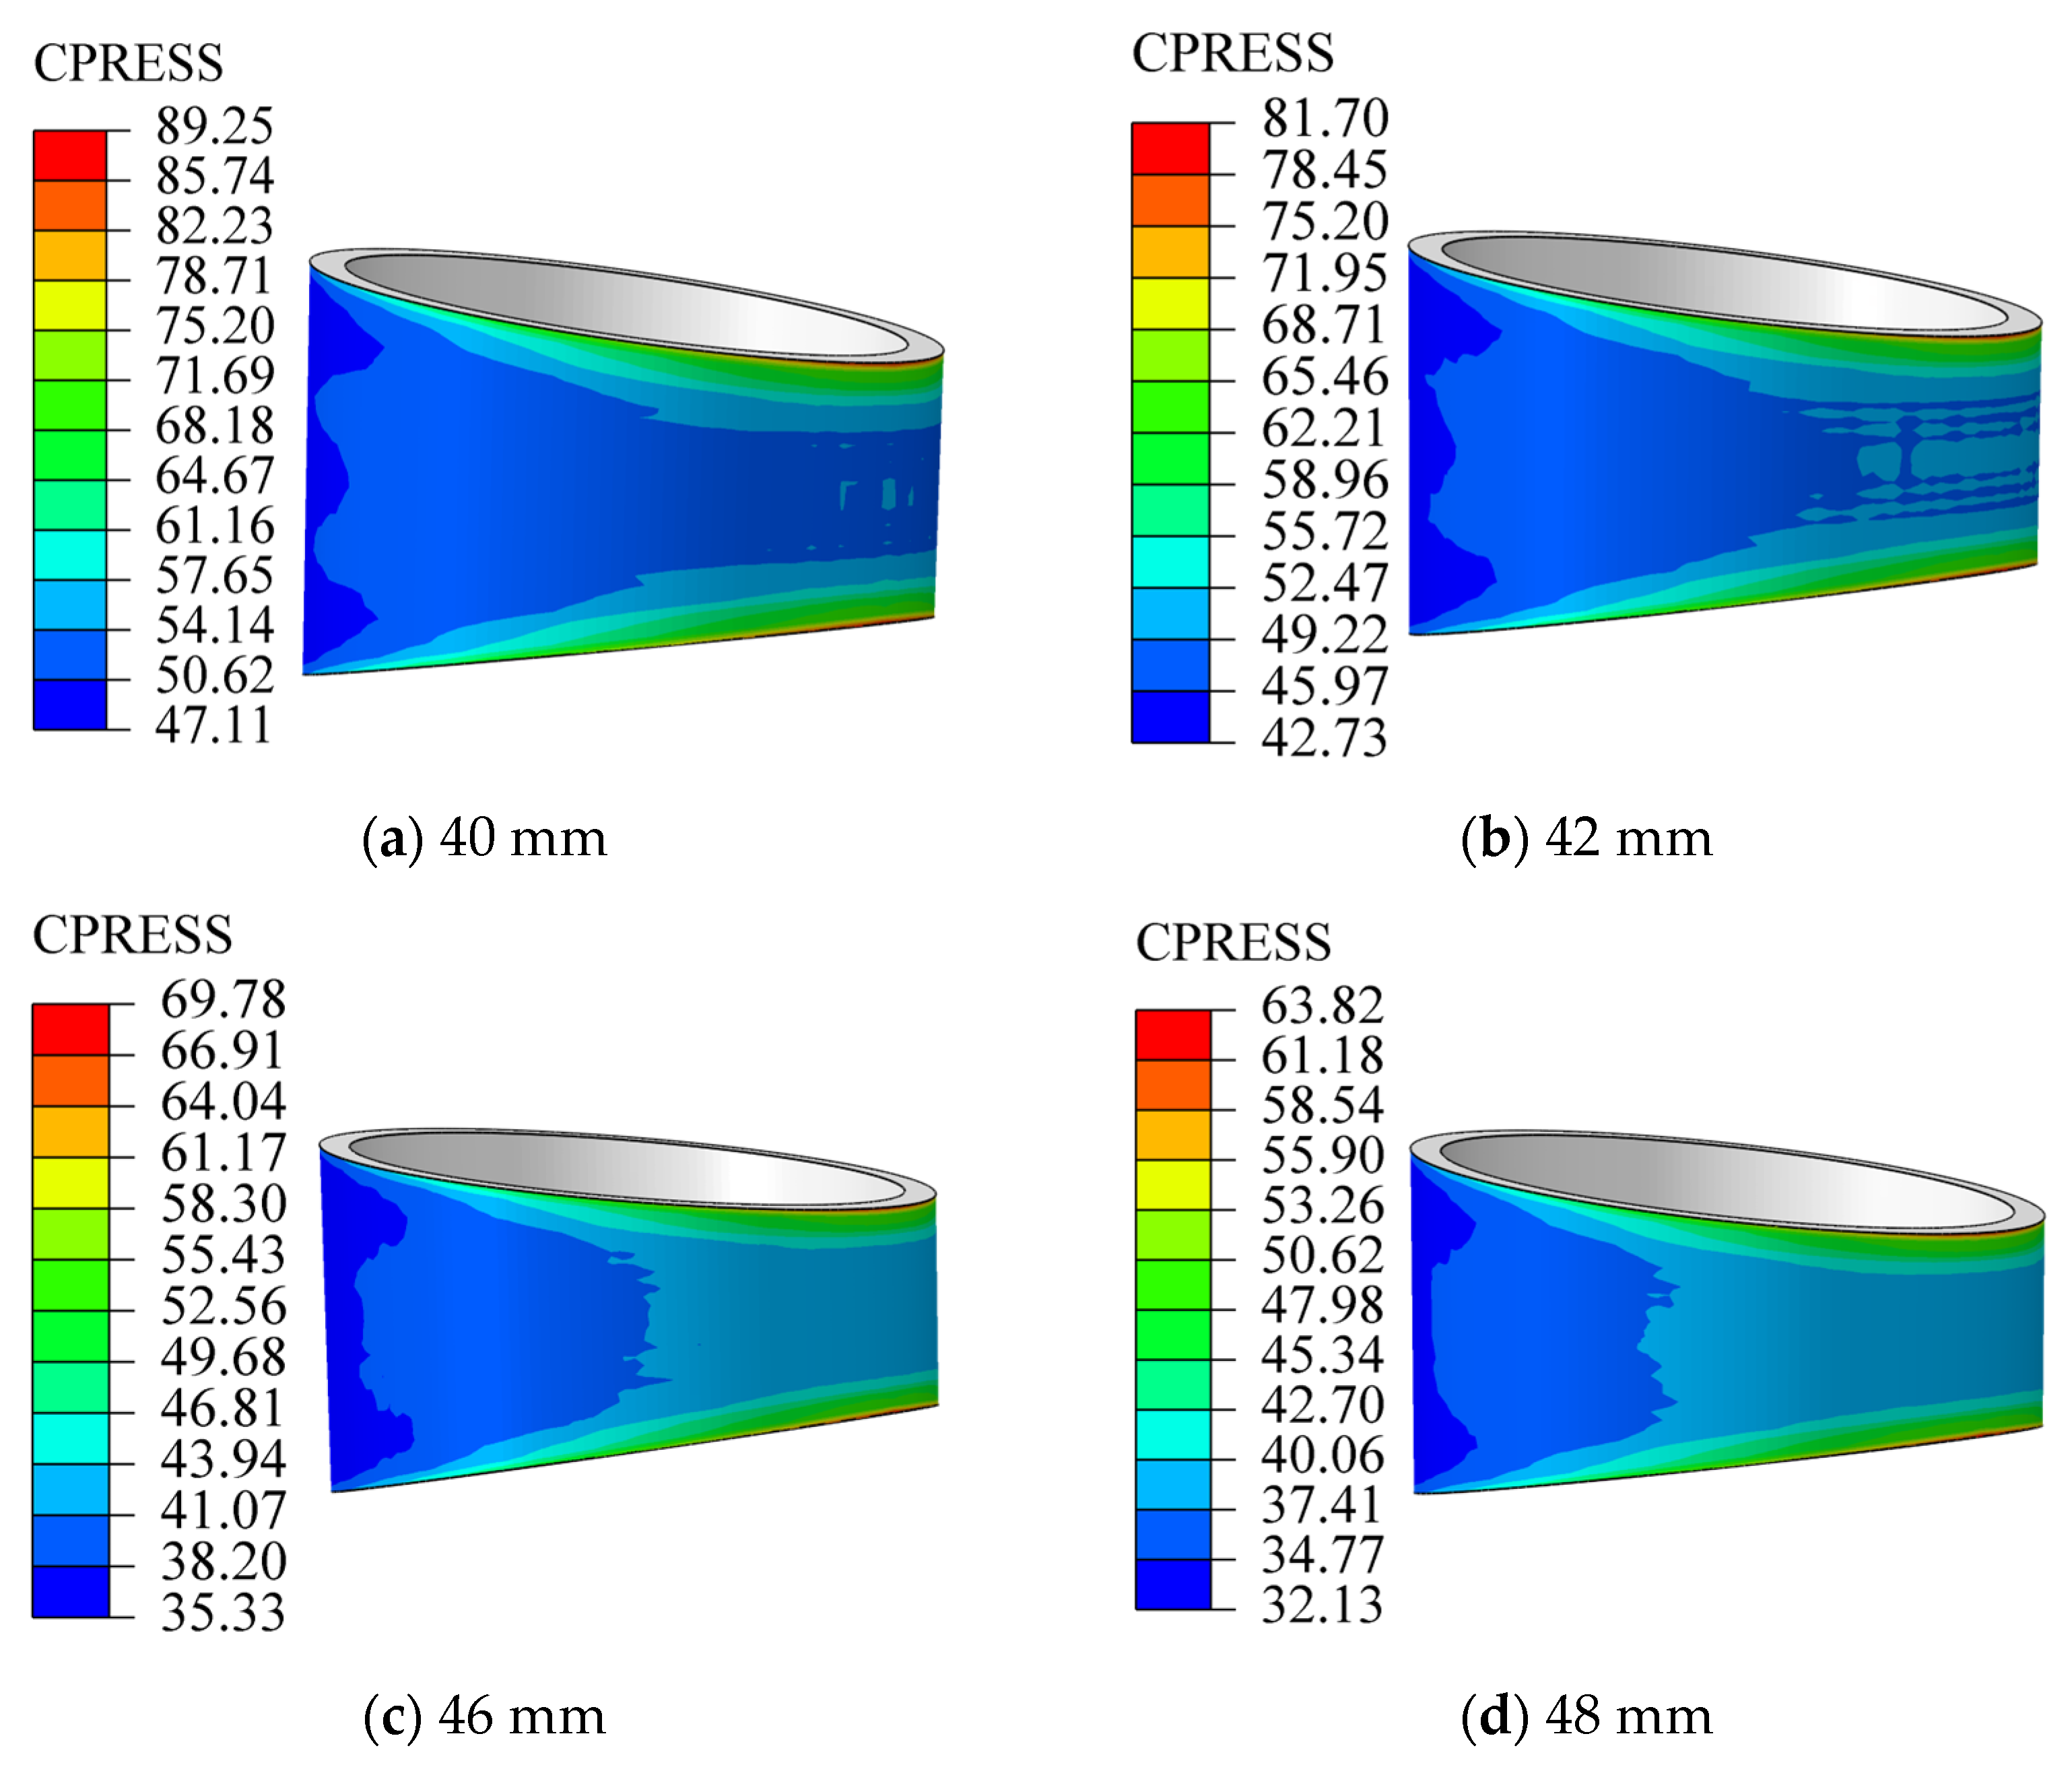
Simulations were performed for bushings with different inner diameters across their respective theoretical interference ranges. The reliability of each configuration was evaluated based on the simulated VMS, outer-surface contact pressure, and EPS. Representative results for an interference of 0.09 mm are presented in Figure 15 and Figure 16.
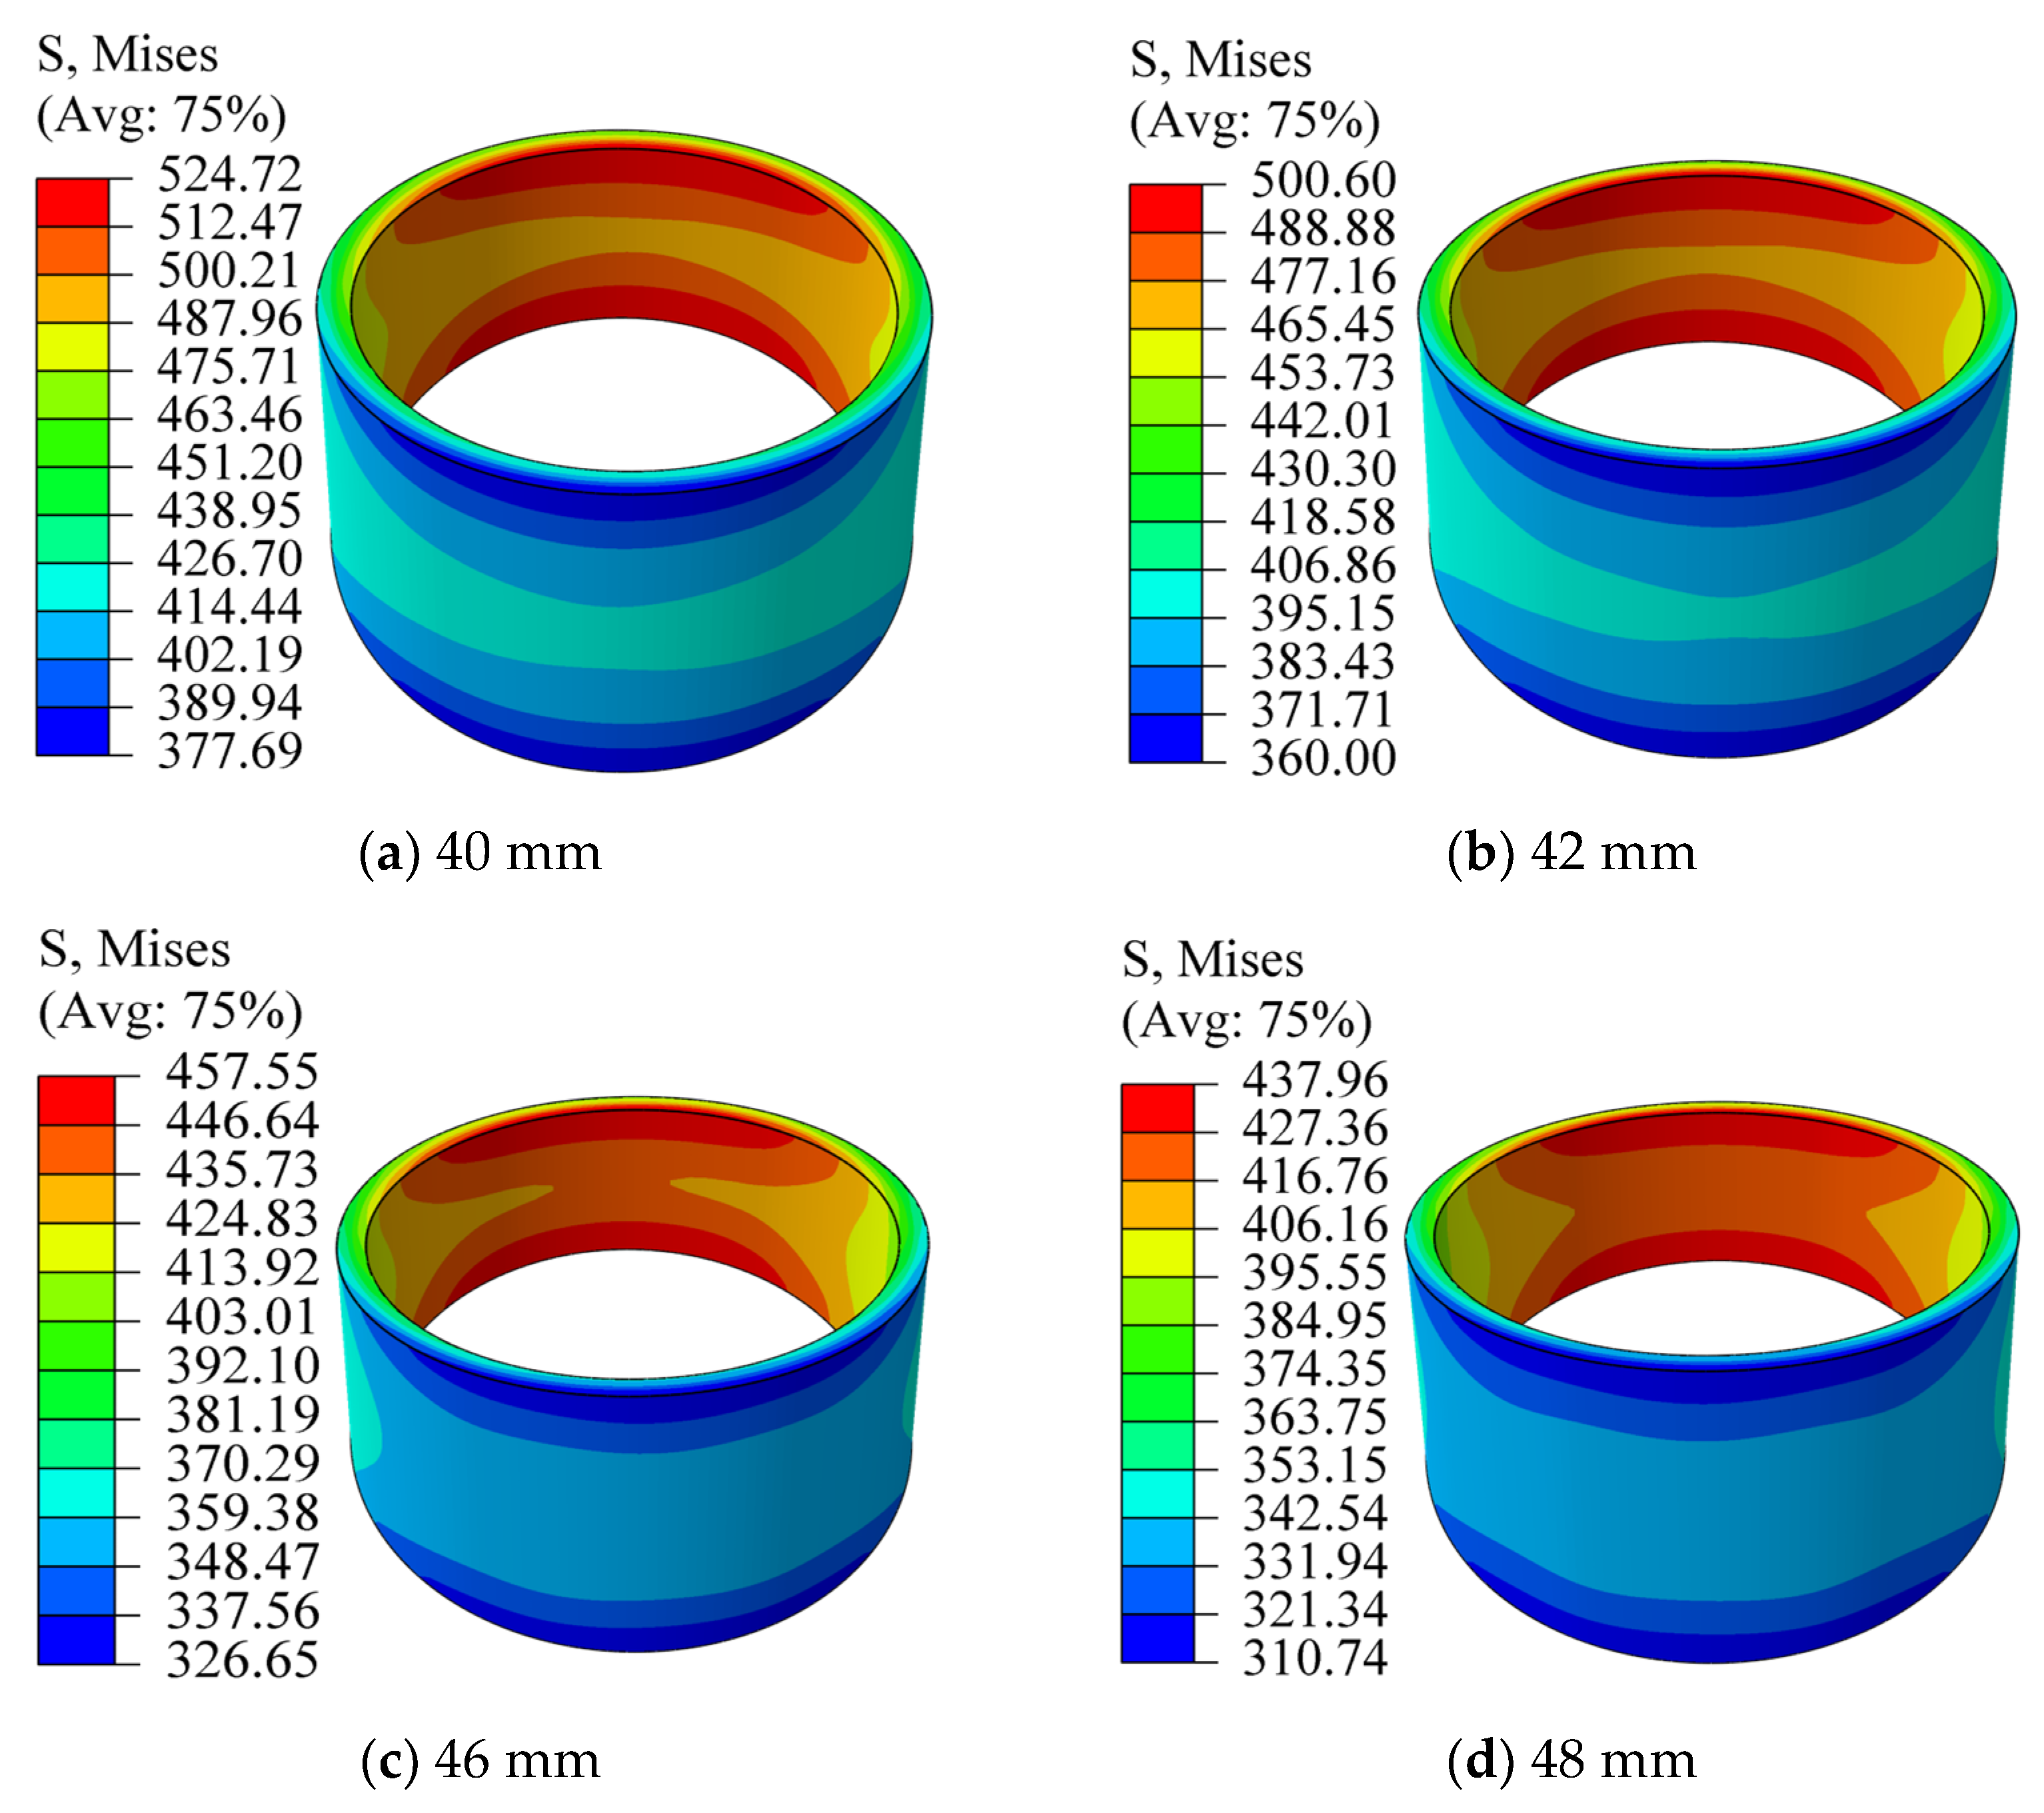
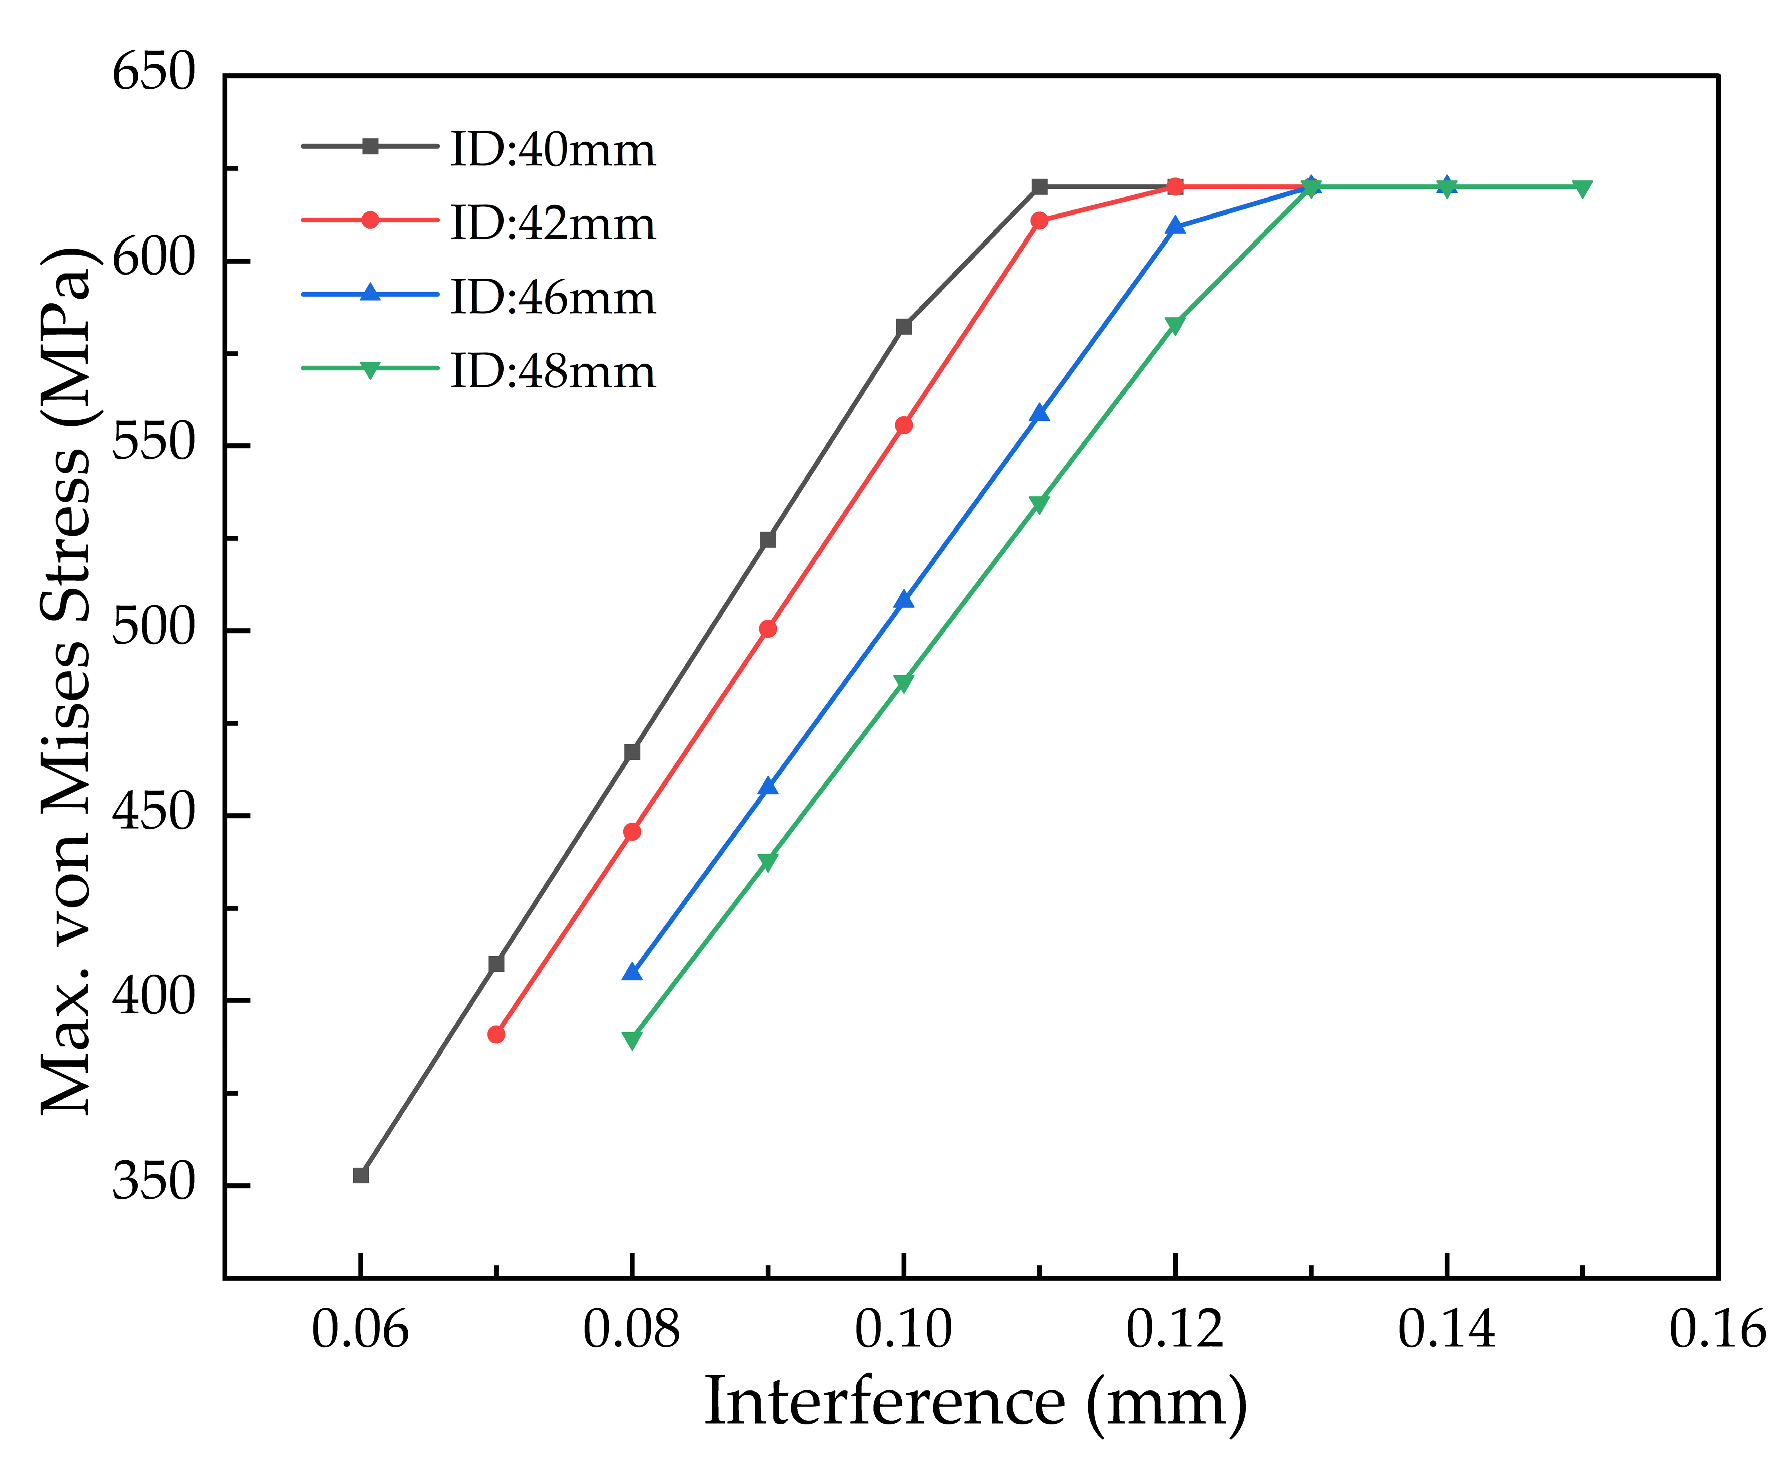
Figure 15 indicates that, for all inner diameters studied, the maximum VMS is localized on the inner surface of the bushing—specifically at the upper and lower edges of its smaller trapezoidal cross-section. As the inner diameter increases, the maximum stress exhibits a decreasing trend, with an approximate reduction of 20 MPa per diameter increment.
Figure 16 shows that the maximum contact pressure on the outer surface also occurs at the upper and lower edges of the smaller trapezoidal section, a typical pressure-concentration feature at the edge of an interference-fit interface. With increasing inner diameter, the outer-surface contact pressure decreases progressively, by roughly 8 MPa per step.
Analysis of Figure 17 confirms that the maximum VMS decreases linearly with increasing inner diameter, at a rate of approximately 20 MPa per step. More critically, the onset of plastic strain defines the upper interference limit for each diameter: yielding begins at 0.11 mm (40 mm ID), 0.12 mm (42 mm ID), and 0.13 mm (for both 46 mm and 48 mm ID). These interference levels and all greater values must be excluded to prevent permanent deformation.
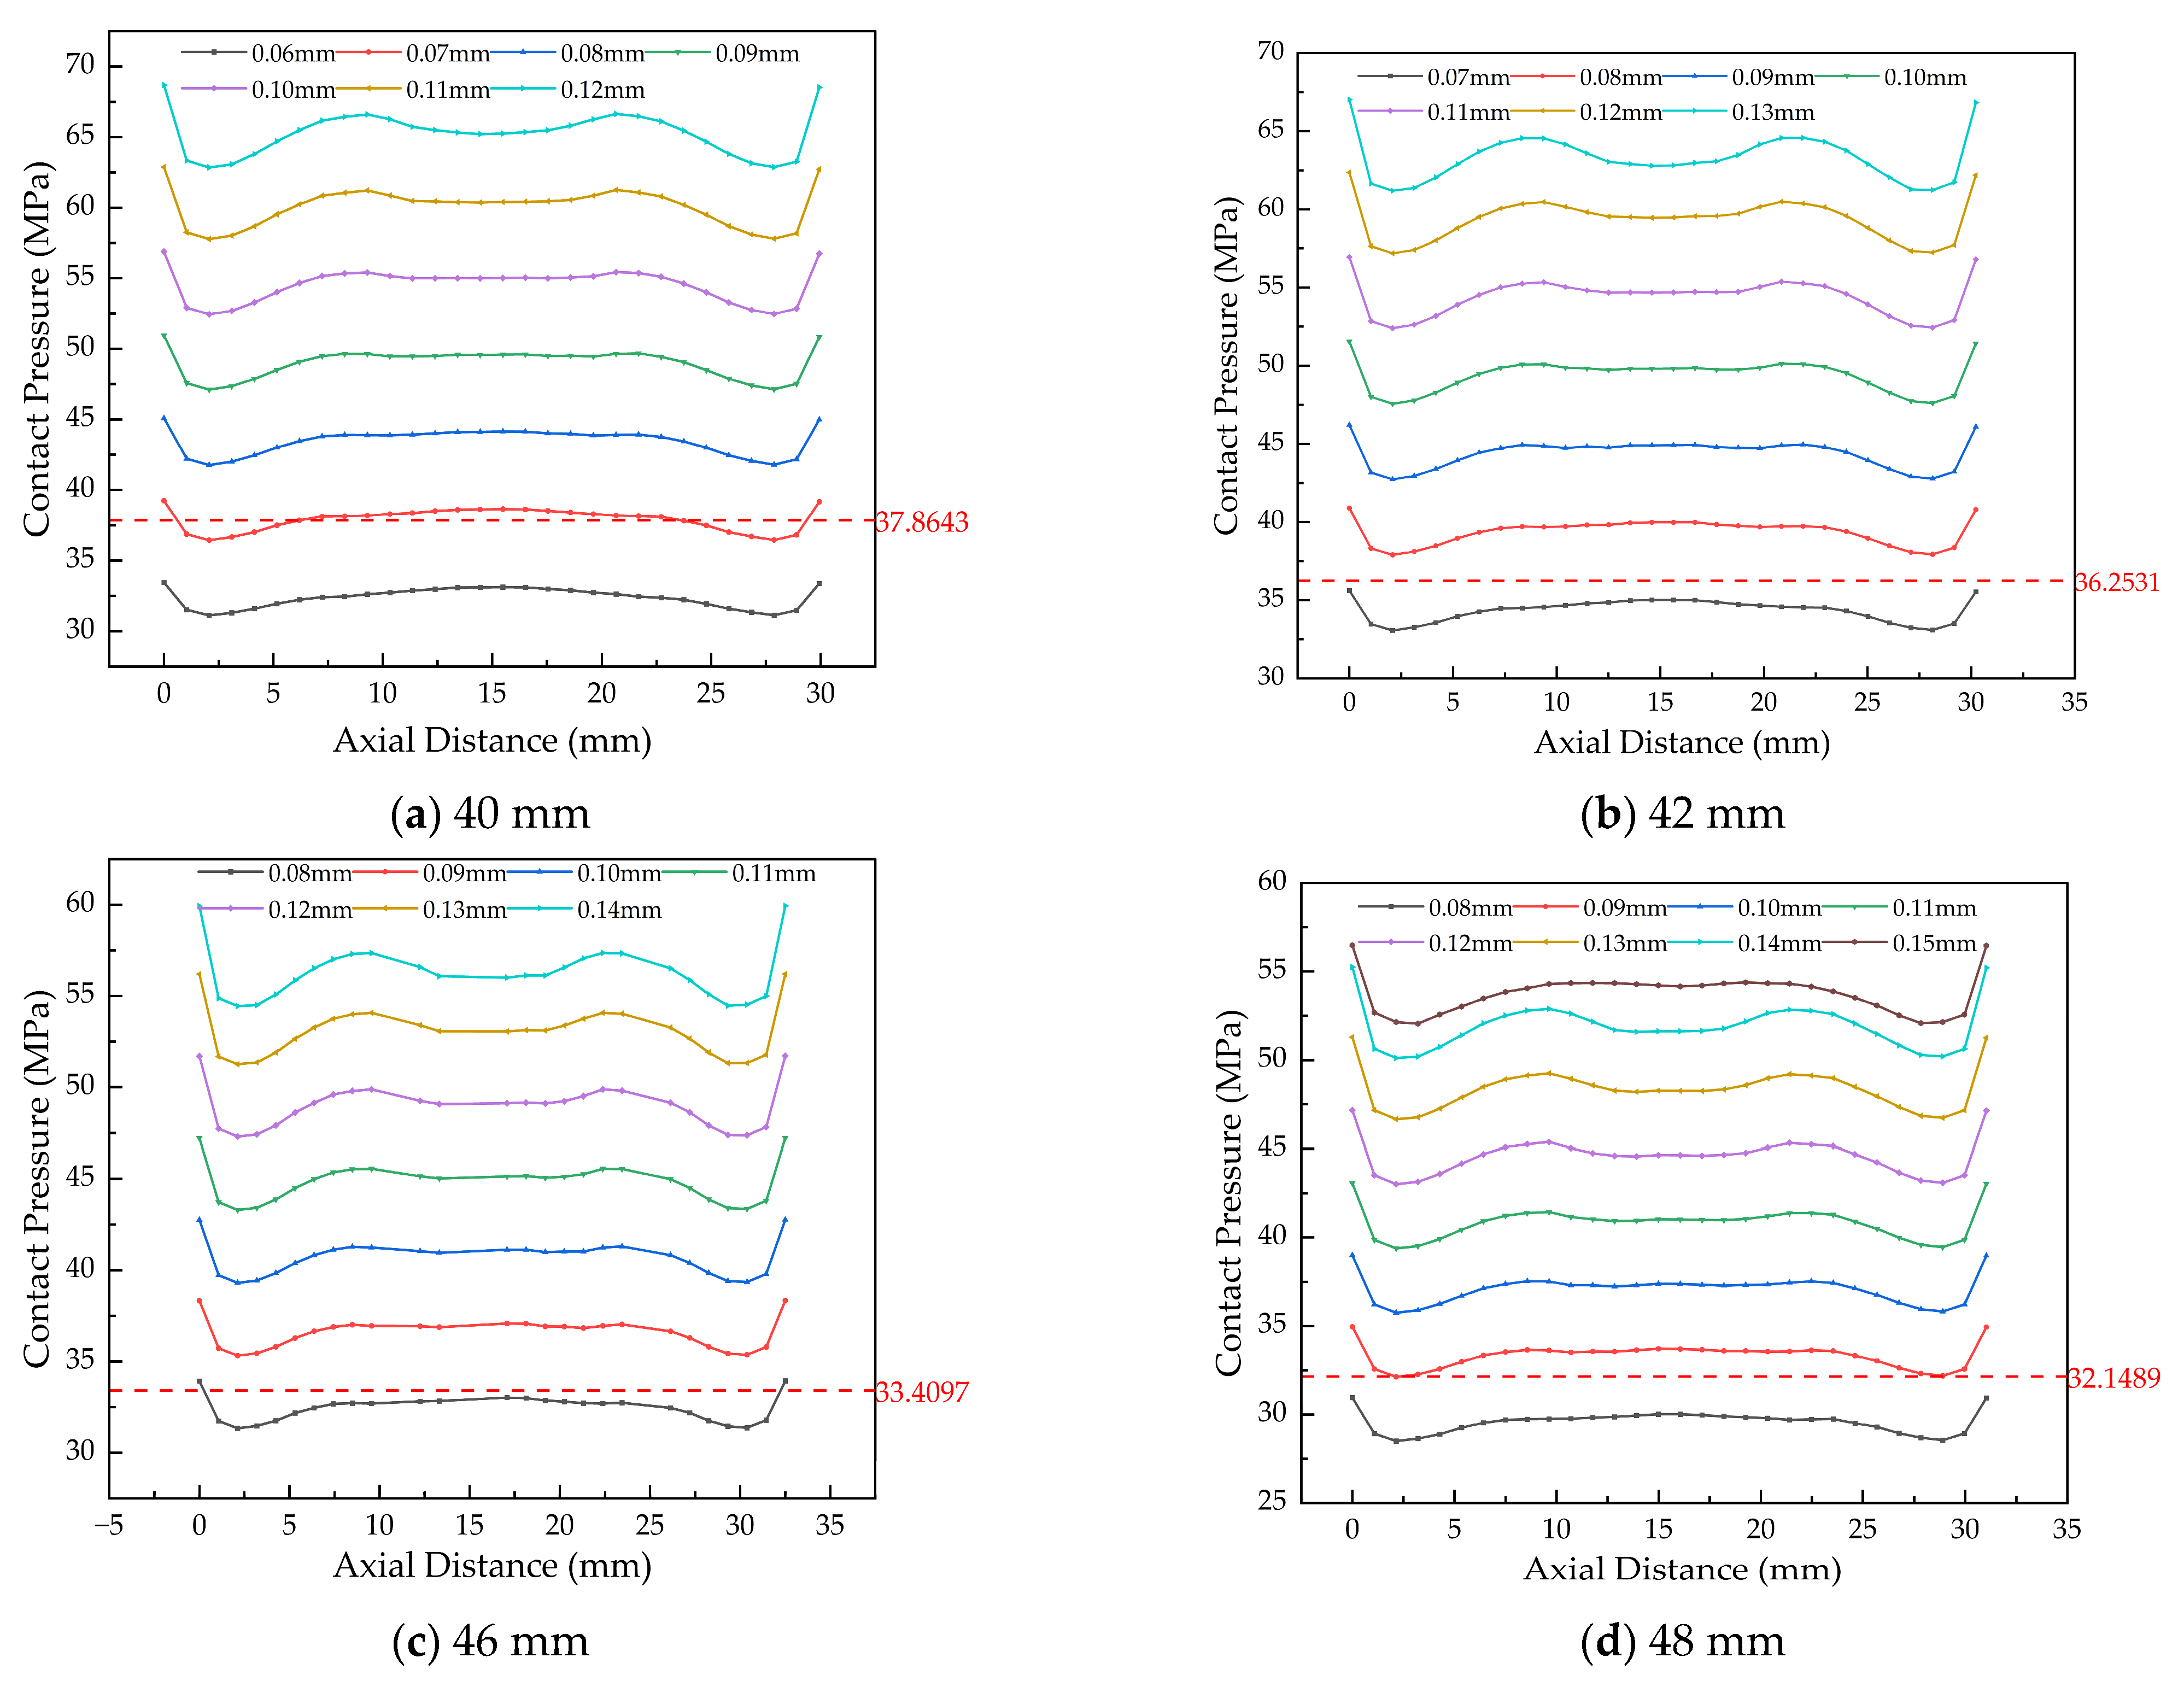
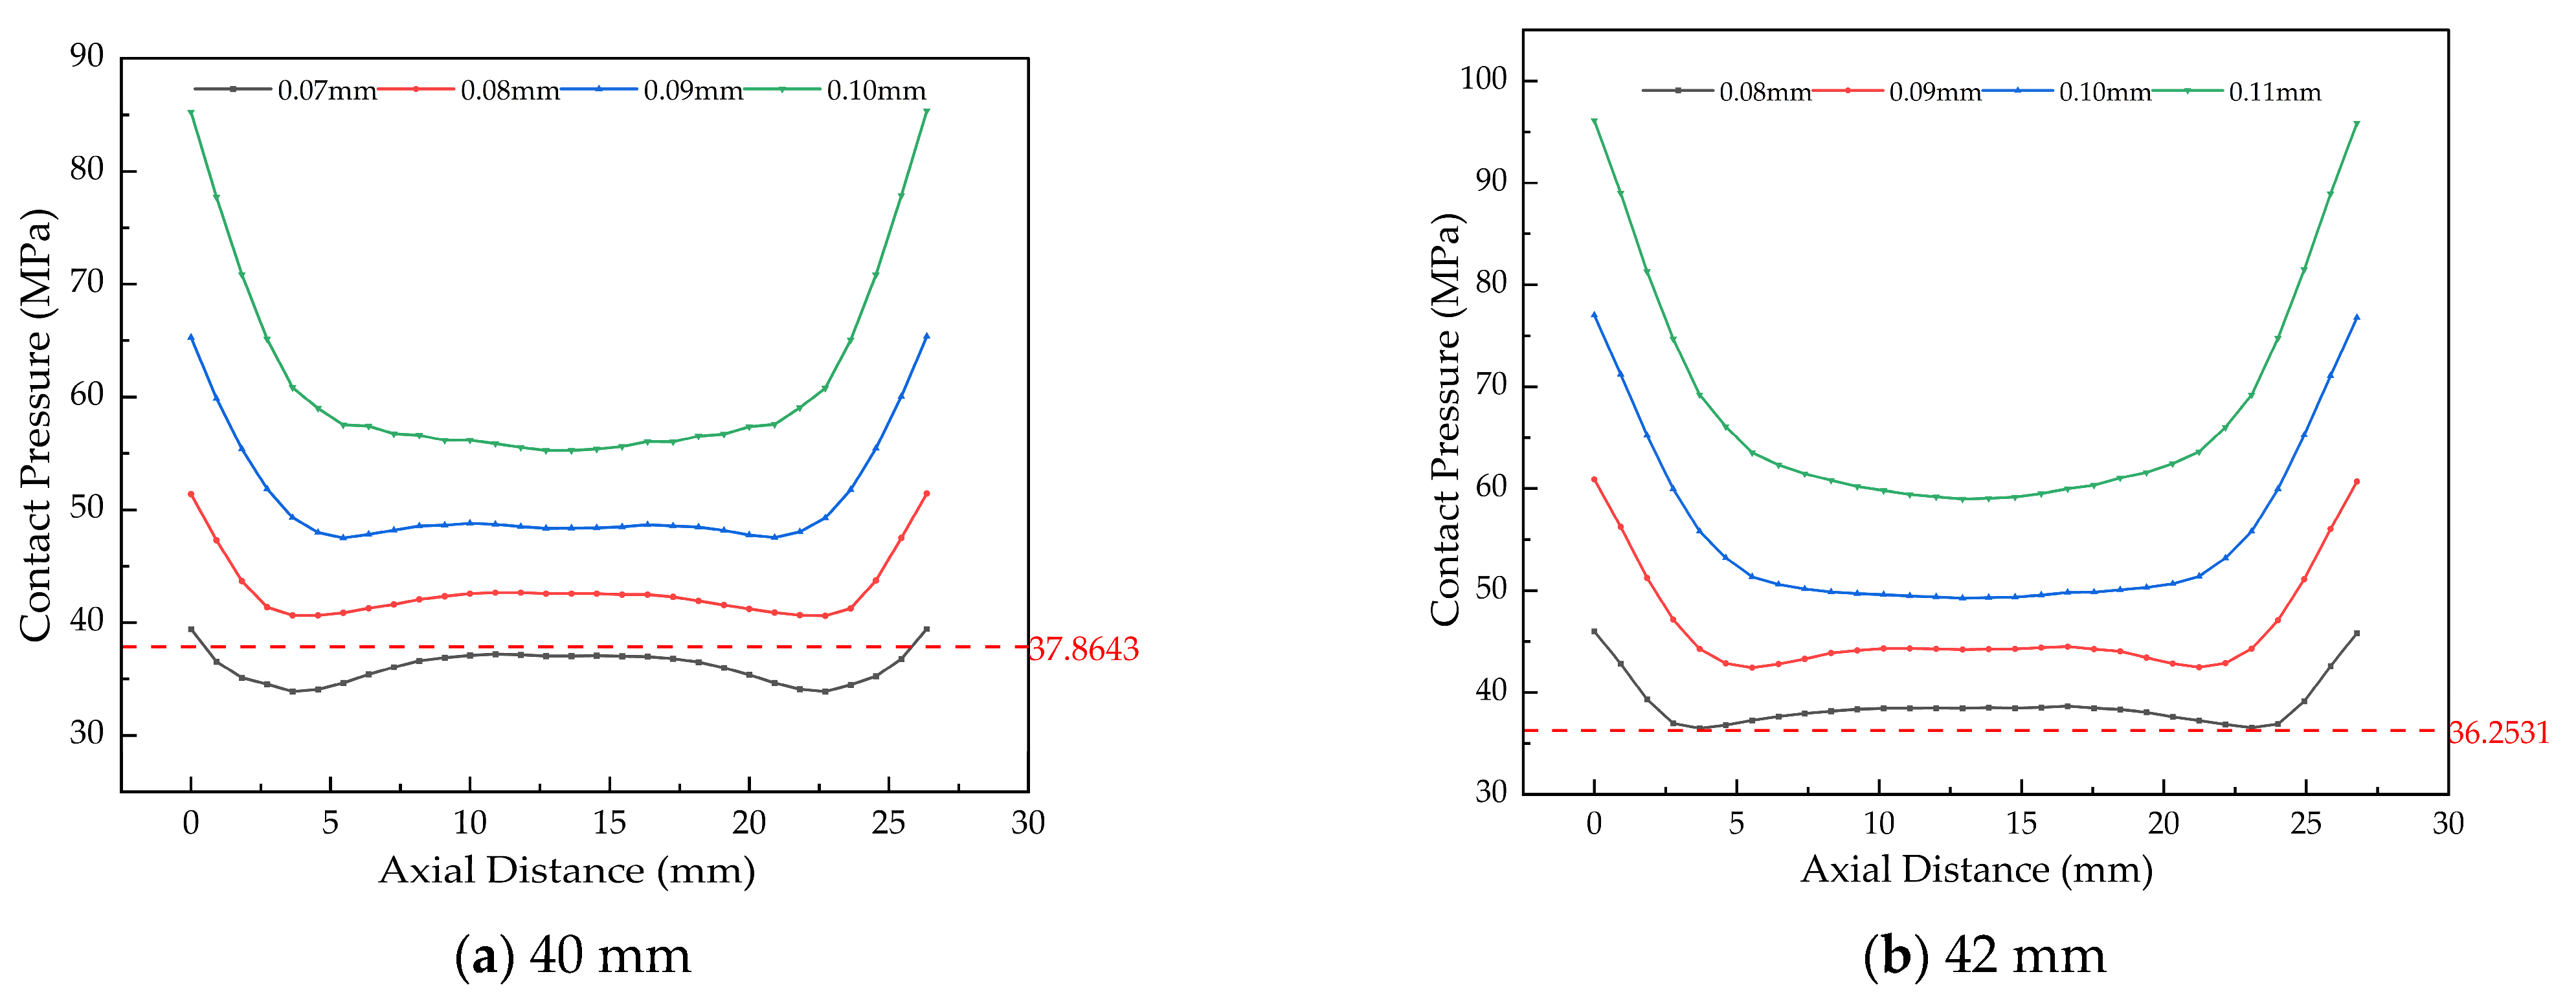
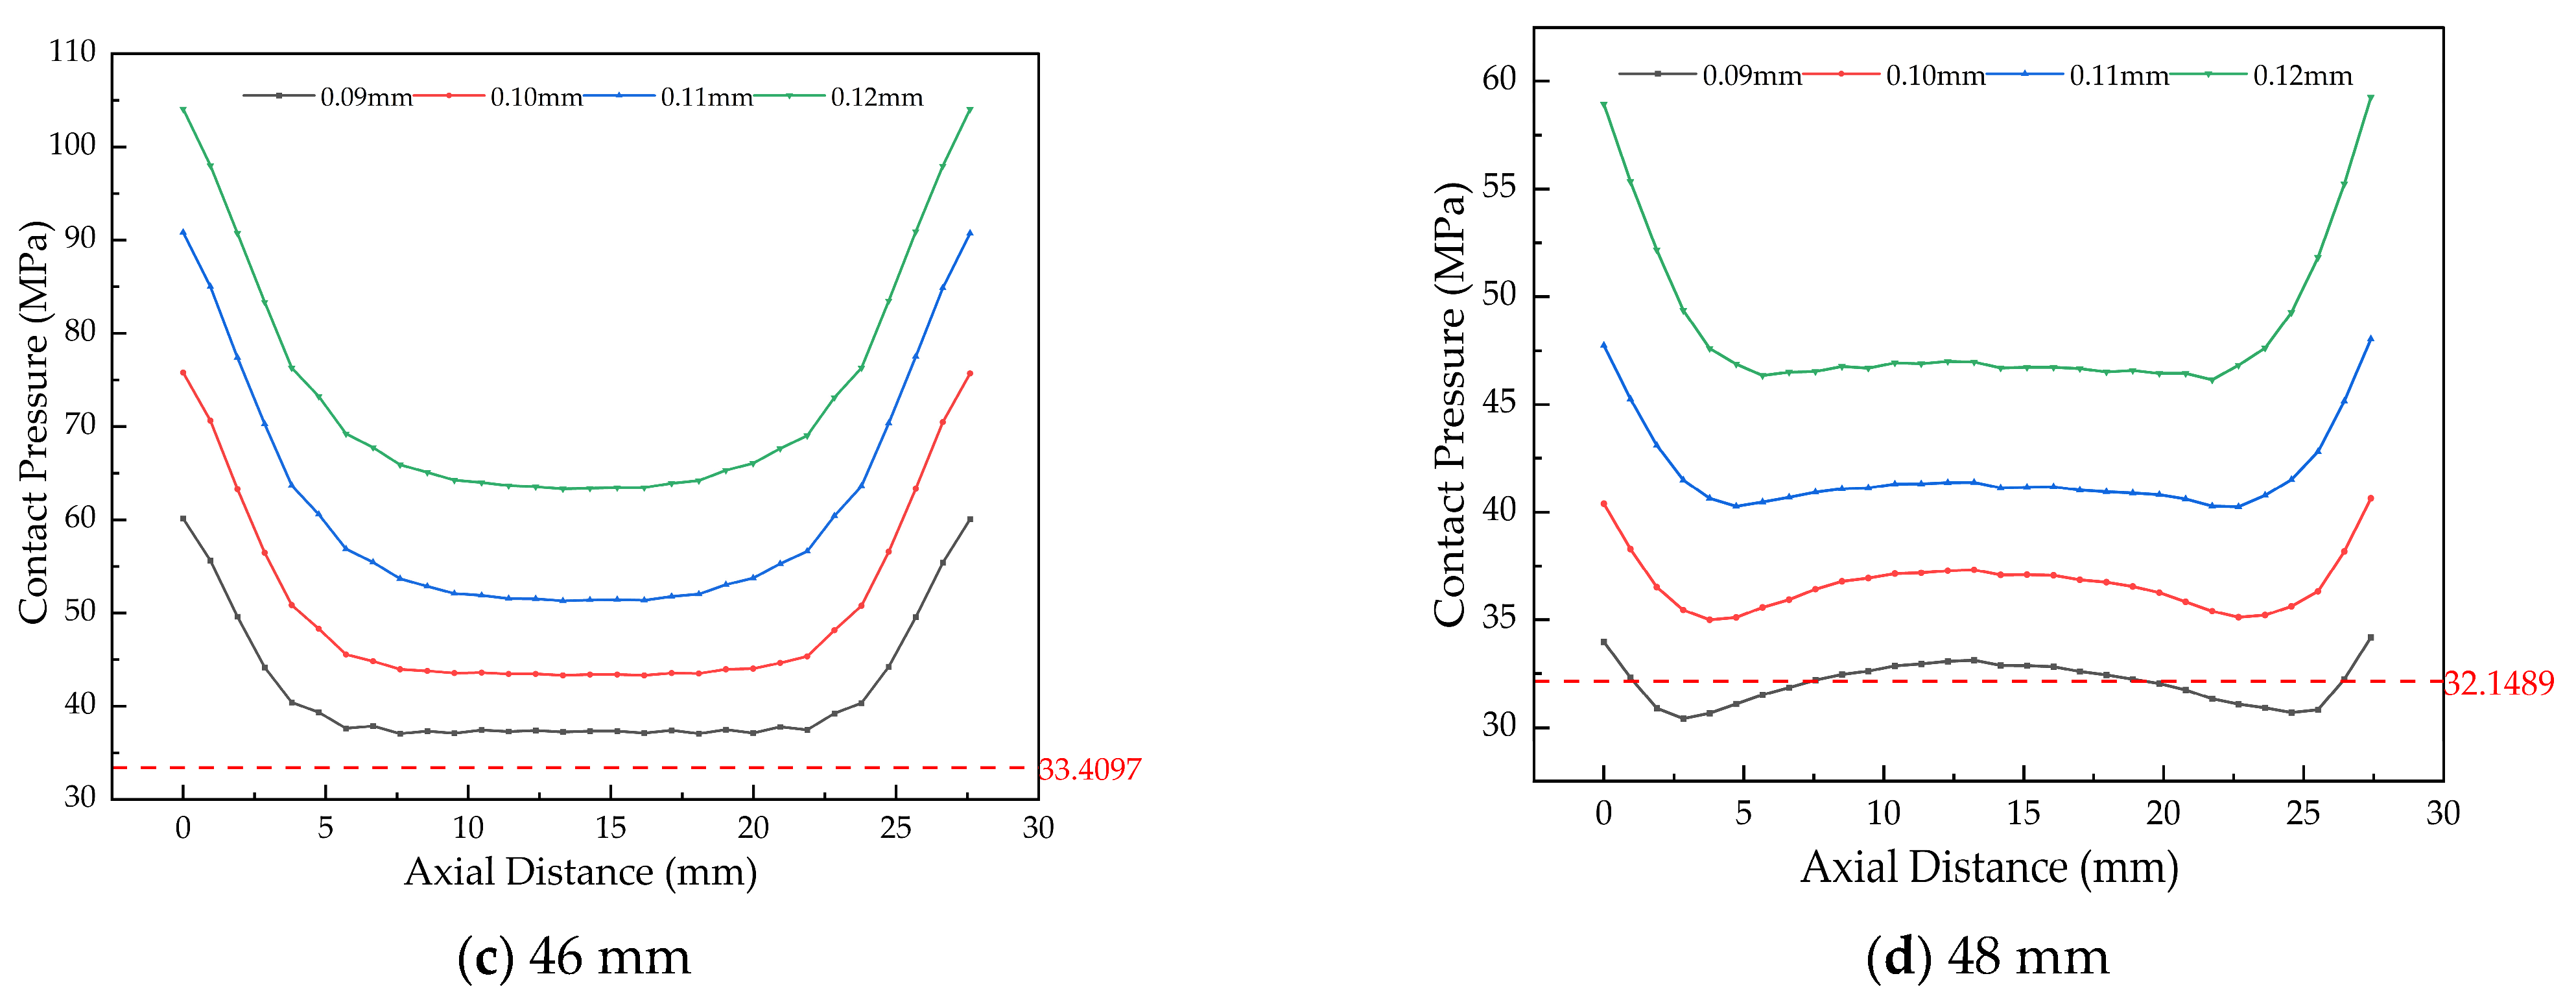
Figure 18a shows that for a 40 mm inner diameter, the minimum contact pressures at 0.06 mm and 0.07 mm interference (31.13 MPa and 36.44 MPa) are below the required 37.86 MPa. However, at 0.07 mm, the area experiencing sub-threshold pressure is negligible; therefore, this interference level is retained. For inner diameters of 42 mm and 46 mm (Figure 18b,c), the minimum pressures at 0.07 mm and 0.08 mm interference fall below their respective required minima (36.25 MPa and 33.41 MPa). Consequently, these interference values are discarded. Similarly, for a 48 mm inner diameter (Figure 18d), the minimum pressures at 0.08 mm and 0.09 mm interference (28.50 MPa and 32.13 MPa) are both below the required 32.15 MPa. Following the rationale applied to the 40 mm case, the 0.08 mm interference is excluded.
In summary, FEA simulation under assembly conditions establishes the allowable interference ranges for bushings of different inner diameters, as summarized in Table 11. These ranges ensure safe and reliable bushing operation.
(2)
Simulation Analysis under Combustion Pressure Conditions
A mechanical load of 182 kN was applied to bushings with different inner diameters. Based on the interference ranges established in the previous section, further simulation analysis was conducted, with the results presented in Figure 19 and Figure 20.
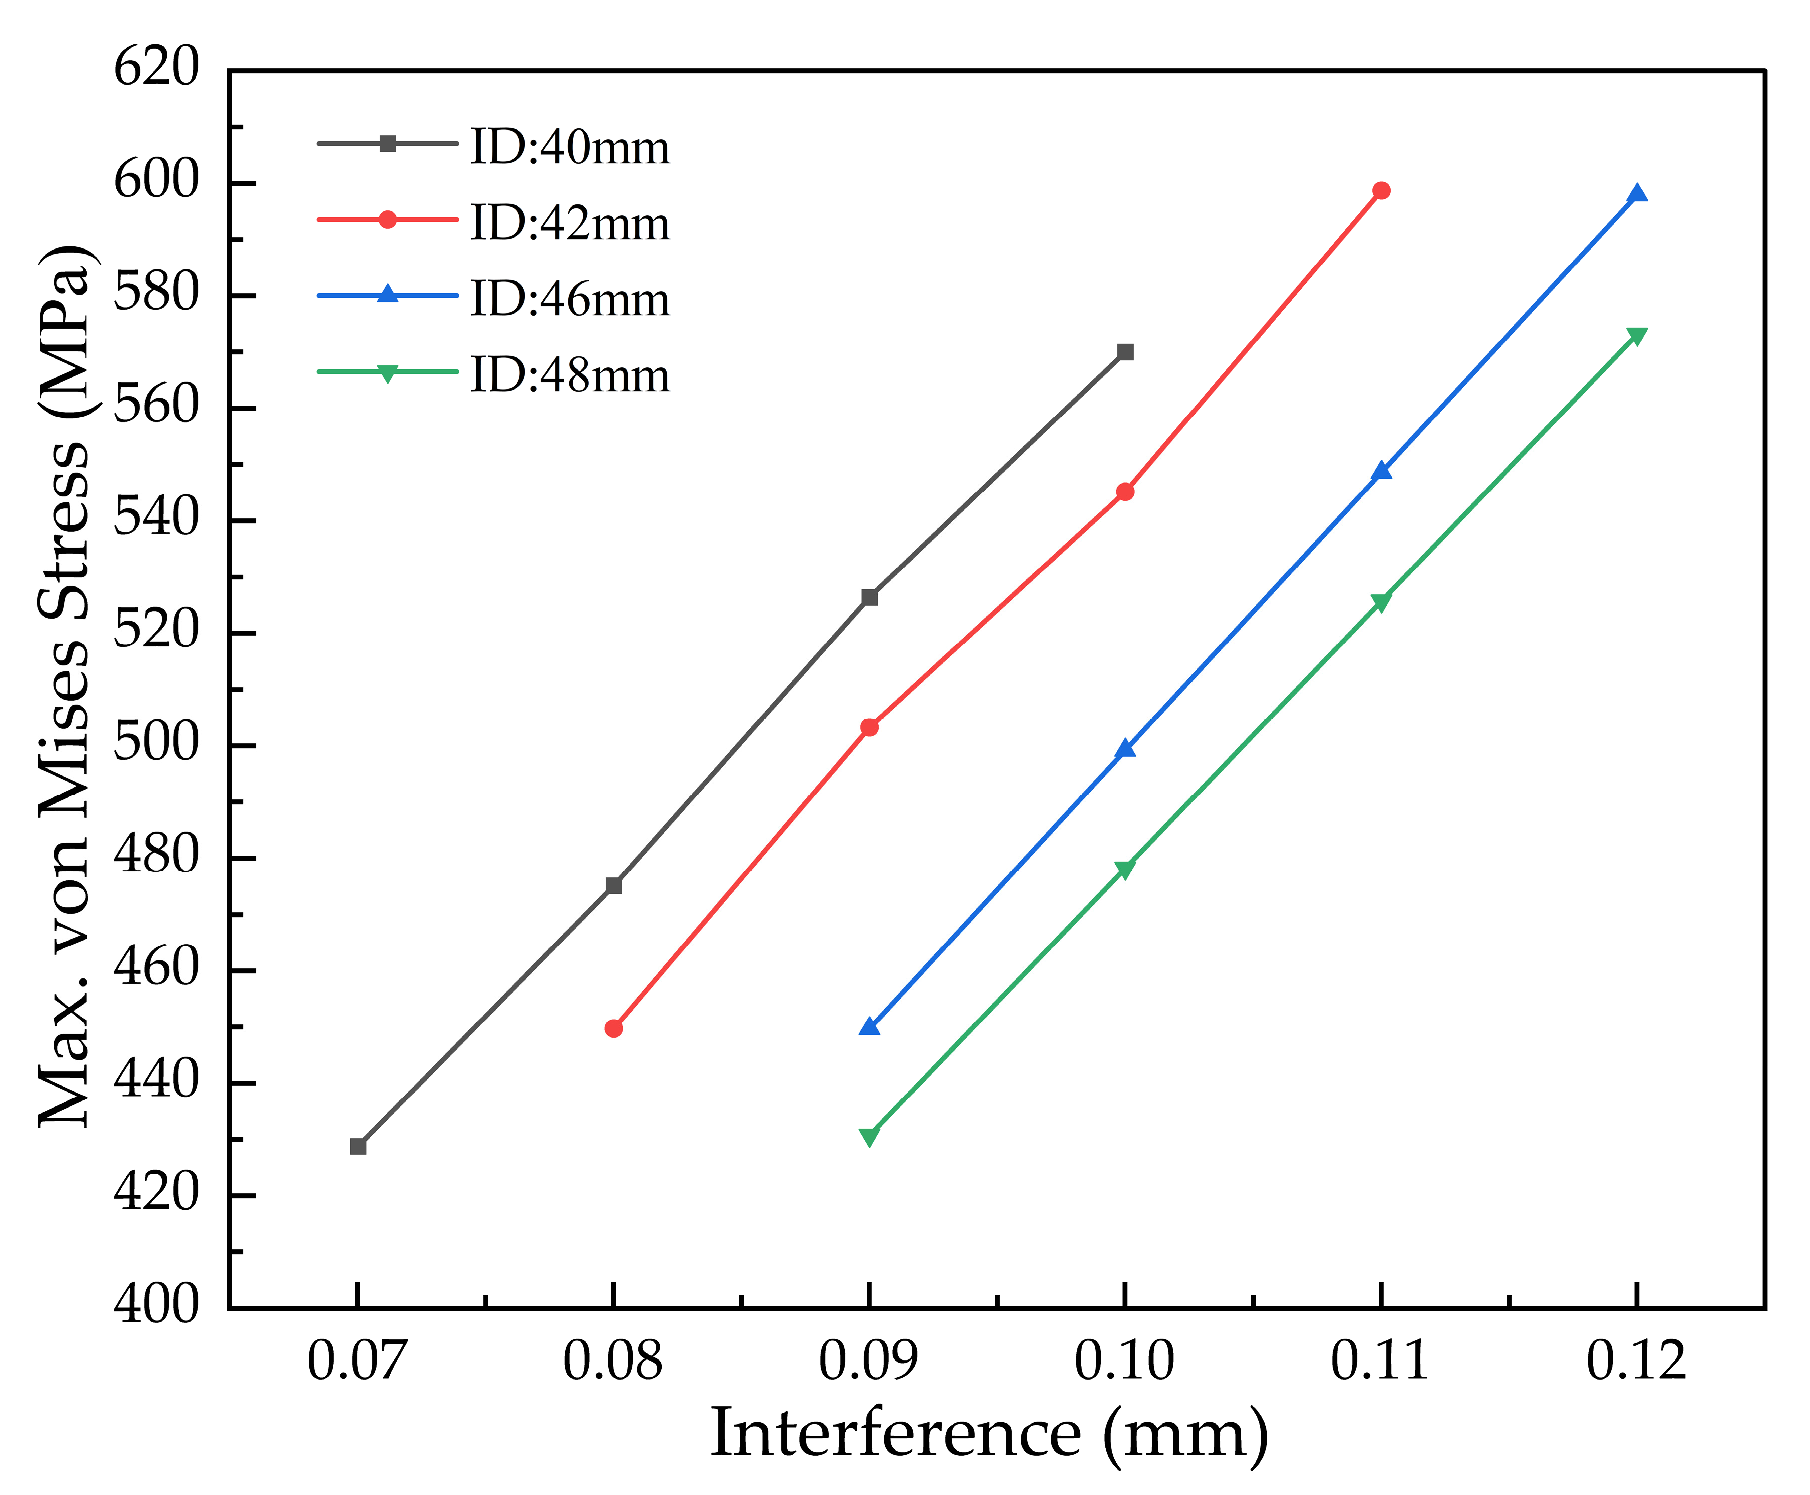
As shown in Figure 19, the maximum VMS under the 182 kN load remained within the material’s yield strength (620 MPa) across all cases. This confirms that the applied mechanical load did not induce plastic deformation, and the stress trend with increasing inner diameter remained consistent with the assembly condition.
Analysis of contact pressure (Figure 20) shows that for specific interferences—0.07 mm (40 mm ID), 0.08 mm (42 mm ID), and 0.09 mm (48 mm ID)—the minimum pressures (33.90 MPa, 36.49 MPa, and 30.41 MPa, respectively) were below their theoretical minima. However, in each case, the area experiencing this sub-critical pressure was sufficiently limited; therefore, these interference levels were retained as acceptable.
In conclusion, the allowable interference ranges for different bushing inner diameters, validated through simulation under combustion pressure, are established in Table 11. These ranges are confirmed to prevent loosening failure, providing comprehensive verification for both assembly and operational reliability.

4.1.3. Simulation of Interference Ranges for Bushings with Different Wall Thicknesses

Simulation results indicated that applying the operational mechanical load had a negligible effect on the allowable interference range determined under assembly conditions. Therefore, the subsequent analysis of wall thickness effects and all associated data presented are based solely on simulations performed under the assembly condition.
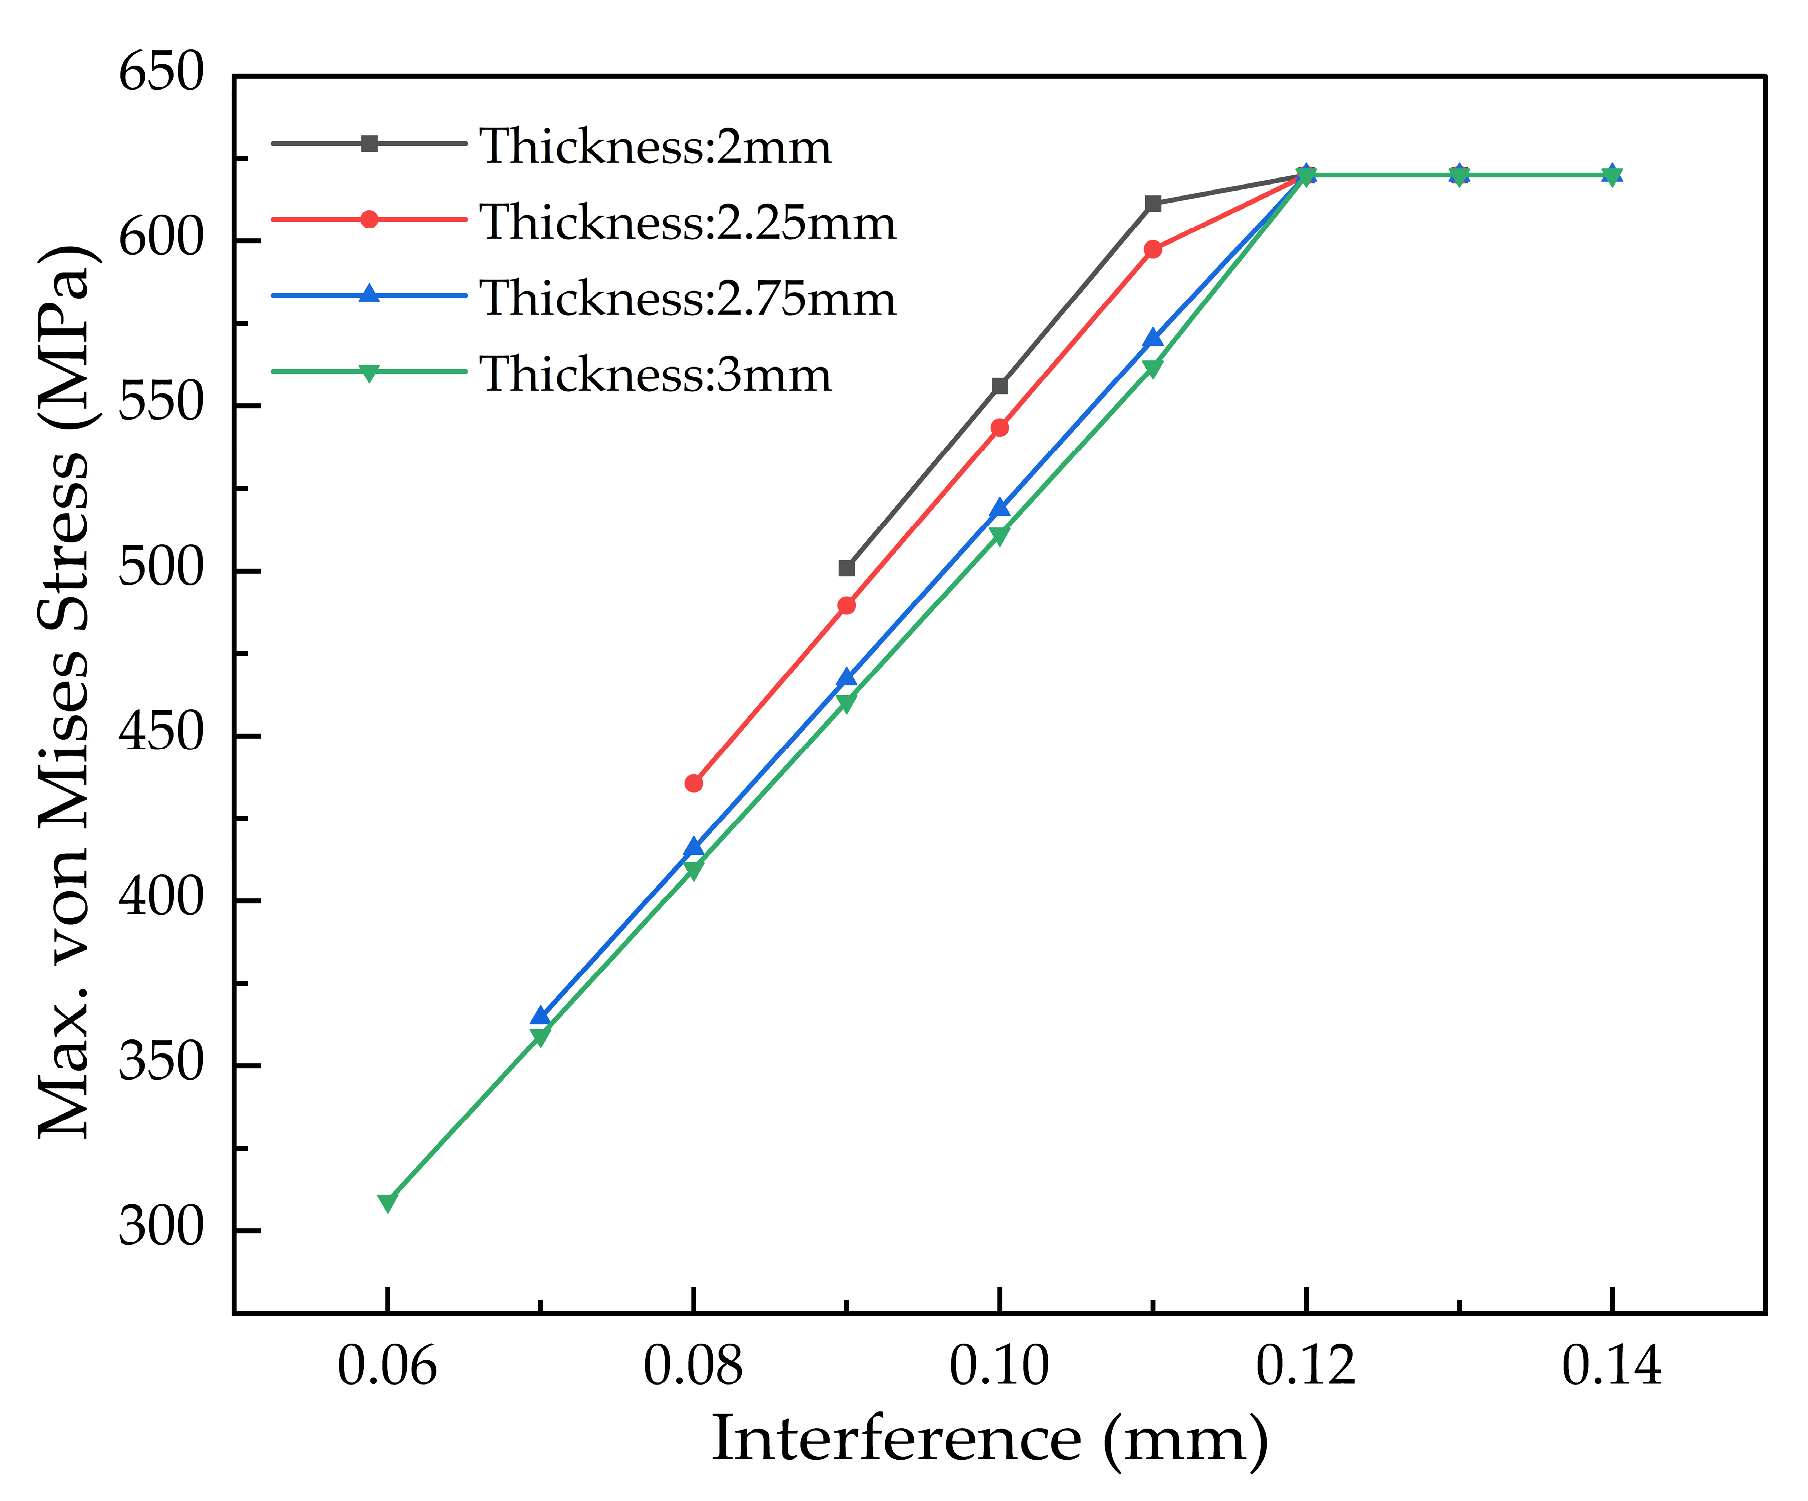
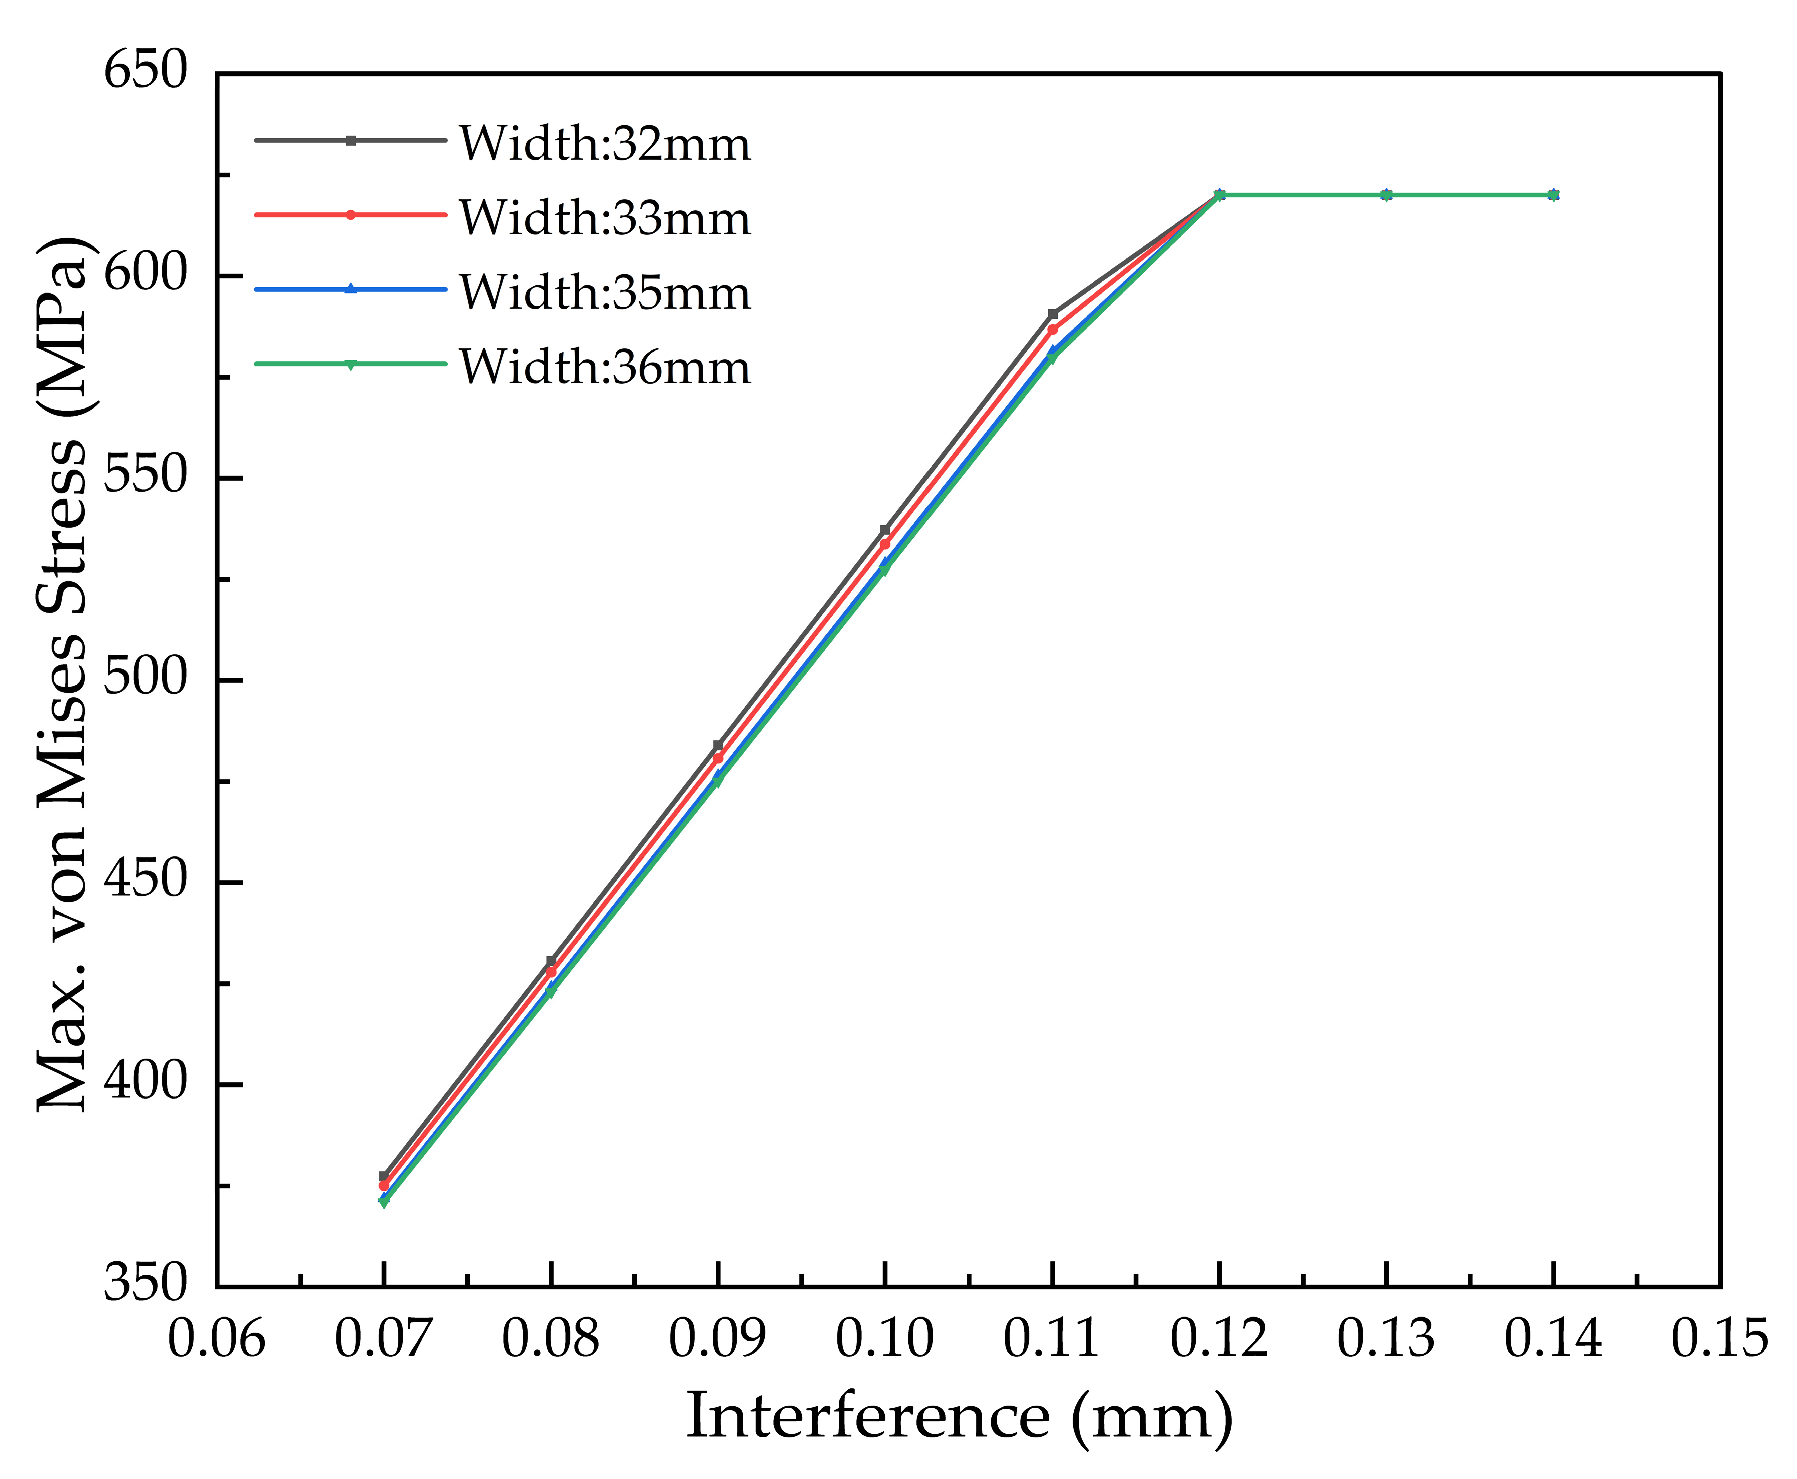
As shown in Figure 21, for bushing wall thicknesses of 2 mm, 2.25 mm, 2.75 mm, and 3 mm, the maximum VMS decreases linearly with increasing wall thickness under the same interference level, at a rate of approximately 10 MPa per mm increment. Notably, yielding initiates at an interference of 0.12 mm. Therefore, this interference level and all higher values must be excluded to avoid plastic deformation.
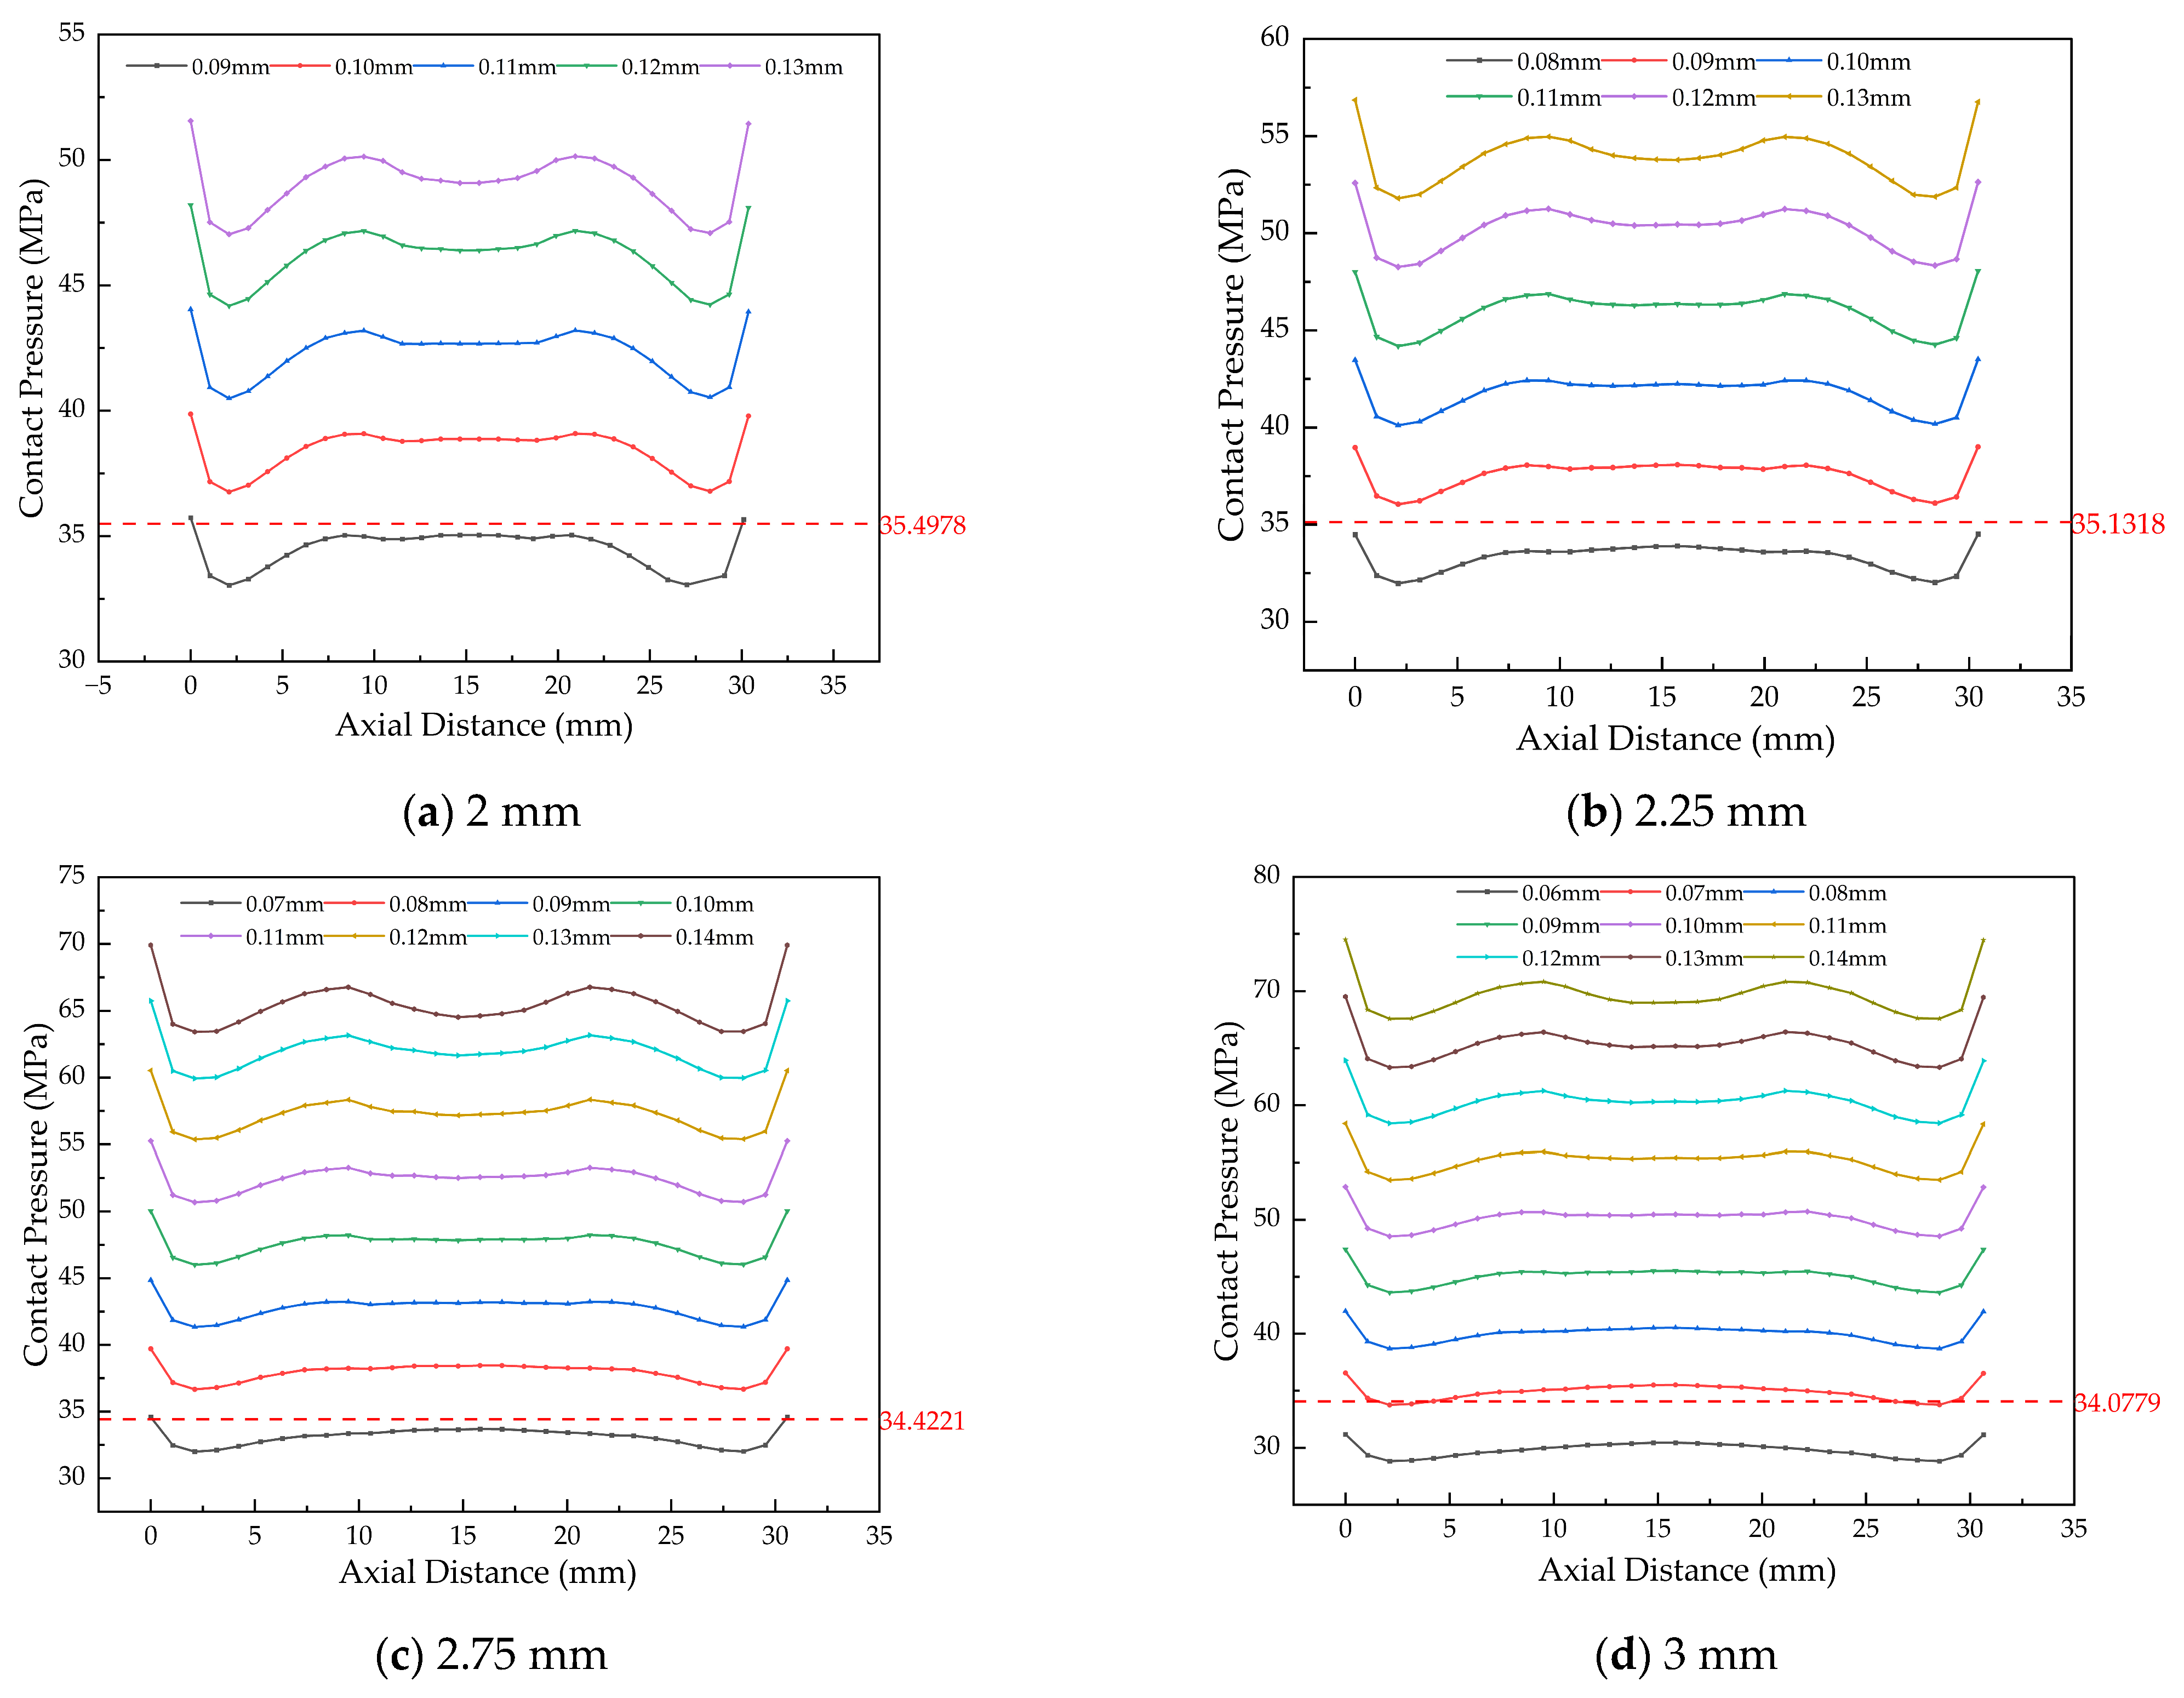
Figure 22 shows that the minimum contact pressure at the lower bound of the interference range varies with wall thickness. For thicknesses of 2 mm, 2.25 mm, 2.75 mm, and 3 mm, the minimum pressures at interferences of 0.09 mm, 0.08 mm, 0.07 mm, and 0.06 mm are 33.04 MPa, 31.98 MPa, 32.00 MPa, and 28.82 MPa, respectively. All these values fall below their corresponding theoretical minimum required contact pressures (35.50 MPa, 35.13 MPa, 34.42 MPa, and 34.08 MPa). Consequently, these specific interference levels are deemed unacceptable and are excluded from the allowable range.
In summary, the optimal interference ranges for bushings of different wall thicknesses, established through simulation under both assembly and operational conditions, are summarized in Table 11 and are applicable to both load cases.

4.1.4. Simulation of Interference Ranges for Bushings with Different Widths

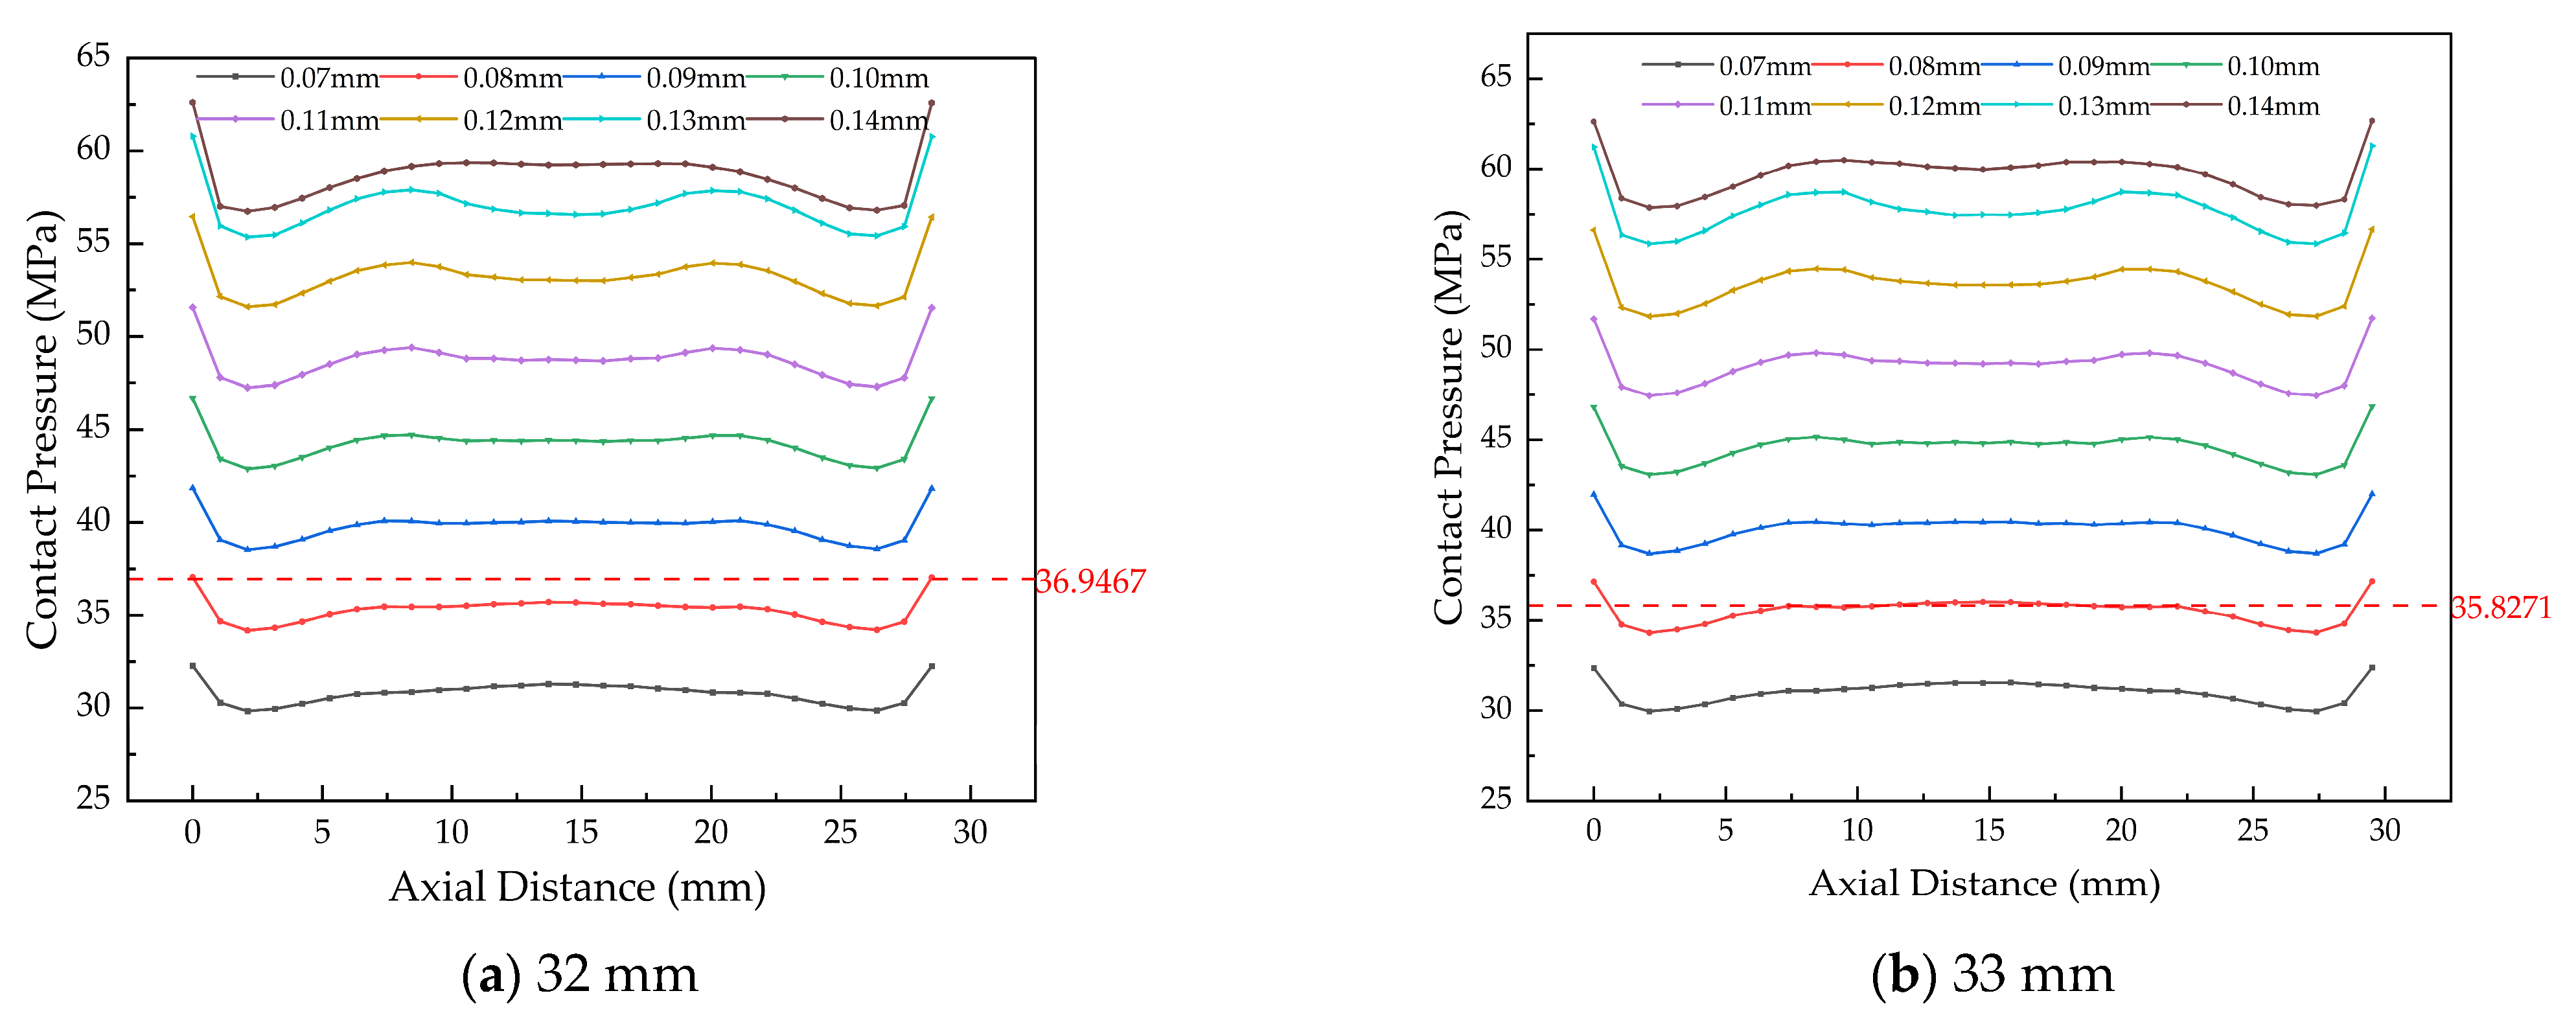
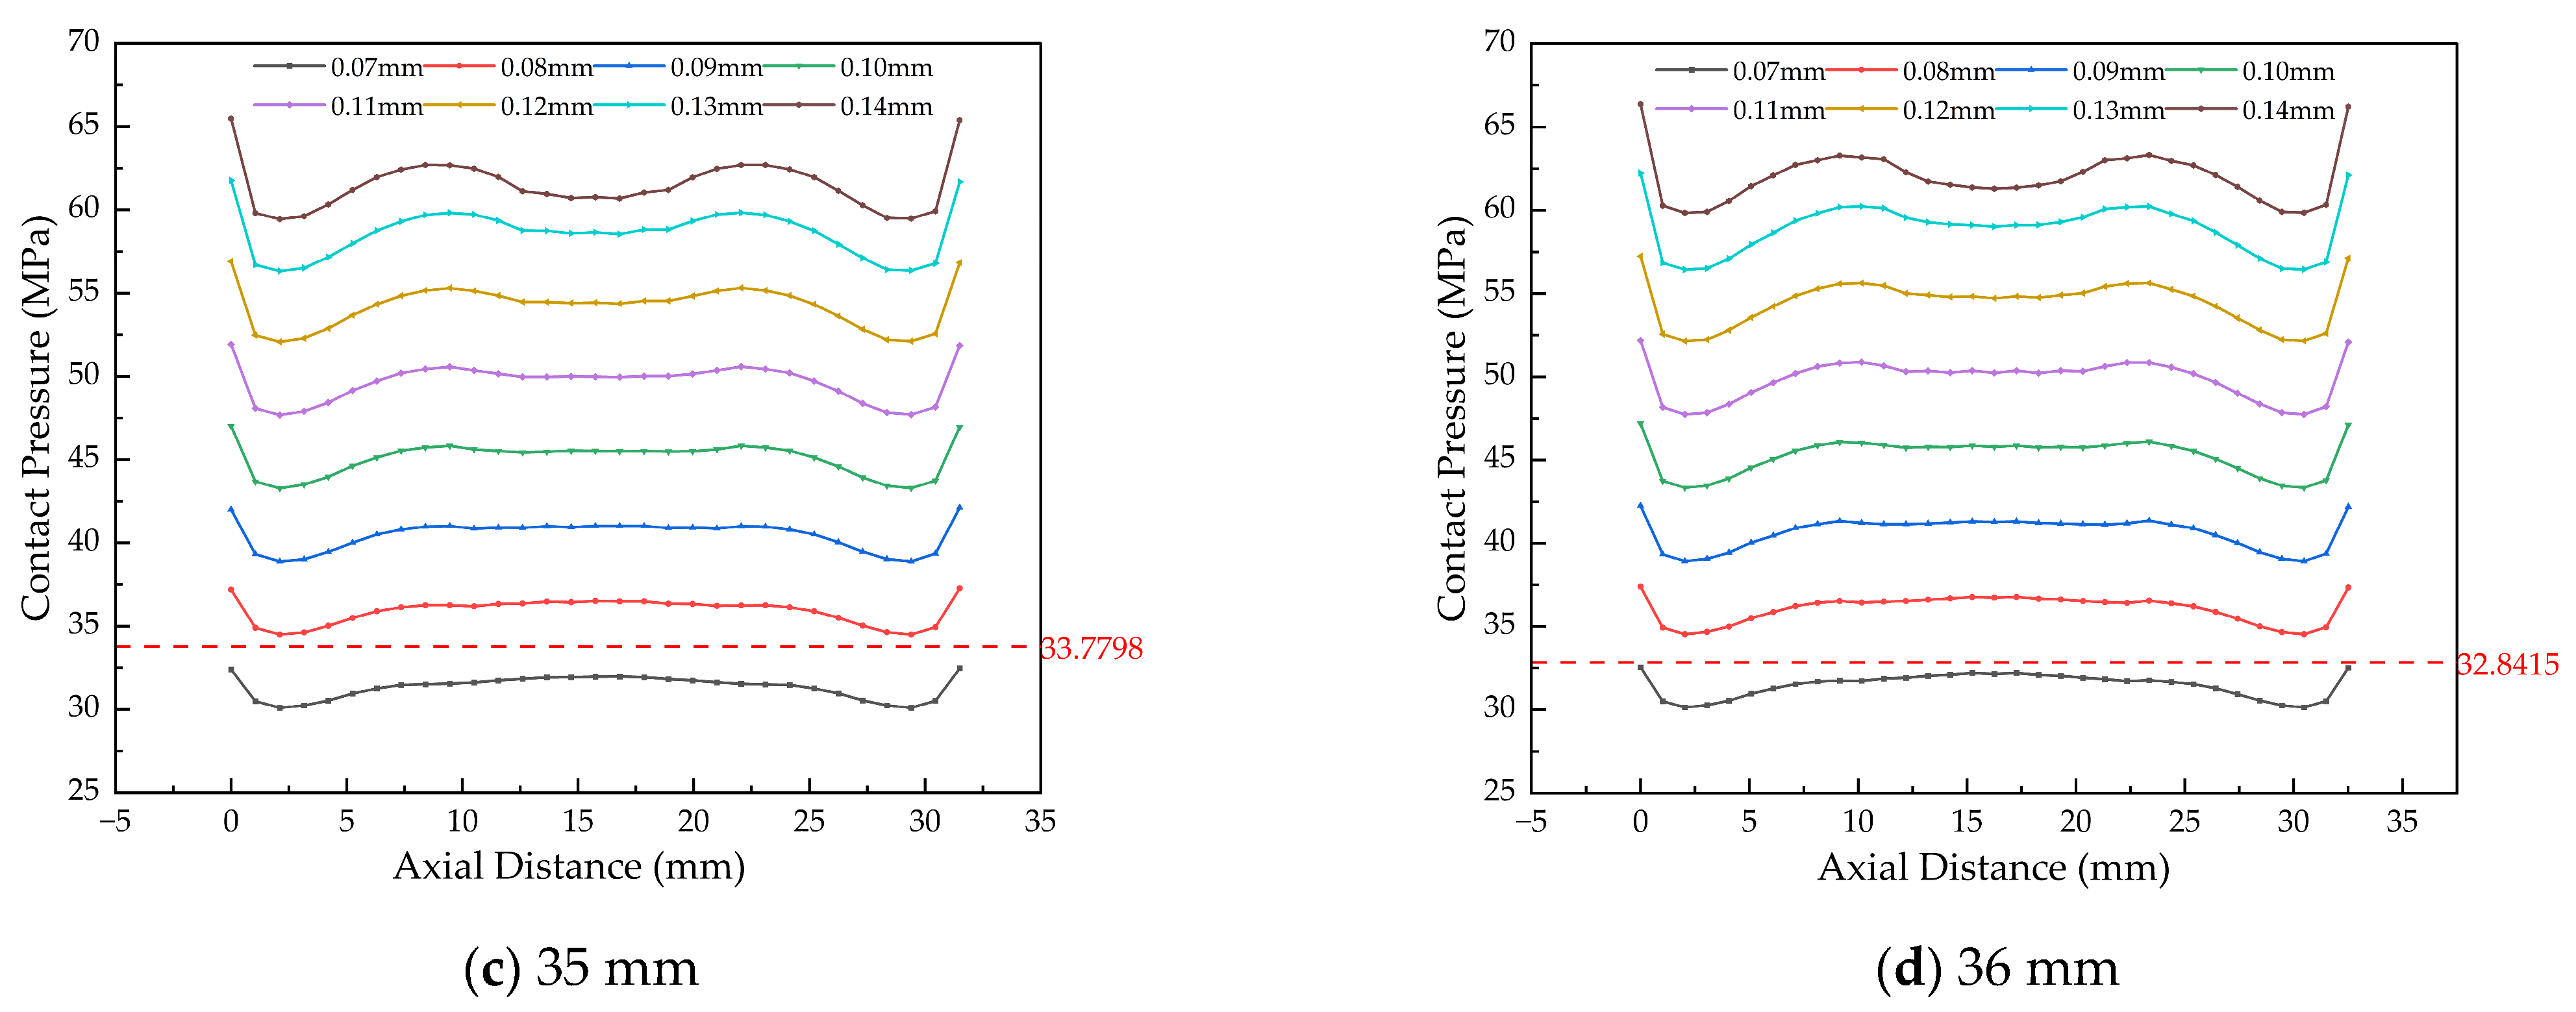
Consistent with the previous analysis on wall thickness, the influence of bushing width was evaluated under interference-fit assembly conditions. The corresponding simulation results are shown in Figure 23 and Figure 24.
According to Figure 23, the maximum VMS is largely insensitive to changes in bushing width under a given interference, indicating that stress levels remain nearly constant. Analysis of the EPS contour reveals that yielding consistently initiates at an interference of 0.12 mm across all widths studied. Consequently, the upper limit of the allowable interference range is conservatively set at 0.11 mm to prevent plastic deformation.
Figure 24 shows that for bushing widths of 32 mm, 33 mm, 35 mm, and 36 mm, the minimum contact pressures at interferences of 0.07 mm and 0.08 mm are insufficient. Specifically, these pressures fall below their respective theoretical minimum required values of 36.95 MPa, 35.83 MPa, 33.80 MPa, and 32.84 MPa. Since such pressures cannot reliably prevent loosening, these interference levels are excluded from the acceptable range.
The final allowable interference ranges for connecting rod bushings with different widths, integrating the constraints from both stress and contact pressure analyses, are consolidated in Table 11.
The simulation data in Table 11 indicate that structural parameters influence the predicted allowable interference range in distinct ways. The range shifts toward larger values with increasing inner diameter—a trend attributable to the reduced radial stiffness of the bushing. In contrast, greater wall thickness substantially lowers the minimum required interference, demonstrating its ability to enhance load transfer and widen the manufacturing tolerance window. Width variation exhibits a relatively limited effect. A notable observation from the model is the close agreement between the allowable ranges under combustion pressure and assembly conditions across all design variants. This suggests that, within the simulated boundary conditions, the static assembly requirement—ensuring sufficient contact pressure without inducing plastic strain—is the governing design criterion, as it inherently satisfies the demands of the most severe dynamic operating condition. Consequently, Table 11 provides a simulation-informed reference to support parameter selection and process control for loosening prevention, thereby helping to streamline the design process by focusing validation efforts on assembly conditions.

4.2. Determination of the Retention Force Range for Different Structural Parameters

Based on the allowable interference ranges established under combustion pressure conditions (Table 10), a series of push-out simulations was conducted. For each structural parameter set, the interference was varied within its respective range at 0.01 mm intervals to calculate the corresponding retention force. This systematic approach enabled the determination of the allowable retention force range associated with each design configuration.

4.2.1. Retention Force Simulation for Different Bushing Inner Diameters

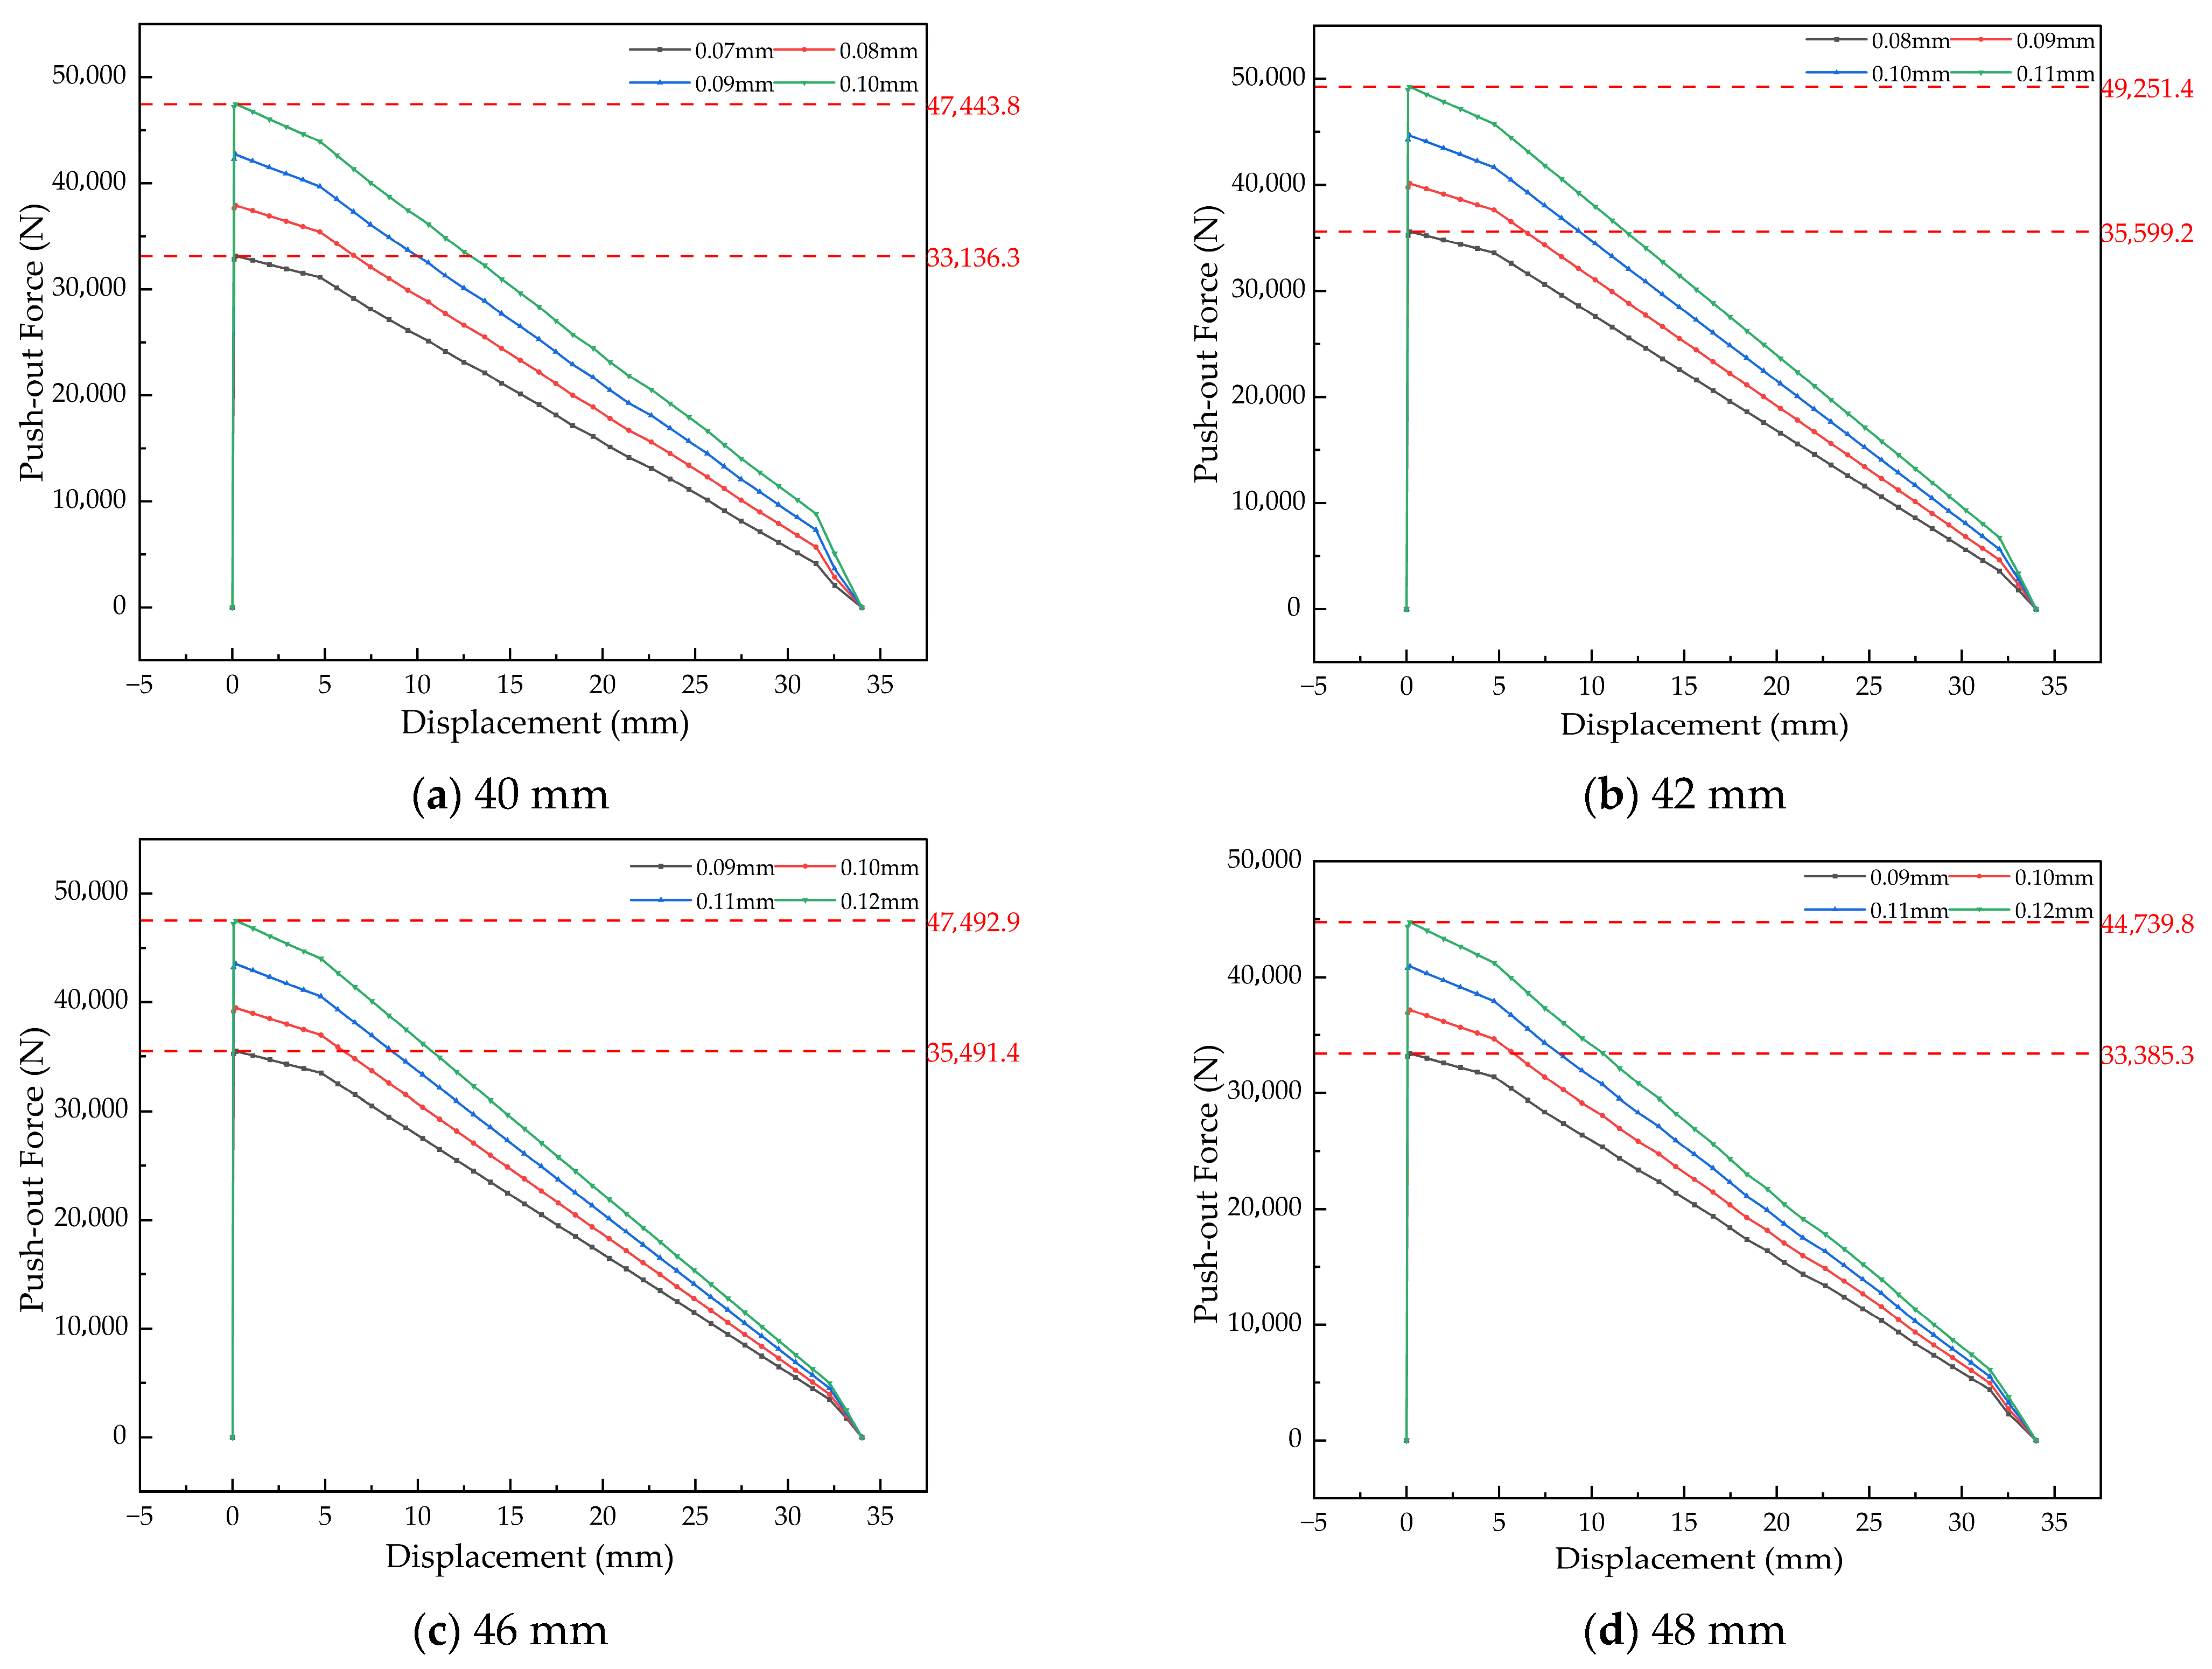
As shown in Figure 25, the simulated retention force for a bushing with a 40 mm inner diameter increases with interference. The maximum forces are 33.14 kN at 0.07 mm interference, 37.91 kN at 0.08 mm, 42.69 kN at 0.09 mm, and 47.44 kN at 0.10 mm. The push-out force versus displacement curves across this range exhibit consistent behavior.
The corresponding allowable retention force ranges for inner diameters of 40 mm, 42 mm, 46 mm, and 48 mm are 33.14–47.44 kN, 35.60–49.25 kN, 35.49–47.49 kN, and 33.39–44.74 kN, respectively. A key trend is observed: under the same interference level, the retention force decreases by approximately 2 kN with each incremental increase in inner diameter. This trend is consistent with the reduced radial contact stiffness associated with larger diameters, which diminishes the frictional resistance under axial push-out loading.

4.2.2. Simulation of Retention Force for Bushings with Different Wall Thicknesses

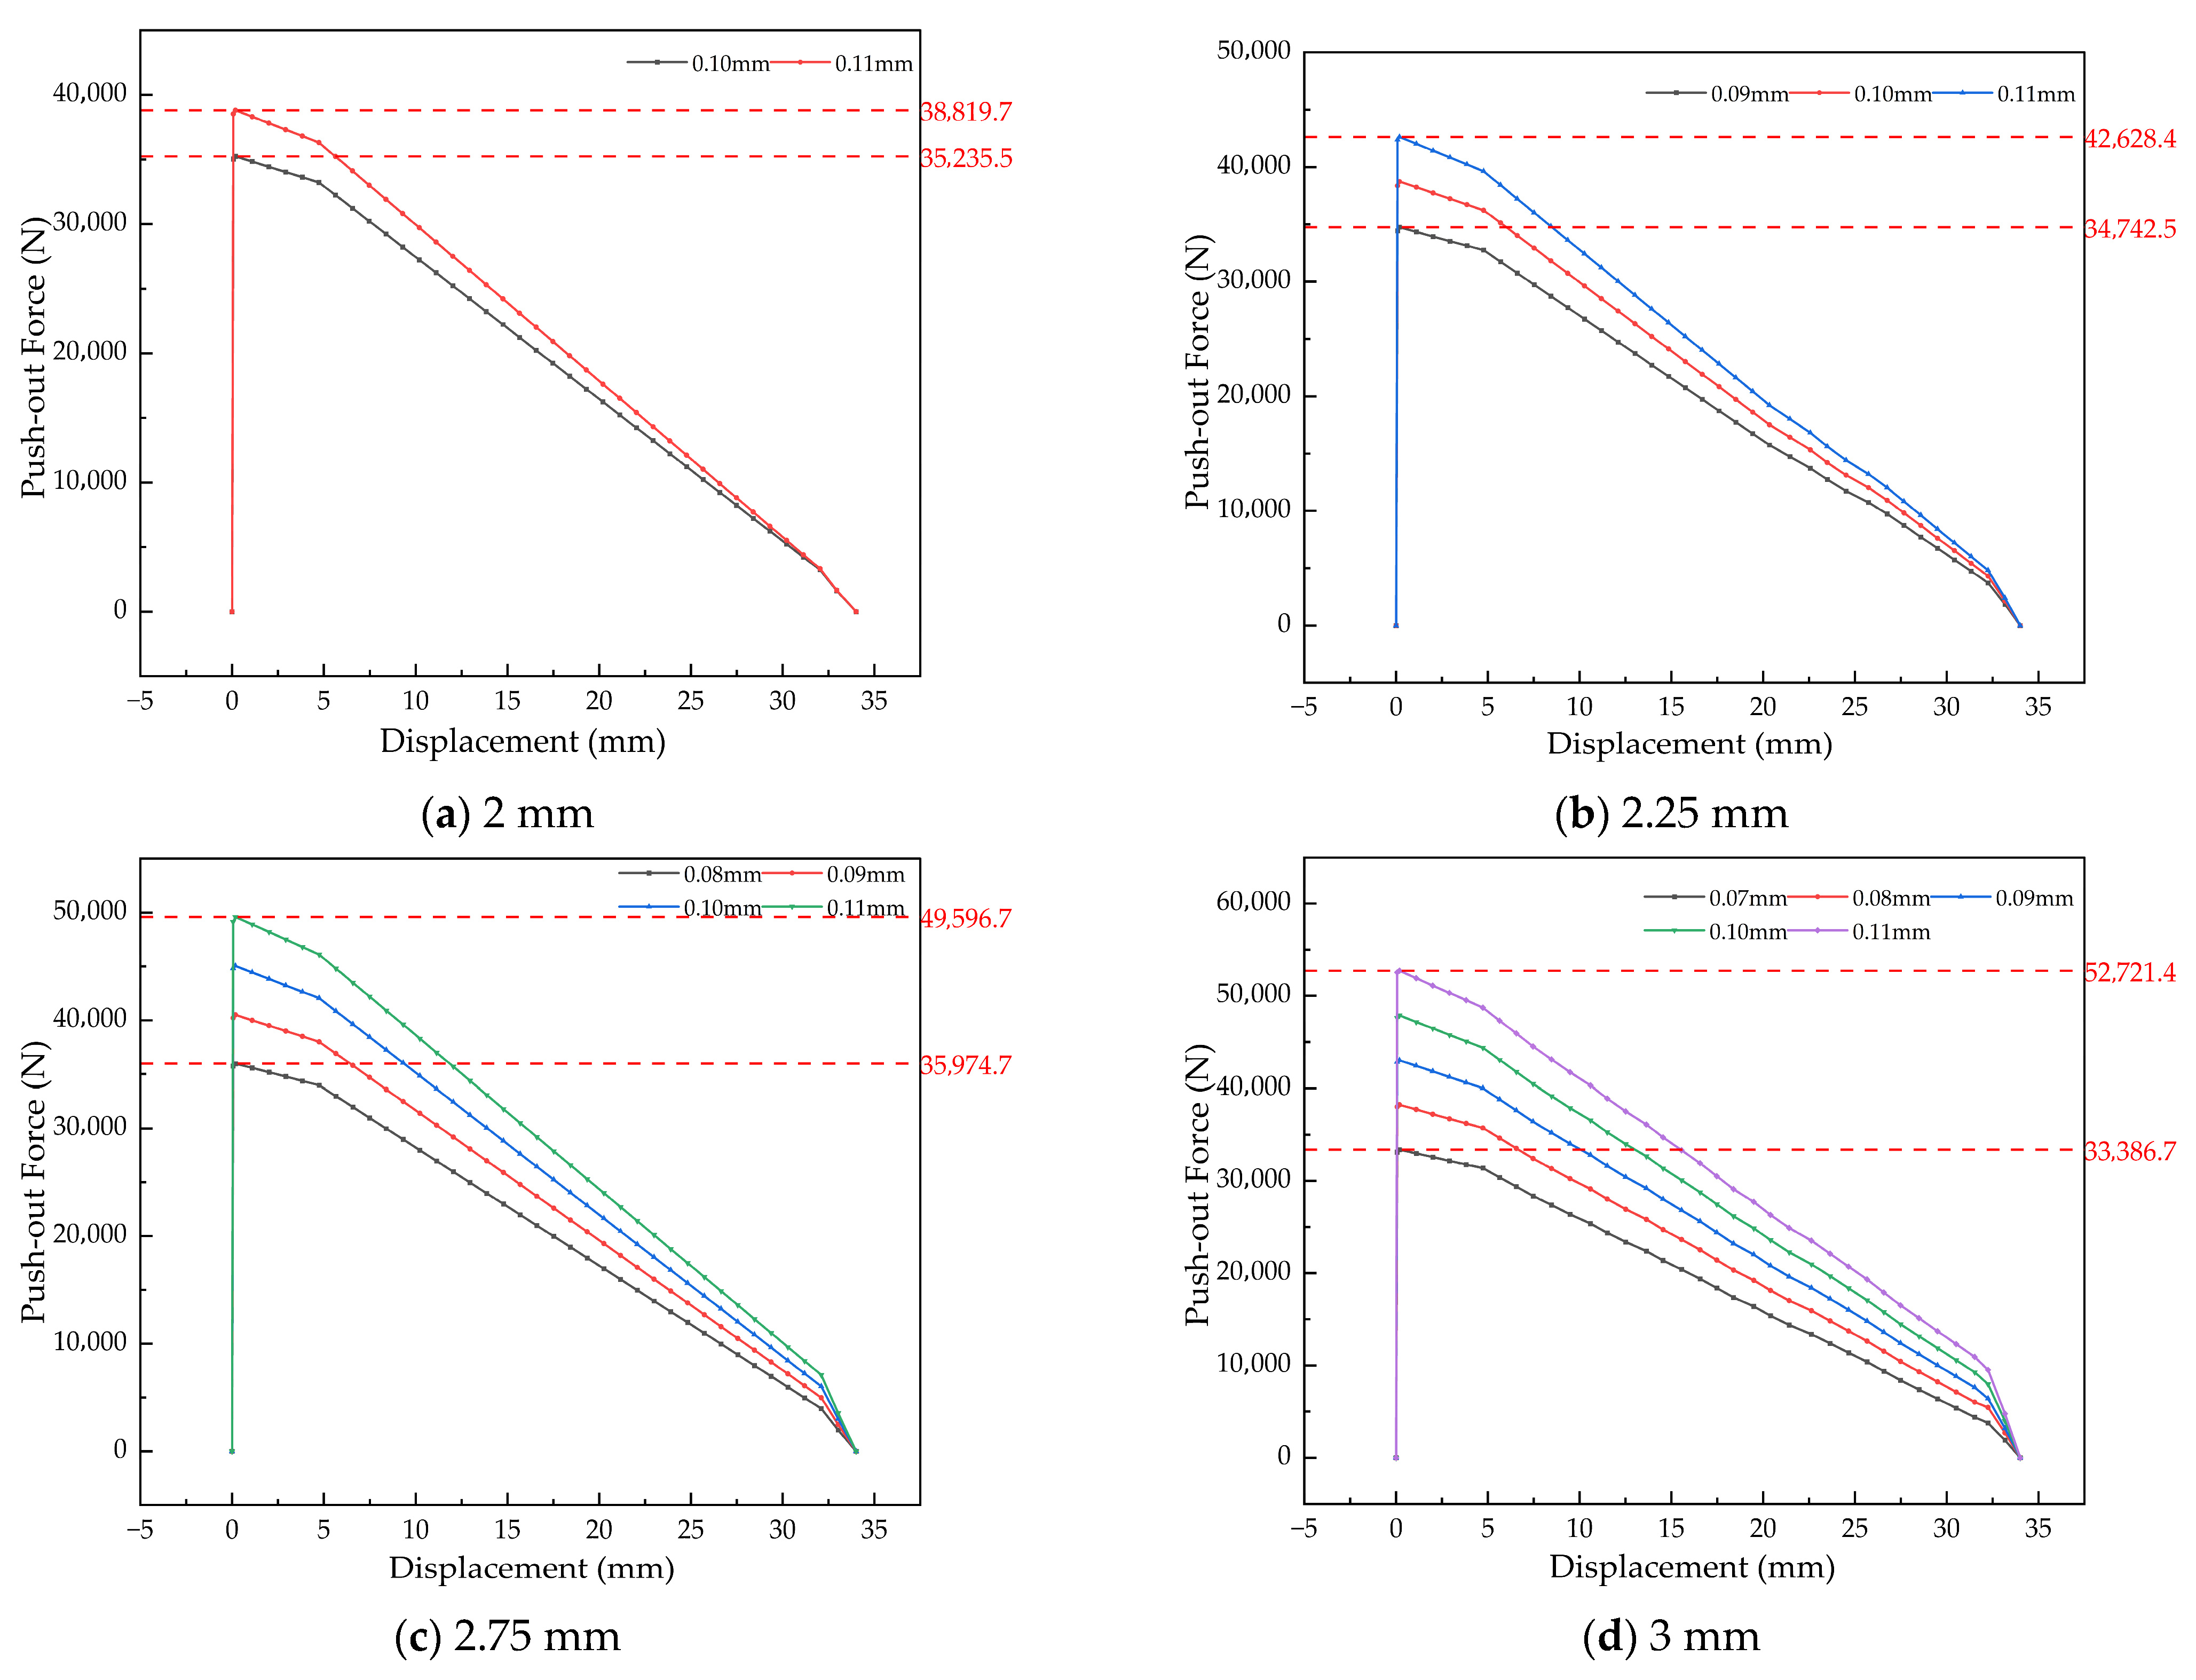
As shown in Figure 26, the push-out force versus displacement curves follow consistent trends across all wall thicknesses. The determined retention force ranges are 35.24–38.82 kN for 2 mm, 34.74–42.63 kN for 2.25 mm, 35.97–49.60 kN for 2.75 mm, and 33.39–52.72 kN for 3 mm wall thickness. A clear trend emerges: under the same interference level, the retention force increases by approximately 3 kN with each incremental step in wall thickness. This increase is attributed to the enhanced radial stiffness and resultant higher contact pressure provided by a thicker bushing wall, which improves frictional resistance during push-out.

4.2.3. Simulation of Retention Force for Bushings with Different Widths

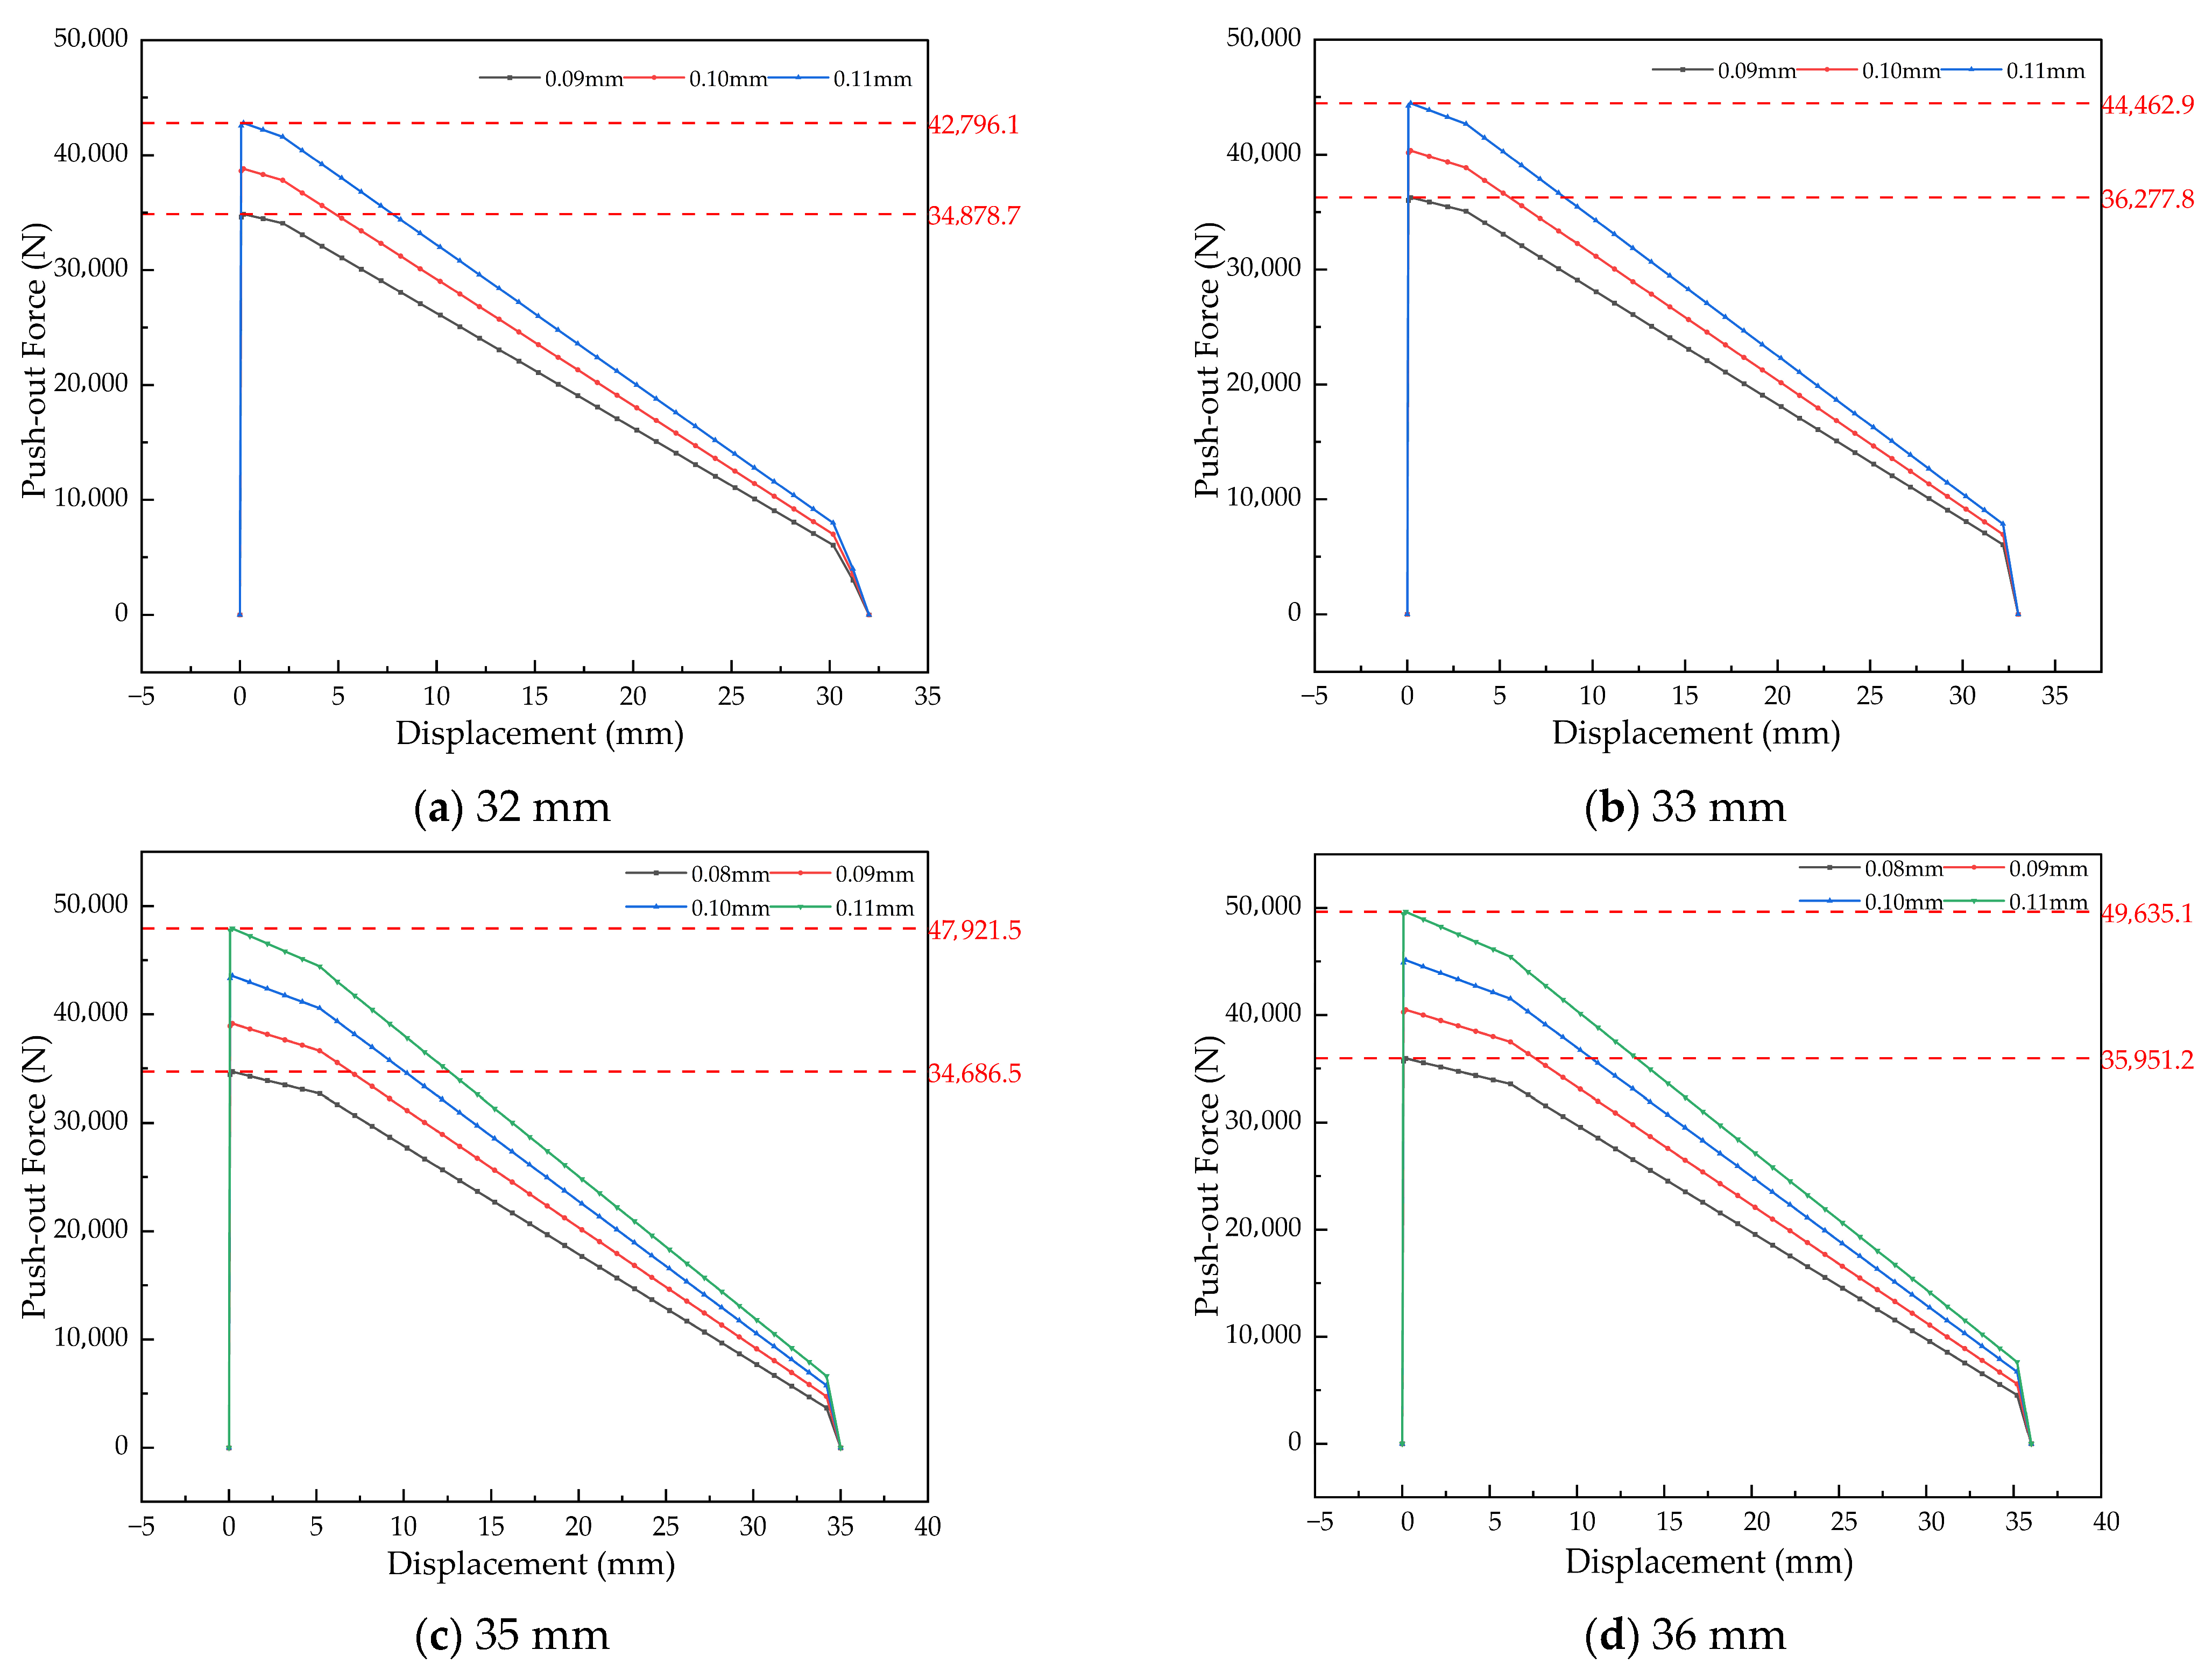
As shown in Figure 27, the push-out force versus displacement curves exhibit consistent behavior across all bushing widths studied. The corresponding retention force ranges are determined as follows: 34.88–42.80 kN for a width of 32 mm, 36.28–44.46 kN for 33 mm, 34.69–47.92 kN for 35 mm, and 35.95–49.64 kN for 36 mm. Under a constant interference level, the retention force demonstrates a gradual increase with wider bushings, at an average rate of approximately 1.3 kN per incremental step in width. This positive correlation is attributed to the enlarged effective contact area, which enhances the total frictional resistance during axial push-out.
The simulation results presented in Table 12 indicate that wall thickness is the most influential parameter affecting retention force. Increasing wall thickness directly enhances the radial stiffness and load-bearing capacity of the bushing, leading to a significant rise in the upper limit of retention force—for example, from 38.82 kN at 2.00 mm to 52.72 kN at 3.00 mm. In contrast, the effects of inner diameter and width are comparatively limited: a larger inner diameter slightly reduces retention force due to decreased stiffness, while greater width provides a modest increase through an enlarged contact area. In summary, this table establishes a simulation-based design reference, quantitatively linking geometric parameters with predicted safe interference ranges and corresponding retention forces, thereby supporting preliminary structural optimization and process selection decisions.

4.3. Comparative Analysis with Existing Research

This section investigates the influence of key bushing structural parameters—inner diameter, wall thickness, and width—on the retention force. A comprehensive comparison with existing literature on structural optimization is conducted to clarify the complementary value and novel insights of this work.
Regarding the influence of inner diameter, existing findings are largely qualitative. For example, Fan et al. [32] noted that an increased inner diameter reduces retention force but did not quantify this relationship or explain the underlying mechanical mechanism. This study addresses this gap. A parametric analysis across inner diameters from 40 to 48 mm established a quantitative rule: for every 2 mm increase in inner diameter, the retention force decreases by an average of 2 kN. The underlying mechanism is attributed to the reduction in bushing radial stiffness with increased inner diameter, which leads to a less uniform and lower contact pressure distribution. This finding provides data to support the precise matching of interference fits for bushings of different inner diameters.
Research on the influence of wall thickness shows significant disagreements and limitations. He et al. [33] provided only the qualitative conclusion that increasing wall thickness enhances retention force. Liu et al. [34] suggested that wall thickness has less influence than the interference fit itself. In contrast, Chen et al. [35], using a thermo-elastoplastic model (TEP), concluded that wall thickness has a minimal impact on contact force. Employing a controlled variable method, this study identifies wall thickness as the most critical parameter affecting retention force. It quantitatively establishes that for every 0.25 mm increase in wall thickness, the retention force increases by approximately 3 kN.
Regarding the influence of width, Feng et al. [36] suggested it has no significant effect on the interference range but did not examine its quantitative relationship with the contact area. This study provides the first quantitative analysis of the width’s effect, establishing that for every 1 mm increase in width, the retention force increases by an average of 1.3 kN. The primary reason is that increased width enlarges the contact area, thereby enhancing retention force. This addresses the gap in existing research regarding the quantitative impact of width.

5. Conclusions and Outlook

5.1. Conclusions

This study systematically investigated the interference fit characteristics and retention force range of a diesel engine connecting rod bushing through an integrated approach combining theoretical analysis, finite element (FE) simulation, and experimental validation. All analyses and conclusions presented herein are based on the assumed dry friction coefficient μ = 0.2 for the steel–bronze pair. It must be emphasized that while small-scale experiments verified the reliability of the established FE model, the proposed safe interference range outlined below is model-predicted and has not been fully validated by extensive experimental testing. The main conclusions are as follows:
(1)
For the typical bushing geometry (inner diameter: 44 mm, wall thickness: 2.5 mm, width: 34 mm), a model-predicted safe interference range of 0.08–0.11 mm was determined. This range corresponds to a retention force range of 33.61–46.25 kN, theoretically satisfying both assembly safety and operational reliability by providing sufficient contact pressure to prevent loosening while avoiding plastic deformation from excessive interference. It must be reiterated that this range, derived from an FE model validated by limited testing, requires further confirmation through extensive experimentation.
(2)
The influence of the three key structural parameters—inner diameter, wall thickness, and width—on retention force was quantified based on finite element model analysis. Wall thickness was identified as the most influential parameter: increasing it significantly enhances retention force by improving the bushing’s radial stiffness. In contrast, a larger inner diameter slightly reduces the force due to decreased stiffness, while increased width provides a limited positive effect by enlarging the contact area. These quantitative relationships are simulation-derived and serve as predictive guidelines.
(3)
For bushing configurations characterized by a “large inner diameter, thin wall, and narrow width,” stricter control over interference fit accuracy and associated manufacturing processes (including dimensional and geometric tolerances as well as surface roughness) is essential. This ensures the bushing remains secure under operational loads and meets safety requirements.
(4)
A comprehensive simulation-based design mapping linking structural parameters, safe interference ranges, and retention force envelopes has been established. This mapping, derived from the parametric FE study, provides practical engineering guidance for the parametric optimization of connecting rod bushings and the precise control of assembly processes. It enables engineers to preliminarily determine optimal structural parameters and interference fit ranges, thereby proactively mitigating the risk of bushing loosening and extending the service life of diesel engines. The mapping and subsequent design guidance are primarily based on simulation results and require experimental validation for broader application. The proposed research framework and design methodology can also be extended to the interference fit design of similar components (e.g., piston pins, hydraulic cylinder bushings) in heavy-duty equipment.
This study, based on an FE model under boundary conditions of room temperature, static compressive load, and ideal alignment, systematically reveals the influence of bushing structural parameters on clamping force distribution. It is important to note that actual engine operation involves complex factors such as thermal mismatch due to high temperatures, oscillating inertial loads, dynamic misalignment, and long-term fretting wear. These factors will interact with the static contact pressure field revealed herein, collectively influencing the final loosening risk. Therefore, when applying the conclusions of this study to engineering practice, they should be regarded as a key simulation-informed design benchmark for determining a safe initial interference fit. Subsequent practical design must integrate thermo-mechanical coupling analysis and fatigue life assessment based on this benchmark, and the model-predicted parameters and ranges should be experimentally verified to ensure the component’s long-term service reliability.

5.2. Outlook

This study focuses on establishing and validating the simulation model, which serves as foundational work to provide a high-precision analytical tool and a theoretical framework for subsequent experimental verification. It is acknowledged that the current validation is based on limited experimental samples and a narrow range of interference levels, which constitutes a key limitation of the present work and precludes definitive engineering conclusions. To address this and transition the research from predictive to validated, a clear follow-up experimental plan has been formulated, comprising:
(1)
Supplementary Validation Experiments: Retention force testing is planned for at least three batches (12 samples total), covering the upper limit, lower limit, and median of the designed tolerance range, with a target completion date of March 2026.
(2)
Analysis of Production Variability: Using existing project specimens, statistical measurements of key dimensions will be performed. The resulting tolerance distribution data will inform Monte Carlo simulations (MCSs) to quantify the impact of production variability on connection performance.
(3)
Accelerated Life Testing: Accelerated tests will be designed to simulate key operational conditions (e.g., alternating loads, temperature cycling) to investigate the long-term degradation of retention force.
These steps are designed to directly remedy the current limitation of scarce experimental data, refine the model with comprehensive evidence, and establish a closed loop of “theoretical modeling → experimental validation → engineering application.” This will provide comprehensive, empirically grounded technical support for the optimized design, improved assembly processes, and enhanced reliability of engine connecting rod bushings.

Author Contributions

Conceptualization, T.L. and C.J.; methodology, T.L.; software, T.L. and C.J.; validation, T.L.; formal analysis, T.L.; investigation, T.L., S.G. and T.S.; resources, C.J. and Y.Z.; data curation, T.L.; writing—original draft preparation, T.L.; writing—review and editing, T.L. and Y.Z.; supervision, C.J., S.G., T.S. and Y.Z.; project administration, C.J. and Y.Z.; funding acquisition, C.J. and Y.Z. All authors have read and agreed to the published version of the manuscript.

Funding

This research received no external funding.

Institutional Review Board Statement

Not applicable.

Informed Consent Statement

Not applicable.

Data Availability Statement

The original contributions presented in this study are included in the article. Further inquiries can be directed to the corresponding author.

Conflicts of Interest

Author Chao Jiang was employed by the China North Engine Research Institute. The remaining author declare that the research was conducted in the absence of any commercial or financial relationships that could be construed as a potential conflict of interest.

List of Acronyms

AcronymFull NameFirst Occurrence Section
FEAFinite Element Analysis1. Introduction
TEPThermo-Elasto-Plastic4.3. Comparative Analysis with Existing Research
MCSMonte Carlo Simulation5.2. Outlook
VMSvon Mises Stress3.1. Determination of the Interference Fit Range
EPSEquivalent Plastic Strain3.1. Determination of the Interference Fit Range

References

  1. Tian, S.; Shen, J.; Wang, C.; Li, G.; Liu, Y.; Jiang, J.; Meng, L.; Li, H. Influence of Low-Pressure Lubrication System on Reliability and Economy of Diesel Engine. Intern. Combust. Engine Power Plant 2024, 41, 30–34+41. [Google Scholar] [CrossRef]
  2. Cui, Y.; Liu, J.; Wang, C.; Wang, Y.; Liu, J.; Zhang, L. Research on the Impact of Low-Viscosity Lubricating Oil on Energy Saving, Emission Reduction and Reliability of Heavy-Duty Commercial Diesel Engines. Automot. Eng. 2024, 46, 935–944+922. [Google Scholar] [CrossRef]
  3. Chen, J.; Bai, C. Kinematics and Dynamics Simulation and Reliability Analysis of Crankshaft-Connecting Rod Mechanism of a Single-Cylinder Four-Stroke Internal Combustion Engine. Neijiang Sci. Technol. 2024, 45, 87–90+115. [Google Scholar]
  4. Liu, K.; Liu, X. Research on Mechanical Fatigue Damage and Reliability of Internal Combustion Engine Piston. Intern. Combust. Engine Parts 2023, 44–46. [Google Scholar] [CrossRef]
  5. Fu, H.; Zhang, H.; Zhang, L.; Niu, P.; Liu, X.; Stelmakh, O. The Loosening Mechanism of Tin-Bronze Bushing Assembled by Interference at Connecting Rod Small End of Heavy-Duty Diesel Engines. Int. J. Engine Res. 2025, 26, 289–298. [Google Scholar] [CrossRef]
  6. Mo, C.; Li, J.; Li, W. Analysis and Improvement Research on Slippage Fault of Connecting Rod Bushing in a V-Type Engine. Intern. Combust. Engine Parts 2025, 92–94. [Google Scholar] [CrossRef]
  7. Jiao, X. Optimization and Verification of Bushing Press-In Force. Automob. Appl. Technol. 2021, 46, 151–154. [Google Scholar] [CrossRef]
  8. Liu, L. Design of Engine Connecting Rod Bushing Pressing Mechanism. Comput. Fan 2021, 3433–3434. [Google Scholar]
  9. Pang, Q.; Liu, Q.; Peng, H. Interference Fit Design Based on Workbench. Mod. Manuf. Eng. 2021, 83–89. [Google Scholar] [CrossRef]
  10. Ji, W.; Hu, J.; Liu, H.; Mao, H. Contact Analysis and Optimization of Track Link Interference Fit under Press-Fitting Process. Mod. Manuf. Eng. 2020, 108–112. [Google Scholar] [CrossRef]
  11. Cao, C.; Fan, W.; Yang, H.; Yang, K.; Ye, W. Solution and Analysis of Interference Fit for Engine Connecting Rod Bushing. Tool Eng. 2017, 51, 52–55. [Google Scholar] [CrossRef]
  12. Cao, Y.; Liang, L.; Ye, Z.; Pan, Z. Simulation and Experimental Study on Bore Shrinkage during Press-Fit Assembly. Machinery 2024, 62, 39–43. [Google Scholar]
  13. Xu, L. Finite Element Strength Analysis of a Diesel Engine Connecting Rod. Intern. Combust. Engine Parts 2024, 1–4. [Google Scholar] [CrossRef]
  14. Mao, X. Simulation Analysis of Structural Strength of Automotive Engine Connecting Rod. Machinery 2022, 60, 37–42+55. [Google Scholar]
  15. Li, X.; Zhao, J.; Wang, X. Experimental Study on Tribological Properties of Tin Bronze Connecting Rod Bushing. J. Plast. Eng. 2019, 26, 267–273. [Google Scholar]
  16. Xiang, J.; Liu, J.; Zhong, C.; Wei, M.; Wang, Y.; Zhang, L. Study on Structural Strength of Bushing in Swinging Pair of Connecting Rod Based on Optimization of Process Parameters. J. Beijing Inst. Technol. 2021, 41, 1154–1161. [Google Scholar] [CrossRef]
  17. Wei, M.H.; Xiang, J.H.; Liu, J.; Zhang, L. Analysis of Stiffness and Strength Characteristics of Connecting Rod Bushing under Material Thermal Degradation. Chin. Intern. Combust. Engine Eng. 2020, 41, 39–45. [Google Scholar] [CrossRef]
  18. Liu, X.; Zhong, J.; Zhou, L. Stress Study Based on Interference Fit of Marine Turbocharger Spindle-Thrust Block System. Intern. Combust. Engine Parts 2025, 22–24. [Google Scholar] [CrossRef]
  19. Li, Y.; Fan, W.; Zhang, H.; Jia, Y.; Wei, Y. Research on Yield Strength of Power Spinning QSn7-0.2 Connecting Rod Bushing Based on Response Surface Methodology. J. Plast. Eng. 2020, 27, 72–78. [Google Scholar] [CrossRef]
  20. Jotawar, C.K.; Chethan, B.R.; Pawan, C.H. Stress Distribution in Interference Fitted Assemblies with Different Material. Int. J. Mech. Eng. Robot. Res. 2014, 3, 129. [Google Scholar]
  21. Petrova, I.M.; Filimonov, M.A. Reliability Assessment of the Compressor Connecting Rods. J. Mach. Manuf. Reliab. 2018, 47, 142–146. [Google Scholar] [CrossRef]
  22. Xu, H. Analysis of Contact Characteristics and Reliability Study of Gear and Shaft Interference Fit Assembly. Master’s Thesis, Hubei University of Automotive Technology, Shiyan, China, 2023. [Google Scholar] [CrossRef]
  23. Qiao, W. Analysis and Research on Interference Contact of Connecting Rod Bushing Based on Workbench. Master’s Thesis, North University of China, Taiyuan, China, 2017. [Google Scholar]
  24. Wang, Z. Simulation and Experimental Study on Optimal Interference Fit of Copper-Nickel-Tin and Tin Bronze Connecting Rod Bushings Based on Workbench. Master’s Thesis, North University of China, Taiyuan, China, 2022. [Google Scholar]
  25. Shi, Y. Simulation Study on Structural Strength Reliability of Diesel Engine Connecting Rod Bushing under Interference Fit. Master’s Thesis, North University of China, Taiyuan, China, 2018. [Google Scholar]
  26. Liu, K. Simulation Study on Loosening of Connecting Rod Small End Bushing Considering Mixed Lubrication. Master’s Thesis, Beijing Institute of Technology, Beijing, China, 2015. [Google Scholar]
  27. Zhang, H. Research and Optimization on Reliability of Interference Fit Assembly for Connecting Rod Bushing. Master’s Thesis, North University of China, Taiyuan, China, 2020. [Google Scholar] [CrossRef]
  28. Marmorini, L.; Baldini, A.; Bertocchi, E.; Giacopini, M.; Rosi, R.; Strozzi, A. On the Loosening Mechanism of a Bush Press-Fitted in the Small End of a Connecting Rod. Proc. Inst. Mech. Eng. Part D J. Automob. Eng. 2012, 226, 312–324. [Google Scholar] [CrossRef]
  29. Xiao, J.; Qin, W.; Xu, S. Interference and Thickness Design of Bushing of Connecting Rod Small End for Anti-Loosening. Eng. Fail. Anal. 2021, 127, 105556. [Google Scholar] [CrossRef]
  30. Liu, J.; Xiang, J.; Qin, W.; Zuo, Z. Effect of Temperature Increase on the Looseness of Connecting Rod Small End Bushing. Eng. Fail. Anal. 2022, 138, 106195. [Google Scholar] [CrossRef]
  31. Jiang, X. Thermo-Elasto-Plastic Mechanical Analysis of Loosening Problem in Connecting Rod Small End Bushing. Master’s Thesis, Beijing Institute of Technology, Beijing, China, 2015. [Google Scholar]
  32. Fan, X. Simulation Analysis of Bore Shrinkage for Diesel Engine Connecting Rod Bushing under Interference Fit. Master’s Thesis, North University of China, Taiyuan, China, 2011. [Google Scholar]
  33. He, J.; Bai, L. Experimental Study on the Influence Law of Press-Out Force for Interference Fit Assembly of Connecting Rod Bushing. Mech. Electr. Inf. 2020, 41–42. [Google Scholar] [CrossRef]
  34. Liu, J.; Wang, J.; Zhang, P.; Yang, W. Load Analysis of Connecting Rod Small End Bearing and Study on Influencing Factors of Looseness. Mach. Des. Manuf. 2023, 384, 215–218. [Google Scholar] [CrossRef]
  35. Chen, G.; Liao, R.; Jiang, X. Calculation and Study of the Failure of the Connecting-Rod Small End Based on Thermoelastic Plasticity. Proc. Inst. Mech. Eng. Part D J. Automob. Eng. 2017, 231, 1489–1499. [Google Scholar] [CrossRef]
  36. Feng, Y. Simulation and Analysis of Interference Fit Assembly for Engine Connecting Rod Bushing. Master’s Thesis, North University of China, Taiyuan, China, 2011. [Google Scholar]
Figure 1. Configuration of the contact pair and interference fit.
Applsci 16 01843 g001
Figure 2. Boundary conditions for the interference fit simulation.
Applsci 16 01843 g002
Figure 3. Finite element meshes of the bushing for different global element sizes.
Applsci 16 01843 g003
Figure 4. Finite element model assembly and mesh of the connecting rod small end, bushing, and piston pin.
Applsci 16 01843 g004
Figure 5. Verification of FEA model: theoretical versus simulated contact pressure on the bushing outer surface.
Applsci 16 01843 g005
Figure 6. Boundary conditions and coupling setup for the retention force simulation.
Applsci 16 01843 g006
Figure 7. Connecting rod bushing (a) before and (b) after the push-out test.
Applsci 16 01843 g007
Figure 8. (a) Schematic of the push-out test setup; (b) Measured retention force for a bushing with 0.04 mm interference.
Applsci 16 01843 g008
Figure 9. Simulation results for the connecting rod bushing at interference levels of 0.07 mm and 0.14 mm: (a) contact pressure distribution (0.07 mm, unit: MPa); (b) VMS (0.07 mm, unit: MPa); (c) VMS (0.14 mm, unit: MPa); (d) EPS (0.14 mm, dimensionless).
Applsci 16 01843 g009aApplsci 16 01843 g009b
Figure 10. Parametric simulation results for the bushing over an interference range of 0.07–0.14 mm: (a) maximum VMS; (b) EPS; (c) outer-surface contact pressure distribution.
Applsci 16 01843 g010
Figure 11. Mechanical load configuration for the combustion pressure simulation.
Applsci 16 01843 g011
Figure 12. Simulation results for the bushing under peak combustion pressure at interferences of 0.08 mm and 0.11 mm: (a) contact pressure distribution (0.08 mm, unit: MPa); (b) VMS (0.08 mm, unit: MPa); (c) VMS (0.11 mm, unit: MPa); (d) EPS (0.11 mm, dimensionless).
Applsci 16 01843 g012
Figure 13. Parametric simulation results for the bushing over an interference range of 0.08–0.11 mm: (a) maximum VMS comparison; (b) outer-surface contact pressure distribution.
Applsci 16 01843 g013
Figure 14. Family of push-out force versus displacement curves for the connecting rod bushing at interferences of 0.08–0.11 mm.
Applsci 16 01843 g014
Figure 15. VMS contour in the bushing at 0.09 mm interference (unit: MPa).
Applsci 16 01843 g015
Figure 16. Contact pressure contour on the bushing outer surface at 0.09 mm interference (unit: MPa).
Applsci 16 01843 g016
Figure 17. Comparison of maximum VMS for bushings with different inner diameters.
Applsci 16 01843 g017
Figure 18. Comparison of outer-surface contact pressure for bushings with different inner diameters.
Applsci 16 01843 g018
Figure 19. Comparison of maximum VMS in bushings with different inner diameters under combustion pressure.
Applsci 16 01843 g019
Figure 20. Comparison of contact pressure on the outer surface of bushings with different inner diameters under combustion pressure.
Applsci 16 01843 g020aApplsci 16 01843 g020b
Figure 21. Comparison of maximum VMS for bushings with different wall thicknesses.
Applsci 16 01843 g021
Figure 22. Comparison of contact pressure on the outer surface of bushings with different wall thicknesses.
Applsci 16 01843 g022
Figure 23. Comparison of maximum VMS for bushings with different widths.
Applsci 16 01843 g023
Figure 24. Comparison of contact pressure on the outer surface of bushings with different widths.
Applsci 16 01843 g024aApplsci 16 01843 g024b
Figure 25. Family of push-out force vs. displacement curves for bushings with varying inner diameters.
Applsci 16 01843 g025
Figure 26. Family of push-out force vs. displacement curves for bushings with varying wall thicknesses.
Applsci 16 01843 g026
Figure 27. Family of push-out force vs. displacement curves for bushings with varying widths.
Applsci 16 01843 g027
Table 1. Material parameters of the connecting rod small end and bushing.
ComponentMaterialElastic Modulus (GPa)Poisson’s Ratio (ν)
Connecting rod small endAlloy Steel2090.29
Connecting rod bushingQSn7-0.21290.27
piston pinAlloy Steel2090.29
Table 2. Plastic material parameters of the connecting rod bushing.
Temperature (°C)Plastic StrainYield Strength (MPa)
Room Temperature0620
1500607
Table 3. Comparison of calculated contact stresses across mesh refinements.
Interference (mm)Element Size (mm)Number of ElementsMax. Contact Stress (MPa)Min. Contact Stress (MPa)Theoretical Pressure (MPa)
0.030.4147,13226.3912.0614.60
0.643,92023.5711.99
0.818,76822.2411.90
1.011,82622.2612.27
1.2536826.0612.01
1.4395227.7911.74
0.110.4147,13296.2548.3253.54
0.643,92094.4147.05
0.818,76893.3347.58
1.011,82693.1748.23
1.2536896.3448.11
1.4395297.5847.24
Table 4. Comparison of theoretical and simulated contact pressure for the interference-fit bushing.
Interference (mm)Theoretical Pressure (MPa)Simulated Pressure (MPa)Error (%)
0.0419.4719.711.2
0.0524.3424.671.4
0.0629.2129.641.5
0.0734.0734.571.5
Table 5. Comparison of theoretical and simulated retention forces for different interference levels.
Interference (mm)Theoretical Force (kN)Simulated Force (kN)Error (%)
0.0416.2516.722.9
0.0520.3220.943.1
0.0624.3825.163.2
0.0728.4429.393.3
Table 6. Comparison of theoretical, simulated, and experimental retention forces.
Interference (mm) Theoretical   Force ,   T (kN) Simulated   Force ,   S (kN) Experimental   Force ,   E (kN) ε T E (%) ε S E (%)
0.0416.2516.7216.521.71.2
0.0520.3220.9420.752.10.9
Table 7. Summary of Inputs, Outputs, and Design Flow.
CategorySymbolPhysical MeaningRole in This Study
InputK,TPeak radial load and driving torqueKnown loading conditions from operational analysis
μ Static friction coefficientKey parameter based on material pairing assumption μ = 0.2 )
σ s Yield strength of bushing materialMaterial-given known property (620 MPa)
r , l , t , r 1 , d Bushing geometric dimensionsInitially given design values or optimization variables
Model Output p min Minimum contact pressure to prevent fretting slipCalculated from the anti-slip criterion (Formula 7)
p max Maximum contact pressure to prevent plastic yieldingCalculated from the yield criterion (Formula 8)
Final Design Output δ m i n , δ m a x Safe interference fit rangeDerived from the safe pressure window via Lamé equations
Table 8. Contact pressure and corresponding allowable interference range for bushings of different inner diameters.
Bushing Inner Diameter (mm)Minimum Contact Pressure (MPa)Maximum Contact Pressure (MPa)Interference Range (mm)
4037.8672.940.06–0.12
4236.2569.660.07–0.13
4633.4163.920.08–0.14
4832.1561.390.08–0.15
Table 9. Contact pressure and corresponding allowable interference range for bushings of different wall thicknesses.
Bushing Wall Thickness (mm)Minimum Contact Pressure (MPa)Maximum Contact Pressure (MPa)Interference Range (mm)
2.0035.5053.910.09–0.13
2.2535.1360.320.08–0.13
2.7534.4272.940.07–0.14
3.0034.0879.150.06–0.14
Table 10. Contact pressure and corresponding allowable interference range for bushings of different widths.
Bushing Width (mm)Minimum Contact Pressure (MPa)Maximum Contact Pressure (MPa)Interference Range (mm)
3236.9566.670.07–0.14
3335.83
3533.80
3632.84
Table 11. Allowable interference ranges for bushings with different structural parameters.
Structural Parameter Variation (mm)Allowable Interference Range (mm)
Assembly ConditionCombustion Pressure Condition
Varying Inner Diameter
(Wall thickness: 2.5 mm;
Width: 34 mm)
40.000.07–0.100.07–0.10
42.000.08–0.110.08–0.11
46.000.09–0.120.09–0.12
48.000.09–0.120.09–0.12
Varying Wall Thickness
(Inner diameter: 44 mm; Width: 34 mm)
2.000.10–0.110.10–0.11
2.250.09–0.110.09–0.11
2.750.08–0.110.08–0.11
3.000.07–0.110.07–0.11
Varying Width
(Inner diameter: 44 mm; Wall thickness: 2.5 mm)
32.000.09–0.110.09–0.11
33.000.09–0.110.09–0.11
35.000.08–0.110.08–0.11
36.000.08–0.110.08–0.11
Table 12. Allowable retention force ranges for connecting rod bushings with different structural parameters.
Structural Parameter Variation (mm)Retention Force Range (kN)
Varying Inner Diameter
(Wall thickness: 2.5 mm;
Width: 34 mm)
40.0033.14–47.44
42.0035.60–49.25
46.0035.49–47.49
48.0033.39–44.74
Varying Wall Thickness
(Inner diameter: 44 mm; Width: 34 mm)
2.0035.24–38.82
2.2534.74–42.63
2.7535.97–49.60
3.0033.39–52.72
Varying Width
(Inner diameter: 44 mm; Wall thickness: 2.5 mm)
32.0034.88–42.80
33.0036.28–44.46
35.0034.69–47.92
36.0035.95–49.64
Disclaimer/Publisher’s Note: The statements, opinions and data contained in all publications are solely those of the individual author(s) and contributor(s) and not of MDPI and/or the editor(s). MDPI and/or the editor(s) disclaim responsibility for any injury to people or property resulting from any ideas, methods, instructions or products referred to in the content.