Abstract
In the coring process of ocean drilling, conventional vertical holes face many difficulties, such as the high cost of single holes and limited acquisition of geological information, which cannot meet the demand for fine delineation of strata around drill holes. For this reason, based on wire-line coring and directional drilling technology, a continuous core tool for directional drilling has been designed, which can efficiently and accurately obtain cores in seabed strata and improve perceptions of target geological bodies. In this paper, the structure and working principle of a directional coring drilling tool (DCDT) were introduced in detail, and the ultimate deflecting capacity of a hollow single bend sub (HSBS) and the power demand of a positive displacement motor (PDM) were calculated. Then, an experiment platform was established to test the performance of the DCDT prototype. The test results showed that a total core length of 5.15 m was obtained among hybrid drilling processes, and the maximum core recovery rate was 91.67%. In slide drilling processes, the core recovery rate was only 55–60%, and the calculated build-up rate reached 7.5°/30 m. Through simulation and experiments, the key components of DCDTs were verified. This research will promote the optimization of DCDTs and accelerate engineering applications.
1. Introduction
Marine drilling technology is essential for oil and gas exploration, subsea mineral resource exploitation, environmental monitoring, and geological research. As deep-sea oil and gas resources are continuously developed, and subsea mineral resources are gradually explored, demand for marine drilling has grown more urgent [1,2]. Complexity and uncertainty of subsea geology present a significant challenge to accurate acquisition of geological data [3]. One of the core challenges in advancing marine drilling technology is obtaining precise geological data through drilling, especially in terms of efficient and accurate sampling.
Traditional marine drilling commonly uses vertical drilling methods, which often fail to meet the demands of modern deep-sea exploration. Single-hole drilling, especially in deep-sea environments where there are high-risk operations and advanced technical requirements, always has many limitations [4,5]. Additionally, the sampling range and depth of conventional vertical drilling are limited, restricting geological data to a vertical plane and hindering a comprehensive understanding of surrounding strata. Traditional methods are significantly inadequate in terms of sampling accuracy and spatial distribution when precise characterization of target strata is required. Furthermore, conventional drilling methods cannot perform multi-angle sampling, limiting the ability to fully understand complex geological formations and thus affecting data accuracy and reliability. Therefore, although vertical drilling technology has been widely used in marine drilling, it has revealed many limitations when facing demands for efficient exploration and detailed geological analysis, so there is an urgent demand to seek new technological solutions to improve the accuracy, efficiency, and cost-effectiveness of marine drilling [6,7].
As an efficient and accurate sampling technology, DCDTs have significant advantages over traditional drilling methods. This method can not only significantly reduce the number of holes on the ground by means of “one hole with multiple branches” or “branching wells”, but it also provides data from multiple directions at the same time, and precisely controls the drilling trajectory in three-dimensional space to obtain a core of a target geological body [8,9]. Furthermore, it minimizes surface vegetation disruption caused by equipment relocation and well site construction, thus transforming traditional resource exploration methods and promoting a shift toward more sustainable, environmentally friendly, and low-carbon exploration, ultimately enhancing both efficiency and accuracy [10,11]. Currently, only two companies—Devico from Norway and Aziwell from the United States—have mastered DCDT technology. The technical parameters are shown in Table 1. These companies have achieved successful applications in various fields, including mineral reserve expansion, tunnel construction, and subsea exploration [12,13,14,15]. Their commonly used build-up capabilities range from 4°/30 m to 9°/30 m [16,17], while the core diameter is less than 40 mm. However, China has achieved significant advancements in small-diameter directional drilling, such as the ultra-long horizontal directional drilling technology for coal mines developed by the Xi’an Research Institute of the China Coal Technology & Engineering Group and the long-distance magnetic targeting technology developed by the Institute of Exploration Technology, Chinese Academy of Geological Sciences [18,19]. Additionally, Wu et al. have applied horizontal hole directional coring technology beneficially in the investigation and construction of the Sichuan–Tibet Railway, but there remains a notable gap compared to the international standards in terms of continuous core recovery and deflecting capabilities during directional drilling [20].

Table 1.
The technical parameters of Devico and Aziwell.
This paper presents a novel structure and process for DCDTs based on wire-line coring and directional drilling technologies. Furthermore, this kind of DCDT can obtain much bigger cores compared to other drilling tools of same type. This will be beneficial to obtain more geological information. Aiming at problems of low drilling efficiency of directional holes in hard rock, easy to break drilling tools due to complicated force, and difficult to obtain core continuously [21,22,23], this paper has introduced in detail the structure and working principle of a DCDT, calculated the ultimate deflecting capacity of an HSBS and the power demand of a positive displacement motor (PDM), as well as simulated the stress–strain of an HSBS under the action of different axial forces, lateral forces, and torques, and finally conducted platform tests and drilling experiments. The main purpose of the above research is to optimize the design of DCDTs.
2. Structure and Process Principles of DCDT
A DCDT (Figure 1) consists of two main components: outer and inner tube assembly. The outer tube assembly includes components such as the nonmagnetic outer tube, torque transmission tube, HSBS, and core bit, while the inner tube assembly comprises a fishing tool, latch head assembly, measurement while drilling system, PDM, and core barrel.
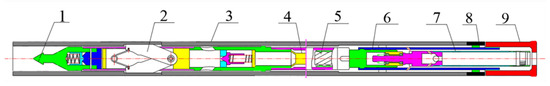
Figure 1.
The structural diagram of a DCDT. 1—fishing tool; 2—latch head assembly; 3—nonmagnetic outer tube; 4—measurement while drilling system (MWD); 5—small-diameter and high-torque PDM; 6—torque transmission tube; 7—high-strength core barrel; 8—HSBS; 9—core bit.
Wire-line coring is achieved through a fishing assembly. A small-diameter PDM is mounted on the inner tube assembly and is driven by drilling fluid to rotate. Torque is transmitted to the core bit via a torque transmission tube for drilling. HSBSs are critical components for deflection, enhancing the deflection capability of a DCDT by adjusting its pre-set bend angle. The adjustable angle ranges from 0~2°, and it can be rotated to achieve five angle settings: 0°, 0.5°, 1°, 1.5°, and 2°, effectively ensuring realization of deflection capability. And core bit and core barrel are used to obtain cores. The technical parameters of DCDTs are shown in Table 2.
Table 2.
The technical parameters of DCDT.
One of main objectives of directional core drilling is to obtain core samples from sub-sea mineral layers, thereby acquiring more detailed information on subsea mineral resources [24,25]. Based on the wire-line coring technique, a DCDT has been developed. During directional drilling, the actual borehole trajectory is adjusted based on measurements while drilling and establishing the planned hole design [26,27]. The coring processes are outlined as follows in Figure 2:
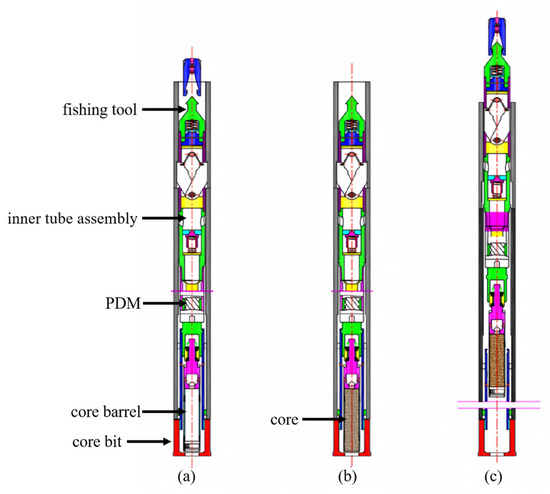
Figure 2.
The processes of wire-line directional core drilling technology. (a)—inner tube assembly deployment; (b)—core drilling; (c)—inner tube assembly retrieval.
- (1)
- Deployment of inner tube assembly: During directional drilling, borehole trajectory may involve vertical, inclined, or horizontal sections, and free-fall deployment of the inner tube assembly may not reach the designated position. Therefore, it must be pumped to the designated position at the bottom of hole using a mud pump. After the inner tube assembly is positioned, drilling fluid flows through the PDM, driving its rotation. Rotational torque is transmitted through a spline to a torque transmission pipe, driving the core bit. An eccentric bearing assembly isolates movement of the torque transmission pipe and outer pipe, permitting only the coring bit to rotate, thus reducing working torque of the PDM. Once the PDM reaches its position, mud pump pressure increases, signaling that the inner tube assembly is properly positioned.
- (2)
- Core drilling: Once the inner tube assembly is deployed, the coring process begins. During drilling, the azimuth and dip angle of the hole are adjusted according to the designed drilling trajectory. It is crucial that axes of both inner and outer tube assemblies remain consistent with borehole axis, ensuring smooth flow of core samples into core barrel while minimizing risks of tool breakage, wear, and core loss [28].
- (3)
- Recovery of Inner Tube Assembly: When the core run footage reaches the length of core barrel, the inner tube assembly can be fished. The coring tool is retrieved using a fishing tool, and as the fishing tool is lifted, the coring tool is released from the latch head assembly. The entire coring tool is then retrieved to the borehole head. The tool is disassembled to extract the core from the core barrel. The tool is then reassembled, and the above steps are repeated for continued core processes.
3. Deflecting Capability and PDM Power of DCDT
3.1. Calculation of Max Deflecting Ability of DCDT
Due to the relatively short length and large stiffness of the PDM, methods based on geometric relationships for calculating its build-up rate have become widely accepted. H. Karisson et al. proposed a “three-point circle method” in 1985, which was the earliest method of calculating geometric deflecting of an HSBS assembly [29,30,31]. Subsequently, Su et al. have conducted in-depth study on the problem of equivalence between dual/triple bend and single bend drilling tools [32,33]. Liu et al. modified the “three-point circle method” to account for influence of structural bending angles on deflecting ability [34]. These methods for calculating build-up rate are primarily researched and refined for single-bend double-stabilizer PDM. Geometric build-up rate calculation for a single-bend no-stabilizer PDM also aligns with the theory of the “three-point circle method”. The tangent point between the upper drill string and wellbore can be approximated as the position of a stabilizer, assuming that the bit point, bend point of the PDM, and tangent point all lie on the same circular arc.
Based on the “three-point circle method“ for calculating the geometric build-up rate of a DCDT, it is necessary to establish a coordinate system and determine the origin. The origin is typically chosen on the centerline of the single-bend point and bit. This centerline is taken as the y-axis, and the drill bit’s bottom surface, perpendicular to the centerline, is taken as the x-axis. For a DCDT, a simplified coordinate system is constructed as shown in Figure 3.
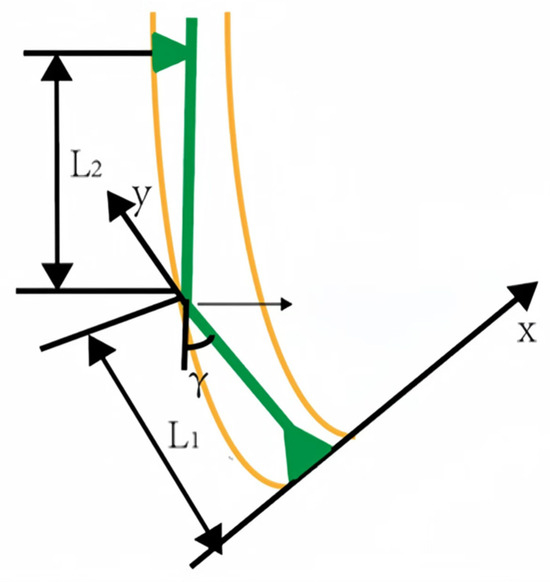
Figure 3.
The model of DCDT deflection mechanism.
From a mathematical perspective, the curvature equation of a circle, denoted as , can be derived as follows:
Through theoretical derivation, the theoretical build-up rate of a modified single-bend no-stabilizer PDM can be simplified as follows:
where represents the modified build-up rate of single-bend no-stabilizer PDM assembly, in (°)/30 m; is the correction coefficient, which is related to factors primarily influenced by the formation’s deflecting capability, typically ranging from 0.70 to 0.85; a is the coefficient reflecting the influence of the drill string diameter at the tangent point with the upper wellbore on build-up rate, in (°)/30 m; is the coefficient accounting for the reduction in build-up rate due to wellbore enlargement, in (°)/30 m; denotes the diameter of the PDM, in meters; denotes the diameter of the upper drill string, in meters; denotes the diameter of the wellbore, in meters; represents the build-up rate of a single-bend no-stabilizer PDM, considering the influence of the structural bend angle position, in (°)/30 m; is the distance from bend point of the PDM to bit, in meters; is the structural bend angle, in (°).
In this equation, is the distance from the tangent point between upper drill string and wellbore to the bend point, which is subject to uncertainty. The bottom hole assembly (BHA) can be treated as a continuous beam subjected to both axial and lateral bending moments. Contact points between drill string and wellbore can be regarded as hinge supports, with each segment between two supports modeled simply as a supported beam. By applying the elastic stability theory of beams and columns, the corresponding three-moment equation can be derived.
Through theoretical analysis, the distance from upper tangent point to bend point of the PDM, denoted as , can be simplified as follows:
where represents the elastic modulus of the drill string, in kPa; is the length of the PDM, in meters; denotes the inner diameter of PDM, in meters; is the weight of the PDM, in kN; represents the density of drilling fluid, in kg·m−3; represents the density of steel, in kg·m−3; is the inclination angle at tangent point, in degrees (°); is the stability coefficient of the single-bend no-stabilizer drill assembly; is the deformation energy generated by the load, J. By substituting the calculated value of from Equation (6) into (2), the build-up rate of the single-bend no-stabilizer PDM can be calculated.
3.2. Power Calculation of PDM
A small-diameter PDM is used to drive the drill bit at high speeds for core drilling with a drilling fluid flow rate not exceeding 8.33 L·s−1. Assuming the theoretical output torque of the drill bit is , the working pressure drop of the PDM is , MPa; the flow rate entering the PDM is , m3·s−1; and the displacement per revolution of a single PDM is , L·s−1; and neglecting the friction of the PDM and drive shaft of the drill assembly, the hydraulic horsepower absorbed by the PDM is equal to its output power, expressed as follows:
where theoretical torque can be given as follows:
where theoretical rotary speed can be given as follows:
where theoretical power can be given as follows:
Based on the above analysis, the following conclusions can be drawn: (1) The rotary speed of the PDM is solely determined by the flow rate entering the PDM and the structure of the PDM itself, but it is independent of working pressure drop across the PDM. When the PDM structure is defined and the flow rate entering the PDM is constant, the rotary speed remains at a fixed value. (2) Both the theoretical torque and theoretical rotary speed of the PDM are related to its displacement per revolution . The larger the , the lower the rotary speed and the higher the torque.
4. HSBS Simulation
4.1. Model Parameter Setting and Mesh Generation
This study used Solidworks to construct the 3D model of the HSBS and then imported it into ANSYS Workbench 2022 for simulation. The HSBS was mainly composed of an upper shell, a bend sub, a shaft sleeve, and a lower shell. The specific technical parameters are shown in Table 3. During sliding drilling, the PDM drove the drill bit to rotate while the HSBS remained stationary. Weight on bit (WOB) acted on the end face of the upper shell, generating an axial load, and lateral forces were exerted at the bend point due to contact with the wellbore. During hybrid drilling, in addition to bearing loads similar to those in sliding drilling, the HSBS also rotated with the PDM, as it was additionally subjected to torque loads. For this simulation, global mesh control and triangular element meshing were selected, which could better adapt to complex geometries, facilitate mesh generation, closely approximate boundary shapes, and provide greater flexibility in handling complex problems. The mesh edge length was 50 mm, with a total of 14,343 nodes and 7397 elements generated, as shown in Figure 4. The minimum aspect ratio is 1.596, the maximum is 100.54, and the majority of the grid elements have an aspect ratio of 1.596. The Jacobian ranges from a minimum of 0.32295 to a maximum of 1, with an average value between 0.54863 and 0.69909. The skewness varies from 0.18708 to 1. A load sensitivity analysis was performed. A variation of ±10% in the weight on bit resulted in a change of merely −0.08% to +0.09% in the maximum equivalent stress and a corresponding change of only −0.08% to +0.07% in the maximum equivalent strain. This analysis demonstrates that our primary conclusions are robust to the uncertainty in the weight on bit. To simplify the model and improve computational efficiency, the following assumptions were made:
Table 3.
Technical parameters of HSBS.
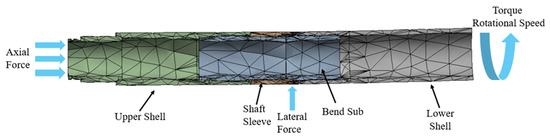
Figure 4.
Composition and mesh generation of HSBS.
- (1)
- The entire HSBS was regarded as a rigid body.
- (2)
- All deformations occurring during the simulation were assumed to be elastic deformations.
- (3)
- Factors such as temperature and vibration during the drilling process were neglected.
4.2. Effect of Different Angles on the Stress-Strain of HSBS
4.2.1. Stress–Strain Effects of Different Angles on HSBS in Sliding Drilling Mode
Due to the fact that HSBS needed to bear large forces and torque, considering material properties and processing costs, 42CrMo was finally selected after comprehensive evaluation. The performance parameters are shown in Table 4.
Table 4.
Performance parameters of 42CrMo, 40Cr, 35CrMo, and 30CrNiMo.
In practical applications of directional drilling, the adjustable range of bend angles for the HSBS was from 0° to 1.5°. The simulated angles selected were as follows: 0°, 0.5°, 1°, and 1.5°. An axial force of 20,000 N was applied to the end of the upper shell. In the Design Modeler module of ANSYS, a point load was applied to the position of the bend point. In the Mechanical module, a local coordinate system was set at the point load position, where the x-axis direction was the normal direction of the bend point, and the y-axis direction was perpendicular to the axial direction of the HSBS. A 5000 N axial force was applied along the y-axis direction. The lower shell was fixed for support, and the simulation time was 1 s.
In Figure 5, under identical loading conditions, the maximum equivalent stress and maximum equivalent strain for different bend angles were compared. Overall, as bend angles increased, both the maximum equivalent stress and strain showed an increasing trend. Figure 6 shows the equivalent stress and strain distributions of the HSBS under different bend angles during sliding drilling. It could be observed that as bend angle increased from 0° to 1.5°, positions and ranges of the maximum equivalent stress and strain remained basically consistent, located at the bend point. Taking the bend point as the center, the values of stress and strain decayed in a gradient along the periphery. However, when the bend angle was 0°, the maximum equivalent stress was 117.95 MPa, located in the edge area of the pin hole adjacent to the bend point, while the maximum equivalent strain was at the bend point. Analysis of this phenomenon showed that at 0°, since the HSBS was not bent, the effect of the axial force it experienced was significantly stronger than that of lateral force, making it a key factor dominating stress distribution in structures.
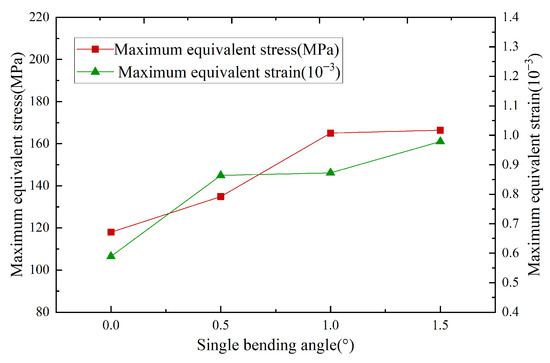
Figure 5.
Curves of maximum equivalent stress–strain at different bend angles in sliding drilling.
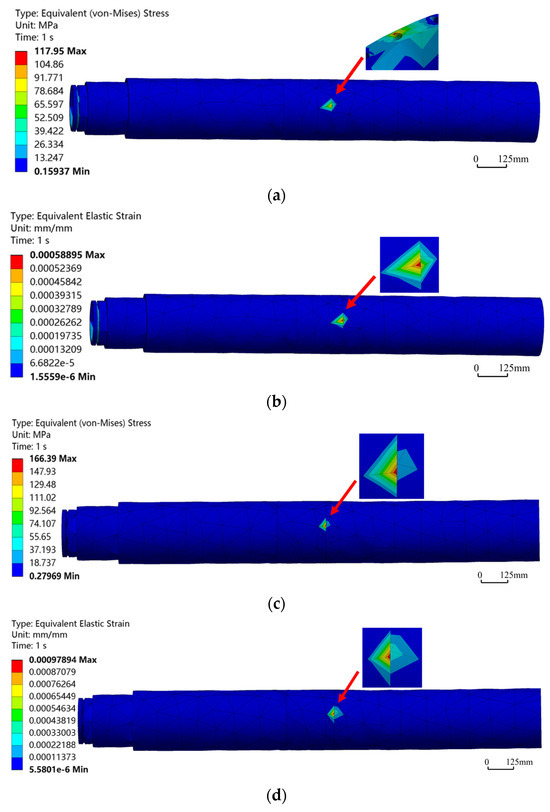
Figure 6.
Equivalent stress–strain contours of HSBS at different angles in sliding drilling mode. (a) Equivalent stress contour at bend angle of 0°; (b) Equivalent strain contour at bend angle of 0°; (c) Equivalent stress contour at bend angle of 1.5°; (d) Equivalent strain contour at bend angle of 1.5°.
When the bend angle was 1.5°, the maximum equivalent stress was 166.39 MPa, far less than the yield strength of 42CrMo. At this time, the maximum equivalent strain was 0.97894 × 10⁻³, with a safety factor of 5.6, indicating that HSBS deformations under different bend angles are all elastic deformations, meeting its operational requirements.
4.2.2. Stress–Strain Effects of Different Angles on HSBS in Hybrid Drilling Mode
In the process of hybrid drilling, the HSBS also rotated together with the PDM, which made the HSBS bear additional torque load. Its internal structure needed to meet the dual functional requirements of transmitting both axial force and torque. Compared with sliding drilling, an additional rotational speed of 200 r/min and a torque of 1000 N·m (both in the clockwise direction) needed to be applied in the Mechanical module. By comparing the curves in Figure 7, it can be seen that when other factors remain unchanged, the overall maximum equivalent stress and strain show a positive correlation with the bend angle. Observing equivalent stress and strain contours during hybrid drilling (Figure 8) revealed that as the bend angle increased from 0.5° to 1.5°, the positions and ranges of the maximum equivalent stress and strain remained essentially consistent, localized in the bend angle region, and gradually decreased outward. When the bend angle was 0°, due to axial force having a greater influence than lateral force, the maximum equivalent stress was located at the pin hole adjacent to the bend point. However, the maximum equivalent strain remained in the bend point region. When the bend angle was 1.5°, the maximum equivalent stress was 166.21 MPa, and the maximum equivalent strain was 0.97805 × 10⁻³. Both values were far below the yield strength of 42CrMo, indicating that the HSBS exhibited sufficient strength and safety reliability when operating at different adjusted angles within the specified working condition range.
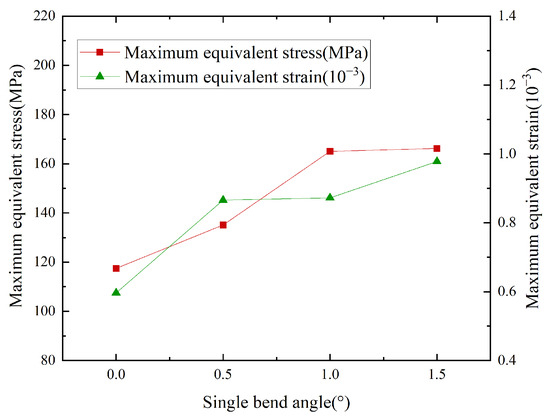
Figure 7.
Curves of maximum equivalent stress–strain at different bend angles in hybrid drilling.
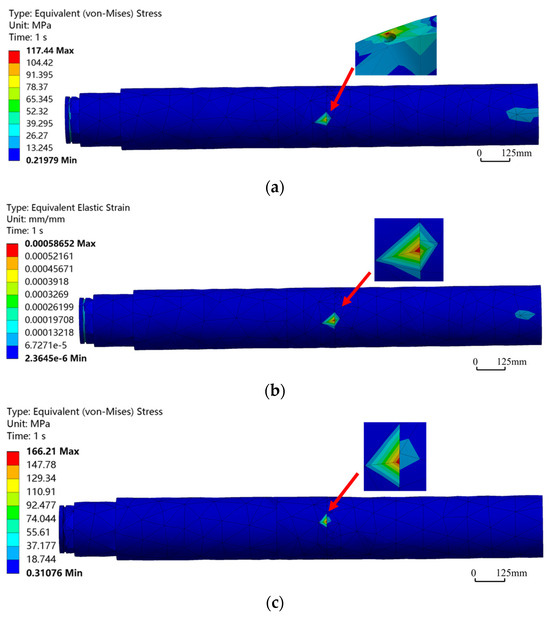
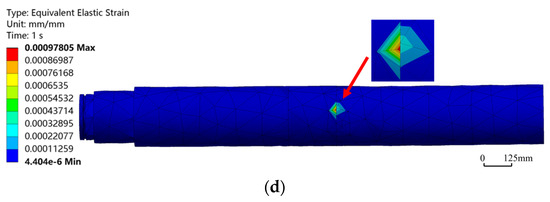
Figure 8.
Equivalent stress–strain contours of HSBS at different bend angles in hybrid drilling mode. (a) Equivalent stress contour at bend angle of 0°; (b) Equivalent strain contour at bend angle of 0°. (c) Equivalent stress contour at bend angle of 1.5°; (d) Equivalent strain contour at bend angle of 1.5°.
Comparison between Figure 5 and Figure 7 revealed that the variation laws of maximum equivalent stress and strain curves under different bend angles were highly consistent between sliding drilling and hybrid drilling. Comparison between Figure 6 and Figure 8 showed that the distributions of equivalent stress and strain contours were nearly identical, indicating significant commonalities in the mechanisms by which bend angles affected the mechanical responses of the HSBS under two drilling modes. Studies have shown that the weakest part of HSBS systems is concentrated at the bend point, which serves as the critical control location for the entire component. If performance indicators such as strength and stiffness at the bend point met the design requirements, the entire component could be ensured to safely and reliably fulfill its operational needs under actual working conditions.
4.3. Effect of Lateral Forces on Stress–Strain of HSBS
In both drilling modes, when the bend angle increased from 1° to 1.5°, the maximum equivalent stress and strain values increased marginally by only 0.7%, which was within the controllable range. Considering technical requirements of actual working conditions and market application preferences, a bend angle of 1° was a commonly used specification in industry. Based on the findings mentioned above, the bend angle of 1° would be selected as a reference parameter for subsequent simulation experiments. Given complex force interactions between the HSBS and the wellbore, the influence of lateral force variations on the sub must be considered. After reference and analysis, four sets of conditions—2500 N, 5000 N, 7500 N, and 10,000 N—had been selected for simulation experiments. As illustrated in Figure 9, stress–strain magnitude varied with lateral force, but their spatial distribution patterns remained invariant, validating the bend point as the critical stress control location under lateral loading. Comparison of the maximum equivalent stress and strain curves under different lateral forces (Figure 10) revealed that as the lateral force increases within the range of 2500 N to 10,000 N, the maximum equivalent stress and strain of the HSBS gradually increased with a relatively stable growth rate. Under the same lateral force, the growth trends of maximum equivalent stress and strain were essentially consistent. The correlation coefficient between stress and strain across all lateral forces was 0.98, confirming their strong linear relationship. When the lateral force was 2500 N, the maximum equivalent stress was 81.666 MPa. When the lateral force was 10,000 N, the maximum equivalent stress was 331.86 MPa, with a growth rate of 306.36%. When the lateral force increased from 2500 N to 10,000 N, the maximum equivalent strain significantly increased from 0.43256 × 10⁻³ to 1.7529 × 10⁻³, with a growth rate of 305.24%. This indicated that an increase in lateral force caused a sharp rise in stress, with a significant impact on the maximum equivalent strain. In actual working conditions, lateral force factors have to be fully considered to ensure that the mechanical properties of the HSBS meet the requirements and guarantee its operational safety and reliability.
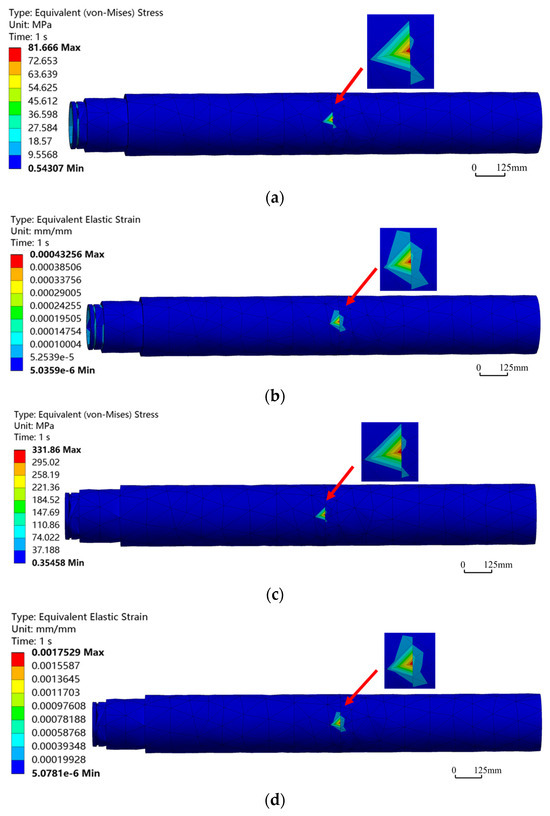
Figure 9.
Equivalent stress–strain contours of HSBS at different lateral forces. (a) Equivalent stress contour under 2500 N; (b) Equivalent strain contour under 2500 N; (c) Equivalent stress contour under 10,000 N; (d) Equivalent strain contour under 10,000 N.
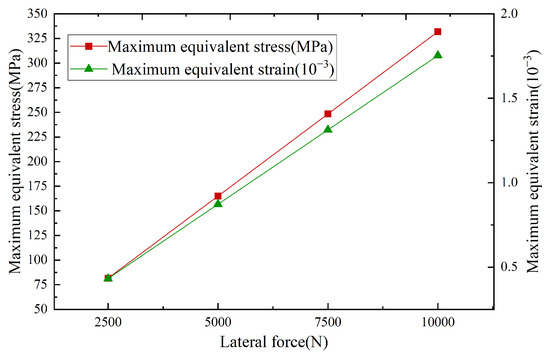
Figure 10.
Comparison of maximum equivalent stress–strain at different lateral forces.
4.4. Effect of Axial Force on Stress–Strain of HSBS
In actual drilling operations, formation conditions exhibited significant heterogeneity with depth, and geological characteristics at different depths varied markedly. To achieve drilling objectives, key technical parameters such as WOB had to be adjusted accordingly. Changes in WOB directly caused variations in the axial force endured by the HSBS, necessitating full consideration of the impact of axial force on its stress and strain. Taking a bend angle of 1° as an example, a comparison of the maximum equivalent stress and strain under different axial forces (in Figure 11) revealed that as axial force gradually increased, the maximum equivalent stress and strain decreased progressively. At 10,000 N axial force, the maximum equivalent stress reached 165.94 MPa; at 30,000 N, it decreased to 164.17 MPa, a difference of 1.77 MPa (−1.07%). For equivalent strain, the value dropped from 0.87635 × 10⁻³ at 10,000 N to 0.86888 × 10⁻³ at 30,000 N, a reduction of only 0.85% despite the significant 200% increase in axial force. Analysis of Figure 12 showed that under different axial forces, the distribution of equivalent stress and strain contours remained essentially consistent, with the maximum values consistently located at the bend point. This indicated that axial force had a minimal impact on the maximum equivalent stress and strain of the HSBS. In analysis of actual working conditions with multiple combined factors, the stress and strain fluctuations caused by axial force were at a lower level compared to other factors.
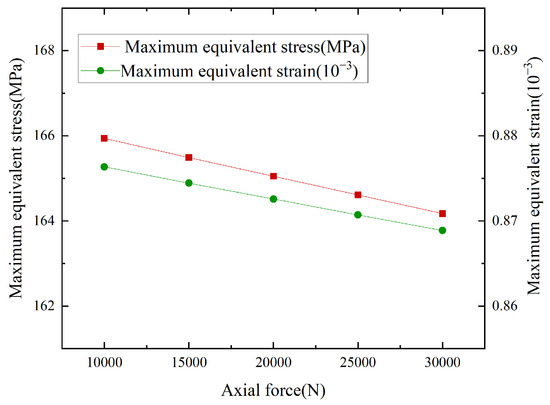
Figure 11.
Comparison of maximum equivalent stress-strain at different axial forces.
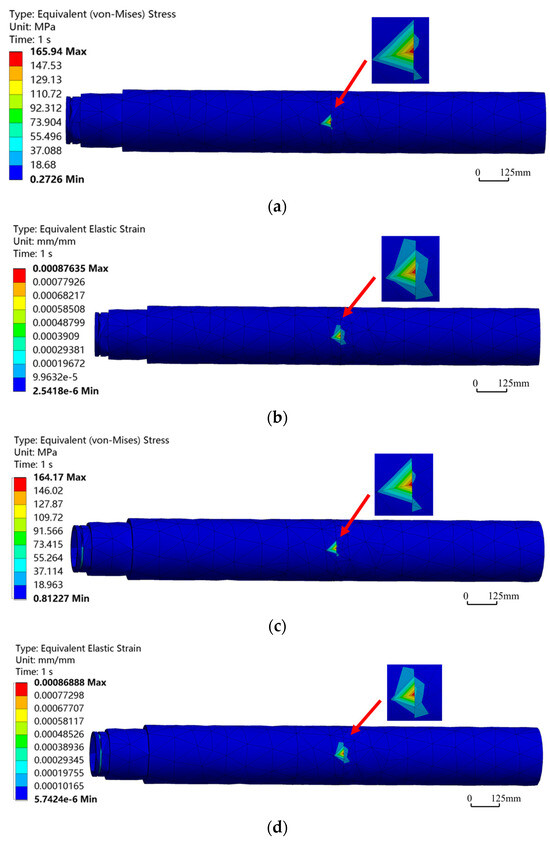
Figure 12.
Equivalent stress–strain contours of HSBS at different axial forces. (a) Equivalent stress contour at 10,000 N; (b) Equivalent strain contour at 10,000 N; (c) Equivalent stress contour at 30,000 N; (d) Equivalent strain contour at 30,000 N.
5. Experiments and Discussion
5.1. DCDT Assembly Tests
According to the above simulation analysis, the HSBS was optimized, and the following MWD, HSBS, alloy bearings, PDC bearings, inner tube assembly, outer tube assembly, PDM, and core drilling bit were test-fabricated (in Figure 13). After assembling the above parts, the DCDT prototype was formed. The length error of the DCDT was found to be 8 mm after assembly, which can be eliminated by adjusting the screw to realize the position fixation of inner and outer tube assemblies.
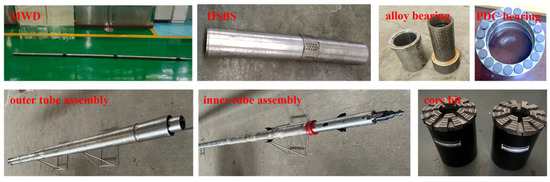
Figure 13.
Key components of DCDT prototype.
5.2. Platform Tests
After the DCDT assembly was completed, the test platform was conducted to check DCDT performance. The test platform (Figure 14) primarily consisted of a data acquisition computer, power control box, mud pump, pressure sensor, current sensor, torque sensor, drilling fluid pit, magnetic particle brake, RPM sensor, connection shaft, recovery tank of drilling fluid, DCDT prototype, and supports. The magnetic particle brake regulated torque applied to the drill bit by adjusting current intensity, thereby enabling testing of rotary speed and pressure drop variations in the PDM under different torque conditions. The data acquisition computer was utilized to monitor real-time changes in torque, pressure, and rotary speed during testing processes, while also managing activation and deactivation of the entire test system. The mud pump had a maximum flow rate of 13.33 L·s−1, and its flow could be continuously adjusted through a power control box for any desired flow rate. The DCDT prototype was securely fixed using three supports to minimize vibrations during tests. As illustrated in Figure 15, output torque, rotary speed, and brake current showed regular fluctuations with pump pressure changes. When pump pressure increased, the system demonstrated significant load response characteristics: output torque showed a marked increasing trend, while rotary speed decreased slightly, accompanied by a corresponding increase in brake current. When pump pressure fluctuated in the range of 1.7 to 1.9 MPa, the maximum rotary speed was 155 r·min−1. However, within this range, both output torque and brake current showed the minimum values, which were 106.3 N·m and 0.42 A, respectively. When pump pressure fluctuated within the range of 2.5 to 2.7 MPa, the minimum rotary speed was 145 r·min−1. Meanwhile, output torque and brake current reached their peak values, which were 226.8 N·m and 0.58 A, respectively. The test results demonstrated that the DCDT prototype could work well and also confirm feasibility of small-diameter and high-speed PDM designs. This effectively addressed the challenge of insufficient downhole power in small-diameter DCDTs.
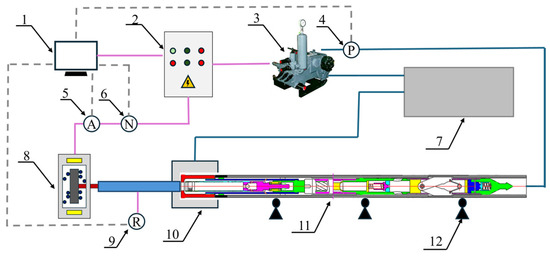
Figure 14.
The experiment platform of DCDT. 1. data acquisition computer; 2. power control box; 3. mud pump; 4. pressure sensor; 5. current sensor; 6. torque sensor; 7. drilling fluid pit; 8. magnetic particle brake; 9. RPM sensor; connection shaft; 10. recovery tank of drilling fluid; 11. DCDT prototype; 12. supports.
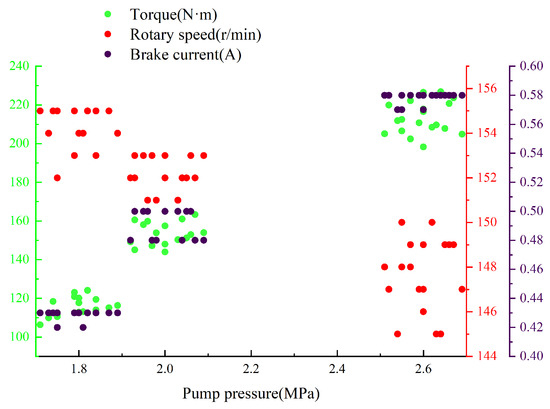
Figure 15.
PDM rotary speed and torque changes under different pressures.
5.3. Core Drilling Tests of DCDT
According to the above tests, the core drilling tests were carried out. Drilling operation was performed using the XY-4 fully hydraulic drill rig, equipped with a DW850/7 mud pump. In addition, 114-specification wire-line drill rods were used. Slide drilling and hybrid drilling were used to test the effects of drilling and coring, respectively, in which the angle of the HSBS in slide drilling was 1°, and the drilling stratum was diagonally long angular flash gneiss, located near the gold mine. Drilling parameters were as follows (Table 5): flow rate of mud pump ranged from 5.83 L·s−1 to 6.67 L·s−1, with pump pressure of 1 MPa to 5 MPa. The rotary speed of the drill rig varied between 40 r/min and 120 r·min−1, and WOB was from 0.5~3.5 t. Core drilling speeds ranged from 0.95 m·h−1 to 1.7 m·h−1, with a total drilling depth of 6.65 m and a total core length of 5.15 m obtained (Figure 16). Among hybrid drilling processes, core recovery rate was higher, and the maximum recovery rate was 91.67%. In the slide drilling process, the core recovery rate was only 55–60%, which was mainly due to the fact that in the deflectional process, parts of the cores were ground off by the drill bit and could not be obtained. After measurement, the top angle of the drill hole changed from 0.5° to 1.0°, and the build-up rate was calculated to be 7.5°/30 m.
Table 5.
The drilling parameters of DCDT.
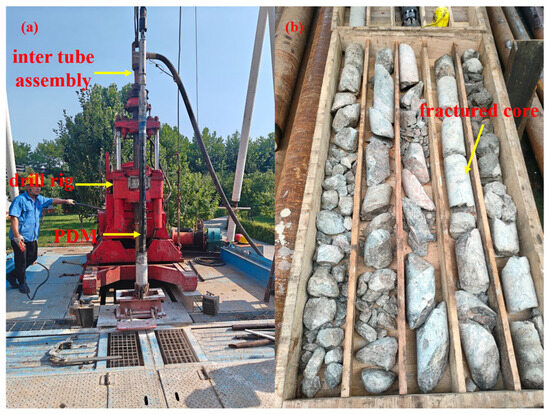
Figure 16.
Core drilling tests and recovered core samples. (a) Field trial; (b) Acquired core samples.
6. Conclusions
- (1)
- In response to the demand for resource exploration and reserve expansion of submarine mineral resources, the structure and processes of DCDTs were proposed. By utilizing wire-line coring, this method enables continuous core retrieval during directional drilling, facilitating precise acquisition of three-dimensional subsurface core samples.
- (2)
- Through simulation, the impacts of the bend angle, lateral force, and axial force on the stress–strain of the HSBS system during slide/hybrid drilling were analyzed. The results revealed the following: ① an increase in the bend angle led to a corresponding rise in the maximum equivalent stress and strain, with the bend point identified as a vulnerable weak zone. ② Notably, lateral force proved to be a critical determinant, while the effect of axial force was found to be negligible. These findings show that it is very necessary to place emphasis on lateral force in drilling processes. And reinforcement design should be carried out in the stress–strain concentration area.
- (3)
- Through the platform tests and core drilling experiments of the DCDT prototype, the results indicated that DCDT performance was well and had the conditions for drilling experiments. The total length of obtained cores was 5.15 m. In hybrid drilling processes, the maximum recovery rate was 91.67%, while the core recovery rate was only 55–60% in slide drilling processes, and the calculated build-up rate could reach 7.5°/30 m. These studies provide technical support for the optimization and improvement of directional continuous coring drilling technology.
- (4)
- Although the initial tests successfully obtained directional cores, the number of tests was relatively small, and possible problems in the durability and fatigue resistance of DCDTs could not be revealed yet. Therefore, in the next step, we need to carry out more experiments to test its performance.
Author Contributions
Conceptualization, Y.W. and X.L.; methodology, X.L.; software, Y.W.; validation, J.C. (Junda Chen), Q.Z., and J.C. (Jiabao Chou); formal analysis, Y.W.; investigation, Q.Z.; resources, X.L. and Y.M.; data curation, Y.W.; writing—original draft preparation, Y.W.; writing—review and editing, X.L.; supervision, S.S.; project administration, Y.M.; funding acquisition, X.L. All authors have read and agreed to the published version of the manuscript.
Funding
This research was funded by the National Key Research and Development Program of China (Grant No. 2021YFC2900200) and the National Natural Science Foundation of China (Grant No. 42102352).
Data Availability Statement
Data will be made available on request.
Conflicts of Interest
The authors declare that they have no known competing financial interests or personal relationships that could appear to influence the work reported in this paper.
Abbreviations
The following abbreviations are used in this manuscript:
| DCDT | Directional coring drilling tool |
| HSBS | Hollow single bend sub |
| PDM | Positive displacement motor |
| MWD | Measurement while drilling |
| BHA | Bottom hole assembly |
| WOB | Weight on bit |
References
- Tuo, S.; Wang, W. International Scientific Ocean Drilling 2050 Science Framework and Its Implications for Future Scientific Ocean Drilling Development. Adv. Earth Sci. 2022, 37, 1049–1053. [Google Scholar]
- Yang, J.; Li, L.; Song, Y.; Tong, G.; Zhang, M.; Zhang, H. Current status and prospects of offshore oil and gas drilling technology development in China. Acta Pet. Sin. 2023, 44, 2308–2318. [Google Scholar]
- Cheng, H.; Zhang, Y.; Wang, Y.; Liu, C. Progress and understanding on geology-drilling engineering-mechanics coupling mechanism of ultra-deep directional wells. Pet. Reserv. Eval. Dev. 2024, 14, 593–599. [Google Scholar]
- Li, X.; Xiong, L.; Xie, W.; Gao, K.; Shao, Y.; Chen, Y.; Yu, Y.; Kou, B.; Lu, Q.; Zeng, J.; et al. Design and Experimental Study of Core Bit for Hard Rock Drilling in Deep-Sea. J. Mar. Sci. Eng. 2023, 11, 306. [Google Scholar] [CrossRef]
- Freudenthal, T.; Wefer, G. Shallow Drilling in the Deep Sea: The Sea Floor Drill Rig MEBO. In Proceedings of the OCEANS 2009—Europe Conference, Bremen, Germany, 11–14 May 2009; pp. 11–14. [Google Scholar]
- Zeng, Z.; Qin, Y. Contribution of Ocean Drilling to the Study of Seafloor Hydrothermal Activity. Adv. Earth Sci. 2003, 18, 764–772. [Google Scholar]
- Song, J.; Ran, F.; Fang, Q.; Tian, P.; Zhang, H. The small-bore directional branch drilling technology in gold exploration of Zhenfeng County, Guizhou Province. Geol. Explor. 2024, 60, 1217–1227. [Google Scholar]
- Allouche, E.N.; Biggar, K.W.; Ariaratnam, S.T. Application of horizontal directional drilling for contaminated site characterization. In Proceedings of the 1st International Conference on Site Characterization (ISC 98), Atlanta, Georgia, 19 April 1998; pp. 341–346. [Google Scholar]
- Gao, D. Some research advances in well engineering technology for unconventional hydrocarbon. Nat. Gas Ind. 2021, 41, 153–162. [Google Scholar] [CrossRef]
- Yao, K.; Li, Q.; Fang, J.; Fang, P.; Wang, L.; Tian, D.; Chen, L.; Xu, C. Research on rotary geo-steering drilling technology and equipment in underground coal mine. Coal Sci. Technol. 2022, 50, 36–42. [Google Scholar]
- Li, Q.; Shi, Z.; Shi, H. The Application of directional drilling technology in coal mine. Coal Geol. Explor. 2014, 42, 85–88+92. [Google Scholar]
- DEVICO AS. Lockable Core Barrel Head for Drilling System and Survey Instrument Assembly Provided with a Connection Link for Arrangement in a Drilling System; DEVICO AS: Gatineau, QC, Canada, 2011; CA 2779932. [Google Scholar]
- DEVICO AS. Orientation System for Down-Hole Device; DEVICO AS: Gatineau, QC, Canada, 2022; CA 3204576. [Google Scholar]
- Shinmoto, Y.; Miyazaki, E.; Wada, K.; Yamao, M. Development of a continuous directional coring system for deep-sea drilling. SPE Drill. Complet. 2012, 27, 139–144. [Google Scholar] [CrossRef]
- Tsang, C.K.; Chau, S.F.; Chan, J. Sub-sea horizontal directional coring(HDC). Geo-Tech. Eng. 2016, 47, 31–36. [Google Scholar]
- Guo, Z.; Gao, D. An analysis of the bottom hole assembly(BHA) in directional drilling by considering the effects of the axial displacement. Comput. Model. Eng. Sci. 2013, 90, 65–76. [Google Scholar]
- Feng, T.; Kim, I.; Chen, D. Dynamic modeling of directional drill-string: A linearized model considering well profile. J. Dyn. Syst. Meas. Control. 2018, 140, 061005. [Google Scholar] [CrossRef]
- Shi, Z.; Dong, S.; Yang, J.; Xu, C.; Hao, S.; Li, Q.; Yao, K.; Liu, J.; Tian, D. Key technology of drilling in-seam directional borehole of 3000 m in underground coal mine. Coal Geol. Explor. 2019, 47, 2. [Google Scholar]
- Hu, H.; Chen, Q. RMRS Application on Target-Hitting of Horizontal Drilling. Geol. Prospect. 2008, 44, 89–92. [Google Scholar]
- Wu, J.; Huang, X.; Jiang, B. Research and application of horizontal wire-line directional deviation correction while drilling. Coal Geol. Explor. 2021, 49, 260–264. [Google Scholar]
- Zhang, J.; Liang, Z.; Han, C. Failure analysis and finite element simulation of key components of PDM. Eng. Fail. Anal. 2014, 45, 15–25. [Google Scholar] [CrossRef]
- Lu, Q.; Yu, Y.; Xiong, L.; Wang, S.; Yu, H. Analysis and Treatment for Accidents of the Broken Wire-Line Coring Pipe in Reinforced Deflecting. Geol. Explor. 2020, 56, 445–450. [Google Scholar]
- Liu, Y.; Lian, Z.; Xia, C.; Qian, L.; Liu, S. Fracture failure analysis and research on drive shaft of positive displacement motor. Eng. Fail. Anal. 2019, 106, 104–145. [Google Scholar] [CrossRef]
- Rodríguez, R.; Fernández, V.; Bascompta, M.; Garcia-Gonzalez, H. Directional core drilling as an approach to reduce uncertainty in tunneling construction. Appl. Sci. 2023, 13, 10998. [Google Scholar] [CrossRef]
- Boden, A.; Bridges, G.; Kin, C.; Xu, J. Experience of horizontal directional coring in Hong Kong. In Proceedings of the Institution of Civil Engineers-Civil Engineering. Thomas Telford Ltd. 2018, 171, 179–185. [Google Scholar]
- Ali, M.; Hegazy, G.M.; Aftab, M.N.; Negm, A.M.; Syed, A.A.; Anis, A.-H.; Schipper, B. First wireline and elevated pressure coring in UAE-saved 30% of coring time for shallow reservoirs & delivered realistic fluids and gas saturations. In Proceedings of the Abu Dhabi International Petroleum Exhibition and Conference, SPE, Abu Dhabi, United Arab Emirates, 10–13 November 2014; p. D011S011R005. [Google Scholar]
- Wang, F.; Ren, T.X.; Hungerford, F.; Tu, S.; Aziz, N. Advanced directional drilling technology for gas drainage and exploration in Australian coal mines. Procedia Eng. 2011, 26, 25–36. [Google Scholar] [CrossRef]
- Wei, H.; Yin, X. Wire-line coring drilling tool and pipe used in nearly horizontal boreholes in tunnel. Coal Geol. Explor. 2011, 39, 74–76. [Google Scholar]
- Karisson, H.; Brassfield, T.; Kueger, V. Perfomance drilling optimization. In Proceedings of the SPE/IADC Conference, New Orleans, LA, USA, 5–8 March 1985; p. 13474. [Google Scholar]
- Karisson, H.; Cobbley, R.; Jaques, G.E. New developments in short medium and long-radius lateral drilling. In Proceedings of the SPE/IADC Conference, New Orleans, LA, USA, 28 February–3 March 1989; p. 18706. [Google Scholar]
- Hassen, B.R.; MacDonald, A.J. Field comparison of medium and long-radius horizontal wells drilled in the same reservoir. In Proceedings of the IADC/SPE Conference, Houston, TX, USA, 27 February–2 March 1990; p. 19986. [Google Scholar]
- Su, Y.; Tang, X.; Gao, L. Problem of double and triple bent PDM equivalent to single bent PDM. Acta Pet. Sin. 2002, 23, 77–81. [Google Scholar]
- Su, Y.; Chen, Y.; Zhao, J.; Zhang, H. Analysis and design of articulated downhole motor assembly for short radius horizontal drilling. In Proceedings of the International Meeting on Petroleum Engineering, SPE, Beijing, China, 14–17 November 1995; Volume 2, p. 29977. [Google Scholar]
- Liu, X.S. New technique calculates borehole curvature, torsion. Oil Gas J. 2006, 104, 41–49. [Google Scholar]


Disclaimer/Publisher’s Note: The statements, opinions and data contained in all publications are solely those of the individual author(s) and contributor(s) and not of MDPI and/or the editor(s). MDPI and/or the editor(s) disclaim responsibility for any injury to people or property resulting from any ideas, methods, instructions or products referred to in the content. |
© 2025 by the authors. Licensee MDPI, Basel, Switzerland. This article is an open access article distributed under the terms and conditions of the Creative Commons Attribution (CC BY) license (https://creativecommons.org/licenses/by/4.0/).