1. Introduction
Industrial robotics is generally considered one of the key sectors of industrial automation, most commonly used in engineering but also in fields such as medicine, the military, biomechanics, and others [
1]. Industrial robots are widely applied in various tasks, often replacing human labour. Over the past decade, the number of industrial robot applications has increased dramatically, indicating the potential for robotics, with implementations expected to continue growing in the future [
2]. Robotic arms have undergone numerous changes and modifications since their inception, improving their manoeuvrability and efficiency in performing manipulation tasks in the engineering industry. Initially, robotic arms were used for simpler tasks, relieving workers from strenuous and repetitive work. Over time, they have been applied to more complex tasks in industries such as engineering and automotive manufacturing [
3].
Robotic arms quickly found their place in the automotive industry, especially in specific applications such as assembling various components and more precise tasks like welding individual car body parts [
4], followed by spraying the welded body [
5]. With the increasing complexity of these applications, collaborative robotics emerged, involving the cooperation of multiple robots to achieve common goals. This developing field has significant potential to transform industrial processes [
6]. In addition to using multiple robots in applications, robotics has expanded to areas where robots are equipped with external devices for environmental sensing through industrial cameras [
7]. These cameras help robots recognise and determine their position in space, detect obstacles or loads to be moved, and correctly position parts into other components.
In the engineering industry, industrial robotics was initially used for basic tasks and pick-and-place applications, where six-axis industrial robots provided wide manoeuvrability within their extensive workspaces [
8]. Over time, robotics has evolved, particularly in handling tasks, utilising its potential for moving and positioning workpieces into machining tools, such as clamping and removing workpieces from CNC machine spindles.
Today, robotics has advanced to a higher level, with researchers striving to integrate robots directly into machining processes such as milling, drilling, and grinding [
4,
9].
In most cases, robotic arms were initially implemented for machining processes with low loads, generating minimal cutting forces. Processes like grinding, polishing, and drilling produce low cutting forces, as they typically remove small amounts of material and apply minimal abrasive force. The main goal of polishing operations is not to alter the shape of a structure but to improve its surface, meaning these operations do not require high positional accuracy. Later, robotic arms began to be used for more complex and demanding applications, such as removing larger volumes of material. Robotic machining is a newer application of industrial robots, offering a larger working area at lower costs, though with reduced precision. Robotic arms are commonly used in milling machining processes that do not involve heavy machining loads or require high tool path accuracy. Consequently, robotic machining is often applied to softer, lighter materials that do not generate significant machining forces [
10,
11]. The biggest obstacle to the full implementation of robotic arms in machining is their limited rigidity, which affects both their precision and repeatability. These factors are significantly lower compared to conventional machining tools [
12]. The rigidity of an industrial articulated robot is approximately 1 N/μm, which is several times lower than that of a standard CNC machine, typically around 50 N/μm. This lack of rigidity, combined with cutting forces, leads to deformations in the end-effector, causing vibrations, poor surface quality, and reduced geometric accuracy during machining. In some cases, end-effectors experience deflections of up to 10 mm when working on parts. Manufacturers are focusing on reducing these end-effector deviations during machining by improving the robot’s rigidity or applying special control algorithms. To enhance the manipulator’s rigidity, engineers either increase the cross-section of the robot’s joints or use modern composite materials. However, the first approach increases the mass of the moving parts, which reduces the robot’s dynamic properties. This low rigidity significantly impacts the quality of the machined surface due to increased vibrations in the entire robotic structure during milling [
13,
14]. To some extent, vibrations occur in all machining processes. If not properly controlled, they can lead to poor surface quality, low productivity, tool wear, and damage. The natural frequency of robotic arms typically ranges from 10 to 20 Hz, which is lower than that of CNC machines. Given that cutting forces in machining are periodic and can sometimes change unpredictably, the occurrence of vibrations or chatter is not surprising.
Machining vibrations can be categorised into two types: forced vibrations and self-excited chatter. Forced vibrations are primarily caused by time-varying external disturbances, such as the regular interaction of the cutter’s teeth with the workpiece. Once the main source of these vibrations is identified, they can often be easily mitigated or even eliminated. Chatter, on the other hand, causes instability in the machining process and is more undesirable and harder to control compared to forced vibrations. In their study, Tlustý and Poláček [
10] identified two major sources of self-excited vibrations: regenerative chatter and mode-coupling chatter.
These parameters of the robotic arm are closely interconnected and determined by the specific kinematics of the arm. In our experiment, we used a six-axis industrial robot. These robots, also known as articulated robots, are defined by their rotary joints, often referred to as axes. Each axis is powered by servomotors, and every joint provides one degree of freedom, corresponding to an independent motion of the robot. The axes are typically arranged in a chain so that each axis supports the next along the robot’s structure. The structure of an articulated robot starts with a base, which is perpendicular to the ground and contains the first rotary joint. Through this joint, the robot’s main body is connected to the base. The next rotary joint is located at the end of the main body, linking it to the robot’s arm. Further joints or axes are found at the end of the arm, connecting the robot’s wrist to the end-effector. This robotic design closely mimics the movement of a human arm. Articulated robots offer more degrees of freedom than any other type of robot, with a wide range of motion that closely follows human movements, making them ideal for many applications [
15]. Their adaptability to changes in the production process or workpieces makes them highly versatile. The enhanced motion allows robots to operate in a larger workspace, enabling them to handle various workpieces, from small to large. Additionally, they are capable of performing a wide range of tasks, such as arc welding, material handling, assembly, part transfer, pick and place, packaging, machine loading, and palletising, among others.
The milling process is a growing area of interest, attracting more and more researchers. Although robotic arms cannot compete with CNC machines in terms of precision, repeatability, and, most notably, rigidity, their key advantages lie in their larger working space, manoeuvrability, and, above all, lower acquisition costs. The working space and versatility of robotic arms make them particularly useful in manufacturing more complex part geometries [
16]. While CNC machines would produce higher-quality parts, achieving the necessary kinematics for five-axis milling would require modifications, increasing production costs. In robotic milling, the main advantage is the ability to create topologically optimised parts for prototype production [
16]. The main objective of this article is to investigate the influence of key technological parameters on the resulting surface quality of the machined Corian material using an industrial robotic arm. Corian exhibits a homogeneous and isotropic structure, ensuring stable behaviour during chip-forming machining. Its material properties minimise process variability, enabling a more reliable assessment of the effects of technological parameters without the presence of confounding factors. Corian is also commonly used in robotic milling, particularly in the production of design surfaces, prototype parts, and geometrically complex components, making it a suitable and representative material for this type of research. This article presents the results of preliminary screening experiments that examine the relationship between various technological parameters and surface quality. Additionally, this study investigates the impact of tool vibration on the machined surface. This article concludes by identifying the technological parameters that will be influential in developing the main experimental plan for robotic milling.
2. Materials and Methods
2.1. Industrial Robotic Arm IRB 1100
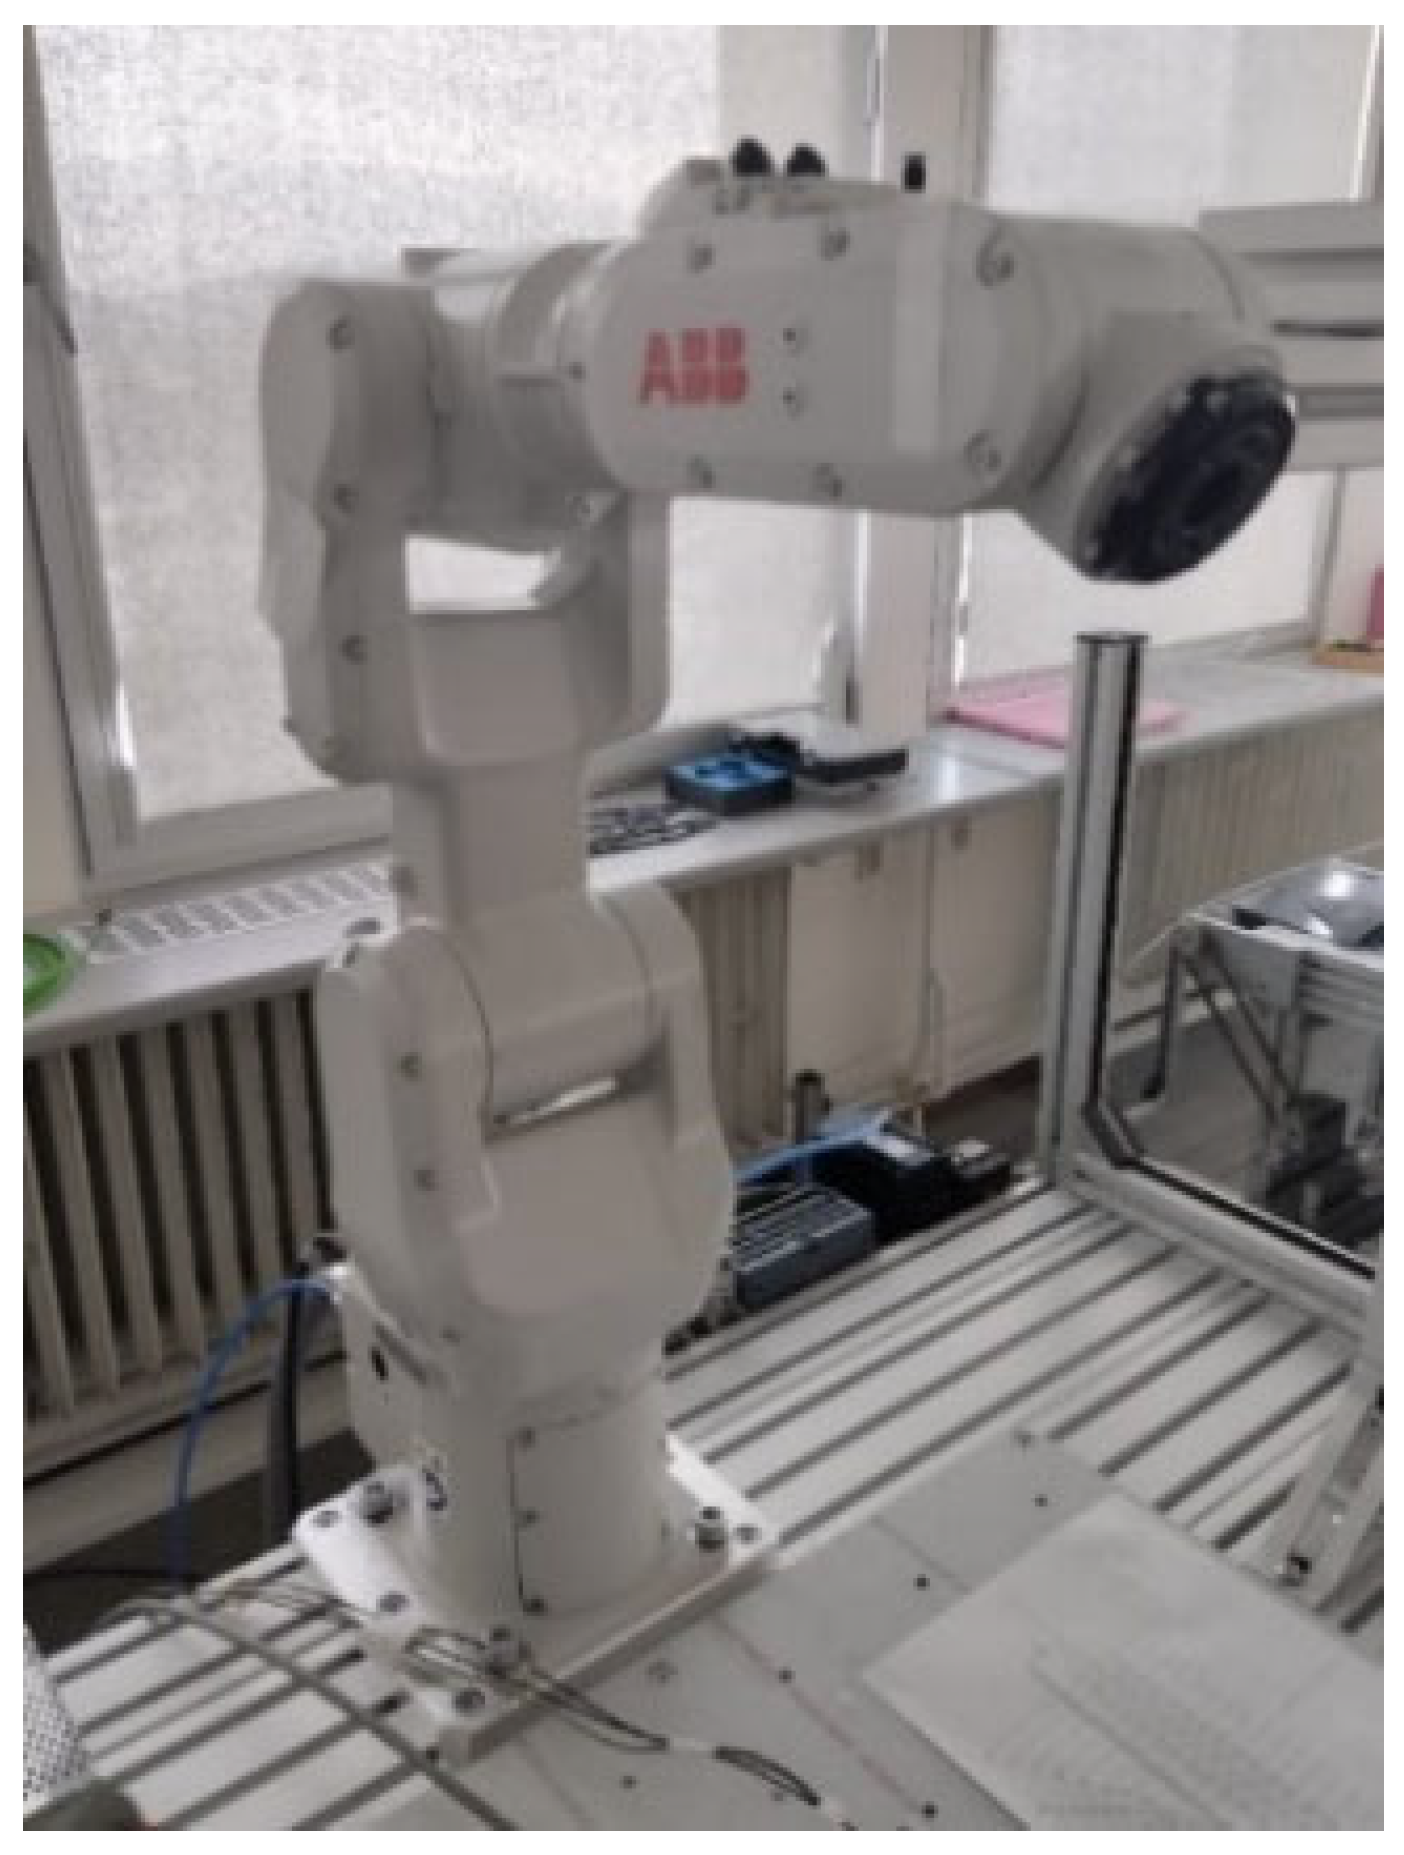
The robotic industrial arm used in the screening experimental research was from ABB, s.r.o. (Bratislava, Slovakia) specifically the industrial robot designated as IRB 1100, as shown in
Figure 1.
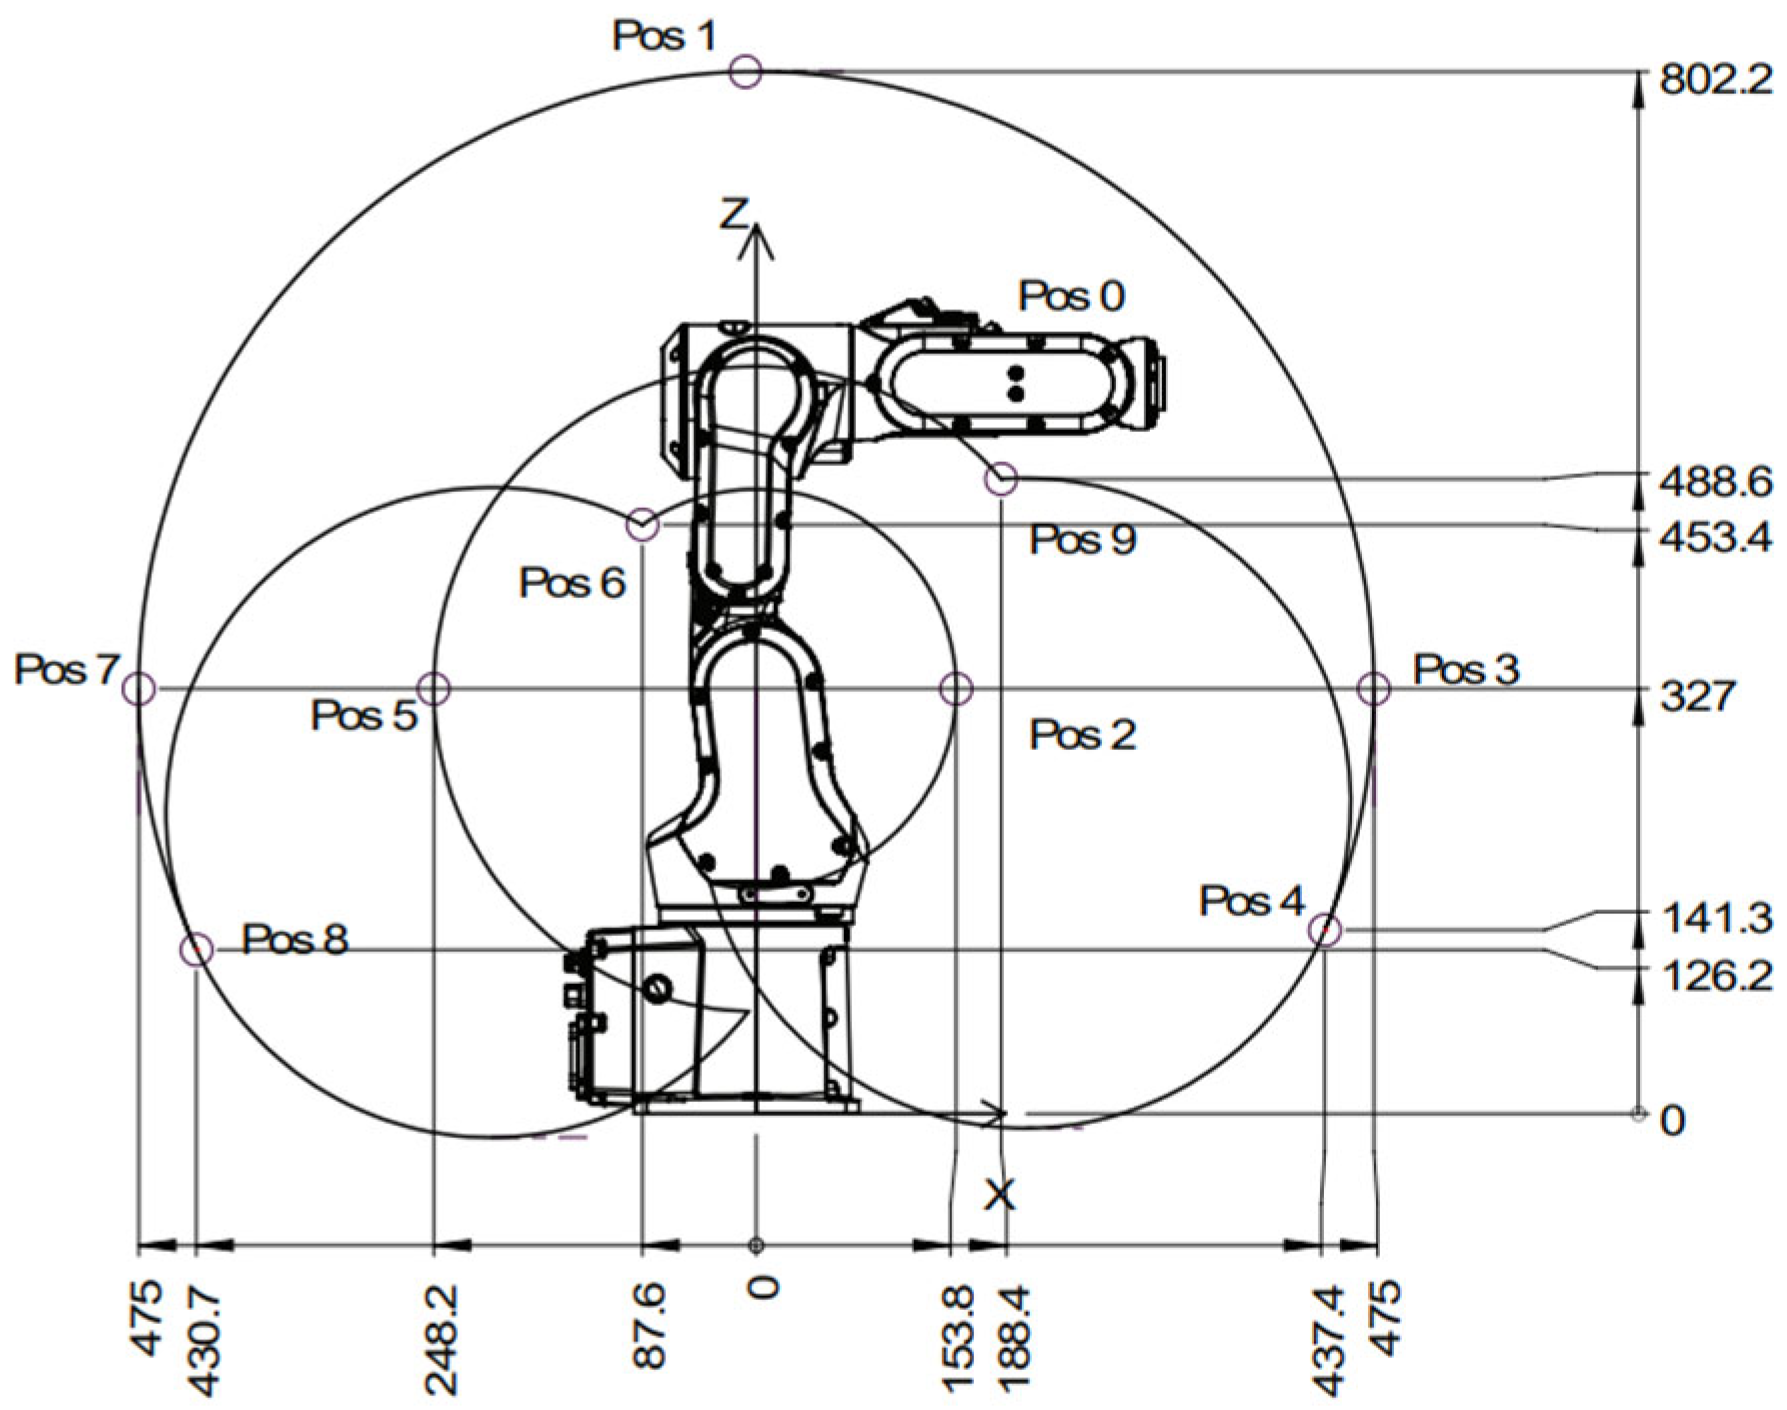
The working range of the robotic arm (working envelope) at the maximum extension of the Tool Centre Point (TCP) of the last sixth axis is 0.58 m, as illustrated in the following
Figure 2. In
Table 1, we can see the maximum values for the positions of the wrist’s midpoint in the X and Z axes, as well as the maximum rotation of each axis.
The robot has a payload capacity of 4 kg at the end effector. The payload capacity was considered a significant parameter when selecting the experimental spindle and designing the mounting joint that allows for the attachment of the spindle to the robotic arm. The robotic arm features mounting holes for additional equipment and the attachment of extra payloads. The maximum allowable load on the arm depends on the centre of gravity, the load on the arm, and the robot’s payload capacity. The value of the maximum external load is 0.5 kg. The attachment of the additional payload was used for routing cables, whether from the experimental spindle or from sensors.
2.2. Experimental Milling Spindle
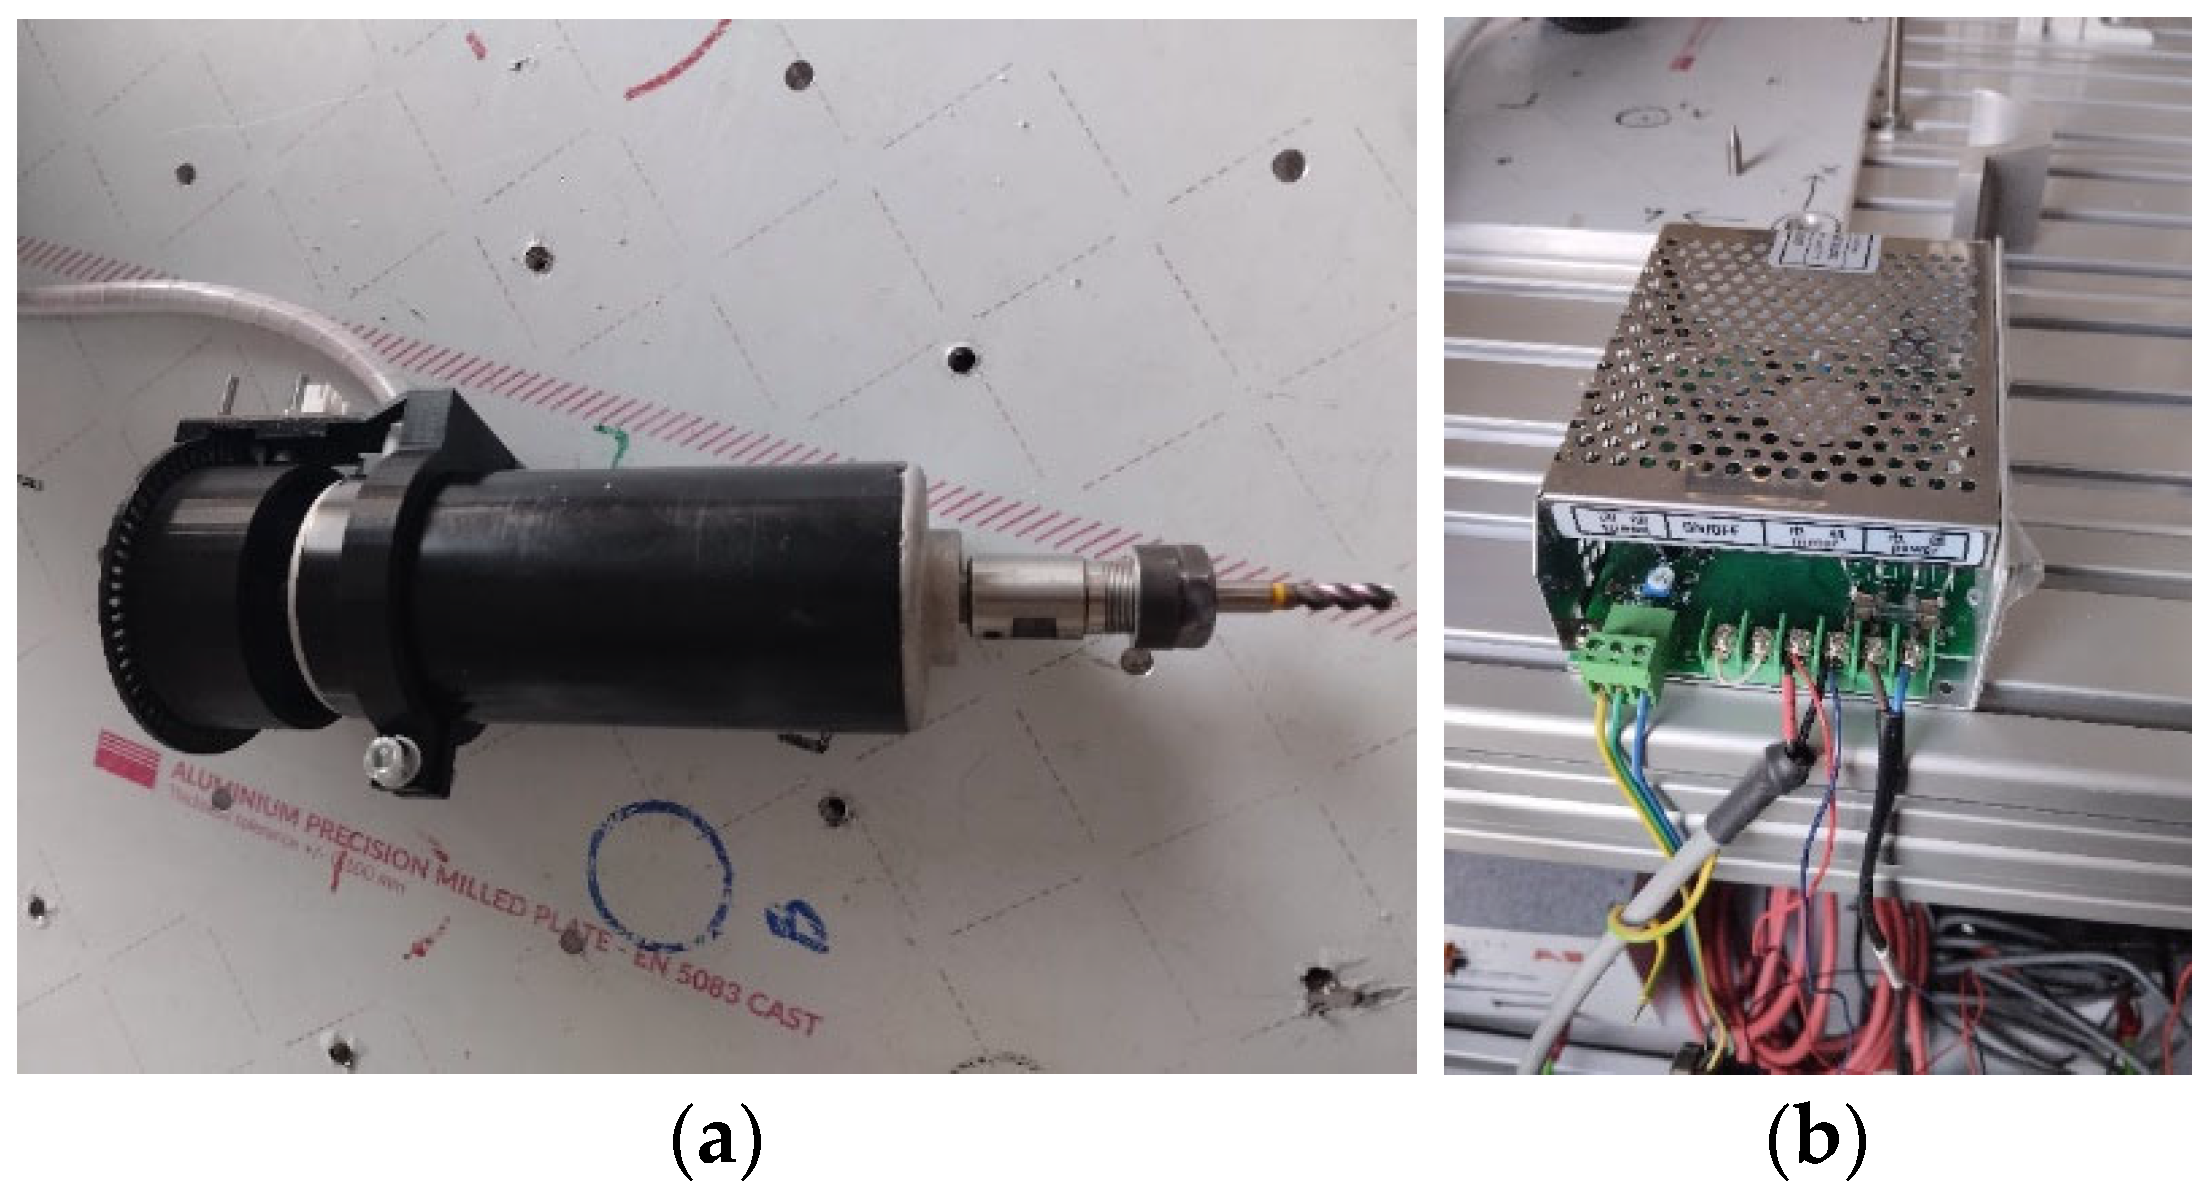
In the screening experiments, a spindle with a power of 500 W, air-cooled (
Figure 3), was used. The spindle speed is variable and can be regulated through a voltage converter in the range of 1000 to 12,000 RPM using a potentiometer. The spindle also includes a set of collets, allowing for the attachment of various diameters of cutting tools. The individual technical parameters of the spindle can be seen in
Table 2.
2.3. Material of Milled Workpiece
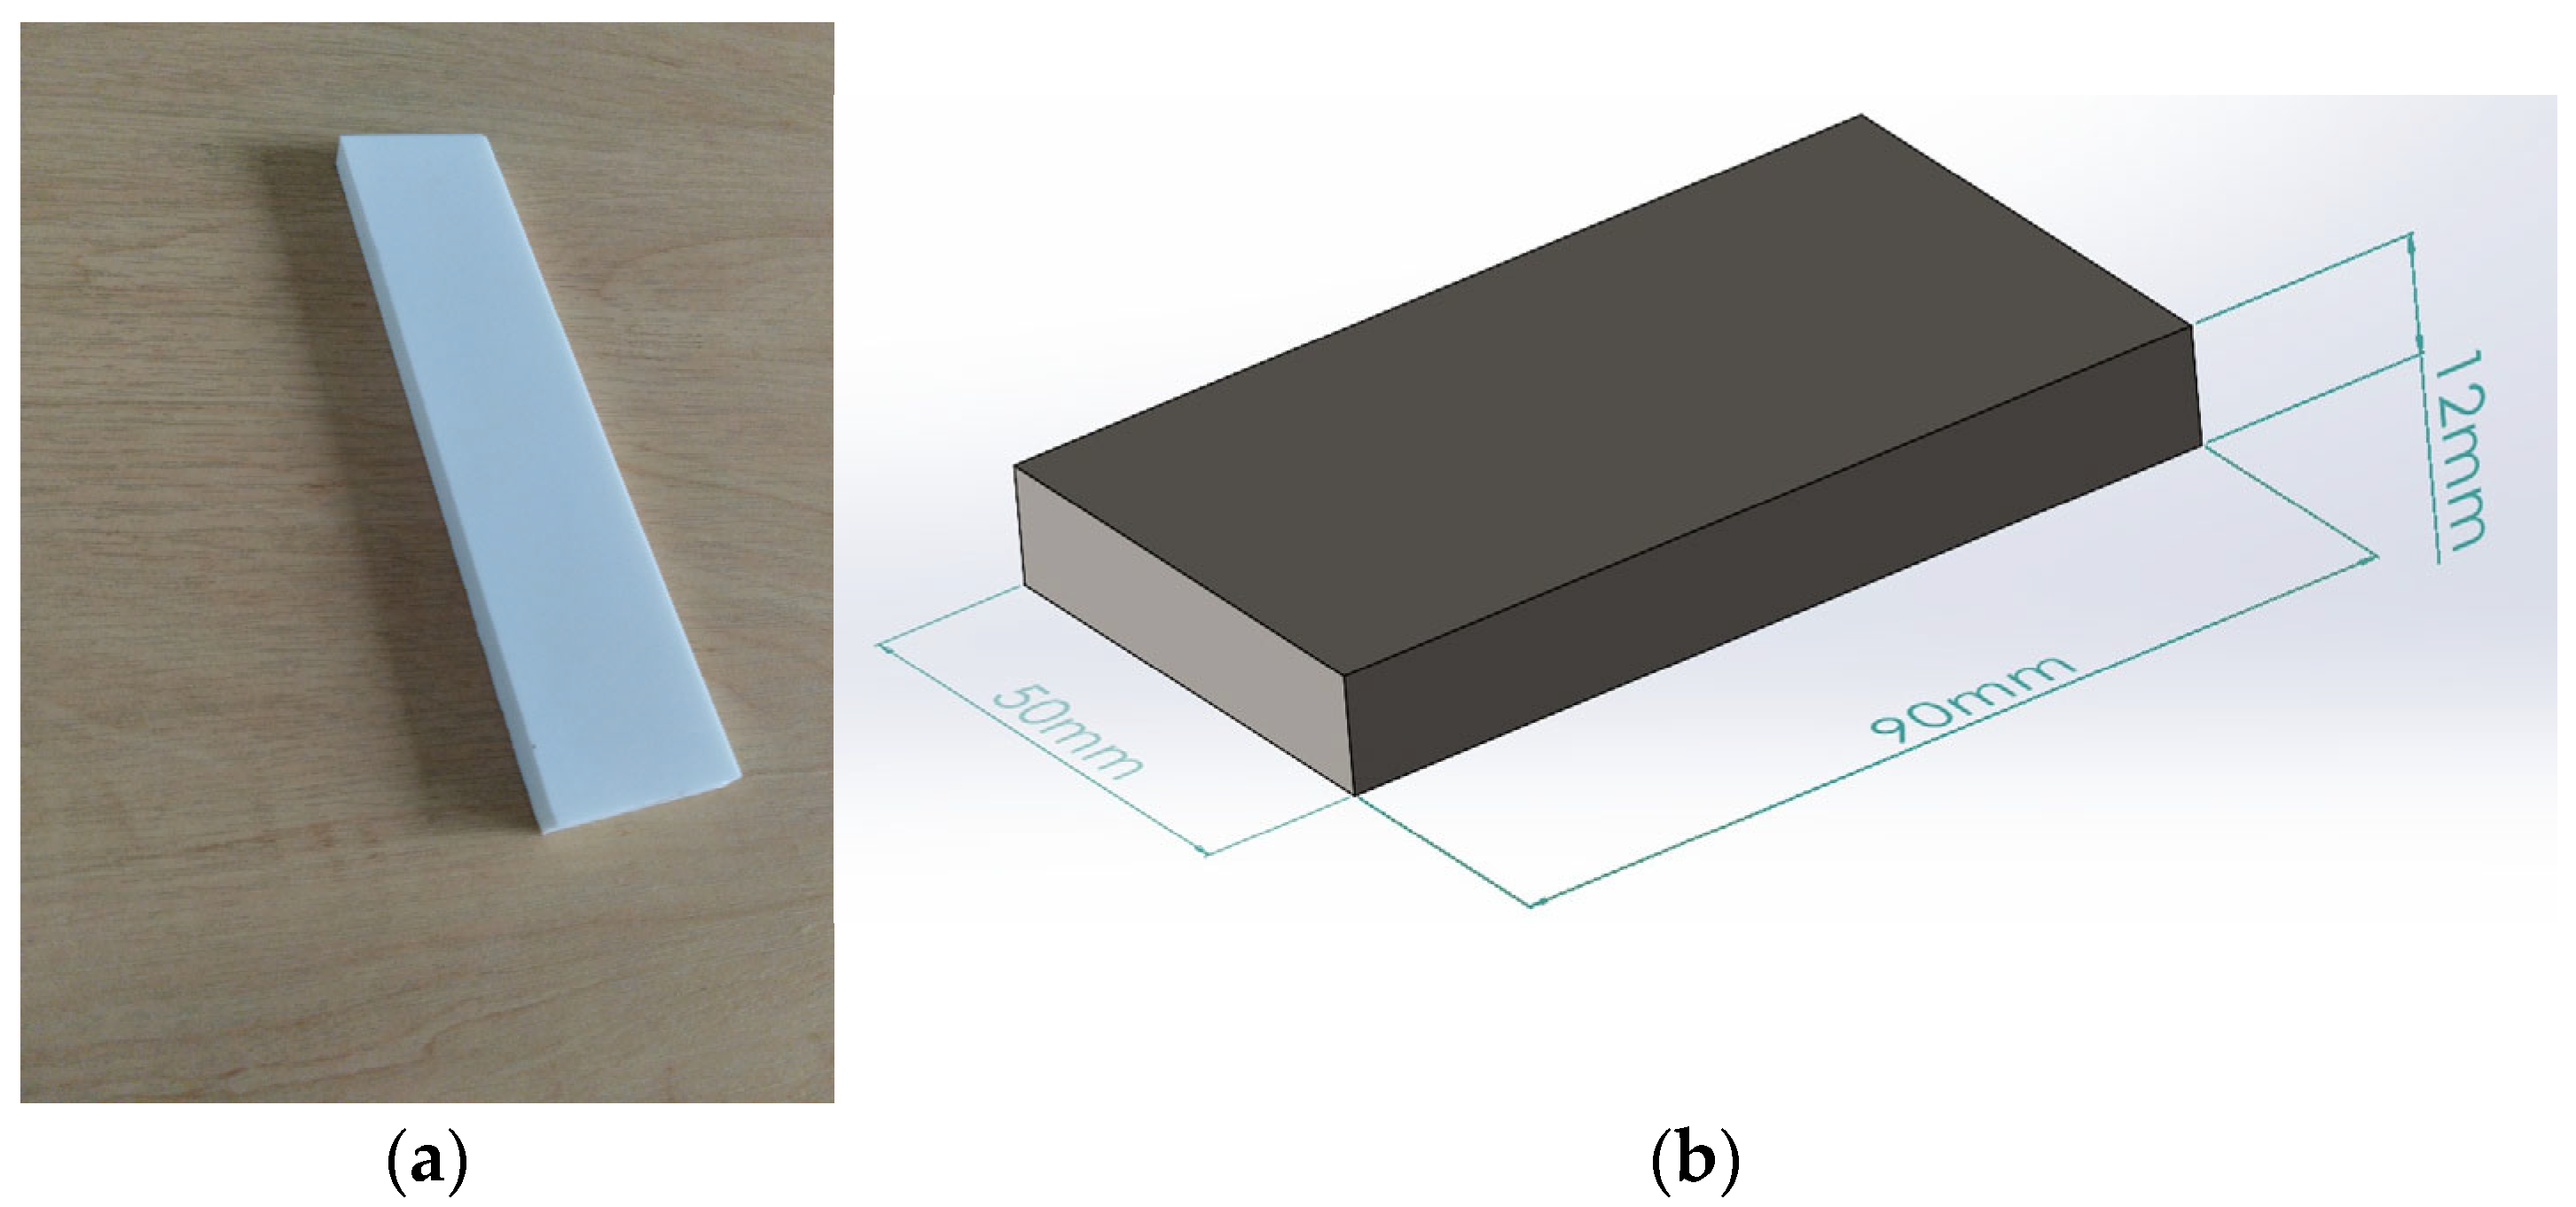
The chosen material for the experiment was Corian. Also known as artificial stone, it has a uniform appearance that can mimic the look of natural stone or other materials. It consists of one-third transparent acrylic resin (polymethyl methacrylate), (PMMA) and two-thirds natural minerals. The main mineral is aluminium trihydrate (ATH), a white powder derived from bauxite, the mineral from which aluminium is extracted. In
Figure 4, we can see a plate of Corian material used in the experimental research. Detailed technical properties of Corian material are shown in the following
Table 3.
2.4. Cutting Tool
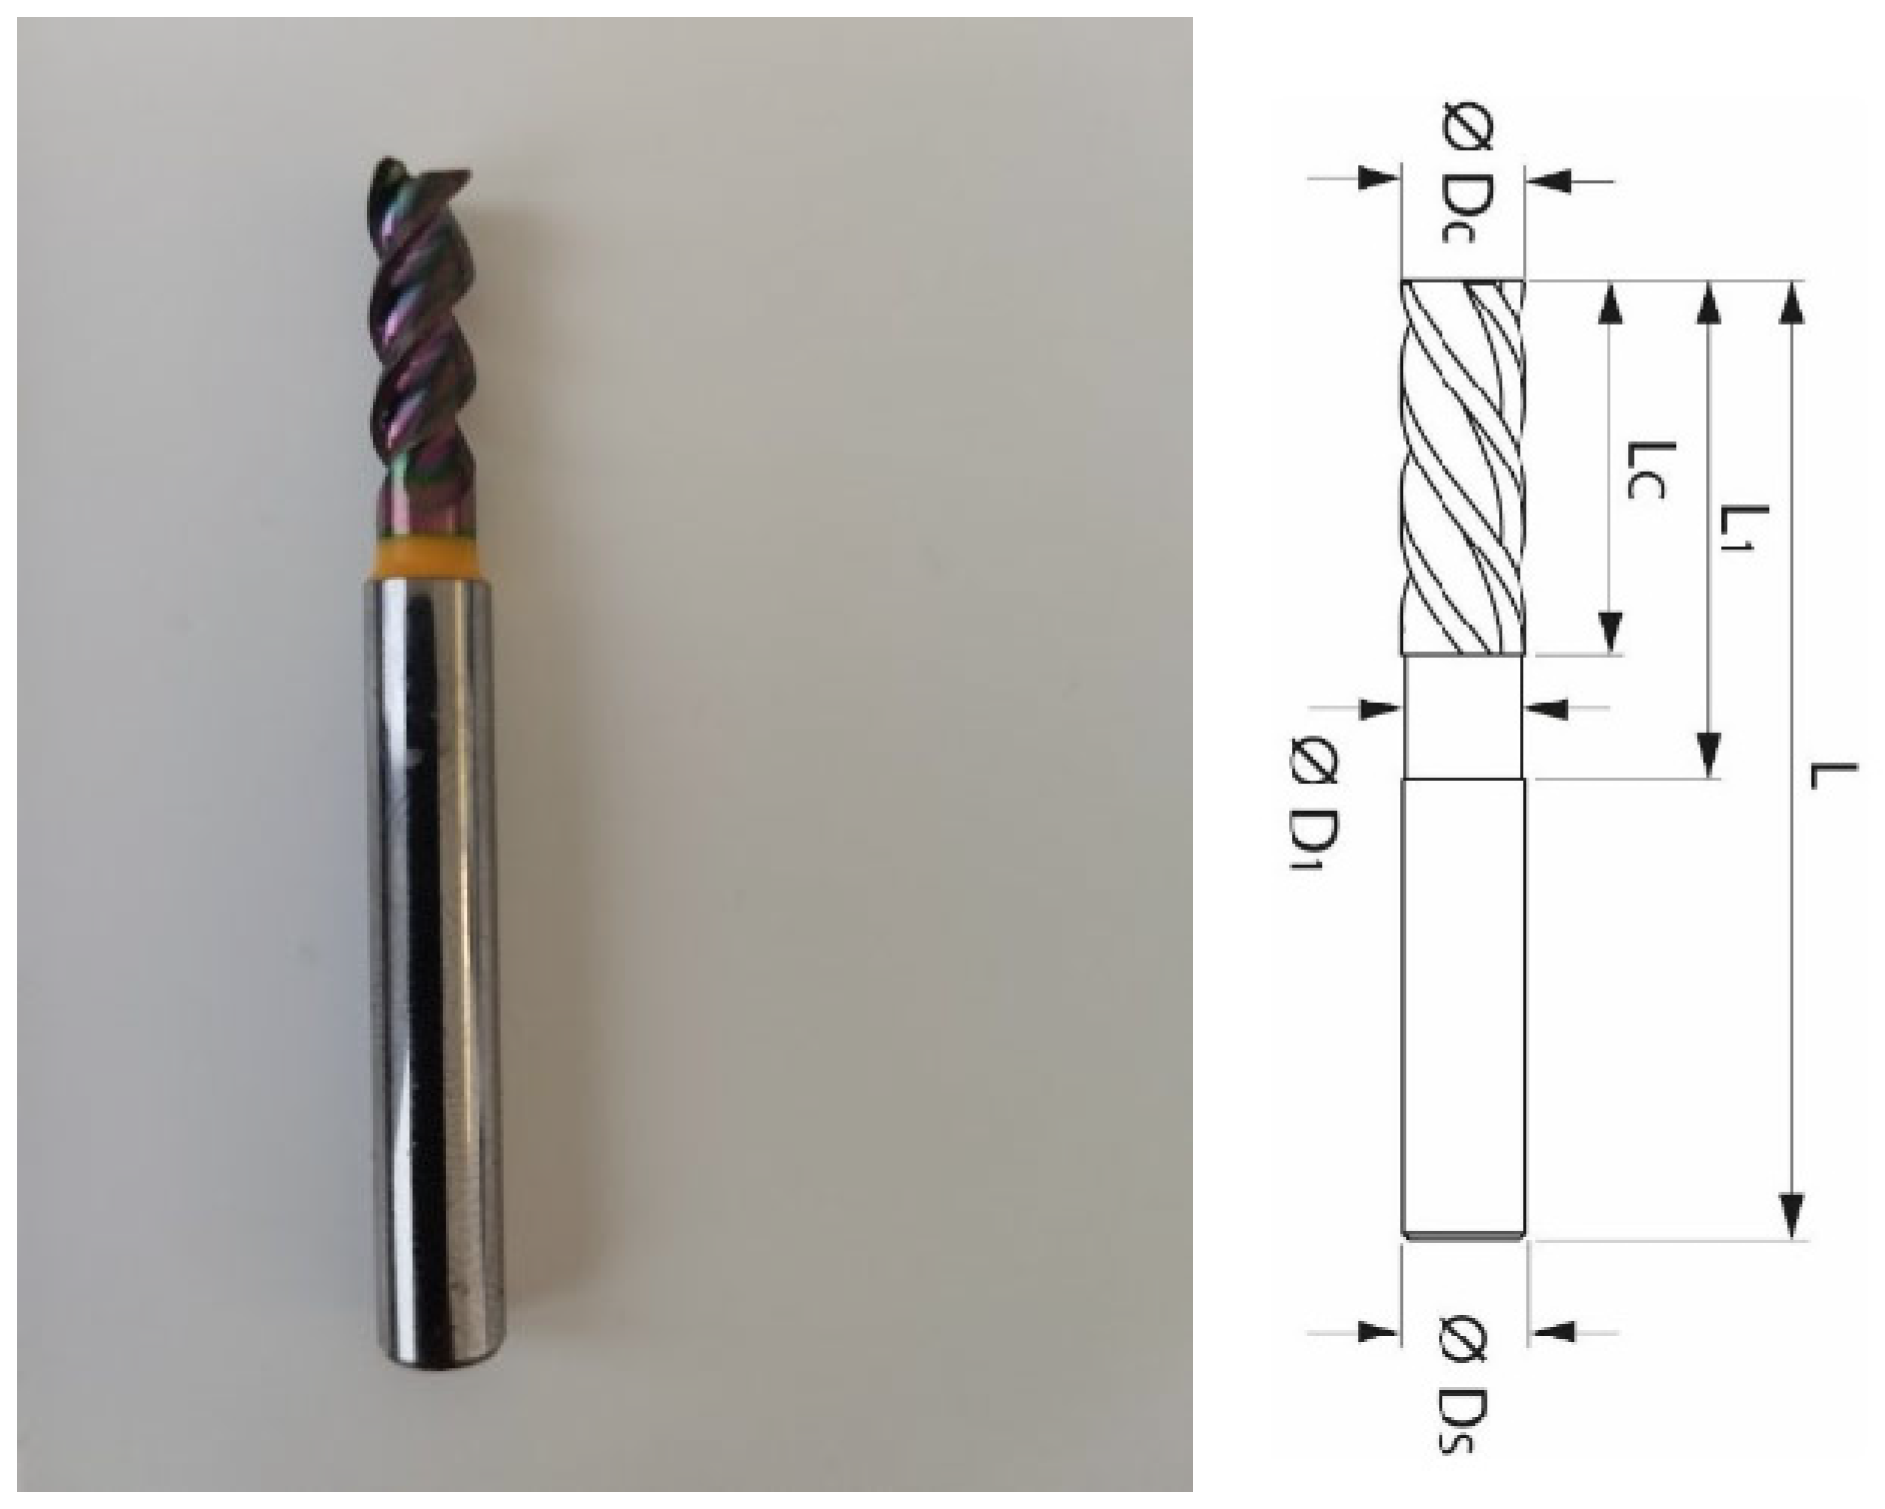
The most important component for the proper execution of the milling process, whether by a robotic arm or conventional machines, is the cutting tool. The proposed cutting tool is a three-blade cylindrical end mill with a cutting diameter of 5 mm and a shank diameter of 6 mm (
Figure 5). More detailed parameters of the three-blade mill can be seen in
Table 4. The choice of cutting tool was made based on professional consultation with Hoffman.
2.5. Preparation of the Experimental Environment for Experimental Milling with a Robotic Arm
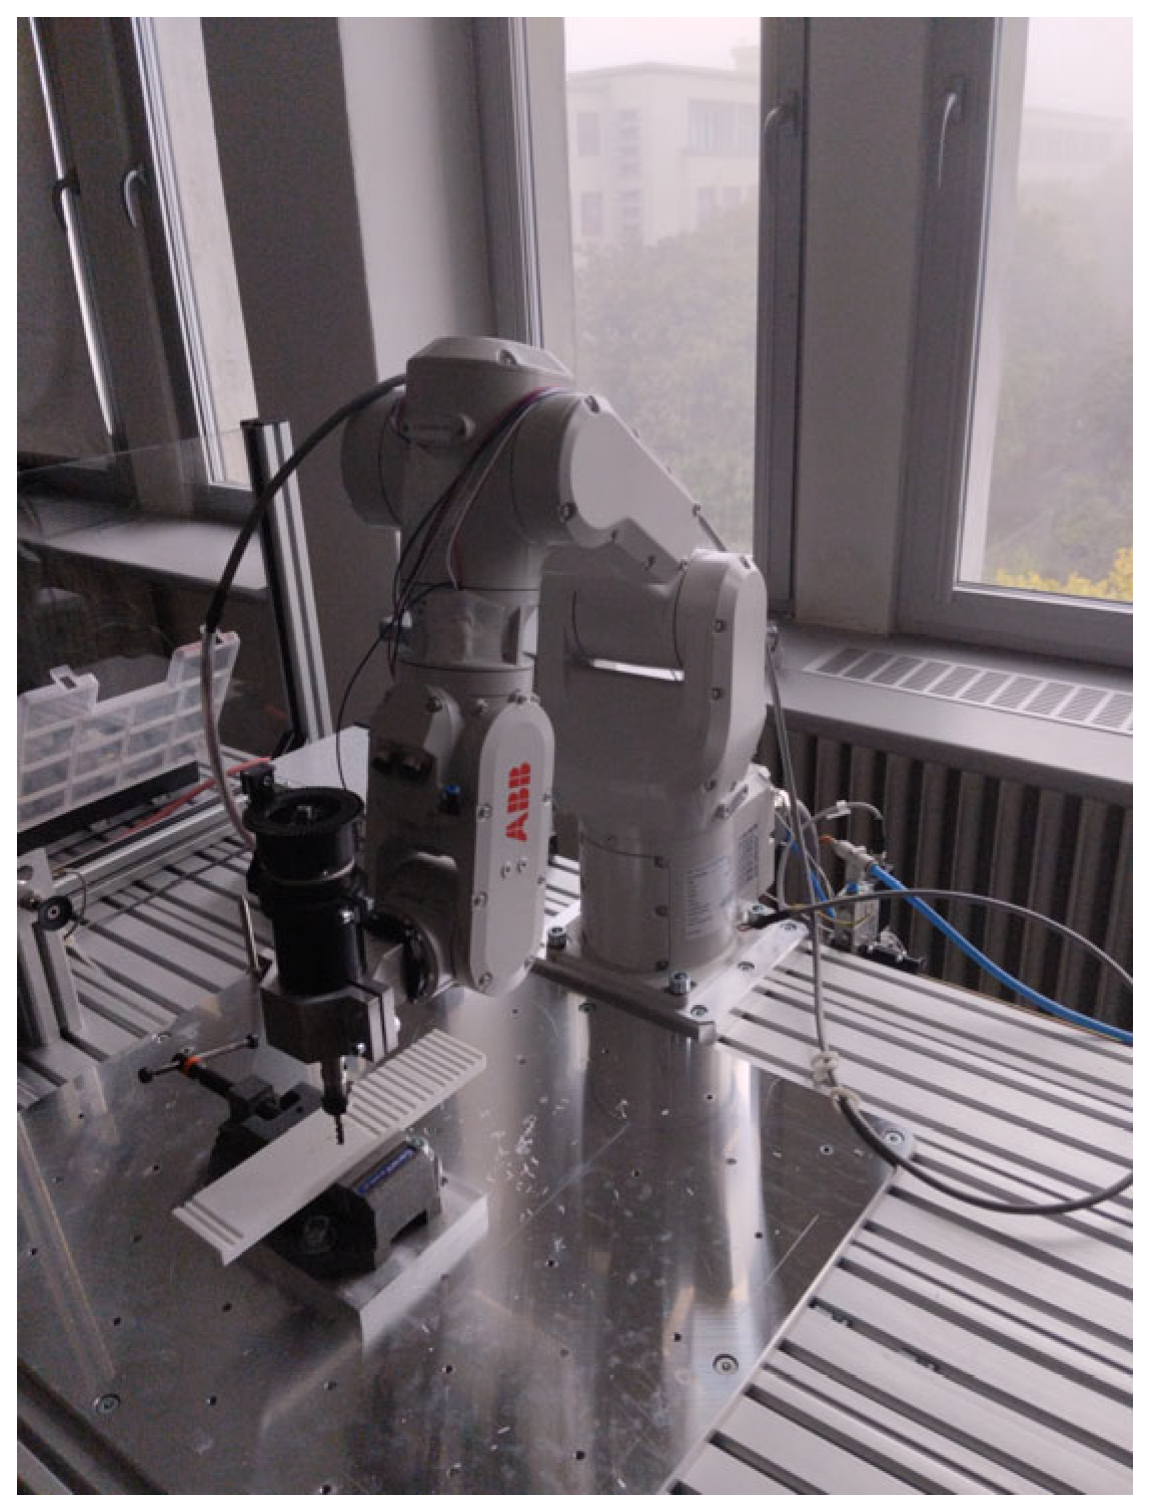
Experiments were conducted using the IRB 1100 robotic arm. This robotic arm is part of a workbench (
Figure 6), to which it is securely mounted. The workbench also includes a work surface where the Corian material was attached.
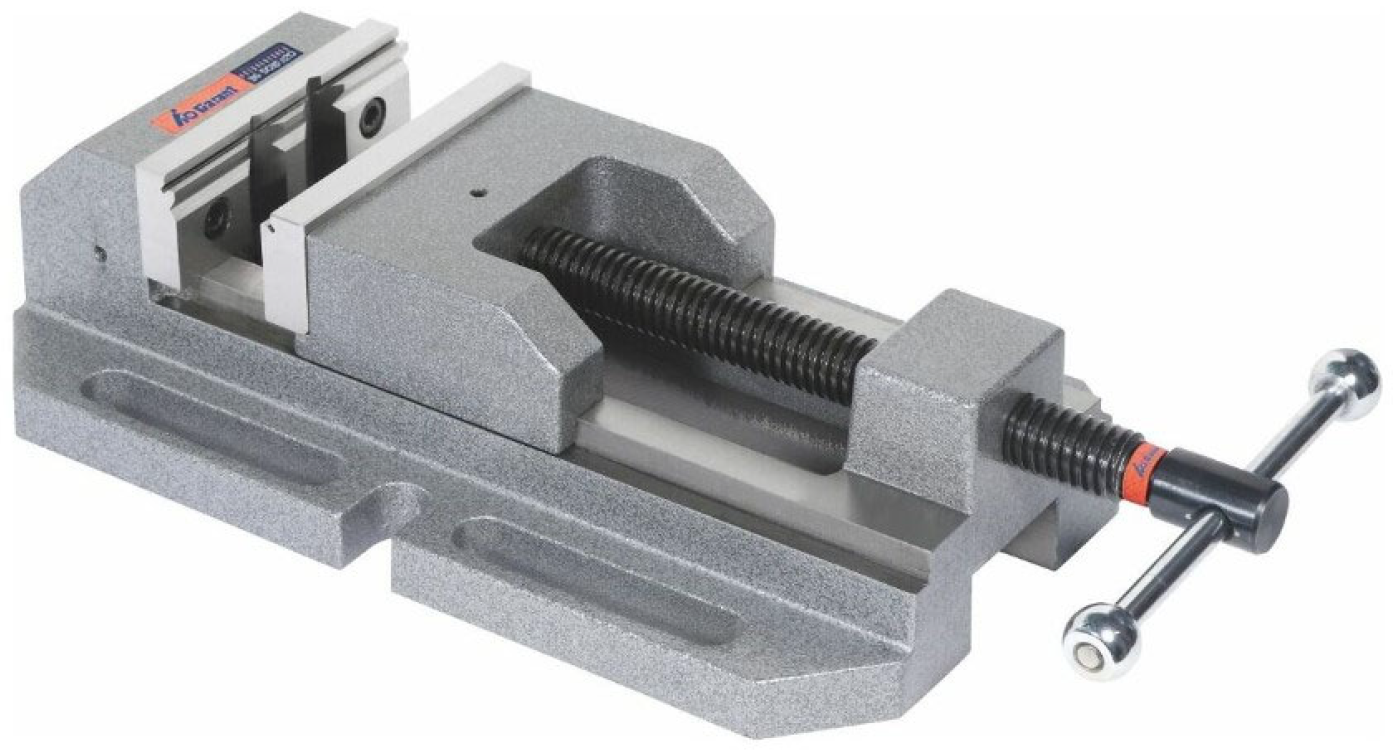
Since this surface contains several holes, there was no need to use complex clamping fixtures, and a precise mechanic vice was utilised for securing the material (
Figure 7).
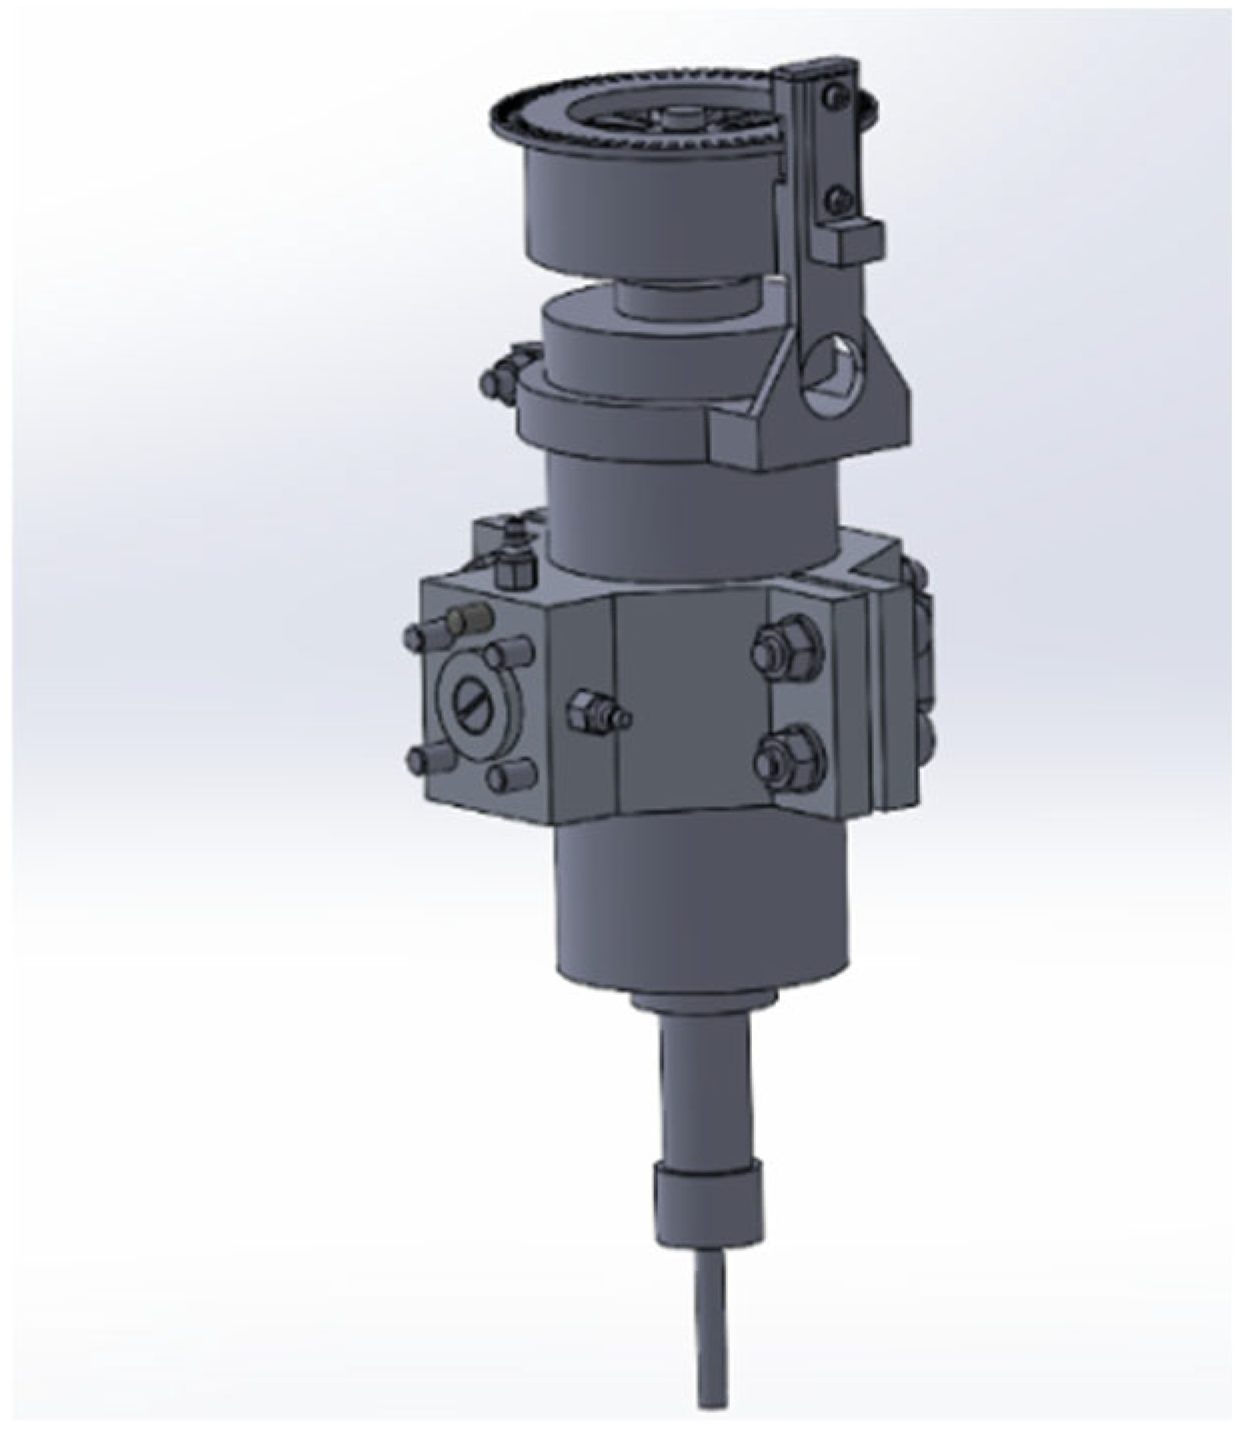
However, more attention was given to the design of the clamping joint, which was used to firmly attach the experimental spindle together with the robotic arm. The spindle attachment was designed to allow for the secure mounting of accelerometers for vibration measurement while keeping the weight as low as possible due to the low payload capacity of the robotic arm. In
Figure 8, we can see the design of the spindle attachment along with the spindle itself, created in SolidWorks.
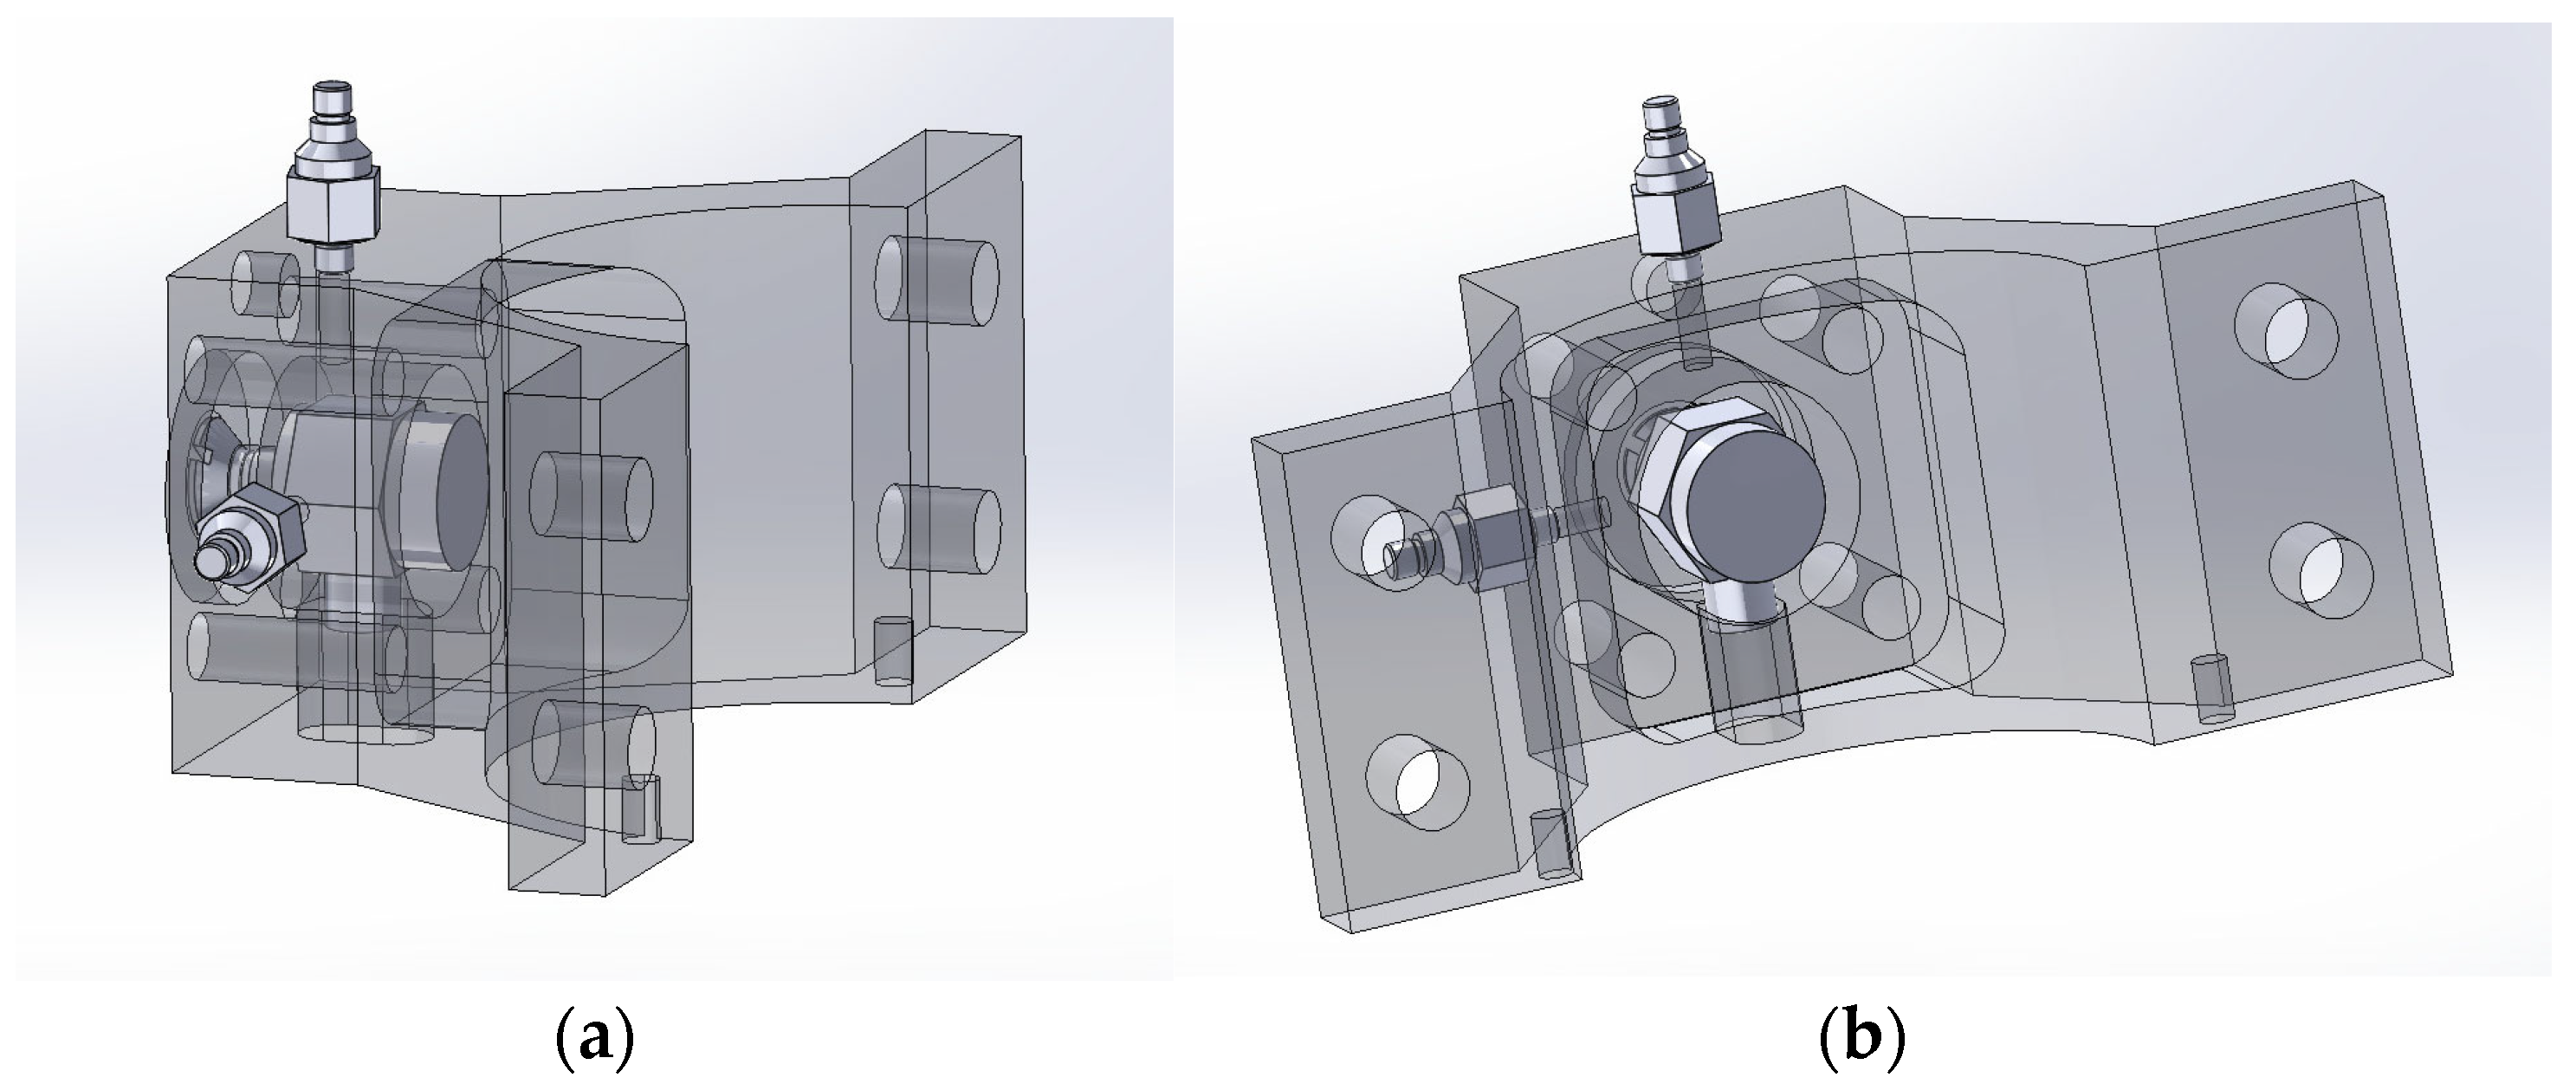
The attachment consisted of two parts, where one part was specially modified to allow for the attachment of an accelerometer directly inside the clamping joint, as shown in
Figure 9. This clamping joint design was created for measuring accelerations along the X axis. The other accelerometers were mounted on the outer surfaces of the clamping joint. These accelerometers measured accelerations in the Y and Z axes.
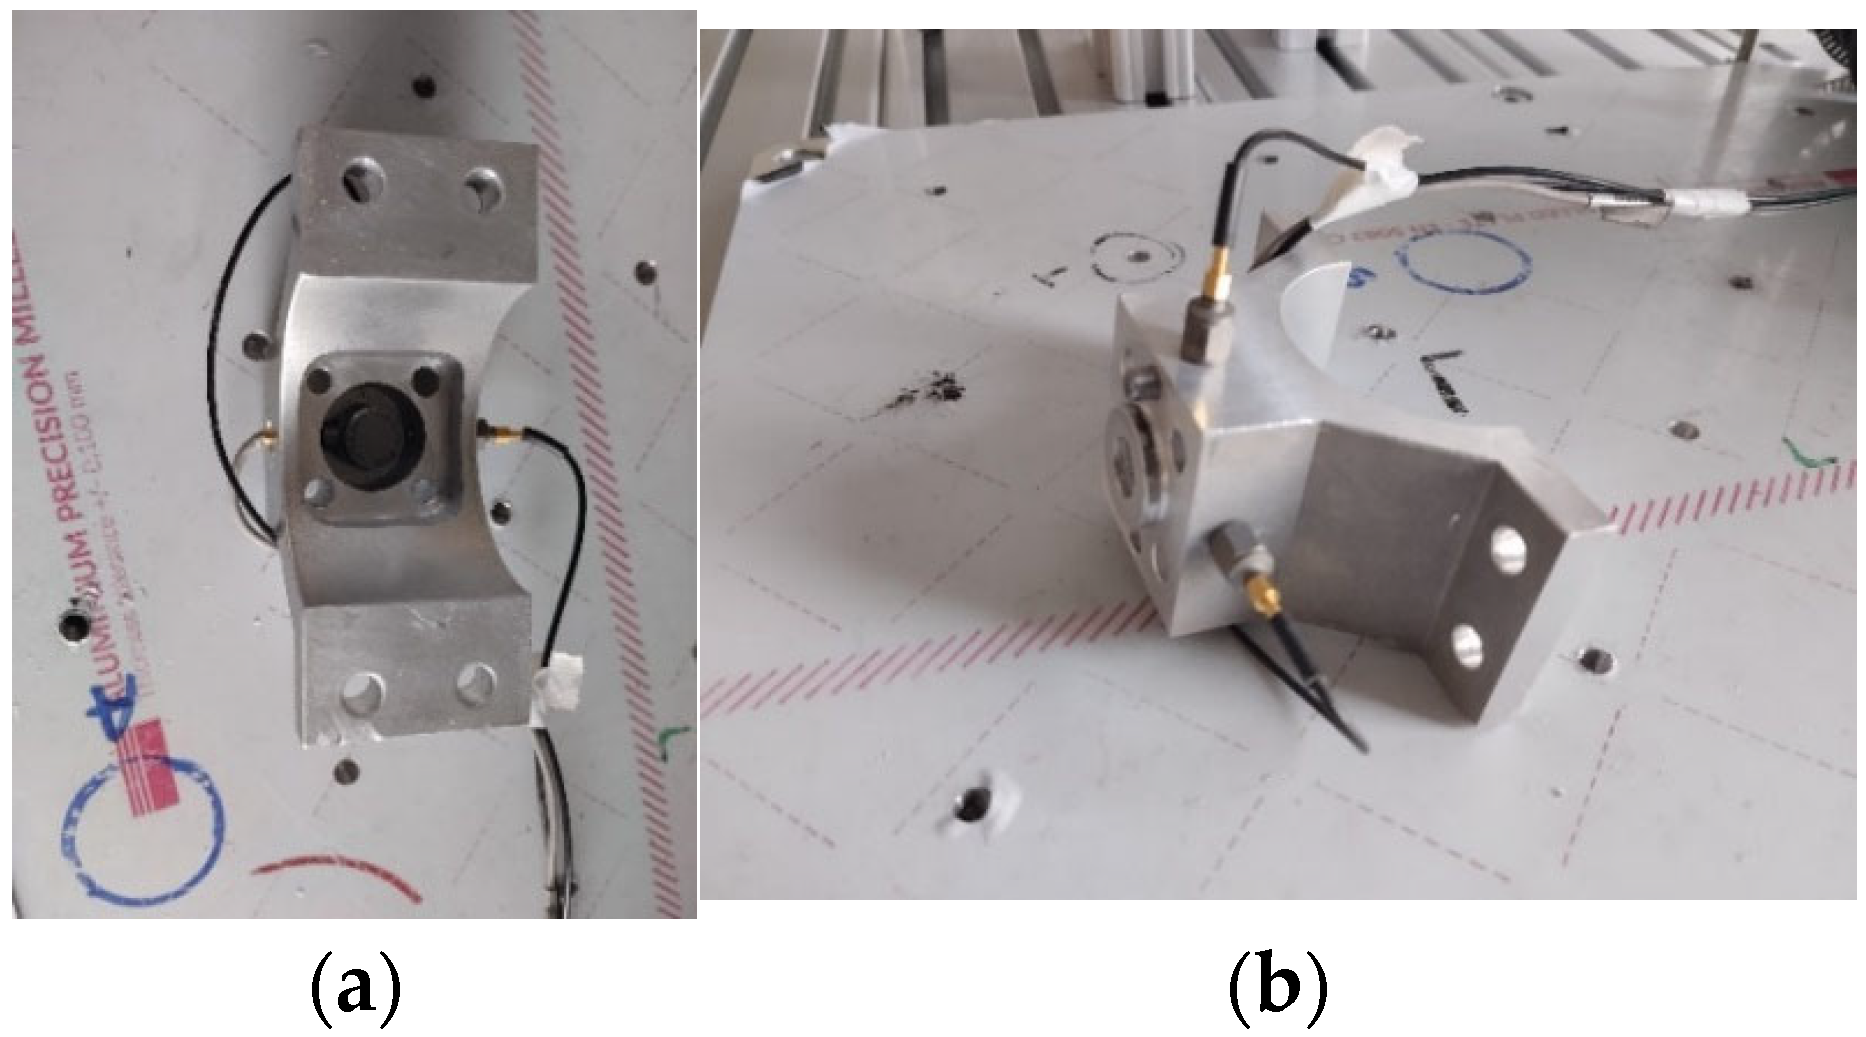
The second part of the clamping joint was used solely to securely grip the spindle between the two parts of the clamping joint. In the following
Figure 10, one part of the clamping joint is shown along with the securely mounted accelerometers.
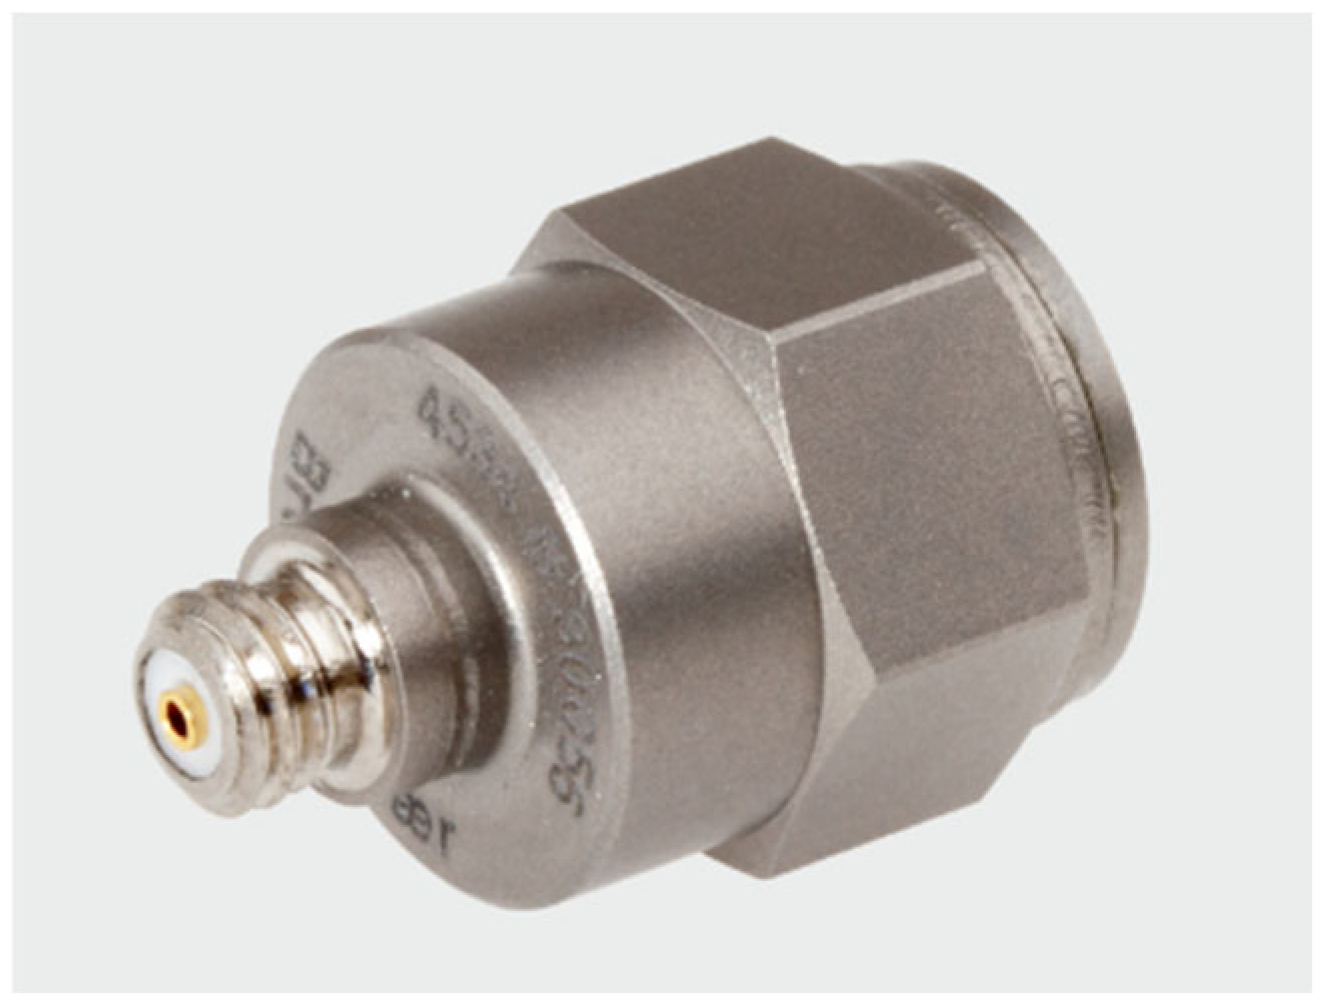
Acceleration sensors were fixed in three places on the clamping joint so that we measured accelerations in each axis, X, Y, and Z. Accelerometers CCLD ACCELEROMETER TYPE TYPE 4534-b (Brüel & Kjær, Nærum, Denmark) were used to measure accelerations, which can also be seen in
Figure 11.
The universal CCLD accelerometer with TEDS has a coaxial connector mounted on top and a low-impedance output for long cable runs. Type 4534-b provides a wide frequency range from 0.2 Hz to 12.8 kHz and low noise levels for low-level measurements. Additionally, the unit offers low sensitivity to environmental factors, making it ideal for use in changing or demanding environments. The parameters of the accelerometer are listed in
Table 5.
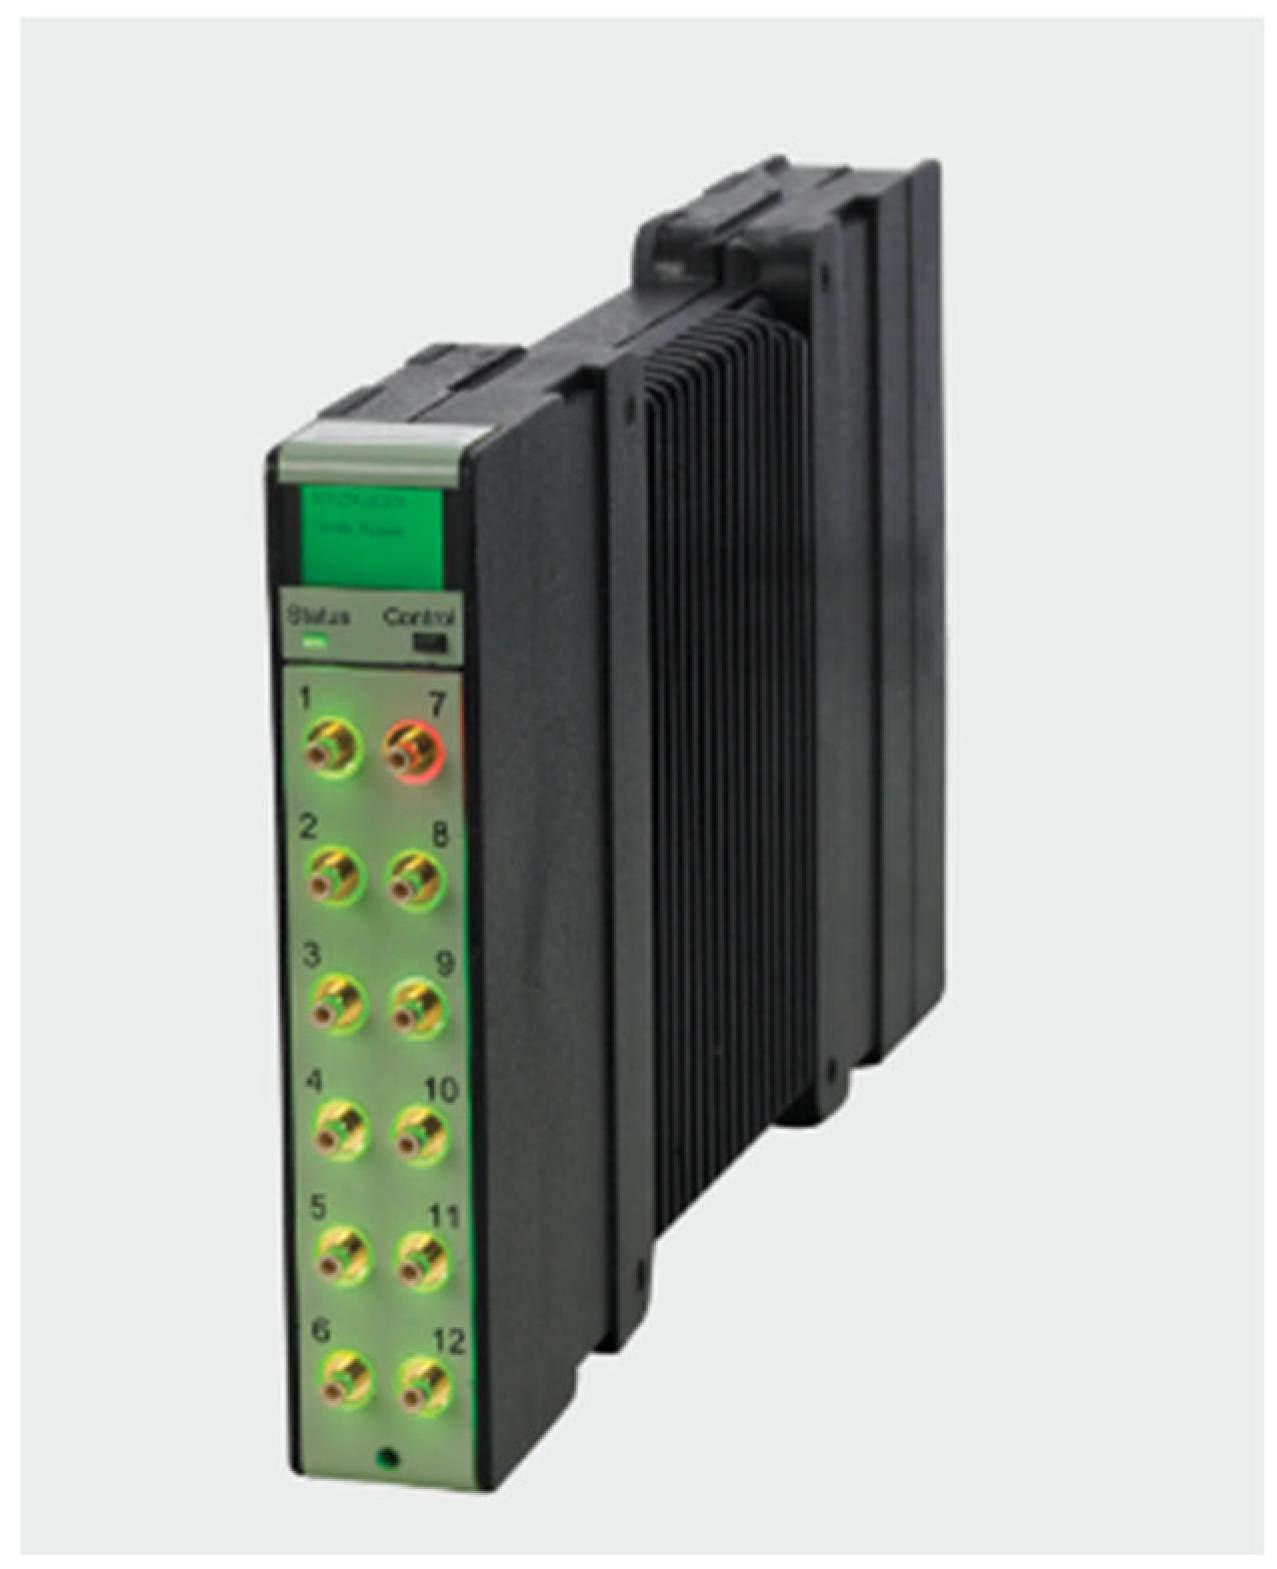
To record and store vibration data, a measuring module was used that allows for monitoring vibration patterns and subsequently recording, storing, and further processing the measured data. The measuring module is shown in
Figure 12, and as can be seen, it offers up to 12 channels for connecting accelerometers and a microphone.
2.6. Programming the Robot’s Movement Instructions in the RobotStudio Program
The robotic arm from ABB provides users with the programming software RobotStudio (Version 25.3.11371.0), which, among many other applications, includes packages for the milling process. Therefore, the entire simulation and generated codes for the real robot were created in this program.
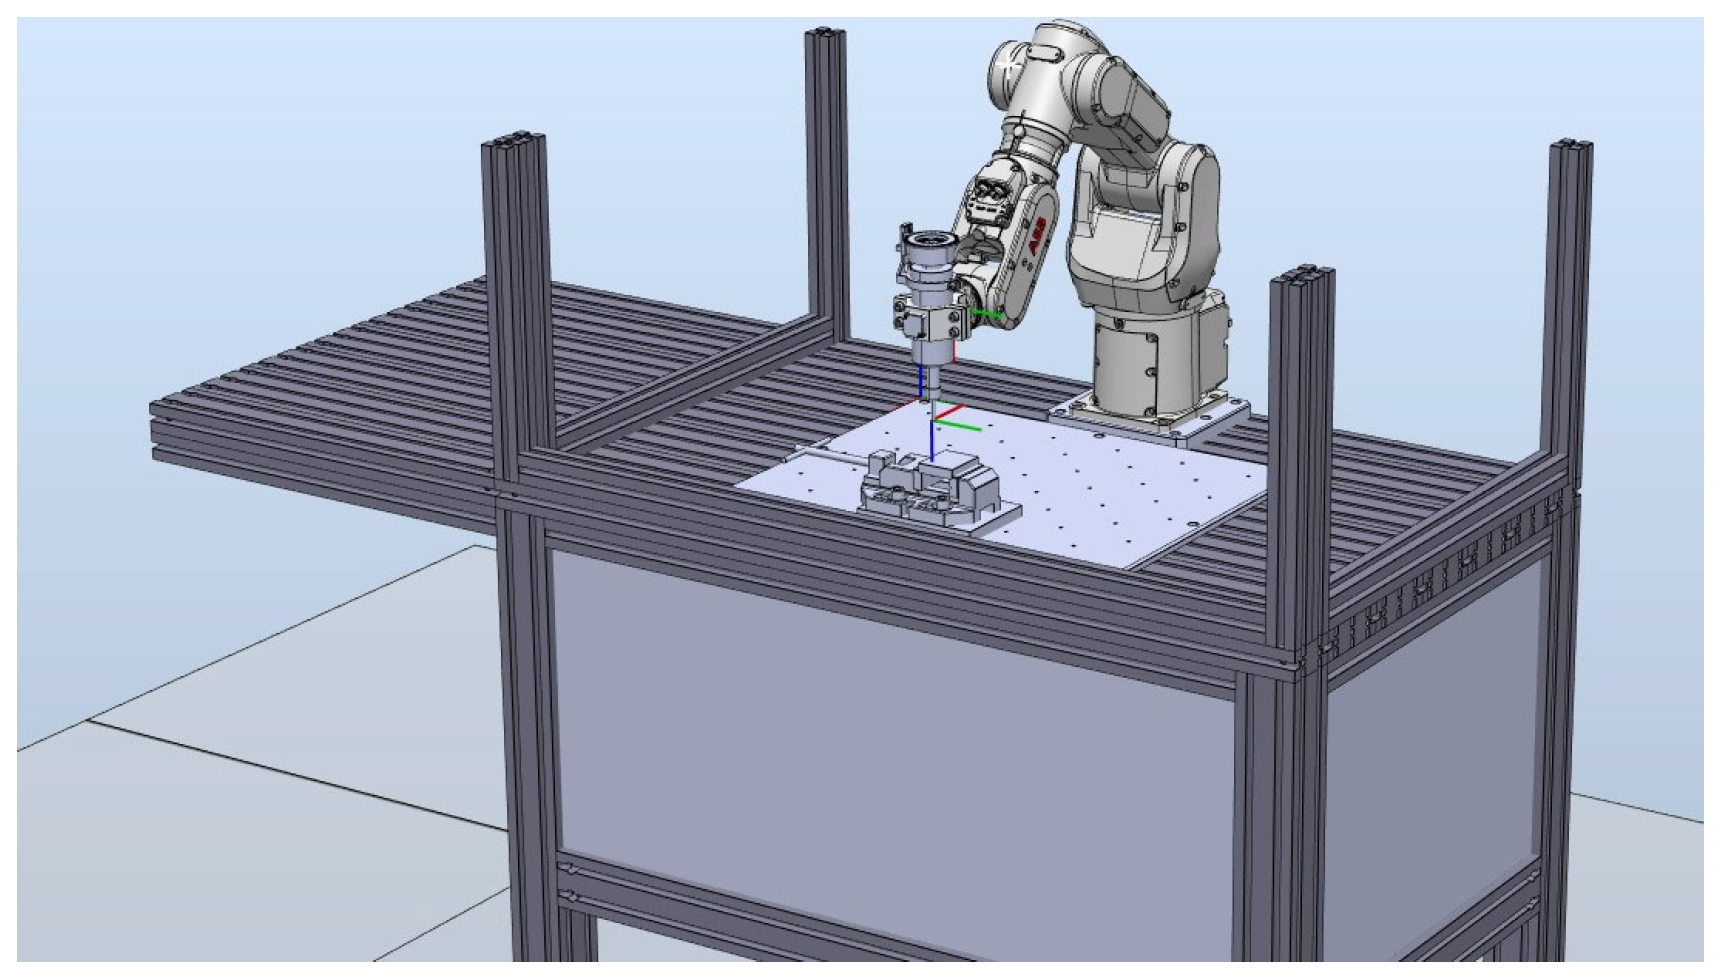
RobotStudio allowed for modelling the trajectory paths along which the cutting tool (milling cutter) would move. Additionally, the program set the values for the tool’s feed (TCP tool) and the depth of material removal. Programming motion instructions was handled in a virtual environment, where a copy of the robotic workstation was created that corresponded to the real workstation, as seen in
Figure 13.
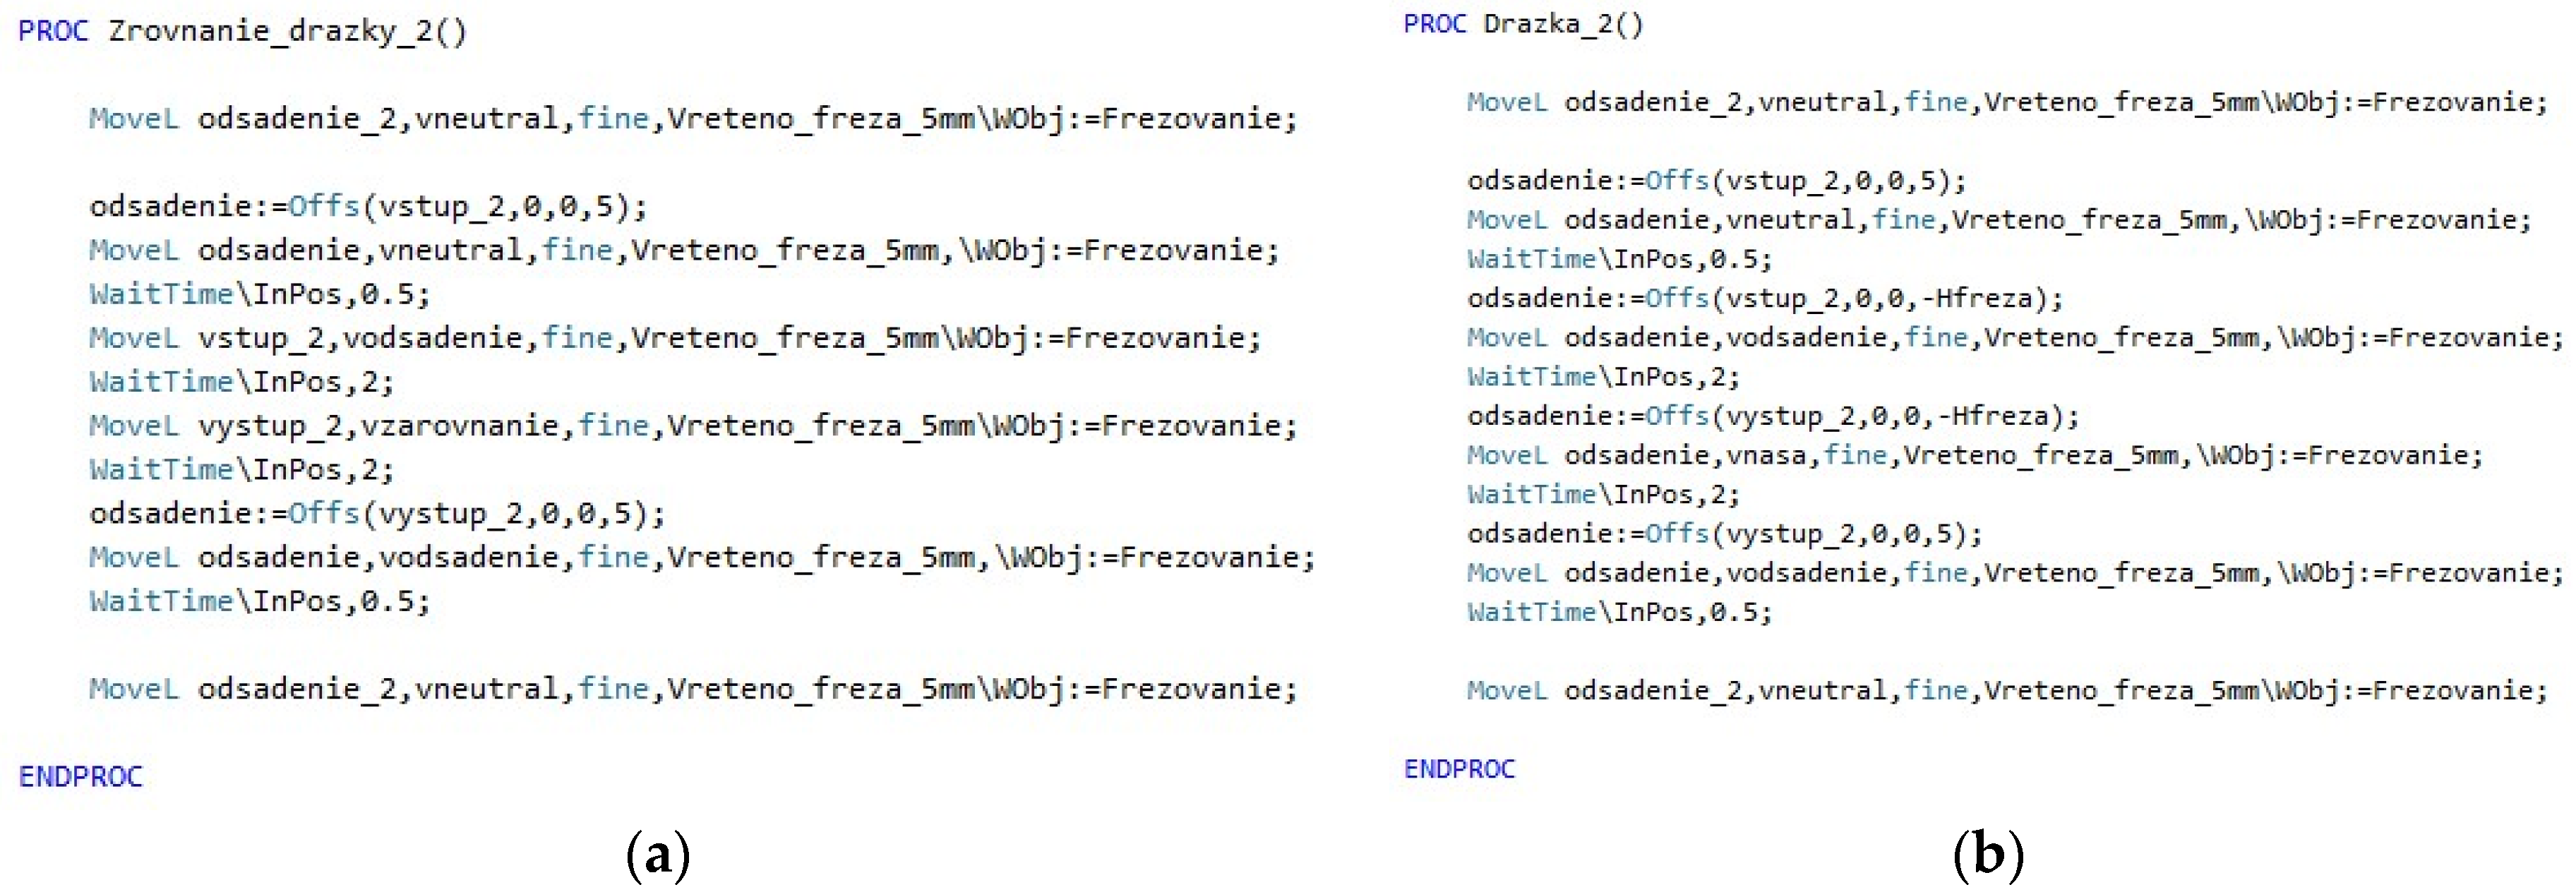
In the virtual environment, all tools and materials needed to simulate the milling process were positioned. The created motion instructions were pre-simulated, allowing for the prediction of undesirable states or collisions. The RAPID program itself was modified to the level of parameterisation of individual changing parameters for the sake of simplicity and fluidity of the program.
The main part of the program was divided into two sections (
Figure 14), where one section was programmed for the cutting tool to traverse the surface of the material being machined to level its surface and achieve a plane. In the second part of the program, the value for the depth of material removal was read from this plane.
2.7. Design of a Screening Experiment
The screening experiment consisted of several individual tests focused on milling grooves with gradually changing technological parameters. These tests allowed us to determine the range of technological parameter values for the design and implementation of the main experiment, which aimed to investigate the impact of technological parameters in the milling process using a robotic arm on the final quality of the machined material (surface roughness).
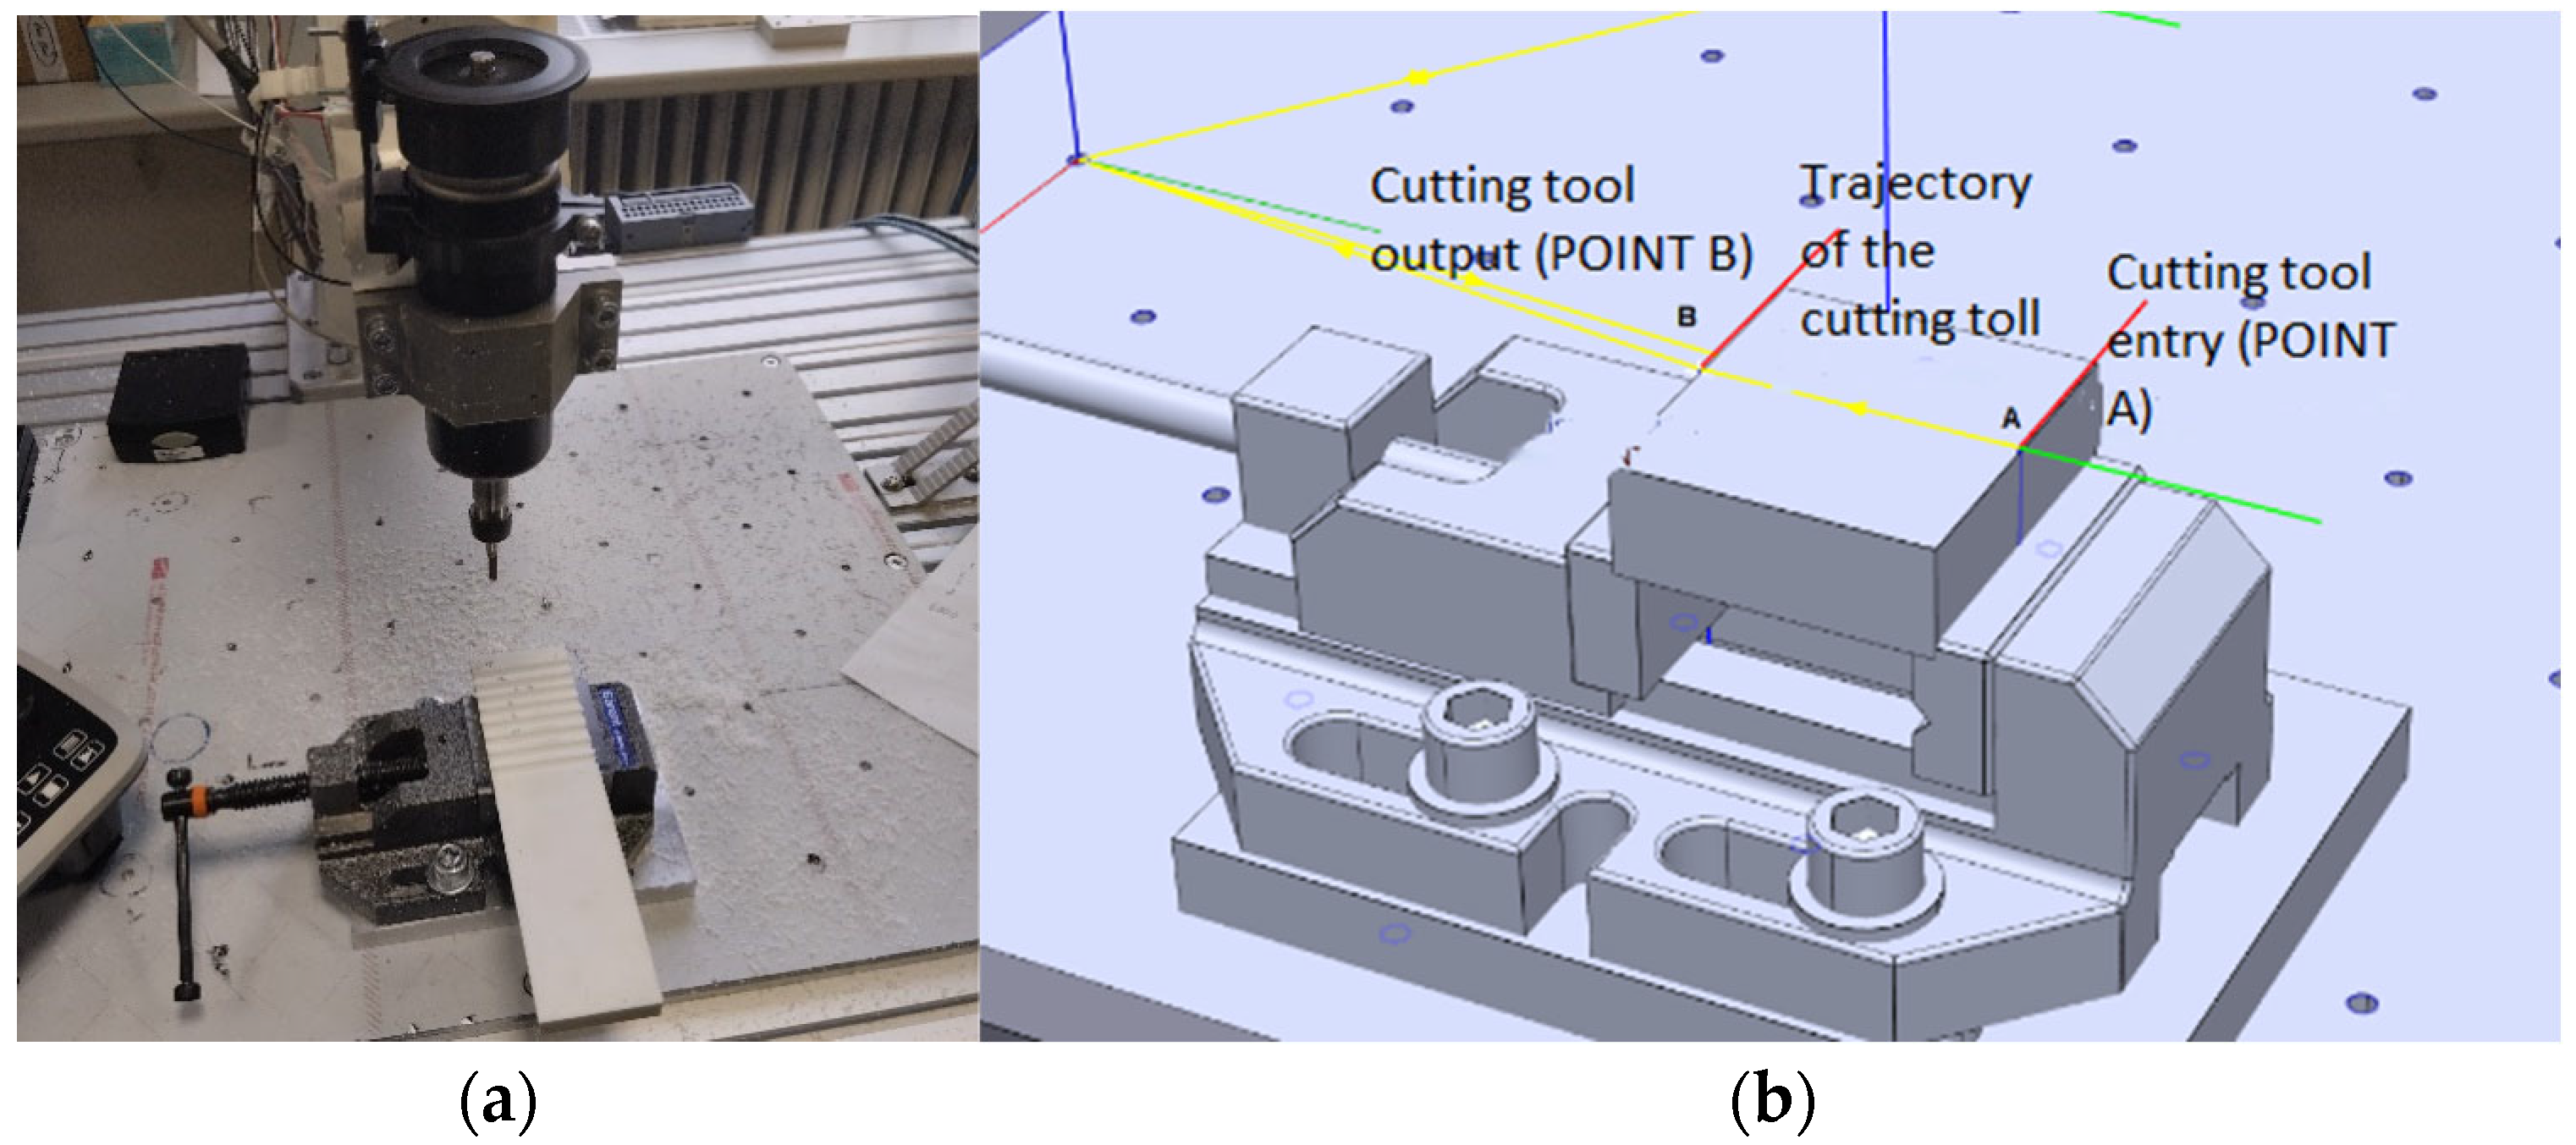
The grooves were milled at a specifically defined position that did not change during the screening test. This position corresponded to the maximum extension of the robotic arm. The material being machined was secured in a mechanic vice (
Figure 15a), which achieved a constant extension position of the robotic arm and, consequently, a constant tool path (
Figure 15b).
The technological process for milling the groove involved milling a specific groove using predetermined technological parameters. After the groove was milled, the workpiece was released from the mechanic vice and repositioned so that a new groove could be milled at the same extension position of the robotic arm using a different set of technological parameters.
The robot’s motion instructions were programmed so that, upon the cutting tool’s entry into the workpiece, there was a time delay that ensured the entire system was stabilised. This prevented other vibrations, such as those occurring during the transition of the cutting tool from the home position to the groove milling position, from affecting the test results.
In this test, we repeatedly performed the milling process with all gradually changing technological parameters, ranging from minimum to maximum values. Simultaneously, we recorded data from the accelerometers, which we analysed along with the measured roughness in each groove. The roughness was measured on the bottom surface of all the grooves.
The test began by setting the minimum spindle speed, which was set at 6000 RPM. We then selected the minimum value for the depth of material removal, set at 0.5 mm. The feed rate of the cutting tool was also set to the minimum value of 5 mm/s. This parameter was varied from the minimum value to the maximum value of 90 mm/s, while the spindle depth of field remained constant. After milling the last groove at a speed of 90 mm/s, we changed the depth of field to 1 mm and repeated the test with varying feed rates. The same approach was applied for a depth of 1.5 mm. After milling all combinations, we increased the spindle speed to its maximum and repeated the milling process for all combinations of feed rates and depths of field. Through this testing, we achieved a total of 66 settings, which provided us with 220 surface roughness values and 66 vibration values that were evaluated through statistical analysis.
From the acquired vibration data, a calculation was performed that yielded RMS values representing values directly related to the energy content of the vibration profile. In other words, it is the effective value of the signal calculated based on the entire sample according to the following formula:
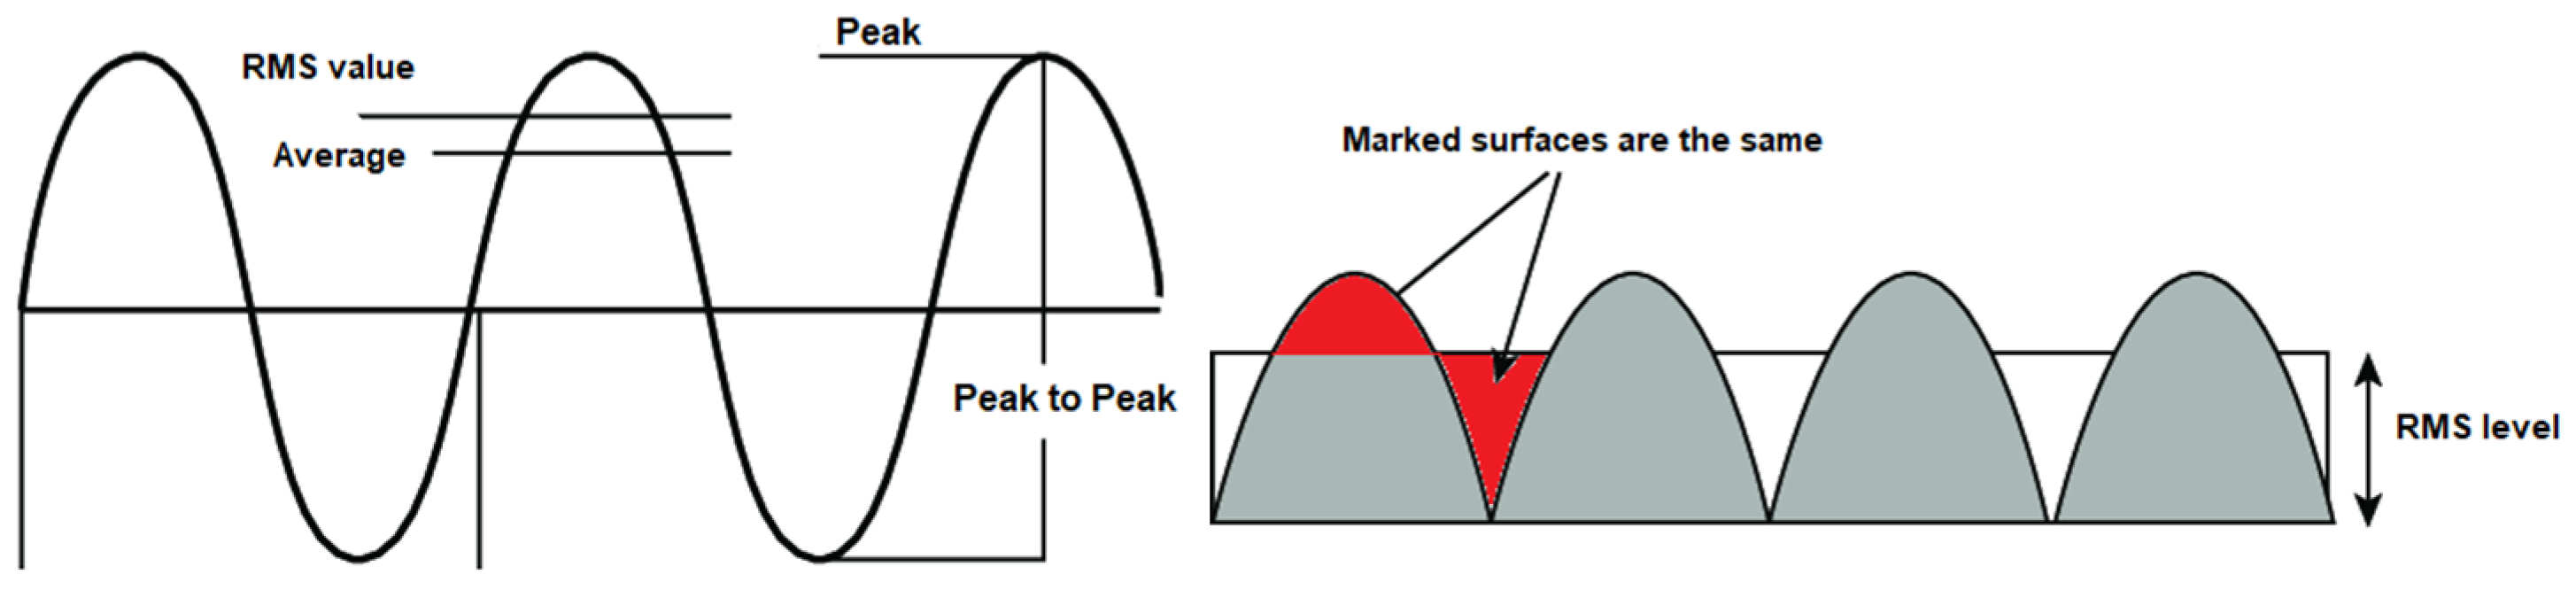
As the formula indicates, the RMS (Root Mean Square) is the square root of the average of the squared values of the waveform. In the case of a sinusoidal waveform, the RMS value is 0.707 times the peak value (as shown in
Figure 16), but this only applies to sine waves. The RMS value is proportional to the area under the curve—if there are negative values, the peaks are rectified, meaning they become positive, and the area under the resulting curve is averaged to a constant level, which will be proportional to the effective value. The RMS value of a vibration signal is an important measure of its amplitude. As previously mentioned, it numerically equals the square root of the mean of the squared amplitude values. To calculate this value, the instantaneous amplitude values of the waveform must be squared, and these squared values must be averaged over a specific time interval. This time interval must cover at least one period of the wave to achieve an accurate value. Since all squared values are positive, their average will also be positive. The square root of this average value is then taken to obtain the effective mean value.
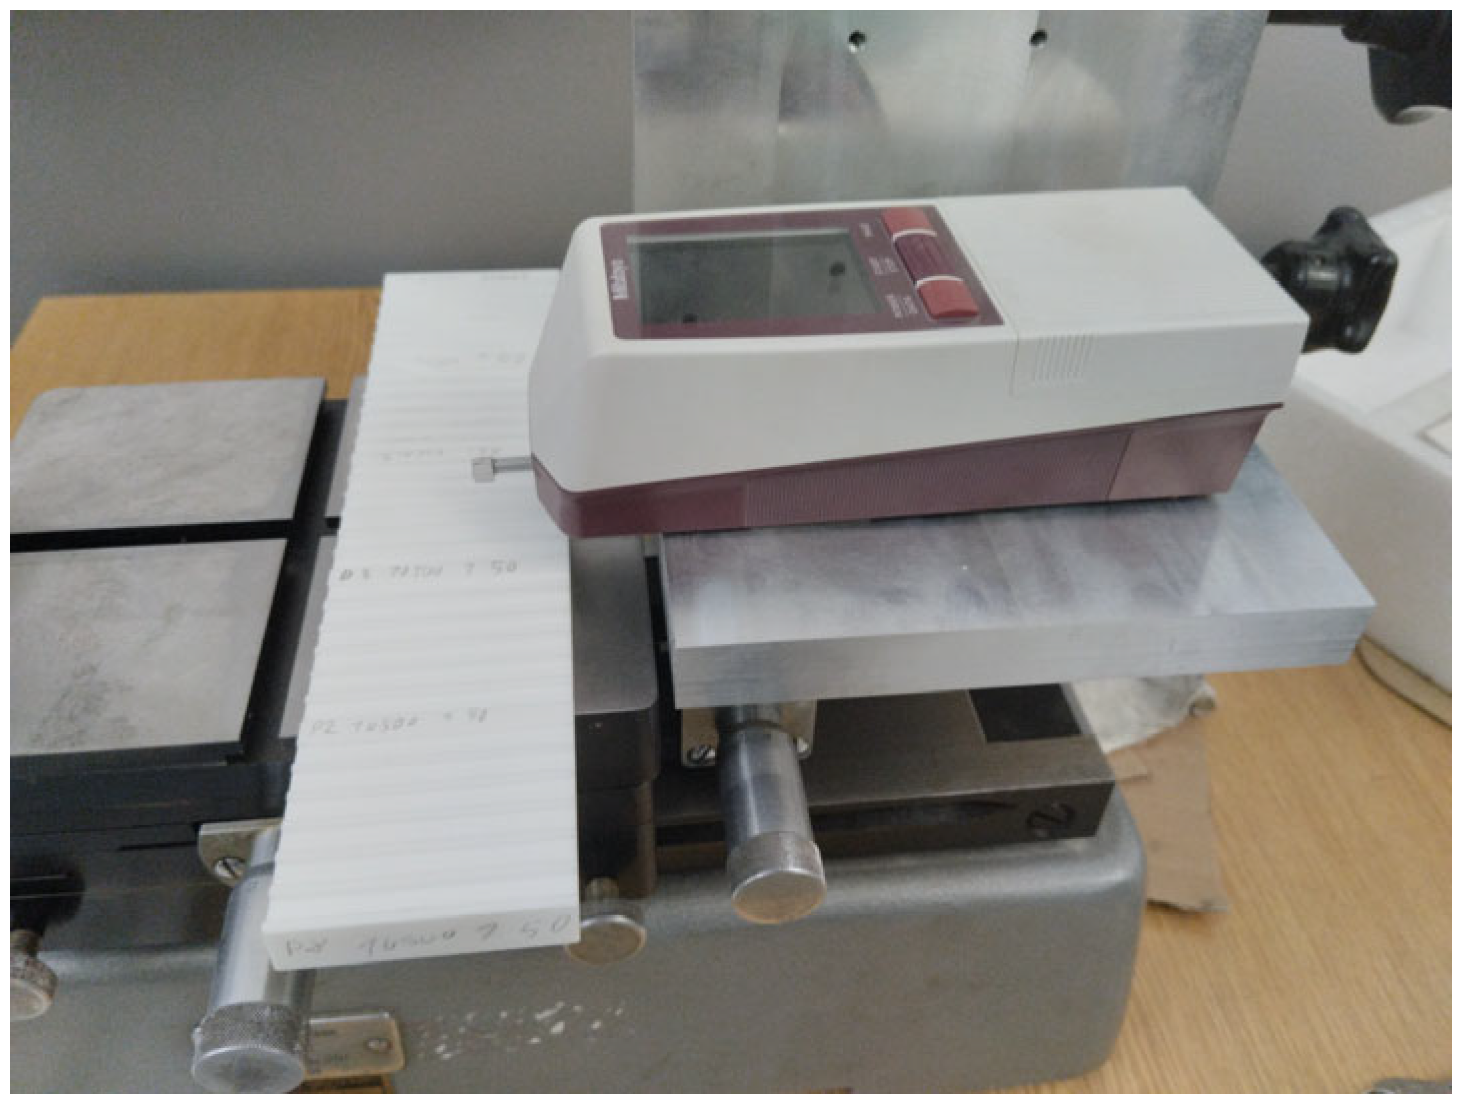
Surface roughness was measured using the Mitutoyo S-210 roughness tester (Mitutoyo, Kawasaki, Japan.), as shown in
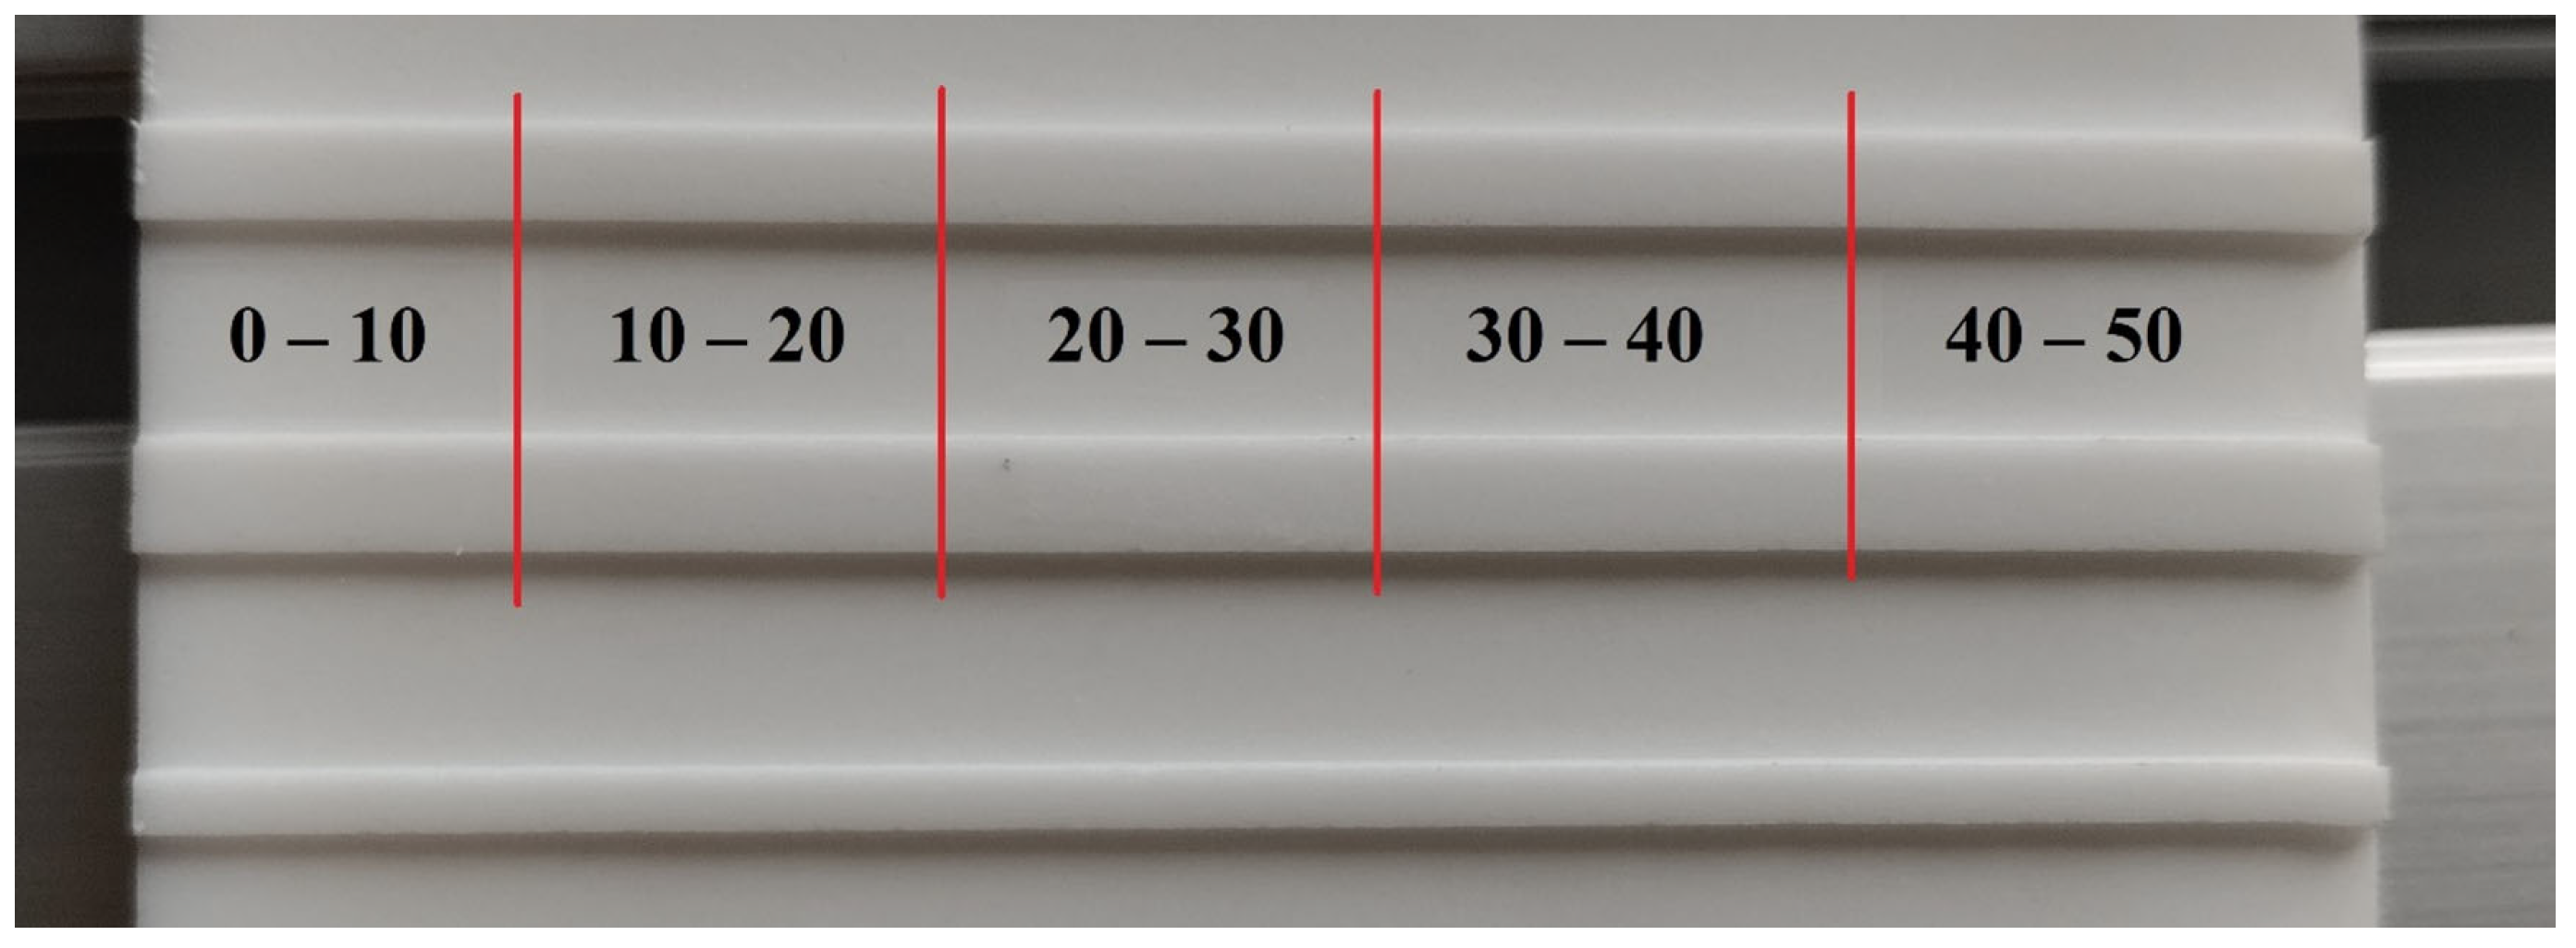
Figure 17. The surface roughness of the inner surface of the groove was measured at five locations (
Figure 18). This means that the total length of the groove was divided into five segments, and multiple measurements of the surface roughness value were taken in each segment.
The total length of the groove was 50 mm, which means that each segment measured 10 mm (
Figure 18). Specifically, each segment underwent four roughness measurements, and from the obtained values, we calculated the average roughness for each segment. Subsequently, we expressed the overall average value for the entire groove based on the average values of the individual segments. In the statistical evaluation, the measured values of roughness and vibrations in the segments 0–10 mm and 40–50 mm were not considered.
The reason for evaluating the measured surface roughness values in the sections from 10–20 mm to 30–40 mm is that the RMS value was calculated from the same segment of the groove, while the entry of the cutting tool into the material (0–10 mm) and the exit from the material (40–50 mm) were not considered. The entry (0–10 mm) and exit (40–50 mm) segments of the groove were intentionally excluded from the statistical evaluation because these regions represent non-steady-state cutting conditions, in which the tool is either engaging with or disengaging from the material. These transition phases generate higher transient vibration peaks, irregular chip formation, and fluctuations in cutting forces, which do not represent the stable machining regime intended for comparison across different parameter combinations.
To ensure repeatability and to avoid distortion of the results due to transient effects, only the central section of the groove (10–40 mm), where the machining process is dynamically stable, was used for RMS vibration analysis and surface roughness evaluation.
Vibrations were recorded using three accelerometers, each measuring vibrations along the individual X, Y, and Z axes. In the statistical analysis, the overall RMS vector value (RMS V) was considered according to the following formula:
3. Results
In our experiment, we conducted 220 roughness measurements at various technological settings in different sections of the groove, where we performed four measurements in each section and averaged them. We also calculated the average roughness value (Ra average) in the middle section of the groove, specifically in the segments 10–20 mm to 30–40 mm. During the milling of the groove in this section, vibration values were measured, from which the RMS was calculated according to Formula (1), and the RMS vector (RMS V) was calculated using Formula (2). In the following
Table 6,
Table 7,
Table 8,
Table 9,
Table 10 and
Table 11, we can see the average roughness values for individual technological settings, as well as the average values for each section of the groove and the resulting roughness of the entire groove. The tables also display the RMS values in all axes processed from the obtained vibrations.
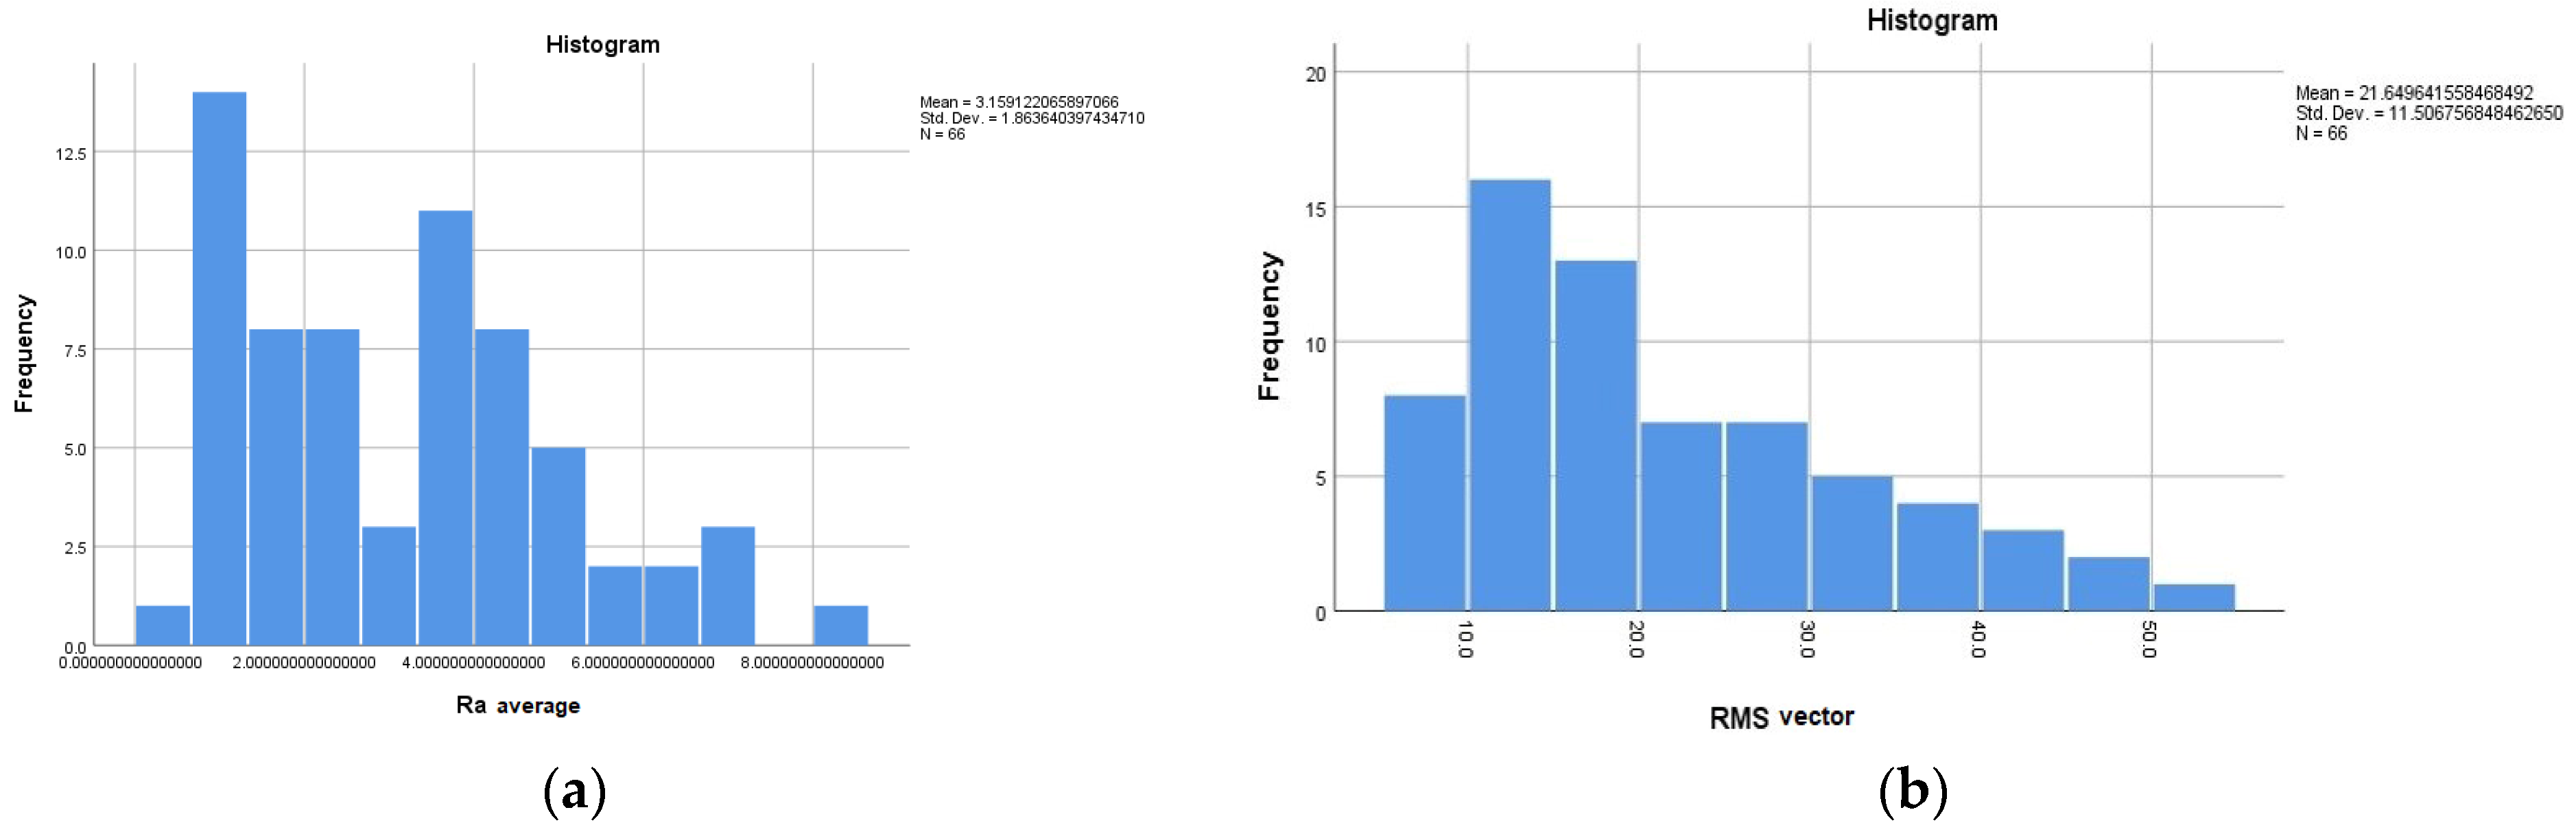
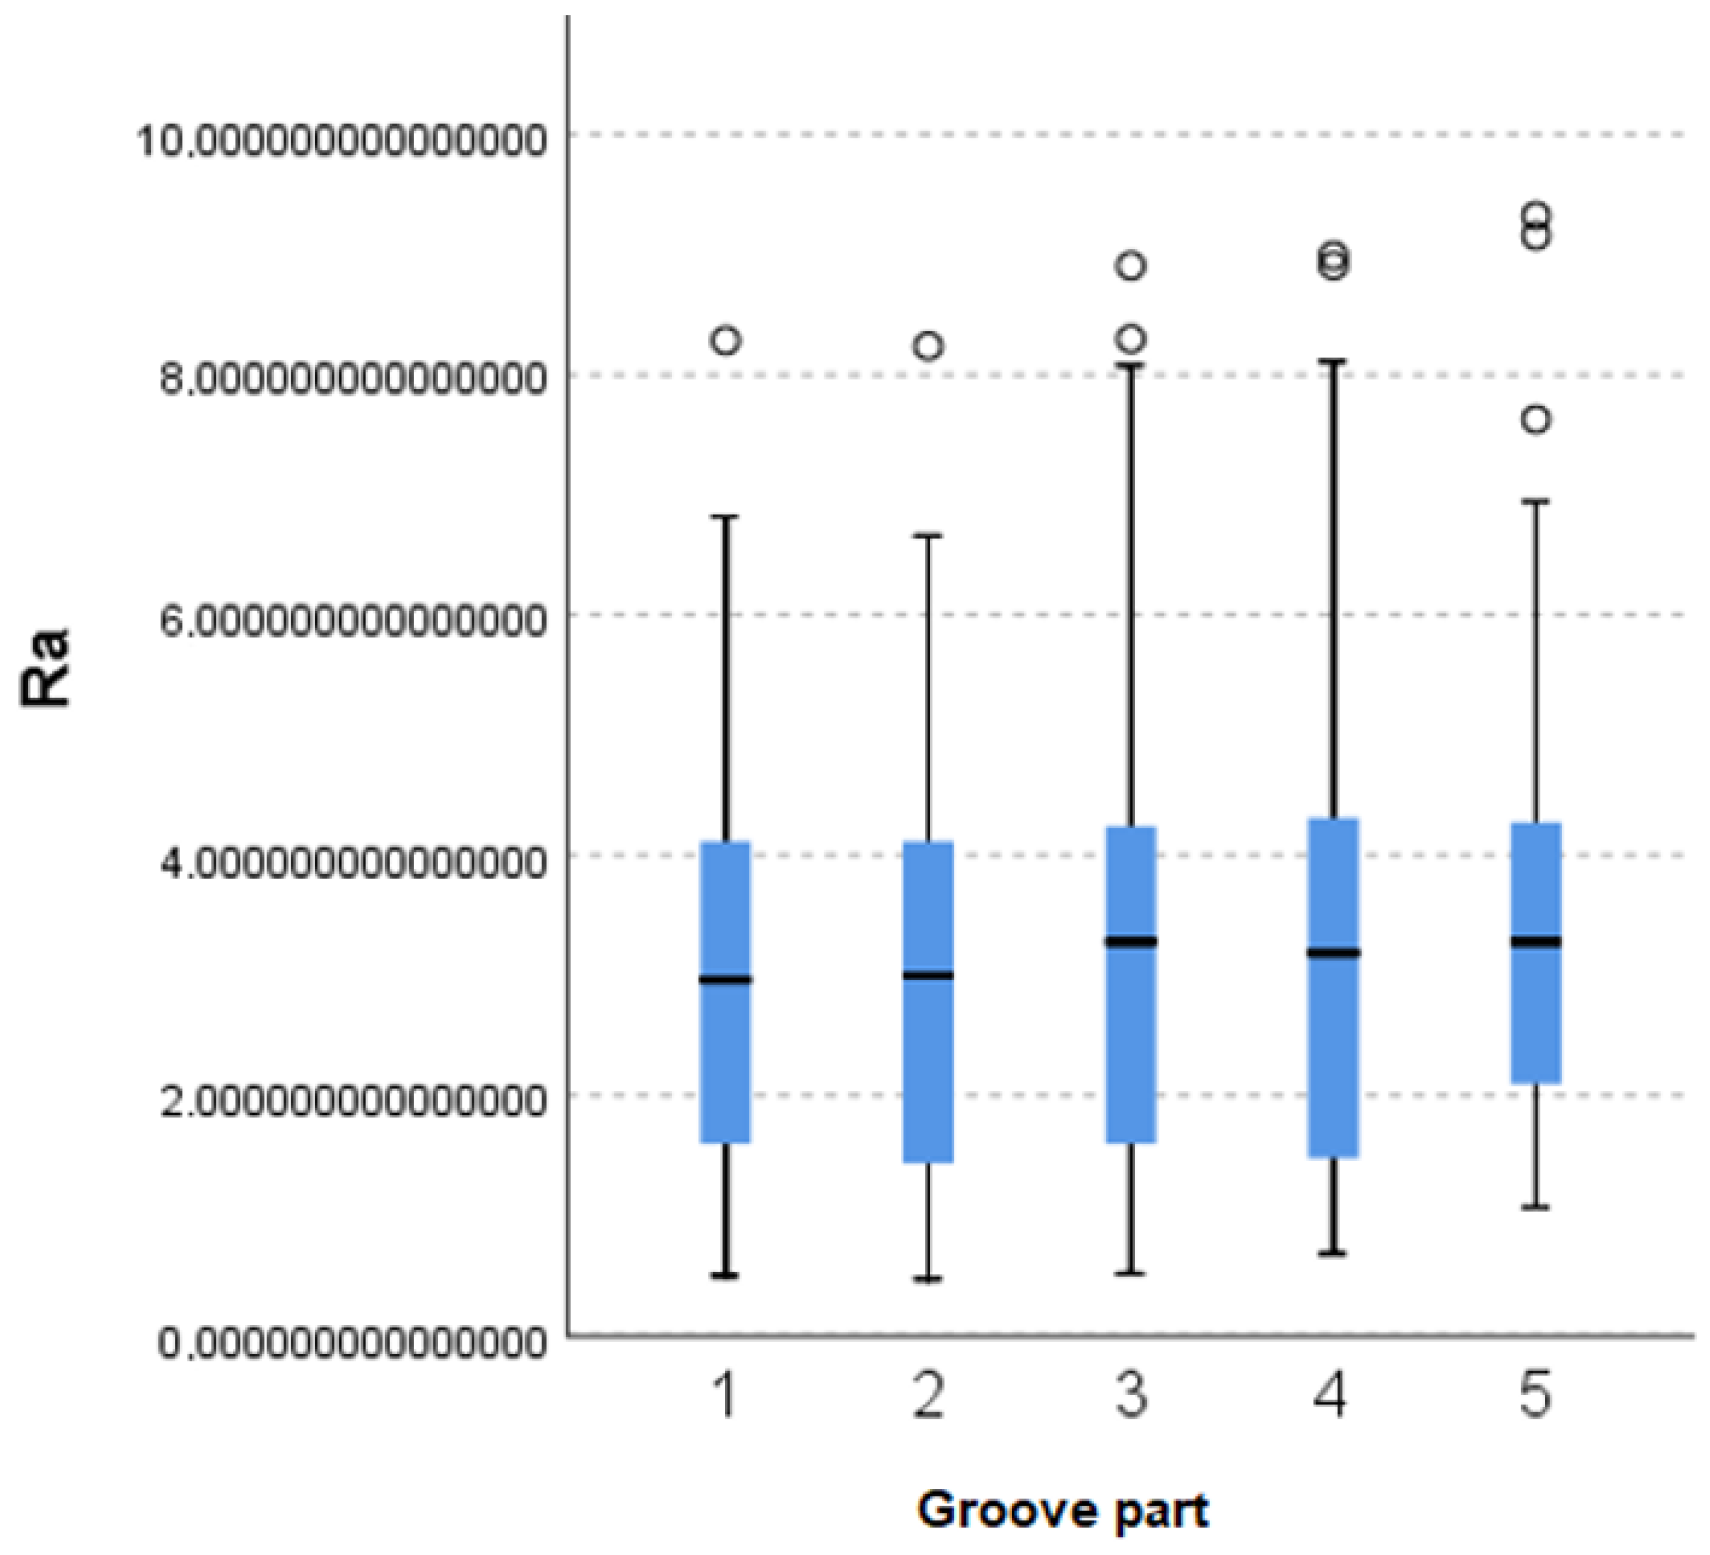
In the statistical analysis, the values of average roughness Ra average and the RMS vector vibration values were taken into account. The measured roughness and vibration values were statistically evaluated using IBM SPSS Statistics version 26. We tested the normality of the data using the Kolmogorov–Smirnov test. The result of the normality test yielded a p-value of 0.007 for the average roughness Ra average, and for the RMS vector value, we obtained a p-value of 0.003. The results of the normality test can be seen in the following images, where Image 19-a shows unevenly distributed values for Ra average, and Image 19-b graphically represents the unevenly distributed values for the RMS vector values.
Since the data were unevenly distributed based on descriptive statistics, we opted for non-parametric tests (
Figure 19). In preparing to compare the individual values of all segments, we used the Independent Samples Kruskal–Wallis Test. When observing the differences in roughness measured in the various segments across all changing technological parameter settings, no statistically significant differences in the average values were found (
Figure 20), with
p = 0.588.
Based on the results, we can determine that there is no difference in the measured values of Ra among the individual segments (10–20 to 30–40) in the given grooves. This means that the roughness measurement in the main experiment will only take place in the middle part of the groove (20–30), which will significantly reduce the number of repeated measurements and decrease the time required for conducting the main experiment.
Another aspect of our statistical analysis was to examine the correlations between selected technological parameters and roughness. Since the previous results showed that we were working with unevenly distributed data, we chose the non-parametric equivalent for correlation analysis (Spearman’s correlation test;
Table 12). In
Table 12, the significance level is indicated with asterisks, showing the strength of statistical significance, where *—
p < 0.05, **—
p < 0.01, and ***—
p < 0.001.
The values of the correlation coefficient r ranging from 0.8 to 1 (or −0.8 to −1) are considered particularly strong, indicating a very strong mutual dependence between the variables. Values from 0.4 to 0.8 (or −0.4 to −0.8) are considered moderately strong, while values from 0 to 0.4 (or −0.4 to 0) are considered weak. From the correlation results, it is clear that the r values for the spindle speed parameter take on negative values, indicating an inverse relationship. In our case, this explains the fact that as we set the spindle speed parameter to a higher value, the resulting roughness values tend to be lower. The correlation values for the spindle speed parameter fall within the moderate range of 0.4 to 0.8, suggesting that spindle speed has a moderately strong impact on the resulting surface quality.
In the following figure (
Figure 21), we can observe the dependence of roughness on spindle speed, where we compared the change in roughness at spindle speeds of 6000 rpm and 10,500 rpm. This comparison was conducted with a constant depth of field parameter of 0.5, 1, and 1.5 mm. As shown in
Figure 21, roughness at 6000 rpm reaches higher values than at 10,500 rpm for all values of material removal and varying feed rates of the tool.
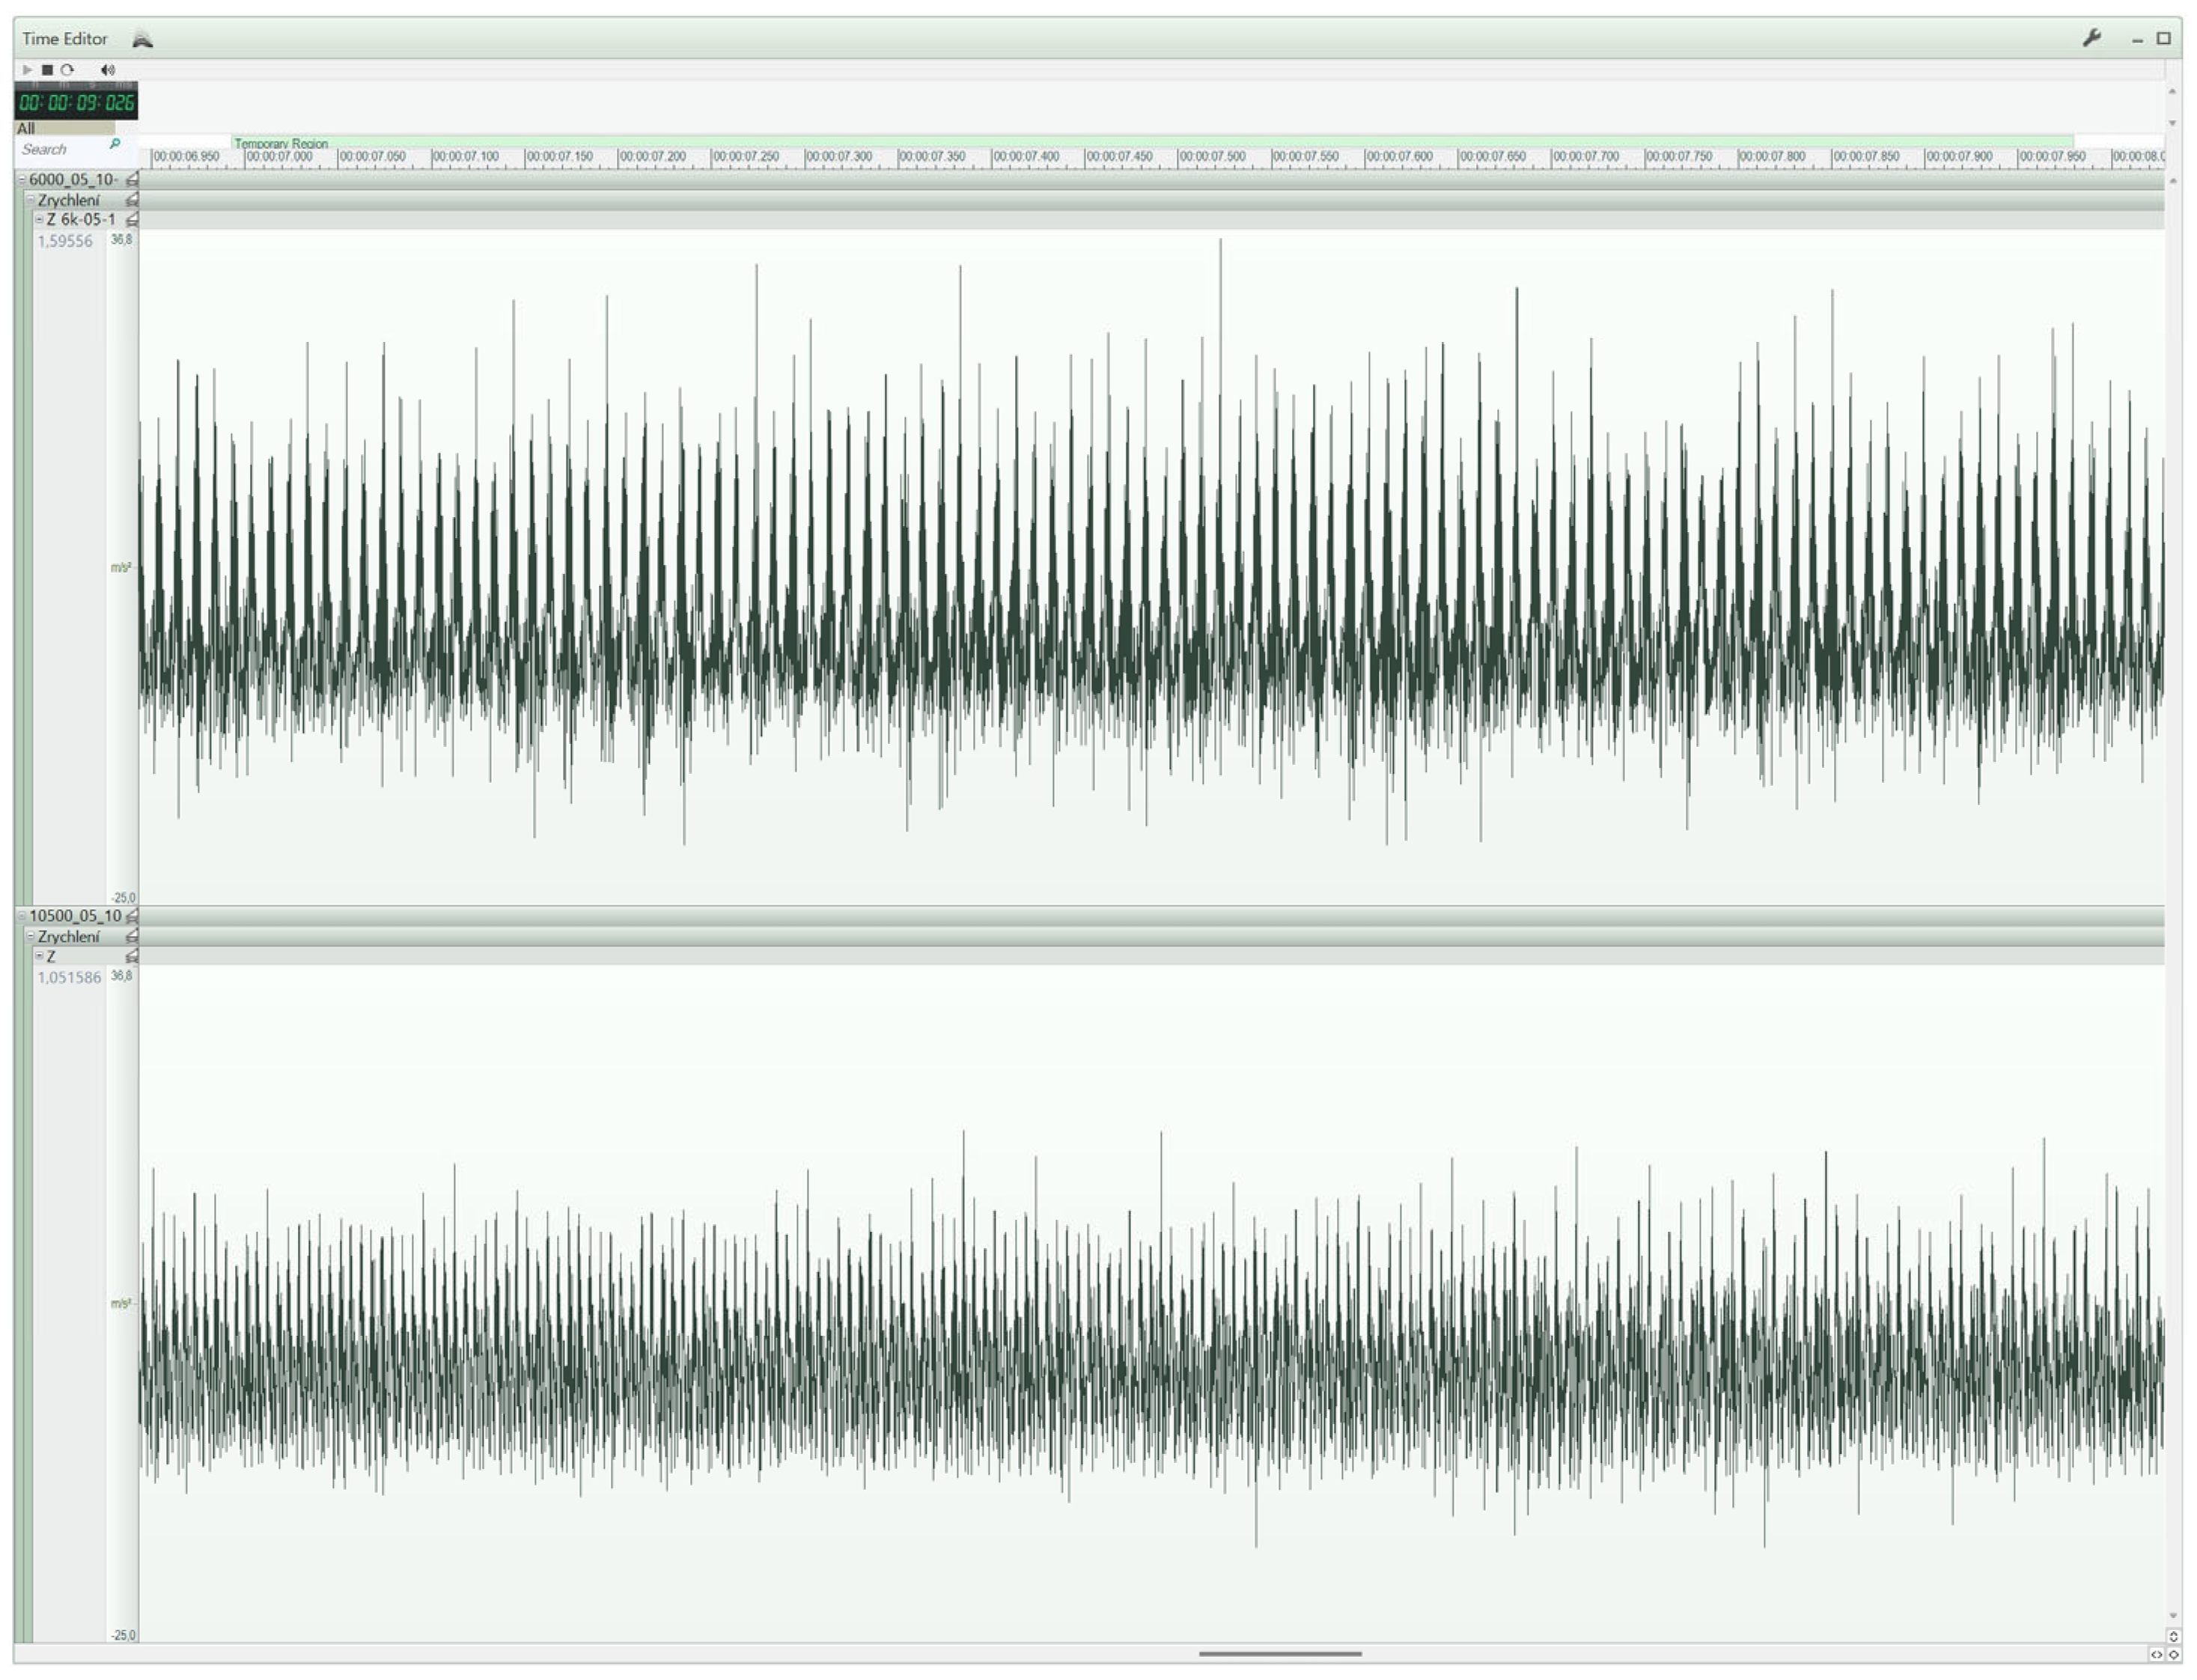
As seen, the parameter representing spindle speed has an effect on the resulting roughness of the groove, and with increasing spindle speeds, the roughness values decrease. This fact is also reflected in the following comparisons of vibration results, where we compared the actual vibration profiles between the maximum and minimum spindle speeds.
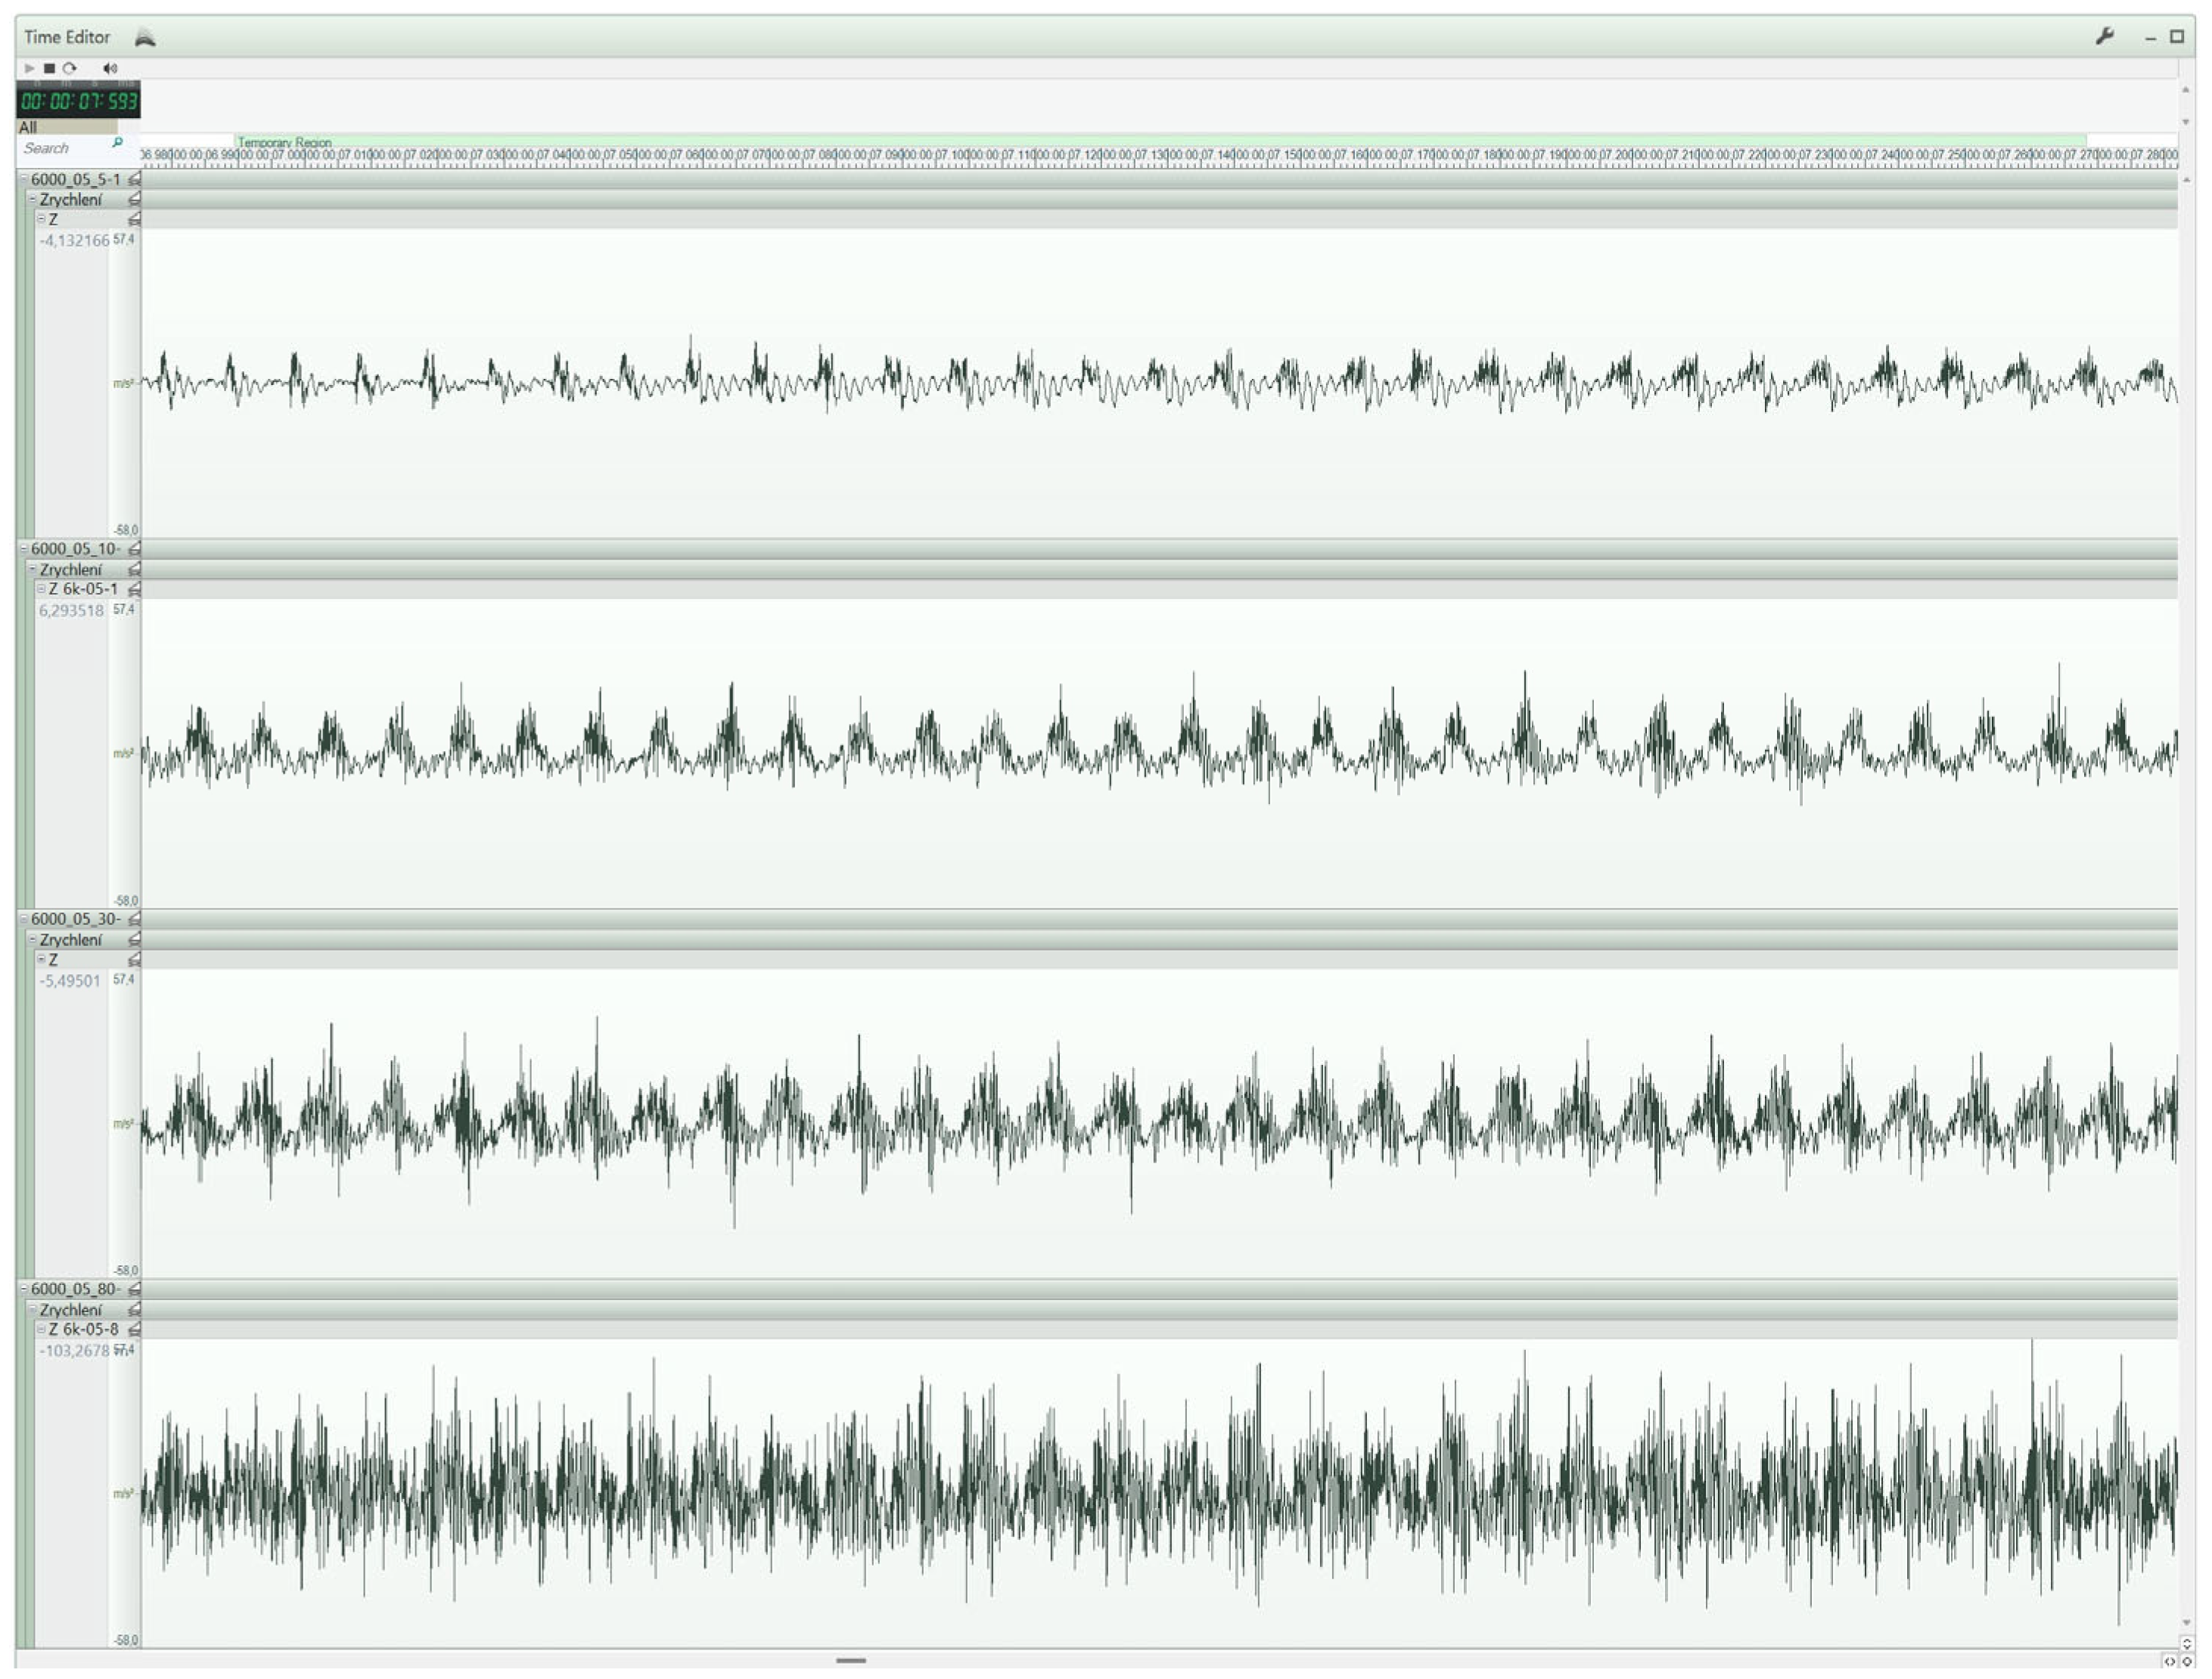
Figure 22 illustrates the different amplitudes between the set spindle speeds of 6000 rpm and 10,500 rpm, with a depth of field of 0.5 mm and a tool feed rate of 10 mm/s. The upper part of the figure displays the accelerations at 6000 rpm, while the lower part represents the vibration profile at 10,500 rpm. This comparison further emphasises the relationship between spindle speed and vibration behaviour during the machining process, highlighting the impact of varying speeds on the system’s dynamic response.
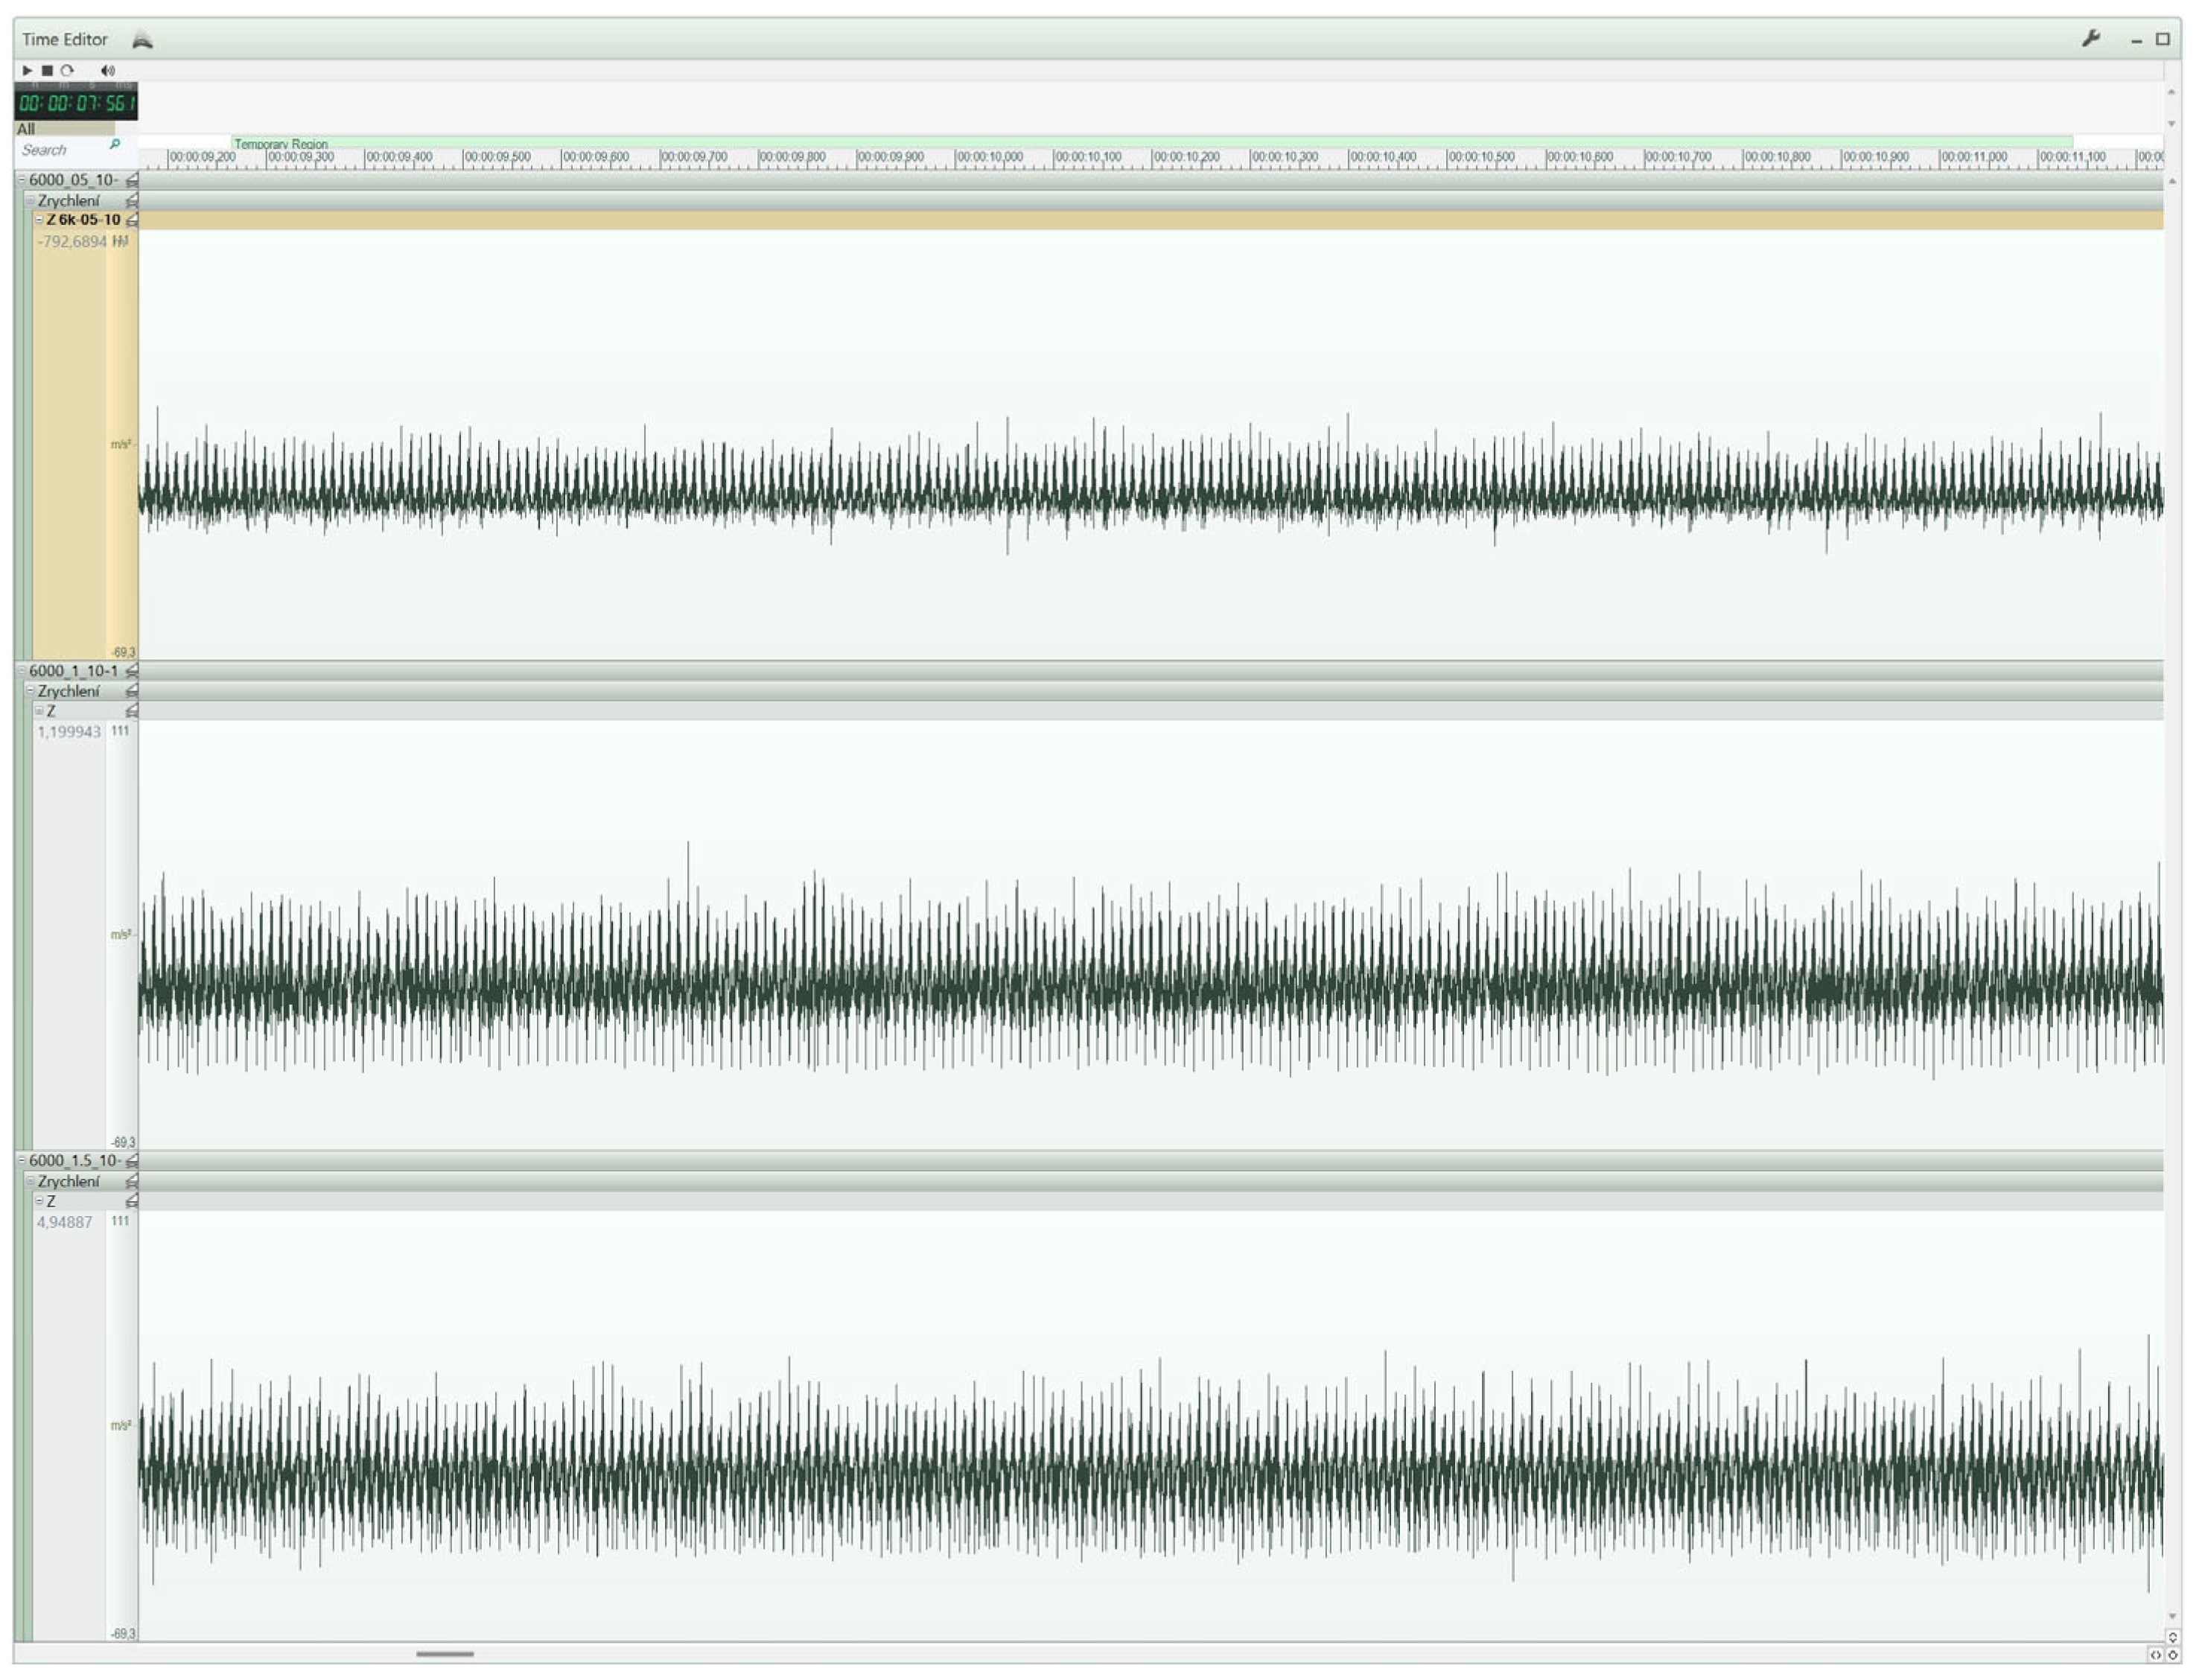
The second technological parameter examined, affecting the surface roughness of the groove, was the depth of field. For this parameter, we recorded values indicating a weak correlation (0 to 0.4), which means that the depth of field has the least influence on the final surface quality of the machined material. When comparing the vibration profiles with the same spindle speeds and tool feed rates but with varying depths of field, we can see that the amplitude differences are minimal. To illustrate this slight amplitude difference, we compared the vibration profiles (
Figure 23) during groove milling at a spindle speed of 6000 rpm and a tool feed rate of 10 mm/s. The upper part of the figure represents the vibration profile for a depth of field of 0.5 mm, the middle part shows the profile for a depth of 1 mm, and the bottom part represents the profile for a depth of 1.5 mm.
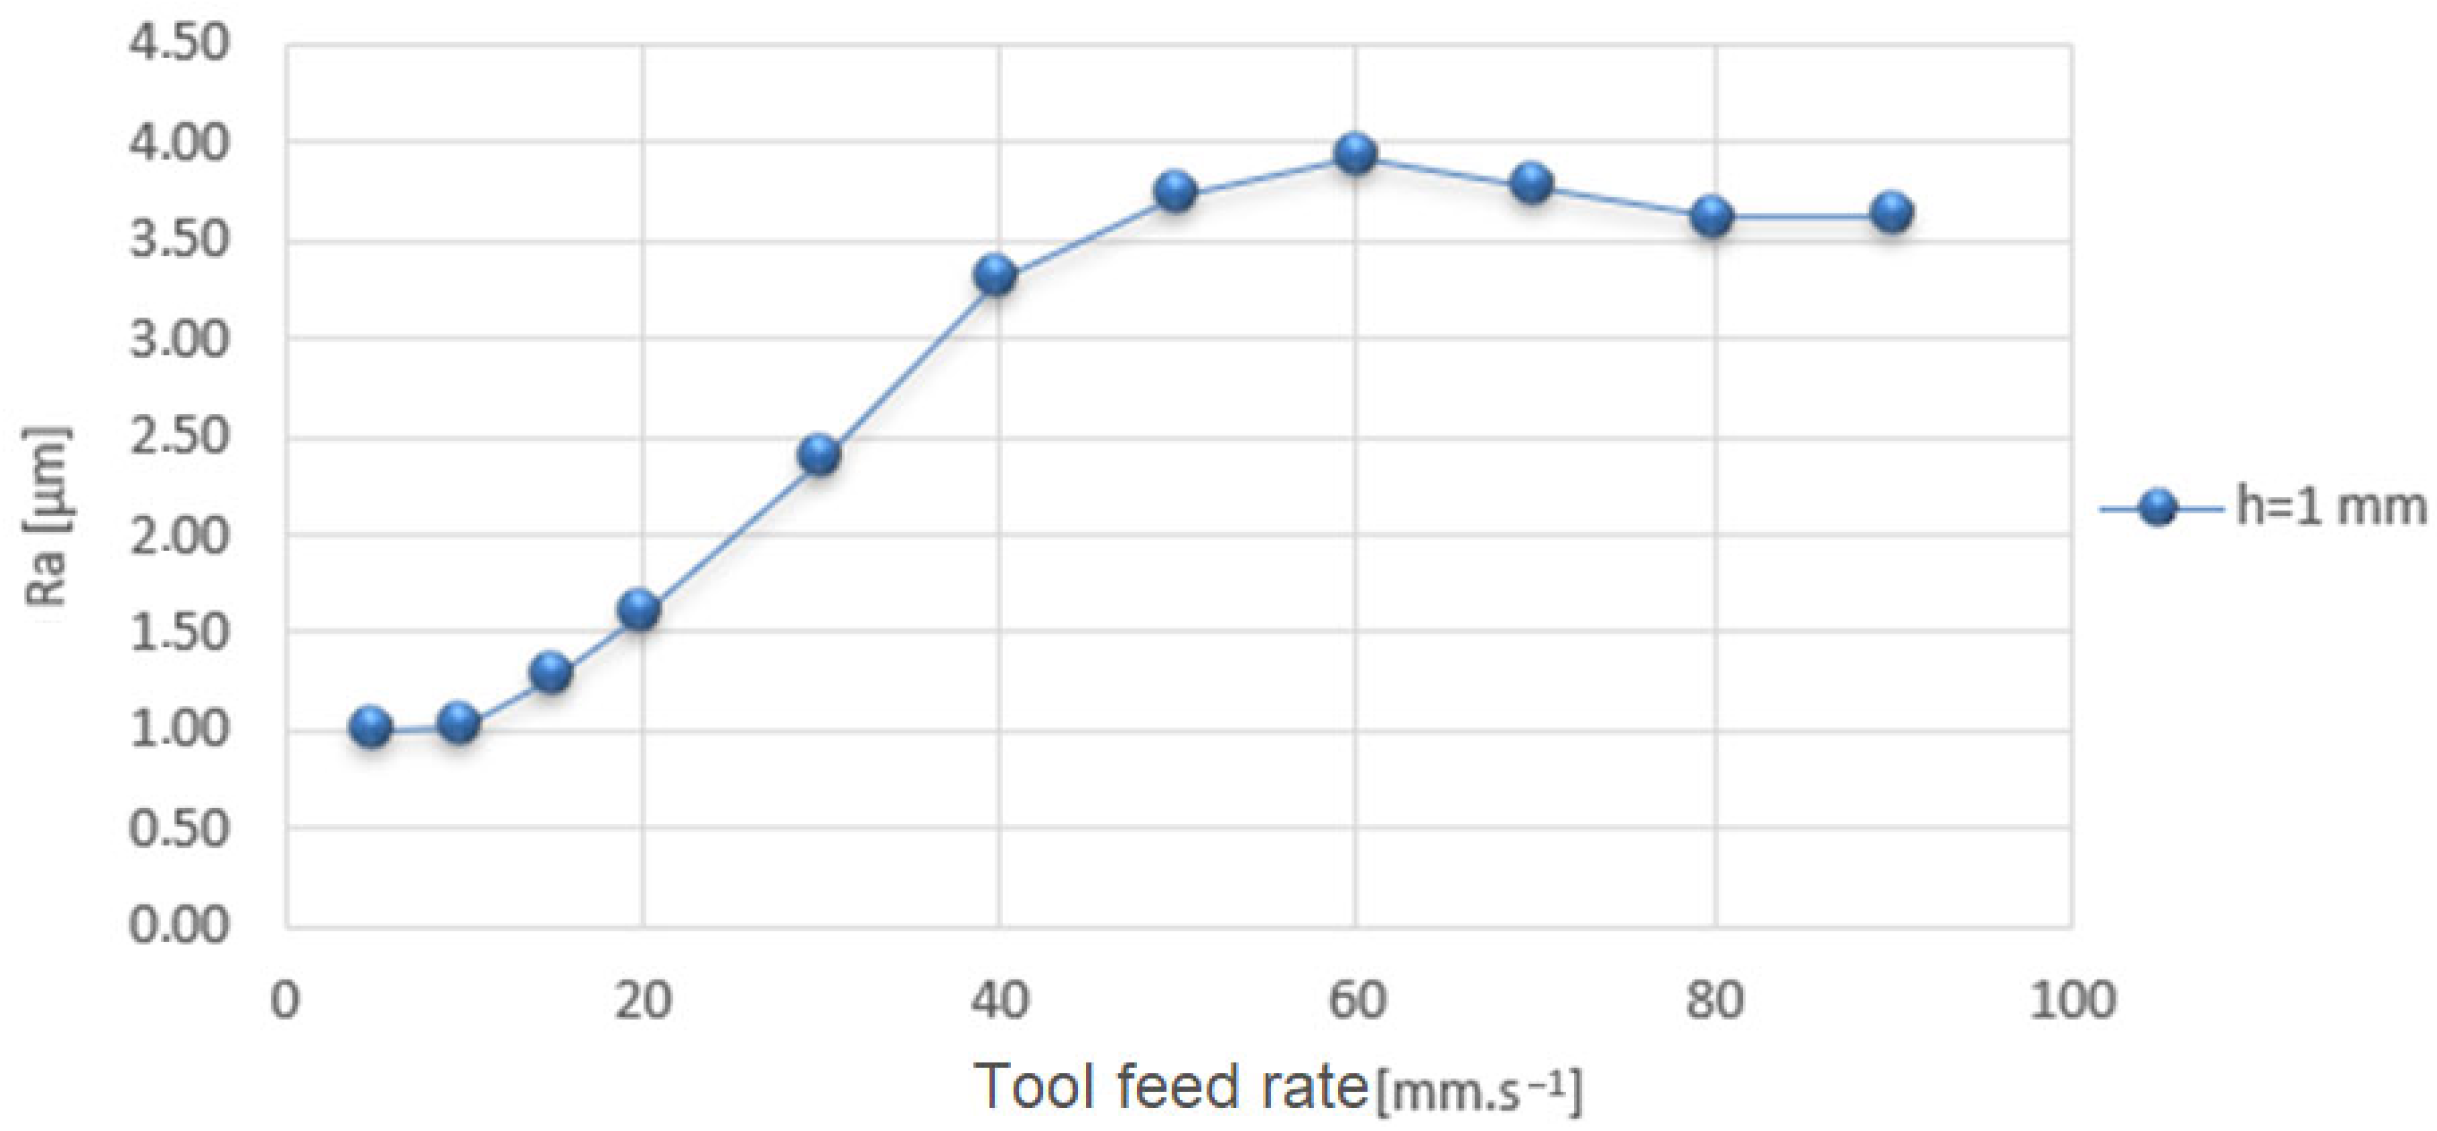
It is worth noting that the tool feed rate parameter shows particularly strong correlation values (0.8 to 1), indicating that this parameter has the greatest influence on the resulting surface quality. This can also be illustrated by
Figure 24, where we observe an increase in surface roughness as the tool feed rate increases.
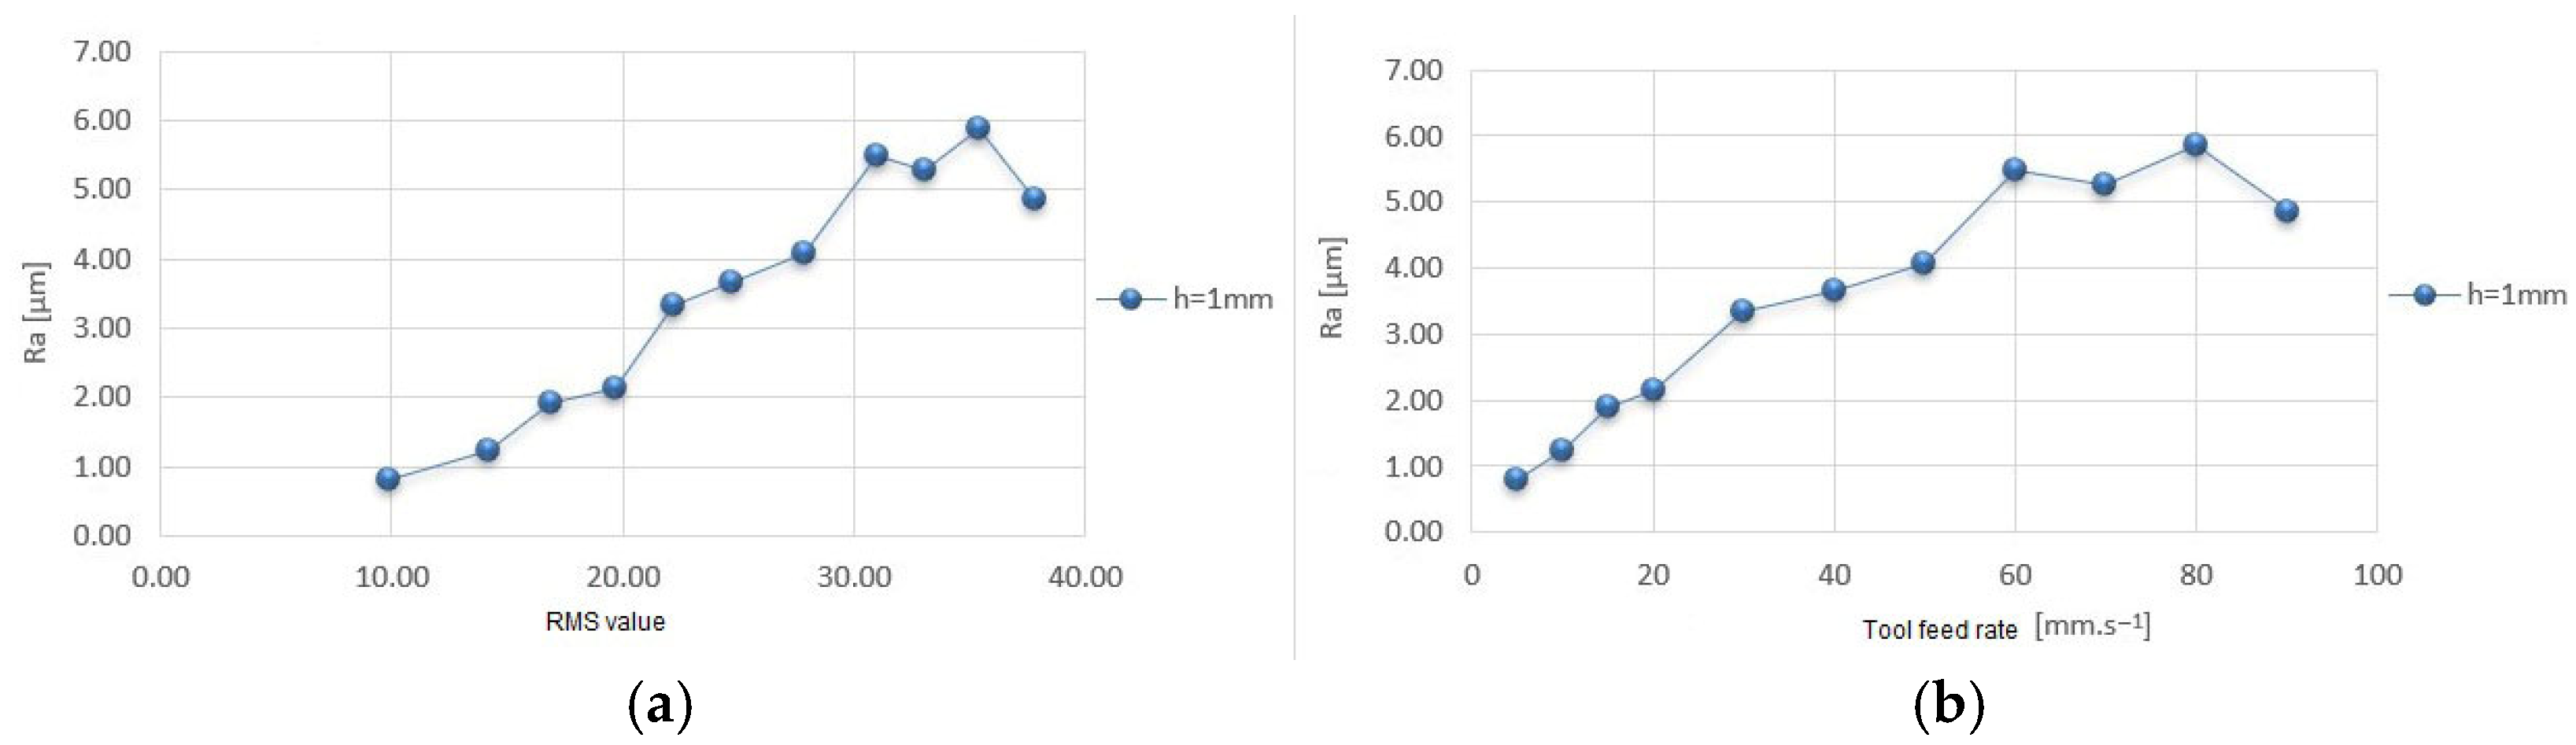
Figure 24 depicts the dependence of surface roughness on tool feed rate at a depth of field of 1 mm and spindle speed of 10,500 rpm. Significant differences were also observed in the vibrations, as shown in
Figure 25. The vibration samples were displayed for corresponding technological parameters with feed rates of 5 mm/s, 10 mm/s, 30 mm/s, and 80 mm/s. The higher feed rates led to increased surface roughness and vibration amplitudes, highlighting the importance of this parameter in achieving the desired surface finish.
In
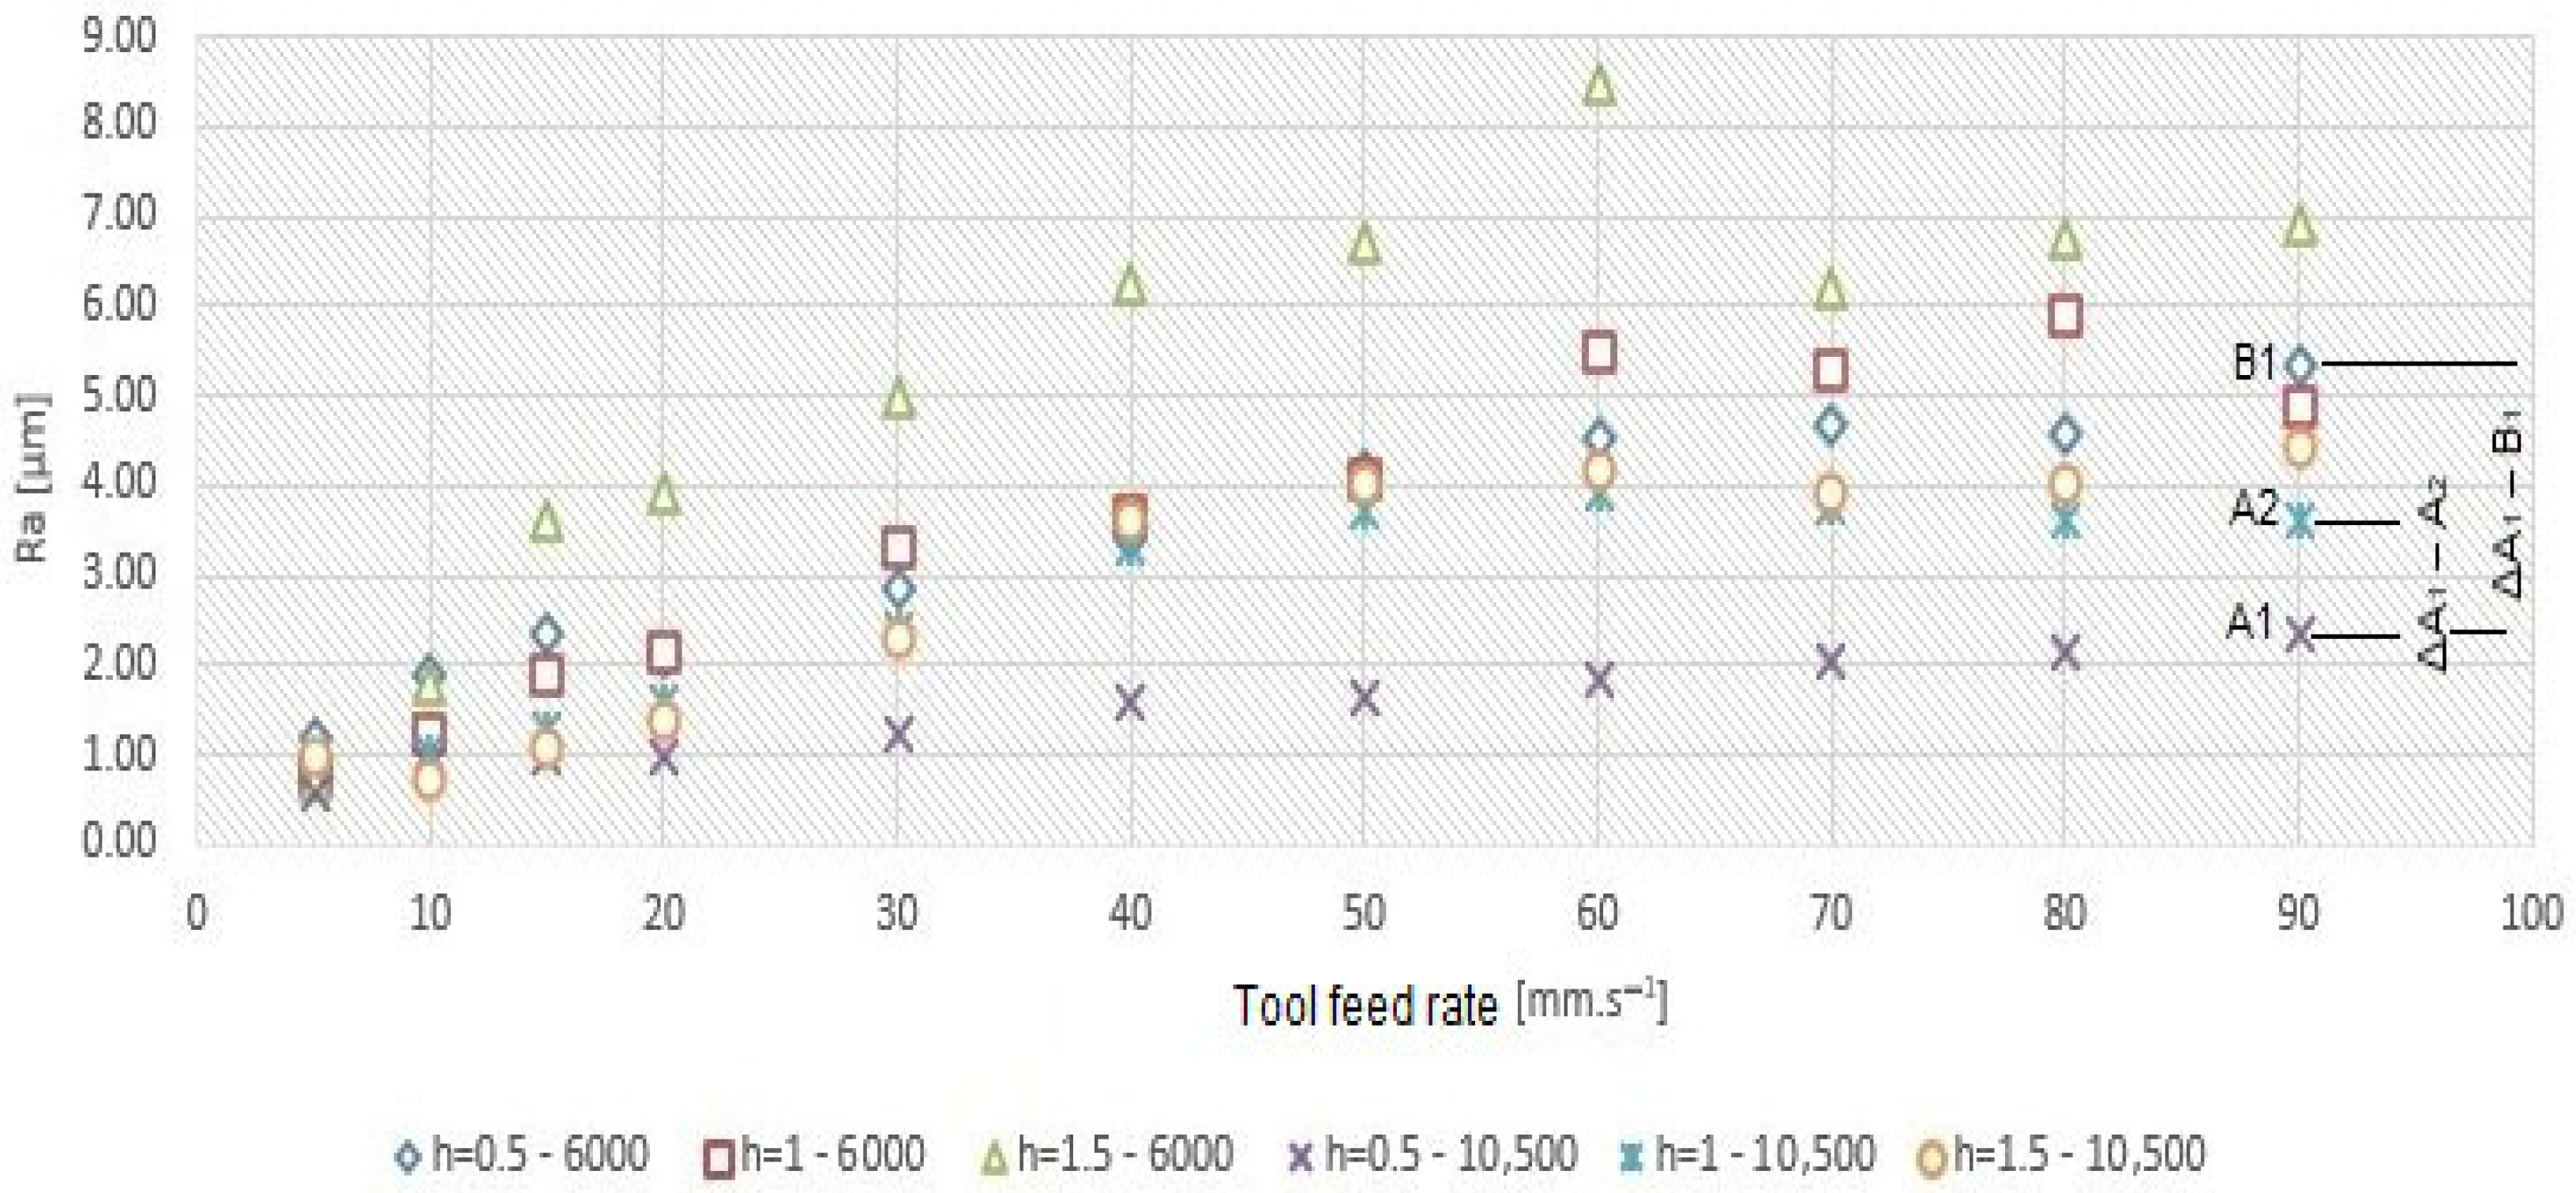
Figure 26, we can see an overall comparison of the feed rate of the tool in relation to the resulting surface quality of the machined material, considering changes in both the depth of field and spindle speed. From the figure, we can clearly observe the comparison of the significance and level of influence of the technological parameters (spindle speed and depth of field) on the resulting surface roughness. If we take into account the Ra average value (purple cross mark) at a speed of 90 mm · s
−1 (point A1), which corresponds to technological parameters such as a spindle speed of 10,500 rpm and a depth of field of 0.5 mm, and compare it with point A2 (marked with a blue star), which has identical technological parameters except for a depth of field of 1 mm, we can observe a minimal difference in the Ra roughness value (ΔA1–A2). However, if we apply such a comparison while maintaining the depth of field of 0.5 mm and include point B2 (marked with a blue diamond), where the technological parameter spindle speed is changed to 6000 rpm and compared with point A1, we obtain a larger difference in Ra roughness values (ΔA1–B1). This graphical representation allows us to highlight the results of the statistical analysis, which suggests the significance of individual technological parameters on the resulting surface roughness. This means that spindle speed has a more significant impact on surface roughness than changes in depth of field, especially as the tool feed rate increases.
The final parameter investigated through statistical analysis was the RMS V value. The RMS V value showed the highest correlation with the Ra mean roughness value (r = 0.793). From previous results, we know that the most significant influence on surface roughness comes from the tool feed rate parameter. The results from the statistical analysis indicate that the RMS V value significantly affects the surface roughness of the machined material. From the combined results, we can conclude that the RMS V value significantly influences the final quality of the machined material, Ra, meaning that the surface roughness is significantly dependent on vibrations. The results can be visually presented in
Figure 27, where the left side shows a graph of the dependence of roughness on tool speed, and the right side illustrates the graph of roughness dependence on the RMS value. In the first graph, we observe an increase in the Ra value with increasing speed, which correlates with the increasing roughness from the RMS V value.
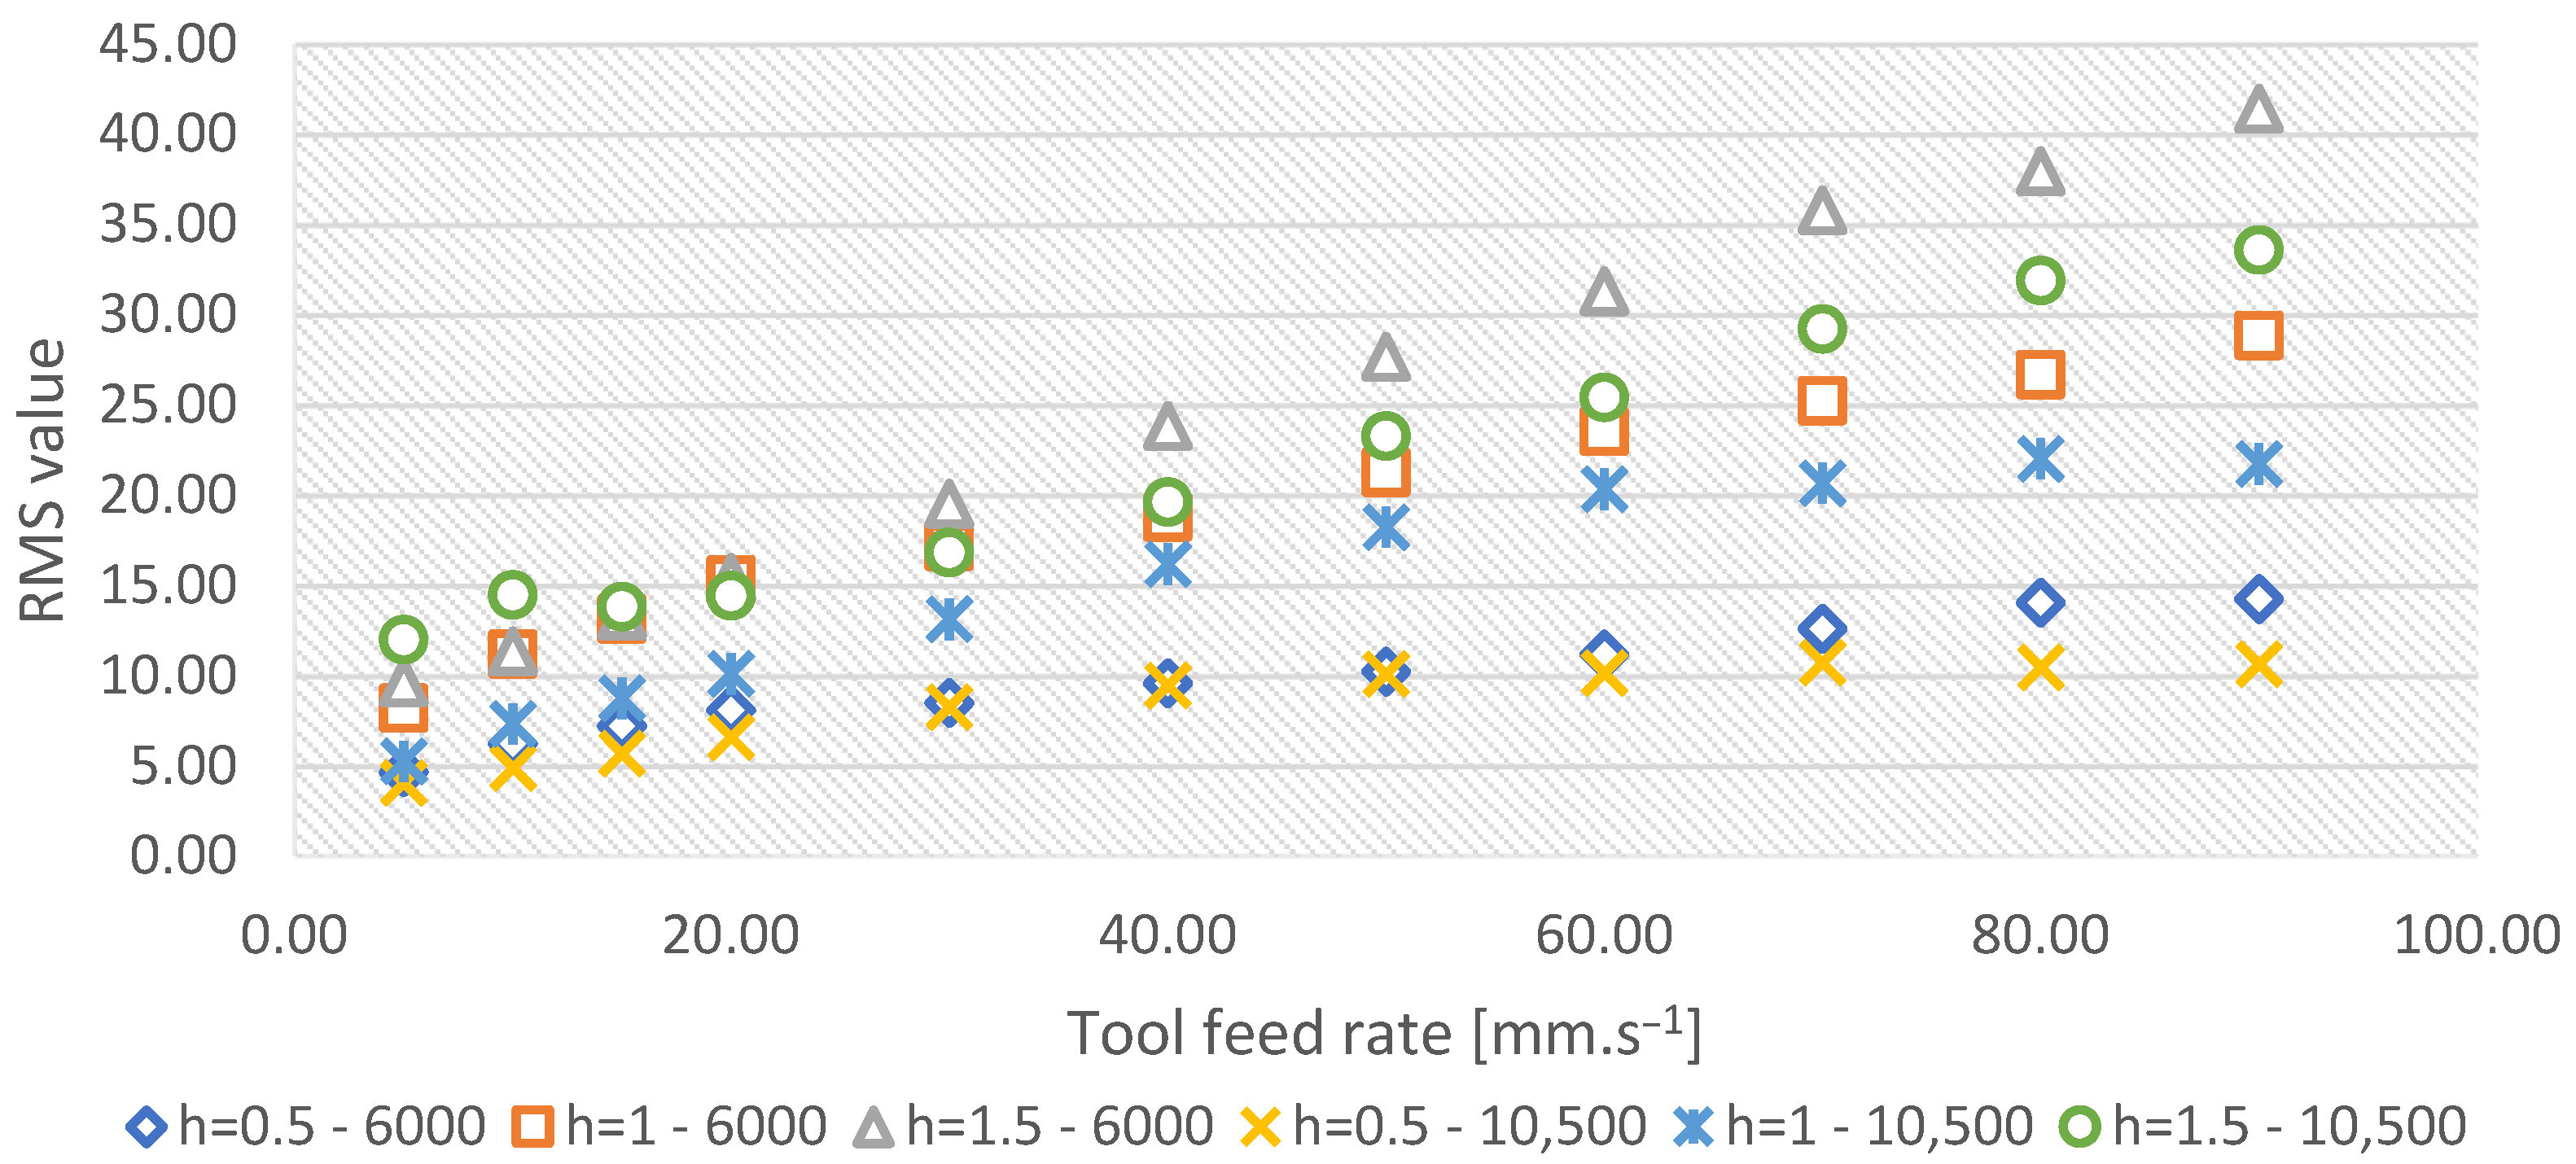
In addition to the significant dependence on the Ra value, RMS V values also show a high correlation coefficient with all technological parameters, except for spindle speed. A strong correlation was noted between the tool feed rate and the depth of field, where these parameters exhibited approximately the same correlation value. The significance and level of influence of the technological parameters on the RMS V values is also illustrated in
Figure 28.
If we compare the RMS V values at technological parameters such as a spindle speed of 10,500 rpm with a depth of field of 0.5 mm across the entire range of tool feed rates (yellow cross) to those at a spindle speed of 6000 rpm with the same depth of field of 0.5 mm across the entire range of tool feed rates (blue diamond), we observe minimal differences in the RMS V values. Furthermore, if we compare the RMS V values at a spindle speed of 10,500 rpm and a depth of field of 0.5 mm across the entire range of tool feed rates with the RMS V values corresponding to a spindle speed of 10,500 rpm and a depth of field of 1 mm across the entire range of tool feed rates (blue cross), we can see a significant difference in the RMS V values. If we were to conduct all comparisons of spindle speeds and depth of field in relation to the RMS V value, we would find consistent results showing larger differences in values between the depth of field and the RMS V and minimal differences between spindle speeds and the RMS V value. This aligns with the results of the statistical analysis.
4. Discussion
Machining is one of the most complex processes in the manufacturing field, which presents a significant challenge for a robotic manipulator with low stiffness. In numerous discussions on robotic machining, technological parameters and their influence on the milling process have been emphasised. The generation of the tool path is the main distinction when comparing the mechanism between a robot and a CNC machine tool [
28]. Robots used in machining processes have many advantages over traditional machines, but the phenomenon of vibrations in robotic milling prevents its widespread adoption. As a result, discussions have arisen about the issue of vibrations during planar milling with robots and the method of generating the milling tool path, as well as the positioning of the workpiece clamping, with the aim of providing guidance on how to suppress vibrations and improve production quality [
29]. In most cases, researchers have focused on the position and placement of the machining material relative to the base of the robotic arm, as well as the tool movement strategy.
Authors Jing Li and Biao Li [
30], in their study, focused on the vibrations of the robotic arm and examined the surface quality of the machined material in relation to the change in the cutting tool movement along the X and Y axes under identical technological parameters. The results indicate that there is a difference in which direction the cutting tool, attached to the robotic arm, moves, due to the robot’s stiffness characteristics. This is because the stiffness of the robot varies across the X, Y, and Z axes. The experimental findings also demonstrate that the clamping position of the workpiece relative to the robot significantly impacts the stability of vibrations in the robotic arm. The surface quality of the workpiece is better in areas where the robotic arm is more stable. At the optimal position, the surface quality improved by 57.3%, and vibrations were reduced by 50.3%. The second examined factor was the tool path, where the authors revealed that the highest stiffness of the robotic arm is along the X axis of the global coordinate system, while the lowest stiffness is along the Y axis. Additionally, the further the cutting tool is positioned from the robot’s global coordinate system, the lower the stiffness of the robot becomes. These results highlight the importance of positioning the workpiece relative to the base of the robotic arm.
In the study by Xu et al. [
31], the authors investigated the influence of two key parameters (robot performance dependent on position and the type and geometry of the cutting tool) on cutting force and surface quality improvement. A robotic machining system was developed for this research, consisting of a six-axis industrial robot, a two-axis positioning device, and a linear track. The combined effect of milling process parameters and the robot’s position on machining outcomes was experimentally examined. A multi-objective optimisation was conducted based on Taguchi’s grey relational analysis to achieve lower cutting forces and improved surface quality. The optimal combination of process parameters and robot positions was identified, resulting in the best overall milling performance. The study’s results demonstrate that the cutting force is heavily influenced by the choice of process parameters, highlighting their importance in affecting the cutting force. Additionally, the position of the robot was found to have a significant impact, which cannot be overlooked. Overall, the depth of field was identified as the most critical factor affecting cutting force in both the Y and Z directions. A deeper field intuitively generates a higher cutting force, which in turn leads to increased vibrations throughout the entire assembly. The study further revealed that the main factors influencing the surface quality of the machined material are the milling process parameters, where the key components were spindle speed, tool path, and the orientation of the positioning table (worktable). It was found that vibrations are influenced not only by the process parameters but also by the configuration of the robot. This is likely because the robot’s dynamic behaviour changes within its workspace. The results suggest that the robot exhibits higher stiffness in certain positions, which are more favourable for robotic machining. The statistical method ANOVA showed that the depth of field, orientation of the positioning table, and spindle speed were the three most significant factors affecting the cutting force in the Y direction (Fy), with contributions of 27.18%, 19.44%, and 15.83%, respectively. The analysis revealed similar results when examining the parameters’ influence on the cutting force in the Z direction (Fz), where the depth of cut contributed 31.69%, the orientation of the positioning Table 18.4%, and the spindle speed 18.29%. Regarding surface quality, the spindle speed had the most significant influence, accounting for 40.12%, while the orientation of the positioning table represented the primary factor with a contribution of 11.89%.
In the analysed literature, Pillai et al. [
32] also addressed the issue of machining using a robotic arm, where the goal of their study was to derive sets of optimal combinations of process parameters for face milling on the aforementioned six-axis robotic machining centre. The study also examined the influence of process parameters such as tool path, spindle speed, and feed rate on performance characteristics, including machining time and surface roughness. The study utilised Taguchi’s Grey relational analysis (GRA) and ANOVA to explore the effects of machining parameters (spindle speed, tool path, and feed rate). The optimal combination of process parameters estimated through Taguchi’s grey relational analysis was as follows: the optimal tool path was the raster path, spindle speed was 14,000 rpm, and feed rate was 800 mm/min. Upon closer examination, the analysis revealed that the tool path strategy was one of the parameters that most significantly influenced performance characteristics like machining time and surface roughness. The tool path strategy accounted for up to 70.58% of the contribution to surface quality, followed by cutting speed with a share of 28.47% and feed rate with a contribution of only 0.95%.
Studies focused on machining using robotic arms indicate that robotic manipulators exhibit low structural stiffness, which, in combination with technological parameters, significantly affects the resulting surface quality. The most influential factor with respect to stiffness is the position of the workpiece relative to the base of the robotic arm. In our study, the maximum extension of the robotic arm limited by the workspace was used, as this position was considered the most critical in terms of arm stiffness. Future research will focus on this issue by mapping the entire workspace in order to determine the optimal workpiece positioning, which will serve as the basis for the main experimental investigation. The influence of technological parameters reported in the literature highlights the significant importance of individual parameters. Our study focused on investigating the effect of selected technological parameters on the resulting surface roughness of the material. In the study by Xu et al. [
31], the depth of cut was reported as the most influential parameter; however, that work investigated cutting forces acting on the cutting tool in relation to changes in technological parameters. In that context, the depth of cut had the greatest influence. In contrast, in our study this parameter exhibited the lowest significance, as cutting forces were not monitored; instead, surface quality was evaluated, which is primarily influenced by the tool feed rate and spindle speed. Consequently, the depth of cut showed the least effect in terms of forces acting on the surface of the workpiece. Many studies primarily focus on cutting forces, whereas in our research vibration levels (RMS) and surface roughness were evaluated. It was also noted that technological parameters influence cutting forces differently than they affect surface roughness, which naturally leads to differing conclusions. While depth of cut is often a dominant factor in force-orientated studies, our results indicate that the tool feed rate is significantly more influential, which can be attributed to the lower stiffness of the robotic arm structure and its higher sensitivity to vibrations. Differences in the evaluated response variables (forces vs. roughness), as well as differences in material, robot type, and structural stiffness, logically result in differing outcomes. All of these insights will be taken into account in future research on robotic milling, contributing to the accurate design of the main experiment and the development of a mathematical model describing the milling process using a robotic arm.







 ,
,