Article

Research on the Mechanisms and Influencing Factors of Sediment Accumulation in Mountain Tunnel Drainage Trenches


1
School of Civil Engineering, Central South University, Changsha 410075, China
2
Hubei Communication Investment Group Co., Ltd., Enshi 430050, China
*
Author to whom correspondence should be addressed.
Appl. Sci. 2026, 16(4), 1758; https://doi.org/10.3390/app16041758
Submission received: 5 December 2025 / Revised: 21 January 2026 / Accepted: 30 January 2026 / Published: 10 February 2026
(This article belongs to the Special Issue Tunnel Construction and Underground Engineering)

Abstract

Sediment accumulation in the drainage systems of mountain tunnels is a typical issue threatening operational safety. To explore the sedimentation behavior under the coupling of multiple factors, this study systematically analyzes the coupled effects of sediment content, flow rate, slope, and cross-sectional shape on sedimentation through full-scale experiments and numerical simulations. The results indicate that: (1) the sediment accumulation is linearly positively correlated with sediment concentration (fitting slope of 0.87) and exponentially negatively correlated with flow rate and slope (R2 > 0.90); (2) for drainage trenches with different cross-sectional shapes under the same boundary conditions, the maximum flow velocity and anti-sedimentation capacity rank as narrow rectangular > semi-circular ≈ inverted trapezoidal > rectangular; (3) the study proposes engineering anti-sedimentation strategies, such as moderately increasing the slope and adopting a periodic concentrated discharge model to enhance sediment transport capacity using peak flow; (4) under the premise of meeting drainage and flood control standards, the inverted trapezoidal or semi-circular cross-sections are preferred. The bottom waterway width can be reduced to increase flow velocity, thereby achieving a synergistic optimization of drainage efficiency and operational reliability. This provides a quantitative basis for the structural selection and anti-sedimentation design of tunnel drainage systems.

1. Introduction

Tunnel drainage system blockage, a critical technical issue jeopardizing operational safety, has attracted widespread attention from both academic and engineering circles. According to statistics, over 63% of tunnel structural diseases in China are attributed to the failure of drainage system functions [1,2,3]. From the perspective of clogging mechanisms, the blockage of drainage systems in mountainous tunnels primarily arises from two mechanisms: the formation of mineral crystalline compounds and the deposition of debris. While the academic community has developed a well-established theoretical framework for the mineral crystallization clogging mechanism [4,5], systematic research on the process of debris deposition remains insufficient. The phenomenon of debris sedimentation blockage is mainly caused by long-term erosion of surrounding rock by groundwater, as well as sediment particles carried by water flow [6,7,8]. The complexity of its clogging mechanism requires a multidimensional analysis of the factors influencing sedimentation in order to develop effective prevention and treatment strategies [9,10,11]. This scientific issue has drawn considerable interest from scholars for in-depth exploration.
In the field of experimental research, scholars have studied the factors influencing drainage trench clogging through experiments and surveys. Ghosh C et al. [12,13,14] conducted indoor experiments and found that coarse particles were mostly intercepted by geotextiles before entering the drainage pipes, while fine particles entered the drainage pipes, where they settled and accumulated due to gravity and fluid dynamics, causing blockage. BA Crenshaw et al. [15,16,17] conducted an in-depth study on drainage pipes that had been in service for 11 years. Their research revealed that clogging developed rapidly in the initial years of service, with a gradual leveling off in later years. Furthermore, indoor experiments showed that the degree of clogging in drainage pipes exhibited a clear nonlinear relationship with service time and drainage volume. Liu Yuyang et al. [18] analyzed the chemical crystallization and physical clogging processes of particles in drainage pipes through indoor experiments and identified seven key solution parameters—pH, Ca2+, HCO3, SO42−, flow velocity, Mg2+, and temperature—as critical indicators for judgment. Through single-factor and orthogonal experiments, they found that the first five parameters promoted crystallization, while the last two inhibited it. They developed a five-level crystallization risk assessment system using an improved hierarchical analysis method.
In terms of numerical simulation research, scholars have employed advanced computational fluid dynamics (CFD) tools to reveal the dynamic characteristics of sediment transport. Yang Shaolin et al. [19,20,21] used Fluent to numerically simulate the sedimentation of sand carried by water flow in pipes. The results showed that lower water flow velocities, smaller water-sediment mass concentrations, and reduced water pressure led to weaker sediment-carrying capacity, which in turn made sediment deposition and drainage trench blockage more likely. Gong Xinjie et al. [22,23] employed Flow-3D software to simulate the three-dimensional hydrodynamic motion of sand particles in long straight pipes, analyzing the variation in flow velocity along the length of the pipe. They proposed the concept of a non-clogging flow velocity at various cross-sectional positions, which may provide a reference for the study of non-clogging drainage pipes in tunnels. Ye Zhendong [24,25,26] used ANSYS/Fluent numerical simulation and model experiments to analyze the impact of cross-sectional blockage rate, blockage interval, and blockage segment length on the flow capacity of drainage blind pipes in railway tunnels. They found that the cross-sectional blockage rate and the length of the blocked segment were key factors, and the flow capacity decreased significantly as both of these factors increased. When the cross-sectional blockage rate was <50%, the blockage interval had a greater impact, while when it exceeded 50%, the cross-sectional blockage rate became the dominant factor.
It is worth noting that the sedimentation process in tunnel drainage systems is not solely determined by near-field hydraulic controls (e.g., slope and geometry) but is also fundamentally governed by upstream boundary conditions, including sediment availability, transport regimes, and episodic forcing at the catchment scale [27,28]. While the ultimate sediment load is dictated by these external geological and hydrological factors, the internal transport capacity of the drainage trench determines whether this load accumulates or passes through. Therefore, understanding the hydraulic response to specific sediment concentrations—treated here as independent variables—provides a necessary baseline for engineering design, even though natural supply dynamics are more complex. Despite significant progress in existing research, most studies focus on the analysis of single factors, and the sedimentation behavior under the interaction of multiple factors remains unclear [29,30,31,32]. This study aims to analyze the influence of factors such as sediment content, water-sediment flow rate, and trench slope on sedimentation in drainage trenches through full-scale simulated experiments of tunnel drainage pipe operation. Additionally, by combining numerical simulation methods, this study innovatively conducts research on the optimization of drainage trench cross-sectional shape and proposes a sedimentation-prevention cross-sectional design method based on fluid dynamics characteristics. The research findings not only contribute to the improvement of the life-cycle design theory of drainage systems but also provide scientific support for enhancing the safety of underground engineering structures, offering significant theoretical value and practical engineering significance.
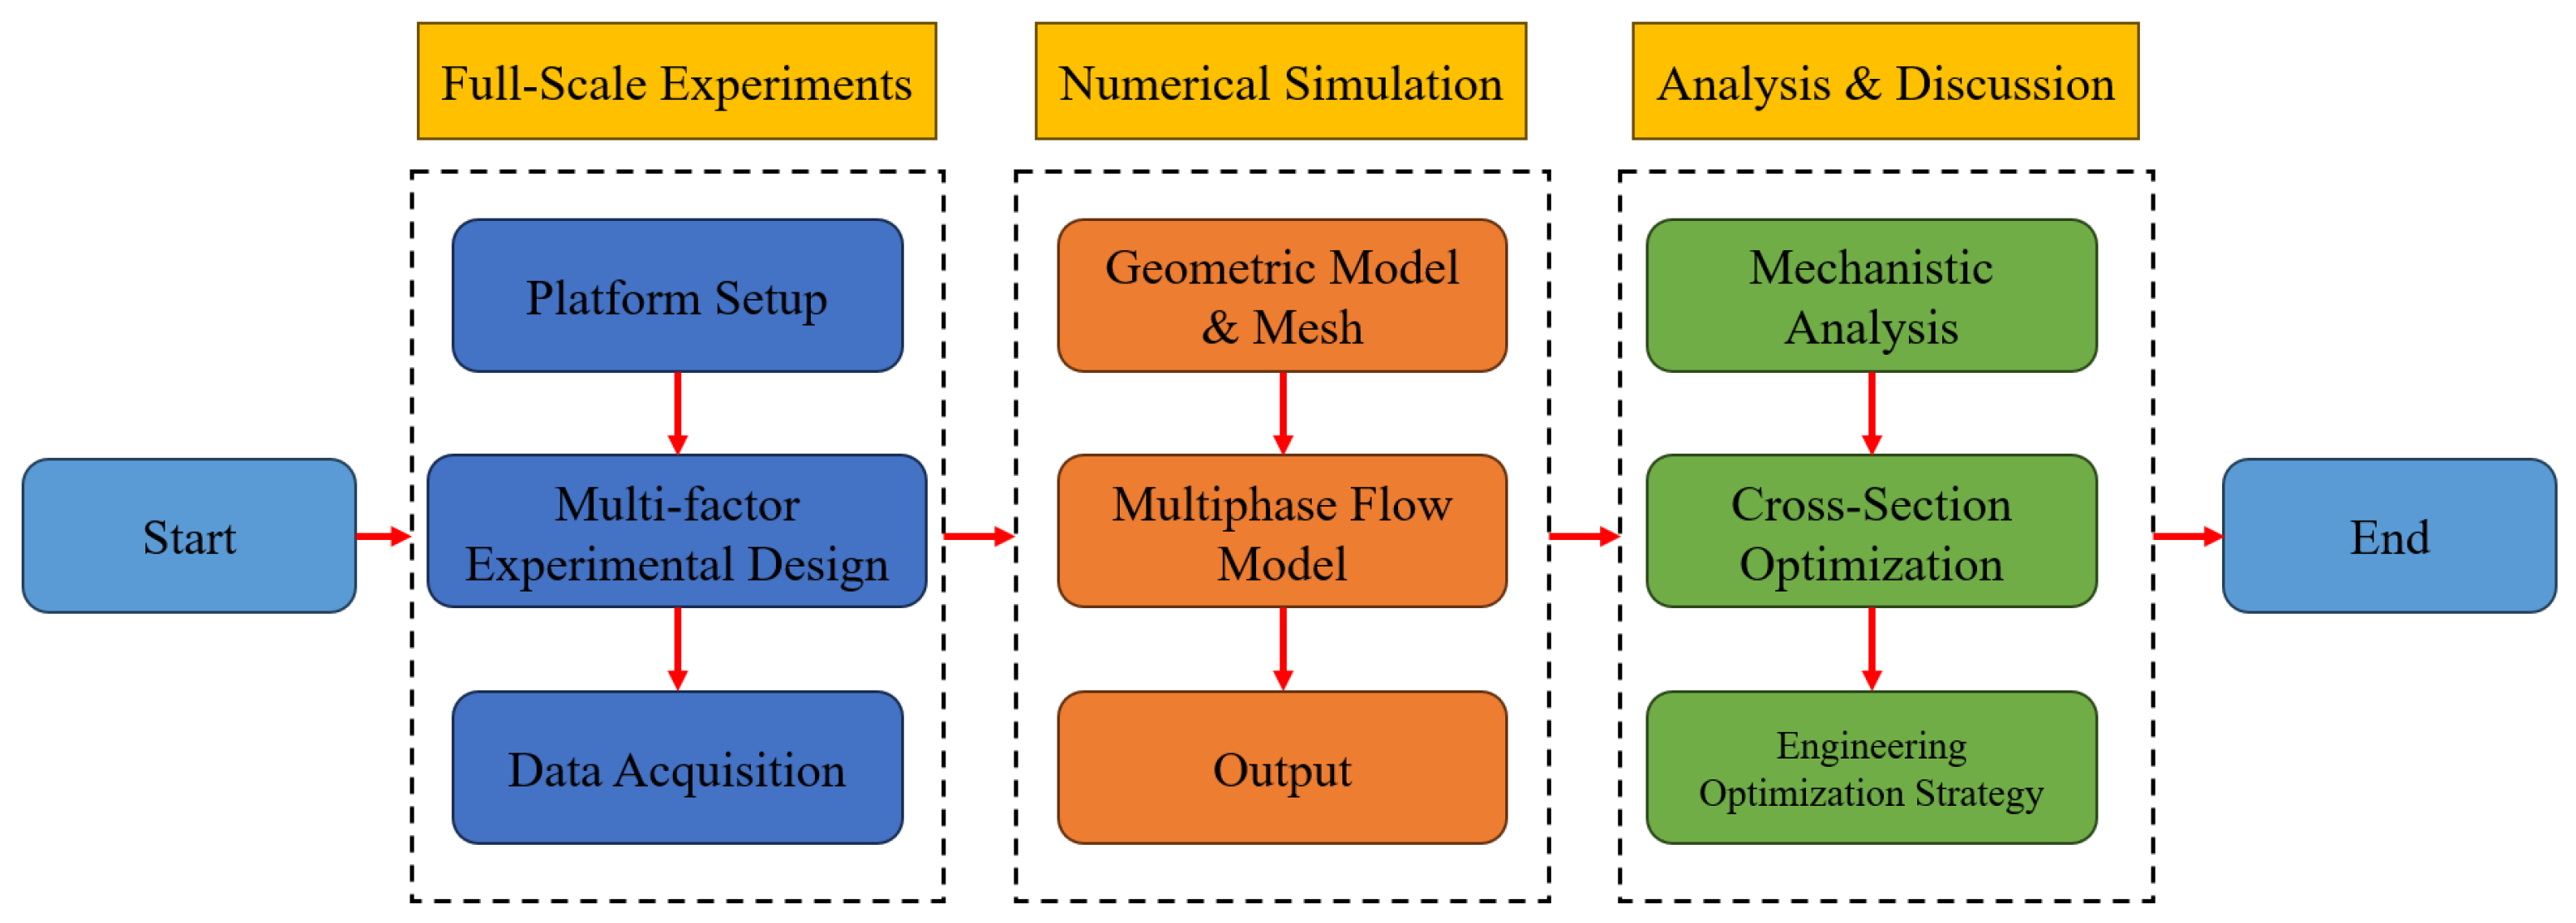
To clearly elucidate the logical framework and technical trajectory of this study, a comprehensive research methodology integrating full-scale physical experiments, numerical simulations, and theoretical analysis was established, as illustrated in Figure 1. This study first utilized a full-scale physical model platform of a drainage trench to characterize macroscopic sedimentation patterns through cyclic sediment injection tests across multiple operating conditions. Subsequently, the Eulerian Multiphase model and the Standard k-ε turbulence model were employed to investigate the microscopic flow field characteristics and deposition morphologies associated with various cross-sectional geometries. On this basis, the hydraulic coupling mechanisms were rigorously analyzed by incorporating theories of critical shear stress and hydraulic radius, ultimately leading to the proposal of targeted strategies for engineering cross-section optimization and operational maintenance.

2. Study on the Simulation of Sediment Accumulation in Drainage Trenches

To investigate the sediment accumulation mechanisms in mountain tunnel drainage trenches, a model experimental study was conducted to examine sedimentation under varying sediment concentrations, water-sediment flow rates, drainage trench slopes, and different cross-sectional shapes.

2.1. Experimental Setup

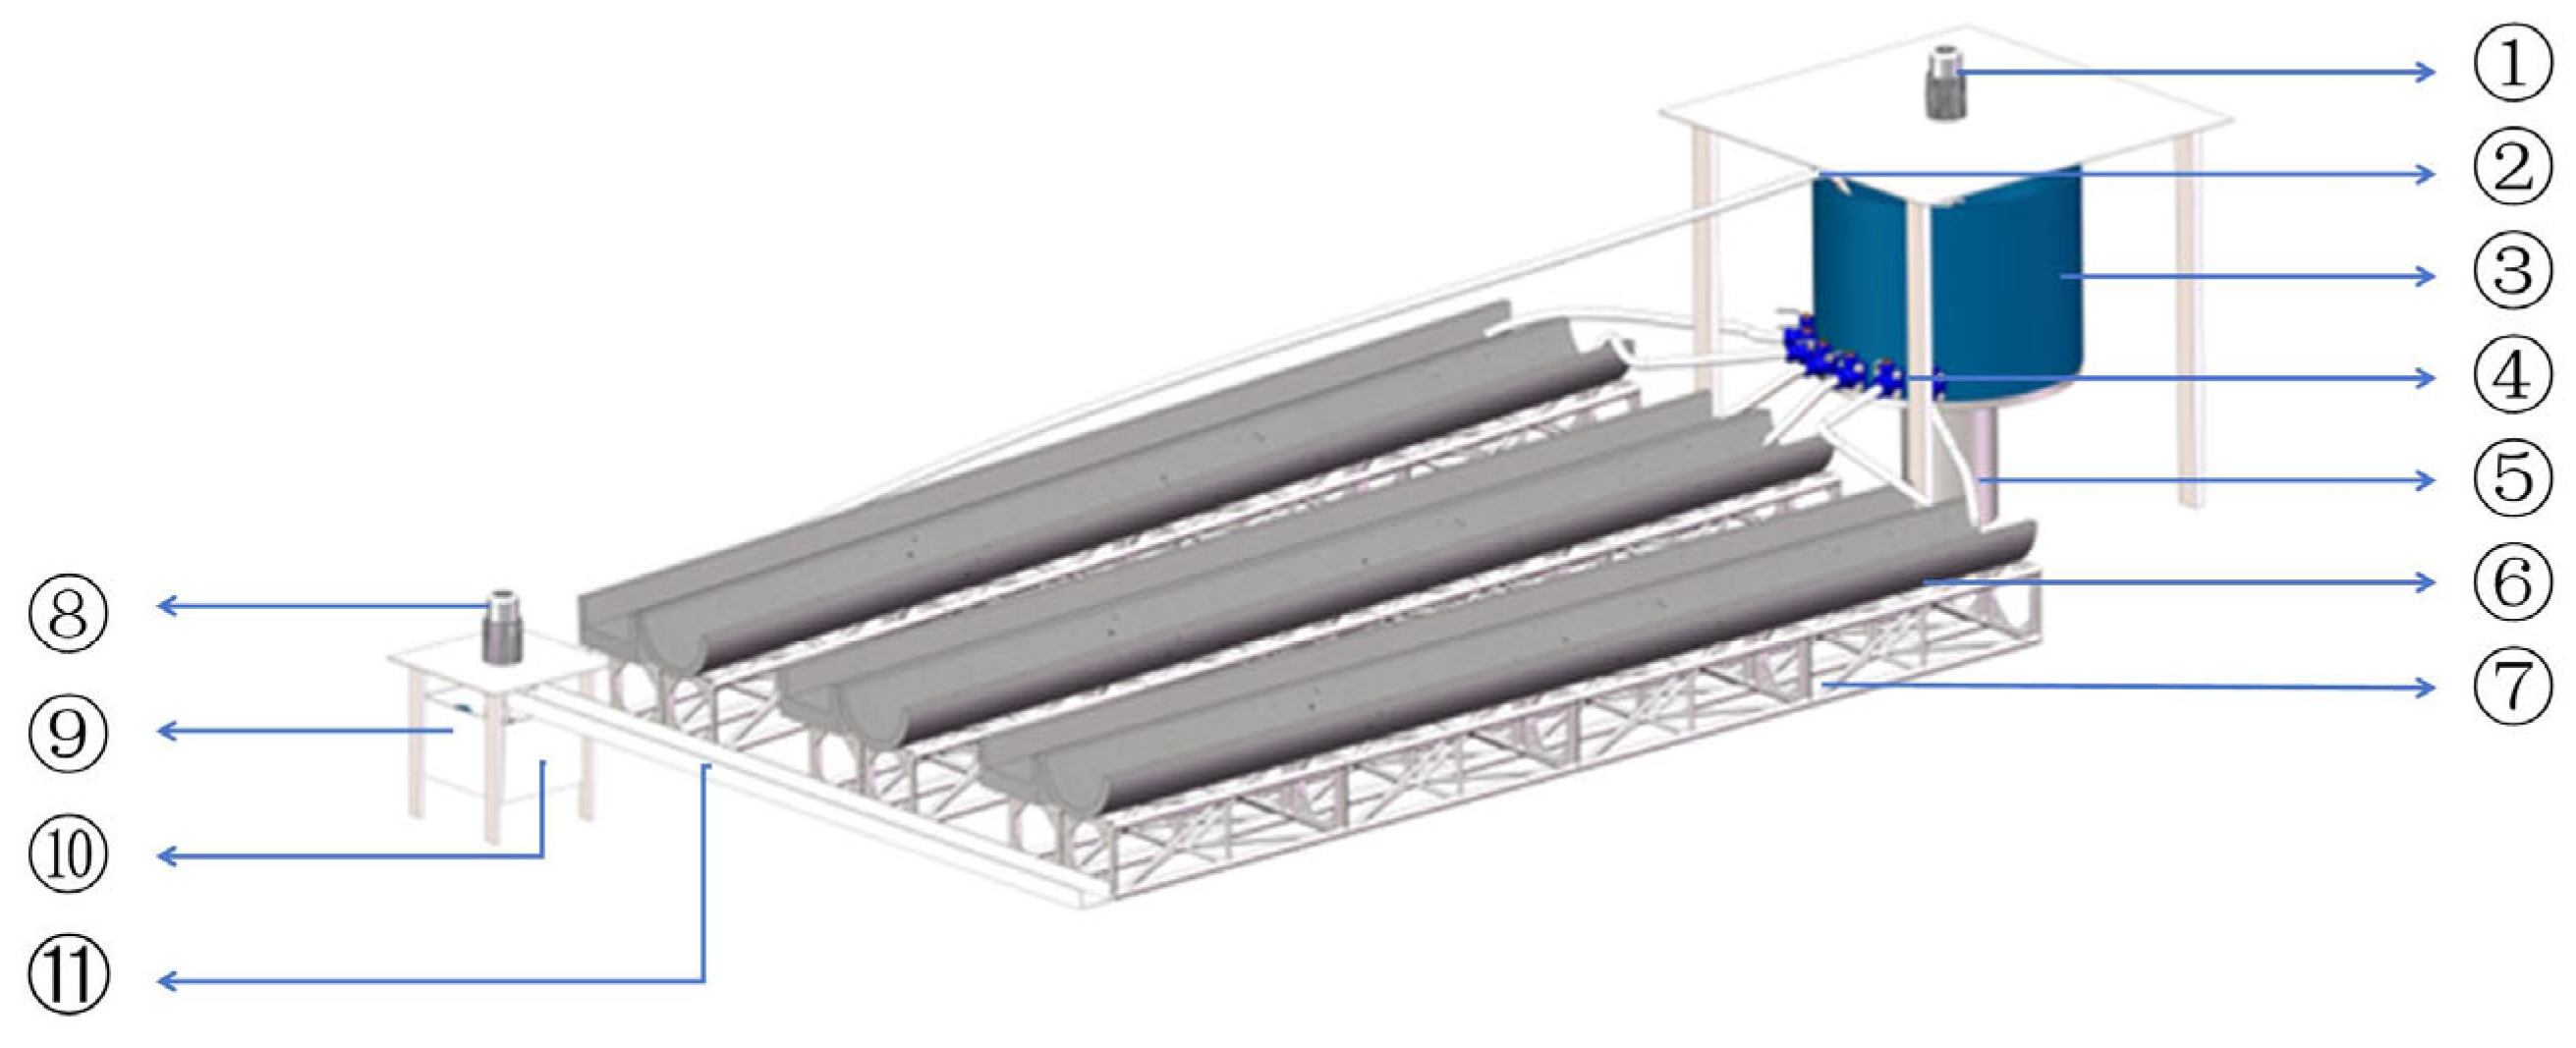
As shown in Figure 2, this study independently constructed a sediment accumulation simulation platform for drainage trenches.
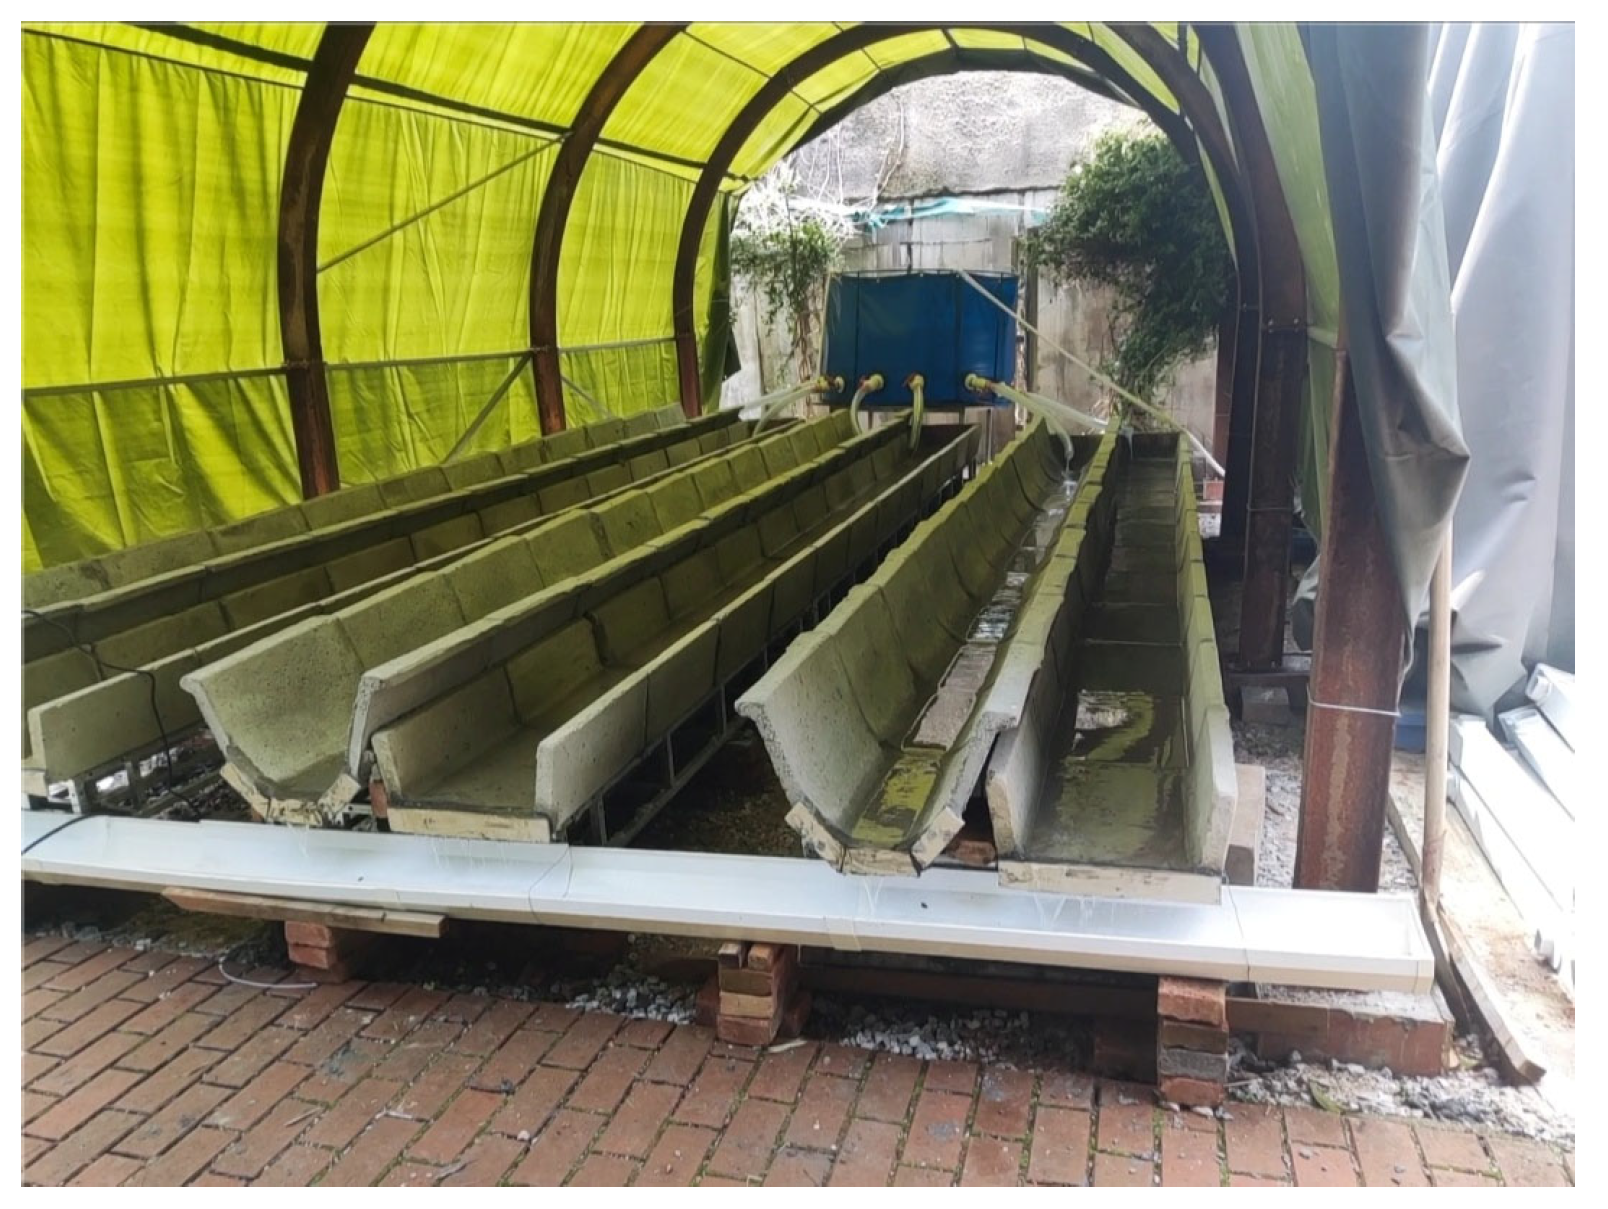
Figure 2. Schematic Diagram of the Drainage Trench Simulation Test Device. The main components of the system include: ① Stirring device 1, ② Return pipe, ③ Water supply tank, ④ Water valve, ⑤ Water supply pipe, ⑥ Drainage trench, ⑦ Load-bearing truss, ⑧ Stirring device 2, ⑨ Sewage pump, ⑩ Collection tank, and ⑪ Collection ditch. The actual platform is shown in Figure 3.
Applsci 16 01758 g002
The water supply tank, a cylindrical container with a diameter of 1.3 m and a height of 1 m, is responsible for storing water. Through the water valve and water supply pipe, water is delivered to one end of the drainage trench. The water flows along the trench to the collection ditch, where it is gathered and directed into the collection tank. Finally, the sewage pump draws the water out, and through the return pipe, the water is returned to the water supply tank, completing the water cycle. Both the water supply and collection tanks are equipped with stirring devices to evenly mix the sediment, thus preventing the sediment from settling.
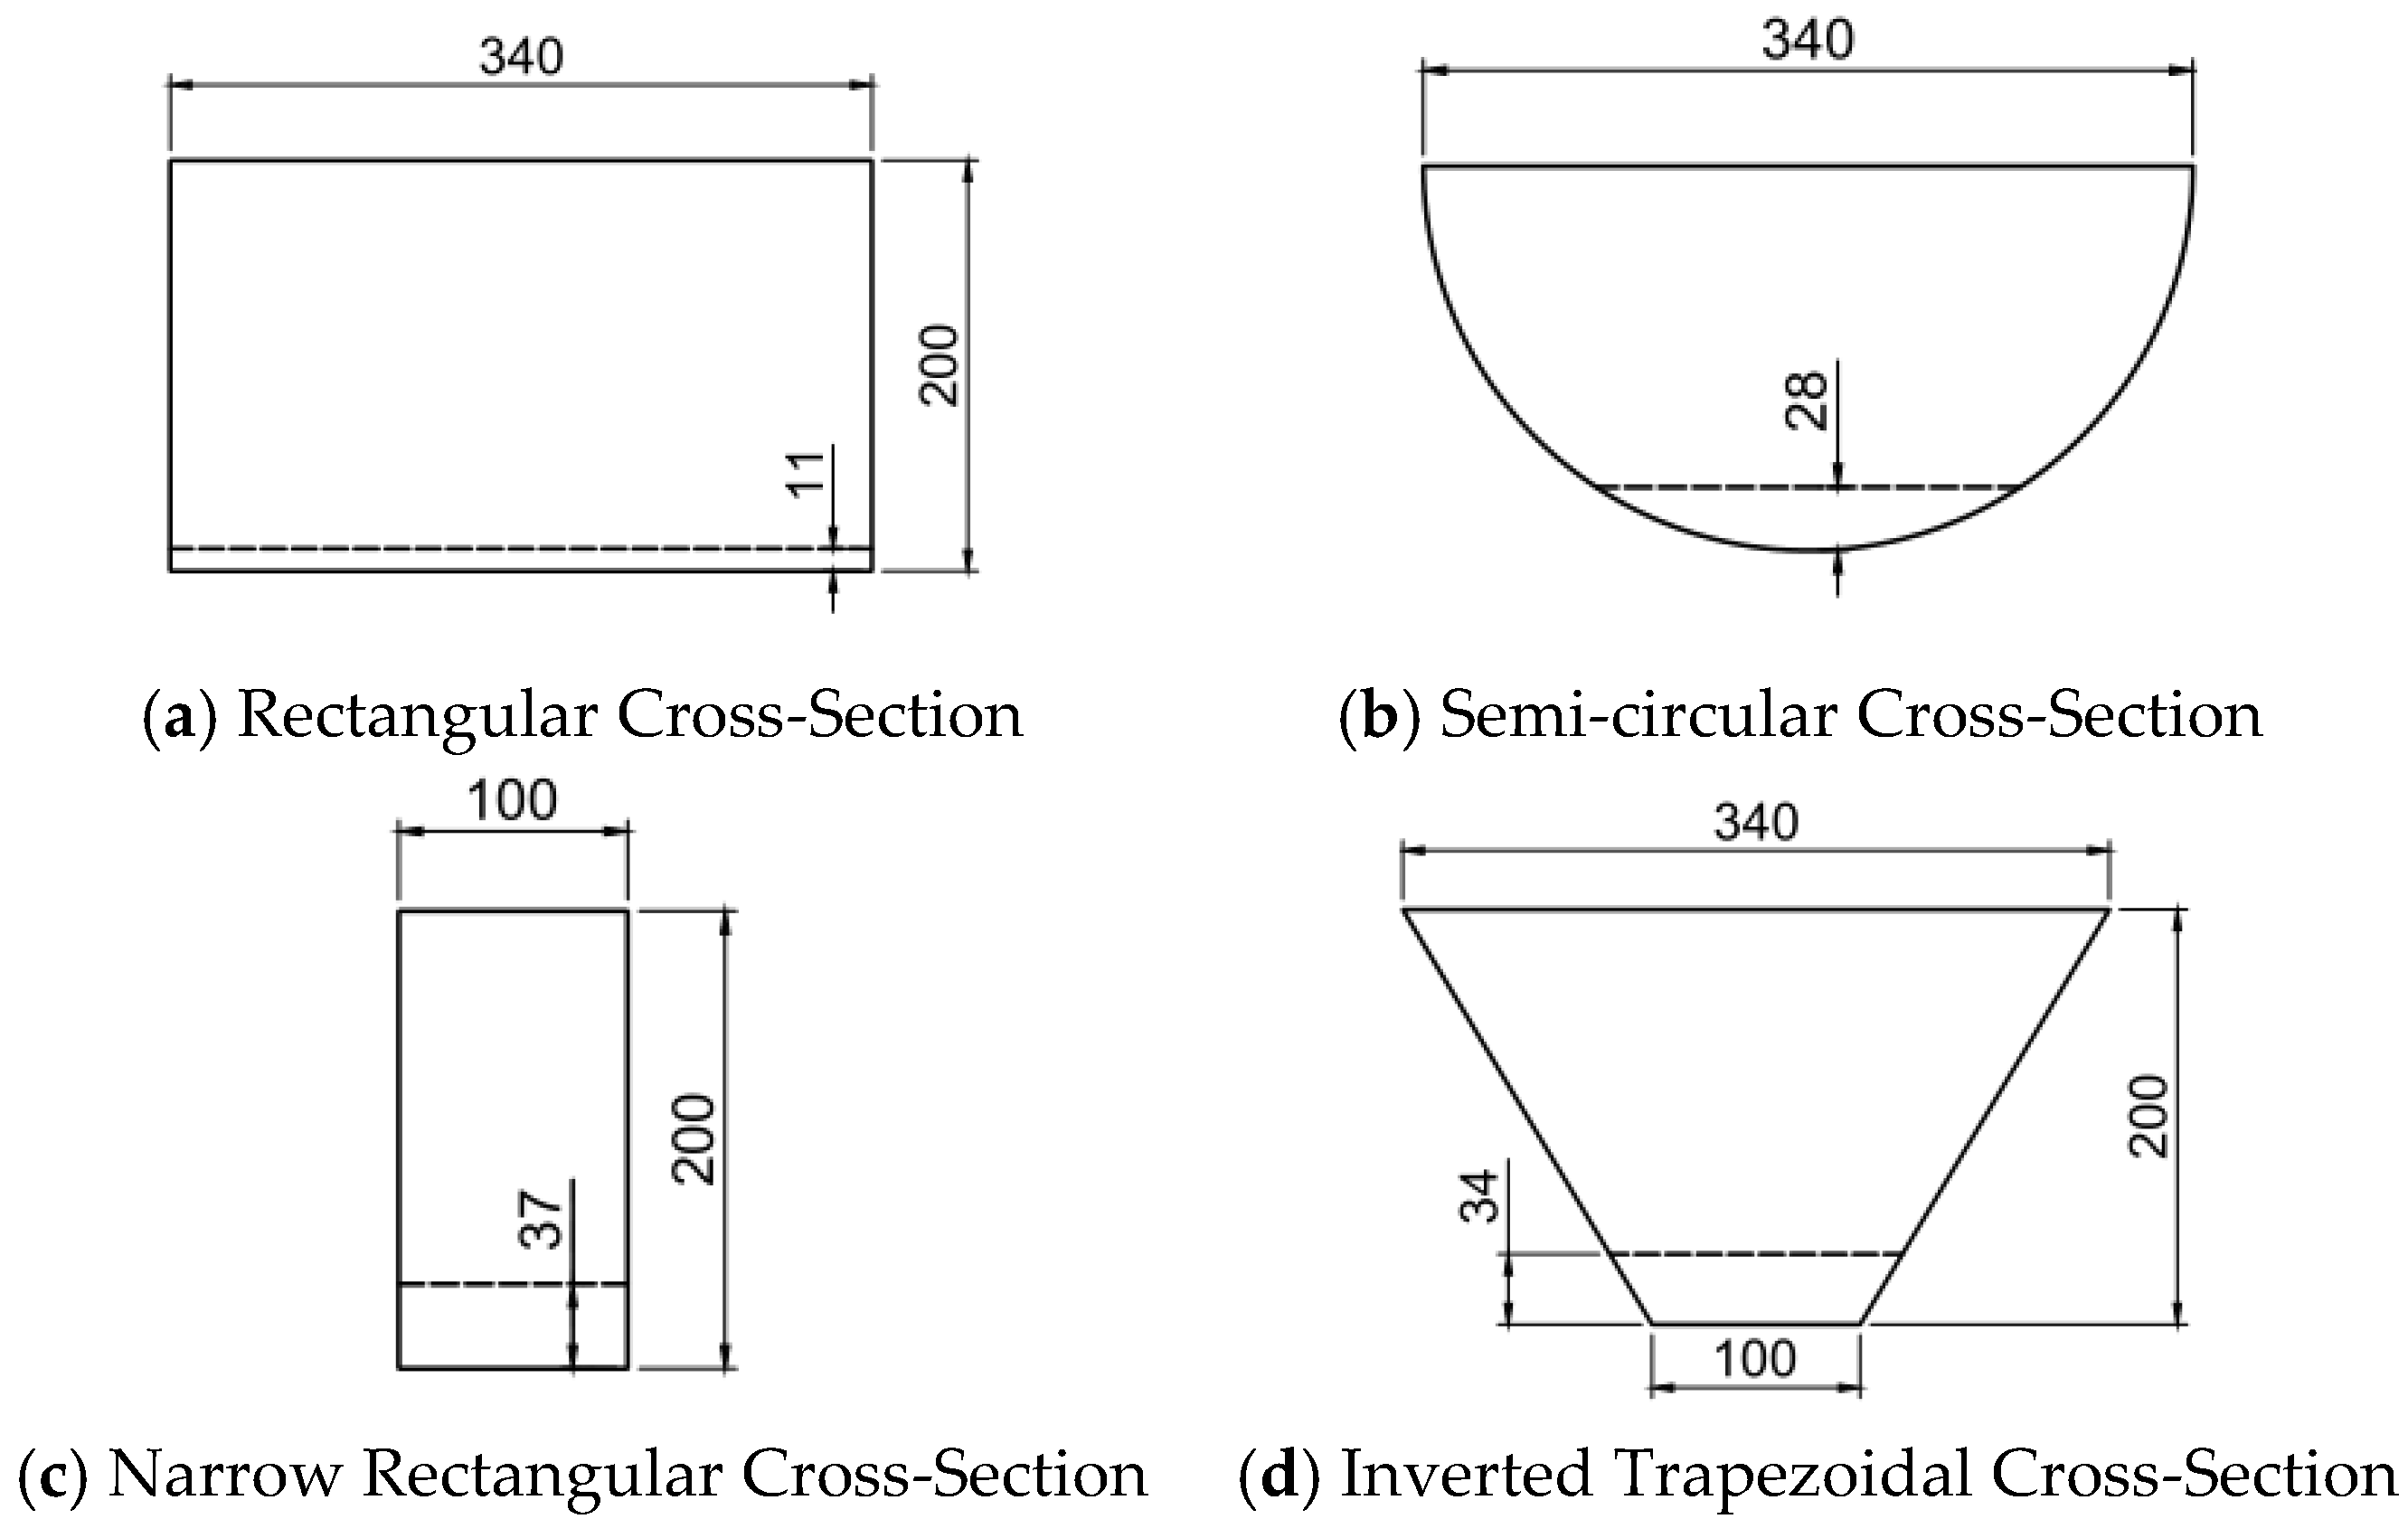
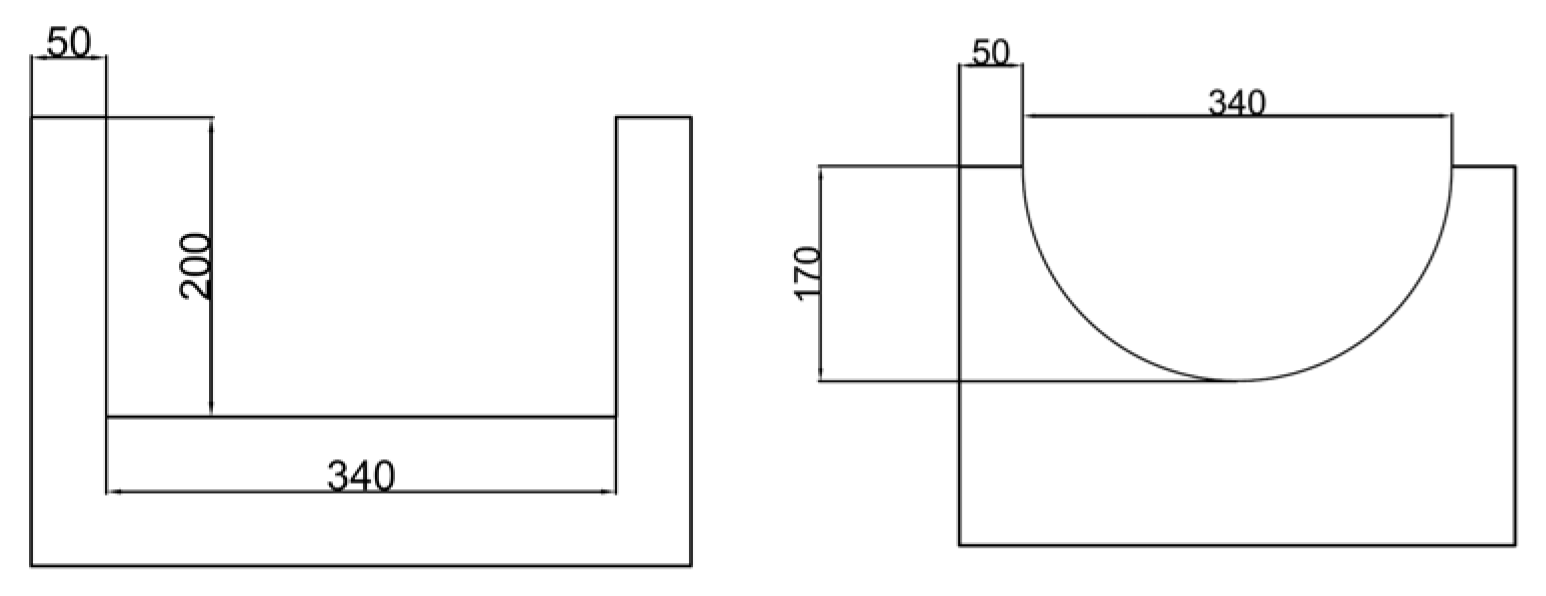
According to the “Code for Design of Railway Tunnels” (TB 10003-2016) [6] and the “Code for Design of Highway Drainage” (JTG D33-2012) [10], the drainage slope of the roadside ditches should be consistent with the longitudinal slope of the tunnel. The minimum longitudinal slope should be greater than 3‰, and the maximum longitudinal slope should be less than 3%, with a recommended maximum of 4%. Additionally, as the existing tunnel drainage trenches are primarily rectangular and semi-circular in shape, this experiment sets the drainage trench slopes at 1%, 2%, and 3%, with each group consisting of one semi-circular and one rectangular trench, totaling six trenches. Each trench has a length of 6 m. The cross-sections of the drainage trenches are shown in Figure 4.

2.2. Experimental Conditions

During the construction of the experimental site, a level instrument was used for precise measurement, and bricks were combined with the load-bearing truss to adjust the slope. Additionally, the water valve is a flow regulation device with a scale, which allows the adjustment of water-sediment flow rate in the drainage trench by rotating the valve to the specified scale. The sewage pump is available in three power ratings: 370 W, 550 W, and 1100 W, with corresponding rated flow rates of 1.5 m3/h, 5 m3/h, and 10 m3/h, and measured flow rates of 1.32 m3/h, 4 m3/h, and 7.98 m3/h, respectively.
Based on the available equipment and conditions, the experimental design considers three levels of drainage trench flow rate, three levels of drainage trench slope, two levels of drainage trench cross-sectional shape, and five levels of sediment content in the water quality, as detailed in Table 1. The experimental conditions are numbered M1 to M15, according to the increasing order of drainage trench flow rate and sediment content, as shown in Table 2.

2.3. Experimental Procedures

Taking condition M5 as an example (flow rate of 0.22 m3/h, sediment content of 10 kg/m3), the specific experimental steps are as follows:
(1)
Experimental Preparation
Sewage Pump Flow Rate Test: Place a dry water bucket on the sediment scale and reset the scale to zero. Then, fill the water supply tank to a height of 0.76 m (approximately 1 m3 of water) and submerge the sewage pump in the water supply tank. Turn on the sewage pump to start the pumping process, with water flowing into the dry water bucket. After running for 1 min, turn off the sewage pump and record the sediment scale reading, which is 22 kg. By calculation, the flow rate of the sewage pump is determined to be 1.32 m3/h.
Water Valve Angle Marking and Flow Rate Test: Place the water supply pipe into the dry water bucket, and adjust the water valve switch to a certain angle. Begin collecting water and set a timer for 60 s. During the collection, make a clear mark on the water valve switch at the angle. After the timer expires, turn off the water valve and weigh the water bucket to calculate the flow rate at that specific angle. Repeat the experiment twice and average the results to obtain the flow rate of the water valve at that angle. Following the same procedure, adjust the angle of the water valve switch to measure and mark the flow rate at different angles. After testing a single water valve, perform the same flow rate testing and marking for the remaining five sets of water valves.
(2)
Pre-experiment
Preparation of Sediment-laden Water with 10 kg/m3 Sediment Content: Add water to the water supply tank up to a height of 0.76 m (approximately 1 m3 of water), turn on stirring device 1, and then use a sieve to filter out 10 kg of sediment with particle sizes ranging from 0.062 to 2.00 mm. (The sediment particle size range of 0.062–2.0 mm was selected to represent the typical mixed debris composition found in the local tunnel drainage systems during field investigations. This mixture includes both fine particles (silt/clay) and coarser sands to simulate the bulk behavior of sediment ingress.) Pour the sediment into the water supply tank and use the stirring device to evenly disperse the sediment in the water.
Flow Test with Water Valves: Adjust the six water valve switches to a specific angle (with each water valve having a flow rate of 0.22 m3/h), allowing the sediment-laden water to flow through the water pipes into the corresponding drainage trench. The water from the six drainage trenches is collected into the collection ditch and flows into the collection tank. When the water level in the collection tank exceeds the sewage pump’s capacity, turn on the sewage pump and stirring device 2 to pump the water back through the return pipe into the water supply tank, completing the water cycle.
Post-experiment Procedures: After two days, turn off all experimental equipment. Once the water in the drainage trenches has drained, take photographs of the trenches and allow them to air dry. Then, collect and dry the sediment in the drainage trenches and weigh it.
Data Calculation: Dry and weigh the collected sediment. In this study, the response variable ‘sediment accumulation’ is explicitly defined as the total dry mass (in grams) of the sediment collected from the drainage trench. To ensure data reliability, three parallel trials were conducted for each experimental condition, and the arithmetic mean of these three measurements was recorded as the final result.
(3)
Experiment
Repeat the pre-experiment as described above. Every 8 h during the experiment, add X/6 of the sediment to the water supply tank to ensure that the sediment concentration in the water supply tank remains relatively constant. Perform three parallel tests for each experimental condition, and take the average of the three sets of data to determine the final sediment deposition amount.
To test other conditions, adjust the water valve angle to change the flow rate, use sewage pumps of different power ratings, and modify the sediment concentration in the water supply tank.

3. Numerical Model of Sediment Accumulation in Drainage Trench

In practical engineering applications, the fluctuation range of sediment content in regional water bodies is usually limited, and the longitudinal slope of the drainage trench often needs to be coordinated with the longitudinal slope of the tunnel alignment. Meanwhile, the drainage flow rate is constrained by system operating conditions, making manual regulation challenging. Therefore, the cross-sectional parameters of the drainage trench become key factors in optimizing its anti-sedimentation capacity. To further investigate the impact of cross-sectional shapes on the anti-sedimentation performance, computational fluid dynamics (CFD) is employed, using the ANSYS FLUENT 2022R2 simulation software for analysis.

3.1. Eulerian Model for Multiphase Flow

The Eulerian model for multiphase flow was employed to simulate and analyze water-sediment deposition, with the governing equations for the analysis process provided as follows:
Continuity equation:
ρ t + ρ V = 0
Momentum equation:
ρ V t + ρ V V = ρ f + P
Energy equation
ρ E t + ρ V E = ρ f V + P V + k T + S
where ρ denotes the fluid density; V represents the micro-element velocity vector; f is the micro-element body force; P stands for the micro-element surface force; E indicates the total energy per unit mass of the fluid; k T denotes the heat flux vector; and S is the internal heat source term of the system.
Although the calculated Reynolds numbers at the inlet for some conditions suggest a transitional flow regime, the Standard k-epsilon model was selected for two primary reasons: (1) the presence of a longitudinal slope causes gravitational acceleration, rapidly transitioning the flow into a fully developed turbulent state downstream; (2) in full-scale engineering simulations involving free-surface multiphase flows, the k-epsilon model offers superior numerical stability and convergence compared to low-Reynolds-number models, providing a conservative and robust prediction for sediment transport capacity.
Therefore, the Standard k-ε model (suitable for high-Reynolds-number conditions) was selected from the k-ε model family. This model was chosen due to its wide application range, relatively balanced accuracy, and economic efficiency. The specific governing equations are listed below:
Turbulent kinetic energy k equation:
x j ρ μ j k ( μ + μ t σ k ) k x j = ρ ( P k ε )
Turbulent dissipation rate ε equation:
x j ρ μ j ε ( μ + μ t σ ε ) ε x j = ρ ε k ( C 1 ε P k C 2 ε ε )
where μ and μ t denote the laminar and turbulent viscosity coefficients, respectively; P k is the production term of turbulent kinetic energy; and C 1 ε , C 2 ε , C μ , σ k , σ ε all empirical coefficients.

3.2. Computational Working Conditions

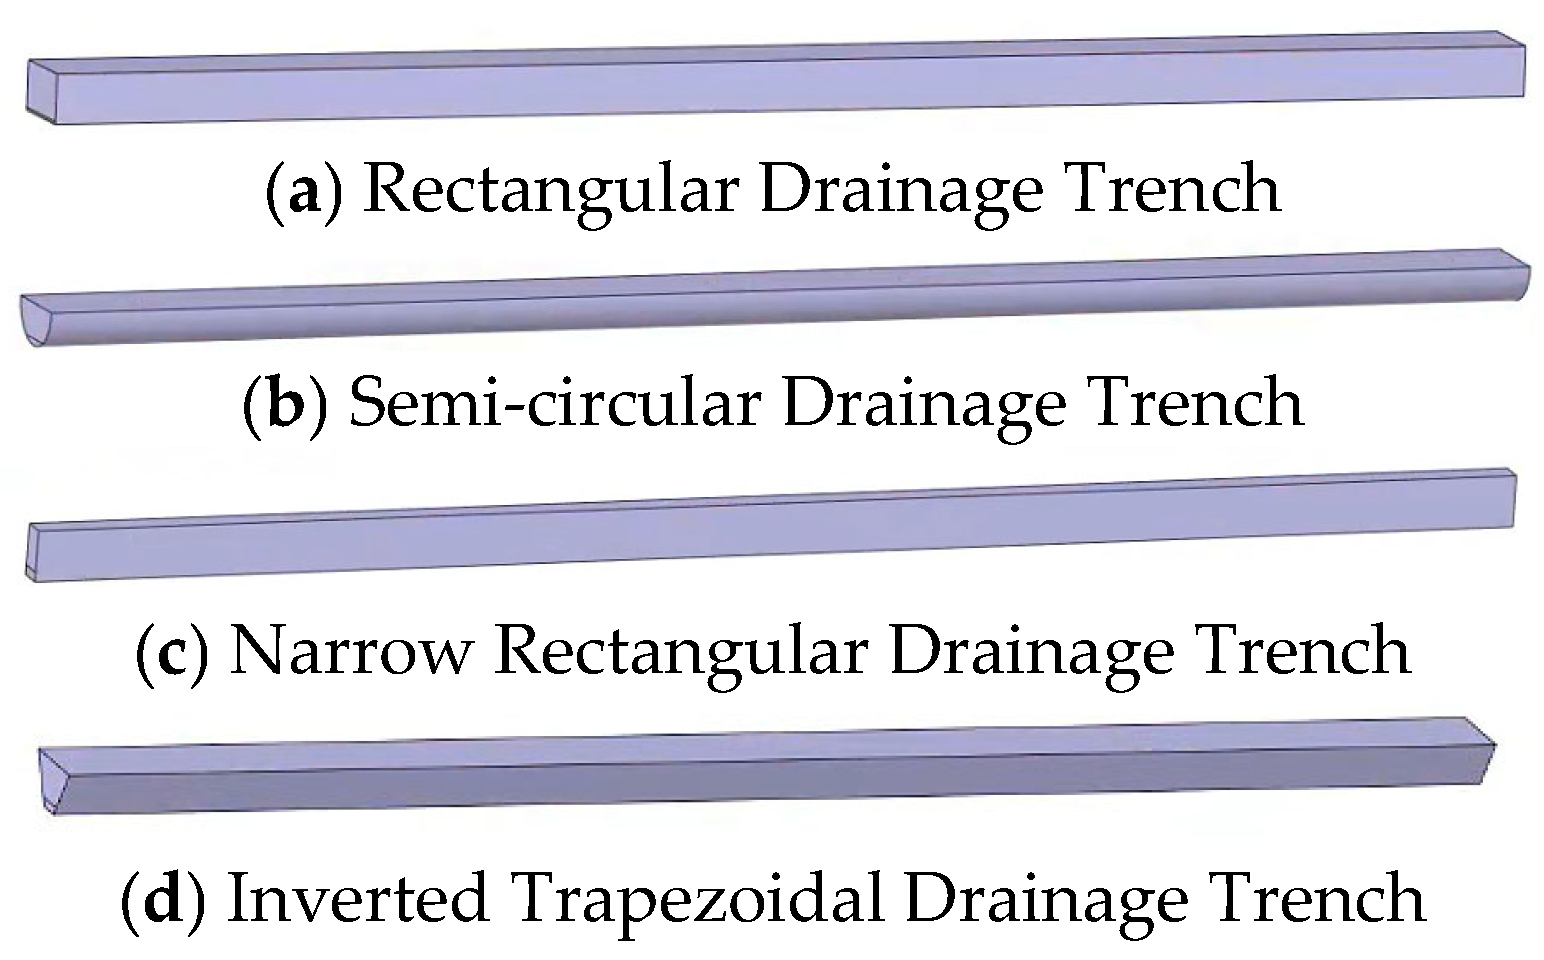
In this calculation, four cross-sectional conditions are set. The rectangular and semi-circular cross-sections correspond to the dimensions of the drainage trench cross-sections used in the full-scale experiments. The narrow rectangular cross-section serves as a control condition, with the same height as the rectangular cross-section but a smaller width. The inverted trapezoidal cross-section is another control condition, with the same height as the rectangular cross-section, the upper base equal in length to the rectangular cross-section, and the lower base equal in width to the narrow rectangular cross-section. To achieve the same flow rate (1.33 m3/h) as in experimental condition M13, a small inlet is provided at the entrance of each of the four model cross-sections. The calculated inlet heights are 11 mm, 28 mm, 37 mm, and 34 mm, respectively. The specific cross-sectional dimensions are shown in Figure 5.
This calculation is based on the experimental condition M13. The flow rate for each drainage trench is 1.33 m3/h, and the sediment content in the water is 5 kg/m3. The fluid density of the sediment-laden water (ρ) is assumed to be approximately the same as that of pure water, taken as 1000 kg/m3. Based on the experimental results, the median sediment particle size is set to 0.5 mm. The calculation parameters for each condition are shown in Table 3.
According to the Reynolds numbers calculated, conditions 3 and 4 correspond to turbulent flow, while conditions 1 and 2 are in the transitional flow regime between laminar and turbulent flow. Since the drainage trench in this simulation has a slope, the overall fluid velocity along the longitudinal direction of the drainage pipe continuously increases. Therefore, conditions 1 and 2 can be treated as turbulent flow for the purpose of simulation.

3.3. Geometric Model and Mesh Generation

The length of each drainage trench is set to 6 m with a slope of 1%, and modeling is performed. The drainage pipe undergoes slope rotation and volume extraction to obtain the fluid domain, with the inlet, outlet, and wall surfaces of the fluid domain being appropriately labeled. The specific model is shown in Figure 6.
The model is meshed to ensure that the grid refinement does not affect the simulation results. To achieve this, a uniform mesh specification is used for all four conditions: local refinement is applied at the inlet, with a single mesh size of 5 mm. The maximum and minimum sizes for surface meshes are 20 mm and 5 mm, respectively, and for volume meshes, the maximum and minimum sizes are 80 mm and 5 mm, respectively. A structured quadrilateral mesh is used uniformly. The resulting mesh counts for conditions 1, 2, 3, and 4 are 262,000, 175,000, 183,000, and 83,000, respectively, with mesh quality greater than 0.5 for all cases.
The upstream inlet of the model is set as a velocity inlet, with the initial velocity of water and sediment set to 0.1 m/s. The inlet is a mixture of water and sediment, with the volume fraction of water set to 0.998 and the volume fraction of sediment set to 0.002. The downstream outlet is set as a pressure outlet, with the pressure set to standard atmospheric pressure. All other boundaries are set as non-slipping walls, with the wall roughness selected as standard roughness. The roughness height is set to 0.005, and the roughness constant is set to 0.5.
The Eulerian multiphase flow model is selected for the calculation, with the primary phase as air and the secondary phases as water and sediment. Initially, the drainage pipe is filled with air.

4. Experimental and Simulation Results

4.1. Effect of Sediment Concentration on Sediment Accumulation

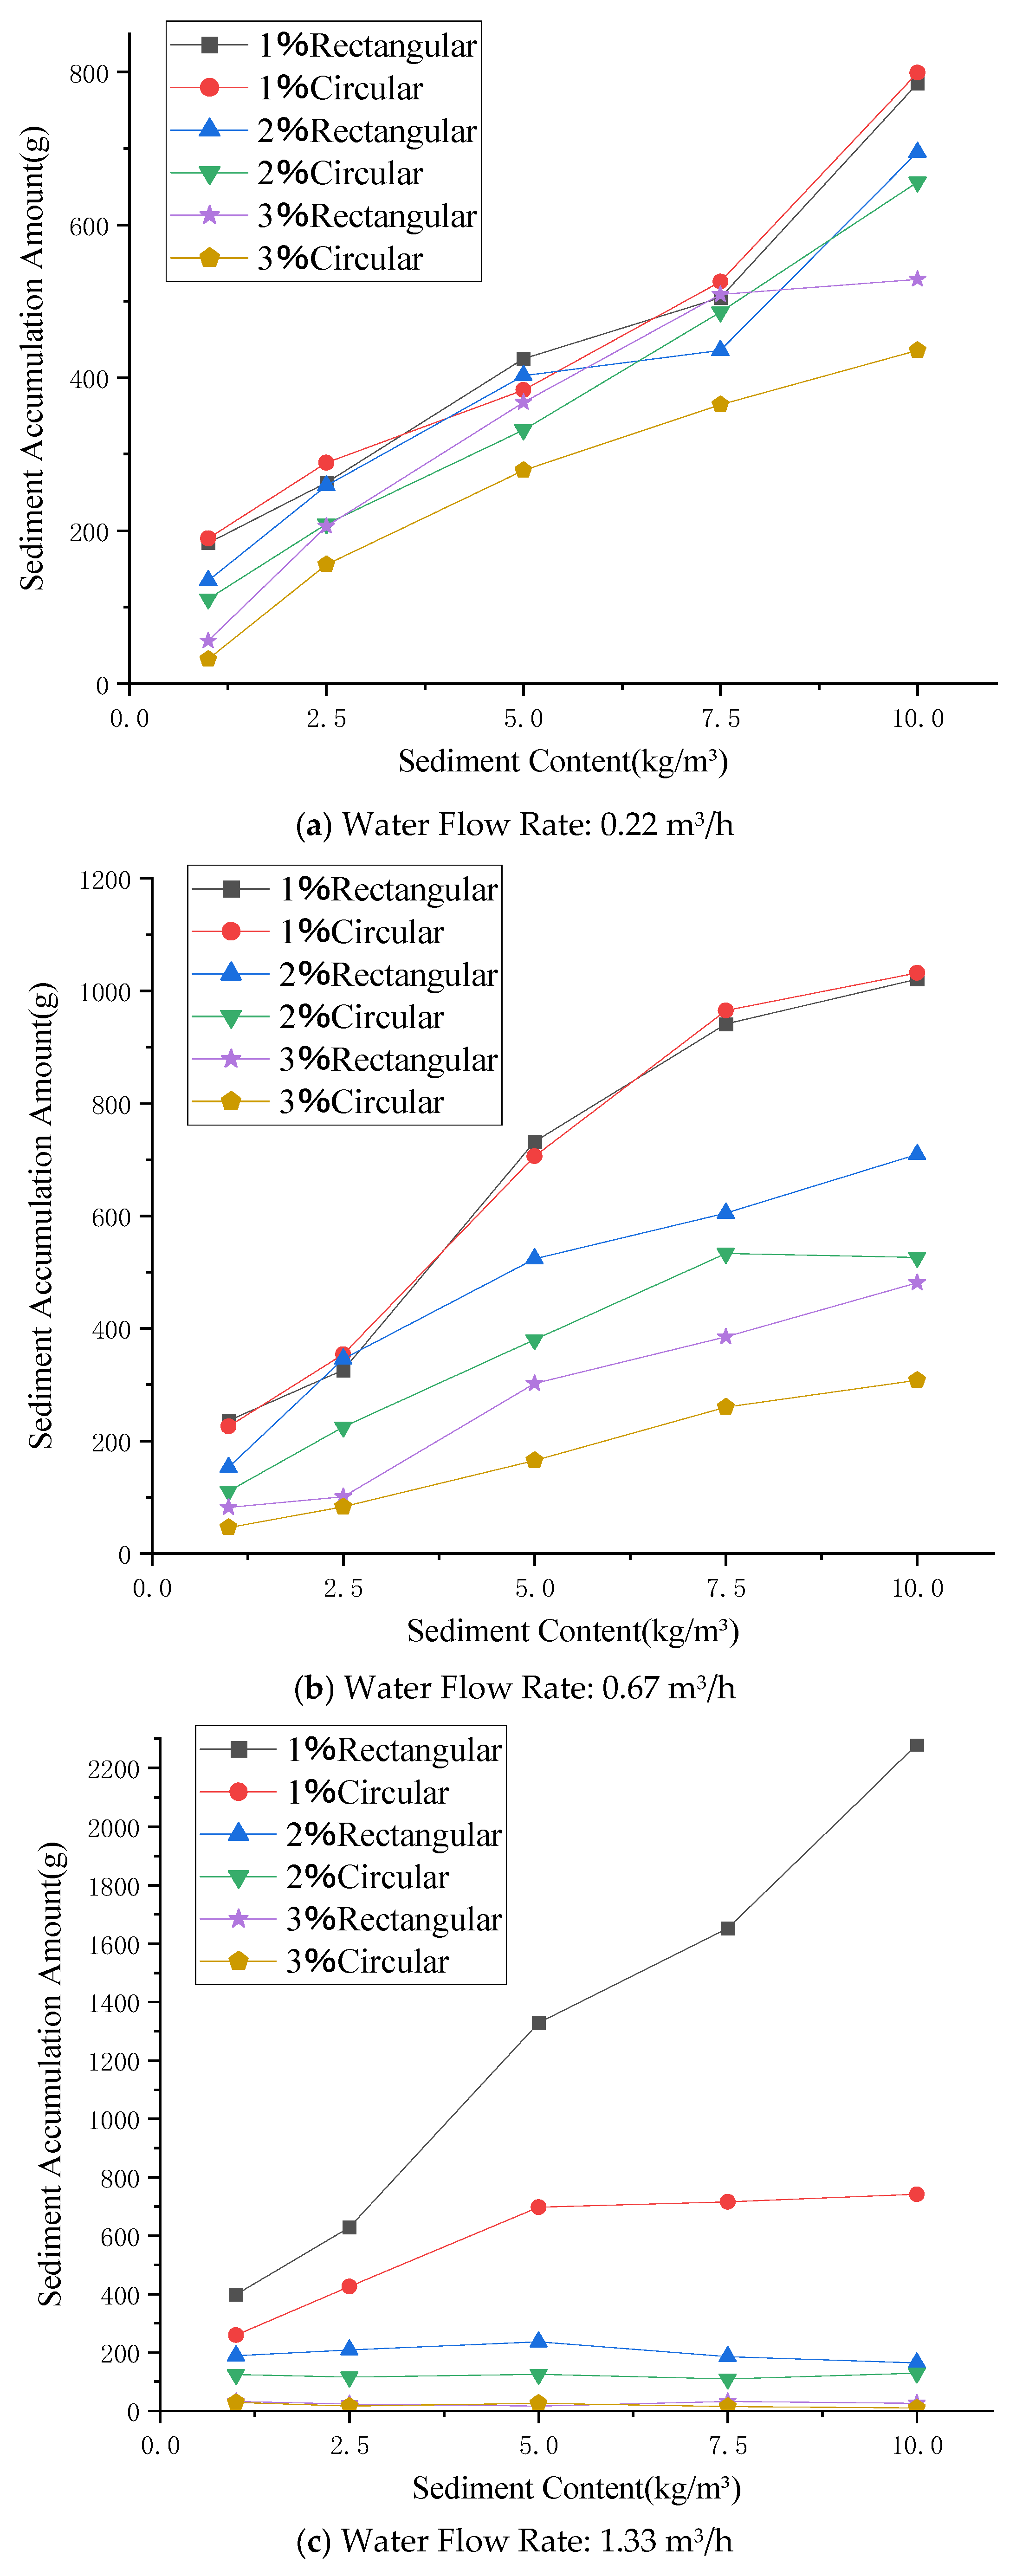
Through the above full-scale experiments, sediment accumulation data for drainage trenches under conditions M1 to M15 were obtained, as shown in Figure 7. Data analysis indicates that under the same flow rate conditions, for the same slope and cross-sectional shape, sediment accumulation increases with the rising sediment content, which aligns with existing industry knowledge. As the flow rate increases, the rate of sediment accumulation in the drainage trenches at various slopes and cross-sectional shapes gradually slows down with increasing sediment content. This phenomenon suggests that under higher-flow conditions, the effect of sediment content on the sediment accumulation process in the drainage trenches is diminished.
As shown in Figure 7c, under higher flow rates and drainage trench slopes of 2% and 3%, sediment accumulation did not significantly increase with higher sediment content but remained relatively stable. In contrast, sediment accumulation in the drainage trenches with a 1% slope significantly increased. These results indicate that under high-flow conditions, slope becomes the primary influencing factor for sediment accumulation in drainage trenches, while the influence of sediment content is notably reduced.

4.2. Effect of Flow Rate on Sediment Accumulation

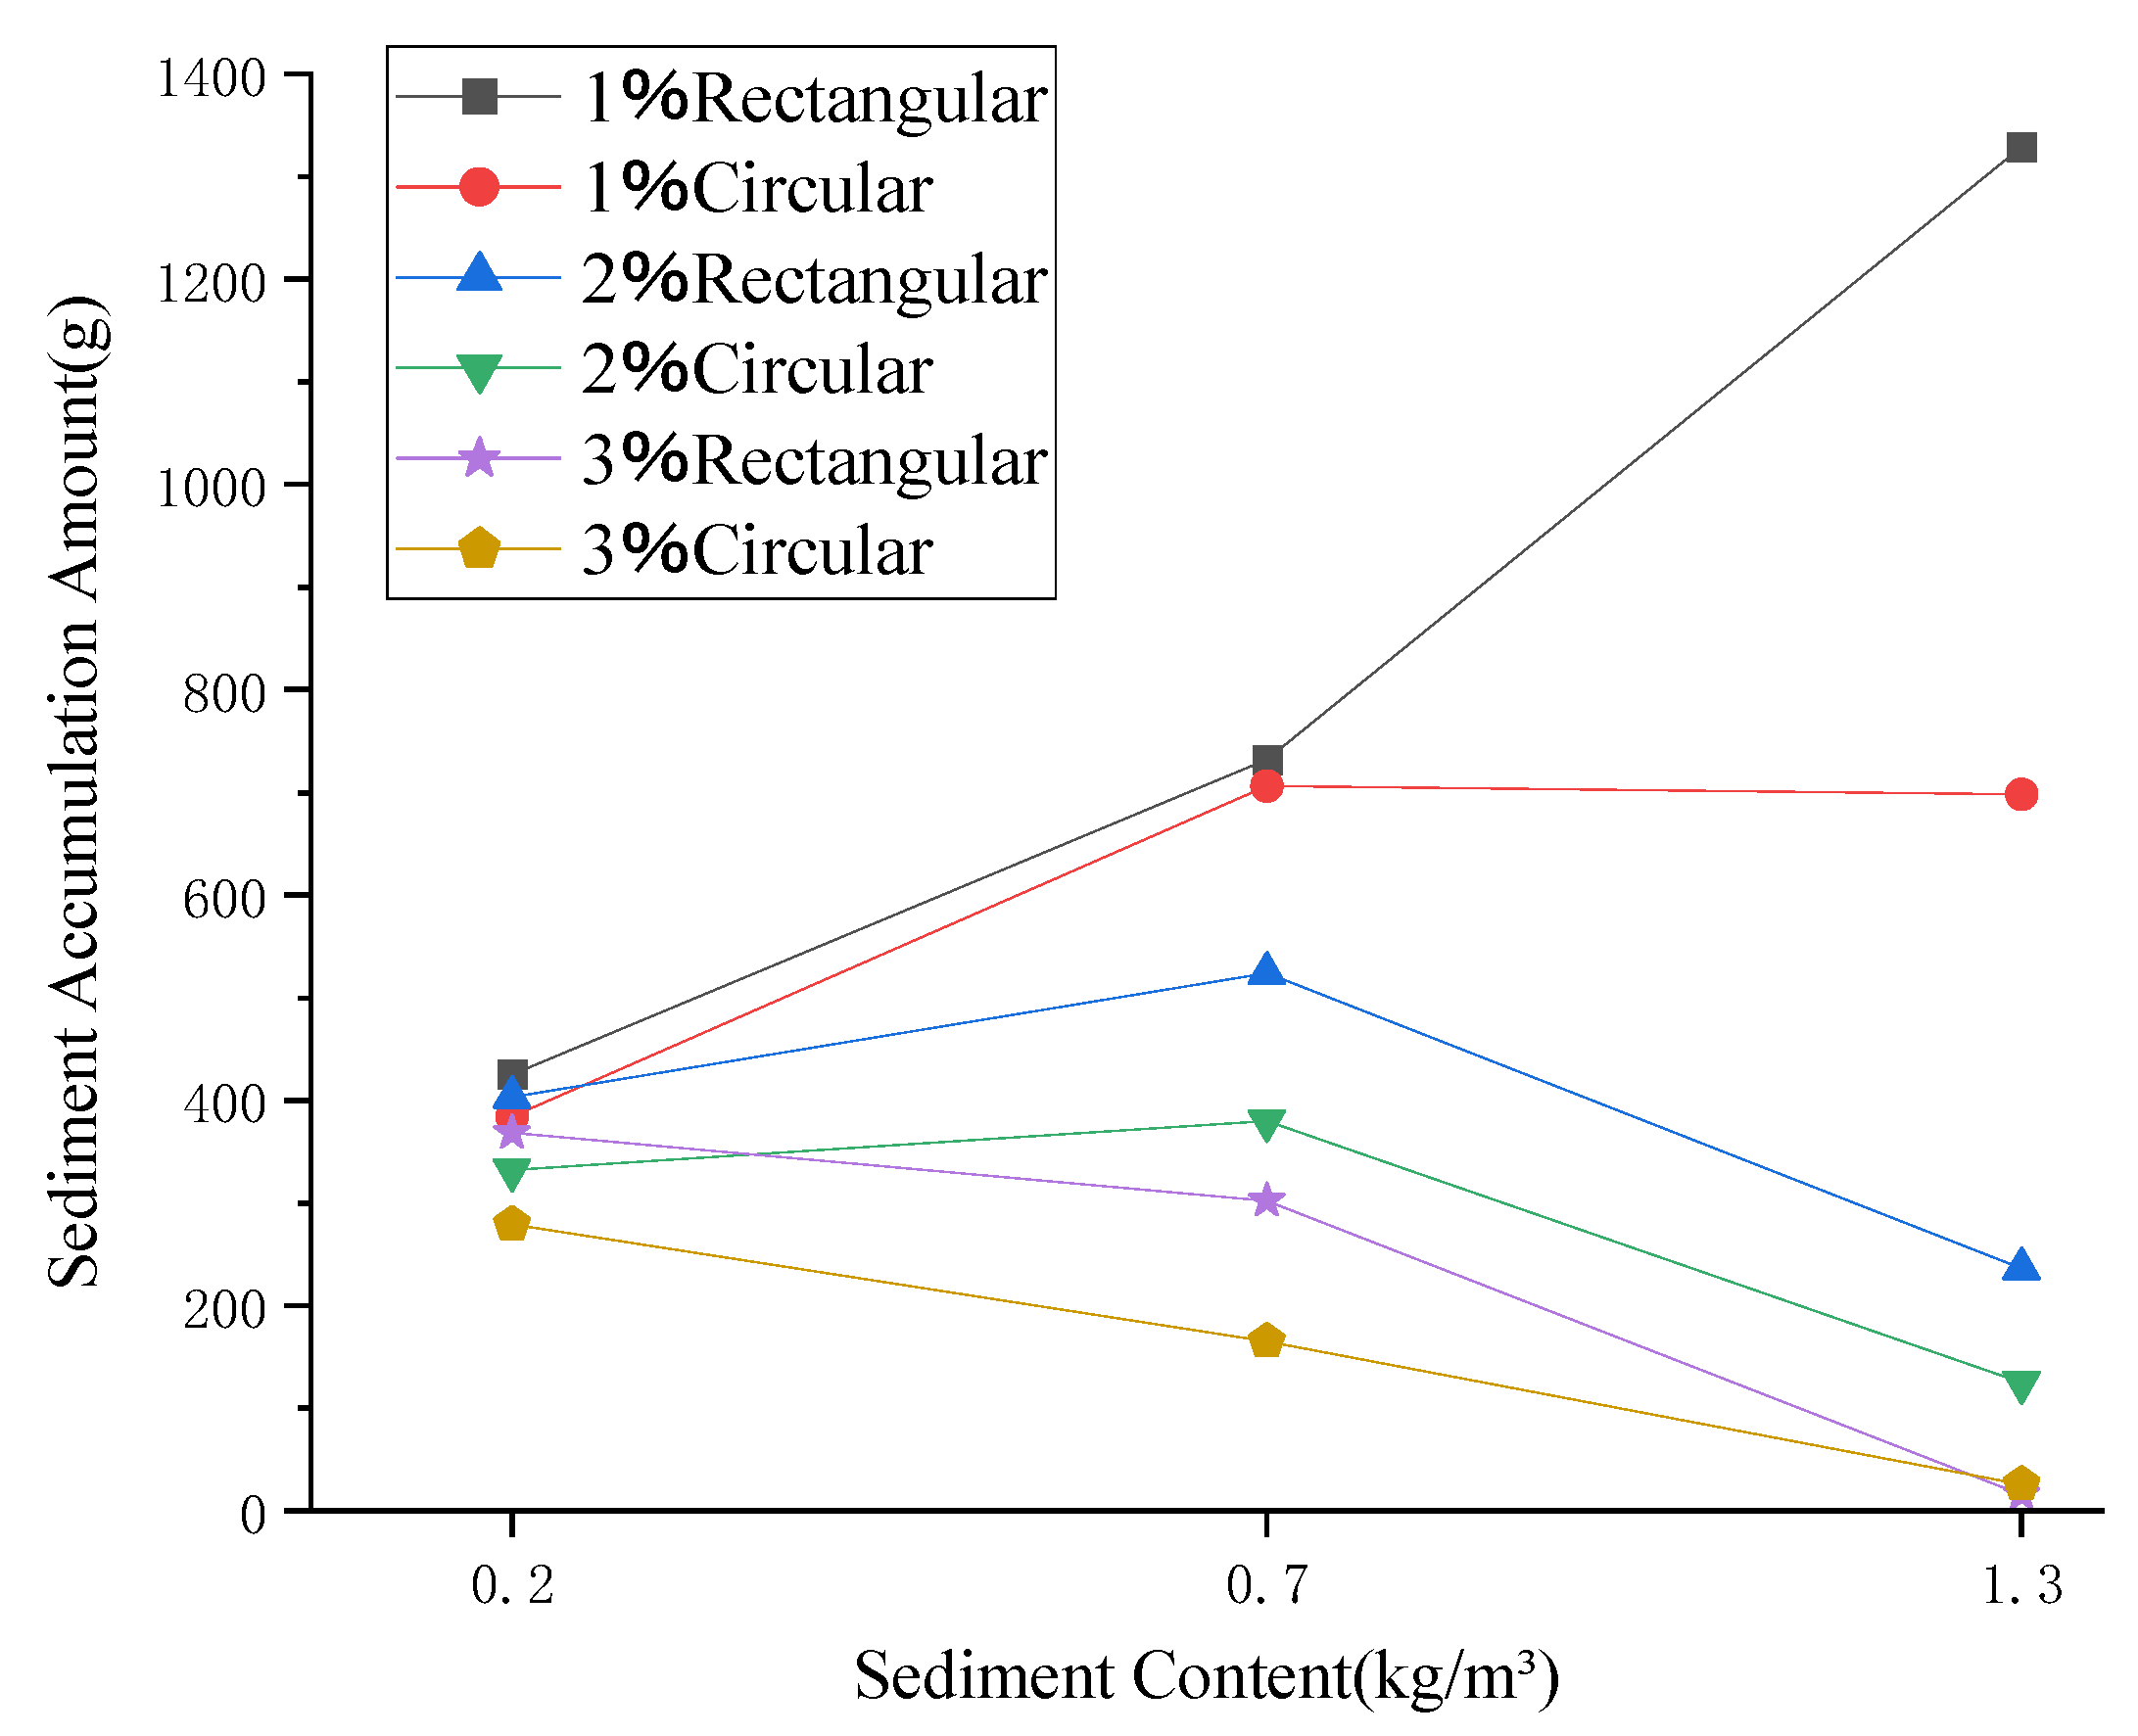
To further analyze the variation trend of sediment accumulation in drainage trenches with changes in flow rate, a systematic study was conducted on sediment accumulation under conditions M3, M8, and M13 (with a sediment content of 5 kg/m3), and the corresponding change curves are presented in Figure 8.
(1)
Analysis of 1% Slope Condition: Under the 1% slope condition for both rectangular and semi-circular drainage pipes, it was found that as the flow rate gradually increased, sediment accumulation in both types of pipes showed significant growth. As the flow rate continued to increase, sediment accumulation in the rectangular pipe maintained an upward trend, with an increasing rate of growth. In contrast, sediment accumulation in the semi-circular pipe stabilized and even exhibited a decreasing trend. This indicates that, under low-flow conditions, there is no significant difference in drainage performance between the rectangular and semi-circular pipes, but under high-flow conditions, the semi-circular drainage pipe demonstrates superior anti-sedimentation performance. The reason for this is that, under a 1% slope, the sediment-carrying water flows relatively slowly through the drainage trench. As the flow rate increases, the total amount of sediment transported through the drainage trench per unit of time increases, leading to more sediment being deposited on the pipe walls, thereby increasing sediment accumulation. Additionally, the rectangular pipe has a flat bottom, which provides a larger surface area for contact with the sediment. This increases the sediment retention capacity through friction with the pipe walls. In comparison, the semi-circular pipe has a smaller bottom cross-sectional area, which enhances the sediment-carrying speed of the water flow, increasing its sediment transport capacity and resulting in better anti-sedimentation performance under high-flow conditions.
(2)
Analysis of 2% Slope Condition: For the two types of drainage pipes under a 2% slope, it was observed that as the flow rate increased, the sediment accumulation in both the rectangular and semi-circular drainage pipes showed a slight increase. However, as the flow rate further increased, the sediment accumulation in both types of pipes began to decrease. Despite this, the semi-circular drainage trench consistently demonstrated superior anti-sedimentation performance compared to the rectangular drainage trench throughout the entire flow range.
(3)
Analysis of 3% Slope Condition: Under the 3% slope condition, it was found that the steeper slope significantly reduced sediment accumulation. As the flow rate increased, the anti-sedimentation ability of both types of drainage pipes improved significantly. At a flow rate of approximately 1.3 m3/h, the sediment accumulation in both types of pipes approached zero, suggesting that, at this flow rate, the drainage pipes with a 3% slope reached their optimal drainage performance.

4.3. Effect of Slope on Sediment Accumulation

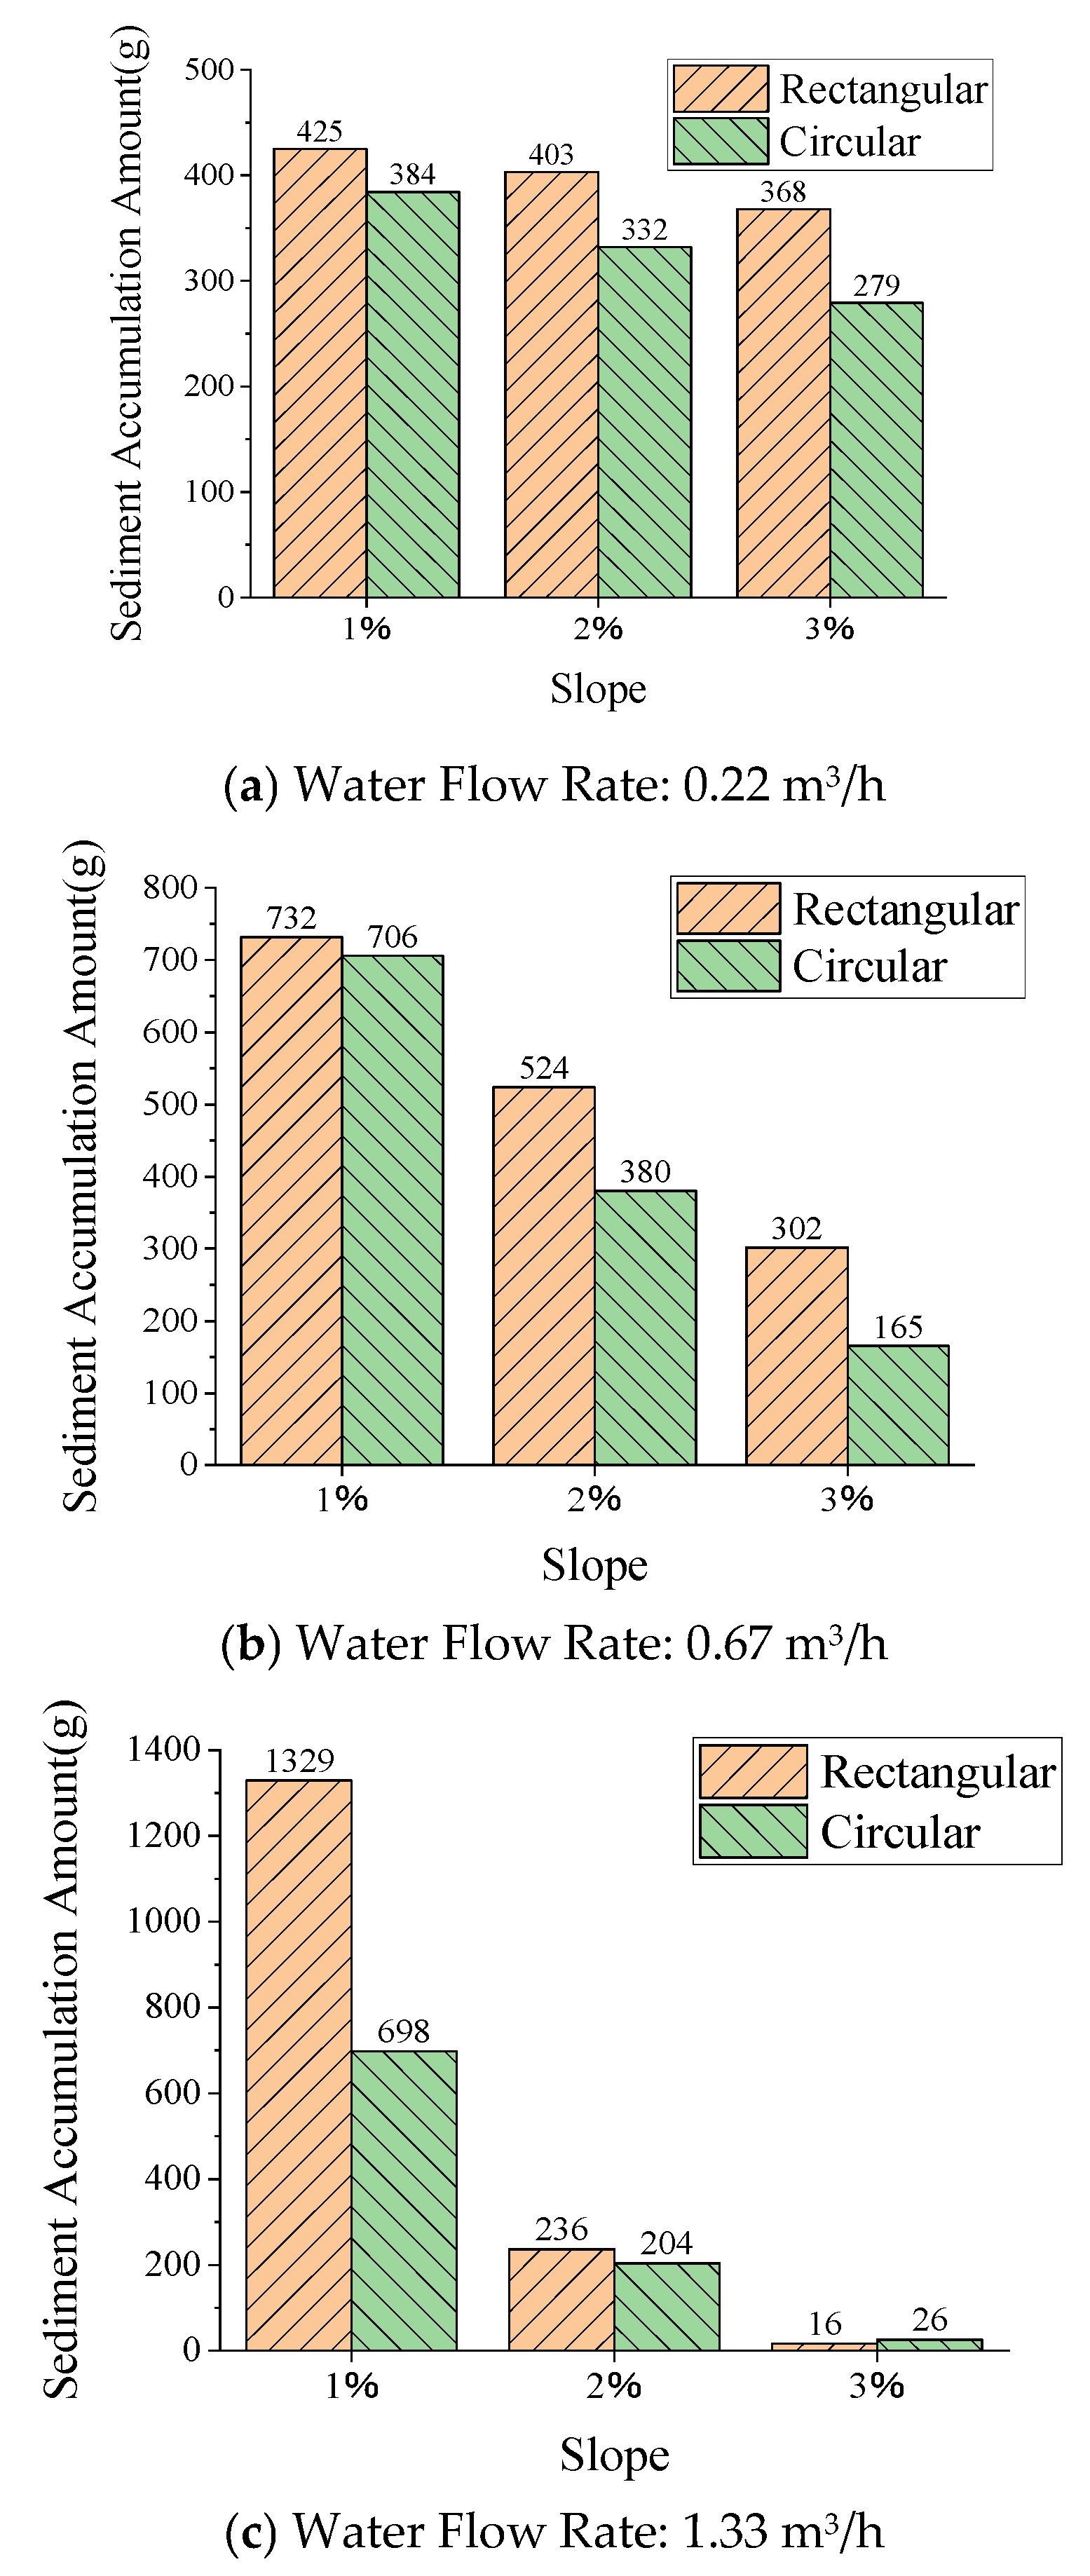
To further analyze the variation trend of sediment accumulation in drainage trenches with changes in slope, the sediment accumulation data under conditions M3, M8, and M13 (with a sediment content of 5 kg/m3) were plotted as bar charts, as shown in Figure 9.
The experimental data indicate that, under different flow conditions, the degree of sediment accumulation in both rectangular and semi-circular drainage trenches significantly decreases as the hydraulic slope increases, which is consistent with basic hydraulic principles. The anti-sedimentation capacity of the semi-circular cross-section consistently outperforms that of the rectangular cross-section, and this can be attributed to the optimized hydraulic radius and reduced wall contact area in the semi-circular section.
From the analysis of flow gradients:
(1)
Low-Flow Condition (0.22 m3/h): The impact of slope on sediment accumulation in the drainage trenches is minimal, with the sediment accumulation difference under different slopes being less than 15%, indicating that, under low flow conditions, the gravity-driven sediment transport is limited.
(2)
Medium- to High-Flow Conditions (0.67 m3/h, 1.33 m3/h): The influence of slope becomes significantly more pronounced. When the flow rate increases to 1.33 m3/h, the sediment accumulation in drainage trenches with 2% and 3% slopes is reduced by 42% and 68%, respectively, compared to the 1% slope. In particular, the rectangular and semi-circular drainage trenches with a 3% slope achieved a zero-sediment-accumulation state. This phenomenon confirms the theoretical hypothesis that large slopes enhance sediment transport capacity by increasing gravity-driven sediment transport.
Comparing the changes in sediment accumulation under different flow gradients, it was observed that when the flow rate increased from 0.22 m3/h to 0.67 m3/h (a 3-fold increase), the maximum increase in sediment accumulation was only 1.8 times, with the reverse trend of a 12% reduction in sediment accumulation under the 3% slope condition. When the flow rate increased from 0.67 m3/h to 1.33 m3/h (a 2-fold increase), the sediment accumulation in the rectangular pipe under a 1% slope increased proportionally, while other conditions achieved a 30–50% reduction in sediment accumulation. This phenomenon reveals the nonlinear relationship between flow rate and sediment accumulation: once the flow rate exceeds the critical sediment transport threshold, the increase in sediment-carrying capacity surpasses the increase in incoming sediment, resulting in a “flow-driven sediment removal” effect.

4.4. Flow Field Characteristics and Deposition Patterns of Different Cross-Sections

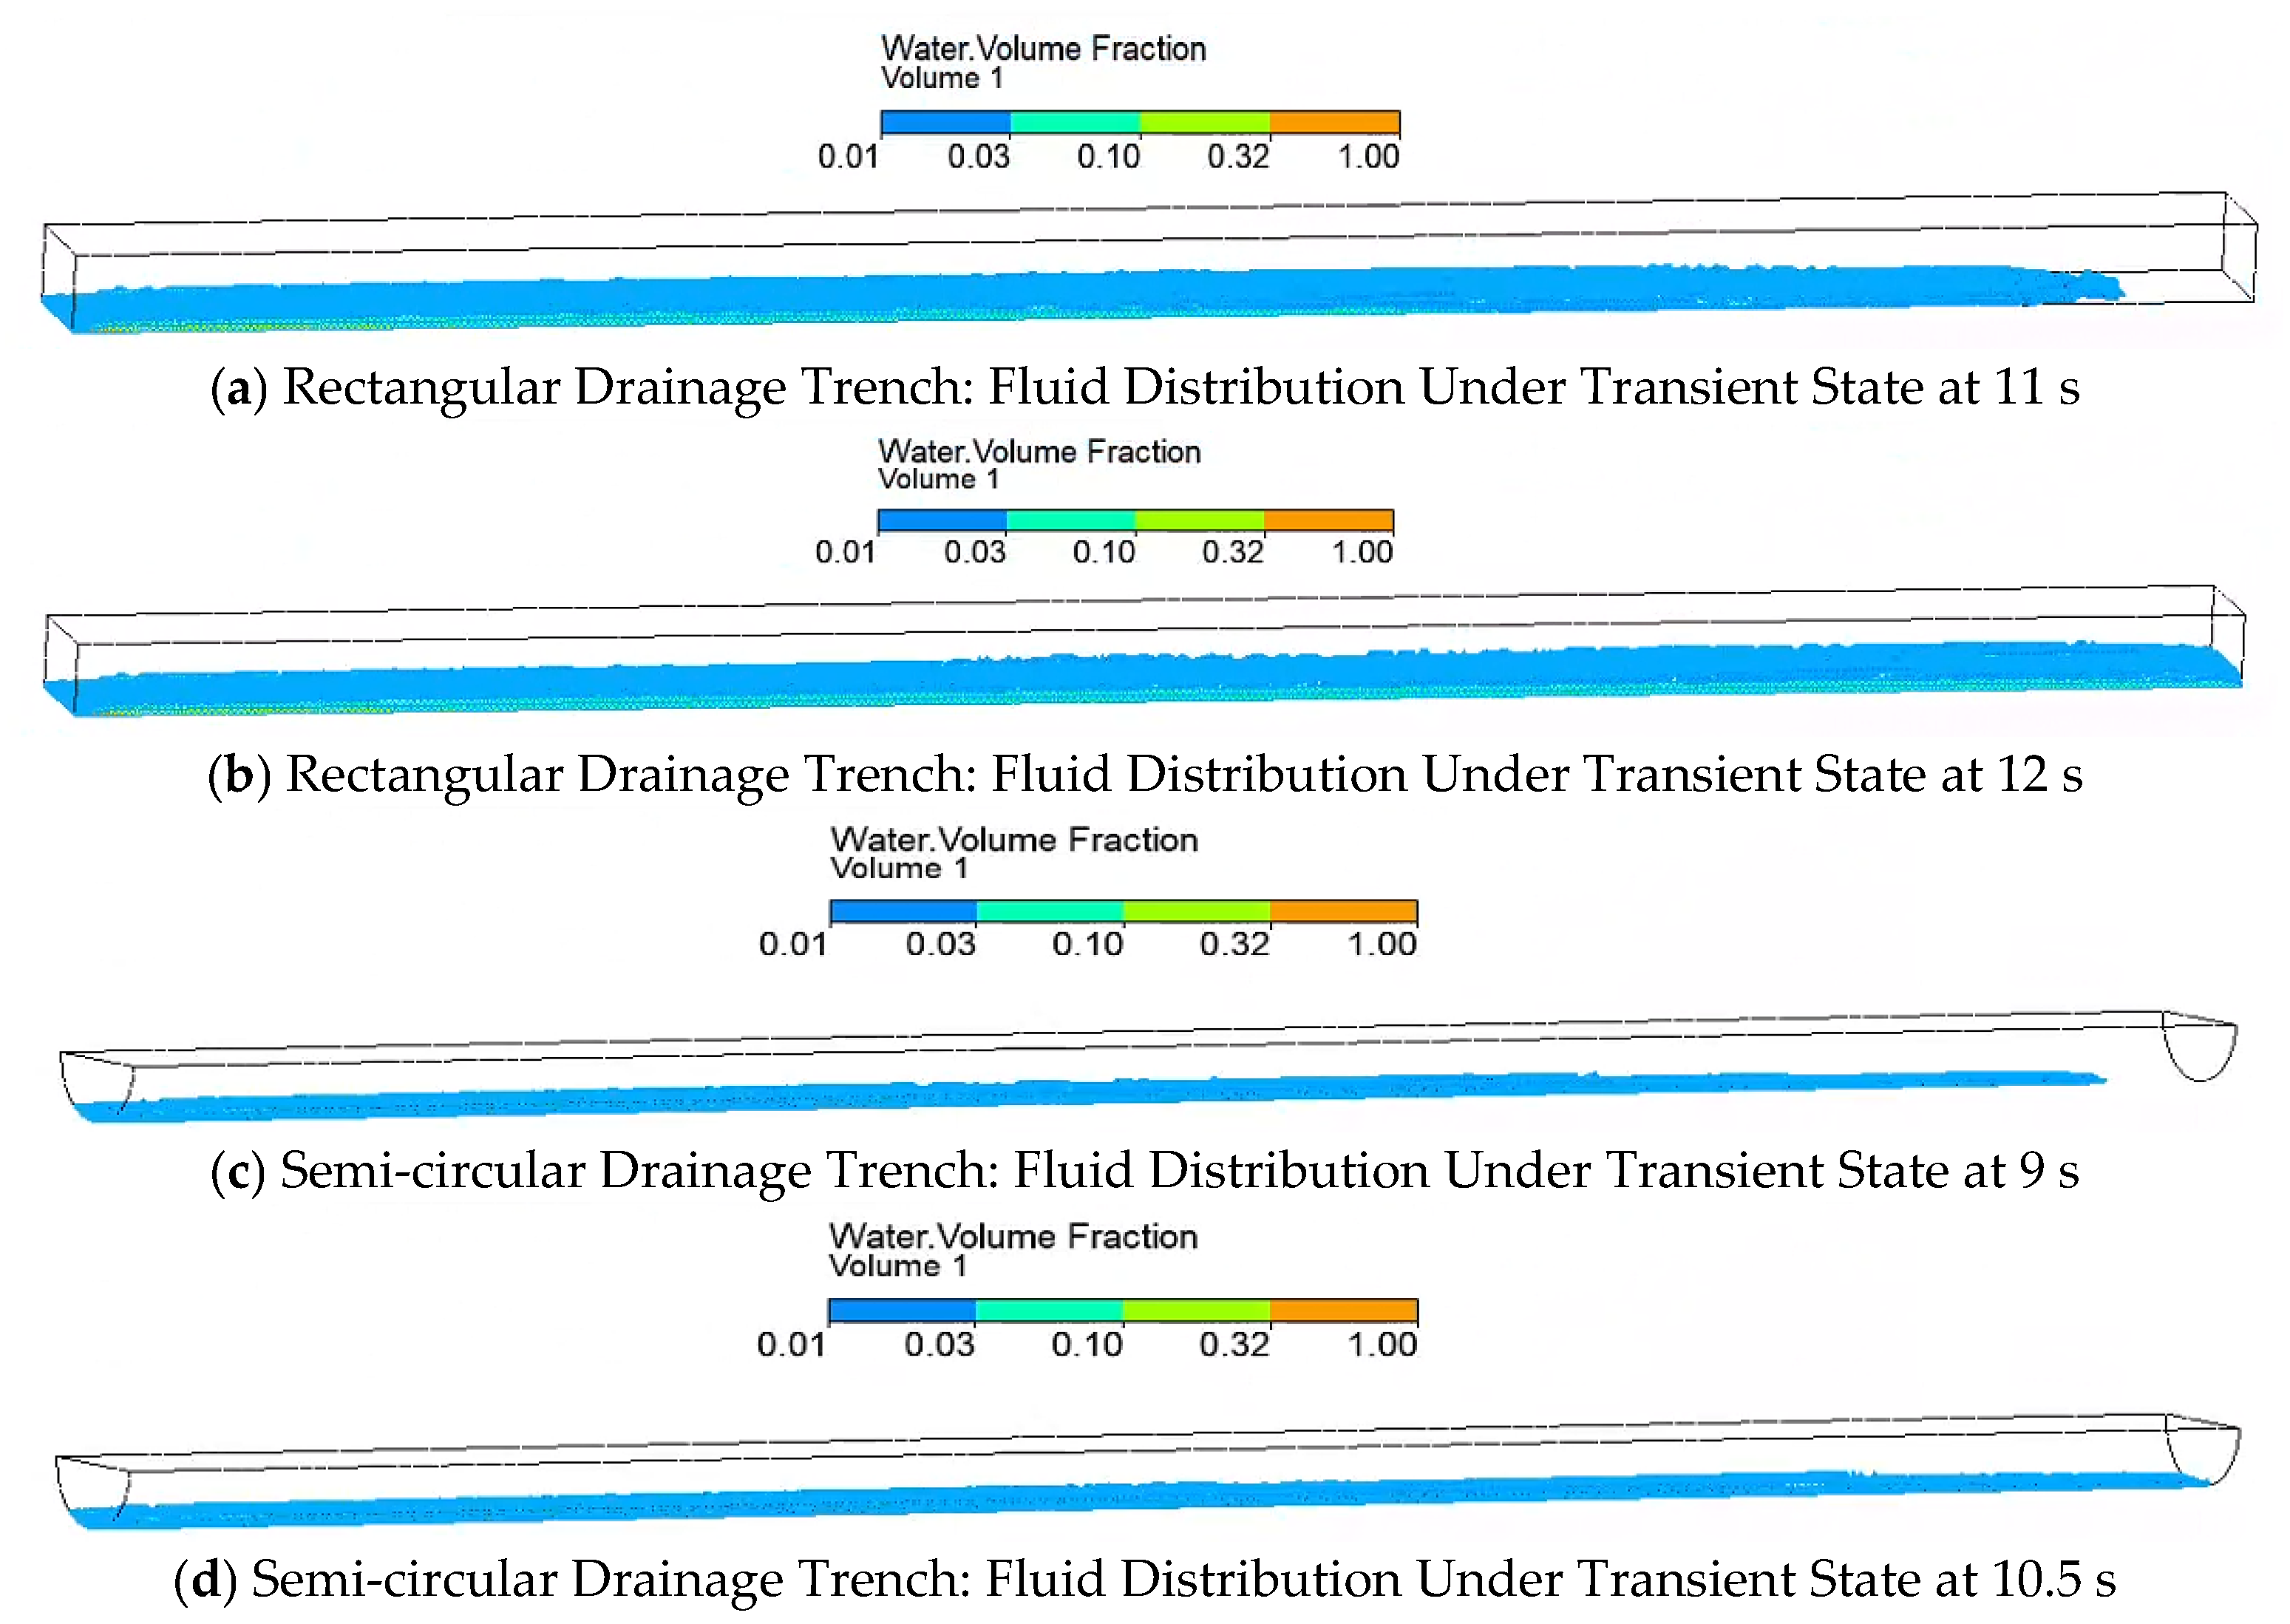
The calculation employs the Eulerian multiphase flow model. Due to limitations in the post-processing module, it is not possible to directly read the volume fraction of sediment in water or the actual volume fraction of water during post-processing. To enable comparison and validation between the numerical simulation and physical experiments, the volume fraction of water in air needs to be determined. At a transient time point of 10 s, when the water-sediment mixture has not yet reached the drainage pipe outlet boundary, the theoretical mass of water inside the pipe is calculated to be approximately 3.7 kg. After iterative calculations in the CFD-Post post-processing module, it is determined that the volume fraction of water is 0.01 when the water mass is 3.7 kg. Consequently, water with a volume fraction greater than 0.01 is considered as the water in the actual flow state, and water with a volume fraction greater than 0.01 is selected as the visible phase.
(1)
Condition 1 (Rectangular Drainage Pipe) Flow Field Characteristics: For condition 1, the distribution of water at the transient states of 11 s and 12 s is shown in Figure 10a,b. At the transient state of 11 s, the water phase front has not yet reached the outlet boundary. At 12 s, the water-sediment mixture has completely reached the outlet section. The computed time for the water-sediment mixture to traverse the entire pipe is 12 s, with a relative error of 7.5% compared to the 11.1 s measured in the physical experiment.
(2)
Condition 2 (Semi-circular Drainage Pipe) Flow Field Characteristics: For condition 2, the flow characteristics of the semi-circular drainage pipe are shown in Figure 10c,d. At the transient state of 9 s, the water-sediment fluid has not yet reached the outlet. At 10.5 s, the water-sediment mixture reaches the outlet, and the time for the water-sediment mixture to traverse the entire drainage pipe is 10.5 s, with an error of 12.9% compared to the 9.3 s measured in the experiment.
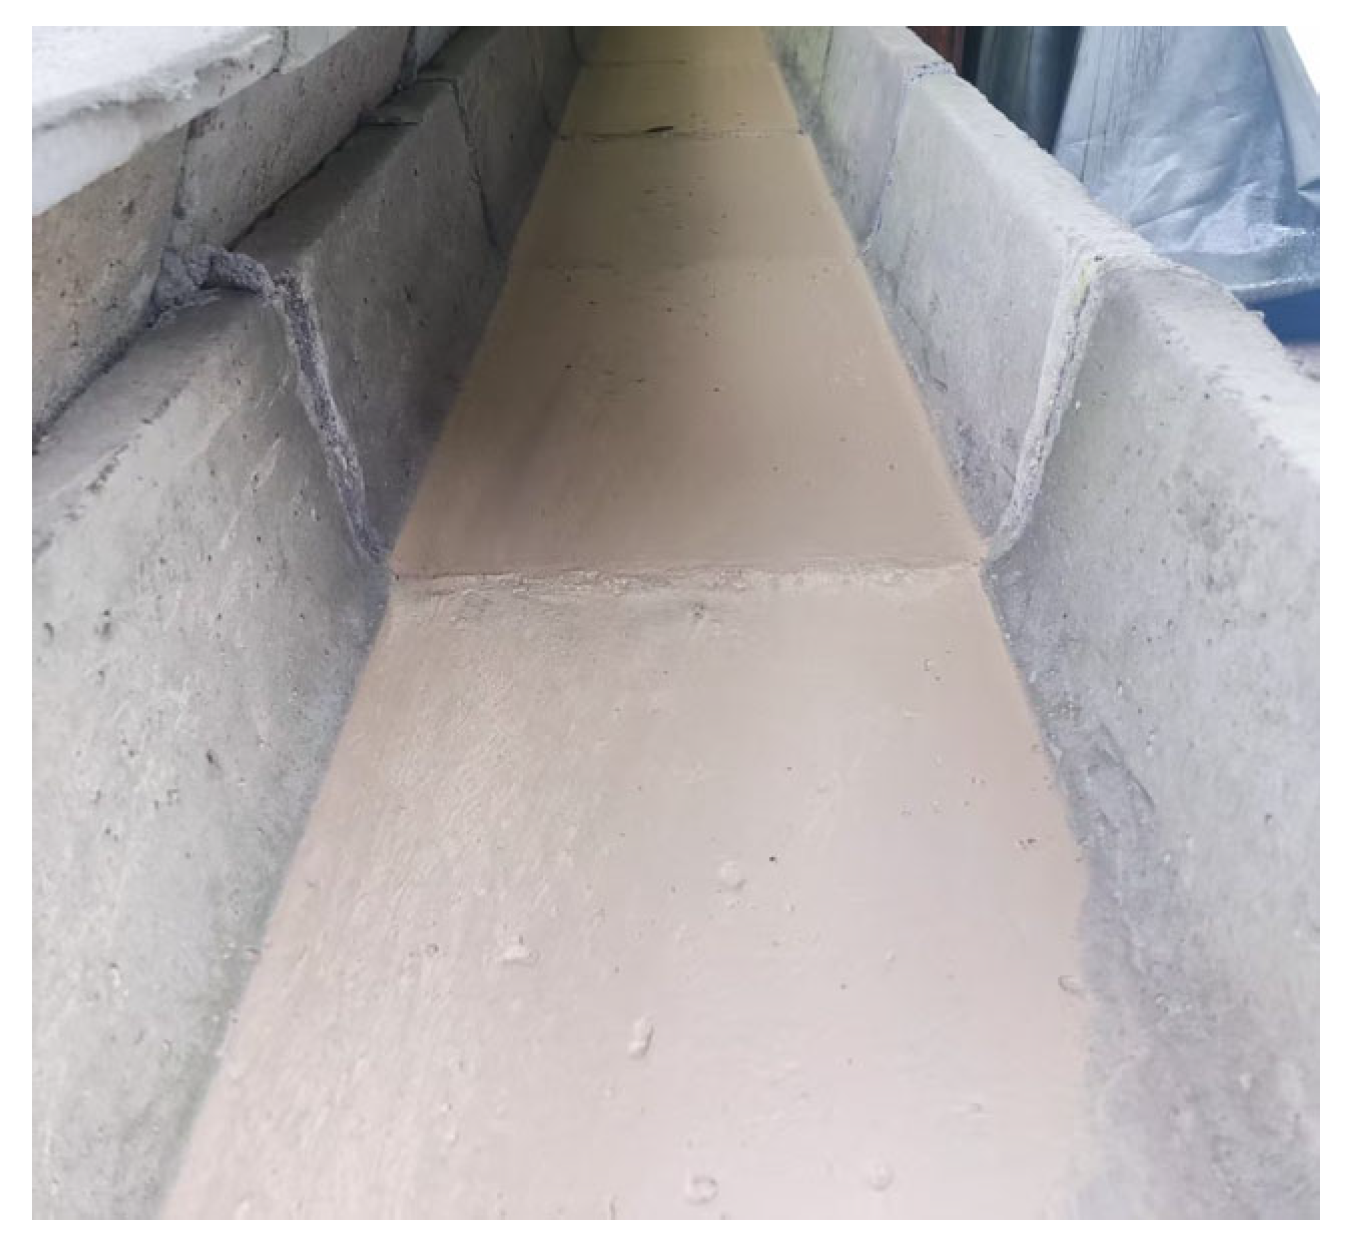
The simulation results for the average water velocity for both conditions 1 and 2 show that the errors between the simulated and experimental values are both controlled within 13%. Given the complexity of full-scale multiphase sediment transport simulations, this margin of error is generally considered acceptable for engineering design purposes. Crucially, the qualitative deposition patterns are also validated. As shown by comparing Figure 11 (Simulation) and Figure 12 (Experiment), the CFD model successfully reproduces the spatial distribution characteristic of “scouring in the center and deposition near the sidewalls.” This morphological consistency confirms that the model correctly captures the secondary flow effects and velocity gradients that drive sediment segregation, validating its use for cross-sectional optimization. Therefore, the numerical simulation results based on the Eulerian multiphase flow model exhibit good consistency with the physical experimental data. This computational model can effectively represent the transport characteristics of the two-phase flow of water and sediment within the drainage trench.
At the 600 s transient state, the sediment distribution of the water-sediment mixture in the rectangular drainage pipe for condition 1 is examined. The 3D view of the drainage trench is shown in Figure 11, where the sediment particle volume fraction exceeds 0.0007 (higher volume fractions show less noticeable sedimentation). The results indicate that sediment deposition is more concentrated near the inlet, with a relatively uniform lateral distribution. Between 2 and 6 m from the inlet, noticeable non-uniform sedimentation occurs, with less deposition in the center of the drainage pipe and more sediment accumulation near the sidewalls. This phenomenon is consistent with the observed non-uniform sedimentation in the experiment, as shown in Figure 12. The sedimentation patterns for the other three conditions exhibit similar spatial distribution characteristics to those of condition 1.
Further, typical longitudinal sections at distances of 1 m, 3 m, and 5 m from the inlet of the drainage trench are selected to extract the corresponding flow velocity contours, as shown in Figure 13. From the velocity contours, it can be observed that along the longitudinal direction of the drainage pipe, the average flow velocity of each section gradually increases, with maximum flow velocities of 0.25 m/s, 0.45 m/s, and 0.6 m/s, respectively. All three sections exhibit a typical “high in the center, low at the edges” velocity distribution, where the flow velocity in the central region of the fluid domain is higher, while the velocity near the walls is significantly reduced. This suggests that the sediment-carrying capacity is stronger in the high-velocity central region, resulting in lighter sedimentation. Conversely, in the low-velocity edge regions, the flow capacity is insufficient, making it easier for sediment to settle, thereby leading to the formation of an uneven sedimentation pattern within the drainage trench. Consequently, the degree of sediment accumulation in the drainage trench is closely related to the local velocity distribution.
For the four conditions mentioned above, at the 600 s transient state, sediment with a volume fraction greater than 0.002 is considered to be deposited. Using the ANSYS CFD-POST 2022R2 for post-processing, the volume of sediment deposited within the drainage pipe is obtained. After calculations, the sediment deposition mass for conditions 1 to 4 is found to be 81.975 g, 57.750 g, 43.5 g, and 60.595 g, respectively. The ranking of drainage trenches’ anti-sedimentation capacities is as follows: narrow rectangular > semi-circular ≈ trapezoidal > rectangular. The corresponding cross-sectional areas of the four drainage pipes are ranked as: rectangular > semi-circular ≈ trapezoidal > narrow rectangular (these rankings apply only to the conditions set in this study). There is an approximate negative correlation between the cross-sectional area of the drainage pipe and its anti-sedimentation capacity.
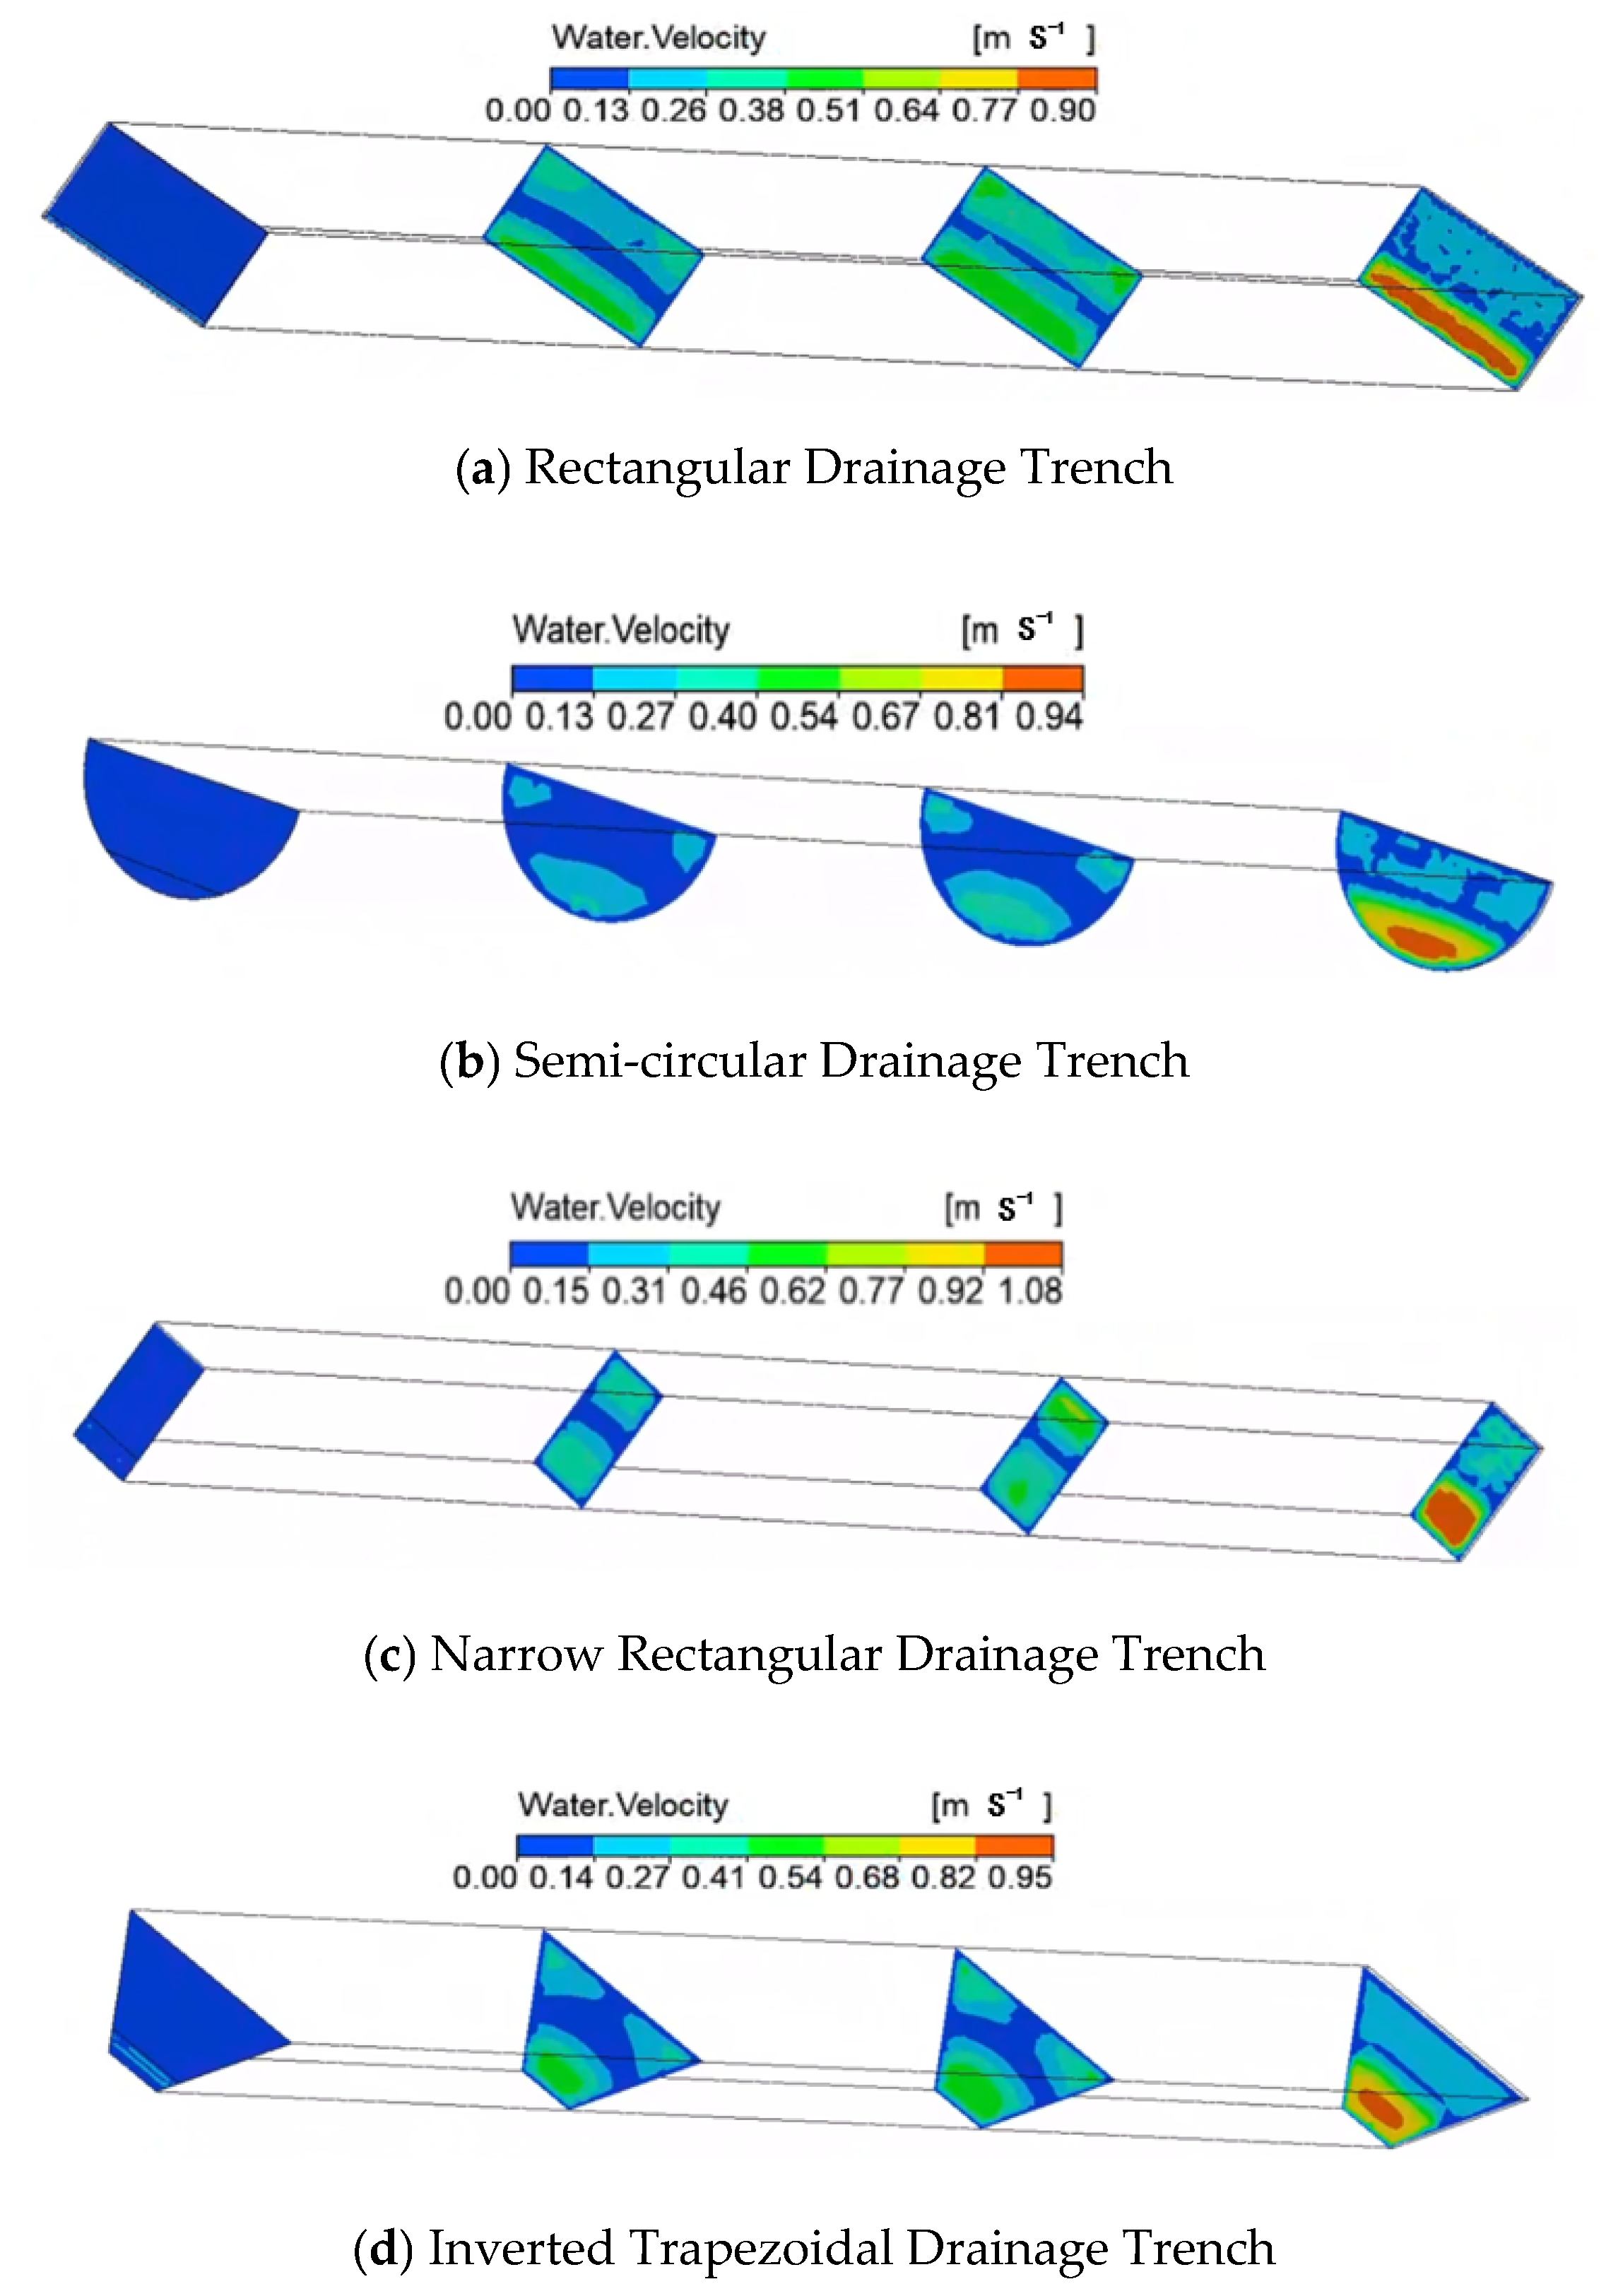
For each of the four conditions, transient states at 600 s are selected, and cross-sections are established at distances of 0 m, 2 m, 4 m, and 6 m from the inlet. The flow velocity contours for these sections are shown in Figure 14.
Using CFD-POST calculations, the maximum flow velocity at each cross-section of the drainage pipes for each condition is obtained, as shown in Table 4. From the table, it can be observed that in all four conditions, the flow velocity in the central region of the fluid domain is higher, while the velocity near the edges is lower. For conditions 1 to 4, the maximum flow velocities at the outlet are 0.9 m/s, 0.94 m/s, 1.08 m/s, and 0.95 m/s, respectively. The maximum flow velocity ranking is as follows: narrow rectangular > semi-circular ≈ trapezoidal > rectangular. This ranking corresponds with the anti-sedimentation capacities of the drainage trenches discussed earlier, indicating a close relationship between the drainage trench’s anti-sedimentation capacity and flow velocity. The higher the maximum flow velocity, the less sedimentation occurs under the same conditions, thereby enhancing the anti-sedimentation capacity. Compared to the rectangular cross-section in condition 1, conditions 2–4 involve changes to the bottom shape of the drainage trench, i.e., reducing the bottom dimension. This modification allows the water-sediment mixture to flow with lower resistance and higher velocity within the drainage pipe.

5. Discussion

5.1. Mechanistic Interpretation of Sediment Transport

The observed nonlinear reduction in sediment accumulation with increasing slope and flow rate can be explained by the fundamental theory of critical shear stress and incipient motion. According to the Shields criterion, sediment particles initiate motion only when the bed shear stress ( τ b ) exceeds the critical shear stress ( τ c ).
τ b = ρ g R S
where ρ is fluid density, g is gravity, R is the hydraulic radius, and S is the slope. The experimental results indicate a threshold behavior: at low slopes (1%) and low flow rates, the generated τ b is insufficient to overcome the resistance of the mixed sediment ( τ b < τ c ), leading to significant deposition. As the slope increases to 3%, the gravitational component of the flow significantly enhances τ b . Once this stress exceeds the nonlinear transport threshold of the bulk sediment, the system shifts from a deposition-dominated regime to a transport-dominated regime, resulting in the “zero accumulation” state observed in Condition M13.
These results quantitatively corroborate fundamental hydraulic principles within the specific context of tunnel drainage. While the inverse relationship between slope/flow and sedimentation is well-established, this study provides specific threshold values and decay coefficients for full-scale mountain tunnel drainage trenches, bridging the gap between theoretical hydraulics and practical engineering design.

5.2. Comparative Optimization of Cross-Sections

Based on the numerical simulation analysis of the four conditions, the hydraulic performance of drainage ditches with different cross-sectional morphologies exhibits significant divergence. Among the tested conditions, the square cross-section (Condition 1) possesses the highest flood discharge capacity due to its maximal flow area; however, it yields the lowest average flow velocity, resulting in the weakest anti-sedimentation efficiency. In contrast, the narrow rectangular section (Condition 3) achieves the highest maximum velocity and fluid depth under the identical flow rate, demonstrating optimal anti-sedimentation capability, yet its minimal cross-sectional area limits its maximum flood discharge capacity. Conditions 2 and 4 exhibit intermediate maximum velocities and moderate anti-sedimentation capabilities, with cross-sectional areas lying between those of Condition 1 and Condition 3, thus achieving a balanced performance compromise.
This performance differentiation fundamentally reflects the mutual constraint between flow area and flow velocity: increasing the cross-sectional area enhances flood discharge capacity but reduces average flow velocity, thereby weakening sediment carrying capacity. Conversely, reducing the bottom width can enhance flow velocity and sediment transport capacity by optimizing flow resistance, though potentially at the expense of flood discharge capacity.
The superior performance of the narrow rectangular and semi-circular cross-sections is attributed to their geometric efficiency. For a given flow area, these shapes possess a smaller wetted perimeter compared to the wide rectangular section, resulting in a larger hydraulic radius (R). This geometric characteristic is particularly critical under low-flow base conditions, as it sustains higher flow velocities and bed shear stresses, effectively preventing the settlement of fine particles.

5.3. Engineering Optimization Strategies

In practical engineering applications, sediment accumulation can be effectively mitigated through two primary approaches. Firstly, regular maintenance to remove debris can reduce the suspended sediment concentration in the water body, thereby retarding the silting process. Secondly, the structural design parameters of the drainage system can be optimized. By appropriately increasing the longitudinal slope and rationally enhancing the drainage flow rate, the hydraulic sediment-carrying capacity can be fully leveraged to strengthen the system’s resistance to clogging, ensuring efficient and stable operation.
Building upon compliance with industry standards, it is recommended to transition from the conventional “continuous low-flow” regime to a “periodic concentrated discharge” strategy. This approach involves accumulating wastewater to discharge it at higher flow rates, thereby alleviating sediment blockage. (However, the potential risks of this strategy, such as temporary hydraulic overloading and downstream scouring, must be assessed.) Regarding cross-sectional design, while large square sections are traditionally favored for their high discharge capacity, this study suggests prioritizing geometries with narrower bottoms—such as semi-circular, U-shaped, inverted trapezoidal, or V-shaped sections—provided that local flood discharge regulations are met. This recommendation aligns theoretically with the experimental findings that semi-circular sections exhibit significantly superior anti-sedimentation performance compared to square sections under high-flow conditions, providing a quantitative reference for structural selection in engineering practice.
Consequently, the operational shift from “continuous trickle flow” to “concentrated discharge” proves to be a viable strategy for sediment reduction. Simultaneously, under the premise of meeting safety and regulatory standards, appropriately increasing the drainage slope and optimizing cross-sections from traditional square shapes to curved structures (e.g., semi-circular or U-shaped) can comprehensively enhance the anti-clogging capability. These strategies provide a theoretical foundation for the design and maintenance management of tunnel drainage systems.

5.4. Limitations and Applicability

While this study provides valuable insights into the hydraulic control of sedimentation, certain limitations regarding representativeness must be acknowledged:
(1)
Steady-State vs. Episodic Supply: In natural mountain tunnels, sediment supply is often episodic, characterized by fine particles during baseflow and coarse pulses during storm events. The experimental design employed a quasi-steady sediment input (constant concentration) to strictly isolate the effects of slope, flow rate, and geometry. Consequently, the results presented herein are most valid for scenarios of steady-state seepage or continuous drainage. They may not fully capture the dynamic behavior of sediment transport under extreme, transient storm surges where sediment concentration fluctuates rapidly.
(2)
Bulk Mass vs. Size-Selective Transport: The analysis focused on the bulk mass of the accumulated sediment. However, the broad particle-size distribution (0.062–2.0 mm) implies that size-selective transport and armoring effects (where coarse particles shield underlying fines) likely occur. This study did not quantify the segregation of particle sizes within the deposits. Future research should distinguish between the transport thresholds of varying particle fractions to provide a more granular understanding of the clogging mechanism.
(3)
Simplification of Numerical Model: The numerical simulation employed the Eulerian multiphase model, treating sediment as a continuous phase. This approach simplifies the complex particle-particle interactions (e.g., collisions) and assumes average settling velocities and drag laws. While this simplification effectively captures the macroscopic transport trends and deposition patterns needed for comparative cross-sectional analysis, it may not accurately predict the microscopic behavior of individual particles or the formation of bedforms (e.g., ripples) observed in natural environments.

6. Conclusions

Based on full-scale simulation tests of the drainage trench service process, this study systematically reveals the coupling mechanism between the degree of sediment accumulation in tunnel drainage trenches and factors such as sediment concentration, water-sand flow rate, longitudinal slope, and cross-sectional shape. By integrating computational fluid dynamics (CFD) numerical simulations, the study delves into the influence mechanism of flow velocity distribution on sediment deposition, providing theoretical support and optimization pathways for selecting drainage trench structures and formulating anti-sedimentation strategies in engineering practice. The main research conclusions are as follows:
(1)
Quantitative Analysis of Key Factors Affecting Sediment Accumulation: The sediment accumulation process in mountain tunnel drainage trenches is influenced synergistically by sediment concentration, water-sand flow rate, and longitudinal slope. Experimental data show that in drainage trenches with different cross-sectional shapes, the sediment accumulation volume is linearly positively correlated with sediment concentration (fitting slope of 0.87) and exponentially negatively correlated with flow rate and slope (coefficient of determination R2 greater than 0.90). When the flow rate exceeds a critical threshold, the influence of sediment concentration on sedimentation decreases, and slope and flow rate become the dominant controlling factors. Taking the geometric parameters of the drainage trench used in this experiment as an example, when the longitudinal slope is 3% and the single-side flow rate is 1.33 m3/h, the trench can achieve a state with no significant sediment accumulation. A comparison of conditions shows that drainage trenches with a semi-circular cross-section exhibit better anti-sedimentation performance than those with a rectangular cross-section.
(2)
Correlation between Flow Velocity Distribution and Sedimentation Patterns: Within the range of boundary conditions tested in this study (flow rates of 0.22–1.33 m3/h and slopes of 1–3%), along the vertical direction of the drainage trench cross-section, the flow velocity in the center of the fluid domain is significantly higher than in the surrounding areas, leading to an “intermediate low, sides high” non-uniform sedimentation pattern. For the four typical cross-sections (rectangular, semi-circular, trapezoidal, and narrow rectangular) with different flow cross-sectional areas (rectangular > semi-circular ≈ trapezoidal > narrow rectangular), under the same boundary conditions, the maximum flow velocities are ranked as narrow rectangular > semi-circular ≈ trapezoidal > rectangular. The corresponding anti-sedimentation capabilities follow the same order, with the narrow rectangular cross-section performing the best and the rectangular cross-section performing the worst.
(3)
Engineering Anti-Sedimentation Technical Strategies: Based on the experimental conclusions, the following engineering optimization measures are proposed: ① Appropriately increase the longitudinal slope of the drainage trench, and establish a regular cleaning and maintenance mechanism to remove accumulated wastewater and debris. ② Innovate the drainage mode by switching from the traditional “continuous low-flow” to a periodic concentrated discharge, using peak flow to enhance sediment transport capacity and reduce sedimentation risk. However, it must be noted that this operational strategy carries potential risks. The sudden release of high-velocity pulses may cause temporary hydraulic overloading, scouring of downstream receiving water bodies, and potential structural fatigue due to cyclic hydraulic loading. Therefore, the implementation of this strategy requires a comprehensive assessment of the downstream system’s capacity and structural durability. ③ Under the premise of meeting tunnel drainage and flood control standards, prioritize the use of trapezoidal or semi-circular cross-section drainage trenches, which can effectively improve the overall anti-sedimentation performance of the system.
(4)
Cross-Sectional Optimization Design Method: In engineering practice, the bottom flow width of the drainage trench can be reduced to enhance the average flow velocity and improve sediment-carrying capacity. It is recommended to prioritize the use of trapezoidal or semi-circular cross-section shapes, with a slight reduction in flow cross-sectional area (to achieve an increase in flow velocity) to optimize both drainage smoothness and operational reliability, provided the required drainage flow rate is met.

Author Contributions

Conceptualization, Y.W. and Y.P.; methodology, J.J. and H.Y.; software, S.Y.; validation, S.Y., Y.P. and Y.X.; formal analysis, Y.P., Y.X. and D.J.; investigation, H.W. and Y.X.; resources, Y.W. and H.Y.; data curation, Y.X. (systematic collation, verification and classification of all experimental data); writing—original draft preparation, Y.P.; writing—review and editing, Y.P., H.W., D.J. and H.Y. (critical revision on academic logic, experimental results and discussion sections); visualization, D.J. (complete chart design, data visualization analysis and figure optimization); supervision, H.Y. (overall guidance on research design, experimental implementation and result discussion); project administration, Y.W.; funding acquisition, J.J. All authors have made substantial contributions to the conception or design of the work, the acquisition, analysis or interpretation of data; all have drafted the work or revised it critically for important intellectual content; all have approved the final version to be published; and all are accountable for all aspects of the work in ensuring that questions related to the accuracy or integrity of any part of the work are appropriately investigated and resolved. All authors have read and agreed to the published version of the manuscript.

Funding

This research was funded by Hubei Communication Investment Group Co., Ltd., under the project entitled “Key Technologies for Quality and Safety Control of Drill-and-Blast Tunnels Based on Dynamic Hybrid Modeling” (HBSJ-202203GL-013).

Data Availability Statement

Data available on request from the corresponding author, Yimin Wu.

Conflicts of Interest

The authors declare that this study received funding from Hubei Communication Investment Group Co., Ltd. The funder had the following involvement with the study: methodology, formal analysis, investigation, data curation, writing—review and editing, visualization and supervision.

References

  1. Fan, Z.; Zhang, J.; Fu, J.; Xiao, K.; Huang, Y.; Magenge, S.E. Mechanism and mechanical analysis of failure of buried rubber waterstop in construction joints of tunnel drainage ditches. Eng. Res. Express 2025, 7, 045131. [Google Scholar] [CrossRef] [Scilit]
  2. Xu, C.; Chen, Y.; Yang, Y.; Li, P.; Wang, S.; Li, L. Experimental Investigation of Crystal Blocking in Drainage Pipes for Tunnels in the Karst Region. Appl. Sci. 2022, 12, 10928. [Google Scholar] [CrossRef] [Scilit]
  3. Lu, C.; Xu, J.; Wang, L.; Wang, H.; He, B.; Tian, C.; Qian, W. Analysis of the Influencing Factors of Crystalline Blockages in Mountain Tunnel Drainage Systems Based on Decision Analysis Methods. Appl. Sci. 2023, 13, 3721. [Google Scholar] [CrossRef] [Scilit]
  4. Whittaker, A.C.; Attal, M.; Allen, P.A. Characterising the origin, nature and fate of sediment exported from catchments perturbed by active tectonics. Basin Res. 2010, 22, 809–828. [Google Scholar] [CrossRef] [Scilit]
  5. Geurts, A.H.; Cowie, P.A.; Duclaux, G.; Gawthorpe, R.L.; Huismans, R.S.; Pedersen, V.K.; Wedmore, L.N.J. Drainage integration and sediment dispersal in active continental rifts: A numerical modelling study of the central Italian Apennines. Basin Res. 2018, 30, 965–989. [Google Scholar] [CrossRef] [Scilit]
  6. TB 10003-2016; Code for Design of Railway Tunnels. China Railway Publishing House: Beijing, China, 2016.
  7. Jin, D.; Wang, T.; Wu, X. Model-Driven Sewage System Design and Intelligent Management of the Wuhan East Lake Deep Tunnel Drainage Project. Water 2025, 17, 3091. [Google Scholar] [CrossRef] [Scilit]
  8. Zhou, Y.; Zhang, X.; Liu, Y.; Yang, Y. Groundwater Discharge Limits of Mountain Tunnels Based on the Normal Growth of Typical Herbaceous Plants. Appl. Sci. 2024, 14, 6561. [Google Scholar] [CrossRef] [Scilit]
  9. Li, Y.; Liu, S.; Guan, S.; Gao, F.; Zhang, Y. Numerical Analysis of the Blockage Effect of the Tunnel Drainage System on the E-Han Expressway. Processes 2023, 11, 949. [Google Scholar] [CrossRef] [Scilit]
  10. JTG D33-2012; Code for Design of Highway Drainage. China Communications Press: Beijing, China, 2012.
  11. Liu, S.; Zhang, X.; Chen, X.; Wang, C.; Chen, Y. Exploratory Research on Drainage Structure of Highway Tunnel Based on Reducing the Risk of Crystallization Blockage. Processes 2022, 10, 1319. [Google Scholar] [CrossRef] [Scilit]
  12. Ghosh, C.; Yasuhara, K. Clogging and flow characteristics of a geosynthetic drain confined in soils undergoing consolidation. Geosynth. Int. 2004, 11, 19–34. [Google Scholar] [CrossRef]
  13. Guo, C.; Zhang, L.; Guo, G.; Wang, T.; Bai, Y.; Zhang, D.; Yu, T. Experimental Study on Prevention and Control of Calcium Carbonate Crystallization in Tunnel Based on the Yijun Tunnel. Int. J. Anal. Chem. 2025, 2025, 5977802. [Google Scholar] [CrossRef] [Scilit]
  14. Wu, Y.; Cao, R.; Wang, J.; Meng, Y.; Yin, R.; Liu, Z. Formation mechanism analysis of karst collapses in Geleshan Town-Zhongliang Town, Chongqing, China. Carbonates Evaporites 2025, 40, 138. [Google Scholar] [CrossRef] [Scilit]
  15. Crenshaw, A.B.; Santi, M.P. Water Table Profiles in the Vicinity of Horizontal Drains. Environ. Eng. Geosci. 2004, 10, 191–201. [Google Scholar] [CrossRef] [Scilit]
  16. Xiao, D.; Liu, B.; Liu, S.; Wang, C.; Huang, K.; Yu, X.; Wu, W. Experimental Study on Anti-Crystallization Performance of Tunnel Drainage Pipes Based on Magnetic Powder Effect. Coatings 2025, 15, 1005. [Google Scholar] [CrossRef] [Scilit]
  17. Li, Y.; Dai, L.; Zhang, L.; Shen, X.; Zhang, X.; Yang, Y.; Guan, Y. Metagenomic insights into the changes of runoff water quality in a deep tunnel drainage system. Environ. Res. 2025, 285, 122509. [Google Scholar] [CrossRef] [Scilit]
  18. Liu, Y.Y.; Zhang, Y.X.; Ma, D.S.; Zhang, H.N.; Chen, M.S. Construction of Crystallization Risk Control Indicators and Evaluation System for Tunnel Drainage Systems. Chin. J. Undergr. Space Eng. 2025, 21, 2192–2202+2216. (In Chinese) [Google Scholar]
  19. Yang, S.L.; Jin, J.; Ma, Y.Y.; Lan, W.Y. Study on Sediment Transport Law in Low-Pressure Turbid Water Pipes and Calculation of Flow Sediment Carrying Capacity. J. Irrig. Drain. 2024, 43, 103–112. [Google Scholar]
  20. Ma, L.; Mou, X.; Xu, X.; Tang, Z.; Li, C.; Zhang, T. Optimization and monitoring verification of drainage control strategy of high-pressure water-rich karst tunnel: A case study of Dejiang Tunnel. Discov. Appl. Sci. 2025, 7, 459. [Google Scholar] [CrossRef] [Scilit]
  21. Chen, X.; Zhang, X.; Guan, S.; Yu, W.; Liu, S.; Li, G. Study on coatings for mitigating calcite scale in tunnel drainage pipes. J. Mater. Res. Technol. 2025, 36, 1962–1973. [Google Scholar] [CrossRef] [Scilit]
  22. Gong, X.J.; Tao, R.L.; Hao, Y.C.; Zhang, M.X.; Yu, G.L. Critical velocity of sand transportation along long straight pipeline. Port Waterw. Eng. 2021, 13–17+23. (In Chinese) [Google Scholar] [CrossRef]
  23. Zhang, S.L.; Bao, T.; Yoo, C.; Liu, C.; Li, P.F.; Chen, L.P. Design, Test and Engineering Application of Composite Waterproof and Drainage Systems for Tunnels. China J. Highw. Transp. 2021, 34, 198–208. [Google Scholar] [CrossRef]
  24. Ye, Z.D. Study on Influencing Factors and Prediction Model of Blockage and Flow-Carrying Capacity of Drainage Blind Pipes in Railway Tunnels. China Railw. 2024, 43–51. [Google Scholar]
  25. Qian, W.; Wang, B.; Luo, D.; Xu, A.; Li, S. Experimental investigation and application on mechanical properties of tunnel linings under different blockage rates of drainage system in a karst tunnel. Tunn. Undergr. Space Technol. Inc. Trenchless Technol. Res. 2025, 157, 106359. [Google Scholar] [CrossRef] [Scilit]
  26. Zhao, K.; Yu, B.; Yang, Y.; Li, S.; Li, D. Causes, influencing factors, and prediction modeling of crystallization blockage of tunnel drainage blind pipe in non-karst area. Case Stud. Constr. Mater. 2024, 21, e04041. [Google Scholar] [CrossRef] [Scilit]
  27. López, R.; Garcia, C.; Vericat, D.; Batalla, R.J. Downstream changes of particle entrainment in a hydropeaked river. Sci. Total Environ. 2020, 745, 140952. [Google Scholar] [CrossRef] [Scilit]
  28. Vázquez-Tarrío, D.; Carrero-Carralero, E.; López, R.; Ville, F.; Vericat, D.; Batalla, R.J. A Field-Based Estimation of the Variability of Particle Entrainment in Coarse-Bed Rivers. J. Geophys. Res. Earth Surf. 2024, 129, e2024JF007695. [Google Scholar] [CrossRef] [Scilit]
  29. Jiang, Y.; Tong, Y.; Ye, F.; Zhang, J.; Tian, C.; Wu, B.; Cui, H. The failure mechanism of crystallization blockage in tunnel drainage system and preventive measure of scale inhibitor. Eng. Fail. Anal. 2024, 166, 108915. [Google Scholar] [CrossRef] [Scilit]
  30. Sun, J.; Wu, X.; Wang, G.; He, J.; Li, W. The Governance and Optimization of Urban Flooding in Dense Urban Areas Utilizing Deep Tunnel Drainage Systems: A Case Study of Guangzhou, China. Water 2024, 16, 2429. [Google Scholar] [CrossRef] [Scilit]
  31. Yuan, P.; Zhang, W.; Shang, X.; Pu, Y. Intrusion Event Classification of a Drainage Tunnel Based on Principal Component Analysis and Neural Networking. Water 2024, 16, 2409. [Google Scholar] [CrossRef] [Scilit]
  32. Zhou, W.; Guan, S.; Liu, S.; Wang, Y.; Cheng, Y.; Zhao, T.; Cheng, L.; Qin, T. The Distribution Pattern of Calcium Carbonate Crystallization in Tunnel Drainage Pipes. Processes 2024, 12, 1058. [Google Scholar] [CrossRef] [Scilit]
Figure 1. Flowchart of the research methodology.
Applsci 16 01758 g001
Figure 3. On-site Photograph of the Simulation Test.
Applsci 16 01758 g003
Figure 4. Cross-Sectional Dimensions of Drainage Trenches (Unit: mm).
Applsci 16 01758 g004
Figure 5. Cross-Section Configurations of Drainage Trenches (Unit: mm).
Applsci 16 01758 g005
Figure 6. Geometric Models of Drainage Trenches.
Applsci 16 01758 g006
Figure 7. Sediment Accumulation in Drainage Trenches Under Different Water Flow Rates and Sediment Contents.
Applsci 16 01758 g007
Figure 8. Sediment Accumulation Amount of Each Drainage Trench Under Different Water Flow Rates.
Applsci 16 01758 g008
Figure 9. Sediment Accumulation Amount of Drainage Trenches with Different Slopes Under Different Water Flow Rates.
Applsci 16 01758 g009
Figure 10. Fluid Distribution of Rectangular and Semi-circular Drainage Trenches Under Transient State.
Applsci 16 01758 g010
Figure 11. 3D View of Transient Sediment Accumulation in Rectangular Drainage Trench at 600 s.
Applsci 16 01758 g011
Figure 12. Full-Scale Test View of Sediment Accumulation in Rectangular Drainage Trench with 1% Slope.
Applsci 16 01758 g012
Figure 13. Water Flow Velocity Contour Maps of Different Cross-Sections in Rectangular Drainage Trench at 600 s.
Applsci 16 01758 g013
Figure 14. Water Flow Velocity Contour Maps of Each Drainage Trench Under Transient State at 600 s.
Applsci 16 01758 g014
Table 1. Experimental Scheme Design.
Water Flow Rate of Single Drainage Trench
(m3/h)
SlopeCross-Sectional ShapeSediment Content in Water
(kg/m3)
0.22
0.67
1.33
1%
2%
3%
Semi-circular
Rectangular
1.0
2.5
5.0
7.5
10.0
Table 2. Detailed Test Condition Grouping Schedule.
Group NumberWater Flow Rate of Single Drainage Trench
(m3/h)
Sediment Content in Water (kg/m3)
M10.221.0
M22.5
M35.0
M47.5
M510.0
M60.671.0
M72.5
M85.0
M97.5
M1010.0
M111.331.0
M122.5
M135.0
M147.5
M1510.0
Table 3. Settings of Computational Working Conditions.
Computational Working ConditionCross-Section ShapeDynamic Viscosity Coefficient (Pa s)Fluid Height (m)Initial Fluid Velocity (m/s)Characteristic Length (m)Reynolds NumberFlow Regime
1Rectangular0.0010.0110.10.02132131Transitional Flow Regime
2Semi-circular0.0010.0280.10.03633630Transitional Flow Regime
3Narrow Rectangular0.0010.0370.10.05405400Turbulent Flow
4Inverted Trapezoidal0.0010.0340.10.05115110Turbulent Flow
Table 4. Maximum Flow Velocity of Different Cross-Sections Under Each Computational Working Condition.
Computational Working ConditionCross-Section ShapeMaximum Flow Velocity of Each Cross-Section (m/s)
0 m2 m4 m6 m
1Rectangular0.10.420.640.90
2Semi-circular0.10.380.540.94
3Narrow Rectangular0.10.400.621.08
4Inverted Trapezoidal0.10.530.810.95
Disclaimer/Publisher’s Note: The statements, opinions and data contained in all publications are solely those of the individual author(s) and contributor(s) and not of MDPI and/or the editor(s). MDPI and/or the editor(s) disclaim responsibility for any injury to people or property resulting from any ideas, methods, instructions or products referred to in the content.