1. Introduction
In regions characterized by high mountains, deep valleys, and turbulent waterways—where the terrain is environmentally sensitive, complex, and unsuitable for direct road construction—tunnels provide an adaptive and environmentally friendly solution. They can effectively mitigate the influence of topography and climate on traffic flow, thereby improving driving safety and operational efficiency. With the continuous growth of transportation demand, tunnels have increasingly become integrated with interchanges and ramps, forming multidimensional transportation structures that optimize spatial utilization. Examples such as the Tiger Leaping Gorge Tunnel in Yunnan and the Shen-Zhong Subsea Tunnel in Guangdong demonstrate the application of traffic diversion within tunnel structures. Such integrated designs enable grade separation of traffic, enhancing overall traffic flow efficiency.
However, interchange areas remain high-risk zones for highway accidents due to vehicle diverging and merging behaviors at entrances and exits. Studies indicate that approximately 30% of all expressway accidents occur at or near interchanges, with a majority concentrated around ramp and exit sections [
1]. From the perspective of intelligent transportation systems and road safety engineering, the timely and effective delivery of roadway information is widely recognized as a key factor in accident prevention and driver decision making [
2]. Therefore, the proper placement of warning and guide signs in interchange diverging areas is critically important. Moreover, due to the semi-enclosed nature of tunnels and the difficulty of natural lighting, drivers’ visual information relies almost entirely on artificial light sources, making an appropriate lighting environment a non-negligible factor affecting the visibility of retroreflective guide signs.
The CIE published the “Guide for the Lighting of Road Tunnels and Underpasses” in 2004 [
3], which is the most widely referenced tunnel lighting design guideline internationally, serving as the foundational framework for many national standards. Based on the specific conditions of highway tunnel construction in different regions, tunnel lighting design standards such as the ANSI/IES RP-22-11 [
4] in the United States and CEN/TR 14380:2024 [
5] in Europe are continuously updated. Although there are differences in the methods and standards for tunnel lighting environments across countries, there is a general consensus that illumination should be strengthened in diverging areas. Currently, the lighting quality requirements for road tunnels are primarily based on meeting the driver’s recognition of standard small target objects. Both the International Commission on Illumination (CIE) recommended standards [
6] and China’s national highway lighting standards [
7] specify that the illumination level in interchange areas should exceed that of approaching road sections. According to the Chinese technical specification JTG/T D70/2-01-2014 Guidelines for Highway Tunnel Lighting Design [
8], the luminance level in tunnel diverging and merging zones should not be less than three times that of the tunnel’s middle section—these enhanced illumination areas are herein referred to as “reinforced lighting sections”.
Furthermore, the current Standards for Road Traffic Signs and Markings [
9] stipulate that, depending on the design speed, advance direction signs should be placed at graded distances before the interchange reference point, and exit direction signs should be installed at the reference location. When successive diverging ramps are present, the placement of guide signs is also influenced by the spacing between adjacent ramp noses. Consequently, the exit guide sign for the second diverging section may sometimes be positioned along the ramp itself. Under such circumstances, drivers transitioning from the first diverging zone into the ramp encounter adjacent road sections with different luminance levels—bright and dark—forming a non-uniform lighting environment (where the higher luminance section is referred to as the bright environment, and the lower luminance section as the dark environment).
The visual recognition performance of retroreflective guide signs placed in dark environments depends on the amount of light reflected from tunnel lighting and vehicle headlights that reaches the driver’s eyes from the adjacent bright environment, as well as the perceived luminance and color contrast between the sign and its background. Pan Xiaodong et al. [
10] investigated the influence of forward and back lighting conditions on traffic sign visibility and found that visibility is optimal under forward lighting and reduced under backlighting, implying that non-uniform lighting can impair drivers’ visual recognition. Similarly, Narisada [
11] derived and compared visibility models under uniform and non-uniform lighting conditions, revealing that non-uniform lighting affects drivers’ ability to perceive the shape and pattern of targets. Existing research thus indicates that a non-uniform lighting environment within a driver’s field of view can hinder the recognition of retroreflective guide signs. When entering a ramp from the first diverging zone, drivers are soon required to make a second diverging decision. They must promptly read and interpret the information on the retroreflective guide signs to choose the appropriate lane and perform lane-change maneuvers. If the non-uniform lighting conditions prevent accurate and timely recognition of complex upcoming road information, drivers may engage in unsafe behaviors such as sudden braking, abrupt lane changes, or even stopping or reversing after missing an exit—leading to significant safety risks. Therefore, improper lighting configurations that create non-uniform environments in tunnel ramp diverging zones can adversely affect drivers’ safe recognition of retroreflective guide signs.
In studies on traffic sign visibility, most researchers employ simulation and static visual recognition experiments due to safety and experimental constraints. Existing studies have shown that sign visibility is influenced by sign characteristics (e.g., letter height, sign height, information content) [
12], surrounding environmental conditions [
13], and driver visual characteristics [
14,
15]; these findings have informed practical sign placement design. Visual recognition capability is primarily evaluated through recognition distance and driver reaction time. Choocharukul et al. [
16] examined the influence of sign height, reflectivity, and driving speed on recognition distance. Du J. et al. [
17] studied drivers’ reaction times to variable message signs and the reliability of sign content. Tianzheng Wei et al. [
18] analyzed the reaction times of drivers with different visual characteristics, while Xianyu Li [
19] experimentally investigated sign recognition under standardized and information-overload conditions and used a BP neural network to analyze lane-change start and end points. Yulong Pei et al. [
20] proposed a safe distance model based on vehicle speed, driver visual characteristics, and sign placement position, and later analyzed the relationship between text-to-sign height ratio and recognition performance under varying speeds [
21]. Jiangbi Hu et al. [
22] found that variations in lighting brightness significantly influence recognition distance for retroreflective guide signs. However, most existing studies on traffic sign visibility have been conducted un-der uniform artificial or natural lighting conditions. Research on how non-uniform lighting environments—such as those in ramp diverging zones—affect drivers’ ability to recognize traffic signs remains limited. The findings of this study aim to contribute to the evaluation and safety design of “bright–dark” non-uniform lighting environments in tunnel diverging zones equipped with retroreflective guide signs.
In summary, the integration of tunnels with interchanges and ramps has created new traffic scenarios in which drivers must recognize retroreflective guide signs under “bright–dark” non-uniform lighting environments. The coupled characteristics of such artificial lighting conditions can significantly affect the safe visibility of retroreflective signs. Yet, current research largely focuses on uniform lighting conditions and lacks investigation into driver recognition performance under non-uniform lighting scenarios. Therefore, this study focuses on tunnel interchange diverging zones with non-uniform lighting, analyzing how the quality characteristics of “bright–dark” lighting affect drivers’ ability to recognize retroreflective guide signs. The aim of this study is to experimentally investigate the variation in recognition distance of guide signs in dark environments as perceived by drivers under bright environment conditions in road tunnels. The findings will also provide a predictive model, and design threshold recommendations.
2. Analysis of the Minimum Safe Recognition Distance for Guide Signs
The visibility of guide signs refers to the driver’s ability to correctly recognize and understand the content of the sign within a limited period of time. Regardless of lighting conditions, the process by which drivers recognize guide signs can generally be divided into four stages: detection, recognition, judgment, and action [
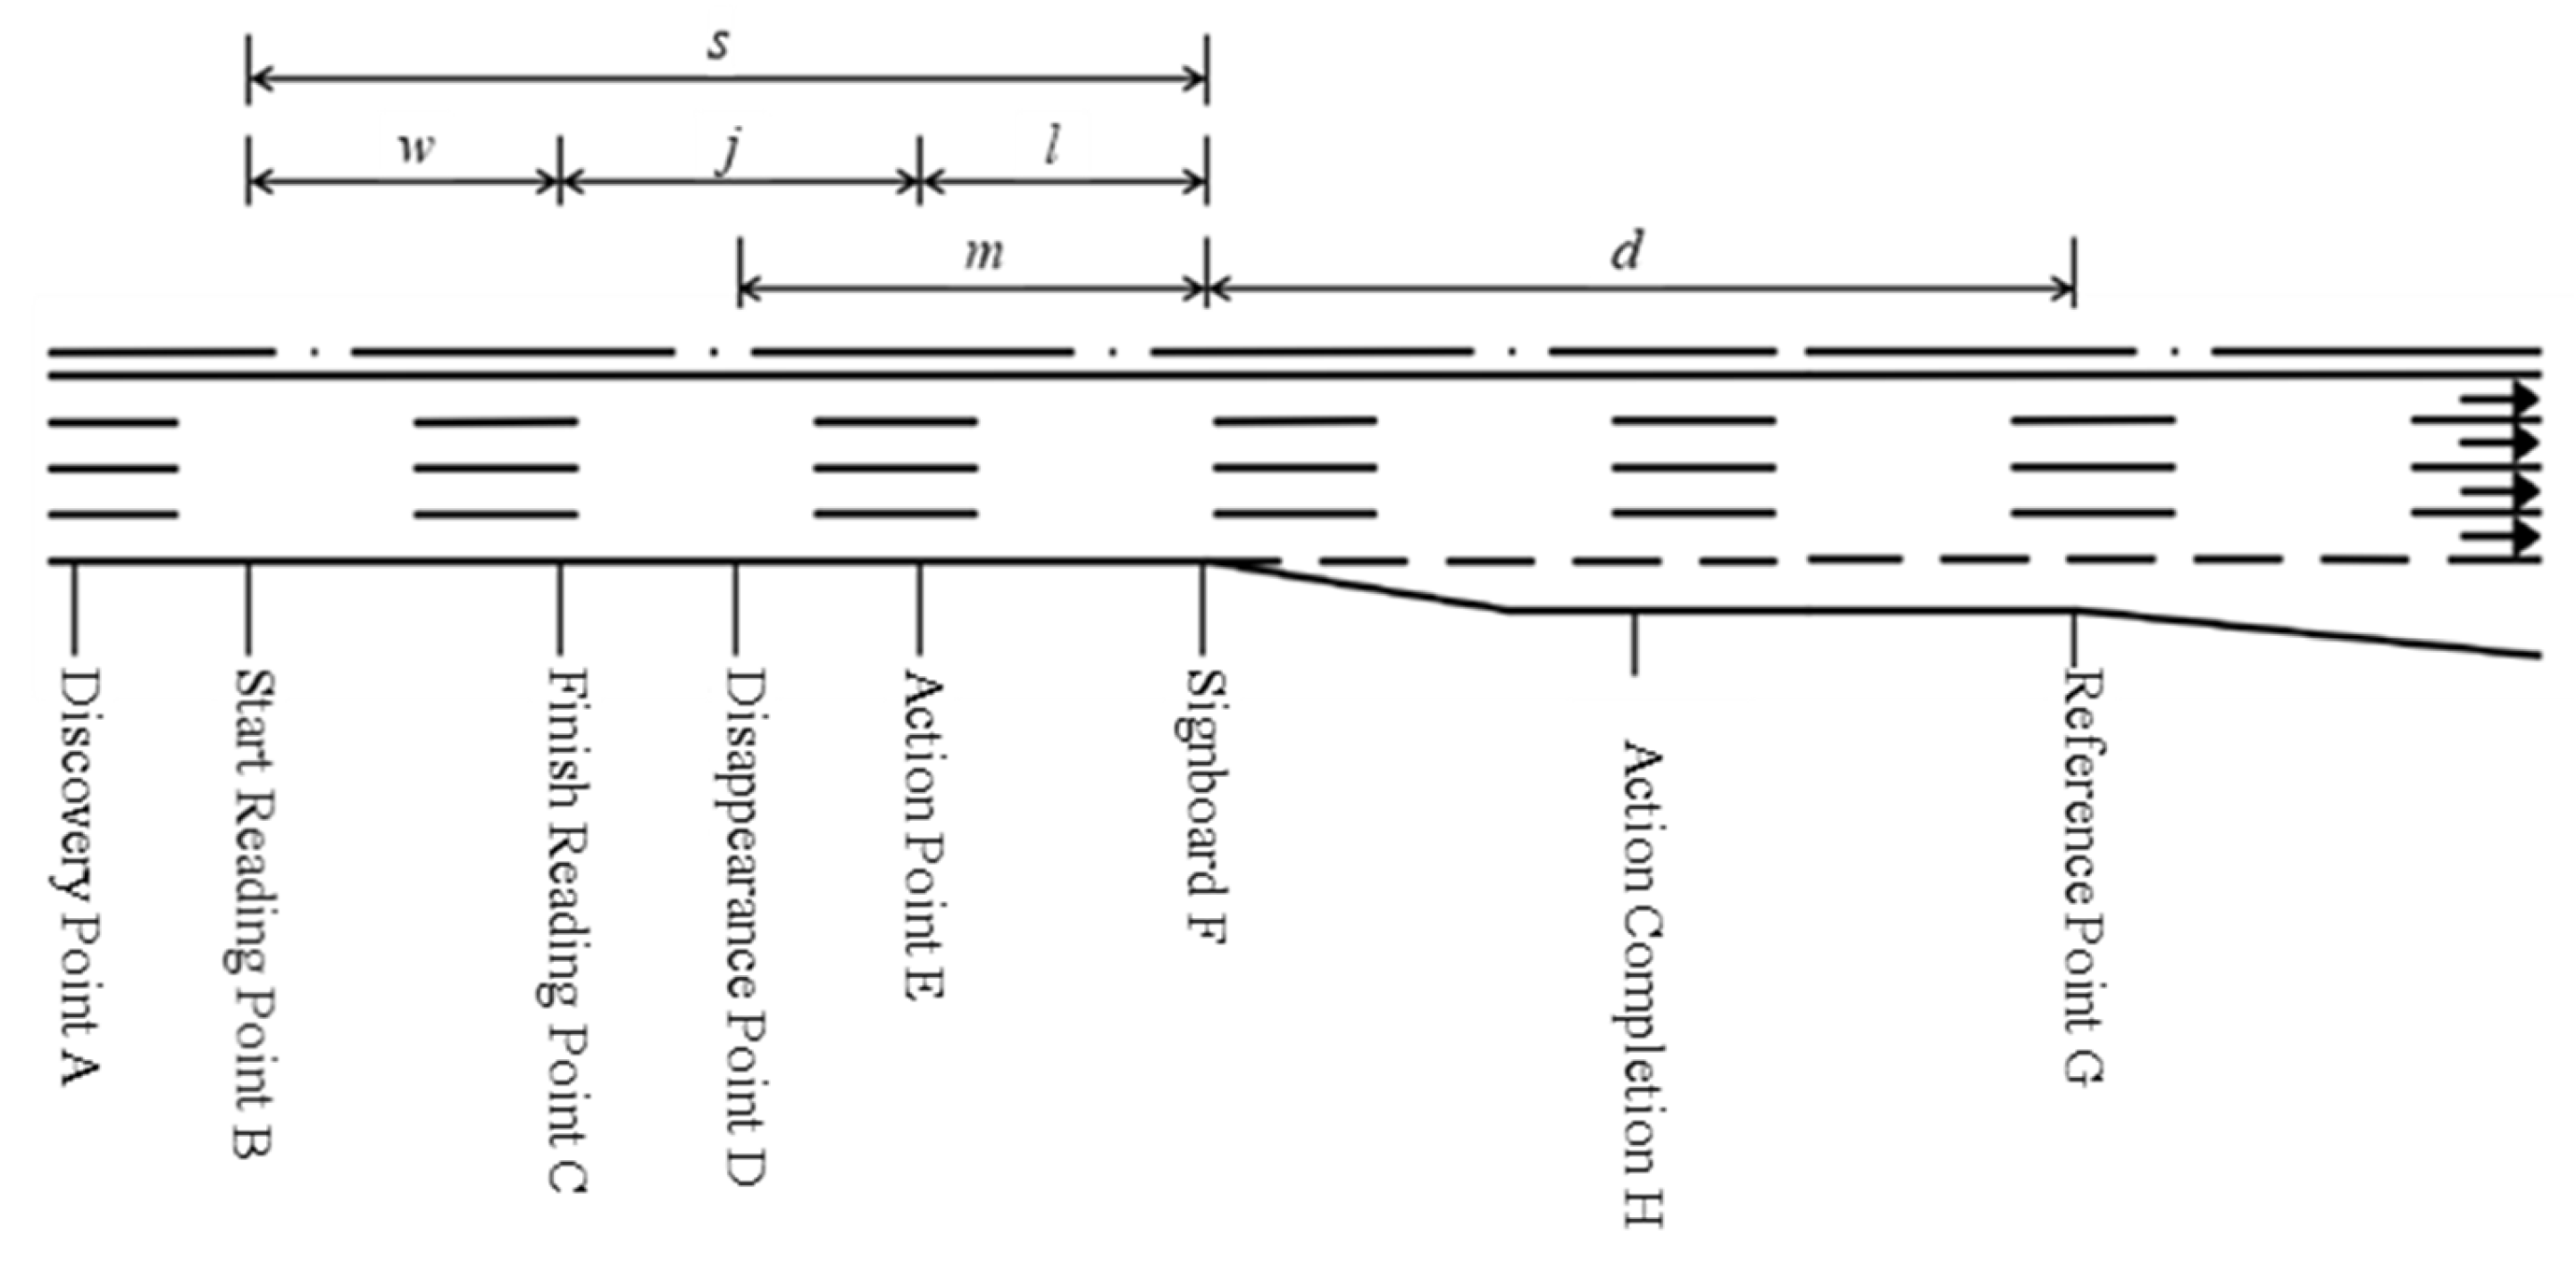
23], as illustrated in
Figure 1.
During vehicle operation, the driver travels along the road before point A, where the guide sign is not yet visible. Upon reaching point A, the sign at point F enters the driver’s visual field but remains unreadable. From point B, the driver begins to read the sign and finishes reading at point C. Between points C and E, the driver processes the obtained information and makes driving decisions—such as deceleration, lane change, or maintaining course—based on the current driving task. The decision-making action starts at point E and is completed at point H. Point D marks the position where the sign disappears from view due to the driver’s field-of-vision limitation; beyond this point, the sign is no longer visible.
The distance between the reading start point (B) and the reading end point (C) is defined as the reading distance (w). The distance between the reading start point (B) and the guide sign (F) is defined as the recognition distance (s). The distance from the reading end point (C) to the action point (E) is defined as the reaction distance (j). The distance between the disappearance point (D) and the guide sign (F) is defined as the disappearance distance (m), and the distance from the guide sign (F) to the reference point (G) is termed the advance distance (d).
From the geometric relationships illustrated in
Figure 1, it follows that
m ≤
j +
l. To derive the minimum safe recognition distance for guide signs under the most unfavorable visual conditions, the following assumptions are made:
- (1)
The guide sign position (F) coincides with the reference point (G), i.e., d = 0.
- (2)
The driver immediately reaches the disappearance point (D) upon completing the reading process, i.e., points C and D coincide.
Under these conditions, the minimum safe recognition distance (
Smin) can be expressed as:
where
w is the reading distance and
mmin is the minimum disappearance distance.
2.1. Reading Distance
The reading distance
w during vehicle operation can be calculated as:
where
v0 is the average driving speed (km/h), and
t is the time required to read and comprehend the sign information, taken as 2.6 s [
24].
2.2. Minimum Disappearance Distance
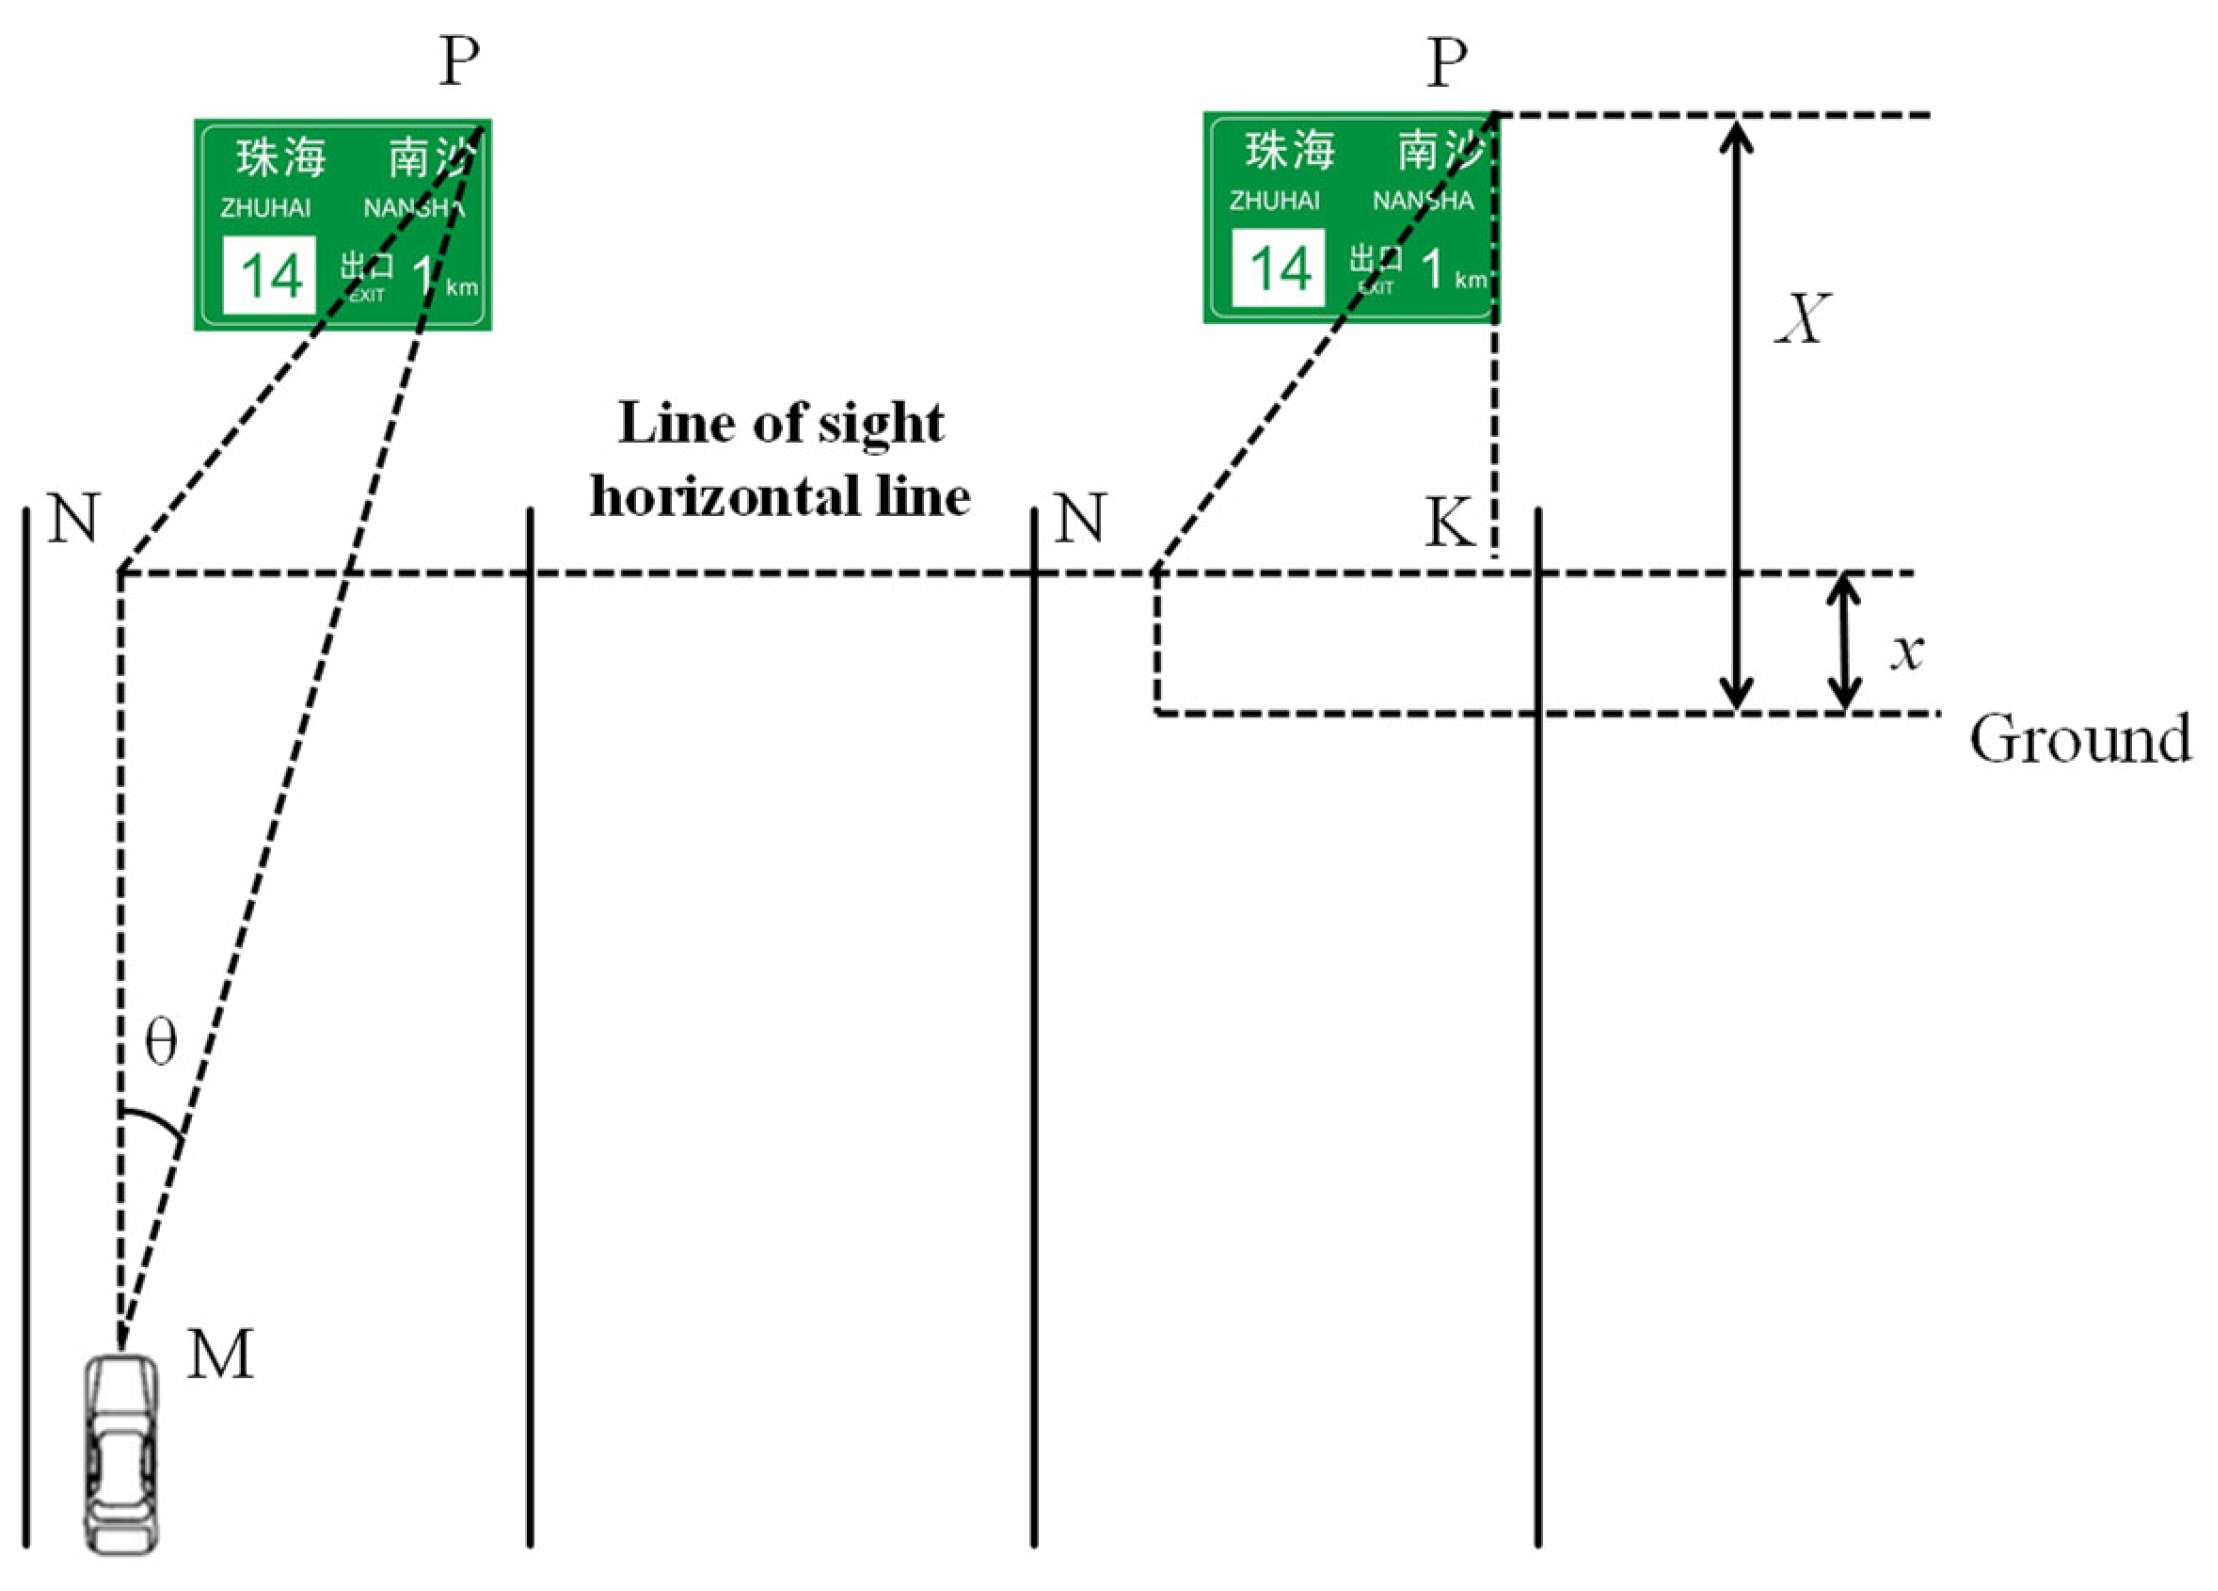
During the recognition process, the visual angle between the driver’s line of sight and the guide sign is denoted as
θ. When
θ ranges from 10° to 12°, the sign remains clearly visible; when
θ exceeds 14°, it disappears from view [
25].
When selecting the lane configuration, it is assumed that the driver is located in the innermost lane and gazes toward the upper-right corner of the guide sign. Under the most unfavorable conditions, the geometric relationship of the minimum disappearance distance is illustrated in
Figure 2, and its calculation formula is:
where
X is the vertical distance from the upper edge of the guide sign to the ground, and
x is the vertical distance from the driver’s eye level to the ground.
The above formulations incorporate key factors such as vehicle speed, driver reading time, visual angle, and road geometry, allowing estimation of the minimum safe recognition distance required for drivers to read guide signs under safe conditions.
However, the lighting conditions within tunnels are complex and variable. Drivers’ visual performance is influenced not only by the tunnel’s lighting system but also by the luminance characteristics of the surrounding environment. When reading retroreflective guide signs, the light reflected from the sign’s surface under the background lighting must enter the driver’s eyes for effective recognition. In non-uniform lighting environments, luminance differences between bright and dark zones lead to variations in the contrast between the guide sign luminance and the driver’s visual field. When this contrast exceeds the visual adaptation capacity, it may impair the driver’s ability to correctly recognize the guide sign [
26].
3. Experimental Design
To examine how variations in luminance contrast between the retroreflective guide sign and the driver’s visual field affect visual recognition performance, an experiment was designed using the dark-environment luminance as a control variable and the bright-environment luminance as an independent variable, to analyze the effect of “bright–dark” luminance differences on sign recognition distance.
3.1. Experimental Environment and Guide Signs
3.1.1. Test Scenario
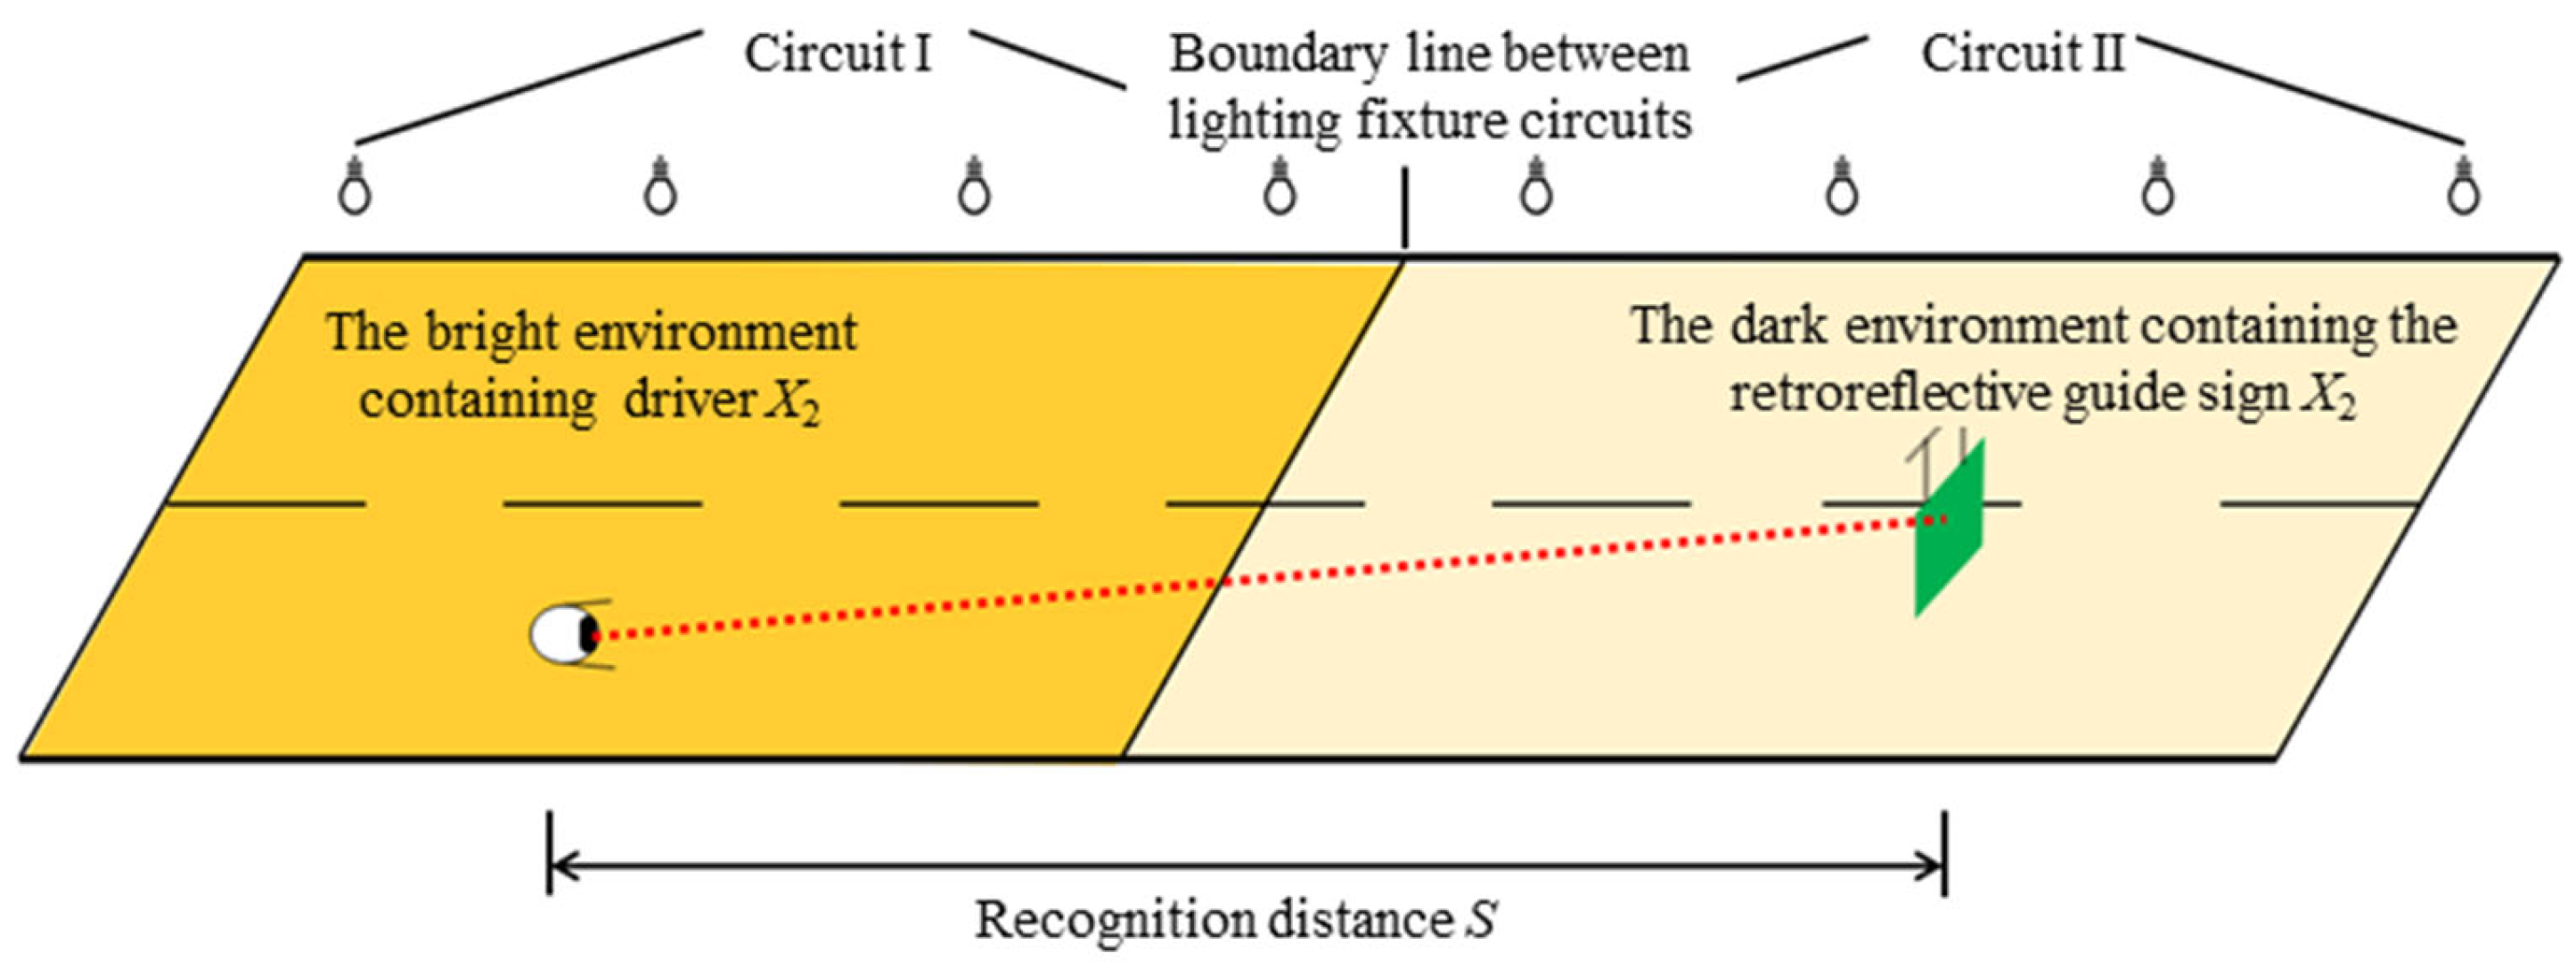
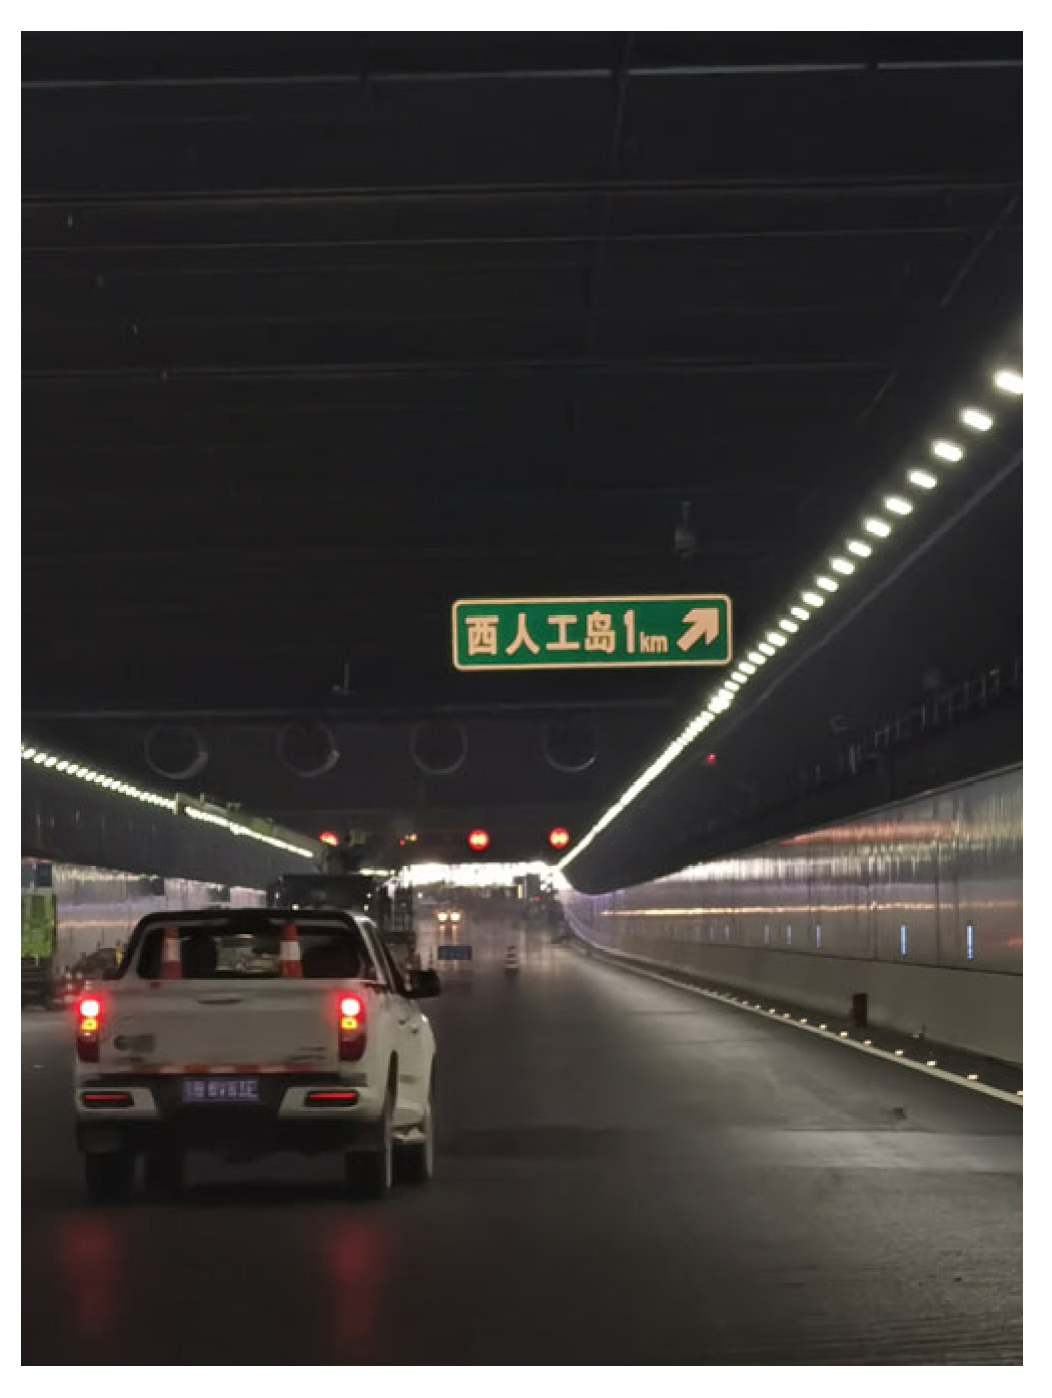
The experiment was conducted in the diverging area of a downstream underwater tunnel where a 1 km advance retroreflective guide sign was installed, as shown in
Figure 3 and
Figure 4. The test section comprised four lanes in one direction, each 3.75 m wide, with a total width of 18 m. The guide sign was positioned in the dark environment, 50 m away from the lighting circuit boundary. The tunnel was illuminated using LED lighting fixtures with a color temperature of 4500 K, typical for tunnel applications.
The luminance in two zones—upstream (bright environment) and downstream (dark environment)—was independently controlled through two separate lighting circuits. The upstream zone (
X1) represented the driver’s bright environment, while the downstream zone (
X2) corresponded to the dark environment containing the retroreflective guide sign. Field measurements confirmed that the luminance of the bright environment could be adjusted between 0 and 20 cd/m
2, and that of the dark environment between 0 and 8 cd/m
2. The longitudinal luminance uniformity exceeded 0.6, and the overall uniformity exceeded 0.4, satisfying standard requirements (
Table 1).
According to JTG/T D70/2-01-2014 Specifications for Tunnel Lighting Design, the design luminance for the tunnel’s middle section ranges from 1.0 to 6.5 cd/m2. Considering the tunnel’s actual lighting power levels, the test extended the dark-environment luminance range to 0.5–7.5 cd/m2.
3.1.2. Experimental Scheme
By fixing the dark-environment luminance and systematically adjusting the bright-environment luminance, a pilot test was conducted to determine an appropriate luminance difference resolution. The results indicated that when the luminance difference between the bright and dark environments was below 1 cd/m2, variations in drivers’ brightness perception and sign recognition distance were unstable, whereas a luminance difference of ≥1 cd/m2 produced stable and distinguishable perceptual differences. Larger luminance steps did not alter the overall trends but reduced the resolution of luminance variation. Therefore, 1 cd/m2 was selected as the luminance step for subsequent experiments.
Taking into account the luminance range of the dark environment, the gradient of luminance differences, and the available lighting power of the tunnel lamps, the bright-environment luminance was varied between 1.5 and 19.5 cd/m
2, as summarized in
Table 2.
3.1.3. Experimental Guide Sign
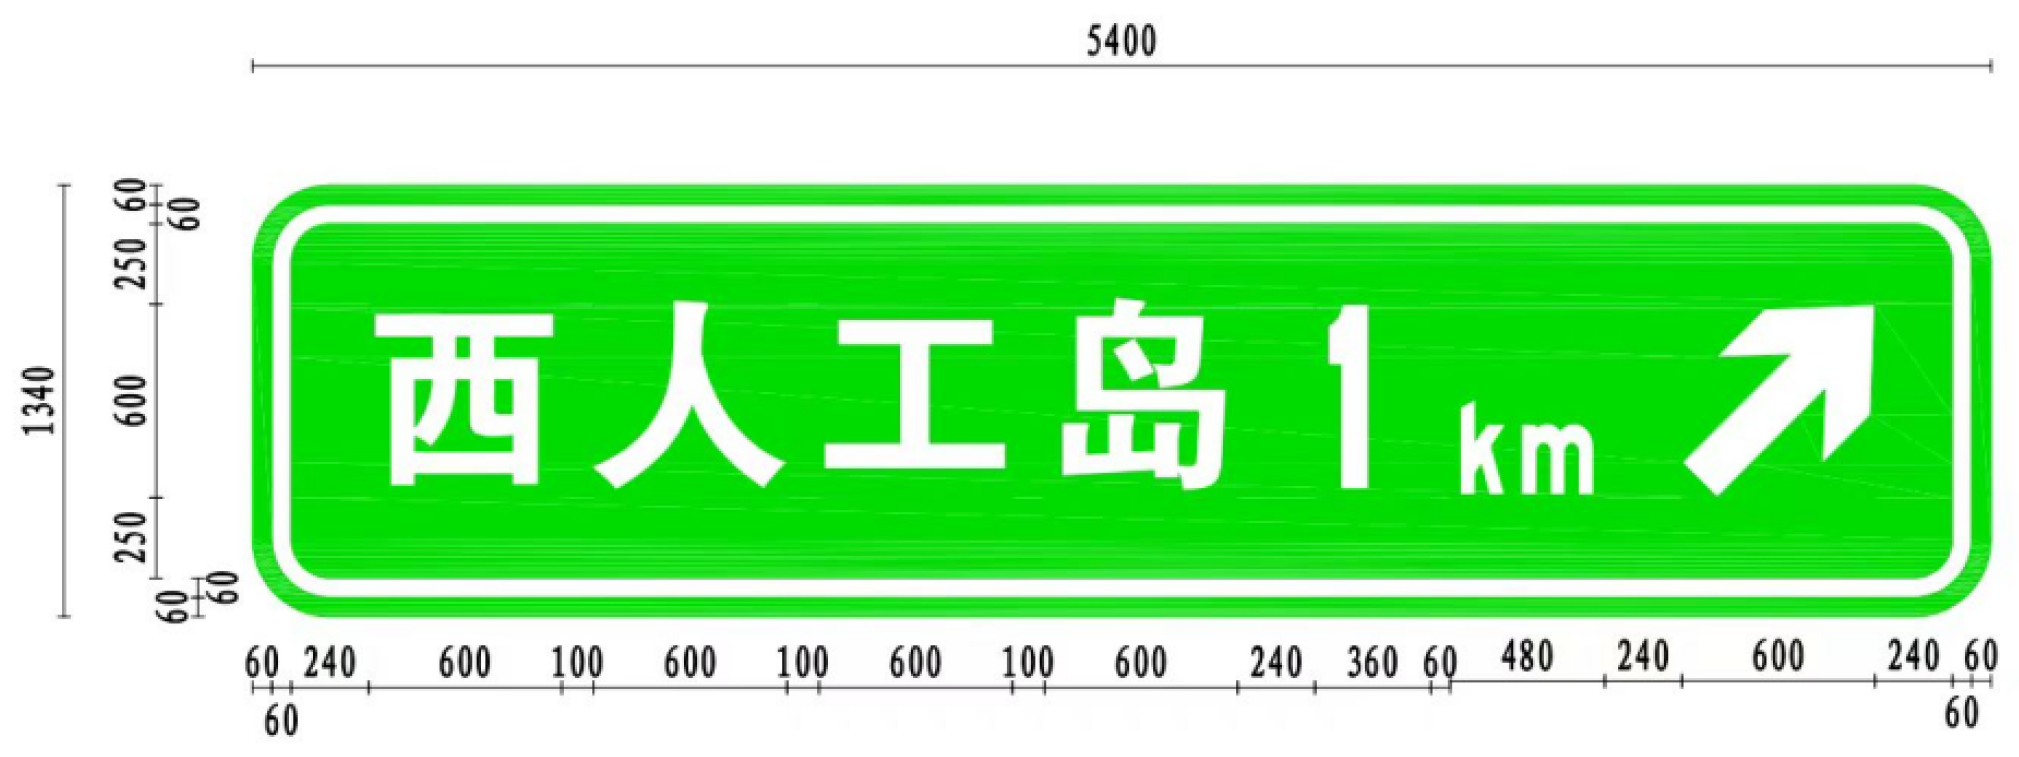
A retroreflective advance guide sign located in the diverging area of an underwater tunnel was selected as the test target. The lower edge of the sign was 5 m above the road surface, with a panel height of 1.34 m. The text on the sign was white with a character height of 60 cm. The layout of the retroreflective guide sign is shown in
Figure 5.
Using Equations (1)–(3), the minimum safe recognition distances (
Smin) corresponding to different design speeds were calculated, as presented in
Table 3. To ensure safe recognition, the measured recognition distance (
S) should exceed
Smin. The subsequent analysis compares the experimentally measured recognition distances with the theoretical minimum safe distances to determine whether the driver’s visibility requirements are met. Furthermore, threshold values of bright-environment luminance satisfying safe visual recognition under various dark-environment luminance levels are proposed.
3.2. Tested Vehicle and Drivers
Although factors such as vehicle types, population distribution, and driver height vary across countries, leading to significant differences in driver eye height, the driver eye height for compact cars is generally similar across regions such as the United States, Europe, and Asia, typically ranging from 1.0 to 1.2 m. Given that passenger car drivers have a lower eye height and thus a shorter line of sight, passenger cars were selected as the tested vehicles according to the principle of the most unfavorable condition. In this experiment, the Volkswagen Lavida, the most widely used and representative compact car in the current Chinese market, was selected. The headlights of the test vehicles used LED light sources, consistent with the dominant type of vehicle headlights in the current market. Before the experiment, the illumination of the test vehicle headlights was measured using a CL500-A spectroradiometer (Konica Minolta (China) Investment LTD. SE Sales Division, Beijing, China) at a distance of 25 m in accordance with the GB 4599-2024 Automotive Road Lighting Devices and Systems standard [
27]. All measured values met the standard requirements.
The sample size of test participants is a key factor in ensuring the reliability of experimental data. Too few participants would reduce the credibility of the results, while an excessive number would lead to unnecessary resource consumption. The required number of participants can be estimated using Equation (4):
where
Q is the sample size;
Z is the standard normal deviate;
σ is the standard deviation, and
E is the maximum allowable error. Generally, a significance level of 10% and a confidence level of 90% are reasonable, giving
Z = 1.25; Referring to prior studies [
28],
σ ranges between 0.25 and 0.5. Considering the difficulty of recruiting test drivers for the on-road driving experiments and ensuring that the experimental data remains within a reasonable fluctuation range, this study adopted parameters of
σ = 0.3 and
E = 10%. The sample size calculated based on these parameters effectively reflects the variability between actual lighting environment scenarios, while avoiding excessive dispersion or instability in the data. The final calculation indicates that the minimum sample size should be 14 participants.
According to visual physiology, drivers’ recognition performance is significantly influenced by factors such as age, gender, and visual acuity. To ensure authenticity, reliability, and validity, participants were classified according to these attributes. The selection criteria for drivers were as follows:
- (1)
A total of 24 healthy passenger car drivers (14 males and 10 females), each with more than five years of driving experience and aged between 20 and 50 years (see
Table 4).
- (2)
All drivers had naked-eye or corrected vision (with glasses) of 4.9 or better, and none had color blindness, color weakness, or other visual disorders.
- (3)
One week prior to the experiment, participants were informed to adjust their rest schedules according to the testing period to maintain normal alertness and reaction ability. During the test, participants were strictly prohibited from consuming alcohol or taking medications that might impair alertness.
Table 4.
Demographic information of test drivers.
Table 4.
Demographic information of test drivers.
| Gender | Age Range | Number of Participants |
|---|
| Male | 20~30 | 8 |
| 30~50 | 6 |
| Female | 20~30 | 6 |
| 30~50 | 4 |
3.3. Measurement Equipment
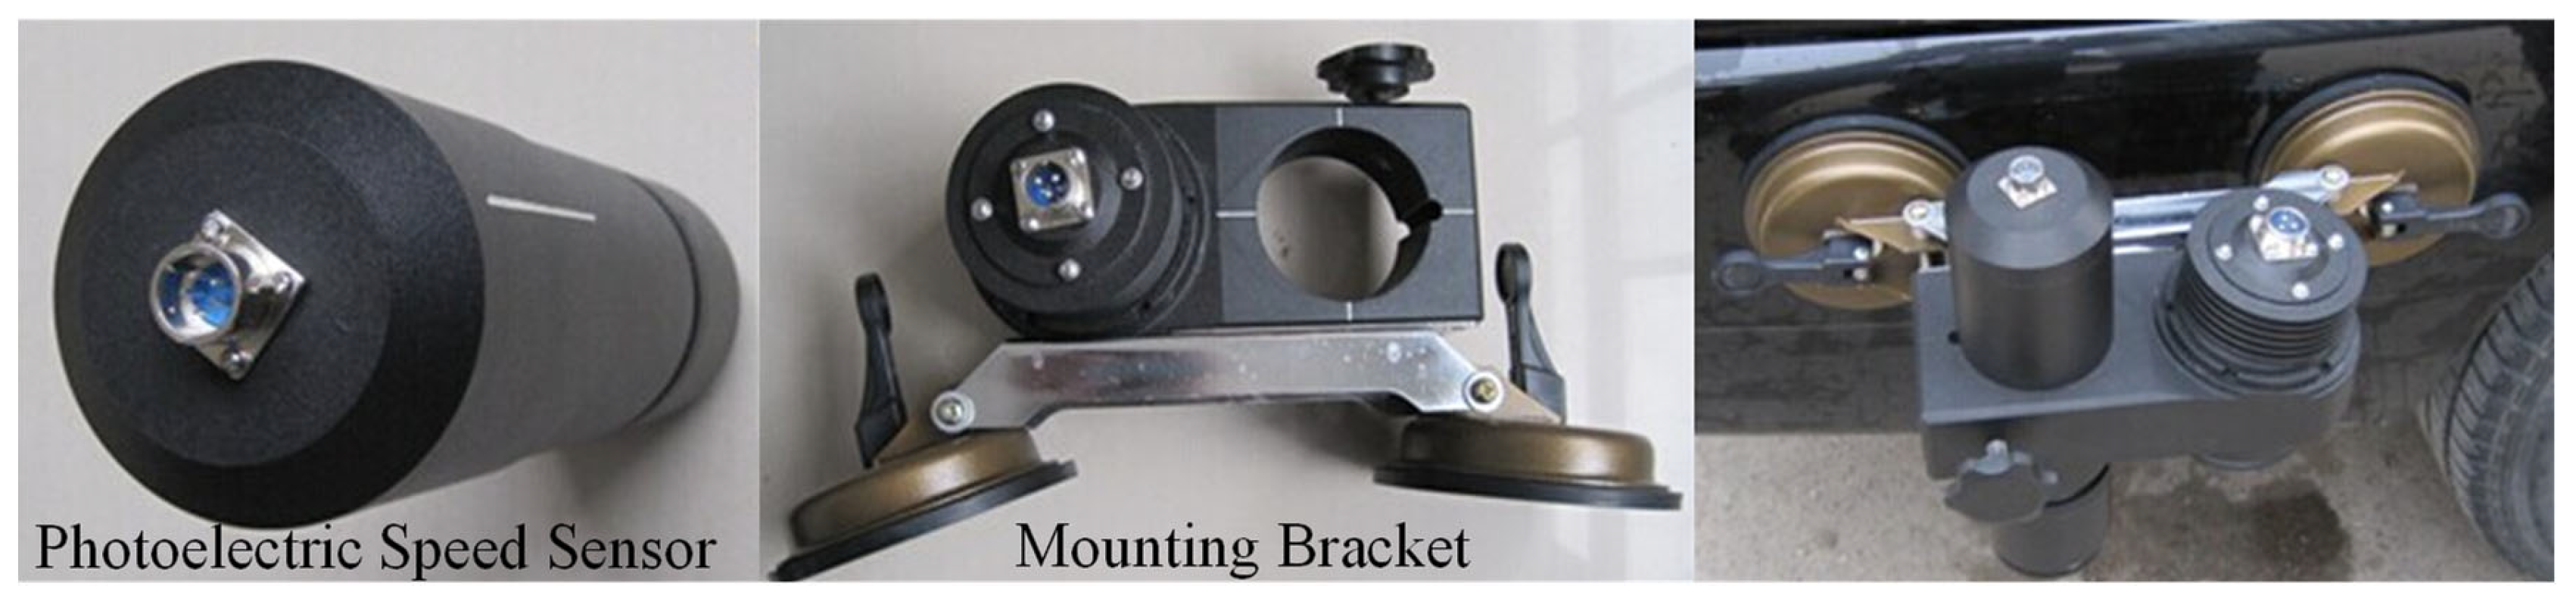
In this experiment, a non-contact speedometer (brand SAGE, model CTM-8C, as shown in
Figure 6), manufactured by ZiBo SAGE Electronic Co., Ltd., Zibo, China, was used to measure the tested driver’s recognition distance to the sign. The instrument utilizes laser-based speed measurement technology, enabling it to operate effectively in enclosed environments, such as tunnels, without relying on satellite signals. It offers high-precision functions for speed measurement, marking, and distance calculation. The device has a speed measurement range from 0.5 to 250 km/h, with a resolution of 0.1 km/h and an accuracy of 0.5%. The distance measurement resolution is 1 mm, with an accuracy of 0.2%.
The visibility distance measurement procedure is as follows. When the tested driver observes the sign and reaches the required recognition threshold, the marking device connected to the speedometer is activated, recording the first time point (i.e., the recognition moment). Subsequently, when the tested driver passes directly beneath the sign, the assisting personnel activate the marking device again, recording the second time point. By analyzing the speed and time data between these two time points, the recognition distance to the road sign can be calculated.
In this experiment, a marking pole with a level was used to precisely measure the driver’s eye height. First, the pole was placed vertically on the ground, and a level was used to ensure that the pole remained perfectly vertical. Then, by adjusting the test vehicle’s seat, the driver’s eye position was aligned with the top of the pole, ensuring that the eye height was consistently set at 1.2 m.
3.4. Experimental Procedure
Before the experiment, a non-contact speedometer was installed on the test vehicle. The test drivers received training to ensure familiarity with the experimental procedure and consistency in the application of the qualitative recognition level scale, as shown in
Table 5. The experiment proceeded as follows:
- (1)
Adjust the luminance levels of the dark and bright environments according to
Table 1.
- (2)
The driver began driving from a position far enough from the guide sign, accelerated to a comfortable constant speed, and continued driving. When the driver first recognized the guide sign at Level II visibility, they immediately notified the onboard observer. The observer then used the speedometer to mark a timing point. When the vehicle passed the guide sign, another timing point was recorded. The recognition distance was calculated from these two points after the test.
- (3)
Replace the driver and repeat steps (1)–(2) until all 24 participants completed the tests under each lighting condition.
- (4)
The luminance of the bright and dark zones was adjusted by controlling the circuit power of the LED lighting system. Because the human eye adapts to light levels, small luminance variations can lead to insignificant perceptual differences. Therefore, the lighting conditions listed in
Table 2 were randomly arranged, and Steps (1)–(3) were repeated until all lighting environment conditions in
Table 1 were completed, after which the experiment was completed.
Table 5.
Qualitative scale for recognition levels.
Table 5.
Qualitative scale for recognition levels.
| Recognition Level | Visibility | Description | Meets Requirement? |
|---|
| Level I | Clear | The text is perfectly clear and sharp, with every character easily and accurately recognizable, without any visual obstruction. | YES |
| Level II | Fairly clear, slightly blurred | The text is generally clear but contains minor blurry areas. With careful observation, the content can still be correctly recognized. | YES |
| Level III | Blurred | The text appears obviously fuzzy, with indistinct contours and severe loss of detail, making the content unrecognizable. | NO |
4. Results and Analysis
In this experiment, a “bright–dark” uneven lighting environment was created using 8 different levels of dark environment brightness and 19 levels of bright environment brightness, resulting in a total of 1976 sets of recognition distance data. Scatter plots of recognition distances for each lighting scenario were generated to identify obvious outliers, and these data were further verified by reviewing corresponding video data playback. The results indicated that the outliers were primarily caused by interference from on-site mechanical and electrical construction and the headlights of oncoming vehicles. After excluding these outliers, 1486 sets of valid recognition distance data remained. Given that all participants had more than 5 years of driving experience, age was not considered a factor influencing the experimental data. Since the data followed a normal distribution and the variances between groups were relatively balanced, an independent samples t-test was employed to analyze the gender differences in recognition distance for each scenario. The test results showed that the p-values for both the male and female groups were greater than 0.05, suggesting that gender did not significantly affect the experimental outcomes. Therefore, the data from both male and female groups were combined to increase the sample size and enhance the statistical power of the analysis.
4.1. Effect of Brightness Difference on Recognition Distance
In a non-uniform tunnel lighting environment, the driver’s field of view simultaneously contains bright and dark zones. The luminance difference (Δ
X) effectively represents this non-uniformity, as calculated in Equation (5):
where the luminance difference Δ
X ∈ [1, 19] cd/m
2,
X1 is the bright-environment luminance (1.5–19.5 cd/m
2), and
X2 is the dark-environment luminance (0.5–7.5 cd/m
2).
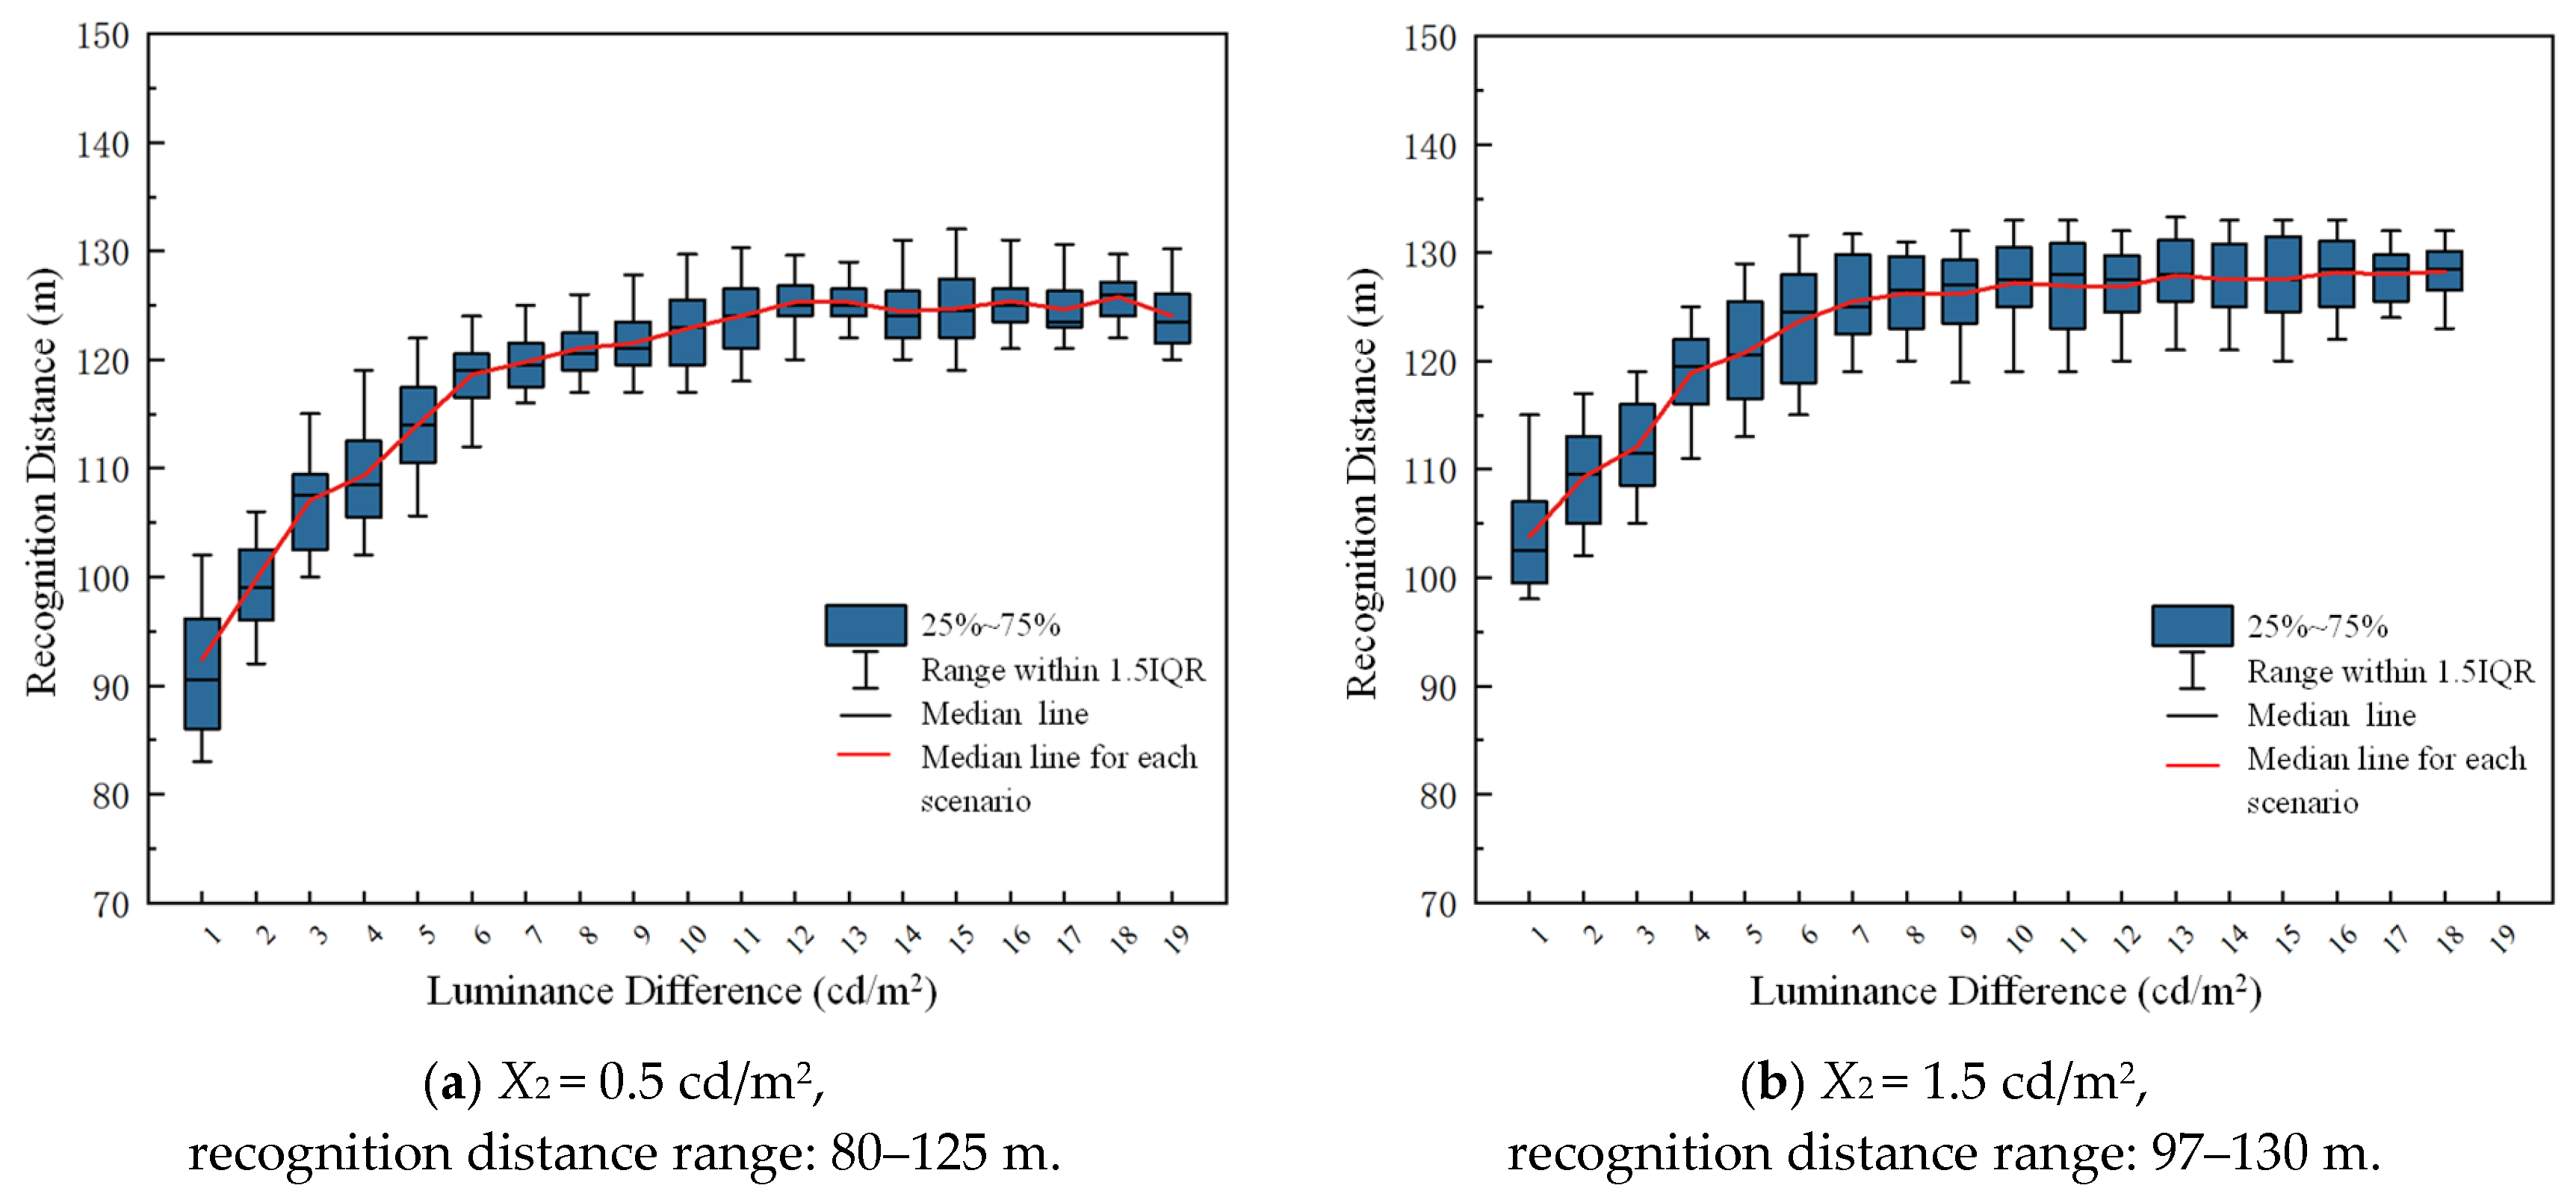
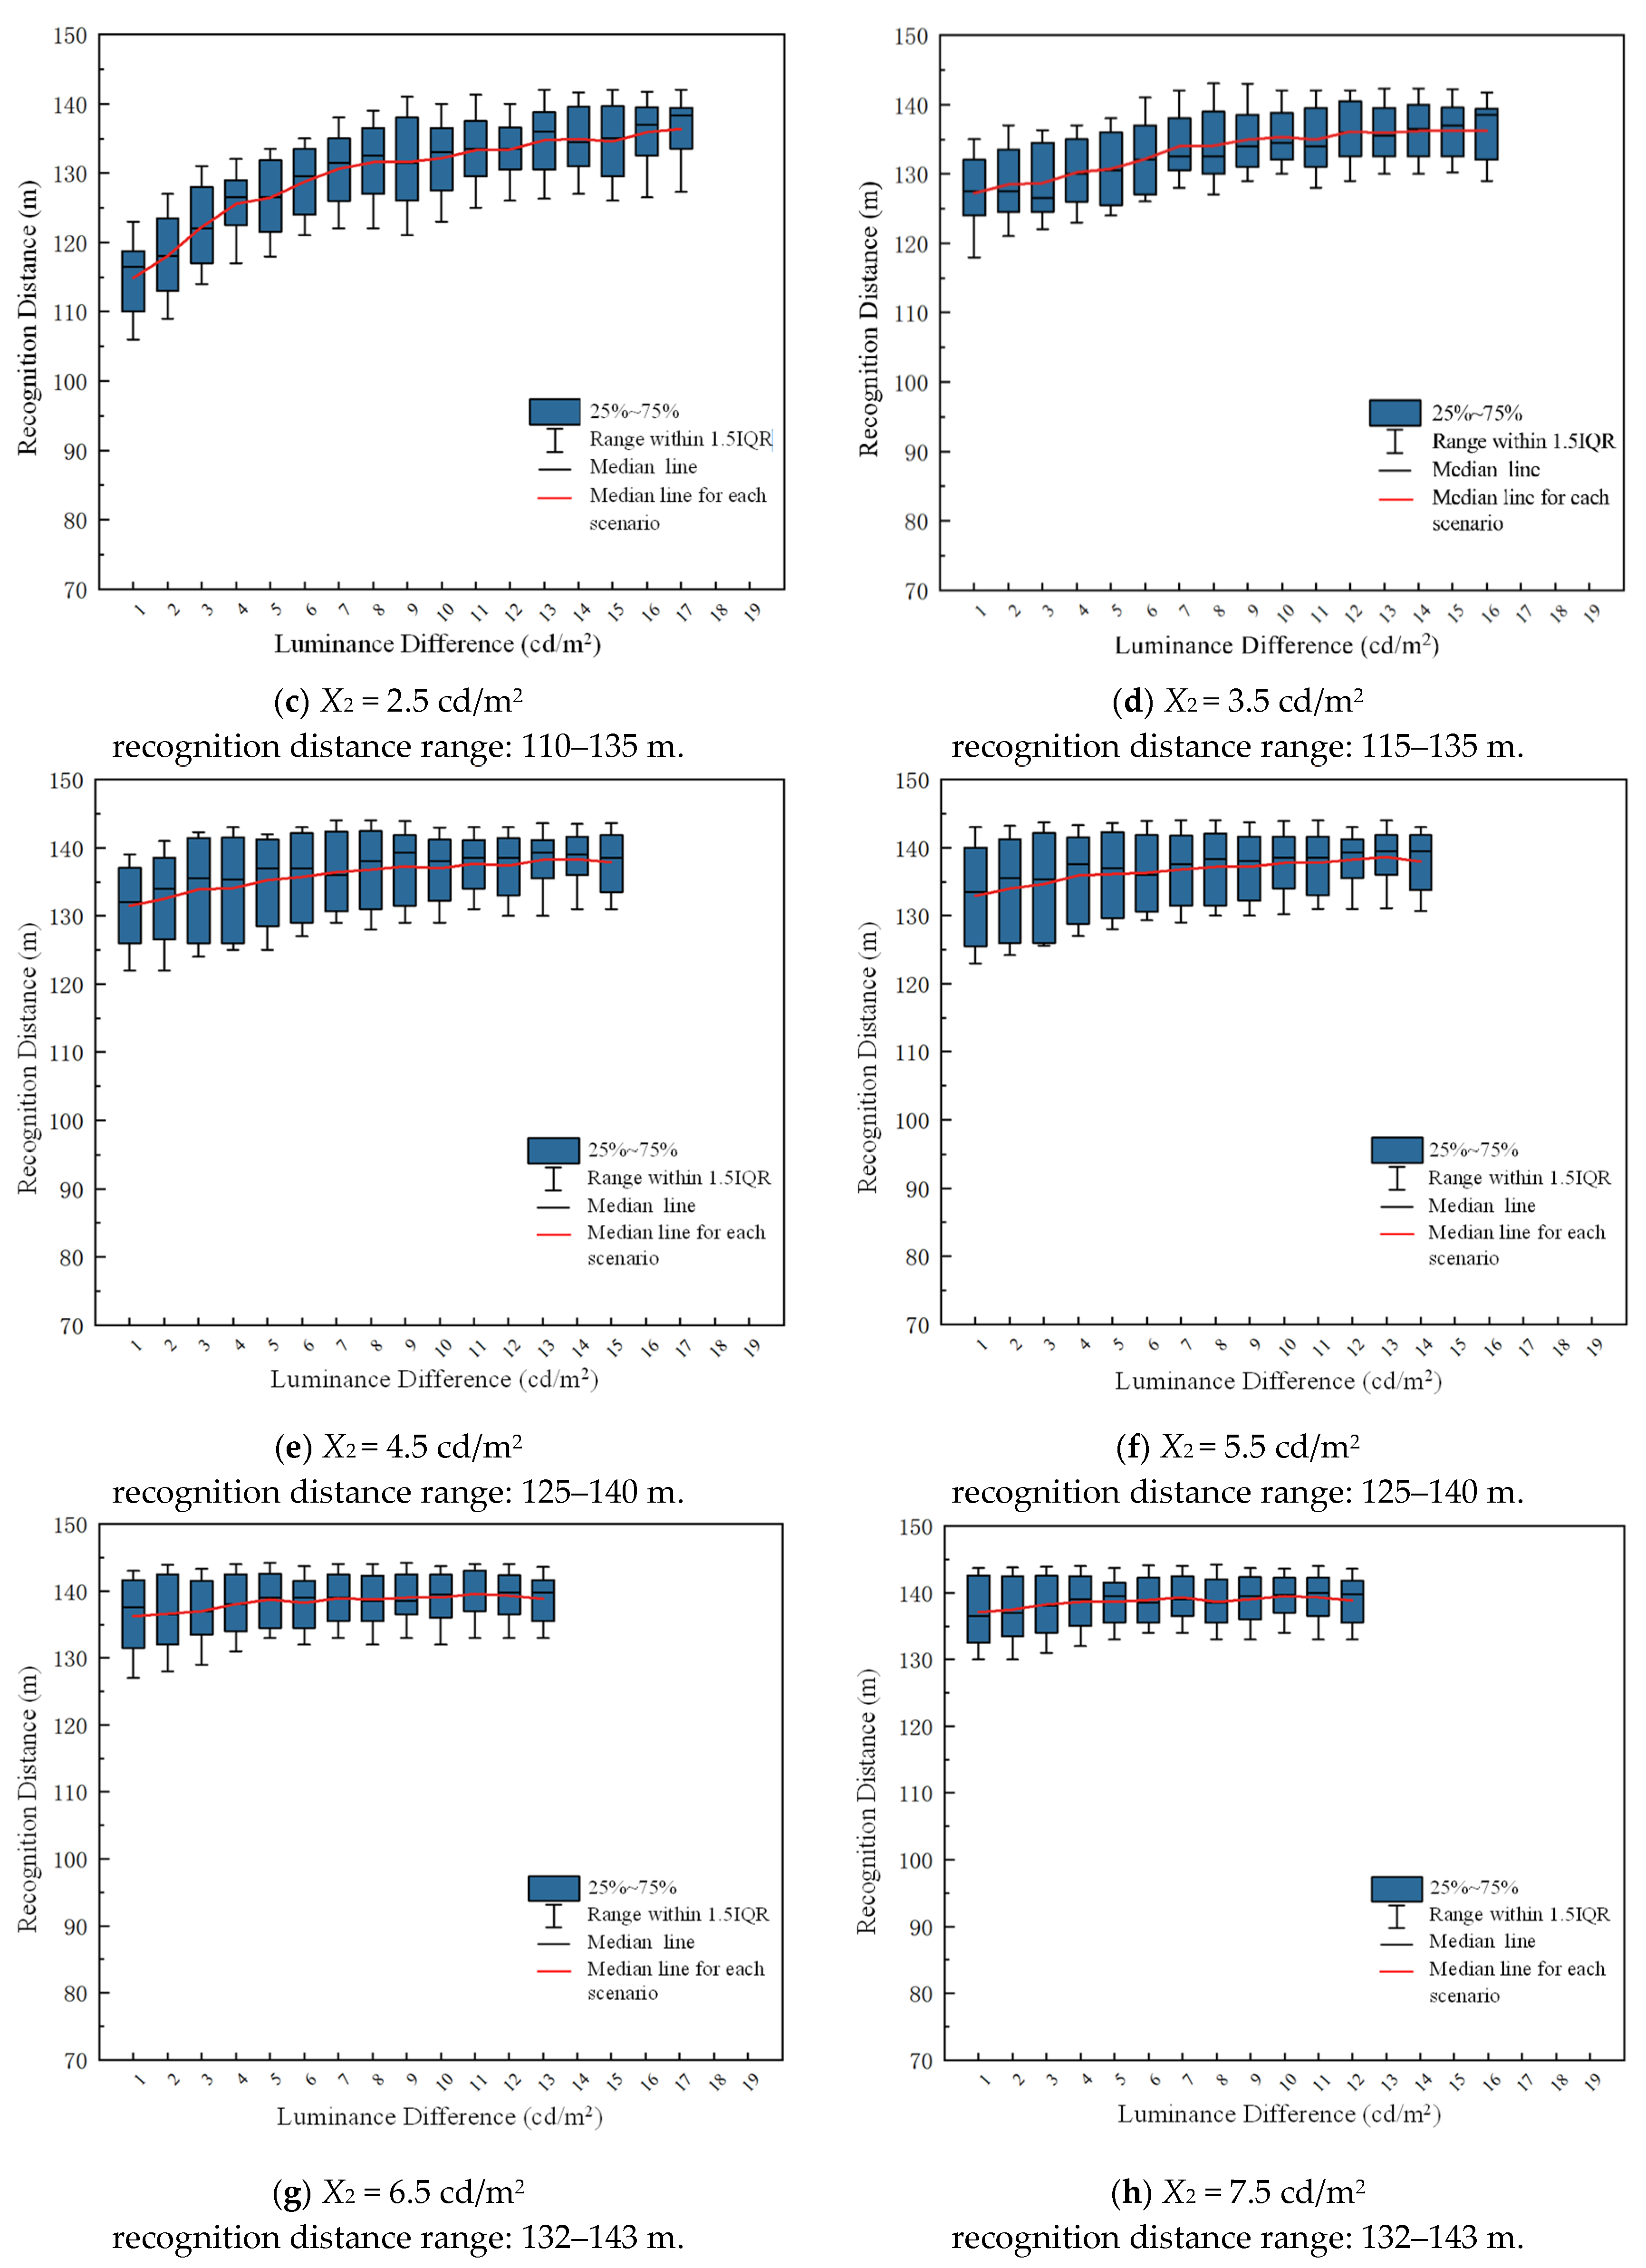
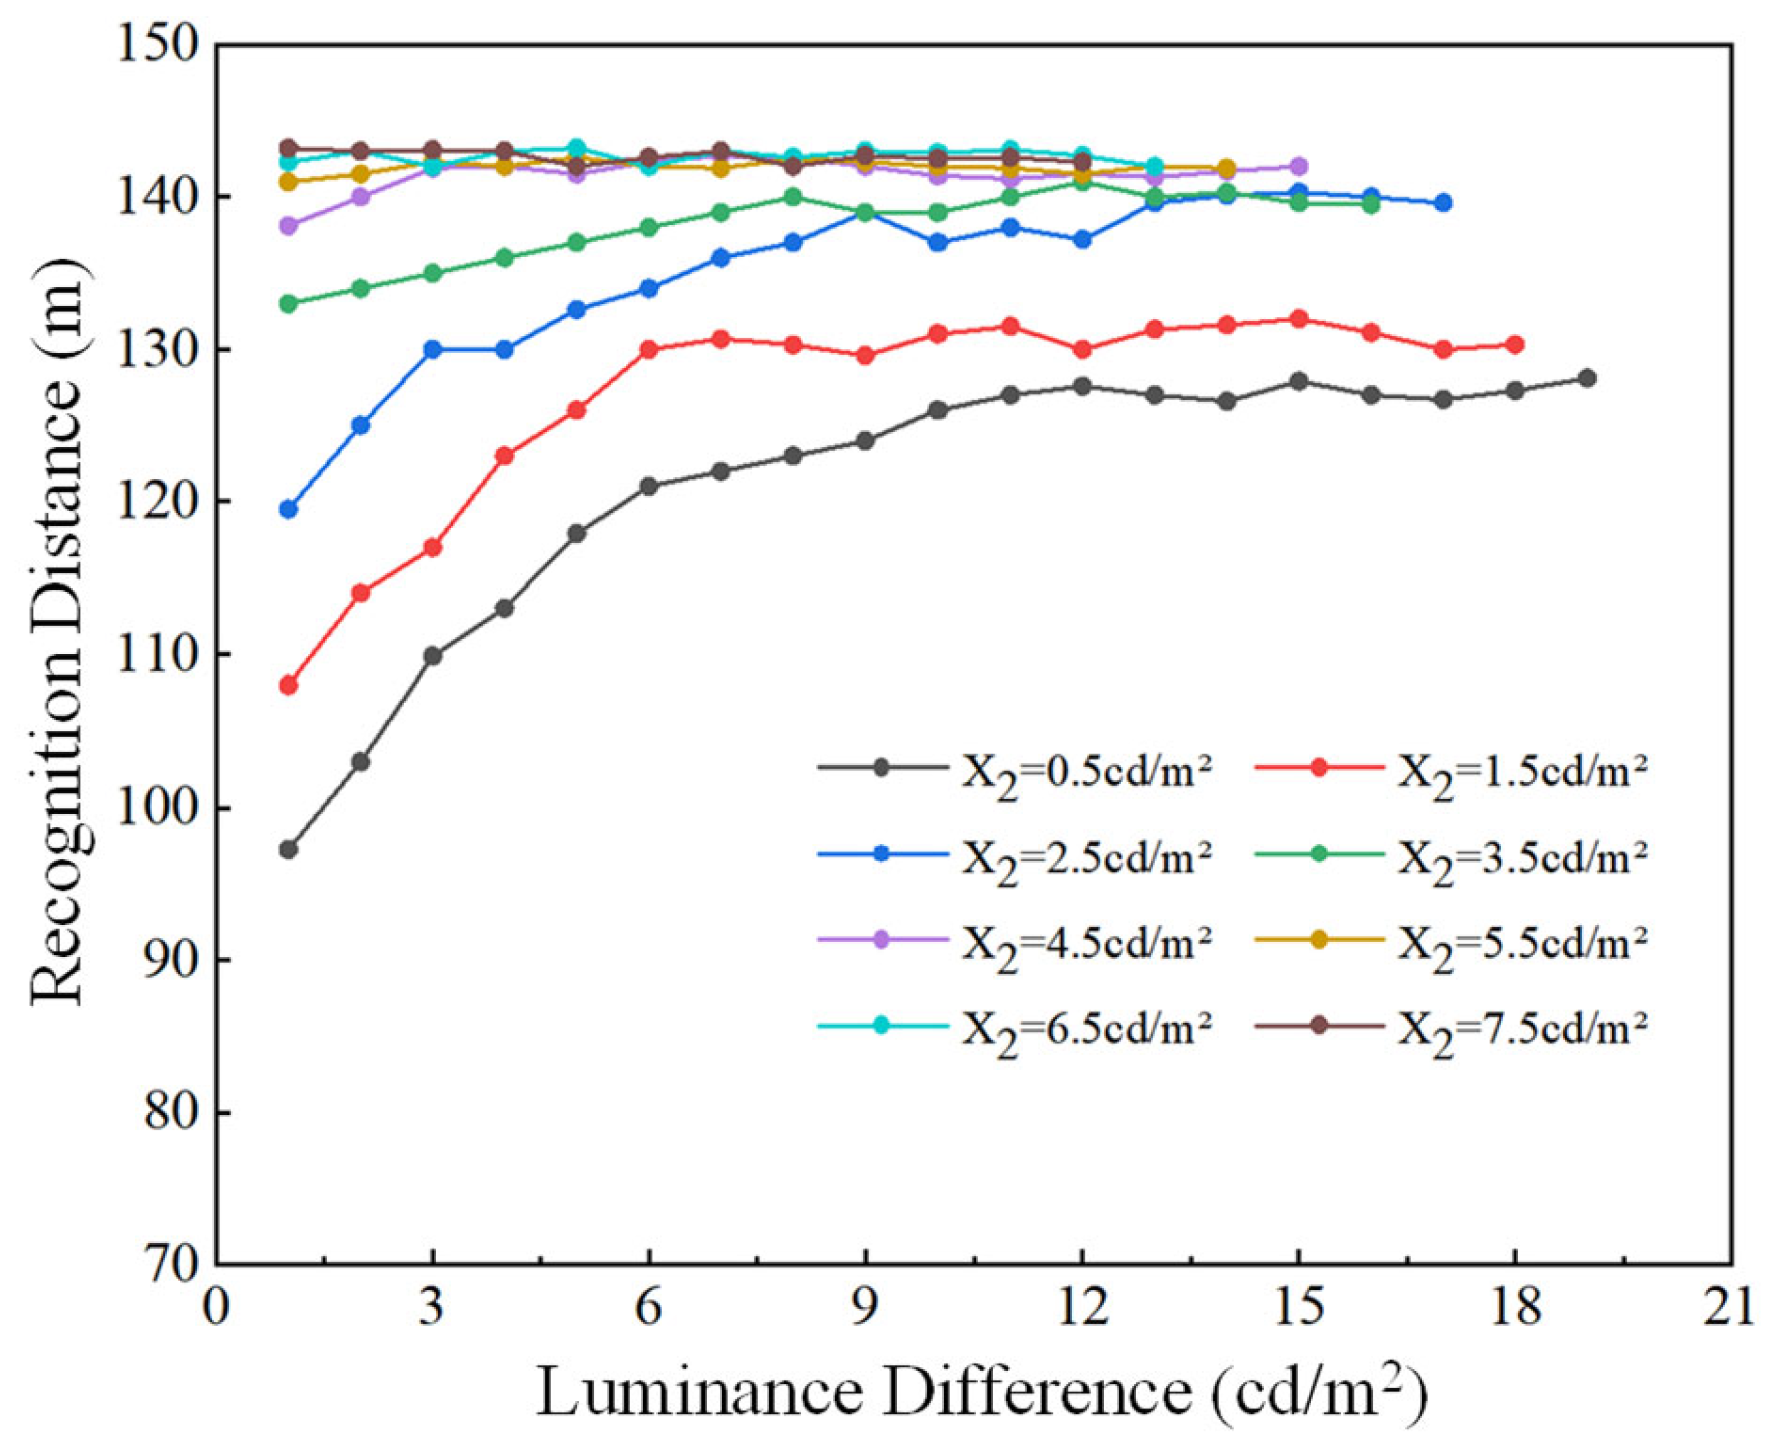
The luminance difference was selected as the analysis metric to investigate the effects of various lighting conditions on drivers’ recognition distances, as illustrated in
Figure 7.
- (1)
For all dark-environment luminance levels, recognition distance increases with luminance difference, especially when the difference is small.
- (2)
As the luminance difference becomes large, the improvement in recognition distance plateaus, indicating diminishing returns.
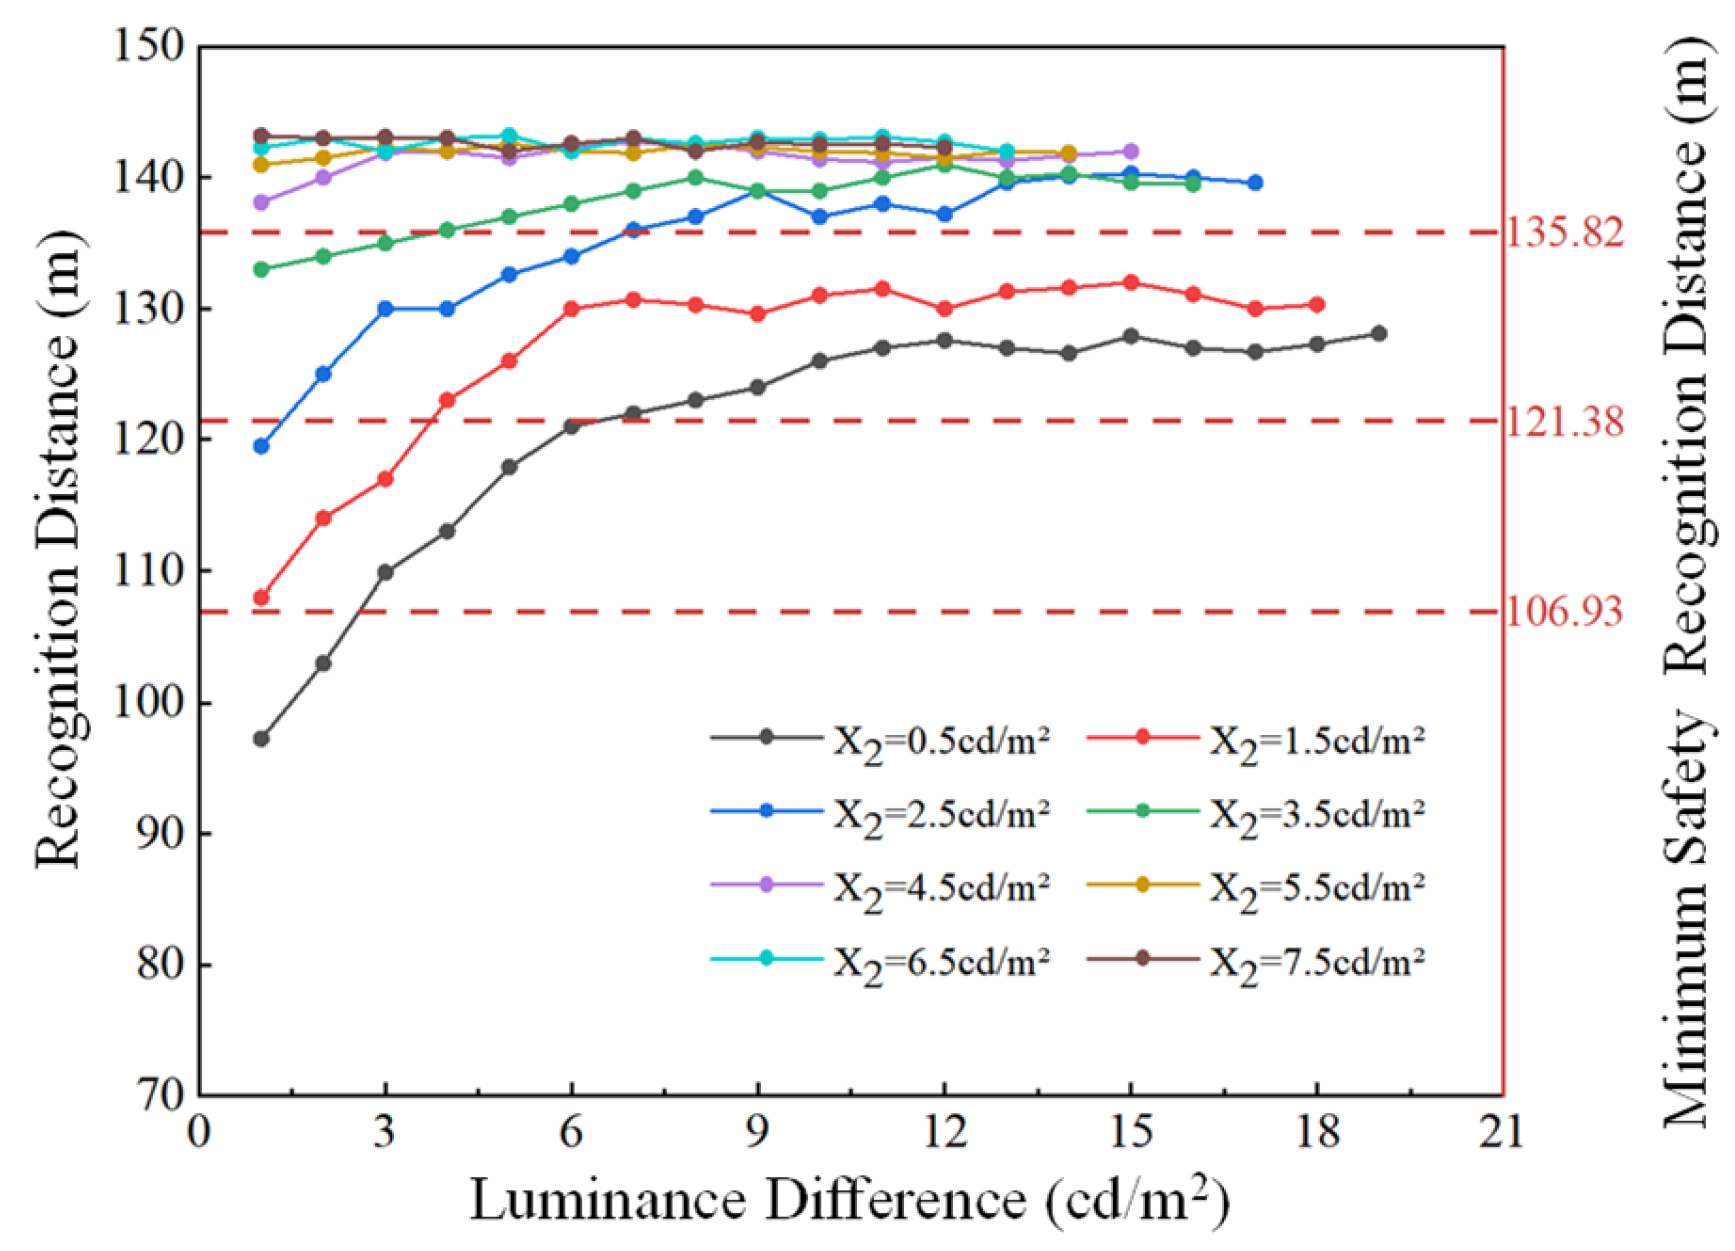
Further, to account for inter-driver variability, the commonly used 85th percentile in traffic engineering was selected as the effective recognition distance, yielding 124 valid combinations (
Figure 8). As dark-environment luminance increases, recognition distance grows and gradually stabilizes. When the dark luminance exceeds 3.5 cd/m
2, the effect of luminance difference becomes negligible; below this threshold, increasing Δ
X significantly enhances recognition distance.
4.2. Determination of Bright-Environment Luminance Threshold
Based on the above analysis, it can be concluded that both dark-environment luminance and the luminance difference between bright and dark environments jointly influence the visual recognition distance. To further determine the threshold luminance difference required under different dark-environment luminance conditions, the minimum safety recognition distance calculated in
Table 2 was compared with the effective recognition distance (
Figure 9).
The findings are as follows:
- (1)
When dark-environment luminance X2 > 3.5 cd/m2, even uniform lighting satisfies safe visibility needs.
- (2)
When dark-environment luminance X2 < 3.5 cd/m2, the driver’s recognition distance may fall below the safety threshold, posing a potential visibility risk.
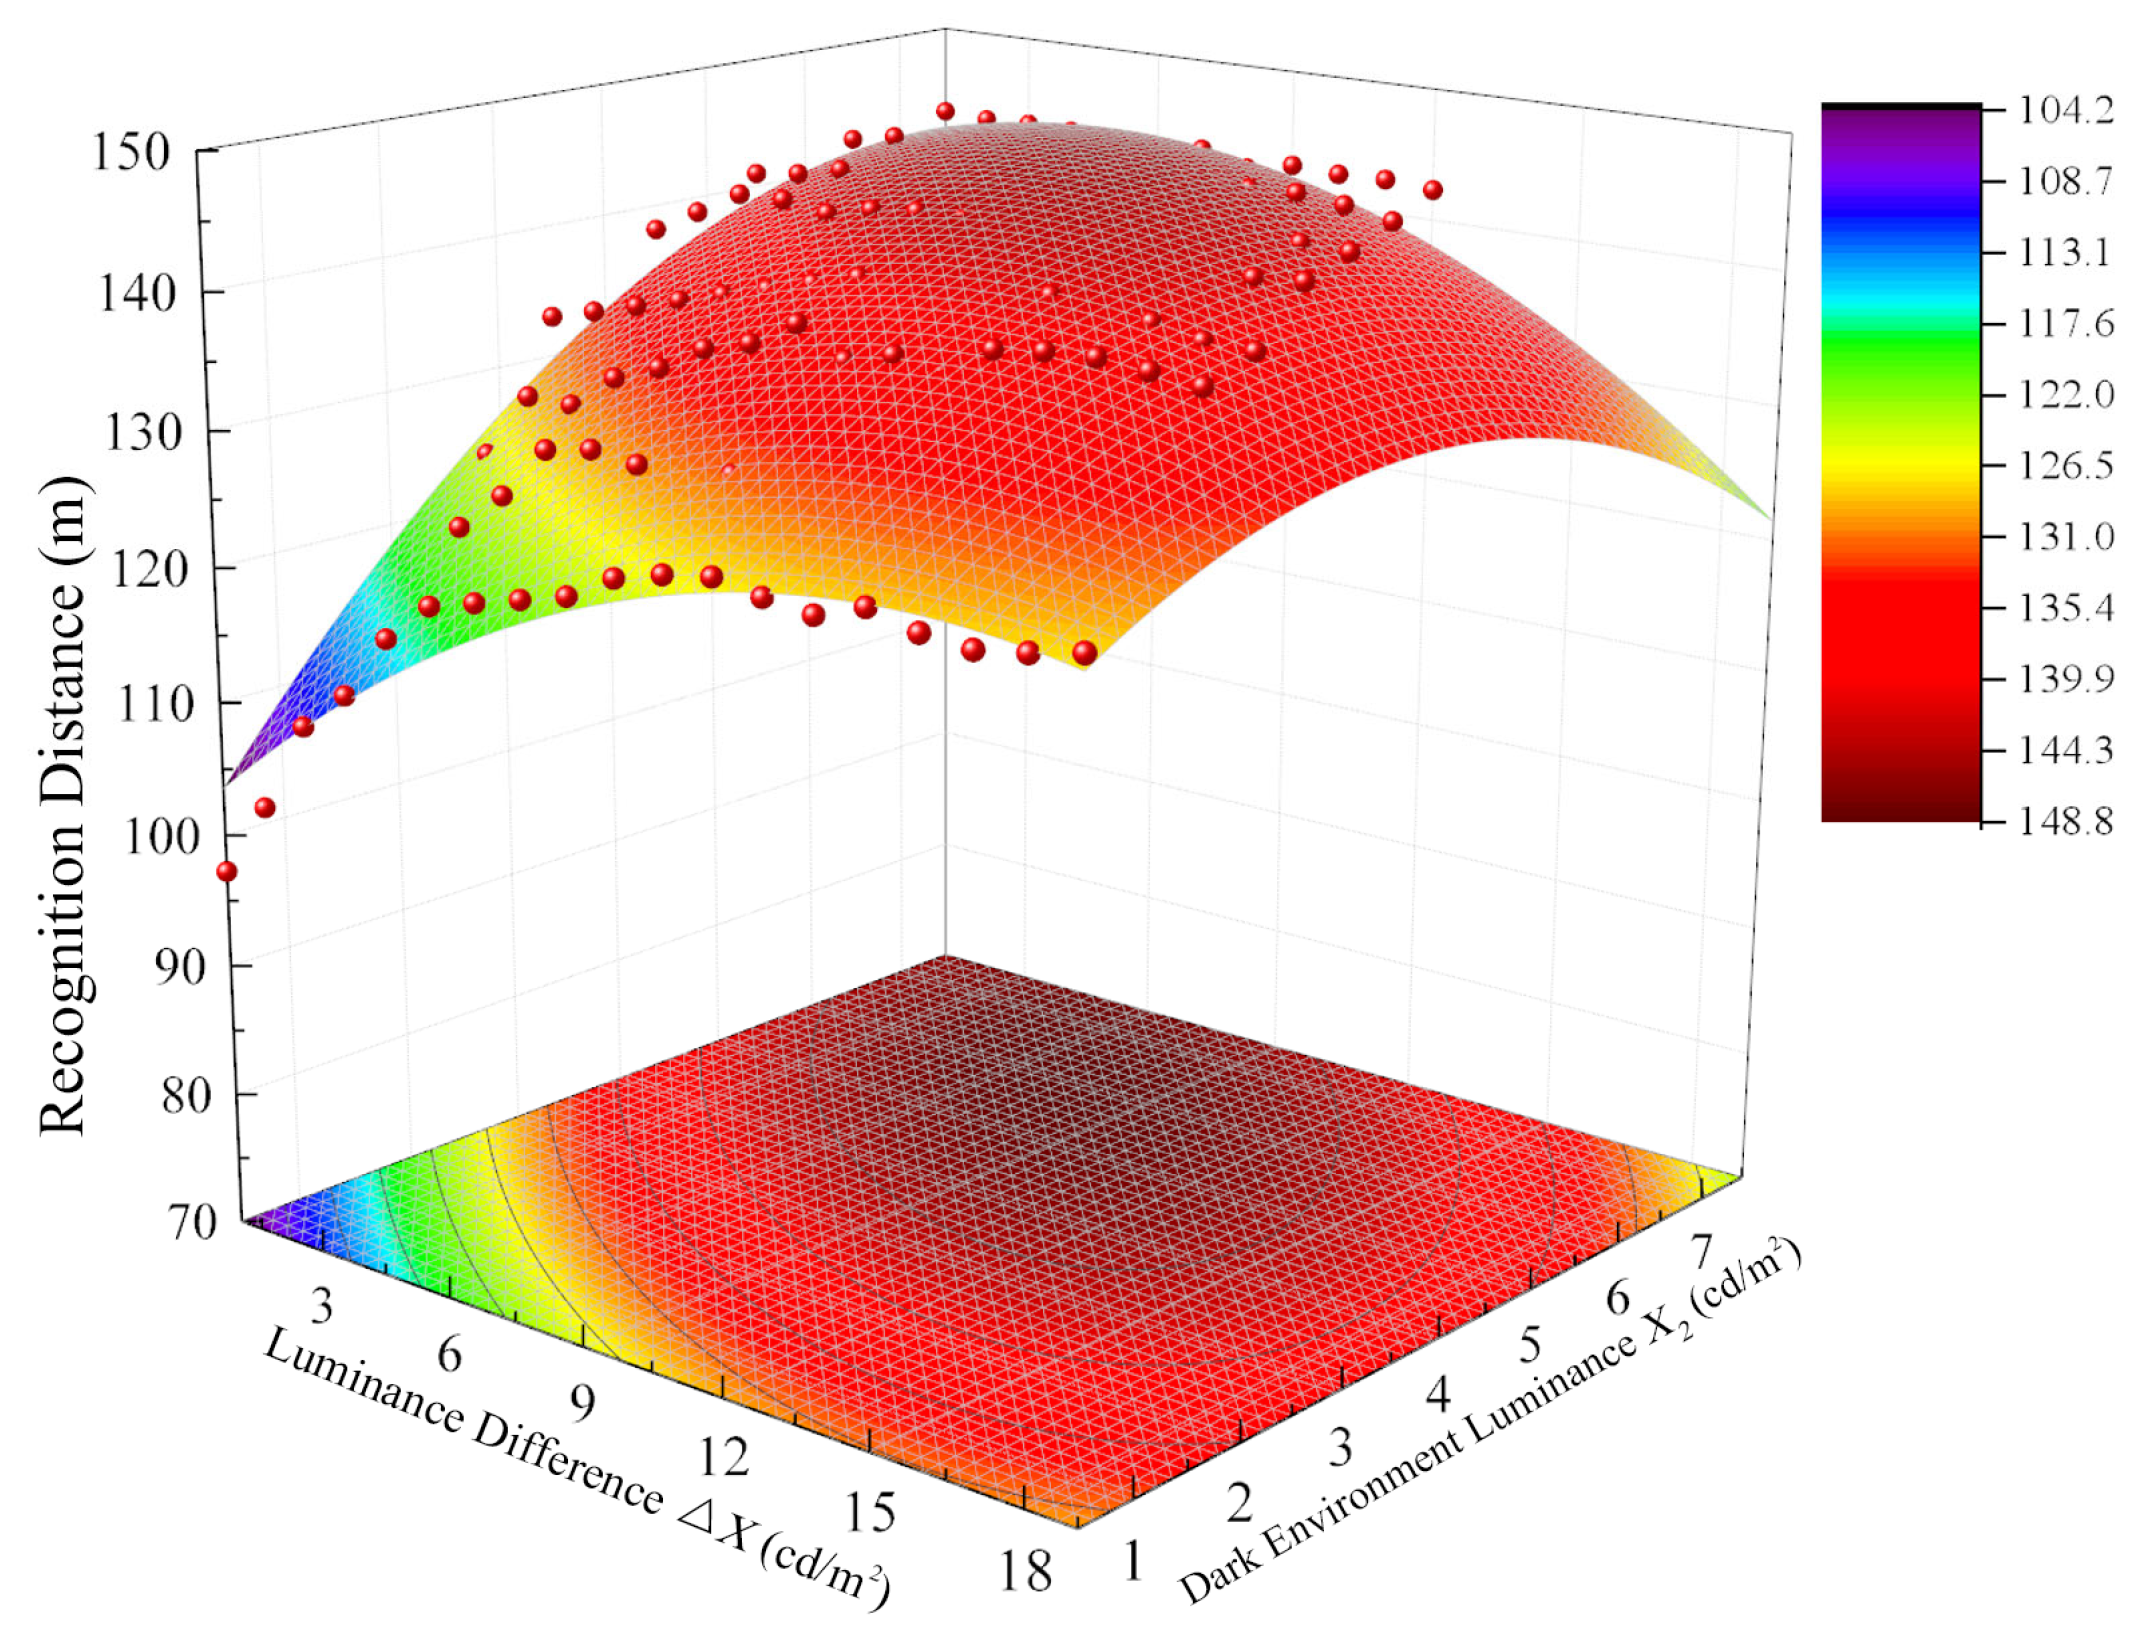
To objectively analyze the effects of luminance difference and dark-environment luminance on recognition distance and to quantify the variation pattern of recognition distance, a three-dimensional surface fitting analysis was conducted, and a predictive model was developed. Luminance difference and dark-environment luminance were treated as independent variables, while recognition distance was treated as the dependent variable, resulting in the surface fitting of recognition distance as shown in
Figure 10.
As can be seen from
Figure 7,
Figure 8,
Figure 9 and
Figure 10, there is a non-linear relationship between the recognition distance and the luminance difference as well as the dark-environment luminance. Therefore, a relatively simple quadratic function is chosen for function fitting. The corresponding regression model is presented in Equation (6). Correlation analysis indicated a goodness-of-fit of R
2 = 0.956, demonstrating a strong fitting performance. A two-way ANOVA was performed on the regression results, and the F-test at a significance level of 0.05 showed that the sig. value corresponding to Equation (6) was below the critical threshold, indicating that the regression model effectively represents the relationship between luminance difference, dark-environment luminance, and recognition distance. The skewness of the model residuals is −0.15, and the kurtosis is 1.83, indicating that the residual distribution is approximately normal. The standard error of the model is 13.24 m. Among the 124 lighting condition combinations, 92.7% of the absolute errors between the predicted and observed values are less than 10 m.
where
S is the recognition distance (m), Δ
X is the luminance difference (1–19 cd/m
2), and
X2 is the dark-environment luminance (0.5–7.5 cd/m
2).
Before determining the regression coefficients, we assumed a linear relationship between the recognition distance S and the independent variables (brightness difference ΔX and dark environment brightness X2), while also considering the possibility of quadratic terms and interaction effects between the independent variables. Therefore, we chose to use the Ordinary Least Squares method to calculate the regression coefficients, and based on this method, we obtained the regression coefficients for each term in the model.
Using Equations (5) and (6) and the minimum safe recognition distances at various design speeds (60, 80, and 100 km/h), the required bright-environment luminance thresholds were derived (
Table 6).
Results show that the threshold increases with design speed. When dark-environment luminance exceeds 2.5, 3.5, and 4.5 cd/m2 for speeds of 60, 80, and 100 km/h, respectively, uniform lighting suffices. However, when X2 < 2.5 cd/m2, further increasing X1 does not guarantee safe recognition. This indicates that under extremely low dark-environment luminance conditions, improving visual safety cannot be achieved solely by enhancing bright-environment luminance, and priority should instead be given to increasing the dark-environment luminance. Thus, for tunnel sections with design speeds ≥ 100 km/h, the dark-environment luminance should not fall below 2.5 cd/m2.
4.3. Case Study and Evaluation
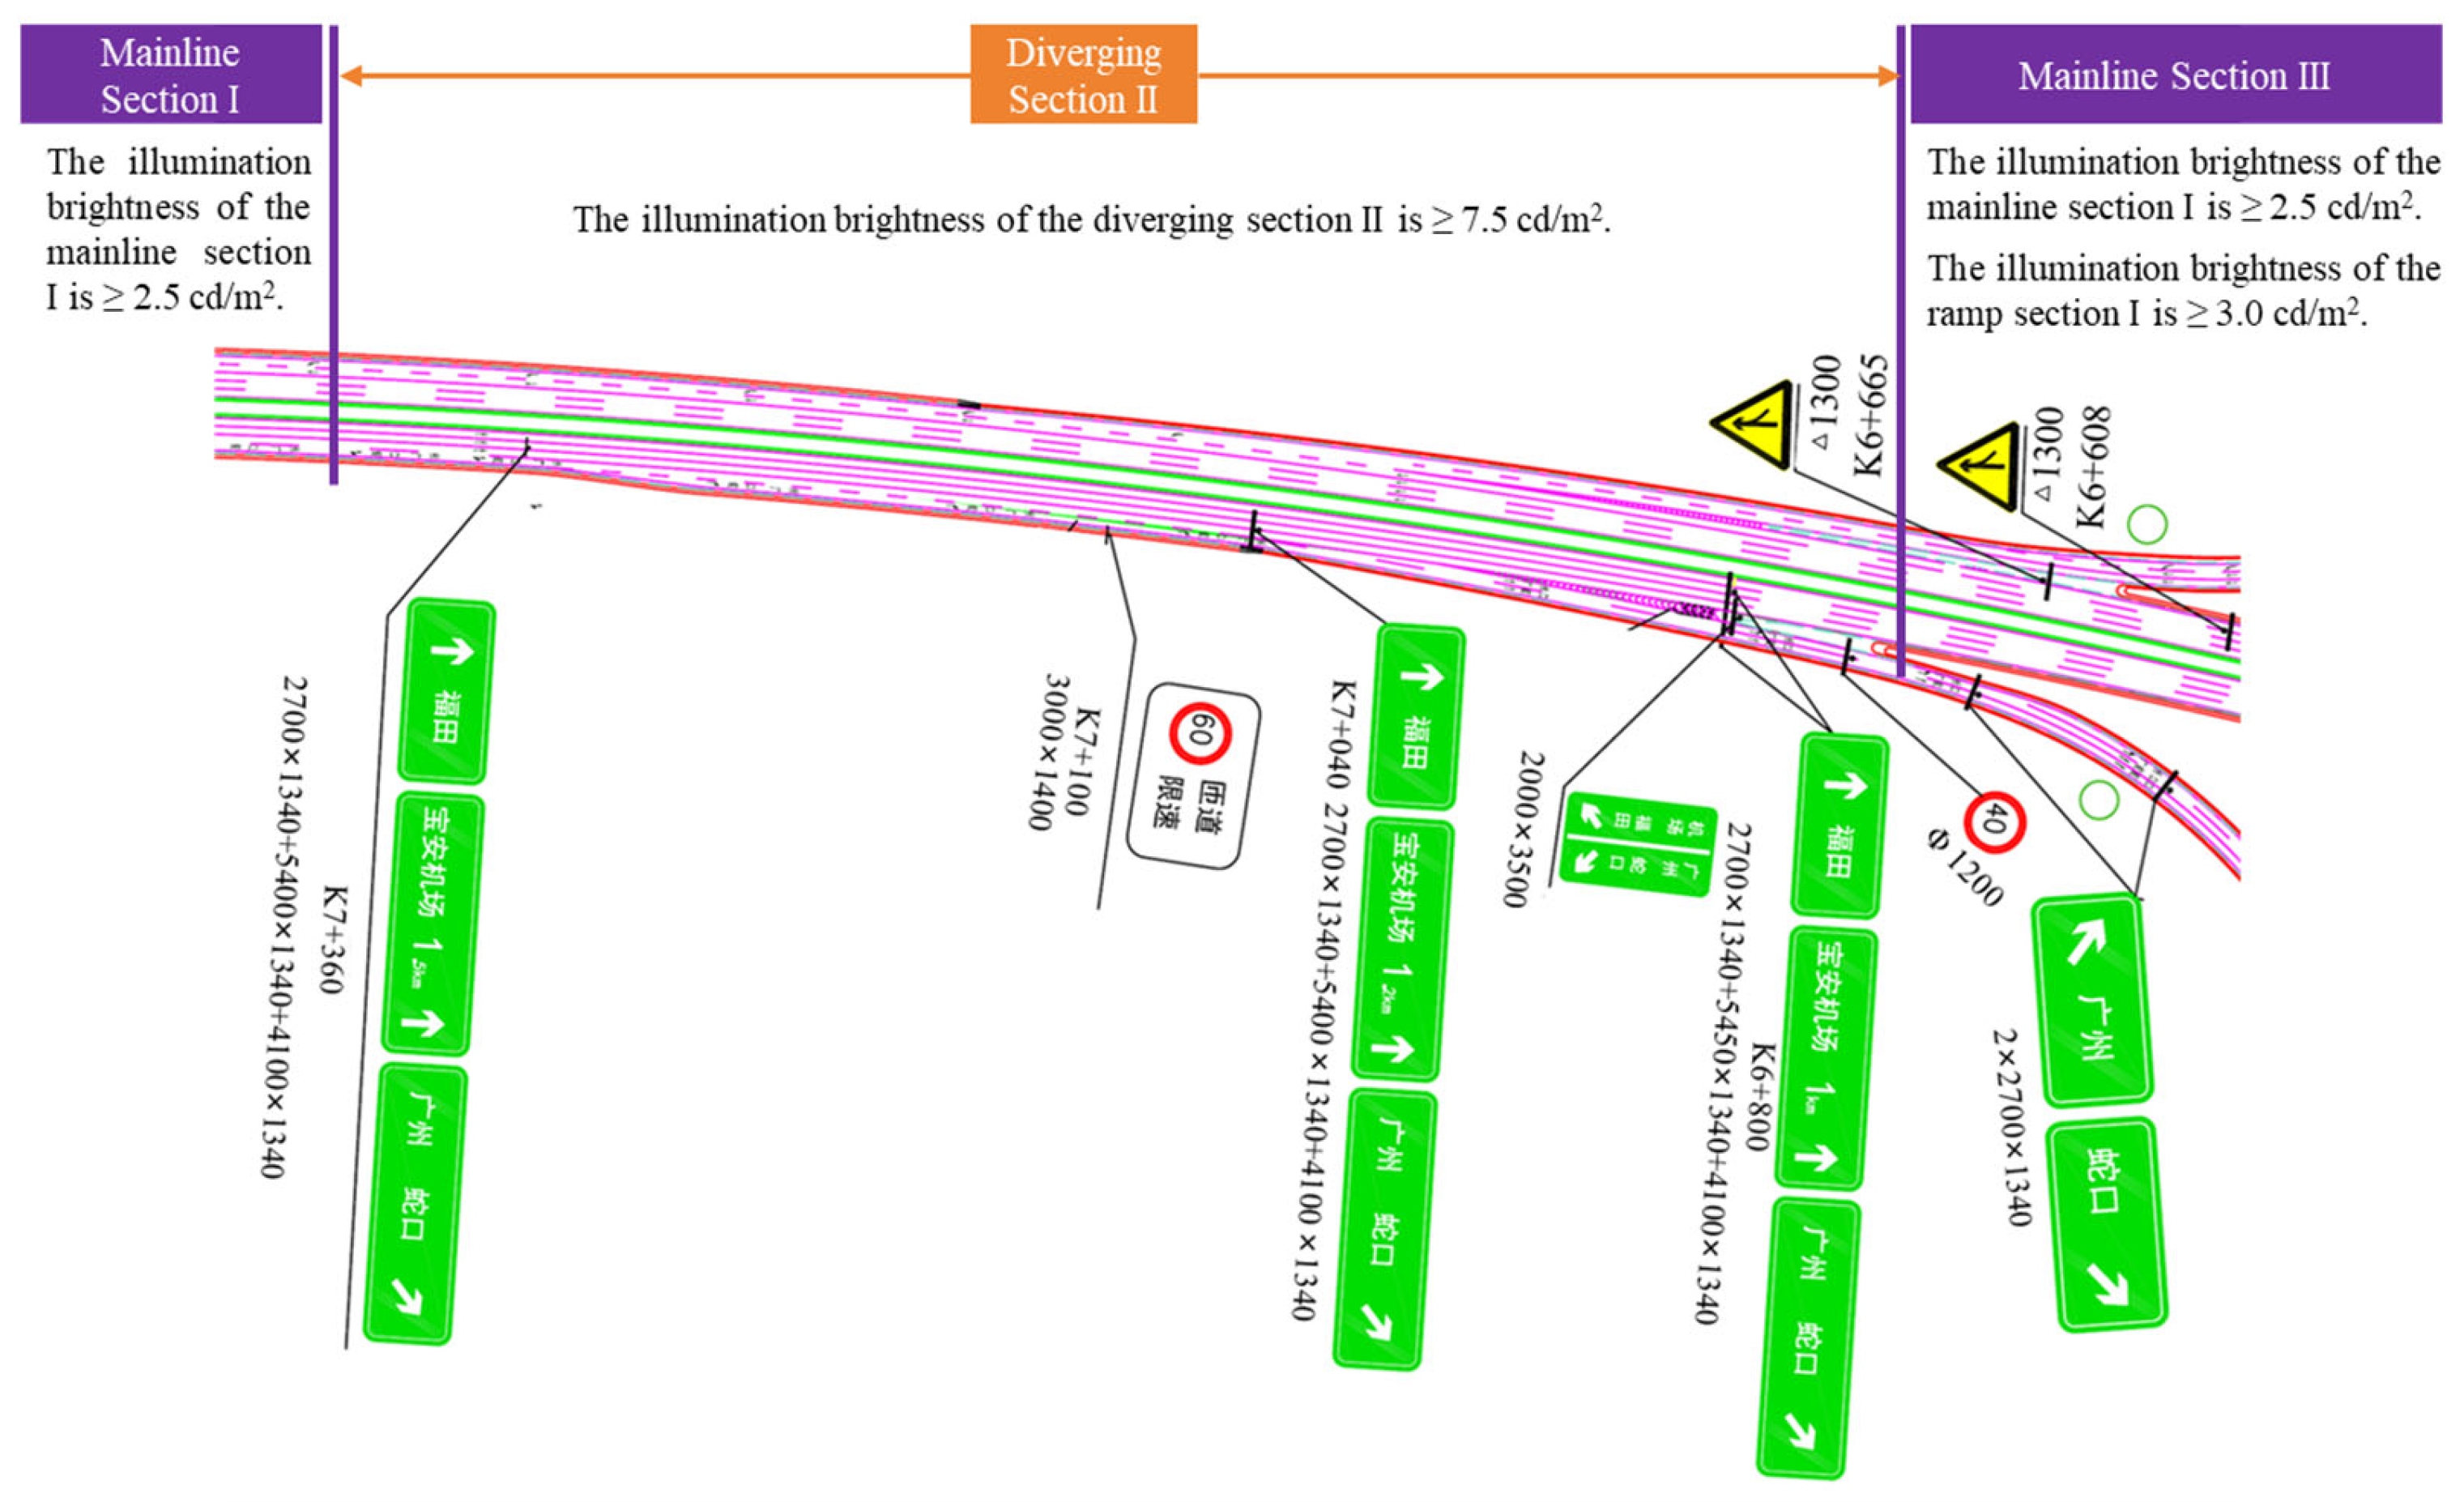
A case analysis was conducted using the underwater tunnel where the experiment was performed (
Figure 11). A safety analysis and evaluation were conducted on the “bright–dark” non-uniform lighting environment in sections of the tunnel diverging area where retroreflective guide signs are installed. The designed traffic volume for the underwater tunnel is 791 vehicles per hour per lane [veh/(h·ln)]. The tunnel’s mainline speed limit is 100 km/h with a design luminance ≥ 2.5 cd/m
2, while diverging ramps are designed for 60–80 km/h with luminance ≥ 3.0 cd/m
2.
Based on the actual lighting conditions of the coupled section between the underwater tunnel and the underground interchange, an analysis was conducted from the driver’s perspective on the characteristics of the non-uniform “bright to dark” lighting environment within the affected area of the section, following the principle of the most unfavorable condition.
(1) From diverging section II to mainline section III:
The driver’ s recognition of the retroreflective guide signs on the mainline corresponds to a bright to dark recognition condition. The design speed is 100 km/h, with the luminance of the dark environment being 2.5 cd/m2 and that of the bright environment being 7.5 cd/m2.
(2) From diverging section II to ramp section III:
The driver’ s recognition of the retroreflective guide signs on the ramp also corresponds to a bright to dark recognition condition. The design speed is 60 km/h, with the luminance of the dark environment being 3.0 cd/m2 and that of the bright environment being 7.5 cd/m2.
The luminance settings of the non-uniform lighting environment in the underwater tunnel, along with the threshold luminance of the bright-environment section calculated using Equation (6), are presented in
Table 7.
The designed luminance of the bright-environment section in the underwater tunnel meets the specification requirement that it should be approximately three times that of the dark-environment section. However, the results of this study suggest that the required threshold luminance for the bright section should be higher.
For Section I, the required threshold luminance of the bright section is higher than the designed luminance under the most unfavorable condition. Specifically, when the basic section of the mainline adopts a luminance of 2.5 cd/m2, the diverging area luminance of 7.5 cd/m2 cannot fully satisfy the safety recognition requirement for retroreflective guide signs.
For Section II, the required threshold luminance of the bright section is lower than the designed luminance under the same condition. Hence, a luminance of 7.5 cd/m2 in the diverging area can meet the safety recognition requirement for retroreflective guide signs.
In practical applications, considering the unified procurement and installation of luminaires, the diverging area is usually designed with a uniform luminance value. Therefore, it is recommended that during actual tunnel operation, the luminance of the diverging area should be appropriately increased and maintained at no less than 9.6 cd/m2.
In summary, the non-uniform lighting design of the ramp section in the underwater tunnel can meet drivers’ safety recognition requirements for retroreflective guide signs. However, when adopting a relatively low luminance value for the mainline section, the minimum luminance for the non-uniform lighting environment may fail to ensure adequate recognition. During tunnel operation, the actual luminance and luminance difference may decrease due to the attenuation of light source flux over time and contamination of luminaire surfaces, tunnel walls, and pavement materials.
To ensure that the lighting quality throughout the service life continues to meet visual safety requirements, it is recommended to install luminance monitoring devices in both bright and dark sections to provide real-time feedback on actual road luminance. When the mainline basic-section luminance drops below 2.5 cd/m2 or the diverging-section luminance drops below 9.6 cd/m2, the power output should be dynamically increased through a zonal dimming control system to compensate for the degradation caused by aging or contamination.
In line with highway tunnel maintenance needs, luminaires should be cleaned regularly or periodically depending on traffic volume and pollution decay conditions to maintain their light transmittance. Where feasible, a luminance degradation model can be established based on monitored luminance and energy-consumption data to predict when luminance levels will fall below standard thresholds, allowing for timely maintenance or replacement.
5. Conclusions and Discussion
Based on drivers’ visual recognition requirements for retroreflective guide signs, a dynamic visual recognition experiment was conducted to investigate the effects of a “bright–dark” non-uniform lighting environment in tunnel diverging areas on the safe recognition distance of guide signs. The minimum safety recognition distance was adopted as the evaluation baseline to ensure consistency with driving safety requirements. The main conclusions and their implications are discussed as follows.
- (1)
The results demonstrate that the “bright–dark” non-uniform lighting environment has a significant influence on drivers’ safe recognition distance of retroreflective guide signs. As the luminance difference between the bright and dark environments increases, the recognition distance initially increases and then approaches a stable level. This trend reflects the combined effect of luminance contrast enhancement and the saturation of drivers’ visual adaptation capacity. Under low dark-environment luminance conditions, increasing the luminance difference effectively improves the visual contrast between the sign and its background, thereby extending the recognition distance. However, beyond a certain luminance difference, excessive luminance contrast does not continuously enhance visual recognition performance.
- (2)
The dark-environment luminance plays a moderating role in the influence of luminance difference. When the dark-environment luminance exceeds 3.5 cd/m2, changes in luminance difference have little effect on recognition distance, suggesting that drivers’ visual adaptation has reached a relatively stable state. In contrast, when the dark-environment luminance is below 3.5 cd/m2, the recognition distance is highly sensitive to changes in luminance difference, and increasing the bright–dark contrast becomes the dominant factor affecting visual recognition.
- (3)
Based on the experimental results, the threshold luminance of the bright section required to meet safety recognition distance requirements under different dark-environment luminance levels was proposed. The results indicate that higher driving speeds require correspondingly higher threshold luminance levels in the bright section to ensure sufficient recognition distance. For tunnels with a design speed exceeding 100 km/h, maintaining a dark-section luminance of no less than 2.5 cd/m2 is recommended to ensure safe visual recognition of retroreflective guide signs. These findings provide practical guidance for optimizing lighting design in tunnel diverging areas from the perspective of visual safety.
Due to objective constraints of the on-site experimental conditions, the relative position of the guide sign with respect to the bright–dark boundary could not be varied and was treated as a fixed condition throughout the experiment. As a result, the conclusions are strictly applicable to the tested spatial configuration and may not directly represent situations with different sign placements. In addition, the experiment focused on a single type of retroreflective guide sign under a controlled lighting spectrum to isolate the effects of luminance-related factors, which may limit the generalization of the results to other sign materials and spectral conditions.
Future research should extend the present work by conducting experiments in environments that allow flexible adjustment of sign position relative to luminance transition zones, incorporating multiple types of retroreflective guide signs with varying optical characteristics, and examining the influence of different lighting spectra and correlated color temperatures. These efforts would help to further validate and generalize the findings under more diverse tunnel diverging scenarios. In this study, the minimum safety recognition distance was calculated based on conservative assumptions. Future research may further investigate the effects of relaxing these assumptions on the results, thereby enhancing the adaptability and applicability of the proposed model.
This study focuses on the recognition of directional signs when viewed from a bright environment to a dark environment within tunnels. Based on this, we discuss the lighting requirements for the tunnel environment. From another perspective, factors such as traffic volume and the proportion of passenger and freight traffic in the tunnel can also affect the lighting environment, which in turn influences the driver’s recognition of other objects. For example, in parking visibility studies, standard small target objects are commonly used (such as gray, with a reflectivity of 20%, and dimensions of 20 cm × 20 cm × 20 cm). When the target object changes, the lighting requirements in the tunnel will also vary. This is one of the limitations of this study, but also a research direction that deserves further exploration. In the future, we plan to conduct a comparative study on the impact of uneven lighting environments on the recognition of different target objects.
A comparison of the adjacent lighting environment brightness values for road tunnel directional signs proposed in this study clearly shows that these values are indeed higher than the recommended middle-section brightness values in the current road tunnel lighting standards. We recognize that the energy consumption of tunnel lighting is an important challenge. To reduce energy consumption, we suggest setting the brightness of the dark environment where the signs are located to 3.5 cd/m2 during the design phase. This brightness level ensures effective recognition while also being economically efficient. In addition, while ensuring safety and comfort, energy-efficient lighting technologies (such as LED lighting) should be adopted, and tunnel lighting brightness should be dynamically adjusted based on traffic flow. We also recommend developing a tunnel dimming control strategy to optimize the lighting design and achieve a balance between energy efficiency and safety.




 ,
,