1. Introduction
Agricultural commodity price volatility poses a significant challenge to global food security, trade stability, and agricultural supply chain resilience. For farmers, inaccurate price forecasts can result in suboptimal planting and marketing decisions, directly affecting incomes and livelihood stability. For traders and exporters, forecast errors translate into contract risks and inventory mismanagement, while, for policymakers, unreliable projections may lead to poorly timed interventions and ineffective stabilization measures. These risks are particularly acute in regions such as West Africa, where national economies and household incomes are highly dependent on a narrow set of globally traded cash crops, including cocoa, coffee, and cotton [
1]. Consumers of agricultural commodities are increasingly aware of the quality and freshness of their food products to enhance their quality of life and health [
2,
3,
4].
Consequently, producers are endeavoring to optimize their revenues through appropriate pricing of their products, so commodity price forecasting is crucial in the agricultural supply chain. In make-to-order manufacturing workshops, accurately predicting production progress (PP) is a crucial reference index for dynamically optimizing the production process and ensuring on-time delivery of production orders [
5]. It aids in decision-making processes related to production planning, inventory management, risk mitigation, and policy formulation [
6]. Moreover, regarding increasing global food security concerns and climate change impacts, reliable price forecasts become even more critical [
7]. Predicting the prices of agricultural commodities has become more important for keeping the agricultural supply chain strong. This is especially true as traditional forecasting methods increasingly fail to account for farm markets’ complexity and nonlinear dynamics.
This study proposes a hybrid LSTM–multi-head attention (LSTM–MHA) architecture for multivariate multi-commodity price forecasting. Unlike existing hybrid models that combine LSTM with convolutional or statistical components, the proposed approach integrates multi-head attention directly into the temporal learning pipeline, enabling the model to capture both long-range dependencies and dynamic relevance patterns across time. This design enhances both predictive accuracy and interpretability.
Empirical analysis is conducted using global agricultural commodity futures prices, which serve as benchmark prices for internationally traded cash crops. West Africa is treated as an application context, reflecting the region’s strong exposure to global price movements, rather than as a domestic price market. This positioning allows the study to draw policy-relevant insights while maintaining methodological consistency. The forecasting of agricultural commodity prices constitutes a significant aspect of global economics, carrying extensive implications for trade, policy formulation, and investment strategies [
8]. The inherent volatility and complexity of commodity markets, particularly in futures trading, pose significant challenges to traditional forecasting methods [
9].
Recent advances in deep learning offer promising alternatives. Long short-term memory (LSTM) networks are well suited to modeling sequential data and capturing long-term temporal dependencies, while attention mechanisms enhance interpretability and allow models to selectively emphasize informative historical periods. However, many existing studies apply these methods in isolation or within narrowly scoped hybrid frameworks, often focusing on single commodities, limited feature sets, or short forecasting horizons.
In contrast, multi-head attention mechanisms are adept at identifying relevant patterns across diverse time scales. By integrating these methodologies, our hybrid model aims to leverage the strengths of both frameworks to enhance the accuracy of forecasting and reliability. The crucial importance of the agricultural sector in ensuring global food security and maintaining economic stability underscores the need for precise and dependable price forecasts [
10]. These commodities satisfy direct consumption requirements and act as raw materials for diverse businesses. Price variations can produce cascading impacts, influencing stakeholders ranging from small-scale farmers to multinational enterprises and national economies [
11].
Developing more accurate forecasting models is crucial for all the stakeholders in the agricultural value chain [
6]. It is assumed that the resilience of the agricultural supply chain largely depends on stakeholders’ ability to anticipate and respond to price fluctuations. Accurate pricing forecasts enhance inventory management, optimize resource allocation, and strengthen risk management techniques. However, contemporary forecasting methods frequently inadequately account for the intricate interrelations among diverse market components, including seasonal patterns, climatic variables, global trade influences, and unexpected market disruptions.
This limitation has created a critical need for more robust forecasting approaches that enhance agricultural supply chain resilience. Advanced forecasting models could improve prediction accuracy and agricultural supply chain performance, particularly those incorporating artificial intelligence and machine learning techniques. This study seeks to leverage deep learning and attention mechanisms to identify intricate temporal correlations and pertinent aspects in commodity price data.
Forecasting agricultural commodity prices has progressed from basic statistical methods to advanced machine learning techniques [
12]. Traditional statistical models like ARIMA and GARCH have long been used for time-series forecasting. However, they often fail to capture the nonlinear, long-term, and dynamic dependency characteristic of agricultural price movements [
13]. In recent years, deep learning models, specifically recurrent neural networks (RNNs) and long short-term memory (LSTM) networks, have demonstrated efficacy in time-series forecasting by effectively capturing long-term dependencies in sequential data [
14,
15]. While LSTMs can be useful, they may not fully capture all the complexities involved in commodity price dynamics [
16]. This is where the multi-head attention mechanism is utilized. Initially, it was developed for natural language processing. Attention mechanisms have demonstrated efficacy in numerous time-series forecasting challenges by allowing the model to focus on specific parts of the input sequence during prediction [
17].
Supply chain resilience (SCR) focuses on mitigating risks like climate variability, pest outbreaks, and trade disruptions through tools such as blockchain for enhancing transparency, the Internet of Things (IoT) for real-time monitoring, and public–private collaborations to improve infrastructure and systems. During events such as the COVID-19 pandemic, localized agricultural supply chains proved essential for continuity, underscoring the need for adaptability and climate-smart agricultural practices [
18,
19]. Price forecasting complements supply chain management by reducing market uncertainty and enabling better planning. Advanced analytics, such as machine learning, utilize historical and real-time data to improve prediction accuracy, aiding inventory and production optimization. For example, forecasting can guide decisions on planting schedules or dynamic pricing, ensuring alignment between supply and market demand [
20].
The study examines a diverse range of agricultural commodities, similar to those discussed in some past studies. For instance, Cocoa and coffee are tropical crops that are sensitive to climate conditions and global demand patterns [
21]. Cotton is a significant non-food agricultural commodity that is affected by both agricultural practices and industrial factors [
22]. Lumber, reflecting the forestry sector, is characterized by distinctive long-term growth cycles [
23]. Orange juice is a commodity that exhibits significant seasonal patterns and is vulnerable to weather conditions. Sugar is a widely produced commodity that is influenced by the food and biofuel industries [
24].
Integrating LSTM and multi-head attention in a hybrid model offers a new approach to forecasting agricultural commodities [
25]. This integration aims to leverage LSTM’s ability to capture long-term dependencies and the attention mechanism’s capacity to concentrate on the important sections of the input sequence [
26]. This research is especially pertinent due to the rising volatility in global agricultural markets caused by climate change, evolving consumer tastes, and geopolitical tensions. Enhanced forecasting models can serve as essential instruments for risk management, policy development, and strategic planning within the agriculture industry [
1]. Furthermore, this study’s findings may have wider applicability in financial forecasting and time-series analysis across other sectors.
Despite advancements, the existing models for agricultural commodity forecasting often suffer from limitations, such as oversimplified feature sets, a single-commodity focus, or inadequate handling of volatility and seasonality. Many deep learning approaches remain shallow, lack proper regularization, or fail to integrate both long-term trends and short-term fluctuations effectively. Moreover, agricultural markets exhibit unique characteristics, such as high sensitivity to weather, seasonality (orange juice and sugar), and supply chain disruptions that demand more sophisticated, generalizable, and robust models. This study is motivated by the urgent need for a unified, accurate, and scalable forecasting framework that can handle the complexity and diversity of agricultural commodity prices. By combining the sequential modeling strength of LSTM with the dynamic pattern-weighting capability of multi-head attention, we aim to develop a hybrid model that improves predictive accuracy and supports decision-making across the agricultural supply chain.
This research makes significant contributions to the field of agricultural commodity price forecasting through several key advancements. First, it proposes an innovative hybrid model architecture that seamlessly integrates the sequential learning capabilities of long short-term memory (LSTM) networks with the pattern recognition strengths of multi-head attention mechanisms, enabling the model to effectively capture both long-term dependencies and salient short-term fluctuations in price data. Second, the model demonstrates strong generalization performance across a diverse set of agricultural commodities, including cocoa, coffee, cotton, lumber, orange juice, and sugar, indicating its adaptability and applicability to various agricultural markets, thereby providing valuable insights into the effectiveness of deep learning for multi-commodity forecasting. Third, the integration of attention mechanisms allows the model to dynamically identify and weigh critical temporal patterns, such as seasonality and volatility shifts, significantly improving prediction accuracy under complex and volatile market conditions. Finally, the study establishes a practical framework for integrating advanced forecasting models into agricultural supply chain resilience strategies, offering stakeholders actionable tools for optimizing production planning, enhancing resource allocation, and strengthening risk management [
27]. Improved price forecasts could lead to better decision-making, more efficient resource allocation, and enhanced risk management strategies [
28,
29].
The rest of the paper is structured as follows:
Section 2 illustrates the related works.
Section 3 presents the proposed LSTM–multi-head attention hybrid model.
Section 4 shows the results of the proposed model in terms of performance and a comparative analysis with the baseline models.
Section 5 concludes the paper.
2. Related Works
This section offers a thorough examination of the current literature concerning agricultural commodity price forecasting, with a particular emphasis on the utilization of machine and deep learning methodologies. Forecasting agricultural food prices is crucial for the academic community and policymakers as it contributes to food security. A substantial amount of research has been conducted in this domain, resulting in the development of numerous models aimed at enhancing prediction accuracy. Vector autoregression (VAR) is a conventional technique employed for time-series forecasting challenges. The VAR model must be evaluated against the rate of an alternative or baseline product, which is why much of the pertinent work in food price forecasting has investigated the correlation between global crude oil prices and food prices. Researchers have recently identified a nonlinear causal link between food prices and crude oil prices [
30]. Another study determined that there is a relationship between biofuel prices and food prices, both in the short- and long term. Historically, the forecasting of agricultural commodity prices has depended on several statistical and economic models. Time-series analysis methods, including autoregressive integrated moving averages (ARIMA) and variations, are extensively employed in this field. For instance, Kohzadi et al. [
31] compared ARIMA models with artificial neural networks for forecasting commodity prices, finding that neural networks outperformed ARIMA in most cases. Another popular approach is the generalized autoregressive conditional heteroscedasticity (GARCH) model, particularly developed for capturing volatility clustering in commodity prices. The GARCH model has been applied to various metal commodities, demonstrating its effectiveness in modeling price volatility [
32].
The emergence of machine learning has introduced novel opportunities in agricultural price forecasting. Support vector machines (SVMs), artificial neural networks (ANNs), and random forests have been utilized with differing levels of efficacy. Xiong et al. [
33] used SVMs to forecast agricultural commodity prices, showing improved accuracy compared to traditional methods. Their research on maize price predictions illustrated the capability of machine learning to identify nonlinear correlations in pricing data. Ensemble approaches, especially random forests, have demonstrated potential in this domain. Sujjaviriyasup and Pitiruek [
34] applied random forests to predict agricultural commodity prices in Thailand, attaining superior accuracy compared to individual decision tree models.
Deep learning models, especially recurrent neural networks (RNNs) and their variants, have gained significant attention in time-series forecasting due to their ability to capture long-term dependencies. Hochreiter and Schmidhuber [
35] introduced LSTM networks; these networks have gained popularity in financial and commodity price forecasting. They are designed to address the vanishing gradient problem seen in traditional RNNs, which makes them better suited for capturing long-term dependencies in time-series data. Attention mechanisms were first introduced in the field of natural language processing by Bahdanau et al. [
36] and have recently been applied to time-series forecasting tasks. The self-attention mechanism, particularly as implemented in the transformer architecture by Vaswani et al. [
17], has shown remarkable results in various sequence modeling tasks. In financial forecasting, Zhou et al. [
26] proposed the informer model, which uses a ProbSparse self-attention mechanism for long-sequence time-series forecasting. Their approach showed efficiency and effectiveness in managing long-range dependencies in time-series data.
Recent studies have concentrated on hybrid models that integrate various techniques to maximize their strengths. For instance, Kristjanpoller and Minutolo [
37] proposed a hybrid model that combines artificial neural networks and GARCH for forecasting the volatility of gold prices, demonstrating improved performance compared to individual models in the context of agricultural commodities. Also, Kantasa-ard et al. [
38] developed a hybrid LSTM with a genetic algorithm and scatter search to automate the hyperparameter tuning of the hybrid LSTM for demand forecasting in a physical internet supply chain network. In the context of commodity markets, Cen and Wang [
39] applied an LSTM network to forecast crude oil prices, showing enhanced performance over traditional time-series models and standard neural networks. Similarly, Livieris et al. [
40] utilized LSTM networks in forecasting agricultural commodity prices, demonstrating enhanced accuracy compared to traditional machine learning techniques. Another study by Liu et al. [
5] designed a long short-term memory (LSTM) model with transfer learning (TL) to accommodate the nonlinear relationships of the features supplied by the CNN–TL model for predicting production progress.
Olofintuyi et al. [
41] applied many machine learning methodologies, including LSTM networks, to predict cocoa prices, illustrating the efficacy of deep learning in encapsulating the intricate dynamics of the cocoa market. For anticipating coffee prices, Mekala et al. introduced a novel approach to predicting coffee prices using BiLSTM (bidirectional long short-term memory) and CNN (convolutional neural network) models. Their method showed how effectively combining CNN and BiLSTM models predicts coffee prices [
42]. Dave et al. developed an integrated ARIMA and LSTM machine learning model in the cotton market to accurately predict Indonesia’s future exports. Additionally, they compared various forecasting methods for predicting cotton prices. Their study emphasized the benefits of hybrid approaches [
43]. For lumber price forecasting, Lamichhane et al. [
44] used machine learning approaches, illustrating their efficacy in encapsulating the distinct attributes of the lumber market, and their research established a foundation for forecasting wood prices in the southern timber market with ANN models. Luo et al. [
45] applied deep learning models to predict orange juice futures prices, demonstrating better performance than traditional time-series models. In the sugar market, Ribeiro and Oliveira [
46] applied neural networks and neuro-fuzzy systems for price forecasting, proposing a hybrid model for predicting agricultural commodity prices, specifically sugar, illustrating the efficiency of these techniques in capturing the intricate dynamics of sugar prices.
The literature review indicates a distinct trend in the utilization of sophisticated machine learning and deep learning methodologies for forecasting agricultural commodity prices. Although conventional methods remain relevant, there is increasing evidence of the enhanced efficacy of deep learning models, especially LSTM networks and attention-based techniques. The effectiveness of hybrid models that integrate various methodologies is also apparent. However, there is a gap in the reviewed literature on the application and effective integration of LSTM–multi-head attention hybrid models for the diverse agricultural commodities analyzed in this study, highlighting the novelty and potential significance of the proposed research.
Our design tackles the limitations highlighted in several related works, as outlined in
Table 1. We compared our proposed LSTM–multi-head attention model with other notable deep learning models to offer a solution for accurate agriculture commodity price predictions.
Table 1 highlights that most existing studies focus on single-commodity forecasting and rely on univariate input structures without explicit attention mechanisms. In addition, several studies report limited evaluation protocols, often omitting validation sets or comprehensive error metrics. In contrast, the proposed LSTM–MHA framework incorporates multivariate inputs, explicitly models temporal relevance through multi-head attention, and evaluates performance using multiple error measures across training, validation, and test sets.
3. Methodology
The methodological framework consists of four stages: data acquisition, preprocessing, model architecture design, training and validation, and performance evaluation.
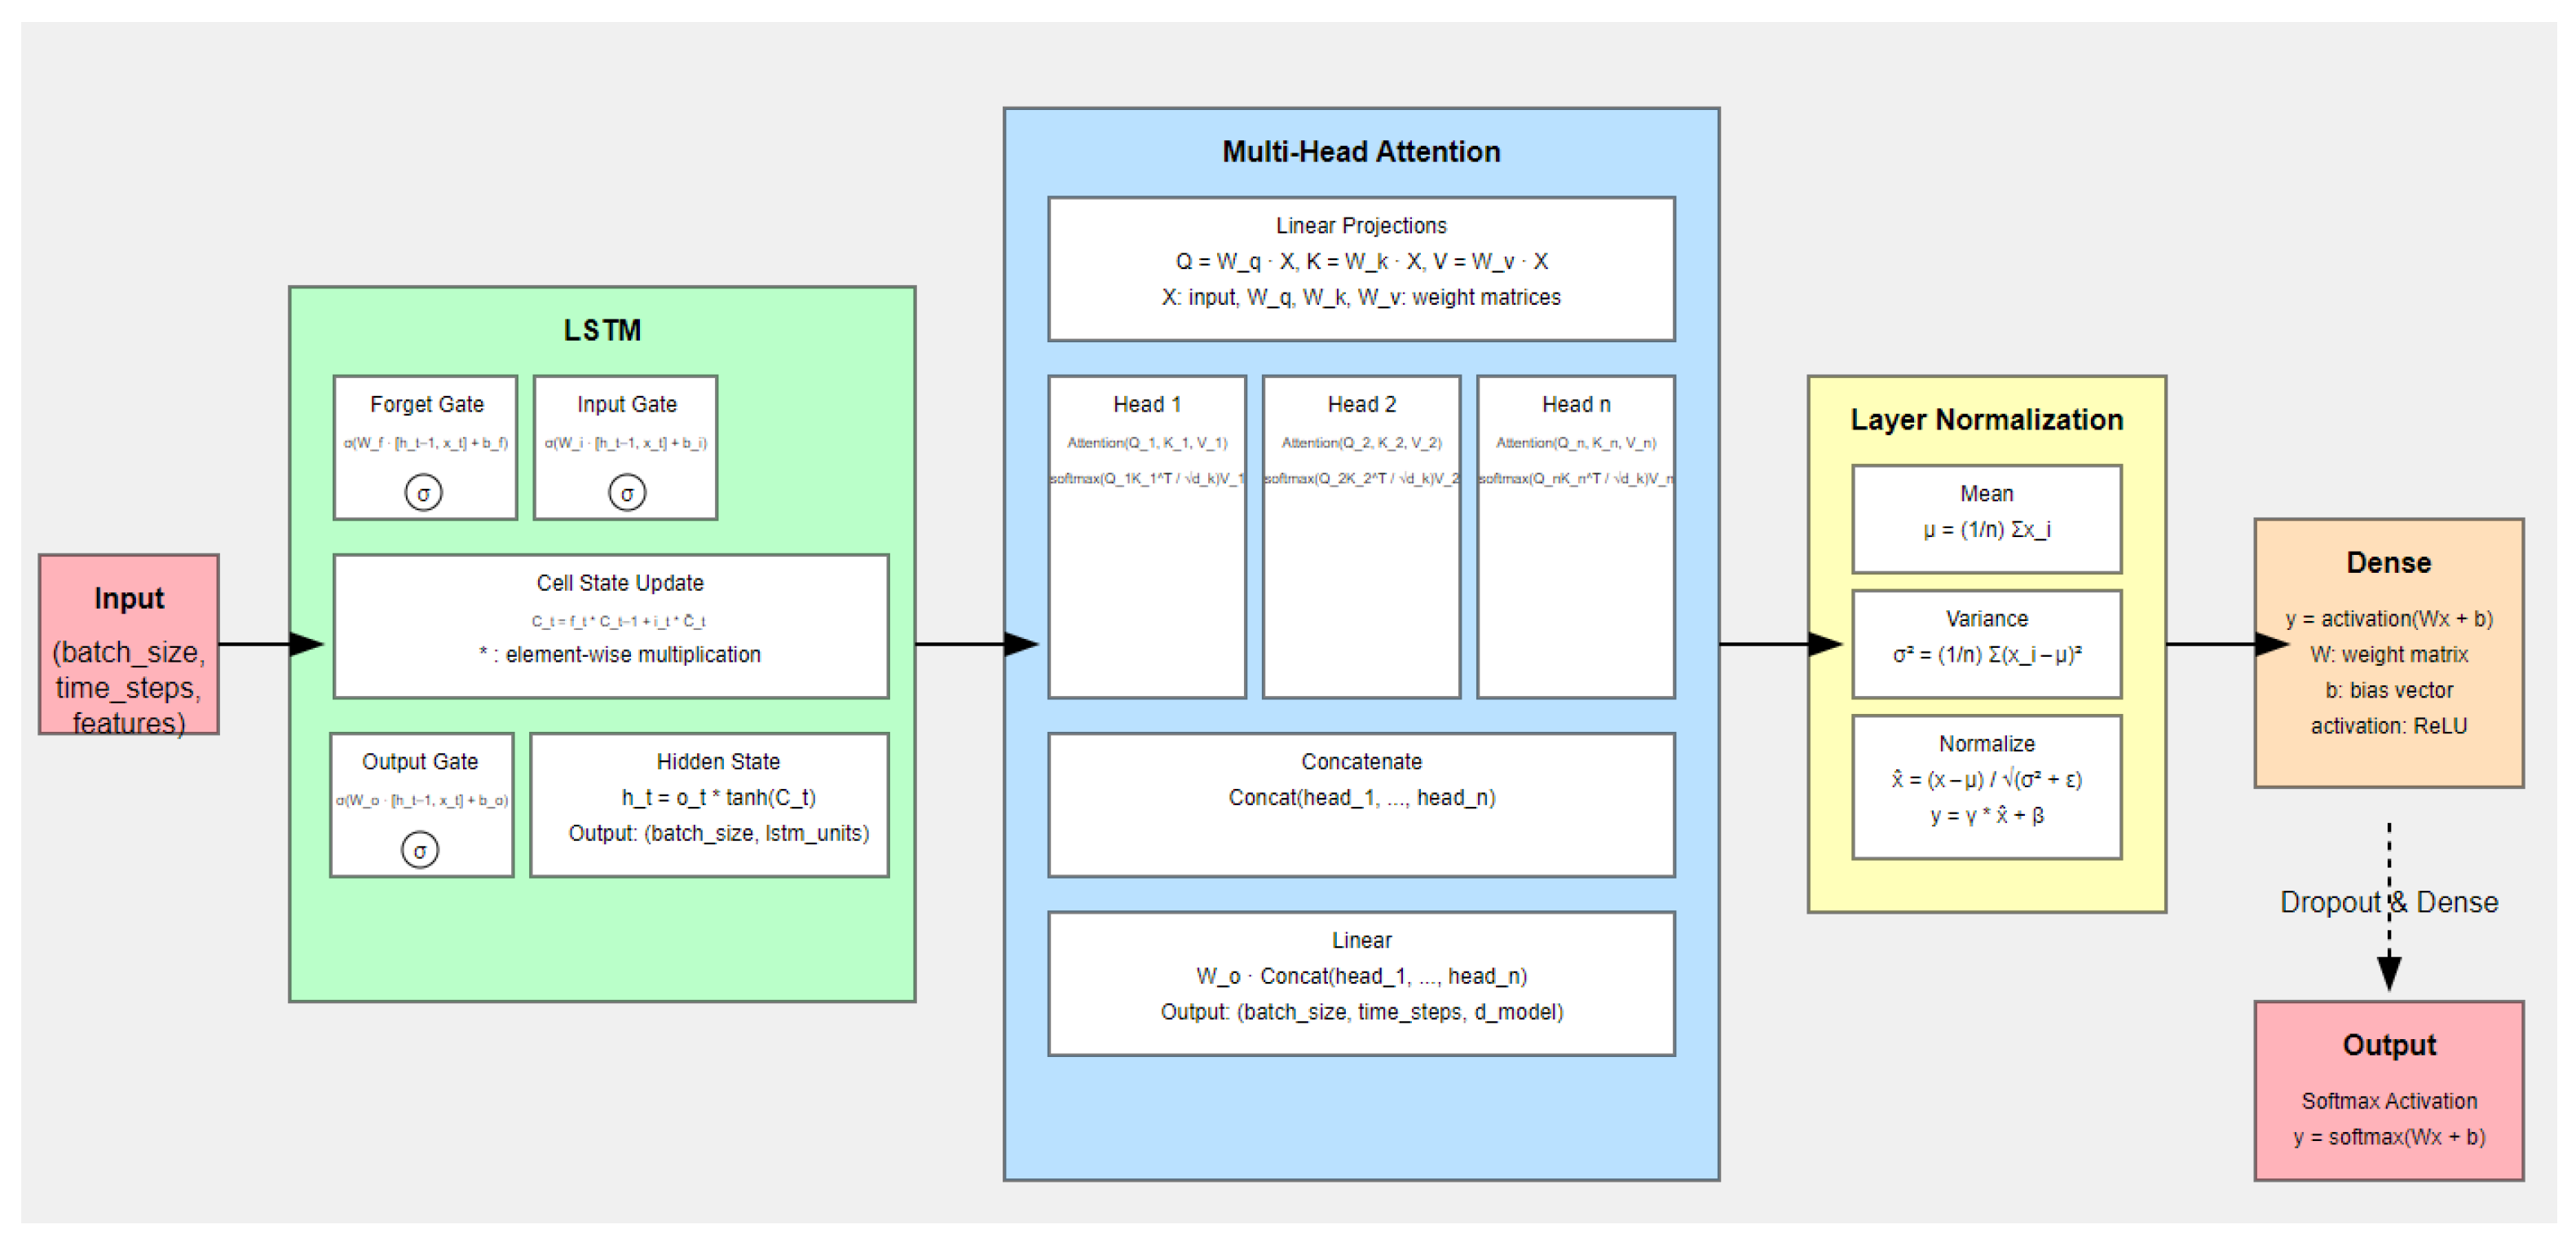
Figure 1 illustrates the overall modeling pipeline.
3.1. Data Collection and Preprocessing
The study employs daily futures price data for six globally traded agricultural commodities—cocoa, coffee, cotton, lumber, orange juice, and sugar—covering the period January 2000 to December 2023. These futures prices represent internationally recognized benchmarks that directly influence export revenues and income stability in West African economies.
The information comprises open, high, low, and closed prices, as well as trading volume. The research employs agricultural commodities futures data [
56] from Kaggle, which offers a comprehensive analytical dataset that serves as the basis for implementing the forecasting models examined in this study.
Missing observations arising from non-trading days were forward-filled to preserve temporal continuity. While forward filling may dampen short-term volatility, it ensures sequence completeness for recurrent models. All price variables were normalized using min–max scaling to enhance numerical stability during training; the implications of this choice are discussed in the
Section 4.6.
The dataset was split chronologically into training (70%), validation (20%), and test (10%) sets to prevent information leakage and to reflect real-world forecasting conditions.
3.2. Model Architecture
The proposed LSTM–MHA architecture consists of stacked LSTM layers followed by a multi-head attention module, layer normalization, and dense layers. The number of LSTM units and attention heads was selected based on empirical performance stability and computational efficiency. Multi-head attention allows the model to learn diverse temporal relevance patterns, improving robustness across commodities with differing seasonal and volatility characteristics. The proposed architecture of the model is illustrated in
Figure 1.
The model was trained using the Adam optimizer with mean squared error as the loss function. Hyperparameters were tuned through controlled experiments, with the final configuration selected based on validation performance stability rather than marginal metric improvements. Training was conducted on a GPU-enabled environment, and consistent random seeds were used to ensure reproducibility.
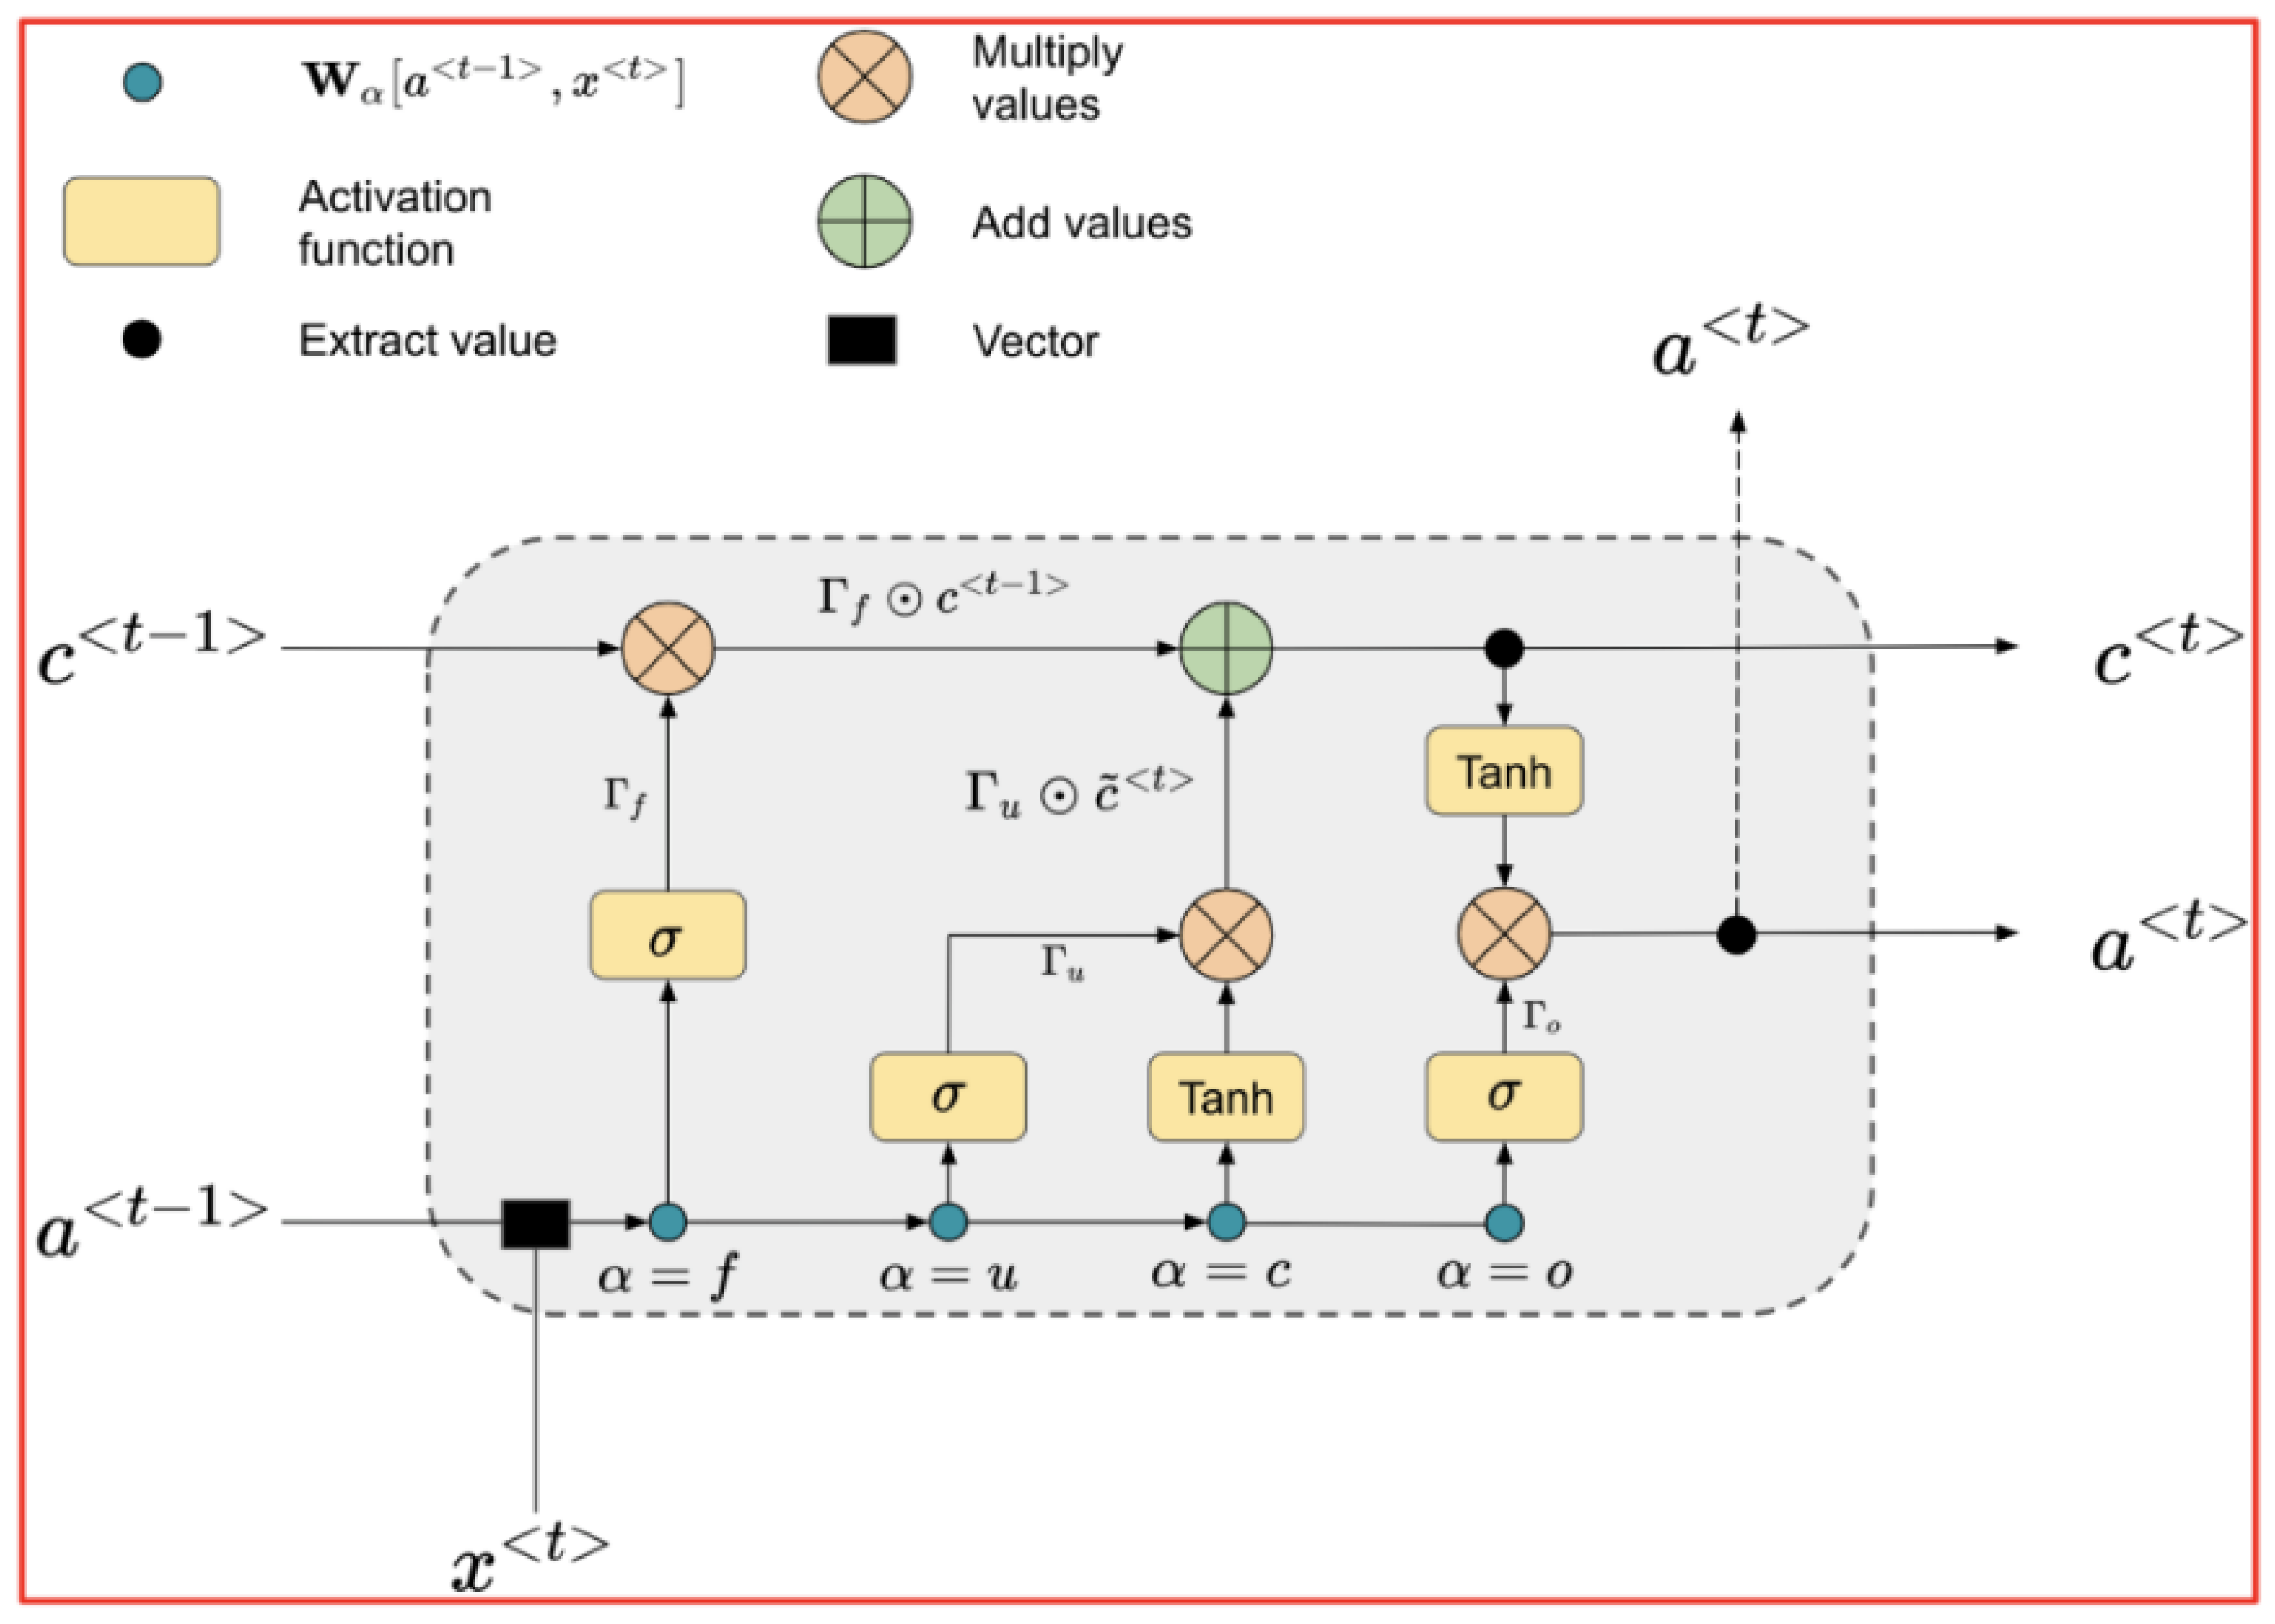
In the LSTM depicted in
Figure 1 information traverses a mechanism regulated by many gates that determine whether to retain or eliminate specific information at each time step.
Figure 2 depicts the single-layer structure of the LSTM architecture within the sequence modeling.
The model architecture and procedures for the experiment are illustrated in Algorithm A1.
| Algorithm A1: Hybrid LSTM–Multi-Head Attention (LSTM–MHA) Forecasting Framework |
Input: Multivariate commodity futures series ; lookback window L; epochs E; batch size B; learning rate ; number of attention heads H. Output: Forecasted price ; trained parameters ; attention weights . Step 1. Data Preparation: Normalize inputs using min–max scaling and construct supervised sequences . Split data chronologically into training, validation, and test sets. Step 2. Temporal Feature Extraction: Encode using an LSTM layer to obtain hidden representations . Step 3. Multi-Head Attention: Apply multi-head self-attention to to compute attention-weighted features . Step 4. Feature Refinement: Combine and via residual connection and layer normalization to produce . Step 5. Forecast Generation: Refine temporal features using a second LSTM layer and generate prediction through a fully connected output layer. Step 6. Model Training: Optimize parameters using the Adam optimizer with mean squared error loss and validation-based early stopping. Step 7. Evaluation and Interpretability: Evaluate forecasting performance using MSE, RMSE, and MAE. Conduct ablation analysis (LSTM-only and attention-only). Extract attention weights to compute lag importance. Step 8: Ablation and Attention Analysis: Train baseline models (LSTM-only and attention-only). Extract attention weights and compute lag importance: return , , |
The model architecture comprises the following components:
Input Layer: The input layer acquires sequential data. It is structured as a sequence of lengths and features. The sequence length represents the number of time steps, while features represent the number of variables at each time step.
LSTM Layer 1 (64 units): This represents the first long short-term memory (LSTM) layer. LSTM is a type of recurrent neural network (RNN) that can learn long-term dependencies. It is advantageous for time-series data. This layer consists of 64 units, determining its capacity to identify patterns in the data. The LSTM unit comprises three gates: the input gate, the forget gate, and the output gate. LSTM equations for the various gates include:
Input Gate: The value
of the corresponding input gate is aggregated to determine the level of updated information, which outputs a value between (0 and 1).
Forget Gate: This variable
represents the output of the associated forgetting gate, which determines whether to eliminate or retain specific information from the storage unit.
represents the output value from the preceding moment.
represents the present input value.
Output Gate: The output gate value
is calculated to ascertain the extent of memory utilized for output.
Cell State: The cell state is modified by multiplying the previous cell state
by the output value
from the associated forgetting gate. The updated output value is subsequently multiplied by the input gate
, incorporating the second state into the new cell state
.
Hidden State: The next step is to employ the hyperbolic tangent function to adjust the
value to fall within the range of 1 and −1. The output gate value
is ultimately multiplied by
, yielding the final output value
at time
t.
Here, denotes the sigmoid or activation function, * represents element-wise multiplication, W signifies weight matrices, and b indicates bias vectors.
Dropout Layer 1 (20%): Dropout is a regularization method employed to mitigate overfitting. It randomly assigns a proportion of input units to zero during each training update. In this instance, 20% of the inputs are omitted, facilitating the model’s acquisition of more resilient features. The dropout layer is computed as follows:
where
d is a vector of independent Bernoulli random variables, each with a probability of 0.8 of being 1.
Multi-Head Attention Layer (8 heads): The attention mechanism, which allows the model to focus on different segments of the input sequence while producing predictions, is incorporated into this layer. The phrase “8 heads” describes the model’s capacity to simultaneously learn eight distinct attention patterns, which enables it to identify a range of dependencies in the data.
The aggregate of the multi-head attention layer is
Each head is calculated as follows:
The function of attention is as follows:
Layer Normalization: Layer normalization stabilizes the learning process by normalizing inputs across features instead of the batch dimension, hence accelerating training and enhancing the model’s overall performance.
where
is a tiny constant for numerical stability and
and
are learnable parameters.
LSTM Layer 2 (32 units): This is the second LSTM layer with 32 units. Multiple LSTM layers enable the model to learn more complex temporal patterns. This layer processes the output from the attention mechanism, refining the temporal features.
Dropout Layer 2 (20%): Another dropout layer for additional regularization. It helps to prevent overfitting on the patterns learned by the second LSTM layer 2 using .
Dense Layer (16 units, ReLU activation): This layer is fully connected with 16 units and uses ReLU (Rectified Linear Unit) activation. It facilitates learning nonlinear combinations of the high-level information retrieved by prior layers. The ReLU activation function provides nonlinearity to the model. The dense layer is expressed as
where
W is the weight matrix,
x is the input vector,
b is the bias vector, and activation is the activation function (ReLU in this case, except for the final layer, which has no activation).
Output Dense Layer (1 unit, linear activation): This is the final layer that generates the forecast. It consists of one unit with a linear activation function, which is suitable for regression tasks such as forecasting. The linear activation enables the model to output any numerical value, making it appropriate for prediction tasks.
3.3. Training Process
We employed a 70-20-10 division in the training, validation and testing of datasets. Our proposed model underwent a training process for 50, 100, and 150 epochs, utilizing batch sizes of 64, 128, and 256, alongside learning rates of 0.001, 0.01, and 0.1, respectively, employing Adam optimizer and mean squared error as the loss function.
Table 2 below presents the various model parameters adjusted in our studies.
Based on the comparative evaluation of the training configurations summarized in
Table 2 and the performance results reported in
Table 3, the final experimental results presented in this study are obtained using Configuration 2, corresponding to a training duration of 100 epochs. This configuration achieved the most favorable balance between forecasting accuracy and training stability, yielding consistently lower validation errors across all evaluation metrics without evidence of overfitting.
Although the 150-epoch configuration provided marginally longer training, it did not lead to further improvement in predictive performance and exhibited diminishing returns in validation accuracy. In contrast, the 50-epoch configuration converged more rapidly but resulted in comparatively slightly higher errors, especially during training. Consequently, the 100-epoch configuration was selected as the final training setting and was used uniformly for all reported forecasting results in this work.
4. Experimental Results and Analysis
4.1. Model Performance
The proposed model assessment was done using multiple metrics, including mean squared error (MSE), root mean squared error (RMSE), and mean absolute error (MAE), with the findings displayed alongside the hyperparameter tuning in
Table 3. However, the training and validation losses in this experiment exhibit near-overlapping trajectories across epochs, as shown in
Table 3, the hyperparameter analysis. While such behavior may appear unusual in some learning scenarios, it is expected in this setting due to three factors: (i) chronological data splitting, which preserves similar statistical regimes across training and validation sets; (ii) regularization effects induced by attention-based temporal averaging and dropout; and (iii) early stopping based on validation stability rather than aggressive loss minimization. This behavior indicates conservative learning and strong generalization rather than data leakage or overfitting.
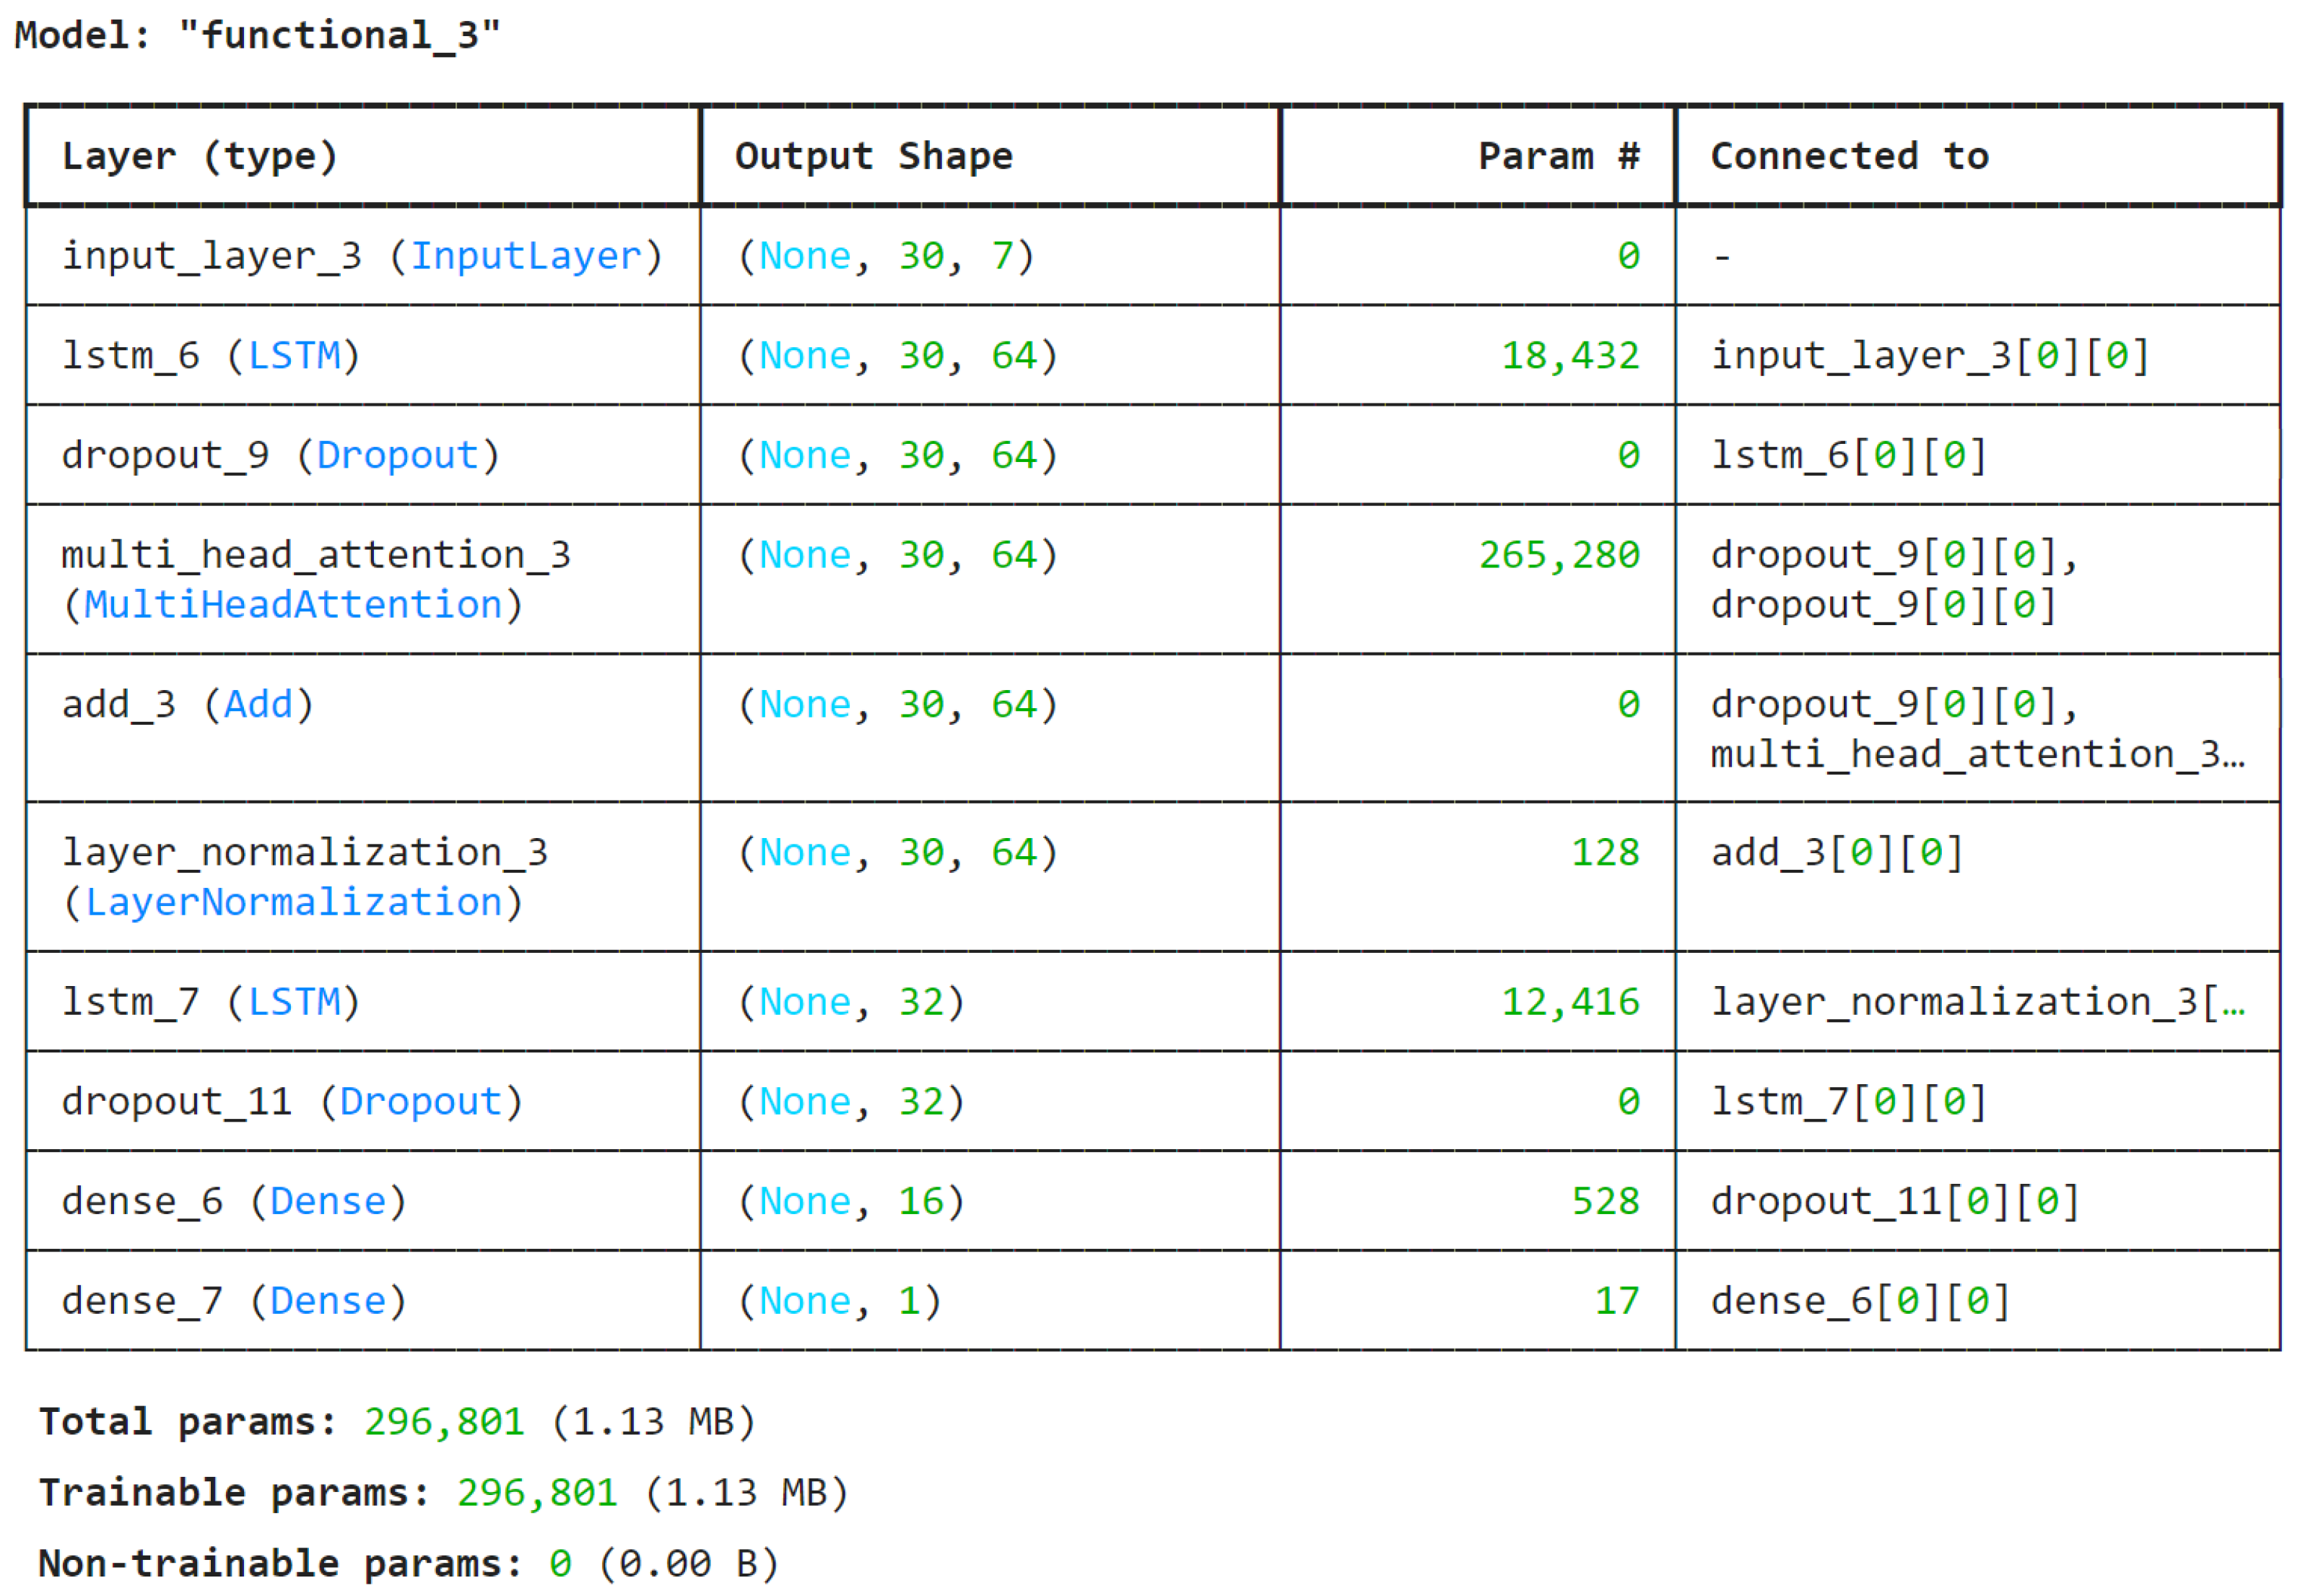
Figure 3 illustrates the summary of the LSTM–MAH model architecture, which exemplifies an advanced hybrid methodology for forecasting agricultural commodity prices. The model initiates with an input layer that accommodates 30 time steps and seven features per step, encapsulating a month’s historical data. The design next processes this input via a dual LSTM–attention mechanism framework. The initial LSTM layer, with 64 units and 18,432 parameters, identifies temporal patterns within the input stream. The subsequent component is a vital multi-head attention method (265,280 parameters) that enables the model to dynamically concentrate on pertinent historical patterns, augmented by residual connections and layer normalization to ensure steady training. Another LSTM layer with 32 units (12,416 parameters) further analyzes this attention-weighted data. The model culminates in two dense layers that systematically decrease the dimension from 16 units to one unit, yielding the final price forecast. The model has 296,801 trainable parameters (about 1.13 MB), achieving an effective equilibrium between complexity and processing demands. This design integrates the LSTM’s proficiency in capturing long-term dependencies with the attention mechanism’s capacity to emphasize pertinent past patterns. It is especially adept at the intricate process of projecting agricultural commodity prices.
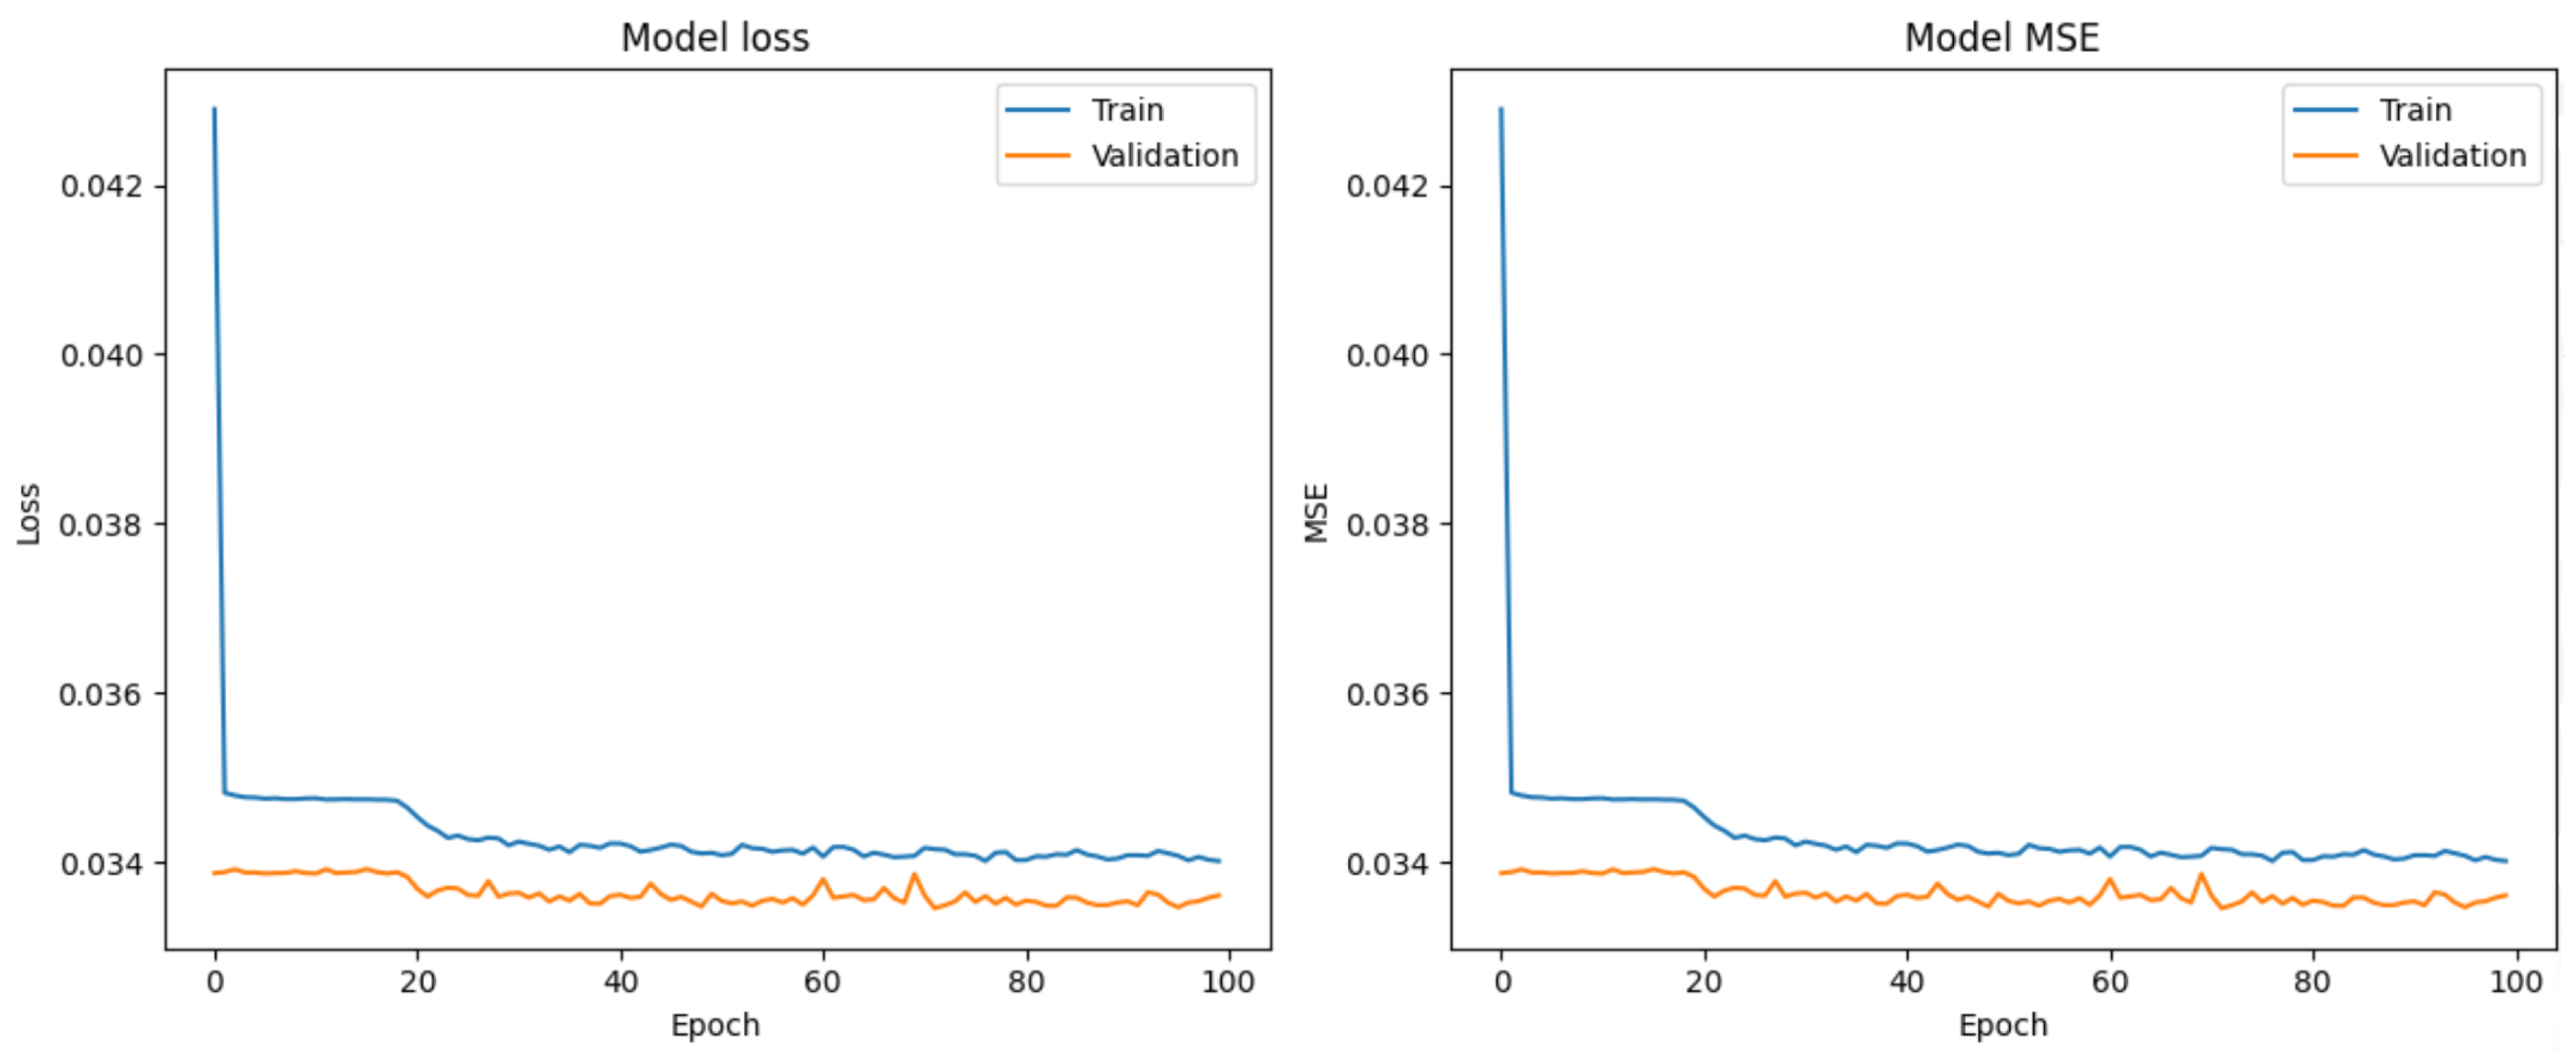
The performance study of the LSTM–MHA model at Epoch 100 reveals strong and stable learning properties, as indicated by the graphical representations in
Figure 4 and the numerical metrics in
Table 3. The model attained nearly equivalent training and validation losses of 0.03472800, alongside a test loss of 0.03464708, demonstrating exceptional generalization skills without evidence of overfitting. The learning curves exhibit a consistent and persistent convergence pattern, with training and validation measures closely aligning throughout the training phase. The convergence is additionally corroborated by the model’s error measures, which include an MSE of 0.01241407, an RMSE of 0.11141844, and an MAE of 0.10966918. The narrow disparity between training and validation performance, along with the consistent stabilization of loss curves near the 0.034 thresholds, indicates that the model effectively discerned the fundamental patterns in agricultural commodity price fluctuations while preserving robust generalization skills. The results confirm the efficacy of the hybrid LSTM–attention architecture in delivering dependable and consistent price forecasting performance.
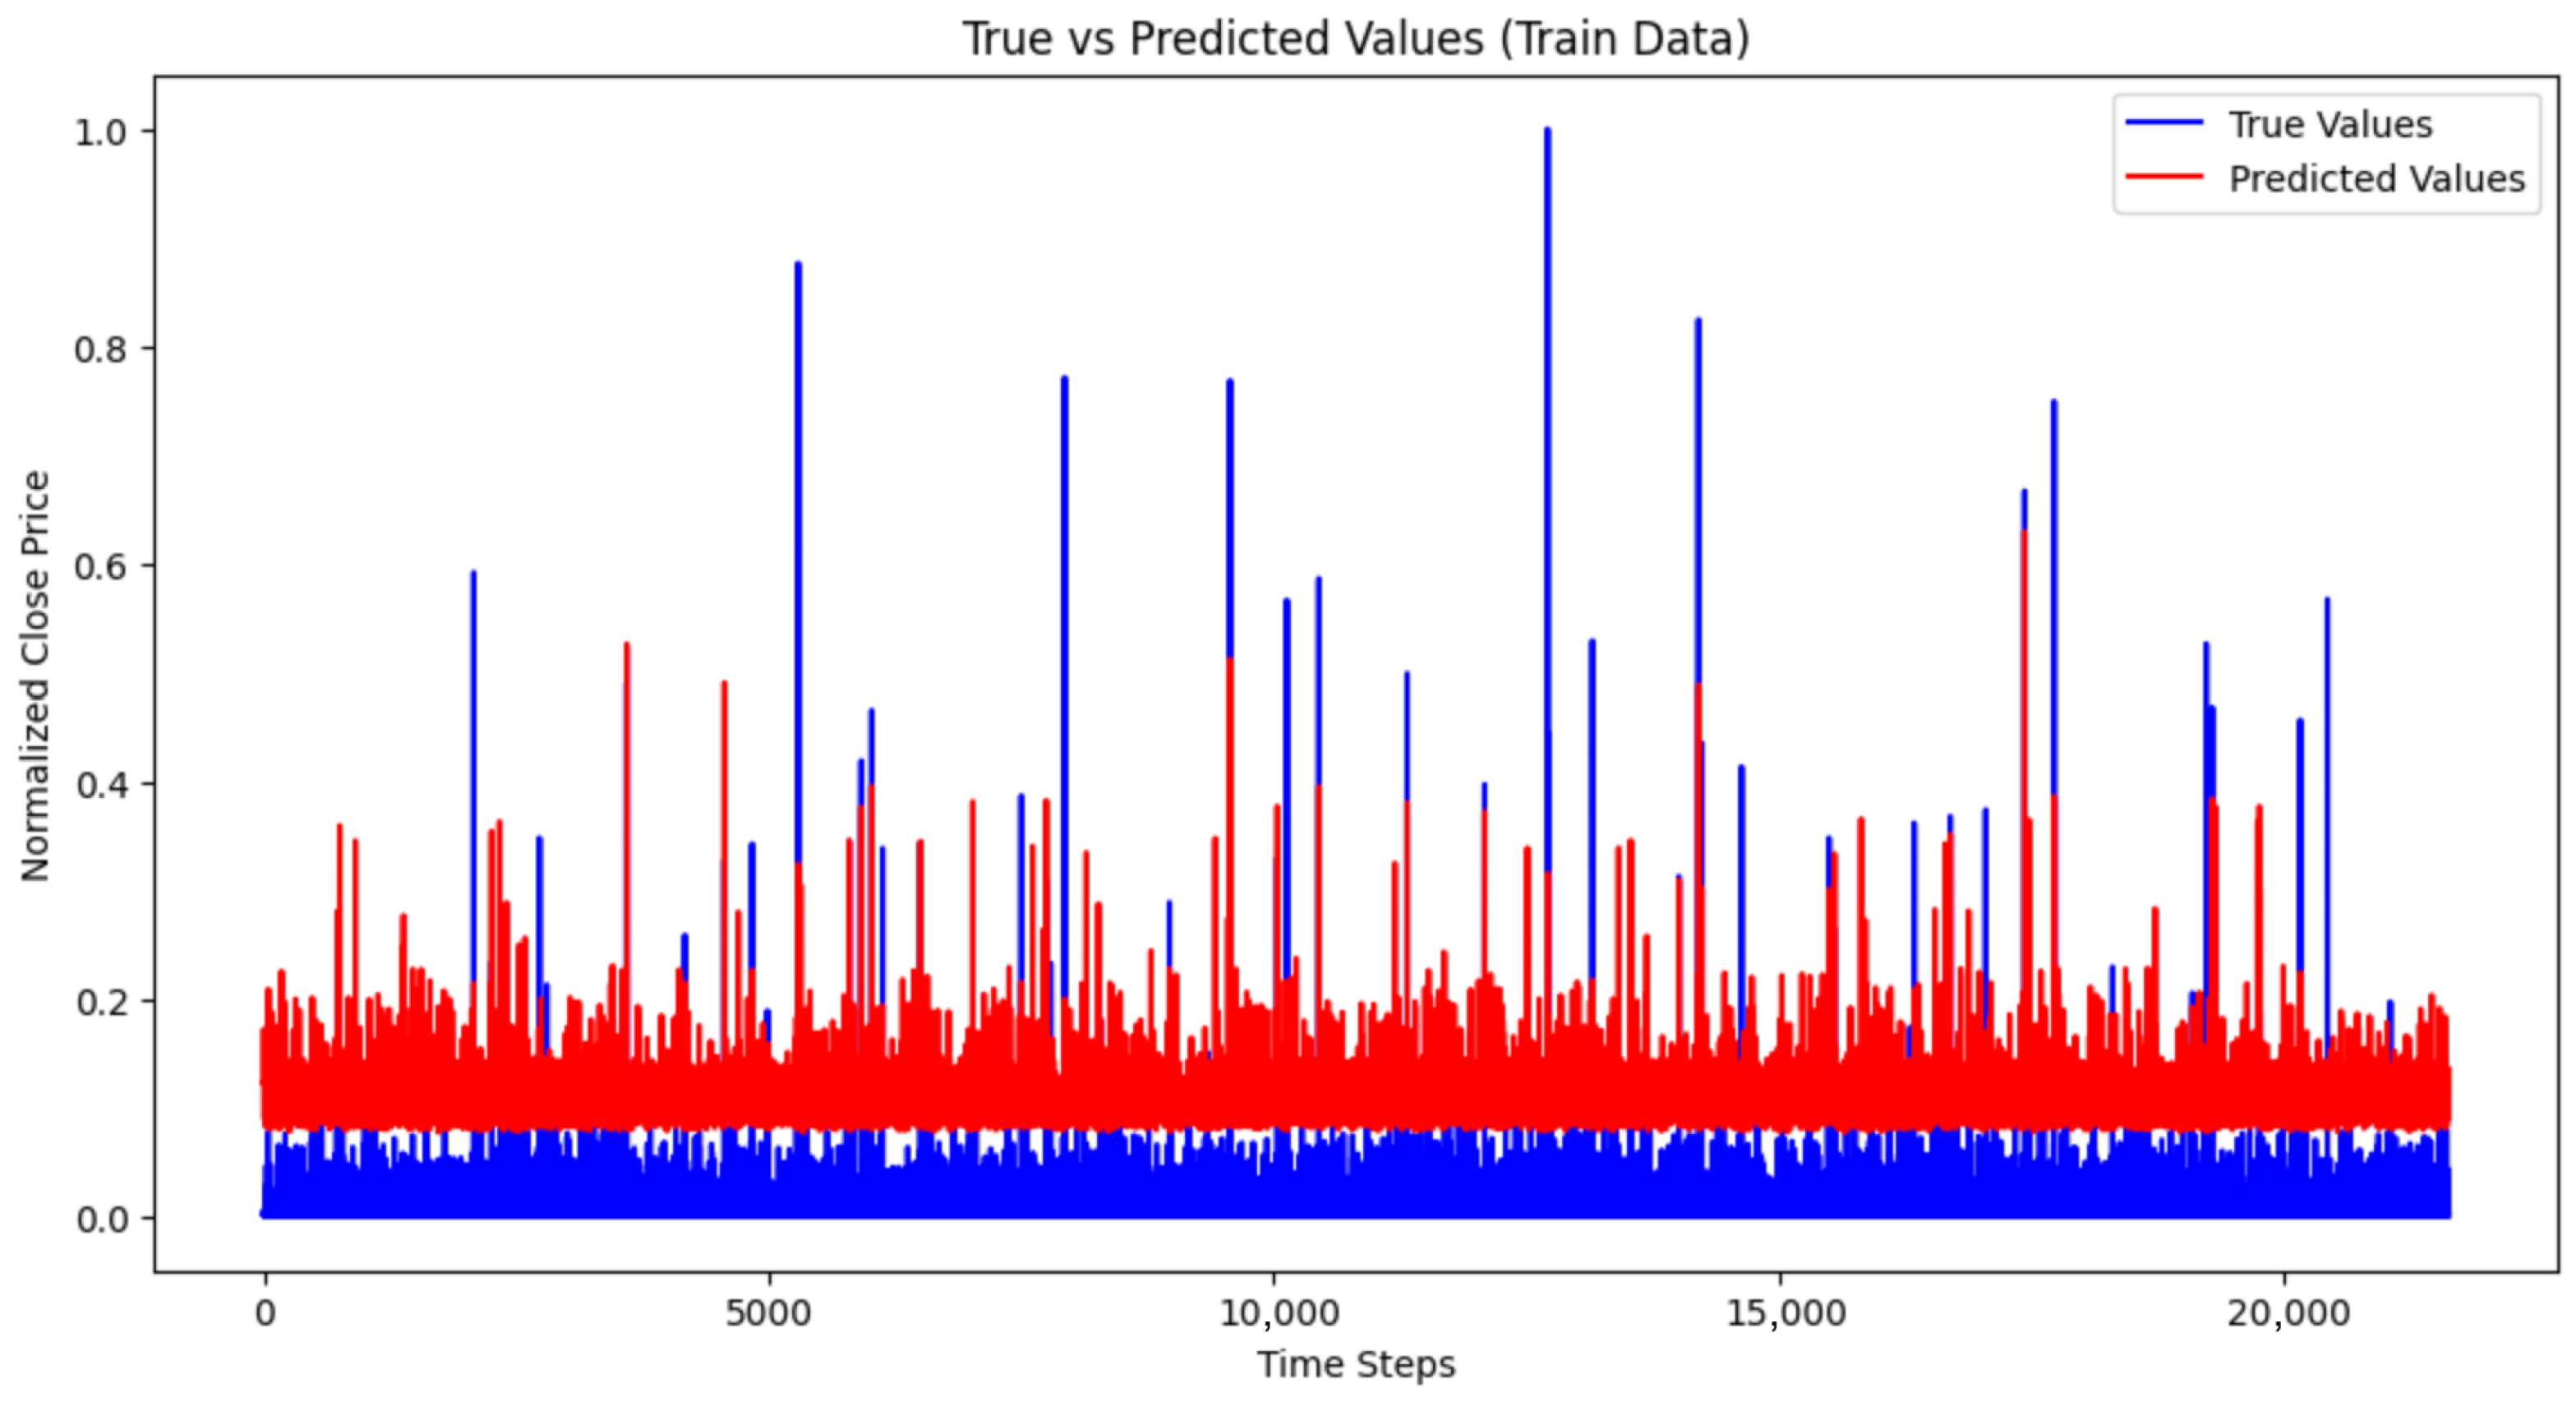
Figure 5 presents the comparison between actual and predicted prices on the training dataset, comprising approximately 20,000 time steps. The predicted series closely follows the underlying trend of the true values while exhibiting reduced sensitivity to short-term fluctuations. This behavior indicates that the model effectively learns the dominant temporal structure of the data without overfitting to transient noise.
Although occasional deviations are visible during abrupt price movements, the overall alignment between the predicted and observed values is consistent with the low training error reported in
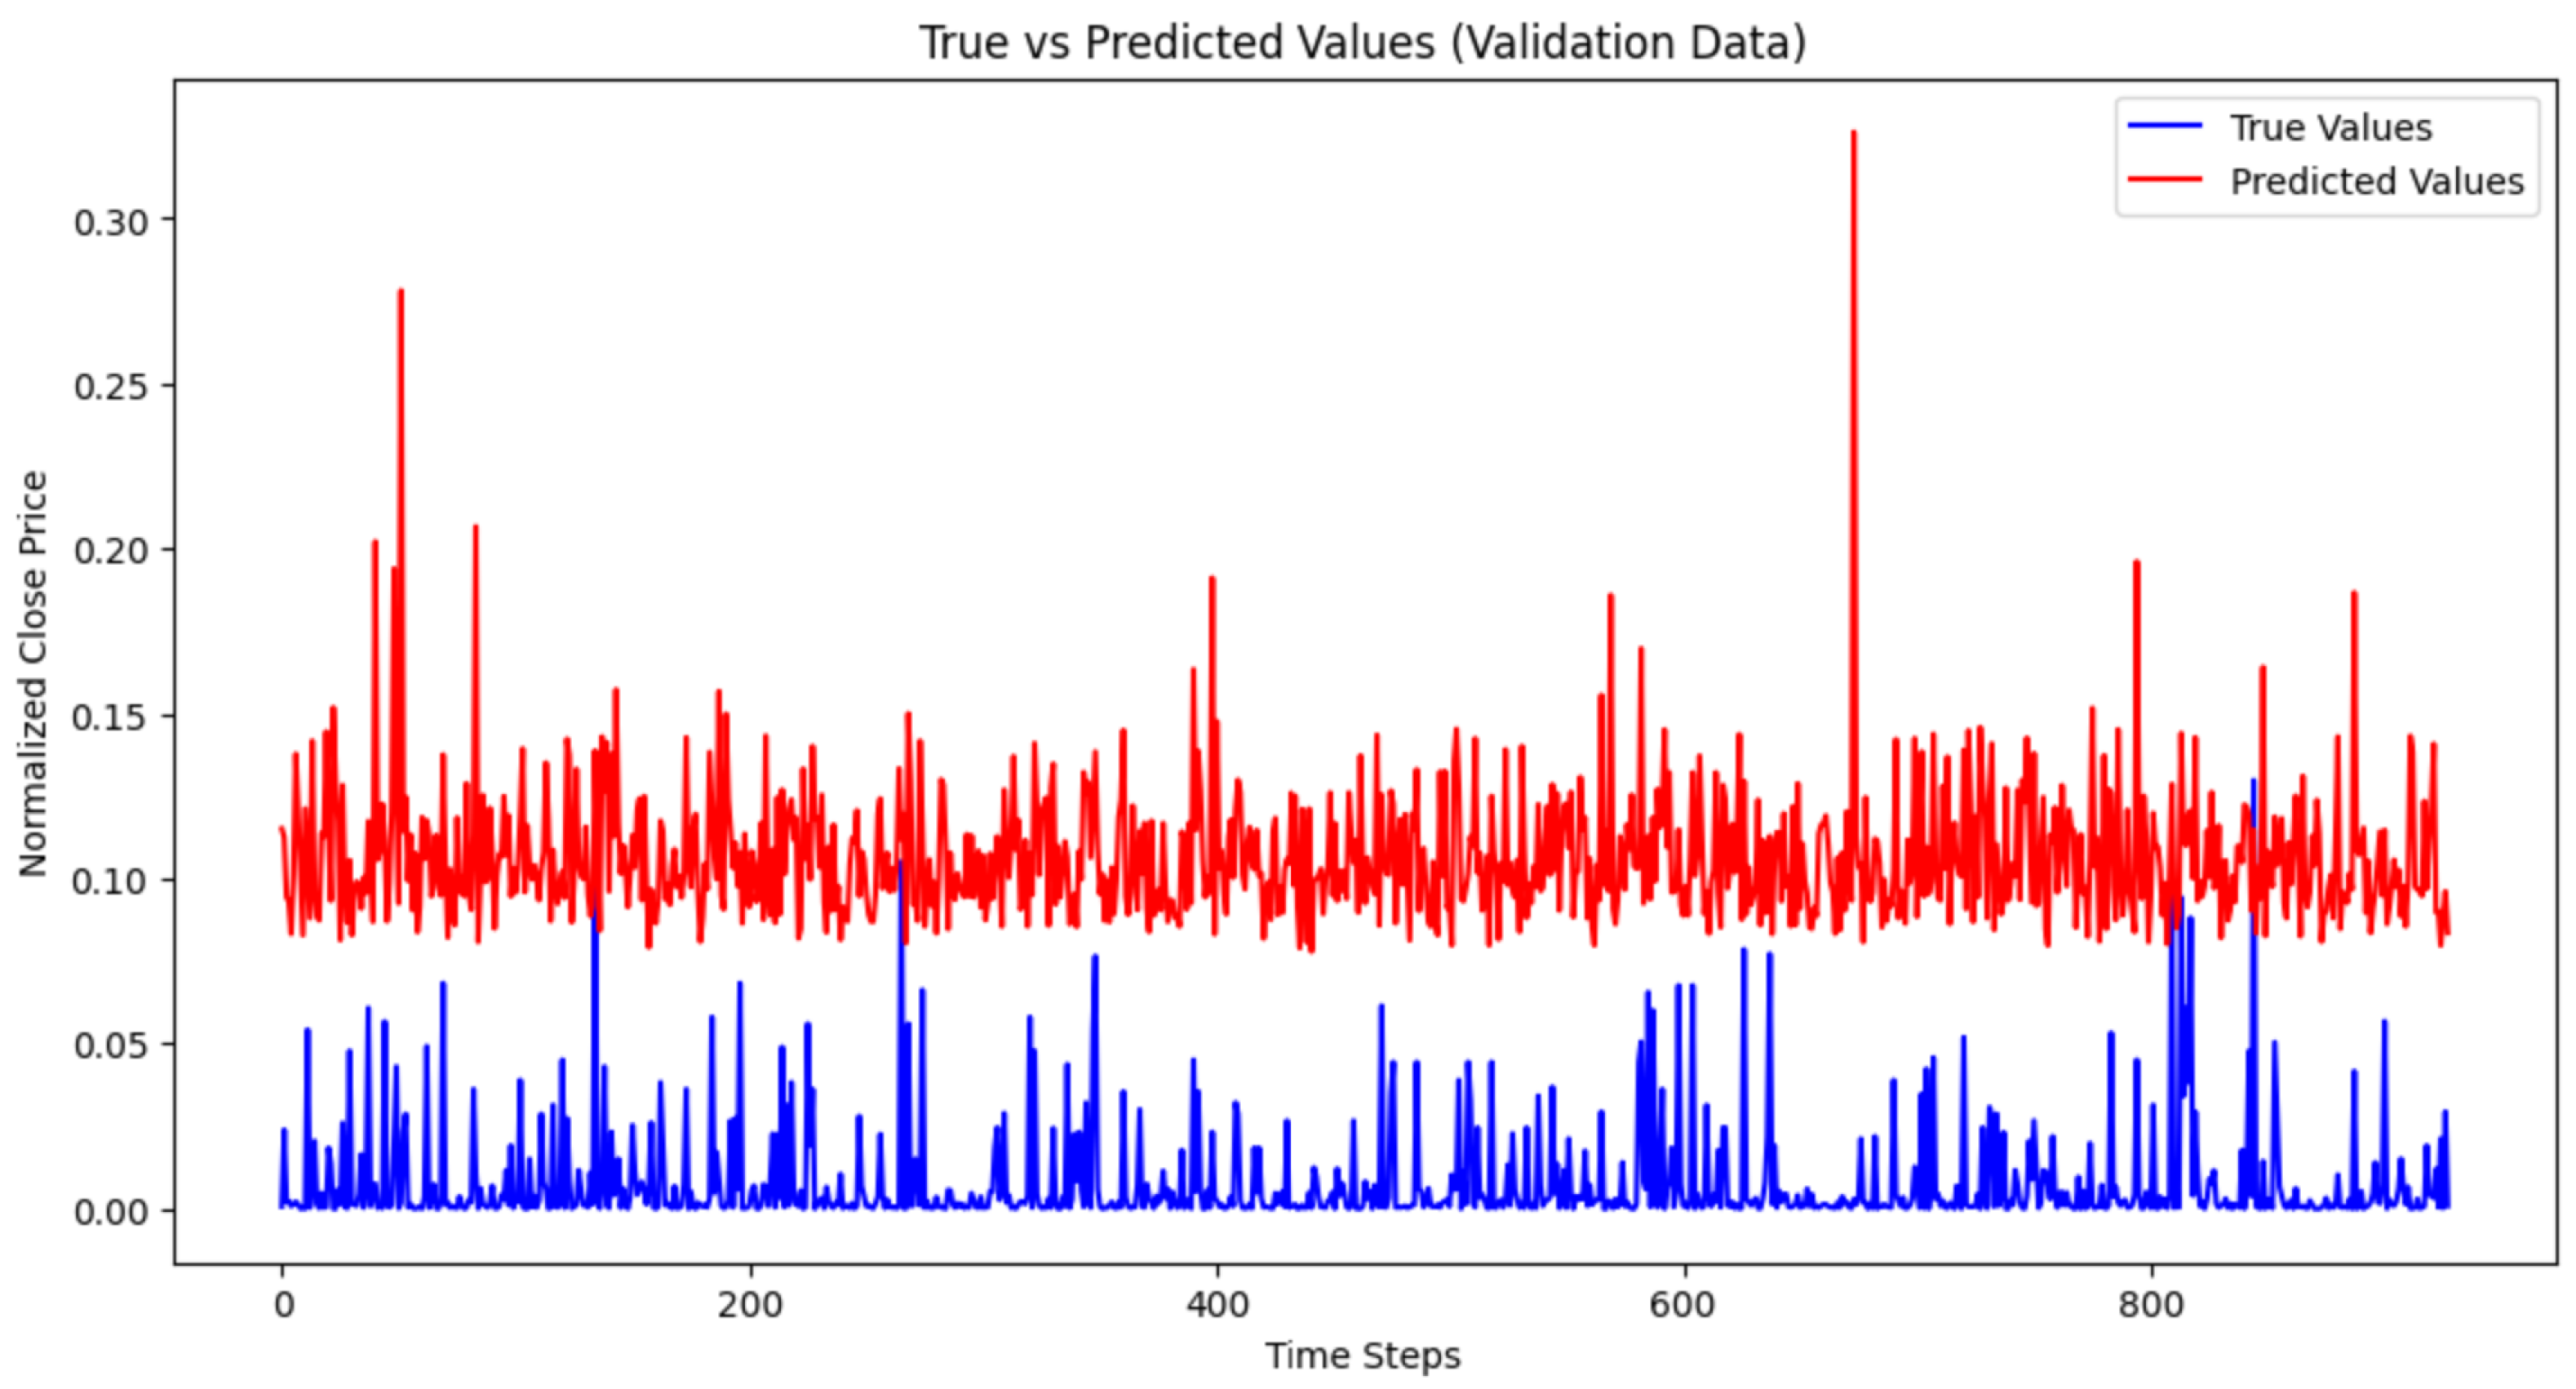
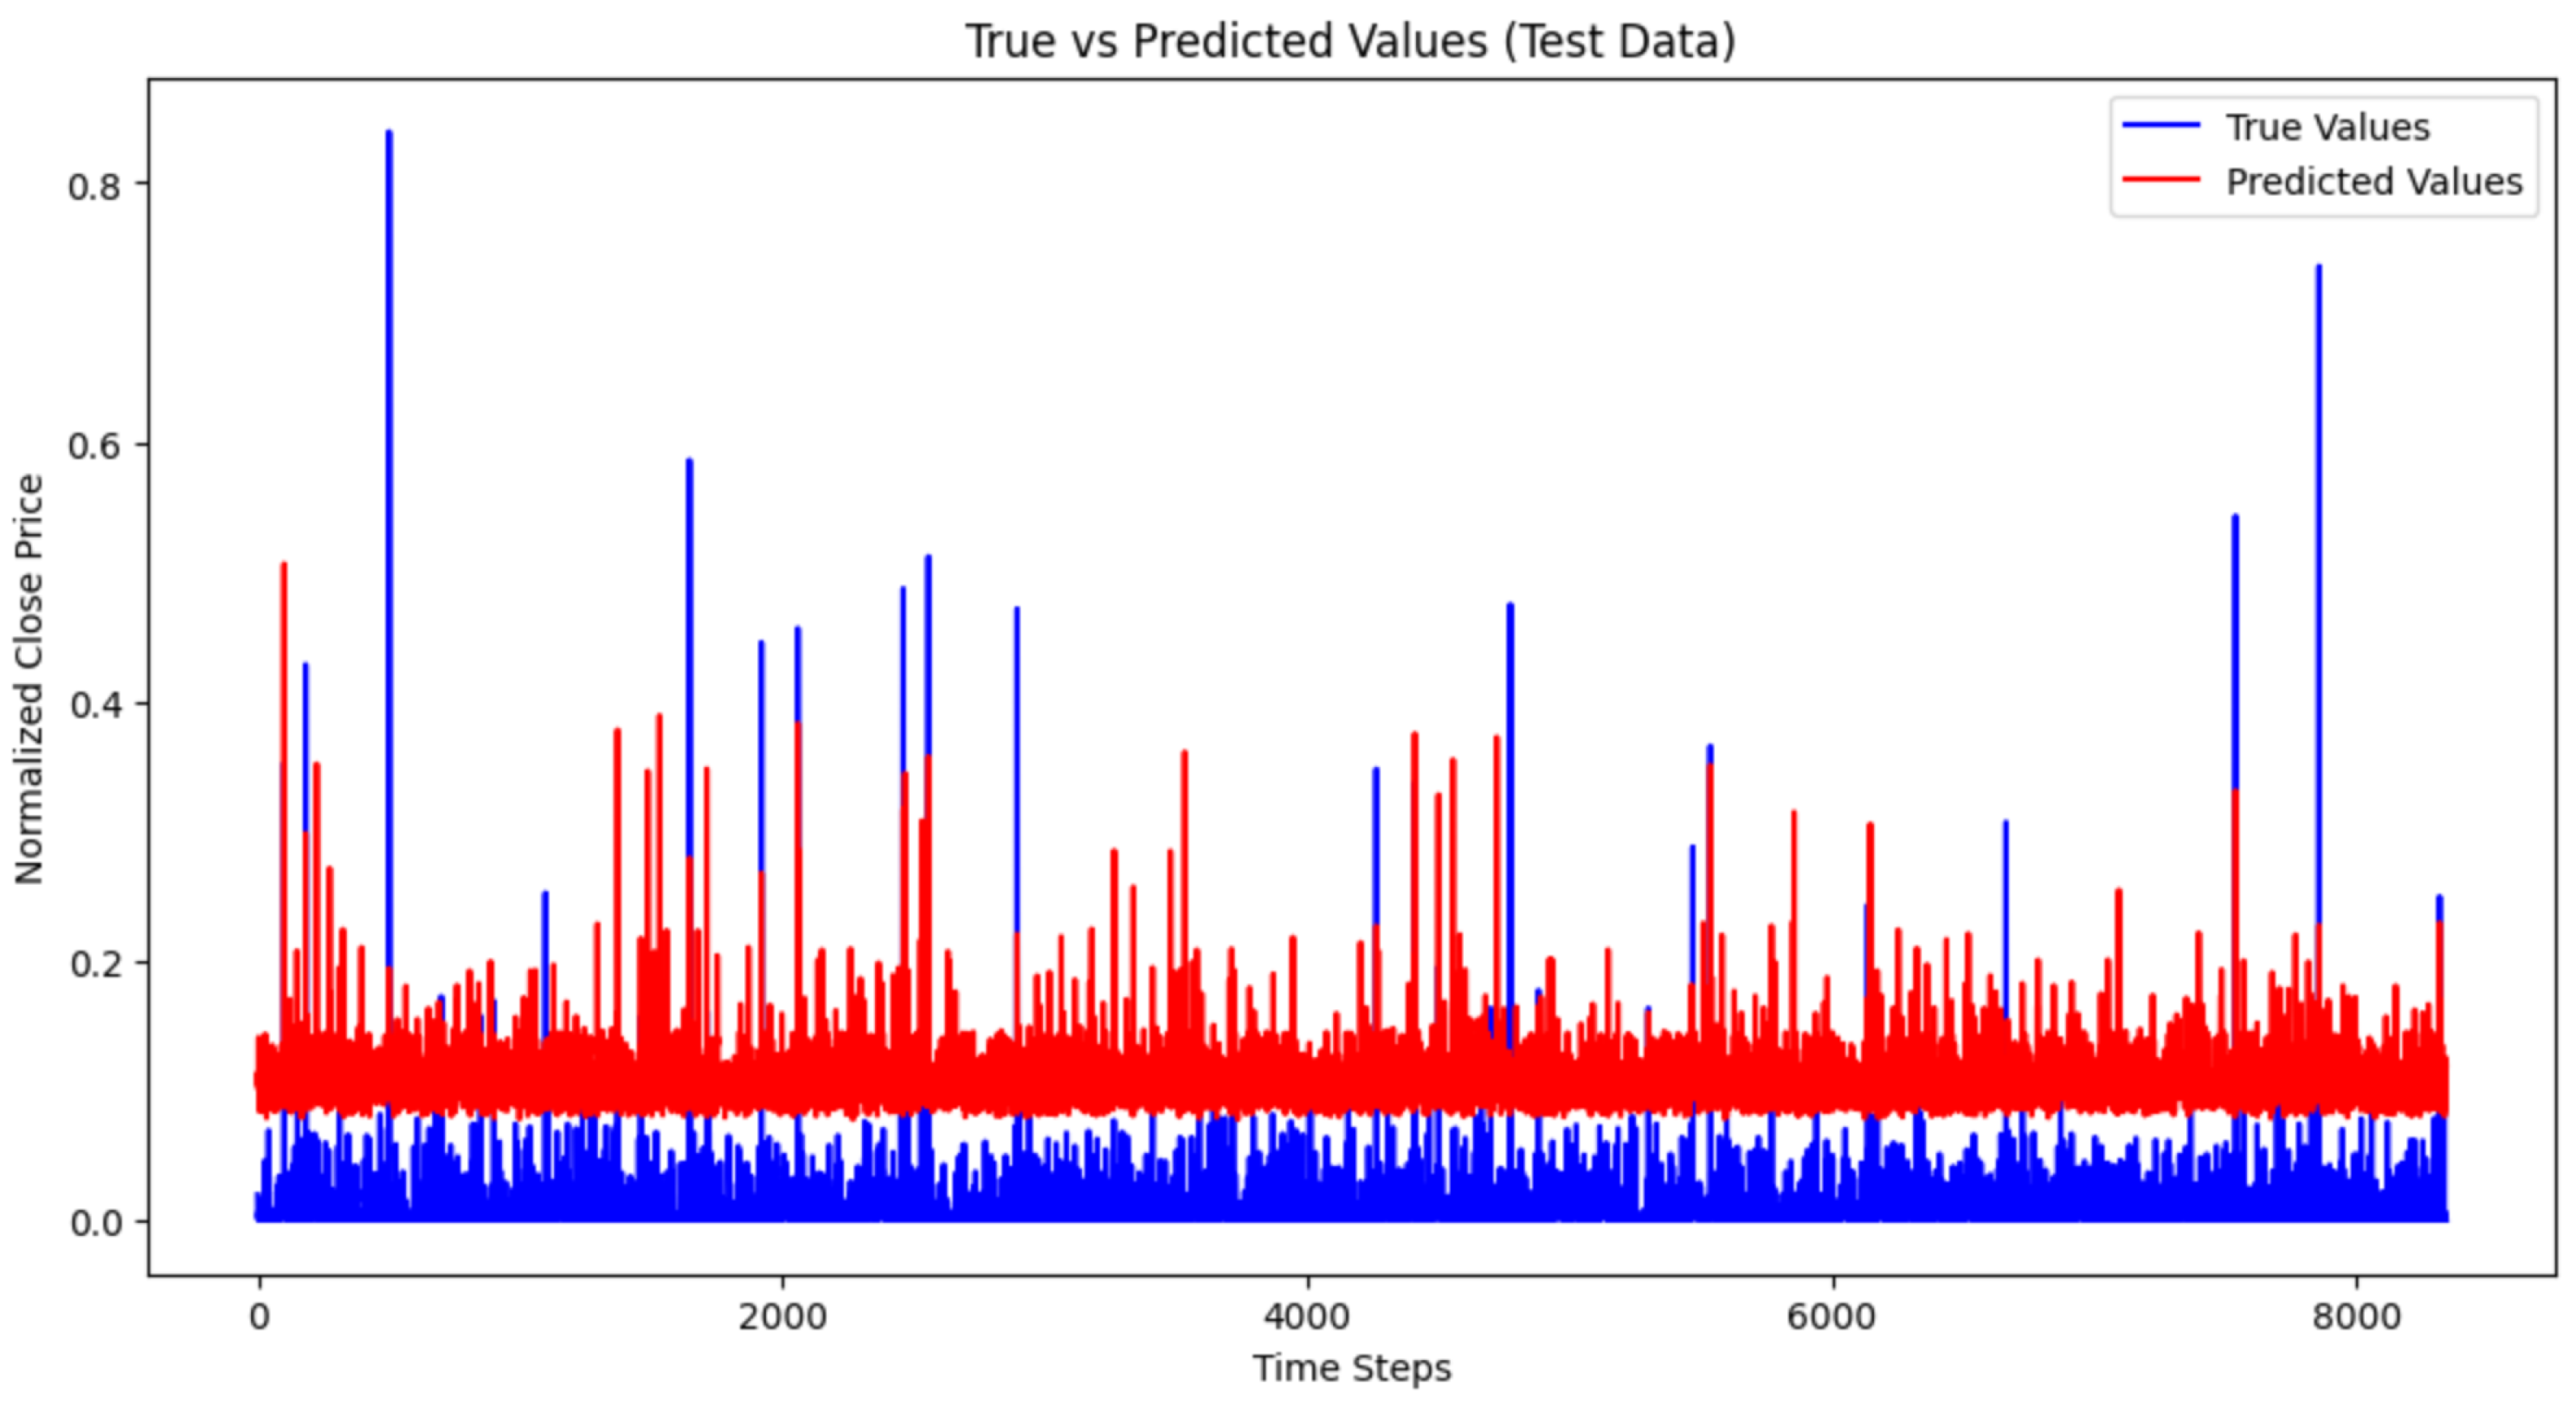
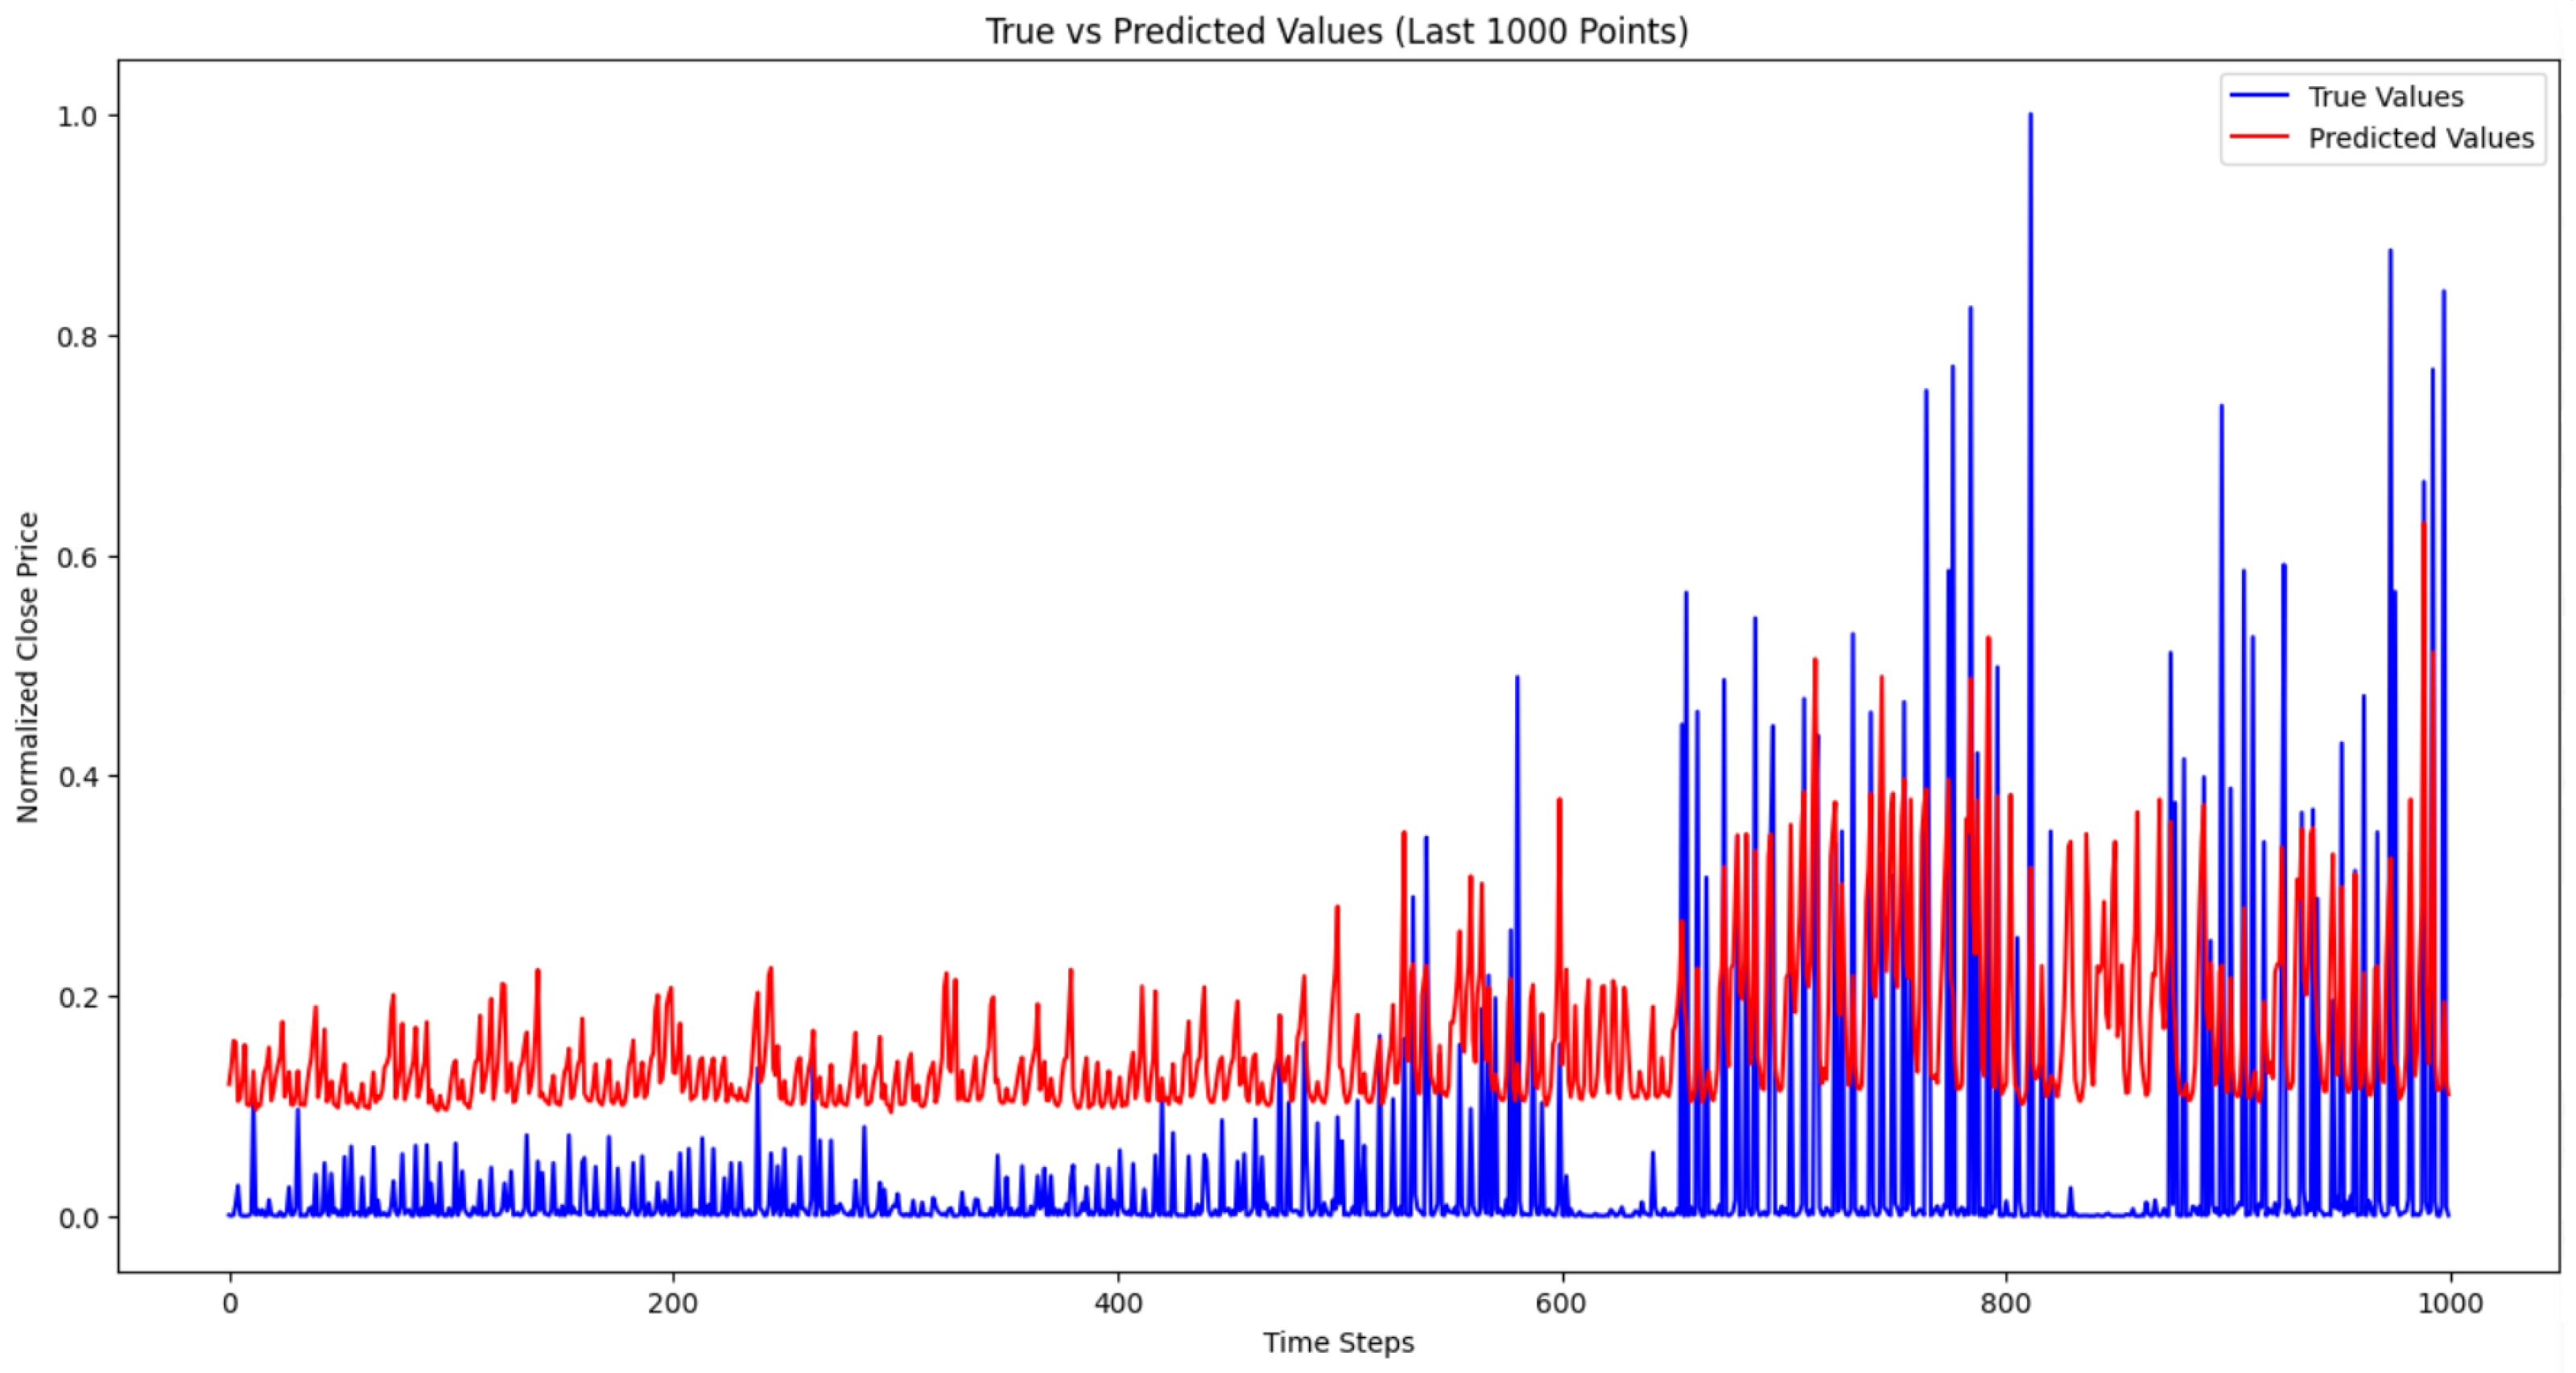
Table 3. The relatively smooth prediction trajectory reflects an intentional regularization effect induced by the LSTM–attention architecture, which prioritizes stable pattern learning over memorization of isolated spikes. The significant difference between the actual and predicted values from
Figure 5,
Figure 6,
Figure 7 and
Figure 8 might be influenced by sudden shifts in global supply and demand, unforeseen changes in production levels, or market interventions; for example, the government can set price controls and trade restrictions on various commodities that were not anticipated by our model.
Figure 6 illustrates the model performance on the validation dataset and provides evidence of strong generalization ability. The predicted values maintain a stable range relative to the actual series, with the prediction line exhibiting lower volatility than the observed prices. Importantly, this smoothing behavior is accompanied by nearly identical training and validation losses (approximately 0.0347), indicating that the model does not suffer from overfitting.
From a quantitative perspective, the error magnitudes during validation remain consistent with the training errors, suggesting that the learned temporal representations are transferable to unseen data. This stability confirms that the hybrid LSTM–MHA architecture captures persistent market dynamics rather than dataset-specific noise.
Figure 7 shows the model’s performance on the test dataset (approximately 8000 time steps). The predictions continue to track the overall price trajectory while systematically underestimating sharp price spikes. This effect is reflected in the slightly higher RMSE relative to MAE, indicating that large deviations during high-volatility episodes contribute disproportionately to squared error.
Rather than signaling poor performance, this behavior highlights a conservative forecasting bias, where the model emphasizes robustness and stability over extreme value prediction. Such behavior is common in deep learning models trained with mean squared error loss and reflects a bias–variance trade-off that favors smoother forecasts.
Figure 8 provides a focused examination of the final 1000 observations, a period characterized by elevated market volatility. During this regime, the divergence between actual and predicted values becomes more pronounced, particularly at sharp upward or downward price movements.
Quantitatively, the error contributions in this segment are dominated by a small number of extreme observations rather than persistent misalignment. The model continues to capture the direction and medium-term trend of prices but attenuates the amplitude of sudden shocks. This confirms that the smoothing observed in
Figure 5,
Figure 6 and
Figure 7 is not an artifact of aggregation but a structural characteristic of the model.
While this limits the model’s ability to predict rare price spikes, it enhances forecast stability and reduces sensitivity to noise, an important consideration for medium-term planning and risk management.
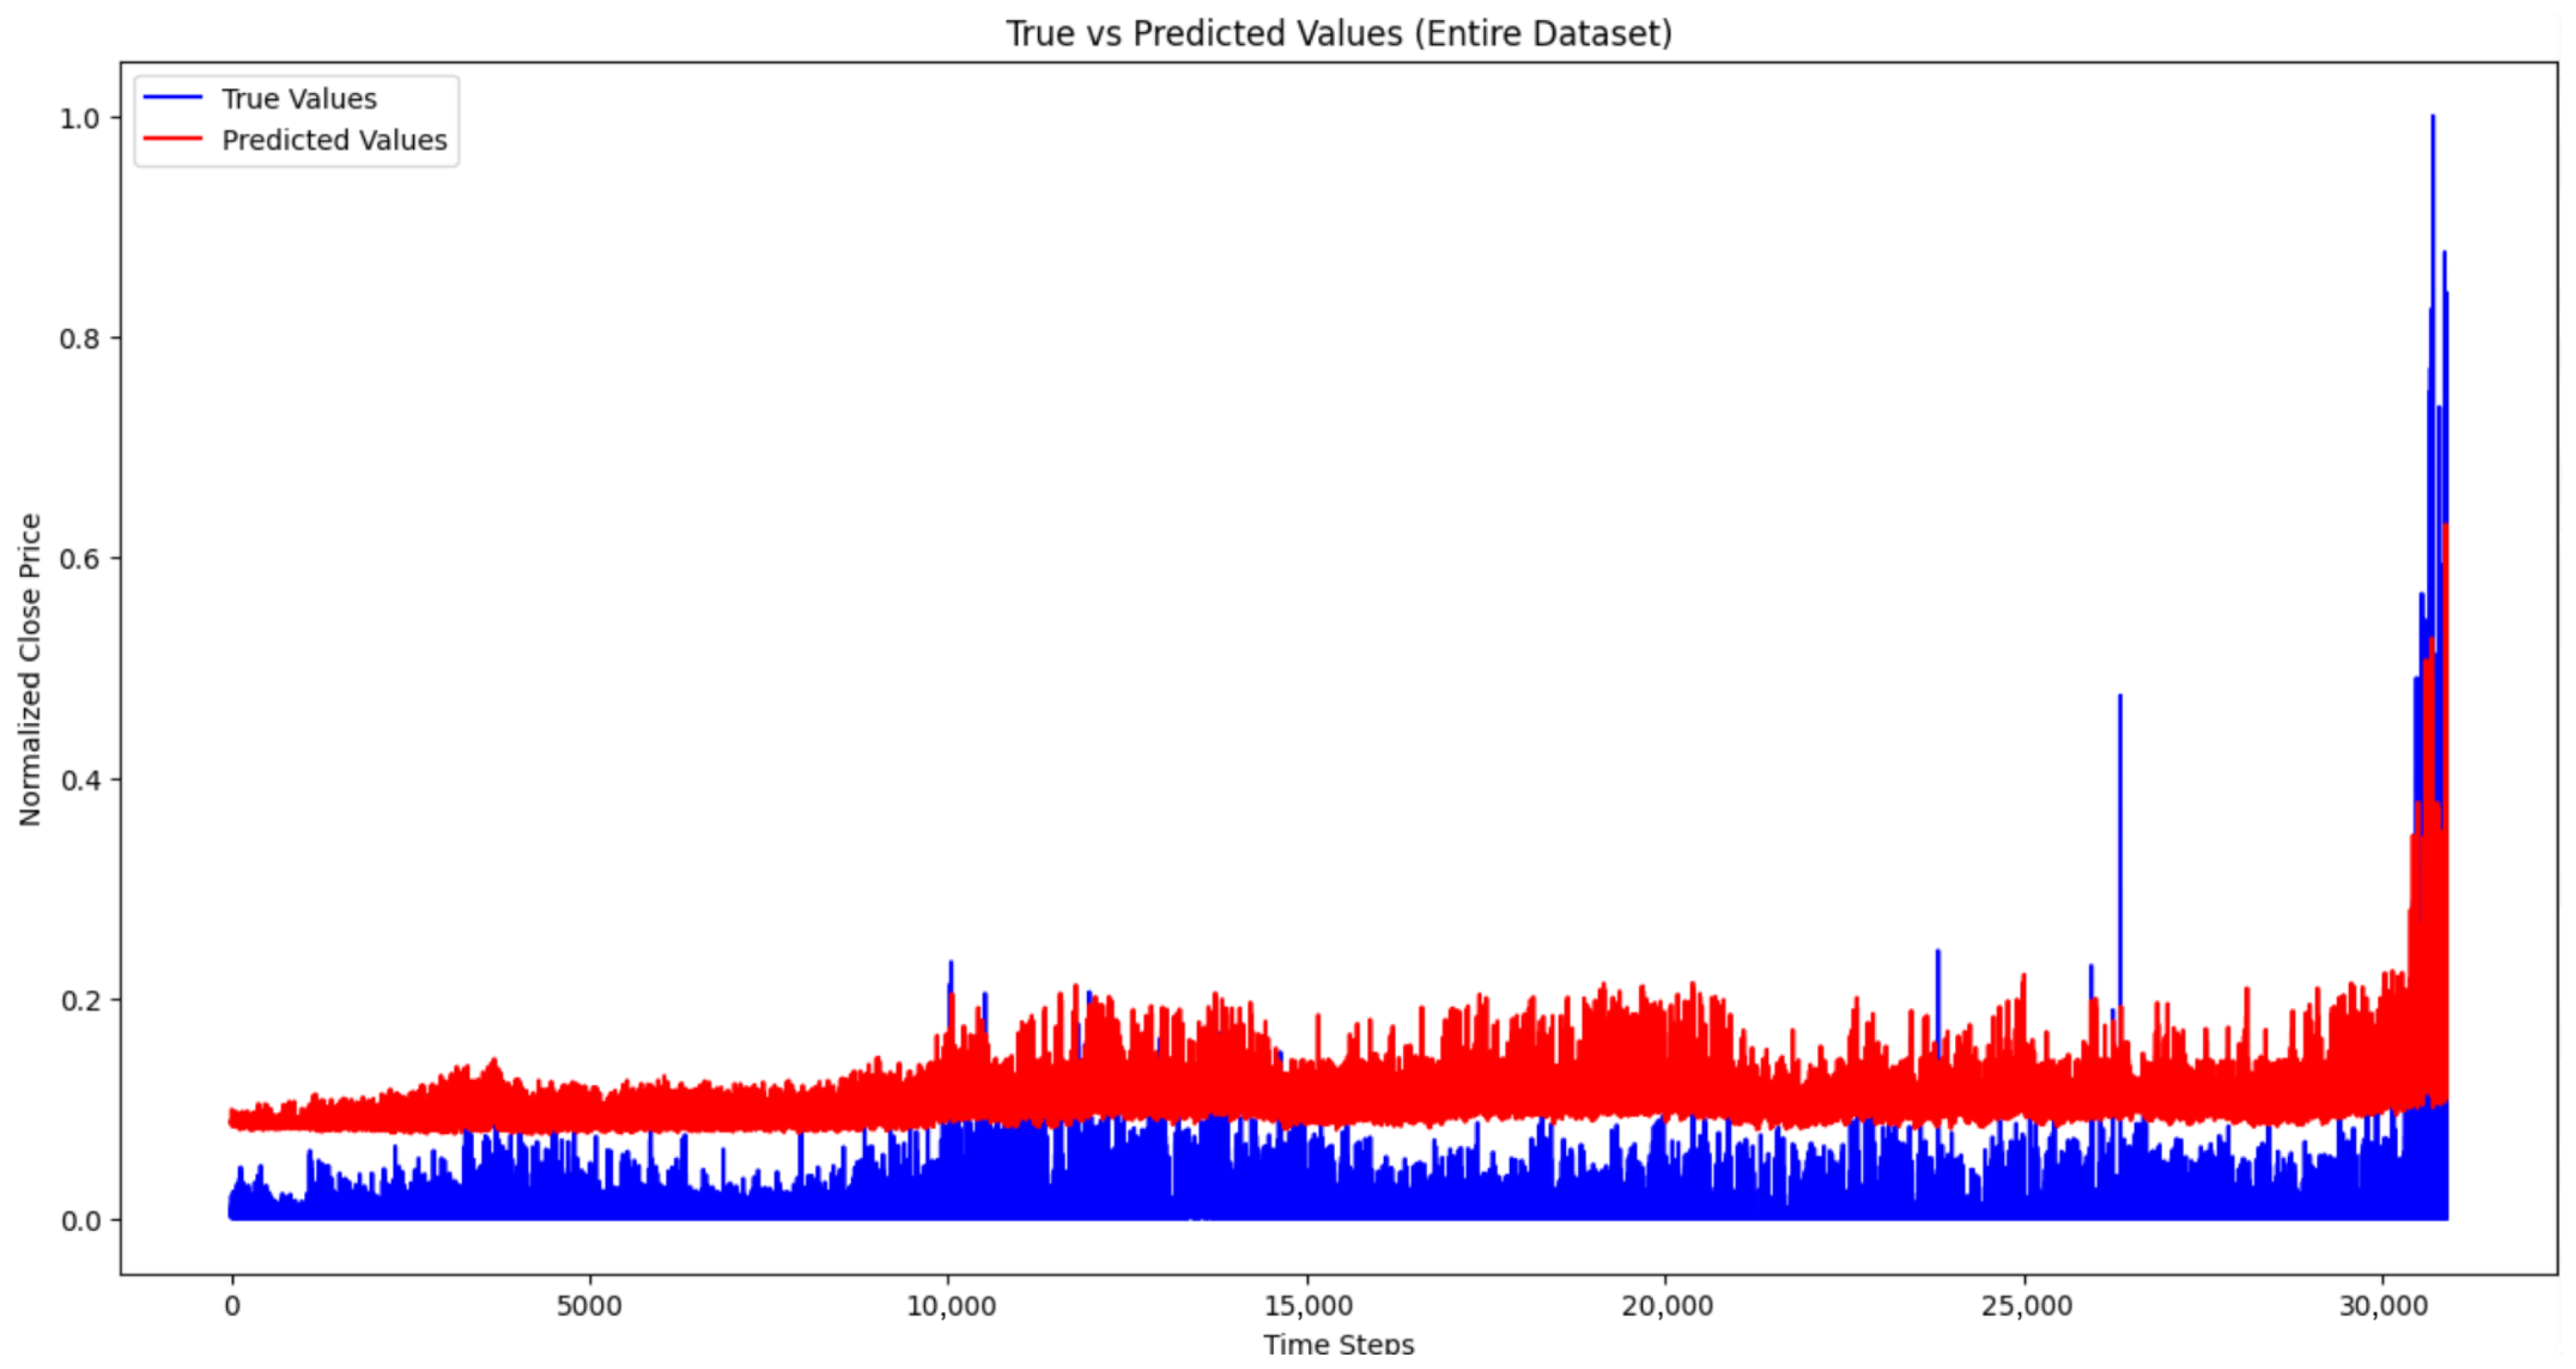
Figure 9 illustrates the LSTM–MHA model’s performance over the whole dataset, with the model (red line) constantly aligning with the overall trend of actual commodity prices (blue line). The predicted series consistently aligns with the long-run trend of actual prices, demonstrating strong baseline tracking capability. However, extreme price movements, particularly in later periods characterized by substantial volatility, are visibly dampened.
This global view reinforces the interpretation that the LSTM–MHA model is optimized for trend- and regime learning rather than precise tail-risk estimation. The attenuation of extreme values explains why the model achieves low average error metrics while still underestimating rare but economically significant price spikes.
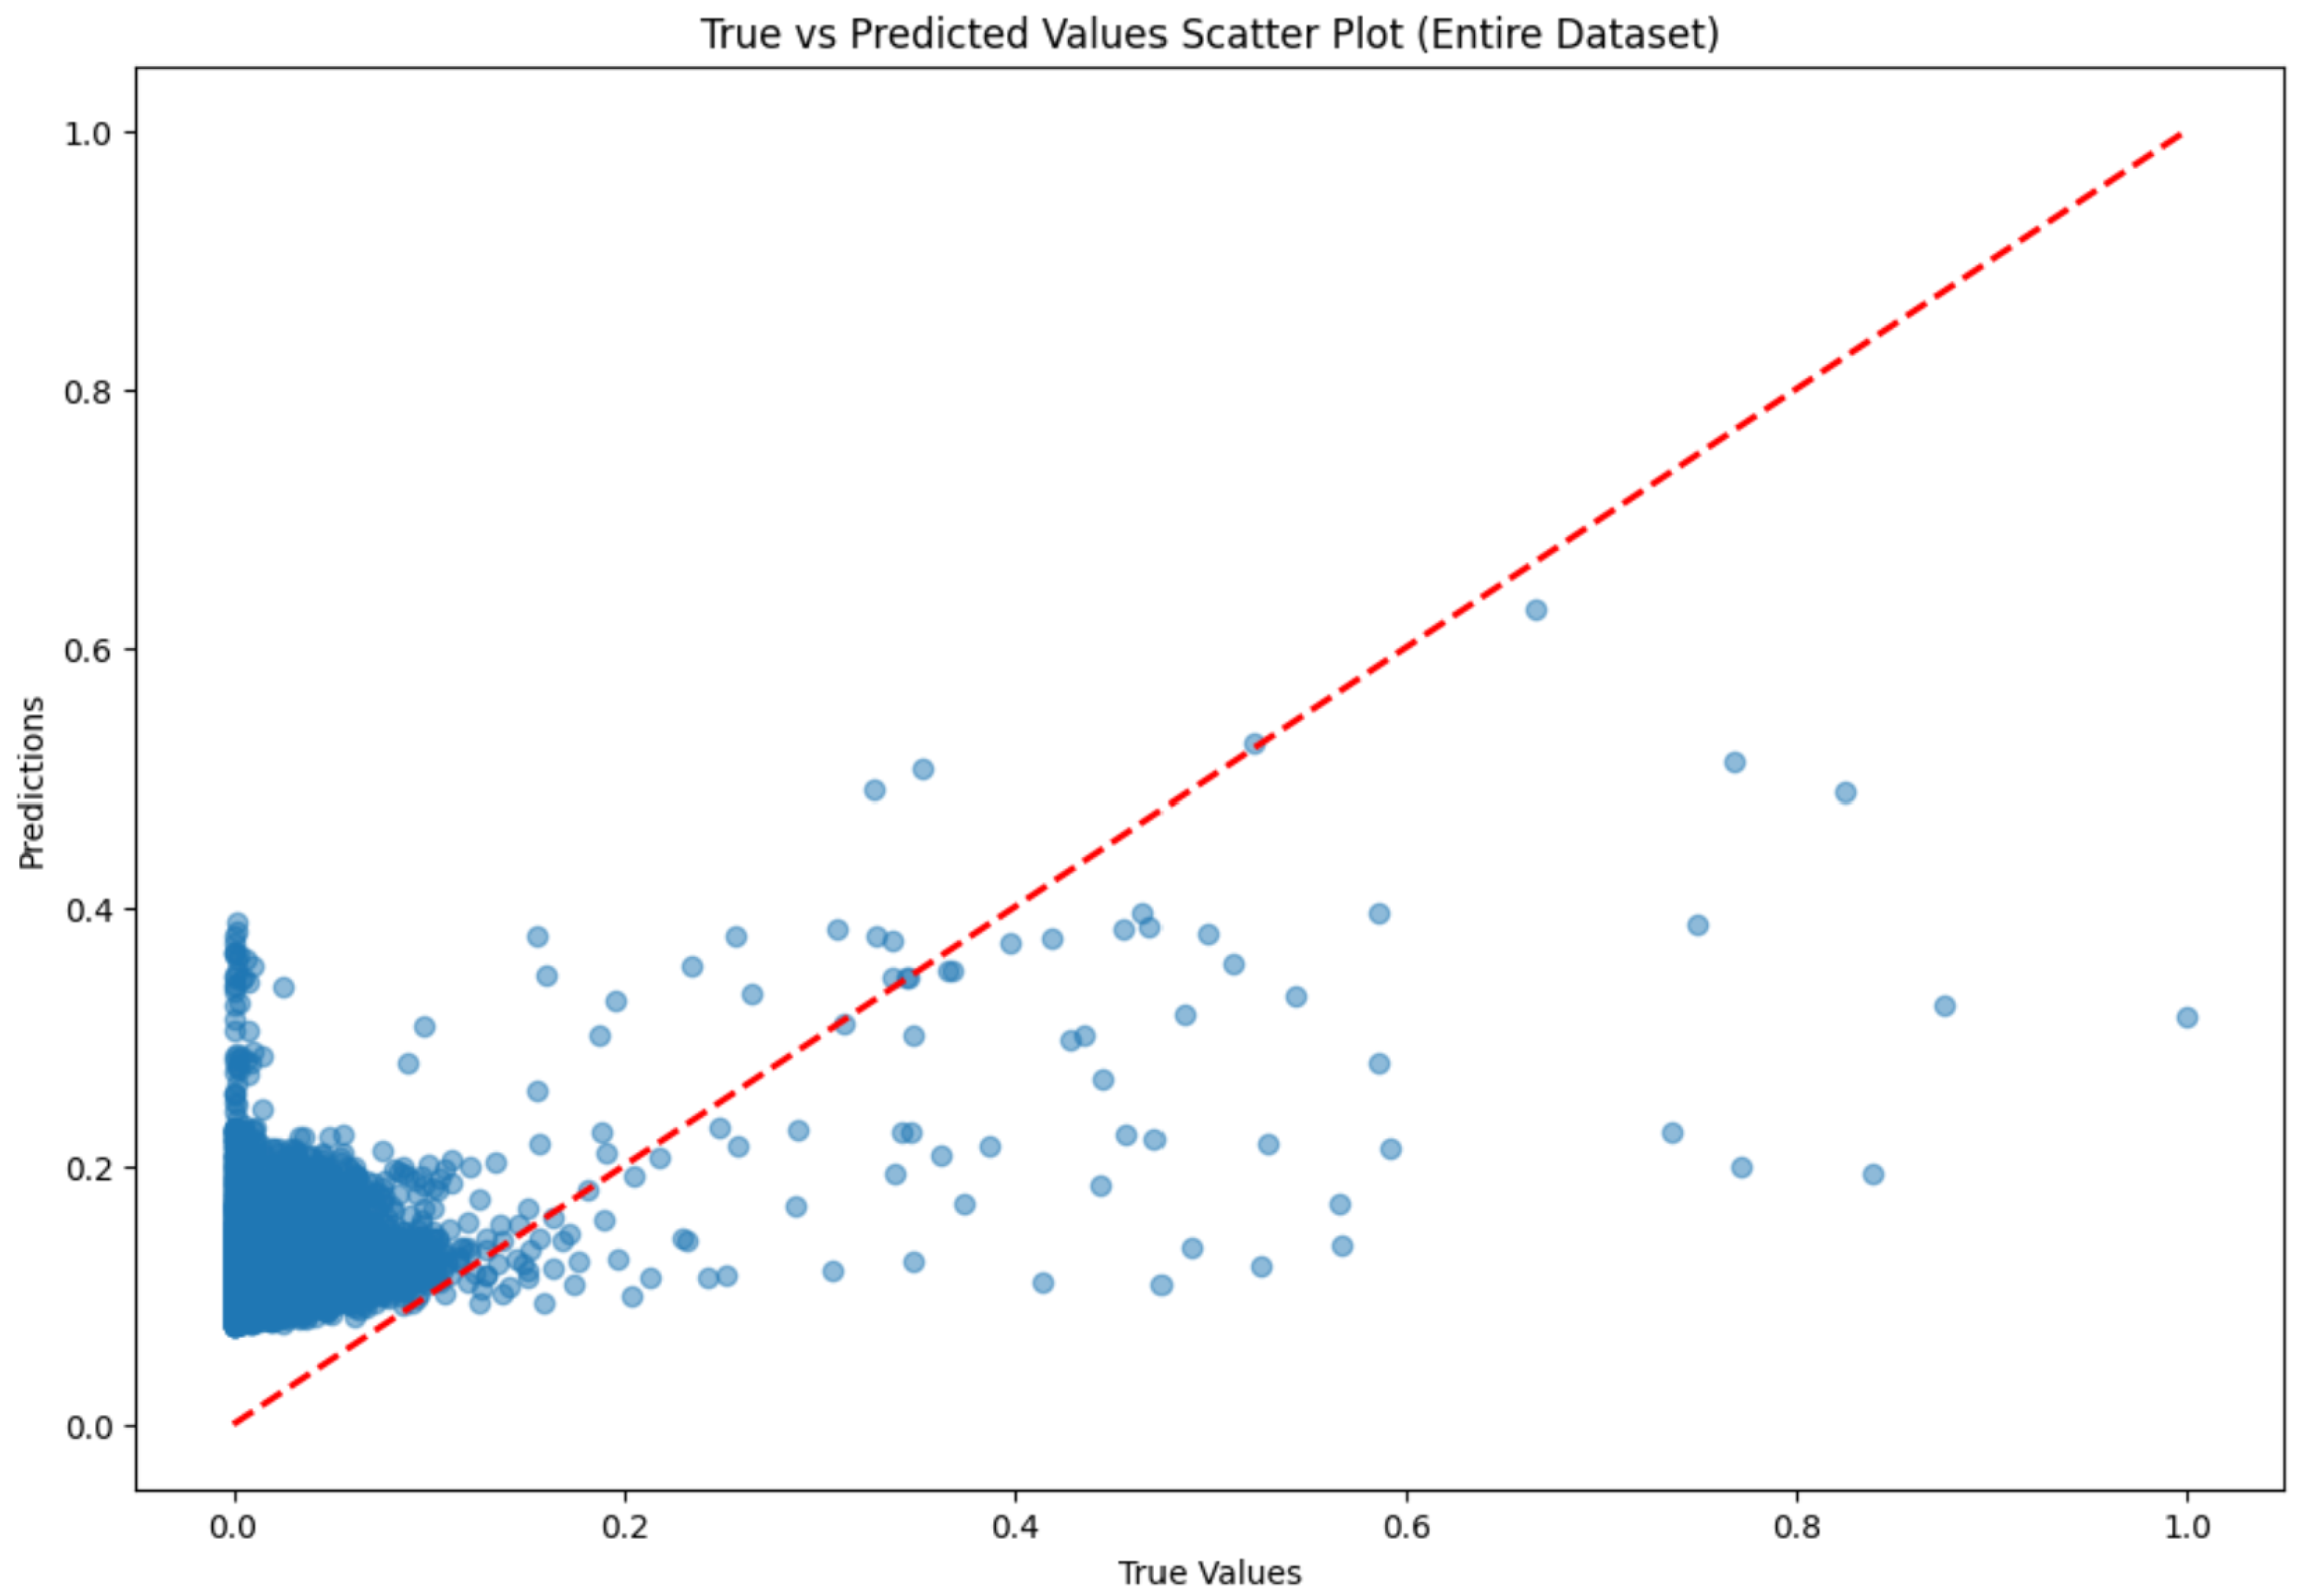
Figure 10 provides significant insights into its prediction abilities. The majority of data points aggregate in the lower range (0.0–0.4) of both true and forecasted values, with a notable concentration between 0.0 and 0.2, signifying that most commodity price fluctuations transpire within this normalized range. The red dashed line denotes the optimal prediction line (y = x), and the model exhibits strong performance at lower values, with points closely aligned to this line. Nonetheless, it exhibits escalating divergence at elevated levels, frequently underestimating them, especially for actual values beyond 0.4. The distribution exhibits right skewness, indicating that high price spikes are infrequent. The model demonstrates accuracy within usual price ranges while adopting a cautious approach to predicting outlier events, hence ensuring reliable forecasts for standard trading scenarios.
4.2. Hyperparameter Analysis
In optimizing the hyperparameters of our proposed LSTM–multi-head attention (LSTM–MHA) model, we examined several configurations concerning epochs, learning rates, and batch sizes. The analysis focuses on evaluating the influence of these parameters on the model’s predictive accuracy using metrics such as mean squared error (MSE), root mean squared error (RMSE), and root mean absolute error (RMAE). The dataset utilized for this experiment consists of agricultural commodity futures data [
56] from Kaggle.
We examine the distinct epochs outlined in
Table 3, noting that Epoch 50 produced training and validation losses of roughly 0.0340, accompanied by a test loss nearing 0.034. The MSE, RMSE, and RMAE figures demonstrate reduced error rates, indicating that this epoch setting achieves a balance between underfitting and overfitting. At Epoch 100, the stability of training and validation losses is enhanced, with each approximately 0.0347. The MSE and RMSE values exhibited negligible fluctuation relative to Epoch 50, indicating the model’s stability over training rounds. Epoch 150 did not markedly enhance the loss values compared to Epoch 100, exhibiting only minor increases in both test and training loss parameters. The stability observed with increased epochs indicates that performance improvements peak at 100, suggesting declining returns on prediction accuracy with additional epoch increments.
Similarly, we examine the learning rates as outlined below: A learning rate of 0.001 ensured steady training and validation loss values across the epochs, allowing the model to converge well without substantial changes. A learning rate of 0.01 exhibited comparable stability patterns, although there were minor increases in validation loss values, suggesting the potential for modest overfitting as the learning rate escalated. The learning rate of 0.1 was less effective as the validation loss exhibited increased volatility, indicating that elevated learning rates may cause instability and impede optimal model convergence.
The batch sizes are examined: A batch size of 64 yielded the optimal balance between accuracy and computational efficiency, demonstrating consistent validation and training losses over the epochs. Batch size 128 yielded results comparable to batch size 64, exhibiting low variation in training and test loss metrics. Concurrently, a batch size of 256 exhibited a minor decline in performance as the batch size escalated, resulting in slightly elevated losses. Larger batch sizes may diminish model generalizability, potentially due to inadequate changes in the model weights.
4.3. Comparison with Baseline Models
The proposed LSTM–MHA model exhibits higher performance across all the assessment measures, indicating that the attention mechanism significantly increases the fundamental capabilities of the LSTM architecture in time-series forecasting. The proposed LSTM–MHA model exhibits the lowest errors across all the measures, with errors around 3–4 times lower than those of complicated models and markedly superior to hybrid techniques, as demonstrated in
Table 4.
To ensure fair and transparent comparison with existing studies, the same set of evaluation metrics, mean squared error (MSE), root mean squared error (RMSE), and mean absolute error (MAE), were consistently employed throughout the comparative analysis. These metrics are the most widely reported performance measures in the agricultural commodity price forecasting literature and are explicitly provided in the majority of the benchmark studies included in
Table 4. Using a common set of metrics allows direct numerical comparison without introducing additional sources of bias arising from metric-specific sensitivities.
Moreover, MSE and RMSE emphasize large deviations and are therefore sensitive to extreme forecasting errors, which is particularly relevant in volatile commodity markets, while MAE provides a complementary measure of average absolute deviation that is more robust to outliers. The combined use of these three metrics enables a balanced assessment of both average forecasting accuracy and error dispersion.
It is important to note that some benchmark studies report only a subset of these metrics, which is reflected by the missing values in
Table 4. In such cases, we refrain from imputing or recomputing unreported metrics to avoid methodological inconsistency. Consequently, the comparison is restricted to the metrics explicitly reported in the sources, and missing entries are clearly indicated. This approach prioritizes transparency and reproducibility over exhaustive but potentially misleading metric harmonization.
However, the reported performance differences should be interpreted in terms of relative magnitude rather than absolute equivalence across datasets.
4.4. Ablation Study and Model Comparison
An ablation study was conducted to evaluate the individual and combined contributions of the LSTM and attention components. Three model variants were considered: a standalone LSTM model, an attention-only model, and the proposed hybrid LSTM–MHA architecture. Performance was evaluated using mean squared error (MSE), root mean squared error (RMSE), and mean absolute error (MAE).
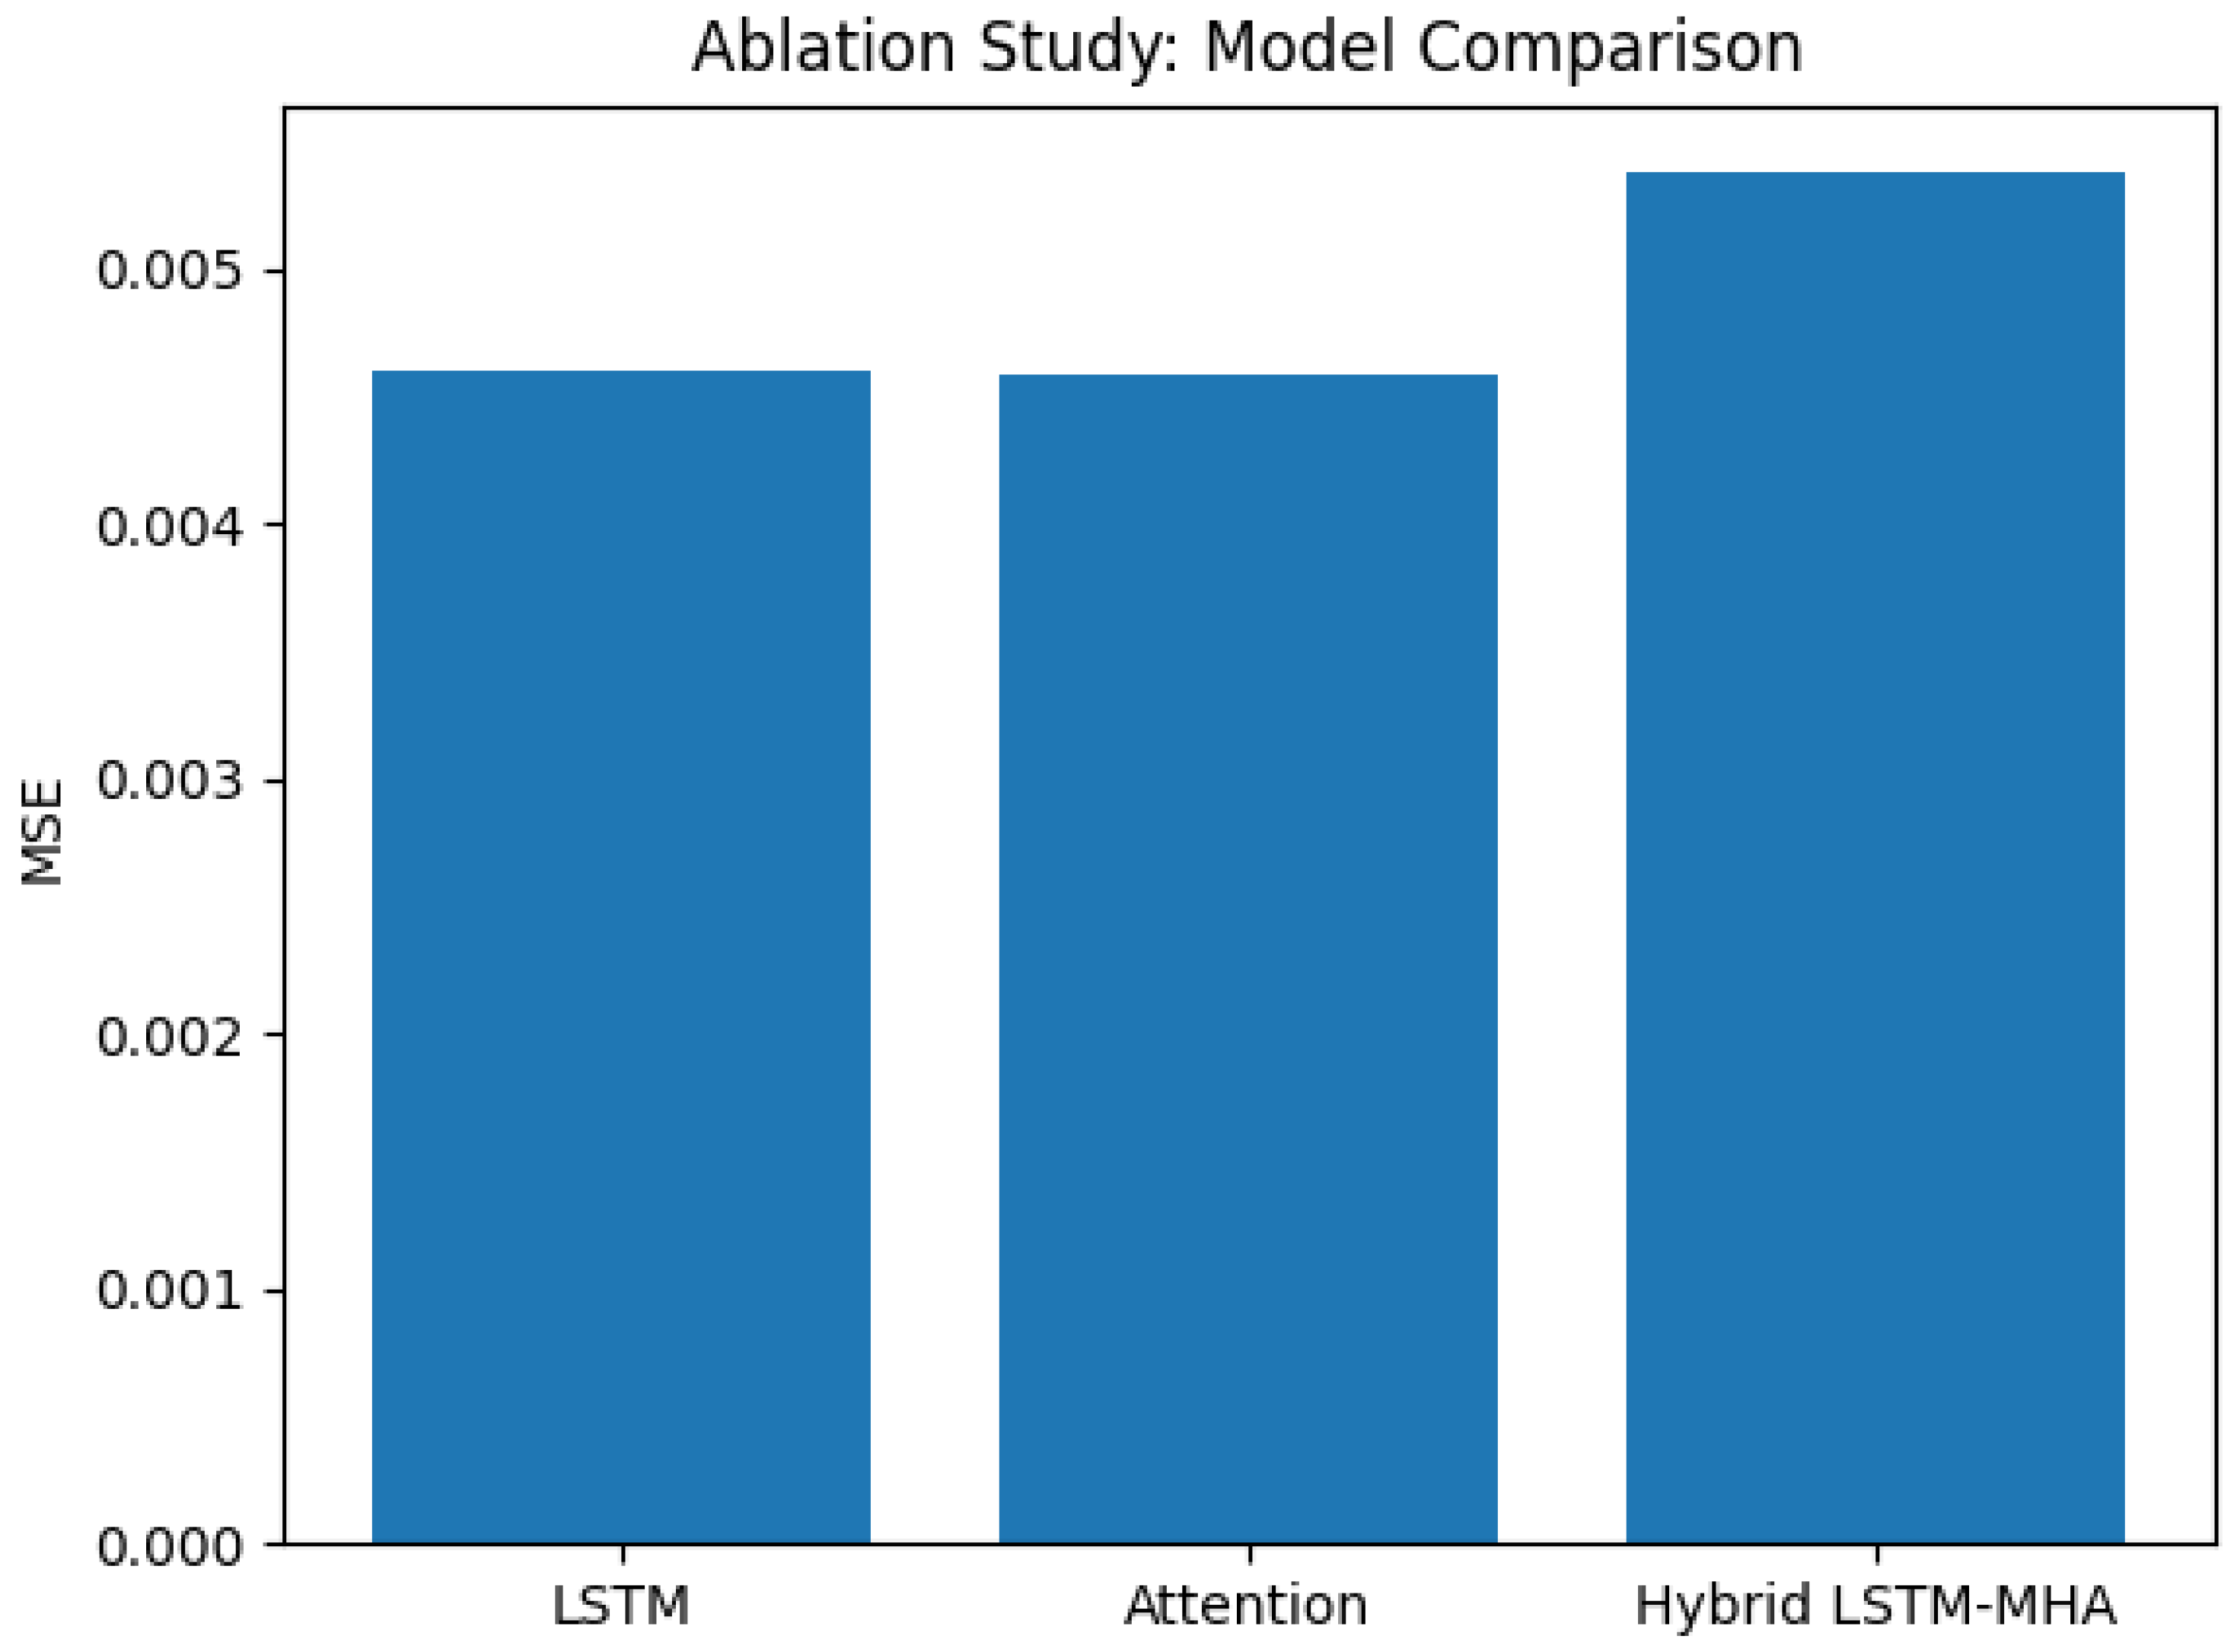
Table 5 summarizes the forecasting errors across the three architectures. The standalone LSTM and attention-only models achieve nearly identical MSE values (0.0046), indicating comparable predictive accuracy under the current experimental setup. In contrast, the hybrid LSTM–MHA model exhibits a slightly higher MSE of 0.0054, along with marginally higher RMSE and MAE values.
These results suggest that the incorporation of multi-head attention does not automatically translate into lower average forecasting error, particularly in a low-dimensional price-driven setting. Instead, the hybrid architecture appears to trade a small degree of numerical accuracy for increased model expressiveness and interpretability. The higher RMSE observed for the hybrid model reflects a more conservative forecasting behavior, characterized by smoother predictions and reduced sensitivity to extreme price fluctuations.
This behavior aligns with the attention analysis and highlights an important bias–variance trade-off. While smoothing may lead to underestimation of sharp price spikes, it can also enhance forecast stability under noisy market conditions. Consequently, the hybrid model’s value lies not solely in minimizing point forecast error but in providing structural insights into temporal relevance, which can be particularly useful for policy analysis and medium-term planning.
The MSE in
Figure 11 visually confirms the numerical results. The LSTM and attention-only models achieve nearly identical MSE values, while the hybrid LSTM–MHA model exhibits a modest increase in error.
Rather than indicating model inferiority, this result should be interpreted as evidence that attention mechanisms do not automatically improve forecasting accuracy when used as an architectural add-on, especially in relatively low-dimensional price-driven settings. Their primary contribution lies in interpretability and structural flexibility, which become more valuable when additional exogenous features (for instance, weather, exchange rates, or policy indicators) are incorporated.
4.5. Attention-Based Lag Importance Analysis
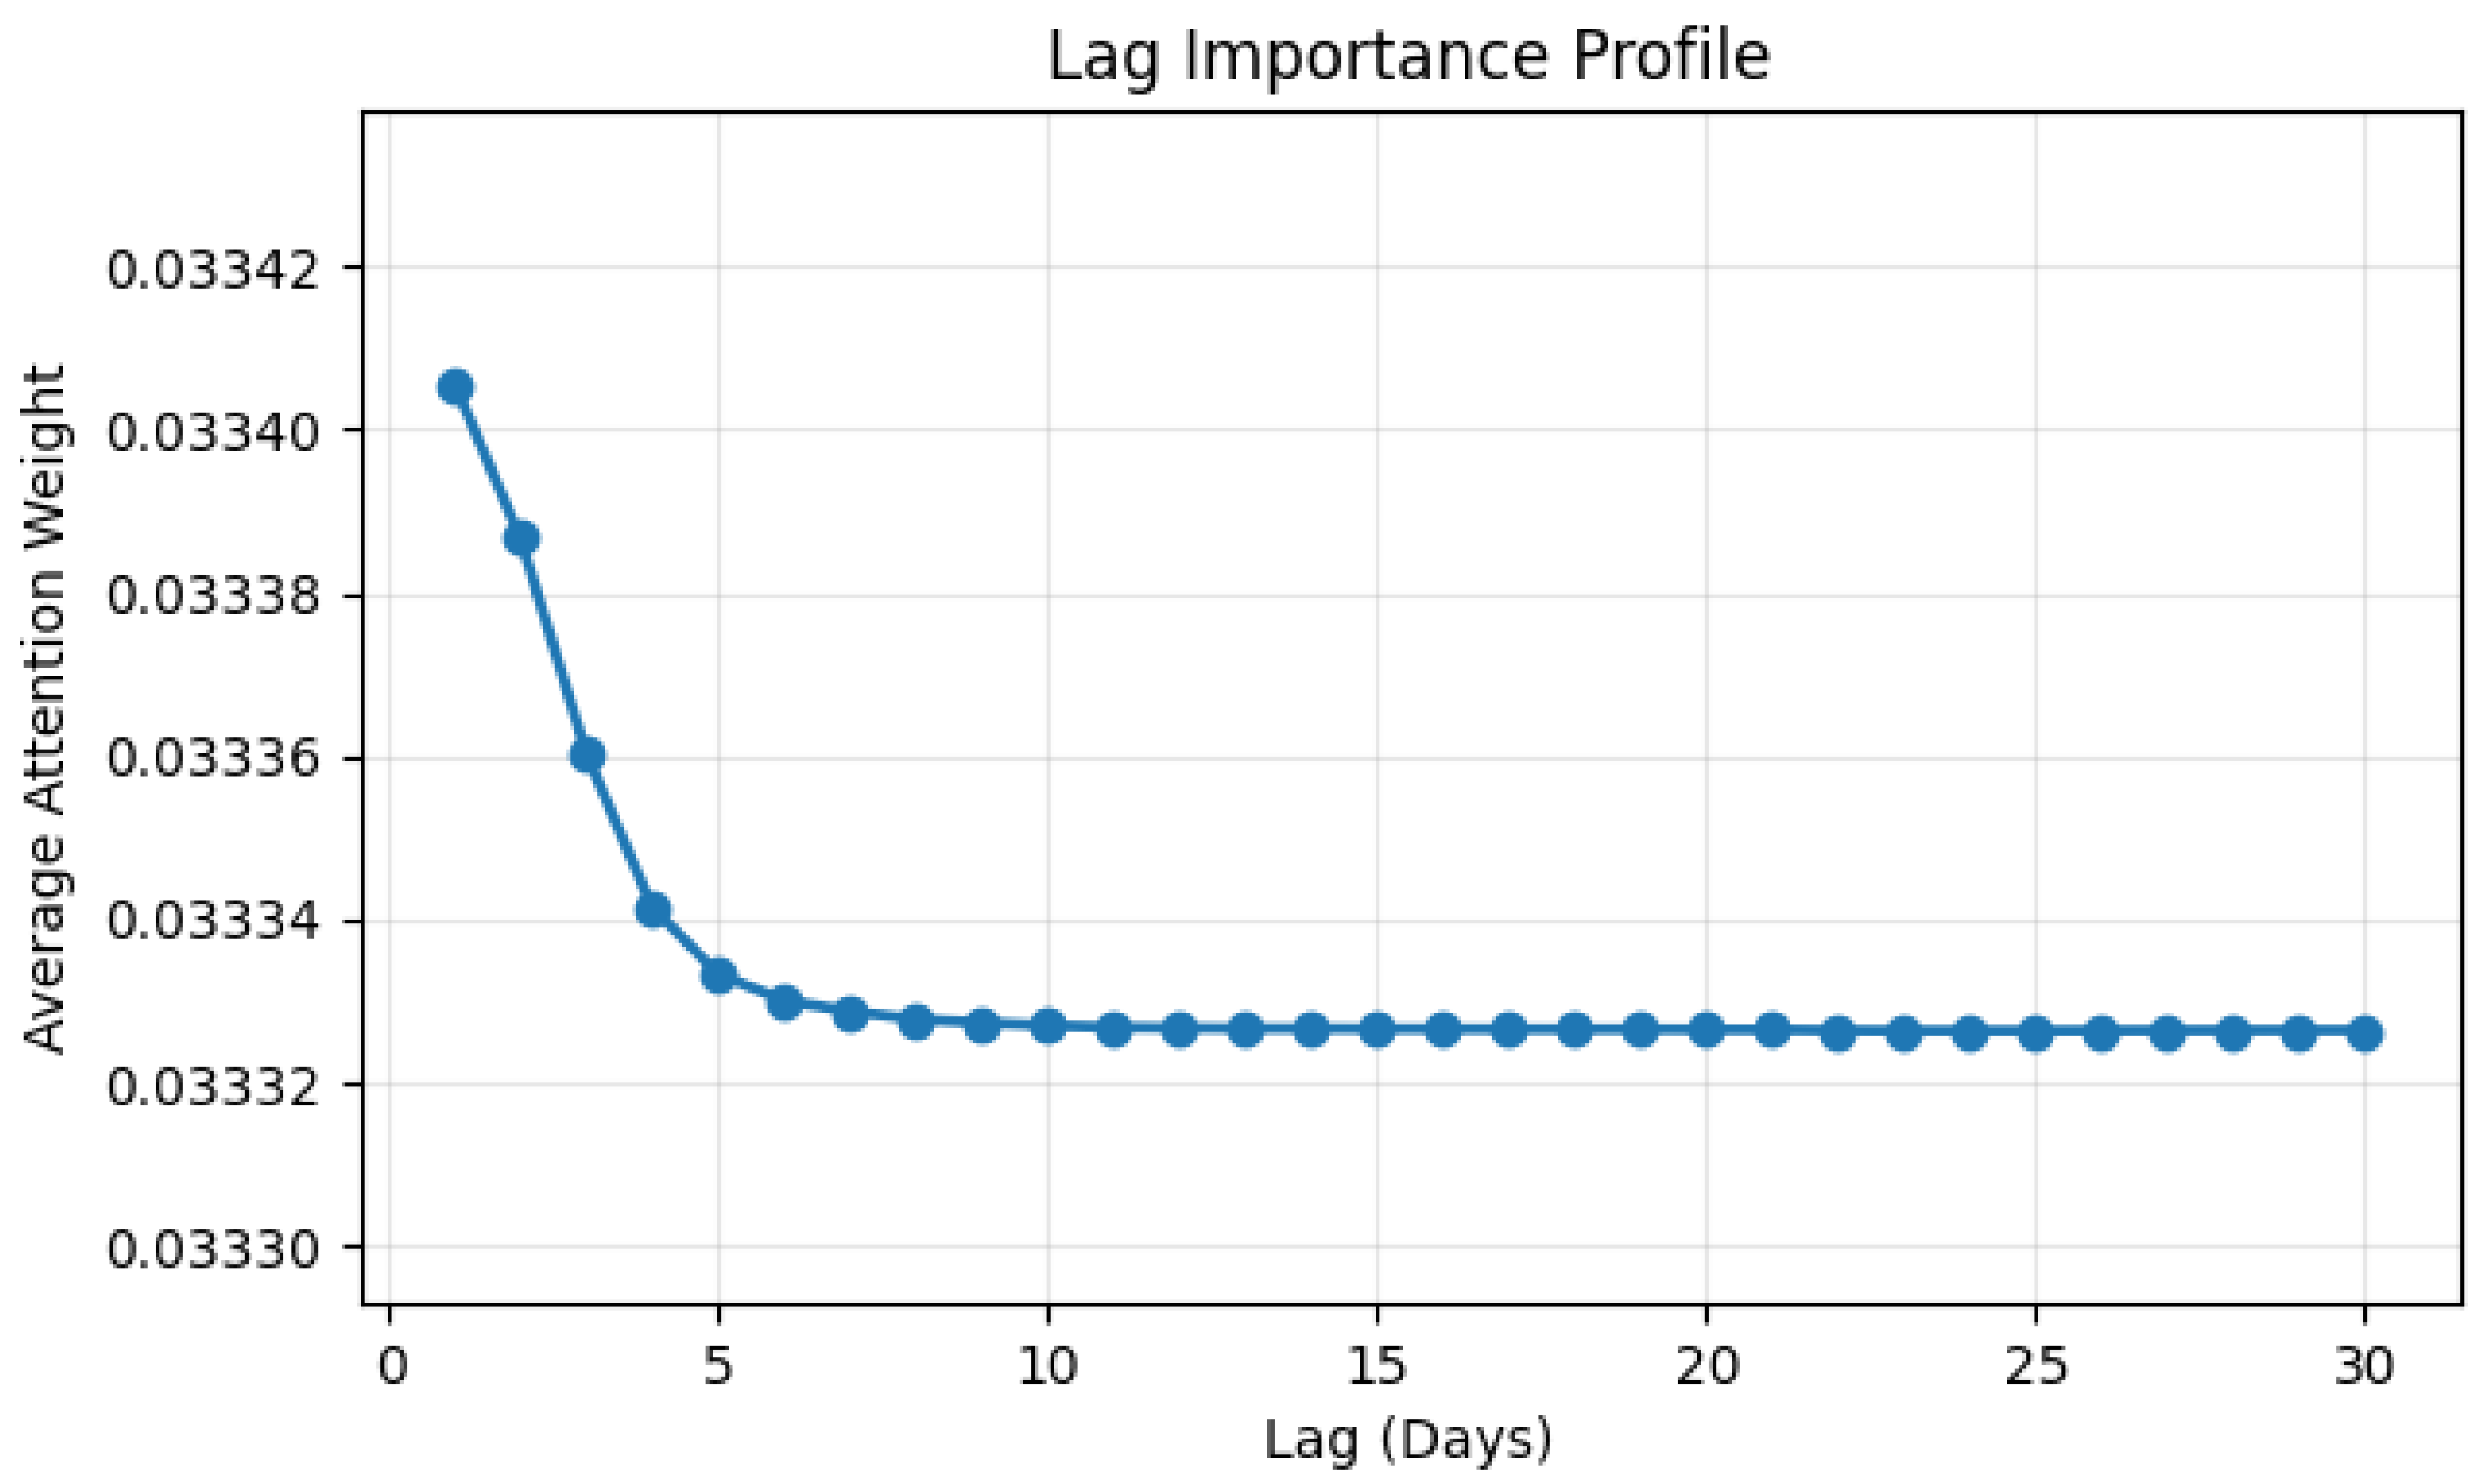
To enhance the interpretability of the proposed hybrid LSTM–multi-head attention (LSTM–MHA) model, we analyze the distribution of attention weights assigned to historical lags. Attention weights are aggregated across batches, attention heads, and target time steps, providing a global view of the temporal relevance learned by the model.
Figure 12 illustrates the absolute distribution of attention weights across historical lags, while
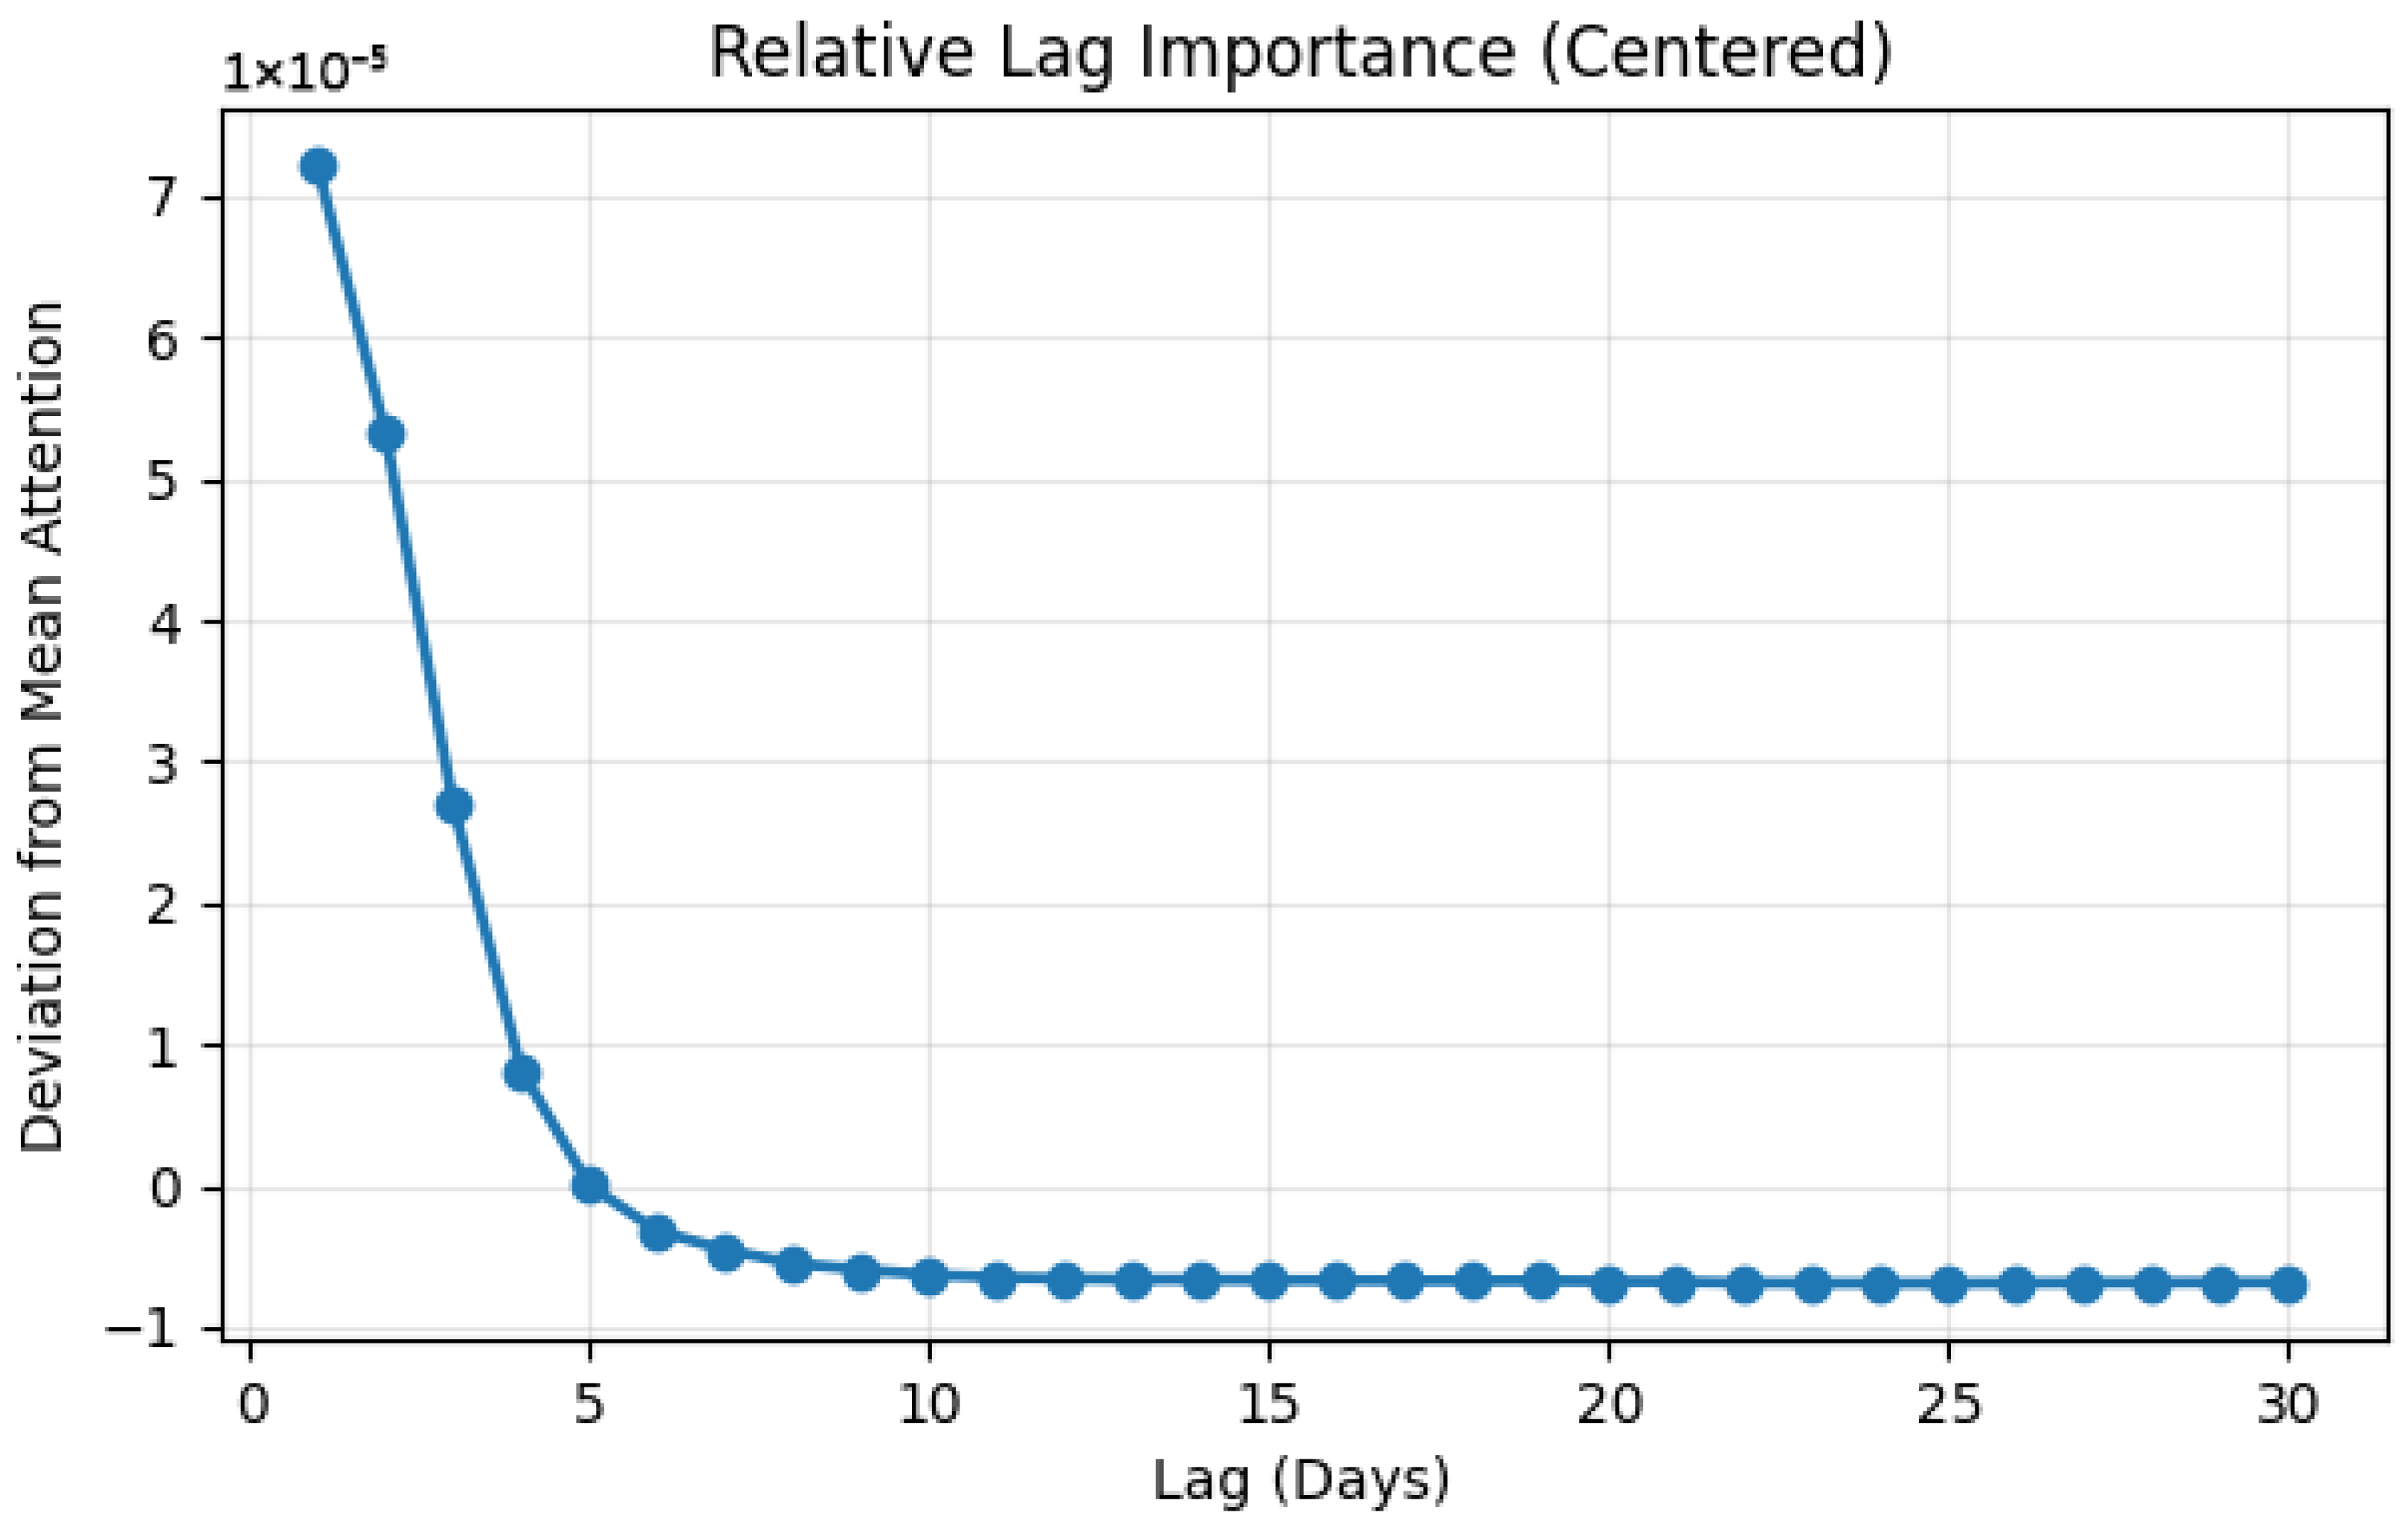
Figure 13 highlights relative deviations from the mean attention weight.
Figure 12 illustrates the absolute lag importance profile. Although the numerical variation in attention weights is small due to normalization and aggregation across heads and time steps, a clear monotonic decay is observed. The first three to five lags receive systematically higher attention weights, indicating that the model prioritizes recent historical information when forming forecasts. Beyond approximately seven to ten lags, the curve flattens and converges toward a stable baseline, suggesting a diminishing marginal contribution of older observations within the 30-day lookback window.
This behavior is consistent with stylized facts of agricultural commodity markets, where short-term dynamics and recent shocks typically exert a stronger influence on price formation than distant historical information. The smooth decay pattern further indicates that the attention mechanism learns a structured temporal relevance profile rather than assigning weights arbitrarily.
To improve visual interpretability,
Figure 13 presents the lag importance after centering the attention weights around their mean. This relative representation highlights deviations from the average attention level, making the contribution of individual lags more discernible. The centered profile confirms that early lags contribute positively above the mean attention weight, while later lags contribute negatively with small magnitudes. Meaningful deviations from the mean are concentrated within the first few lags, reinforcing the conclusion that the model’s effective memory is largely short-term.
Taken together, the two panels demonstrate that the multi-head attention mechanism primarily serves as an interpretability tool, revealing how the model selectively emphasizes recent information. While the attention distribution is smooth and gradual, its structure is systematic and economically meaningful. This temporal weighting explains the smoothing of extreme price movements observed in the forecasting results and reflects a bias–variance trade-off in which forecast stability and generalization are favored over sensitivity to isolated extreme shocks.
This pattern indicates that the model primarily relies on short-term temporal dependencies, which is consistent with the stylized facts of agricultural commodity markets, where recent price movements and short-run volatility often dominate price formation. Beyond roughly ten lags, the attention weights converge to near-constant low values, suggesting diminishing marginal relevance of longer historical windows within the chosen 30-day lookback period.
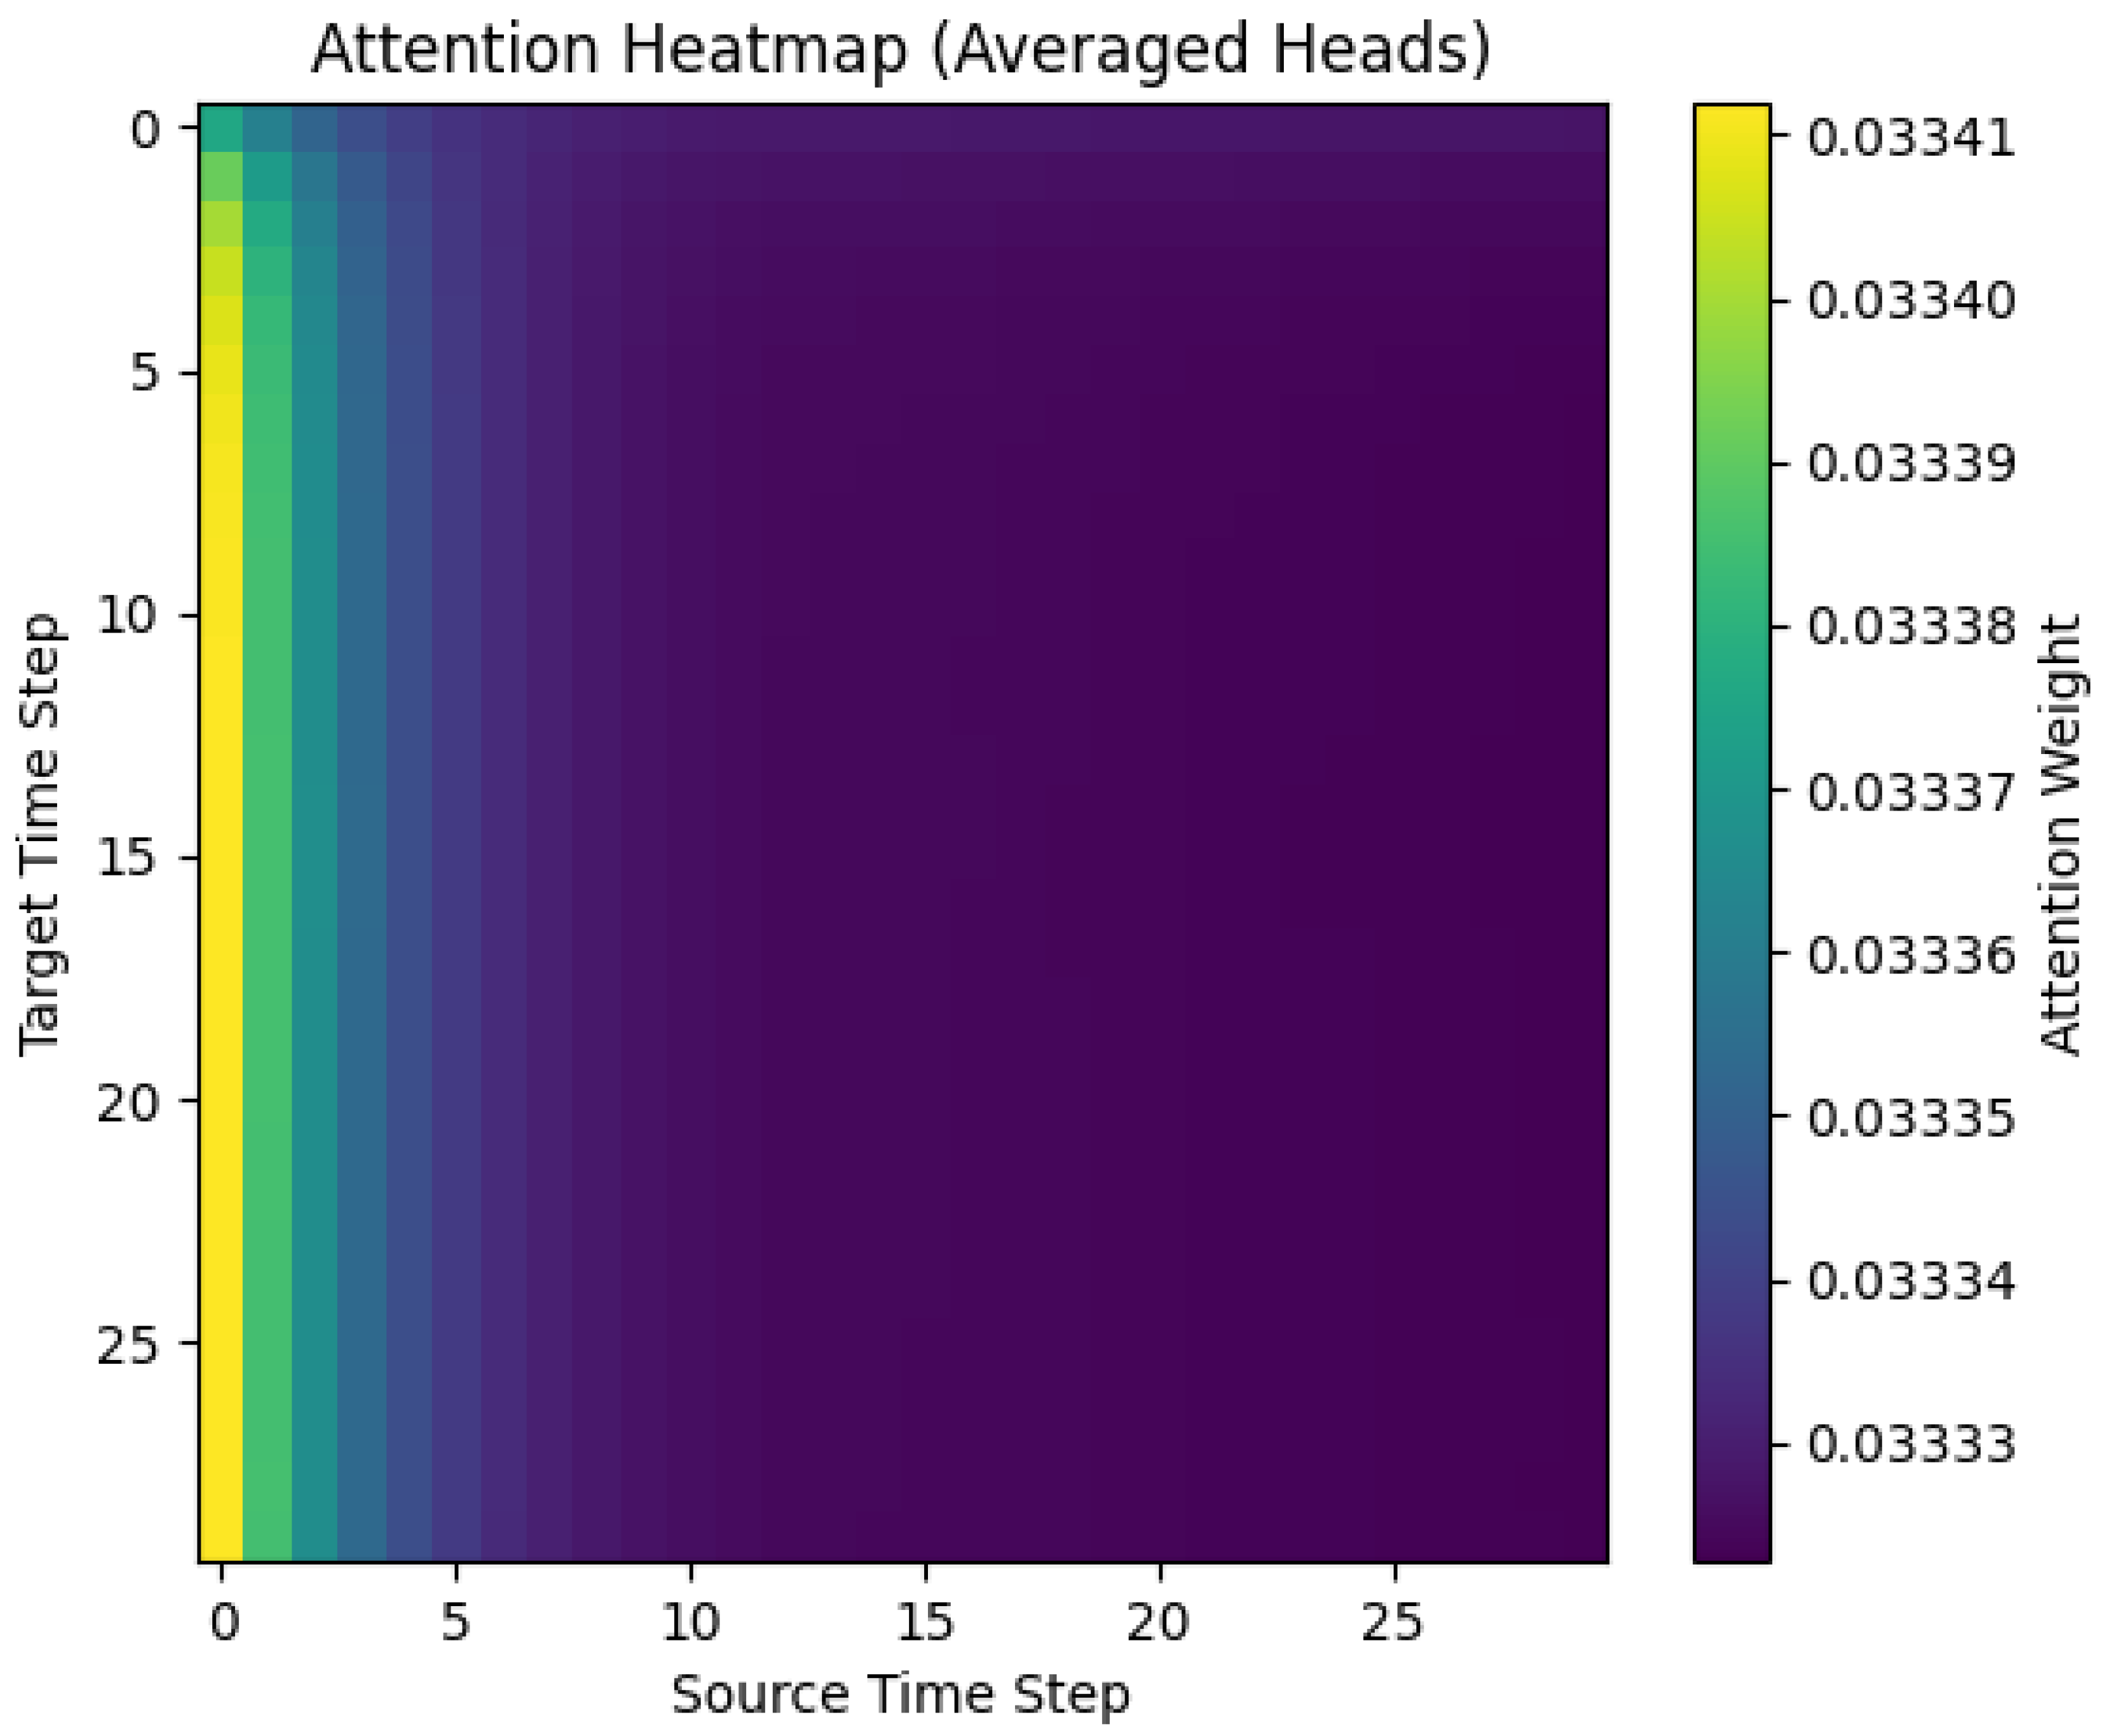
Figure 14 further illustrates this behavior through an attention heatmap averaged across heads. High-intensity regions are concentrated along the leftmost columns, corresponding to recent source time steps. The relative uniformity of the attention structure across target time steps suggests that the model learns a stable temporal relevance pattern, consistently prioritizing recent information regardless of the forecast position. This structural property explains the smoothness observed in the hybrid model’s predictions and highlights how attention mechanisms contribute primarily to interpretability rather than aggressive error minimization.
4.6. Discussion
The forecasting plots reveal that the proposed model produces relatively smooth predictions and tends to underestimate sharp price spikes during periods of high volatility. While this behavior contributes to stable trend estimation and noise reduction, it also represents a limitation of the model. In particular, the use of MSE-based loss functions and attention-driven temporal averaging introduces a bias–variance trade-off that favors robustness over sensitivity to extreme events. Consequently, the model is more suitable for medium-term trend forecasting than for applications requiring accurate tail-risk or volatility prediction.
An attention-weight analysis reveals that the model assigns greater importance to periods characterized by sustained market shifts rather than isolated price spikes. This behavior explains the observed smoothing of extreme price movements in the prediction plots. While such smoothing improves forecast stability and reduces noise sensitivity, it also leads to systematic underestimation of rare but economically significant price spikes. This reflects an inherent bias–variance trade-off and should be interpreted as a limitation rather than an unconditional advantage.
Comparisons with baseline models must be interpreted cautiously as some benchmark results are drawn from heterogeneous datasets and experimental settings. However, the consistent performance gains observed in re-trained baselines support the effectiveness of the proposed architecture.
From a policy and supply chain perspective, the model’s strength lies in its ability to provide reliable trend forecasts rather than precise spike prediction. Such forecasts are valuable for inventory planning, export strategy design, and medium-term policy analysis in commodity-dependent regions such as West Africa. However, for applications requiring accurate tail-risk estimation, such as hedging against extreme shocks, future extensions incorporating external variables (for example, weather indices and geopolitical indicators) and volatility-weighted loss functions are necessary. Consequently, the findings of this study are best interpreted as methodological and analytical contributions rather than prescriptive policy tools.
4.7. Study Ramifications
For agricultural commodity markets and their players, the LSTM–MHA model has a number of significant implications. These implications span a wide range of fields and show how the model may affect several aspects of agricultural commodity trading and management. Our findings are influential regarding forecasting technology, economic and policy issues, industry-specific applications, and market operations and decision-making.
Market activities are immediately impacted by the LSTM–MHA model’s implementation. Through improved price forecasts, the model helps stakeholders to make well-informed decisions about trading tactics, position management, inventory optimization, storage choices, production scheduling, resource allocation, and risk management.
Significant technological implications are shown by the successful integration of LSTM networks with multi-head attention mechanisms. This demonstrates how hybrid deep learning techniques may be used to estimate agricultural prices, provides a foundation for developing more complex forecasting models, and indicates how many neural network architectures can be integrated to address complex market dynamics.
The results of this study should not be interpreted as direct evidence of improved market efficiency or policy effectiveness. Instead, the proposed model contributes indirectly by providing more reliable and interpretable trend-level forecasts of global commodity price dynamics. Such forecasts may support decision-making processes related to planning, risk assessment, and market monitoring, particularly in regions exposed to international price transmission. However, causal policy conclusions would require the integration of domestic price data, institutional factors, and exogenous variables, which remain beyond the scope of this study.
Cocoa, coffee, cotton, timber, orange juice, and sugar are the six different commodities that are examined in this study. The results have particular significance for supply chain optimization, seasonal planning, production scheduling, investment strategy design, cross-commodity market analysis, and correlation studies.
The ablation and attention analyses demonstrate that attention mechanisms contribute more to interpretability and structural understanding than to immediate gains in point forecasting accuracy. The results also suggest that the full potential of the hybrid LSTM–MHA architecture is likely to emerge when richer feature sets, such as weather indicators, exchange rates, or policy variables, are incorporated. In such settings, attention mechanisms can selectively weight heterogeneous information sources, potentially improving both accuracy and robustness under volatile market regimes.
5. Conclusions
This study proposed an attention-enhanced deep learning framework for agricultural commodity price forecasting, integrating long short-term memory (LSTM) networks with a multi-head attention (MHA) mechanism. Using global agricultural commodity futures prices as benchmark data, the model was designed to capture complex temporal dependencies and nonlinear price dynamics that are inadequately addressed by traditional statistical and standalone deep learning approaches. While the empirical analysis relies on globally traded futures markets, the study is motivated by the strong exposure of West African economies to international commodity price movements, positioning the region as an important application context rather than a distinct domestic market.
The empirical results demonstrate that the proposed LSTM–MHA model achieves substantially lower forecasting errors than conventional benchmarks such as ARIMA and standalone LSTM models, reducing mean squared error by approximately three to four times in comparable settings. The hybrid architecture effectively balances sequential learning and dynamic temporal weighting, enabling robust trend prediction across multiple commodities, including cocoa, coffee, cotton, lumber, orange juice, and sugar. The learning curves and validation results further confirm stable convergence and strong generalization performance, indicating that the model captures underlying price structures rather than overfitting short-term noise.
Beyond predictive accuracy, a key contribution of this study lies in the interpretability enabled by the attention mechanism. Attention-weight and lag-importance analyses reveal that the model consistently prioritizes recent historical observations, typically within a short temporal window, while assigning diminishing importance to distant lags. This behavior aligns with stylized facts of commodity markets, where short-term dynamics and recent shocks play a dominant role in price formation. At the same time, the attention structure explains the observed smoothing of extreme price movements in the forecasting plots, highlighting an inherent bias–variance trade-off. While this conservative behavior enhances forecast stability under noisy market conditions, it also leads to systematic underestimation of rare but sharp price spikes, which is acknowledged as a limitation.
The ablation study further clarifies the role of the architectural components. The results indicate that the inclusion of multi-head attention does not automatically yield lower point forecast errors in a low-dimensional price-driven setting. Instead, attention primarily contributes to structural flexibility and interpretability, trading a small degree of numerical accuracy for improved transparency and robustness. This finding suggests that the full benefits of attention mechanisms are likely to emerge in richer modeling environments that incorporate additional exogenous variables, such as weather indicators, exchange rates, or policy signals.
From a practical perspective, the proposed framework offers valuable insights for market participants and policymakers. Reliable trend forecasts can support inventory planning, export strategy formulation, and medium-term policy analysis in commodity-dependent regions such as West Africa, where global price transmission plays a critical role. However, for applications requiring precise tail-risk estimation or hedging against extreme shocks, future extensions are necessary.
Several avenues for future research emerge from this study. First, incorporating external drivers of price volatility, including climatic, macroeconomic, and geopolitical variables, may enhance the model’s ability to capture extreme events. Second, alternative loss functions or volatility-sensitive training objectives could be explored to better balance stability and tail-risk responsiveness. Finally, extending the framework to real-time forecasting and regime-switching environments would further improve its applicability in dynamic agricultural markets.
In summary, this study demonstrates that attention-enhanced deep learning models provide a powerful and interpretable tool for agricultural commodity price forecasting, offering both methodological contributions and practical relevance for globally integrated markets with regional economic implications.