Article

Small-Target Pest Detection Model Based on Dynamic Multi-Scale Feature Extraction and Dimensionally Selected Feature Fusion


1
Xinjiang Space-Air-Ground Integrated Intelligent Computing Technology Laboratory, Changji 83110, China
2
School of Computer Science and Technology, Xinjiang University, Urumqi 830049, China
3
Xinjiang Key Laboratory of Signal Detection and Processing, Urumqi 830046, China
*
Author to whom correspondence should be addressed.
Appl. Sci. 2026, 16(2), 793; https://doi.org/10.3390/app16020793
Submission received: 15 December 2025 / Revised: 5 January 2026 / Accepted: 9 January 2026 / Published: 13 January 2026

Abstract

Pest detection in the field is crucial for realizing smart agriculture. Deep learning-based target detection algorithms have become an important pest identification method due to their high detection accuracy, but the existing methods still suffer from misdetection and omission when detecting small-targeted pests and small-targeted pests in more complex backgrounds. For this reason, this study improves on YOLO11 and proposes a new model called MSDS-YOLO for enhanced detection of small-target pests. First, a new dynamic multi-scale feature extraction module (C3k2_DMSFE) is introduced, which can be adaptively adjusted according to different input features and thus effectively capture multi-scale and diverse feature information. Next, a novel Dimensional Selective Feature Pyramid Network (DSFPN) is proposed, which employs adaptive feature selection and multi-dimensional fusion mechanisms to enhance small-target saliency. Finally, the ability to fit small targets was enhanced by adding 160 × 160 detection heads removing 20 × 20 detection heads and using Normalized Gaussian Wasserstein Distance (NWD) combined with CIoU as a position loss function to measure the prediction error. In addition, a real small-target pest dataset, Cottonpest2, is constructed for validating the proposed model. The experimental results showed that a mAP50 of 86.7% was achieved on the self-constructed dataset Cottonpest2, which was improved by 3.0% compared to the baseline. At the same time, MSDS-YOLO has achieved better detection accuracy than other YOLO models on public datasets. Model evaluation on these three datasets shows that the MSDS-YOLO model has excellent robustness and model generalization ability.

1. Introduction

Cotton is threatened by a wide range of pests during its growth, flowering and fruiting stages, which can extend from seedling to harvesting stage, seriously affecting the yield and quality of cotton [1]. Therefore, their prevention and control are essential to minimize agricultural losses. However, existing small-target pest detection techniques face many challenges in practical applications. The challenge of small-target pest detection mainly stems from the fact that individual pests occupy a small pixel area in the image, which makes their feature extraction extremely difficult [2]. In order to better understand and solve this problem, we need to clarify the definition of small-target pests. Their definitions are usually based on absolute and relative sizes, where the absolute size focuses on the number of pixel points occupied by the individual pest in the image, while the relative size approach considers the ratio of the pest to the overall size. For example, the COCO dataset defines objects with less than 32 × 32 pixel points as small targets [3], and due to their limited pixel information, small-target pests are difficult to detect in an image, which makes feature extraction extremely difficult and further increases the difficulty of separating the pests from the complex background.
To address these limitations, various detection approaches have been investigated, spanning from conventional methods to deep learning-based techniques. For example, traditional small-target pest detection methods mainly rely on hand-designed features and classifiers: based on feature extraction methods such as Haar features [4], SIFT [5], and HOG [6], combined with classifiers such as SVM [7] and Adaboost [8]. However, such traditional machine vision methods exhibit limited feature extraction capability as well as poor generalization ability when detecting small-target pests [9]. With the progression of deep learning, target detection has increasingly been dominated by convolutional neural network-based methods. Deep learning approachs are able to automatically learn pest characteristics without the need for manual design, and have higher detection accuracy and stronger generalization performance [10]. Modern target detection frameworks, powered by deep learning, have evolved into two dominant paradigms: two-stage and single-stage architectures. Two-stage object detection, such as Faster R-CNN [11], have higher detection accuracy but are computationally slower due to the need to generate a region suggestion network and subsequent processing. On the other hand, single-stage object detection, such as YOLO [12], which treats target detection as regression distance and predicts the location and class of the target directly from the image, have high detection speed and efficiency.
The YOLO family of algorithms has gradually become a popular choice for small target detection due to its real-time and high-precision features [13]. However, the earlier versions of YOLO have certain limitations in detecting small targets, such as insufficiently fine feature extraction and easy missed detection. To overcome these shortcomings, researchers have made several improvements to YOLO. For example, Tian et al. [14] proposed an improved YOLO framework based on multi-scale dense connection (MD-YOLO), which is optimized for the challenges in the detection task of small lepidopteran pests. In this study, the feature extraction network is reconstructed by integrating DenseNet blocks and adaptive attention modules, which effectively enhances the model’s ability to capture subtle features of the image, and significantly alleviates the motion blur problem caused by pest mobility. The experimental results show that MD-YOLO achieves 86.2% mAP on the self-built small pest dataset, which surpasses the performance of the original YOLO series and other comparison models. Hu et al. [15] addressed the challenge of pest detection in complex agricultural scenarios by proposing a hybrid architecture that combines CNN and MHSA. This effectively enhances the model’s ability to extract features from small-scale targets, significantly improving detection accuracy for tiny pests against complex backgrounds. Experimental results show that this method achieved a detection performance of 95.27% mAP on the tea tree pest dataset. Wang et al. [16] developed an enhanced YOLOv8 framework incorporating attention mechanisms to optimize feature extraction, achieving 98.6% mAP for mango pest detection. Tang et al. [17] developed Pest-YOLO, an advanced detection framework integrating Efficient Channel Attention (ECA) modules and Transformer encoder blocks, which achieved 73.4% of mAP on the Pest24 dataset while maintaining real-time performance, surpassing existing state-of-the-art approaches. Hu et al. [18] improved the YOLOv4-Tiny model to identify and detect Phytophthora citrus. By optimizing the neck network and using the location and detail information of the shallow convolutional layer, they enhanced the model’s ability to identify small targets such as citrus psyllids. Chu et al. [19] successfully captured the detailed feature information of tiny objects by combining the YOLOv5 model with the ECA attention mechanism. In addition, they introduced BiFPN to fuse low-level and high-level feature information, an innovative approach that achieved up to 98.2% detection accuracy on a 5231-image silo pest dataset. Xu et al. [20] developed YOLOv5s-pp, an improved architecture incorporating a Channel Attention (CA) module to enhance small-target detection in low-resolution scenarios by effectively suppressing interference from complex backgrounds and negative samples. Although these YOLO-based methods have significantly improved detection accuracy in object detection tasks, they still face challenges such as loss of small-object feature information, feature redundancy during feature fusion, computational parameter redundancy, and balancing inference speed when detecting small-target pests.
To address the aforementioned challenges, we designed a dynamic multi-scale extraction mechanism that adaptively captures subtle features across different scales, effectively mitigating information decay in deep networks for small targets. Furthermore, we introduced a dimension selection strategy to suppress redundant information and enhance semantically critical features during feature fusion, thereby improving the model’s discrimination capability in complex field environments. Additionally, we optimized the detection head and loss function tailored to small target characteristics and constructed the real-world dataset, Cottonpest2, specifically for dense small pests, providing robust support for model training and evaluation. Experiments demonstrate that MSDS-YOLO significantly improves detection accuracy for small-target pests while maintaining efficient inference, delivering a practical solution for intelligent agricultural monitoring.

2. Related Work

In the field of small-target pest detection, the YOLO series of models has received widespread attention for its efficiency and accuracy. This study summarizes representative feature extraction networks and feature fusion networks in the YOLO series. The feature extraction-based approach focuses on identifying and localizing small-target pests through efficient feature extraction networks [21]. The feature fusion-based approach, on the other hand, focuses on utilizing different levels of feature information to nhance the precision of detection tasks [22].

2.1. YOLO Algorithm Based on Feature Extraction Network

Conventional feature extraction approaches typically employ fixed-size convolutional kernels for multi-scale feature processing, yet demonstrate limited effectiveness in complex scenarios due to their inability to adequately preserve fine-grained target characteristics. This leads to the fact that critical information, especially for small targets, may be gradually lost during downsampling, increasing the difficulty of feature extraction. Researchers have consequently introduced various YOLO modifications to address these shortcomings. Jiang et al. [23] proposed a Multi-Scale Feature Extraction Module (MSFEM) integrated with YOLOv5, employing parallel convolutional branches with heterogeneous kernel sizes to significantly improve fine-grained feature representation for small target detection. Dong et al. [24] developed a High-level Semantic Feature Extraction Module (HSFEM) for YOLO architectures, which preserves rich semantic information while facilitating feature pyramid construction, thereby significantly improving pest detection performance through enhanced feature representation. Iqra et al. [25] proposed SO-YOLOv8, which adaptively introduces the SE attention mechanism into the backbone of YOLOv8 by adaptively directed to salient regions, which significantly enhances feature learning specialized for small target detection. Ding et al. [26] developed a DFCE network based on YOLOv8, incorporating a Dynamic Multidimensional Attention (DMA) module that employs cross-mechanism operations to selectively emphasize discriminative features through adaptive weight allocation, thereby optimizing attention to critical information. Zhang et al. [27] developed DsP-YOLO, an enhanced YOLOv8 architecture incorporating a Lightweight LCBHAM module, which is capable of capturing important features while suppressing unimportant feature information during feature propagation. However, when confronted with small-target features, these methods may not be able to emphasize critical foreground information, thus constraining the model’s capacity to extract important features effectively. To this end, this paper proposes a dynamic multi-scale feature extraction module that enhances the network’s ability to capture multi-scale pest features by adaptively adjusting the receptive field of convolutional kernels and feature weights. This approach not only improves the capture of minute pest details but also avoids the feature adaptation limitations inherent in fixed convolutional kernels through its dynamic adjustment mechanism. Consequently, it establishes a more robust feature foundation for subsequent feature fusion and target localization.

2.2. YOLO Algorithm Based on Feature Fusion Network

Meanwhile, multi-scale feature fusion has been widely used for target detection [28]. While low-level feature maps maintain precise spatial details essential for localization, high-level feature maps encapsulate abstract semantic representations crucial for recognition. Hierarchical fusion of these complementary representations enables superior detection performance through integrated feature exploitation. This modification enriches the details and localization information, which improves the detection accuracy. Zhang et al. [29] developed CFANet, an enhanced YOLOv5 architecture incorporating: a CFA module for parallel multi-scale feature integration, and a LASPP module for multi-receptive-field detail extraction, collectively generating optimized feature representations. Zhang et al. [30] proposed a BiTSFP based on the YOLO model, which is designed to combine a shallow positional information flow to complement the existing deep semantic information flow. Chen et al. [31] developed an HR-FPN integrated with YOLOv5, which optimizes multi-scale feature resolution through adaptive adjustment, thereby enhancing small-object detection accuracy while minimizing feature redundancy. Wang et al. [32] developed LSOD-YOLO, an optimized YOLOv8 variant incorporating an LCOR module that reduces architectural redundancy through layer pruning, and enhances low-resolution small-target detection via cross-layer feature fusion, achieving superior performance with reduced complexity. Zhao et al. [33] developed a MAFF module for YOLOX that addresses complex background interference through sophisticated integration of multi-scale contextual and channel-wise information, replacing conventional summation and concatenation operations with more discriminative fusion strategies. To address the limitations of existing feature fusion methods in adaptive selection and redundancy suppression, this paper proposes a dimension-selective feature pyramid network. It dynamically filters and enhances key features across both channel and spatial dimensions, achieving efficient and adaptive fusion of multi-scale information.
Based on the above analysis, existing methods still have room for improvement in dynamic feature extraction and multi-dimensional feature selection. To address this, this paper proposes the MSDS-YOLO model, whose core innovation lies in:
(1)
A dynamic multi-scale feature extraction module is proposed, which can adaptively adjust to different input features as well as efficiently fuse information across layers to efficiently capture multi-scale and diverse feature information in images.
(2)
Integration of feature maps at different scales through a dimensionality-selective feature pyramid network enhances feature fusion and propagation across layers. Then, the fused feature maps are further extracted with effective features through the dynamic multi-scale feature extraction module to minimize the problem of information loss during the information fusion process.
(3)
In this paper, NWD combined with CIoU is used as the position loss function of MSDS-YOLO to measure the prediction error more accurately. Furthermore, the implementation of a specialized detection head for small targets has led to a substantial enhancement in the accuracy of detecting minute objects.

3. Methodology

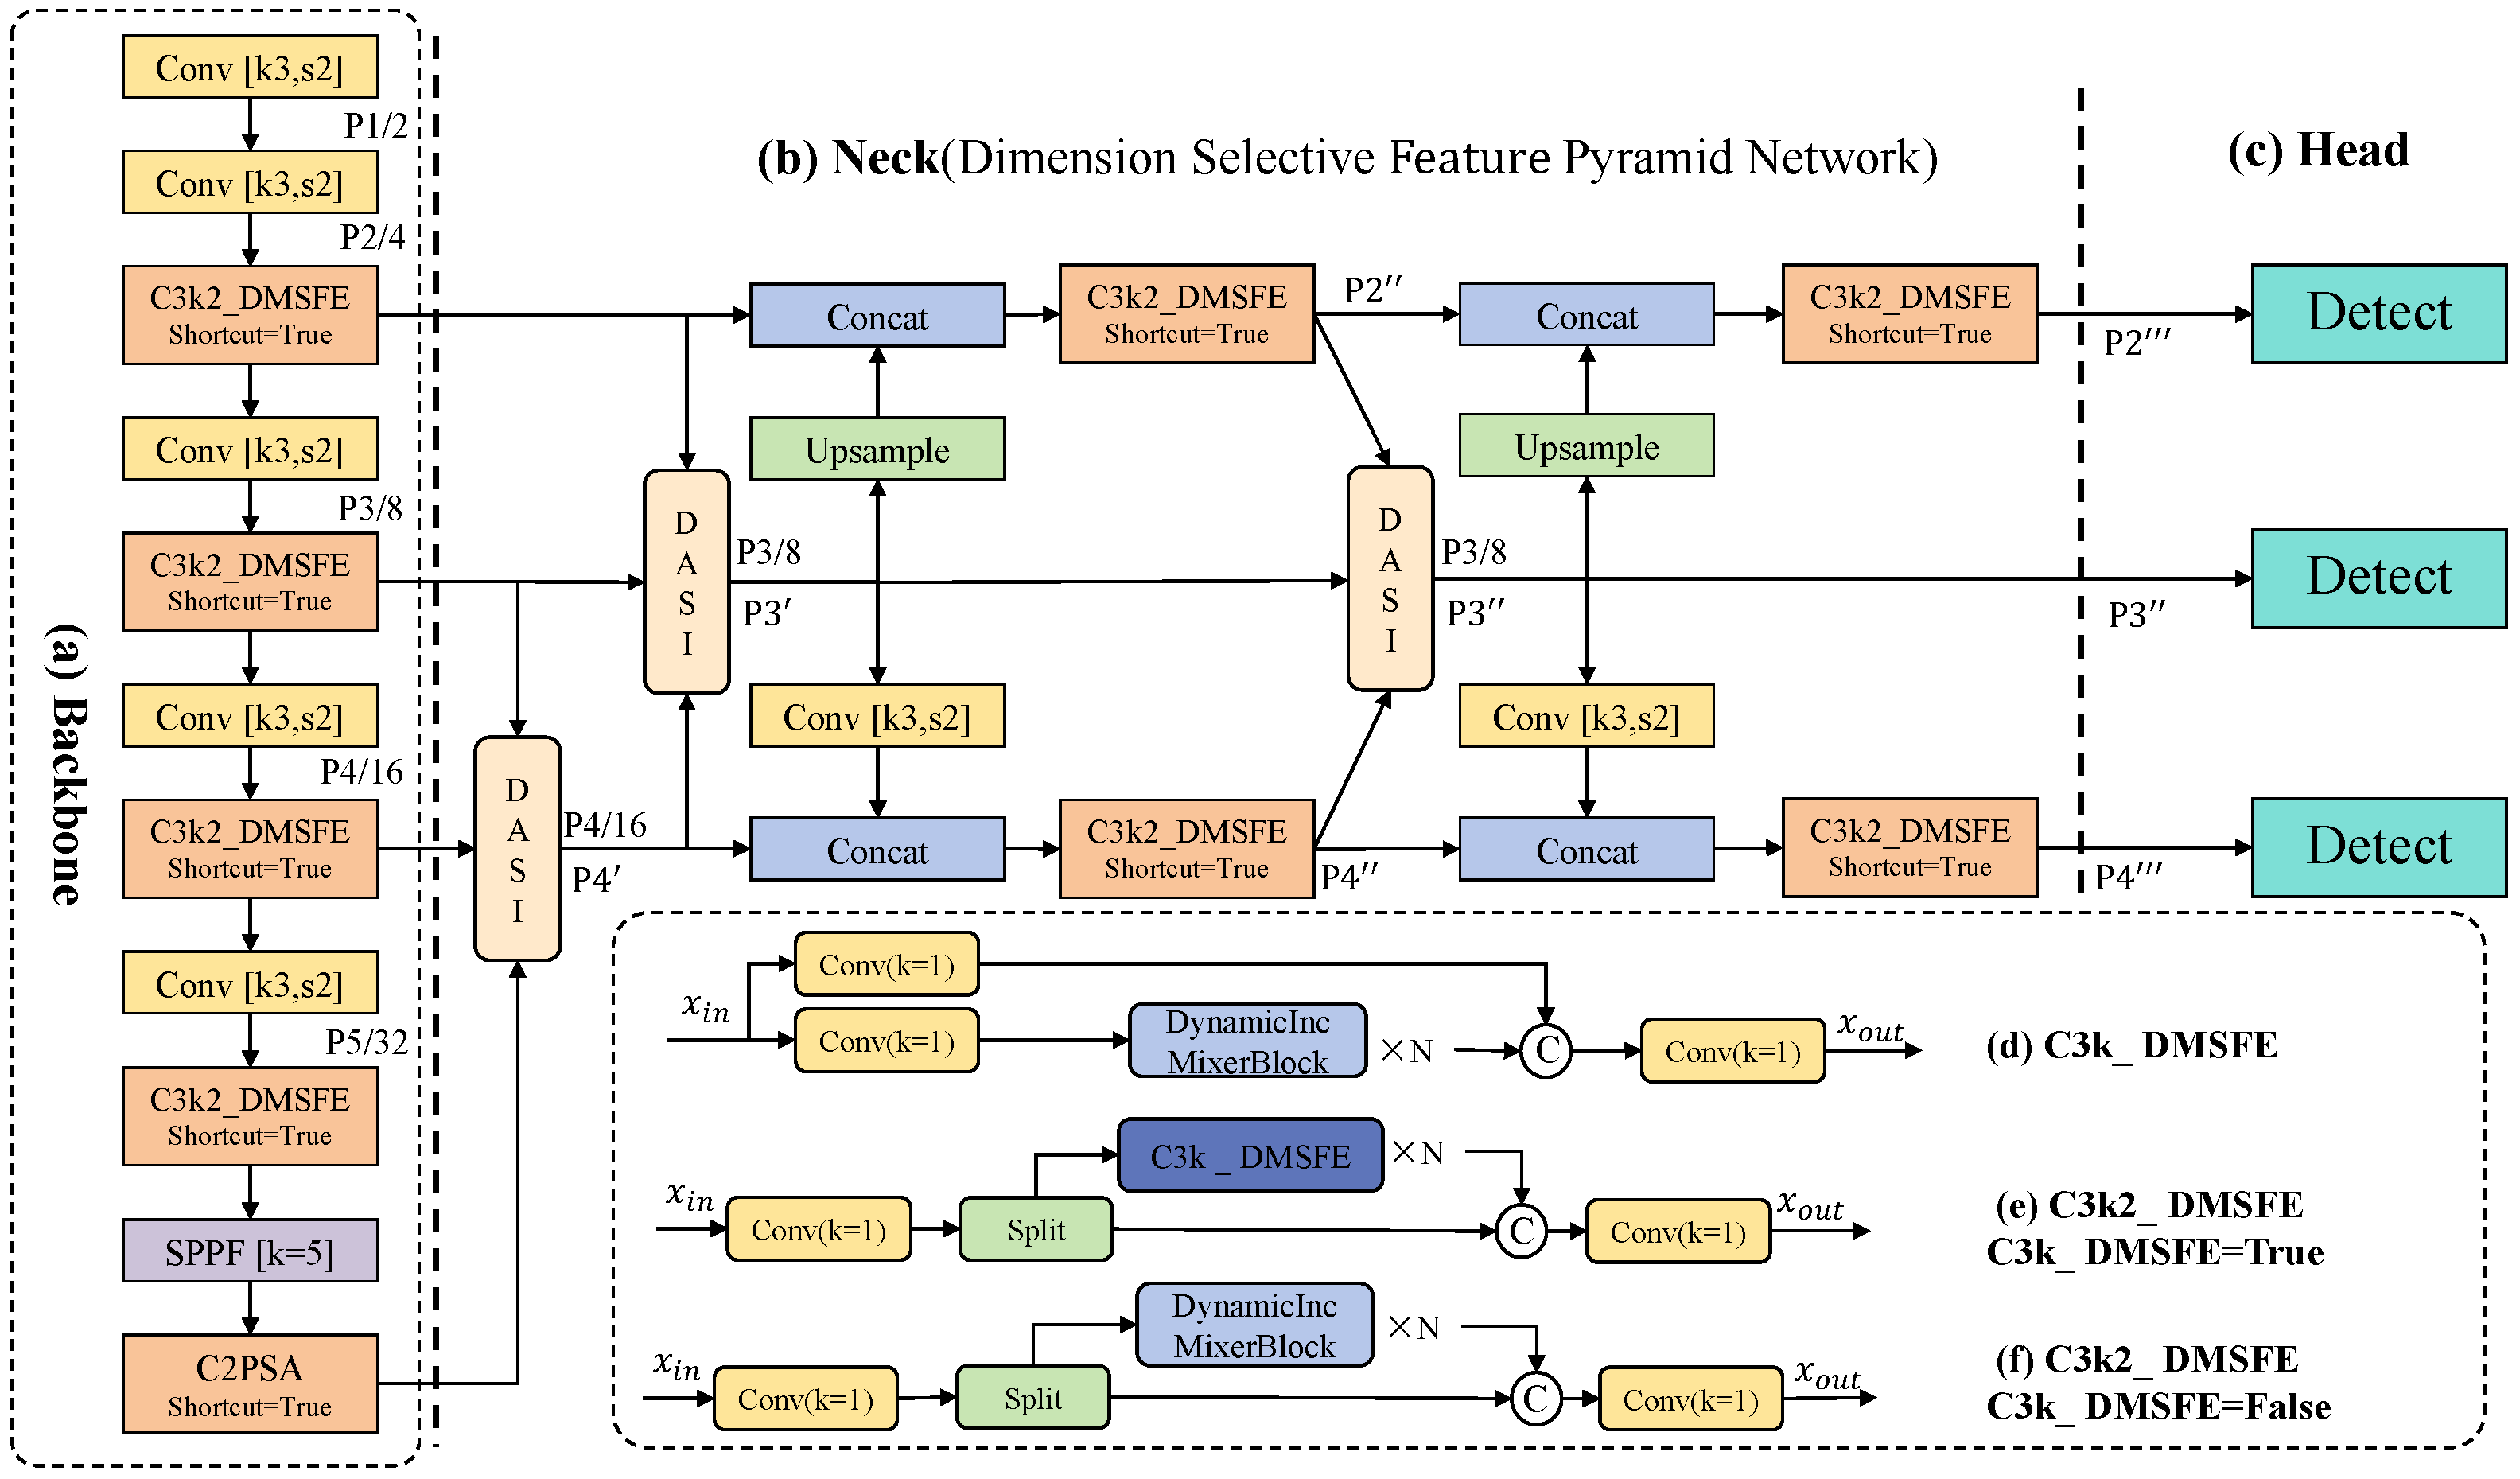
A novel real-time pest detection model named MSDS-YOLO is proposed, which is developed based on YOLOv11 to more effectively capture and utilize multi-scale information of small-target pests while fully integrating contextual information across different-scale feature maps. as illustrated in Figure 1. In this study, targeted improvements are made to the model’s backbone network, neck network, and detection head, with the aim of enhancing detection performance, particularly for small-target pests.
The MSDS-YOLO architecture introduces targeted modifications to the baseline YOLOv11 framework, specifically optimized to improve small-pest detection performance through enhanced feature representation and multi-scale processing. This renders the MSDS-YOLO model particularly adept at handling tasks involving the detection of small-target pests and provides strong support for building efficient intelligent pest detection systems. Thanks to these enhancements, the MSDS-YOLO model not only achieves higher detection accuracy, but also maintains the real-time performance, which is of great significance for pest monitoring and control in agricultural production.

3.1. Dynamic Multiscale Feature Extraction Module (C3k2_DMSFE)

In the InceptionNeXt model [34], the input channel is divided into four branches and different processing operations are performed for each branch. However, this approach may lead to underutilization of feature information. To solve this problem, an innovative DynamicInceptionDWConv2d structure is proposed in this paper. This structure performs different convolutional operations on the whole input to extract multi-scale feature information, which is subsequently weighted and fused using dynamic convolutional kernel weights to utilize the feature information more effectively. In addition, the DynamicInception-Mixer module is proposed in this paper, in which the channels of the input features are split into two groups and processed separately by DynamicInceptionDWConv2d layers with distinct kernel sizes. This design aims to capture richer feature information with different scaled convolutional kernels. Ultimately, by combining the DynamicInceptionMixer module with the convolutional gating unit (CGLU) [35], the integration of cross-layer information has been effective achieved, thereby significantly enhancing the model’s capacity to capture features at multiple scales.
The C3k2_DMSFE module replaces the traditional Bottleneck in the C3k2 architecture with the innovative DynamicIncMixerBlock module. This enhancement empowers the module to dynamically adapt to the varying attributes of input features, facilitating the efficient integration of cross-layer information. As a result, the C3k2_DMSFE module is more adept at capturing a broader spectrum of multi-scale and diverse feature information, which in turn elevates the model’s overall performance. Subsequently, the design and implementation intricacies of these three modules will be elaborated upon to illustrate how they synergistically enhance the model’s capability to detect and utilize feature information within complex scenarios.
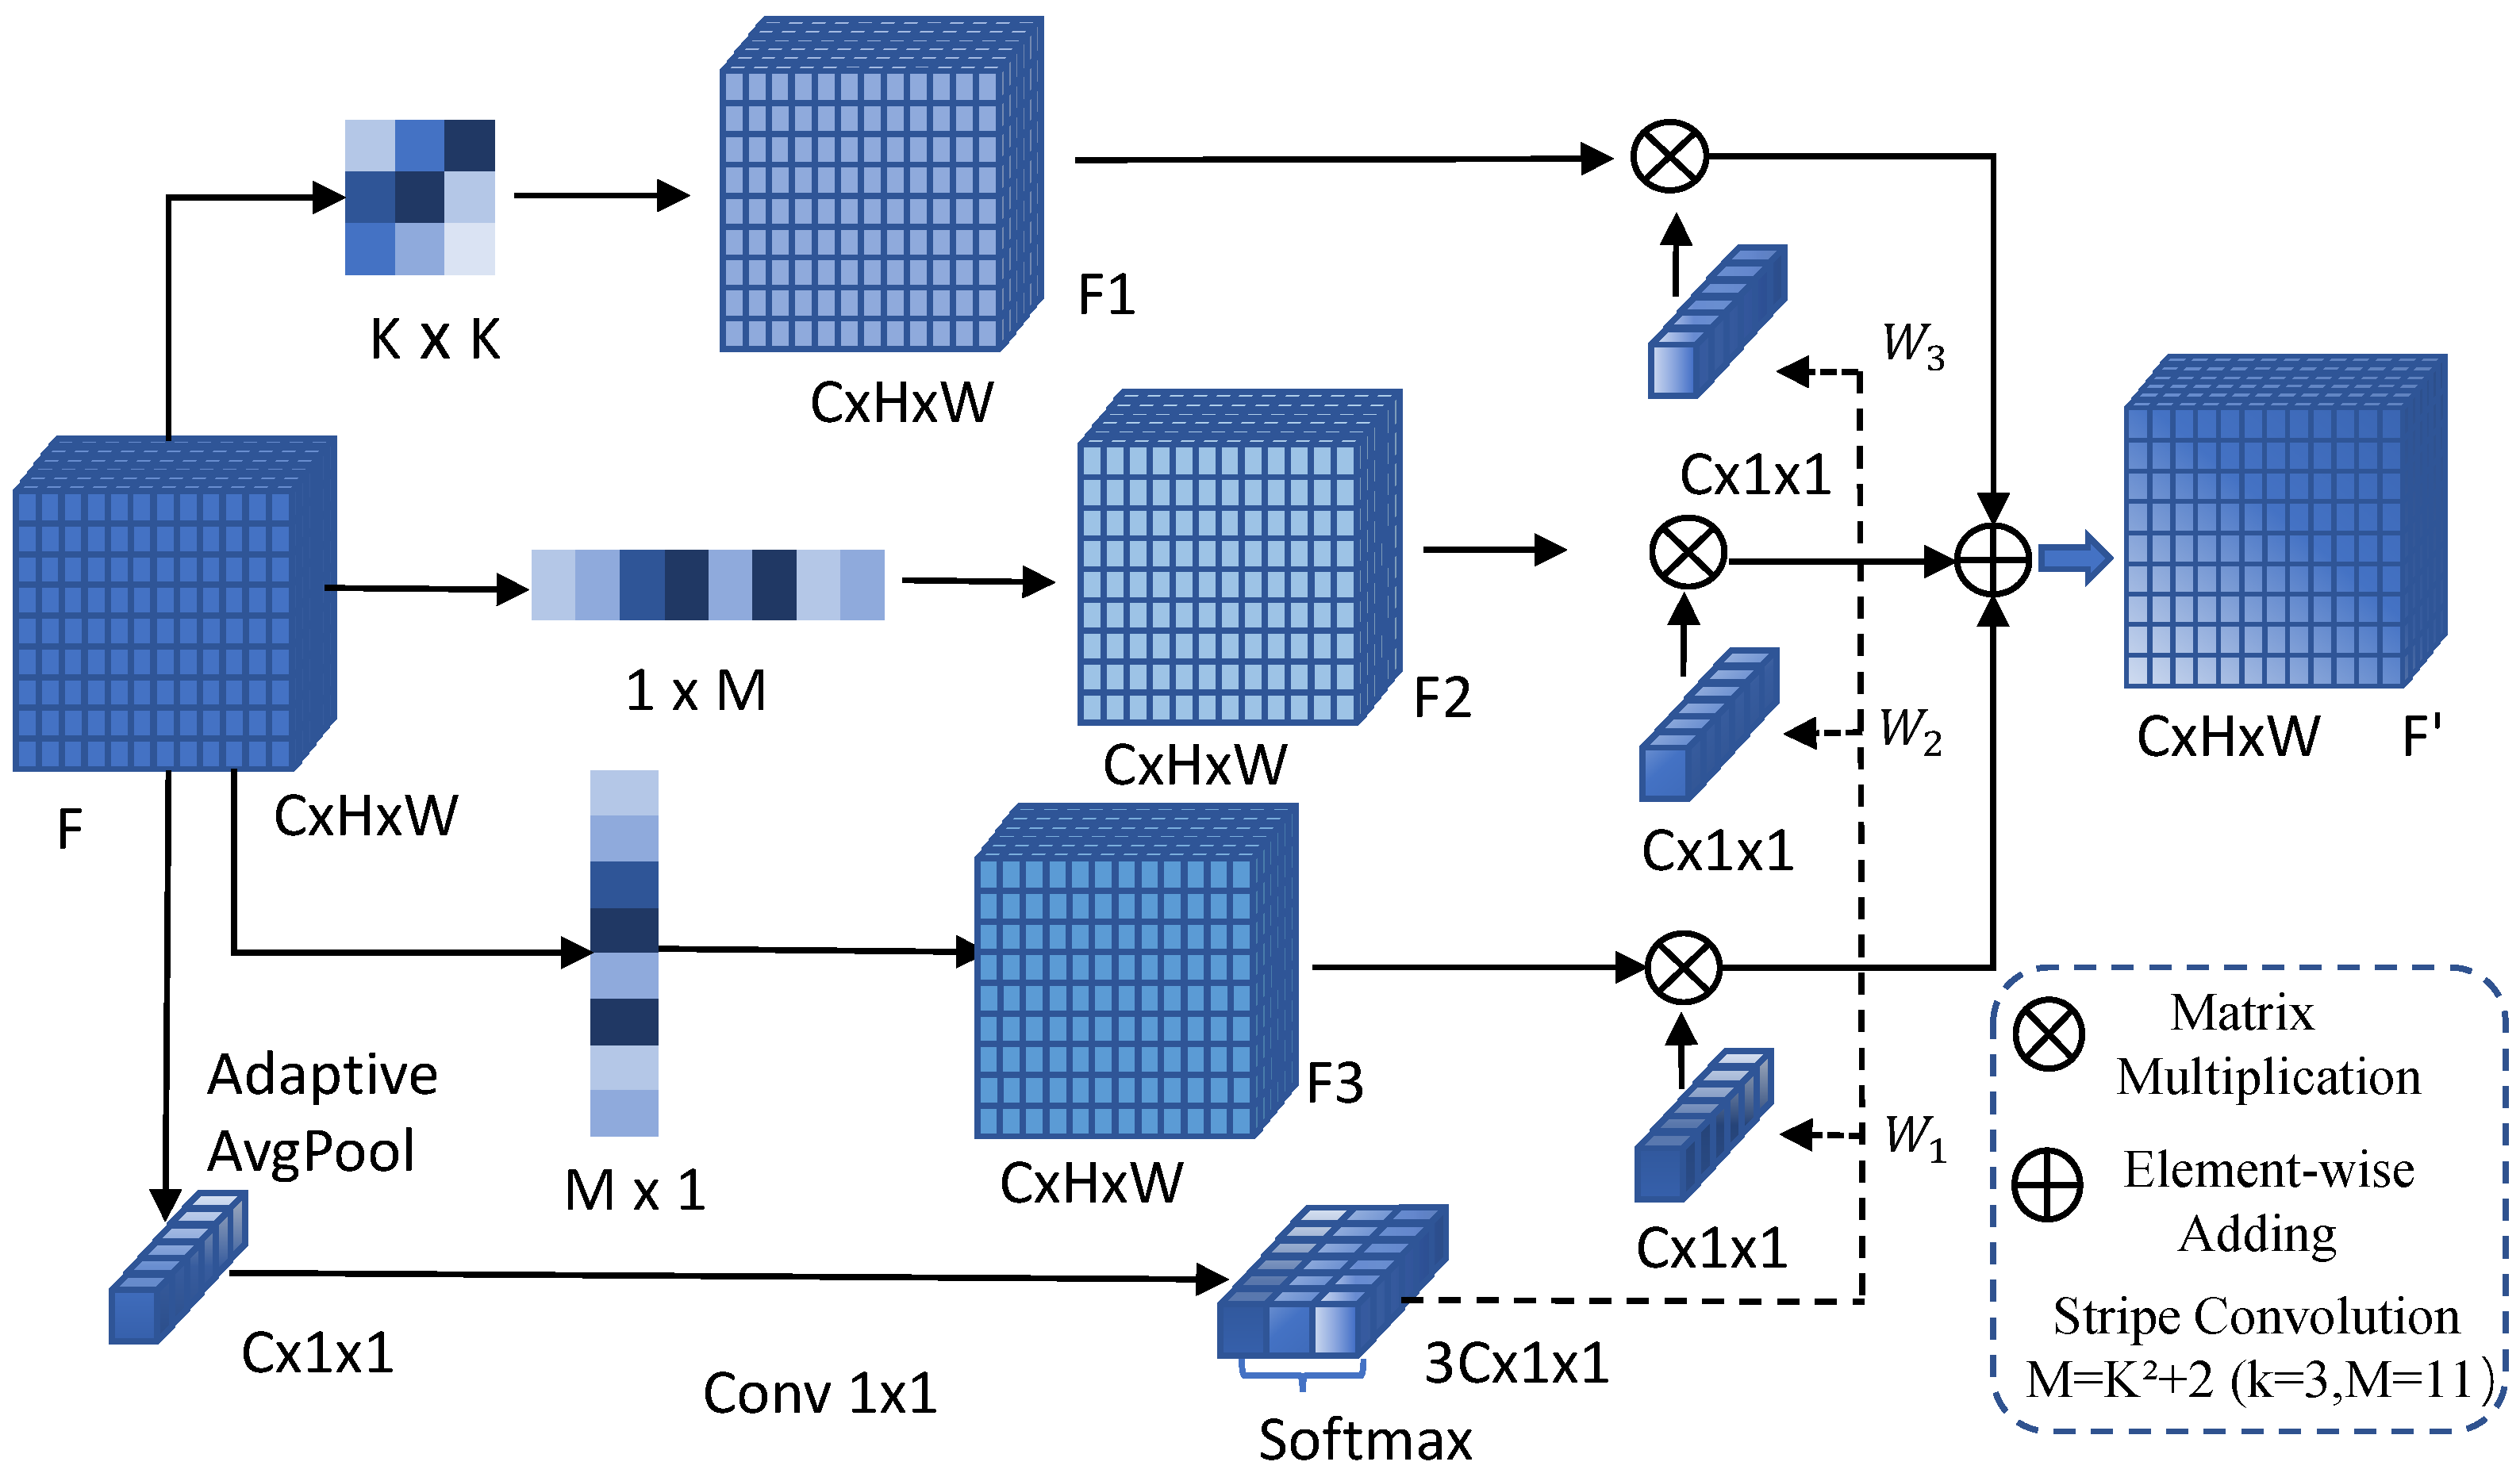
(1) DynamicInceptionDWConv2d module: In traditional feature extraction networks, convolutional kernels are typically fixed and static. This design often fails to adapt to the diverse scale and feature 5ype requirements when processing small-target pests. Particularly when handling images with significant scale differences, a single convolutional kernel cannot effectively capture a balanced blend of fine details and global information. To address this, this paper introduces a novel dynamic Inception convolution, detailed in Figure 2. Its core innovation lies in dynamically computing the shape and importance weighting of the receptive field based on the current input feature map F. This module implements the mechanism through a parallel “dynamic kernel weight generator.” First, the input feature map F undergoes global average pooling to compress spatial information and extract contextual semantics with a global receptive field. Subsequently, a lightweight 1 × 1 convolutional layer maps the compressed features to three sets of channel-dimensional weight vectors, corresponding to the three subsequent parallel convolutional branches. Finally, a cross-channel Softmax function normalizes these three weight sets, ensuring their sum equals 1 at each spatial location. This process enables the network to adaptively determine the importance of each branch based on input content. After dynamic weight generation, the three parallel depth-separable convolution branches simultaneously process the input feature F.
Standard square kernels (e.g., 3 × 3) extract local, isotropic features such as dot-like textures or small patches on pest bodies, providing foundational details for detection. The horizontal convolution branch employs a flat kernel (e.g., 1 × M) with a receptive field significantly extended horizontally. The vertical band-based convolutional branch employs symmetric kernels (e.g., M × 1), focusing on long-range dependencies in the vertical direction. The output from each branch undergoes per-channel multiplication with dynamically generated weights corresponding to that branch, enabling adaptive feature weighting. Subsequently, the three weighted feature maps are summed along the channel dimension, forming an enhanced feature representation that fuses multi-directional, multi-scale contextual information. Finally, this fused feature undergoes batch normalization and SiLU activation to stabilize training and introduce nonlinearity, outputting the ultimately optimized feature map F′. The formula is as follows:
F 1 = Conv 1 ( F )
F 2 = Conv 2 ( F )
F 3 = Conv 3 ( F )
F 4 = δ ( Conv 4 ( avg ( F ) ) )
F = F 1 × W 1 + F 2 × W 2 + F 3 × W 3
where F denotes the input, Conv 1 denotes k × k convolution, Conv 2 and Conv 3 denote M × 1 and 1 × M strip convolution, respectively, where M = 3 × k + 2. Conv 4 denotes 1 × 1 convolution, avg denotes AdaptiveAvgPool, δ denotes Softmax, W x is the dynamic convolutional kernel weight obtained through Softmax normalization (x = 1, 2, 3), and F denotes the output.
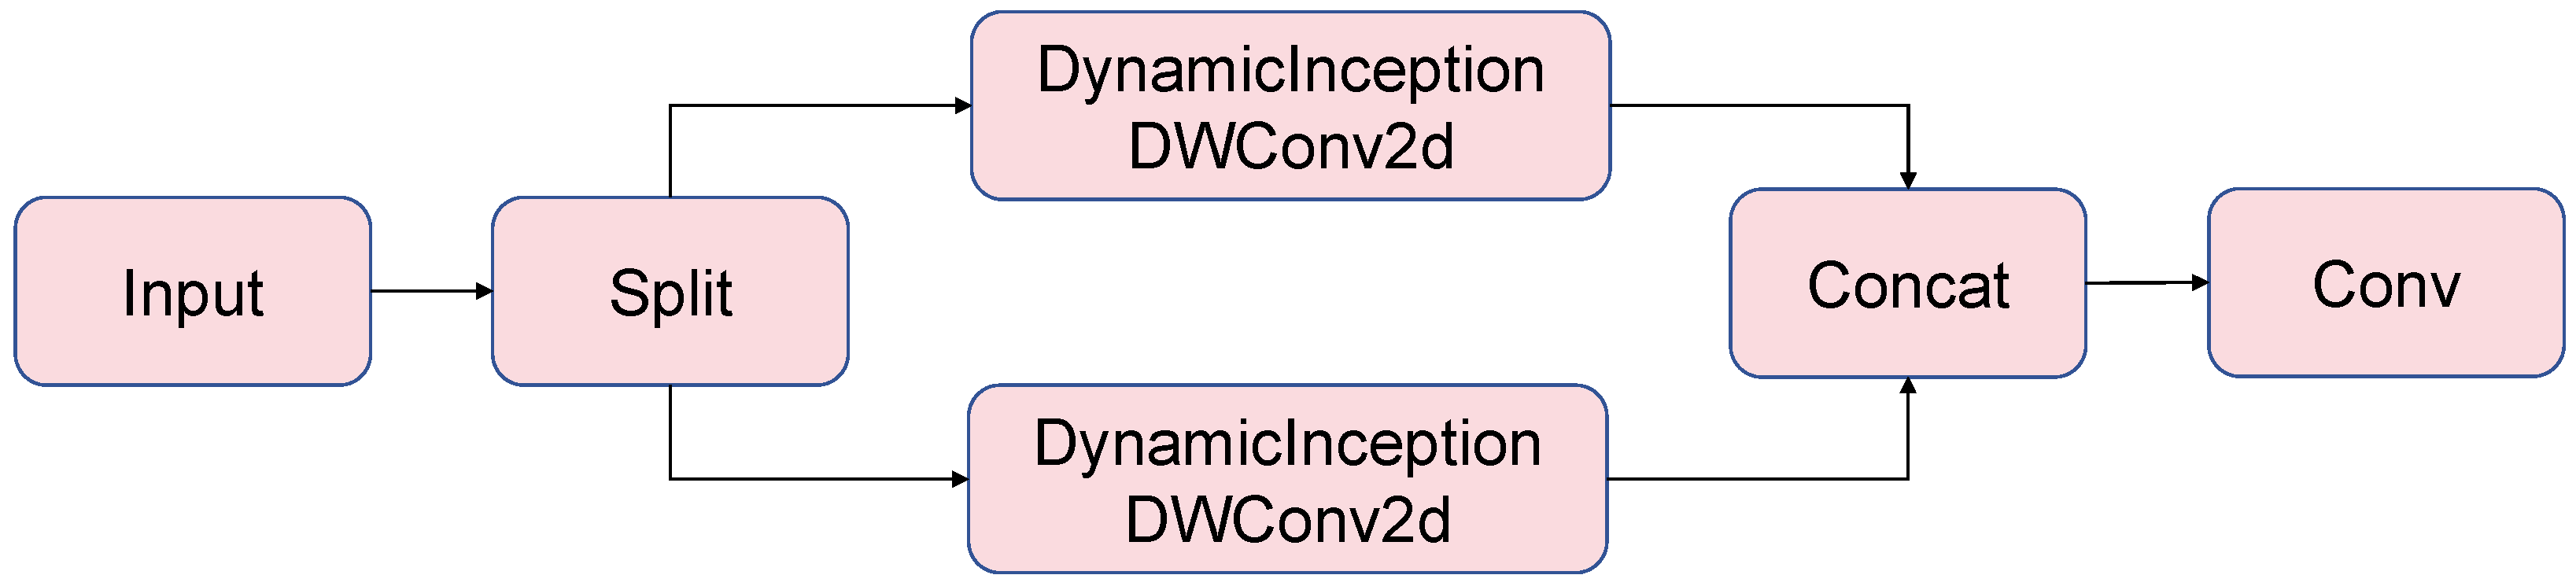
(2) DynamicInceptionMixer module: The DynamicInceptionMixer module further extends the functionality of DynamicInceptionDWConv2d. It divides the input feature channels into two groups, each group is processed by DynamicInceptionDWConv2d with different kernel sizes, and then the channels are fused by a 1 × 1 convolution. This design not only enhances the diversity of features, but also reduces the computation by group convolution. The specific implementation is shown in Figure 3.
(3) DynamicIncMixerBlock Module: In the DynamicInc-MixerBlock module, we fuse the DynamicInceptionMixer module with the Convolutional GLU (CGLU) to realize the effective fusion of cross-layer information. Within each module, the convolved feature maps are combined with the input feature maps through residual summation. This approach guarantees the efficient conveyance of both low-level and high-level features throughout the network. This not only enables the model to fully utilize the information of multiple layers, but also reduces the problem of gradient loss or feature loss due to too deep network layers. The specific implementation is shown in Figure 4.

3.2. Dimension Selection Feature Pyramid Network (DSFPN)

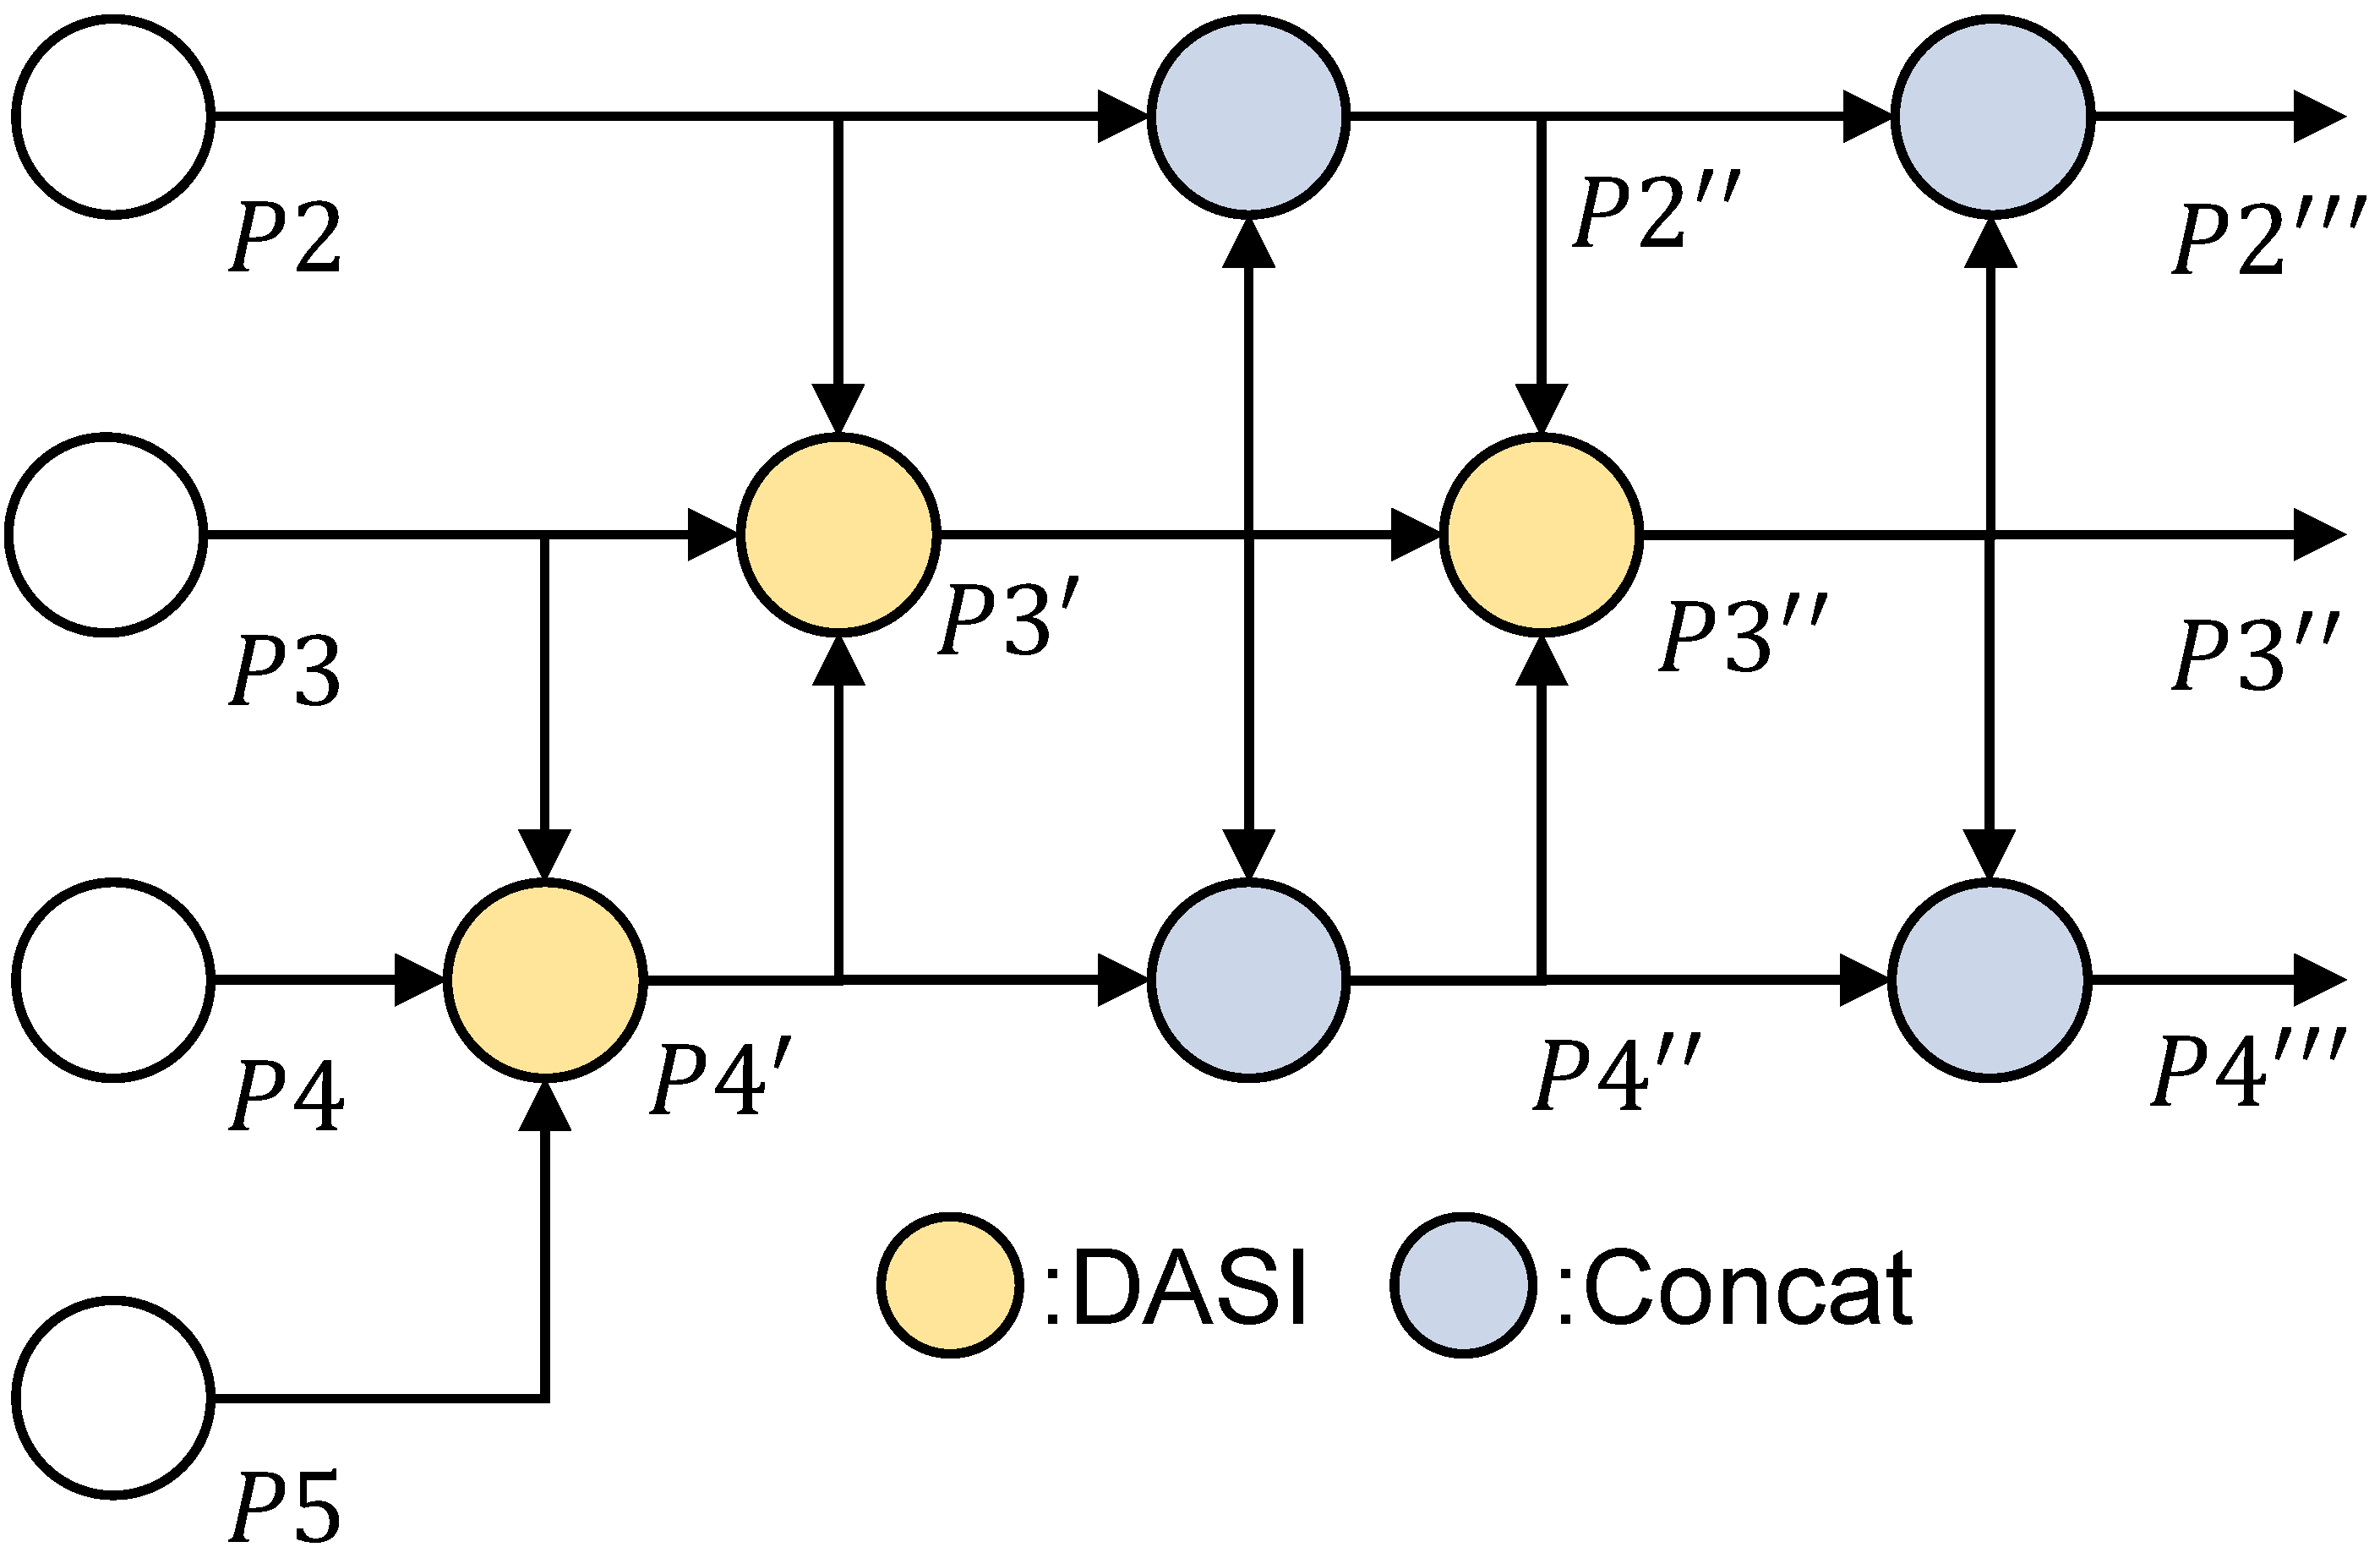
In the small target detection task usually undergoes multiple downsampling phases, the downsampling process may result in high-dimensional features losing detailed information related to the small target, while low-dimensional features retain more details but may lack sufficient contextual information, which affects the accurate detection of the small target. For this reason, A Dimensionally Selected Feature Pyramid Network (DSFPN) is proposed, and its network architecture is illustrated in Figure 5. The DSFPN module are described in detail below:
Figure 5 presents the architectural design of the DSFPN model. DSFPN fuses P3, P4 and P5 feature maps through DASI module [36] to generate the enhanced P4 feature map (denoted as P 4 ), which is a process that effectively integrates feature information at different scales. Subsequently, the model again utilizes the DASI module to fuse the P2, P3 and P 4 feature maps to generate the improved P3 feature map (denoted as P 3 ). Next, P 3 is up-sampled and down-sampled and concated with P2 and P 4 , respectively. The concated feature maps will be further processed by C3k2_DMSFE module to extract more valuable information, so as to obtain the optimized P2 feature map (denoted as P 2 ) and P4 feature map (denoted as P 4 ). After that, P 2 , P 4 and P 3 are fused by DASI again to obtain the further enhanced P3 feature map (denoted as P 3 ). Finally, P 3 is up-sampled, down-sampled, concated, and processed by C3k2_DMSFE module to obtain P 2 and P 4 . The feature maps of P 2 , P 3 and P 4 are used as inputs to the detector head, and the specific realization steps are shown in the following equations:
P 4 = D A S I ( P 3 , P 4 , P 5 )
P 3 = D A S I ( P 2 , P 3 , P 4 )
P 2 = F C o n c a t ( P 2 , U p ( P 3 ) )
P 4 = F C o n c a t ( P 4 , C o n v ( P 3 ) )
P 3 = D A S I ( P 2 , P 3 , P 4 )
P 2 = F C o n c a t ( P 2 , U p ( P 3 ) )
P 4 = F C o n c a t ( P 4 , C o n v ( P 3 ) )
where DASI denotes the DASI module, F denotes the C3k2_DMSFE module, Concat denotes the splicing operation, Up denotes the upsampling operation, and Conv represents the convolution operation, which is performed with a stride of 2.
Through these some feature fusion steps, the DSFPN model can effectively capture and utilize the multi-scale feature information to to enhance the depth and quality of feature representation, thereby facilitating more accurate detection in subsequent tasks.

3.3. Normalized Gaussian Wasserstein Distance Loss Function

YOLOv11 employs a hybrid loss function, combining the CIoU and DFL, to compute the bounding box regression loss. The formula for CIoU is shown in Equation (13):
L CIoU = 1 I o U + ρ 2 ( b , b g t ) c w 2 + c h 2 + 4 π 2 arctan w g t h g t arctan w h 2
Equation (13) defines the Intersection over Union (IoU), which measures the spatial overlap between the predicted and the ground truth bounding boxes. This is determined by the ratio of the intersection area to the union area of the two boxes. The term ρ 2 ( b , b g t ) signifies the Euclidean distance between the centroids of the predicted bounding box and its corresponding ground truth bounding box. Here, h and w represent the height and width of the predicted bounding box, respectively, while h g t and w g t correspond to the height and width of the ground truth bounding box. Additionally, c h and c w denote the height and width of the smallest frame that completely encloses both the predicted and the ground truth frames.
The CIoU metric suffers from scale inconsistency, while minor localization errors cause severe IoU degradation for small objects, similar displacements yield relatively smaller IoU fluctuations for larger objects. Additionally, it lacks explicit mechanisms to handle sample difficulty imbalance. To solve this problem, this paper introduces a position regression loss function based on the Normalized Wasserstein distance NWD [37]. The NWD method employs a two-dimensional Gaussian distribution to assess the similarity between predicted and labeled bounding boxes. It then computes the normalized Wasserstein distance between these frames according to the formulation given in Equation (15). The method provides a consistent metric for quantifying the distance between detected object distributions, maintaining measurement validity regardless of bounding box overlap conditions. At the same time, NWD is insensitive to targets between different scales, so it is more appropriate to use it to measure the similarity between prediction frames and marker frames in small target images.
N W D ( N a , N b ) = exp W 2 2 ( N a , N b ) c
W 2 2 ( N a , N b ) = c x a , c y a , w a 2 , h a 2 T c x b , c y b , w b 2 , h b 2 T 2 2
where C is the normalization constant. We adopt the setting from the original NWD paper, defining it as the average absolute size of all target bounding boxes in the dataset. Specifically, following their configuration on the AI-TOD dataset, we set C to 12.8 pixels, W 2 2 ( N a , N b ) is a distance metric, and N a and N b denote the Gaussian distributions modeled by A = ( c x a , c y a , w a , h a ) and B = ( c x b , c y b , w b , h b ) . Since CIoU is more suitable for medium and large targets, this paper samples the method of combining CIoU with NWD, as shown in Equation (16), this enables the model to enhance the optimization weight and precision of the bounding box regression as defined in Equation (14), utilizing the Loss function specifically for position error calculation, and α denotes the weight share of CIoU, and α = 0.5 in this paper.
Loss = α · CIoU + ( 1 α ) · NWD

4. Experimental Results and Discussion

4.1. Datasets

4.1.1. Public Datasets

Yellow-Sticky-Traps-Datasets [38]
The experimental dataset comprises 284 static-captured images of yellow sticky insect boards, containing 8114 annotated instances across three insect categories (MR, NC, WF). Following standard practice, we partitioned the data into training (70%), validation (20%), and test (10%) sets. Considering that the research in this paper focuses on small-target detection, no segmentation process was performed on the images. Instead, images of 5184 × 3456 pixels were directly inputted into the model, which changed the original 141 × 120, 125 × 129, and 55 × 50 labeling frames of MR, NC, and WF categories to 17.41 × 14.81, 15.43 × 15.93, and 6.79 × 6.17 [39].
VisDrone2019 [40]
The collection comprises a total of 6471 images for training, 548 for validation, and 1610 for testing purposes captured across diverse urban environments including streets, public squares, parks, educational institutions, and residential areas. Annotations span ten object categories: pedestrians, individuals, bicycles, trains, trucks, tricycles, shaded tricycles, buses, and motorcycles. The image resolutions range from 2000 × 1500 to 960 × 540. The dataset focuses on small target detection, with 60% of the instances being less than 20 pixels and 25% between 20 and 30.

4.1.2. Self-Buit Datasets

Data Collection
The CottonPest2 dataset was collected through field photography at an experimental cotton plantation located in Huaxing Farm (44°22′ N, 87°29′ E), Changji Hui Autonomous Prefecture, Xinjiang, China. We photographed the dataset using a resolution of 3264 × 2448 Raspberry Pi 4b to ensure that the image quality was sufficient to capture the subtle features of the pests. The distance between the Raspberry Pi and the yellow sticky board was kept at about 20 cm and the images were saved in png format. Also to prevent the effect of light variations on image acquisition, the yellow sticky insect board was placed on a LED lamp. the LED lamp provides a high and uniform light source, which ensures that each part of the yellow sticky insect board is uniformly illuminated and avoids the problem of uneven illumination due to natural light or normal light sources. The image collection was systematically conducted between July and August 2024 at 2–3 day intervals, yielding 144 annotated insect specimens captured under varying meteorological conditions and field scenarios. The dataset specifically includes two small-target pest species: aphids and thrips.
Dataset Preparation
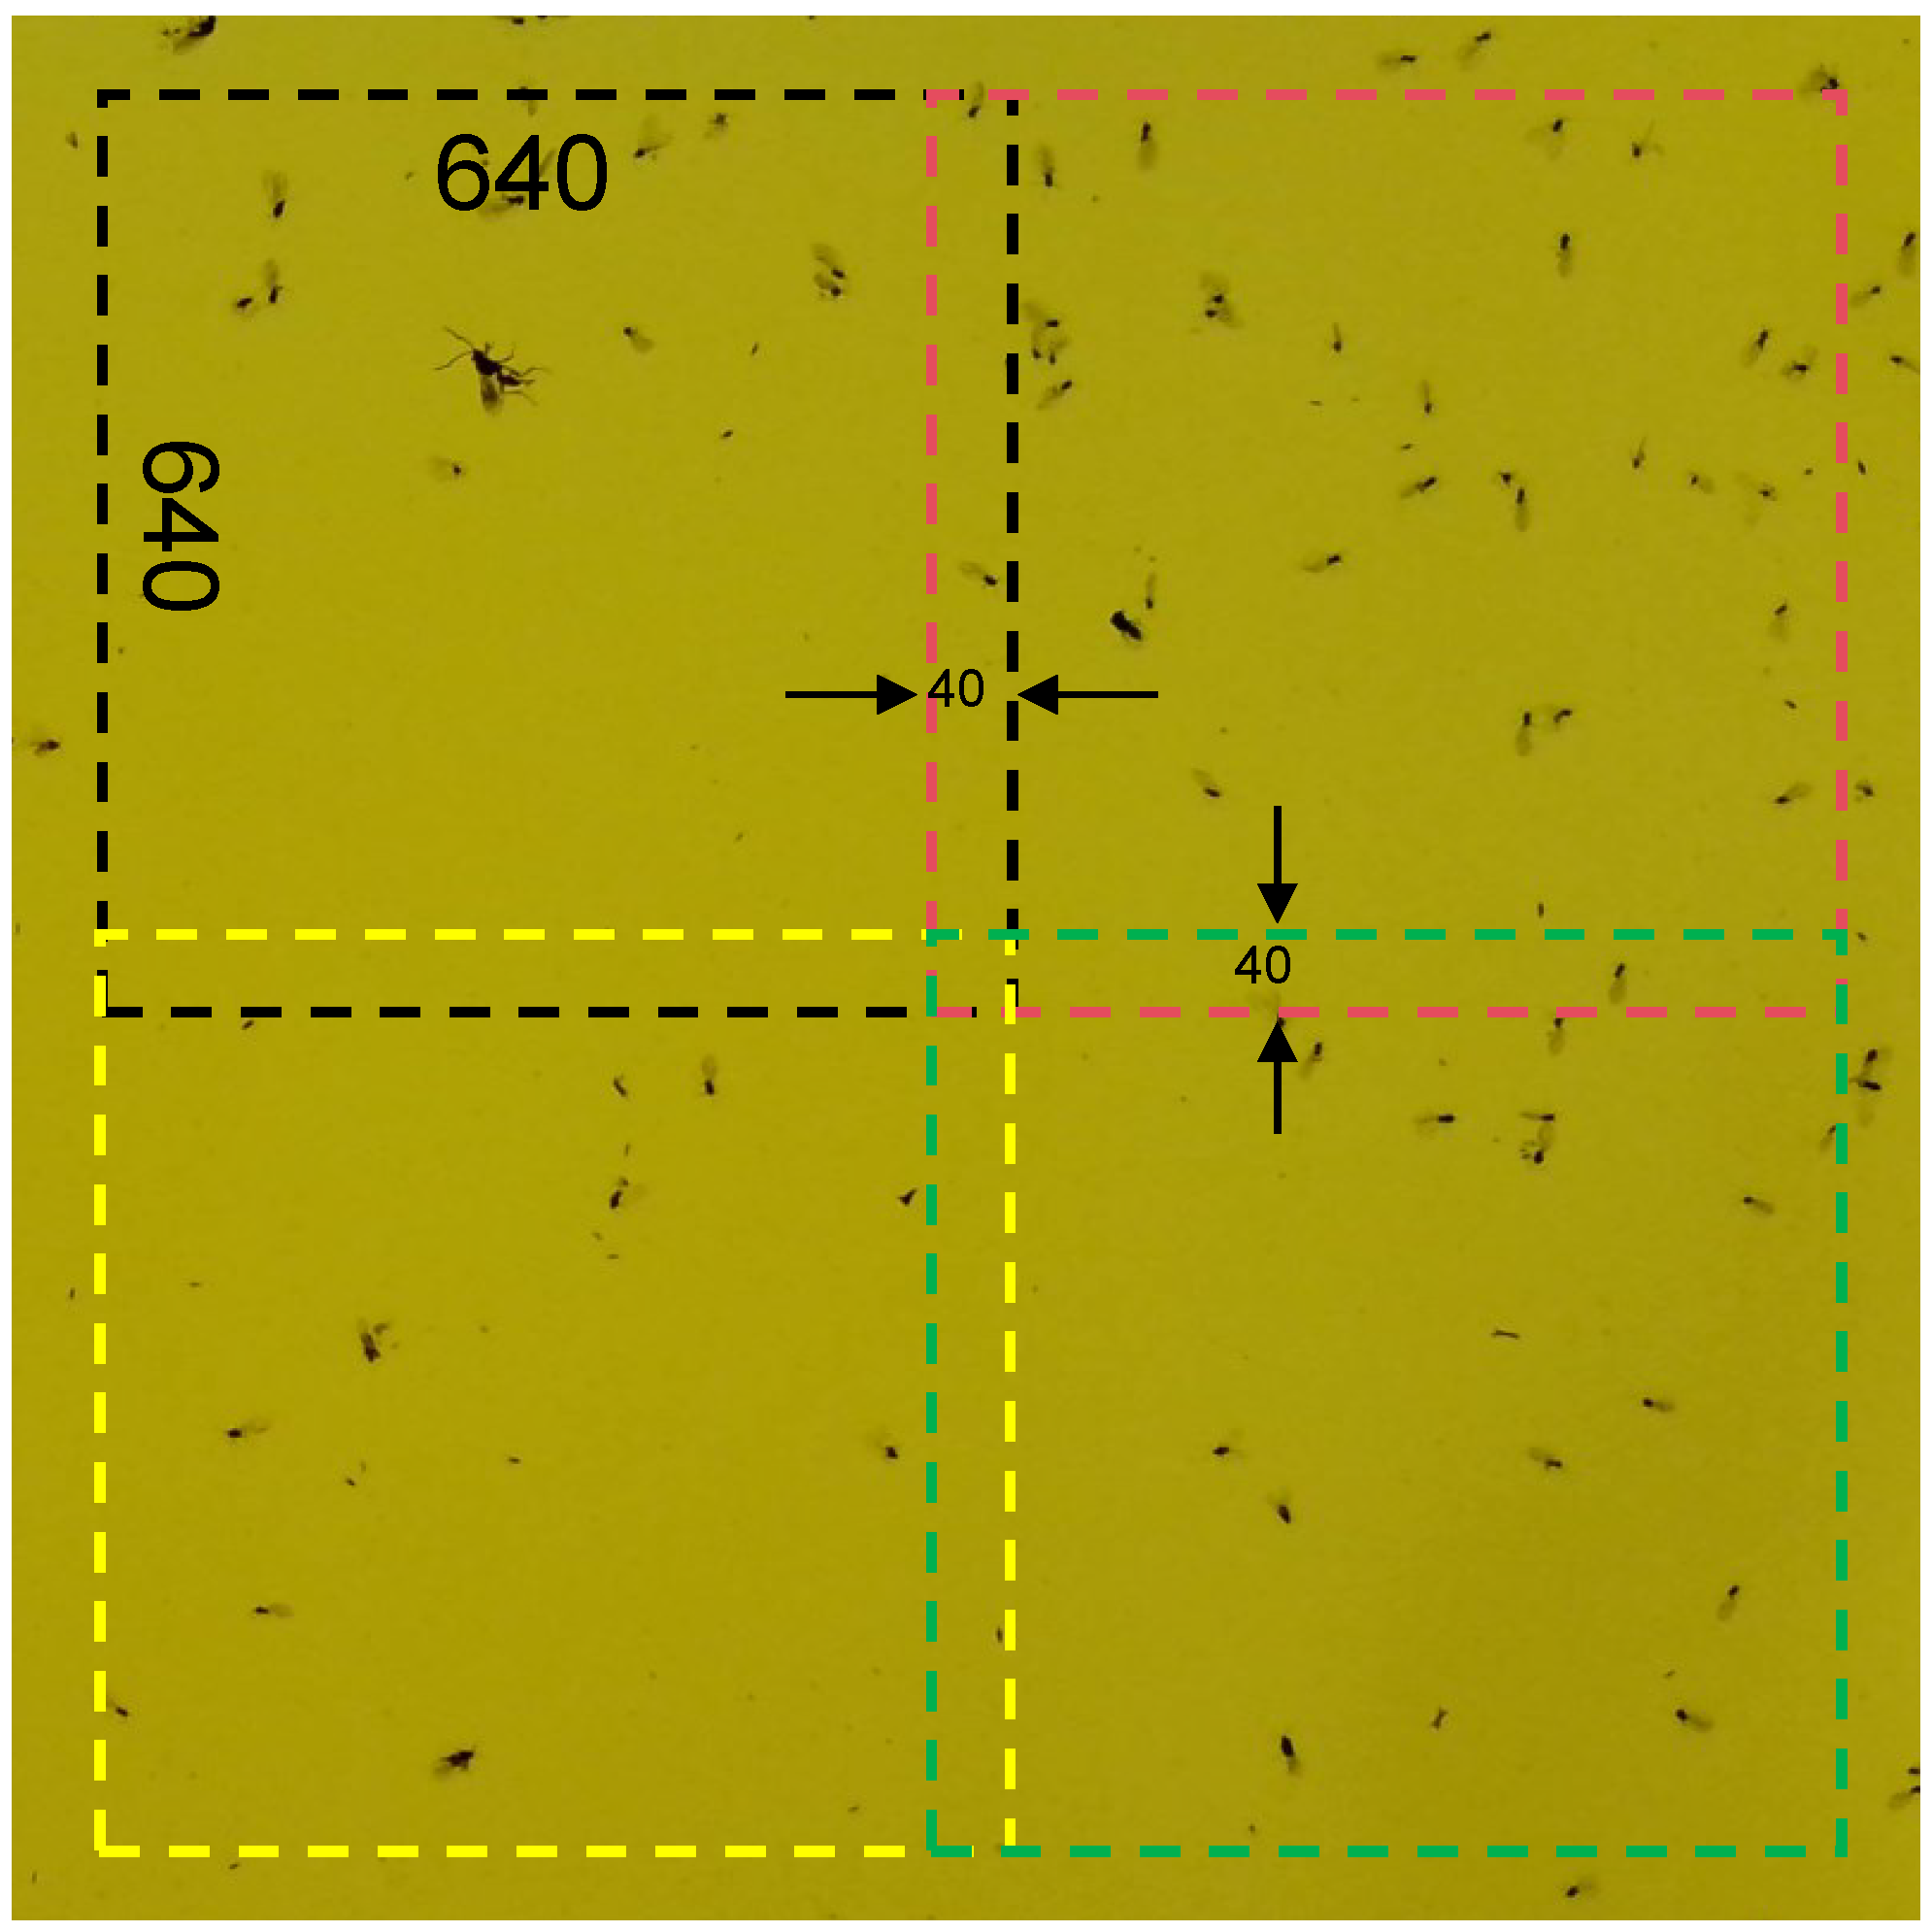
Image annotations were manually performed using the LabelImg tool, with annotations initially saved in PASCAL VOC XML format and subsequently converted to TXT format for model training. Since the target instances of the dataset are too small, if the dataset is directly fed into the model it will result in an equal scale reduction of the image leading to compression of the instances, resulting in the loss of useful information related to the small target. So in this paper, the dataset is segmented into 640 × 640 pixels and two neighboring images are overlapped by 40 pixels to ensure that as many instances as possible are not segmented, as shown in Figure 6. After segmentation, a total of 2437 images (640 × 640) were obtained, and then the dataset is divided into 1705 training sets, 488 validation sets, and 244 test sets in the ratio of 7:2:1. Table 1 provides an overview of our dataset.
According to the COCO dataset definition, we define objects with a resolution of less than 32 × 32 pixels as small targets. According to the data in Table 1, our self-built dataset Cottonpest2 consists mainly of small targets. This indicates that this dataset is well suited for evaluating and training models for small target detection.

4.2. Experimental Environment and Evaluation Indicators

In this experiment, we built a high-performance computing environment based on Ubuntu 20.04.1 LTS operating system to support efficient training and evaluation of deep learning models. The environment is equipped with NVIDIA A40 GPUs, Intel Xeon Gold 5218R CPU@2.10GHz, and 256GB RAM to ensure powerful computing power and data processing speed. In addition, we utilized CUDA 12.2 and PyTorch v2.2.2 frameworks, as well as Python v3.10 programming language to build a stable and efficient experimental platform, which provides a solid foundation for the development and testing of small-target pest detection models. The hyperparameter sets used in training are summarized in Table 2, with all other hyperparameters kept at their default values. Unless otherwise specified, all models were trained from scratch without any pretraining. The performance of small-target pest detection in MSDS-YOLO is measured by a series of key parameters. The key metrics include the number of Params, GFLOPs, model size ( MB), model stability (F1-Score), mAP50, and mAP0.5:0.95.

4.3. Experimental Results and Discussion

4.3.1. Comparative Analysis of Detection Model Performance Metrics

We performed comprehensive benchmarking experiments to assess MSDS-YOLO’s detection capabilities against current state-of-the-art methods through rigorous comparative analysis. Its comparison with other mainstream target detection algorithms includes YOLOv3 [41], YOLOv5 [42], YOLOv7 [43], YOLOv8 [44], YOLOv9 [45], GELAN [45], YOLOv10 [46], YOLOv11 [47], YOLOv12 [48]. The validity of the proposed model was verified by comparing it on the public datasets yellow-sticky-traps-datasets and Visdrone2019 and the self-constructed dataset Cottonpest2.
Cottonpest2 Dataset
The experimental design of this study aims to provide a comprehensive evaluation of the proposed MSDS-YOLO model through two main dimensions. First, we compare the performance of MSDS-YOLO with current state-of-the-art detectors to verify its superiority in small target detection tasks. Second, we performed a comprehensive comparison of the performance of MSDS-YOLO on key performance metrics, including the number of parameters, GFLOPs, model size, F1-Score, mAP50, and mAP0.5:0.95. Table 3 demonstrates the performance comparison between the YOLO family of methods, and the results clearly show that MSDS-YOLO significantly outperforms all the metrics of the comparison methods.
In evaluating the performance of YOLOv3-Tiny and YOLOv7n, we found that they have relatively high parameter counts and model sizes, and their detection accuracies are considerably lower compared to other models. This finding suggests that YOLOv3-Tiny and YOLOv7n lack sufficient feature extraction capability in small target detection. In contrast, the four models, YOLOv5n, GELAN-t, YOLOv11n and YOLOv12n, attained a more optimal trade-off regarding the number of parameters and the computational effort, and even though their model sizes were not very large, they achieved average accuracies of 84.5%, 84.1%, 83.7%, and 83.7%, respectively, although there is still a large compared to the MSDS-YOLO model gap.
Further analyzing YOLOv8n, YOLOv9-t, and YOLOv10n, we find that their parameter counts and model sizes are similar to those of the MSDS-YOLO model, but the detection accuracies of the MSDS-YOLO model are significantly better than these three models. This indicates that MSDS-YOLO achieves higher detection accuracy while maintaining model complexity.
The MSDS-YOLO model achieves an F1-Score of 80.83%, with mAP50 and mAP(50–90) of 86.7% and 40.6%, respectively. While ensuring high accuracy, the model maintains a parameter count of 2.8 M and a model size of 10.75 MB, which significantly reduces the storage and memory requirements of the model. Although the GFLOPs of the MSDS-YOLO model are slightly higher, this increase is due to the optimization of the DSFPN module for small-target detection, which enhances the utilization of contextual information between different feature maps, and seamlessly incorporates contextual information across various scales, thereby enhancing the precision and accuracy in detecting small targets. This optimization not only improves the performance of the model, but also provides a more effective solution for the small target detection task.
Public Dataset
Table 4 demonstrates the comparative performance analysis of the MSDS-YOLO model with nine different YOLO series detection methods on two different datasets. These evaluation metrics show that our MSDS-YOLO model achieves optimal detection accuracy on different small-target datasets.
In the comparison experiments on Yellow-Sticky-Traps-Datasets, the F1-Score and mAP50 of the MSDS-YOLO model compared to YOLOv3-Tiny, YOLOv5n, YOLOv7n, YOLOv8n, YOLOv9-t, GELAN-t, YOLOv10n, YOLOv11n and YOLOv12n improved by 30.61% and 40.8%, 2.65% and 5.9%, 18.87% and 21.5%, 5.77% and 7.6%, 12.88% and 12.3%, 11.49% and 10.6%, 8.5% and 7.7%, 4.96% and 5.3%, and 5.25% and 4.0%, respectively. In comparative experiments on the VisDrone2019 dataset, the MSDS-YOLO model achieved significant improvements over the aforementioned models in F1-Score and mAP50, with increases of 16.93% and 17.8%, 8.08% and 8.2%, 0.04% and 1.0%, 3.82% and 3.9%, 20.3% and 0.3%, 1.59% and 1.2%, 3.79% and 3.6%, 4.0% and 4.1%, and 4.22% and 4.1%, respectively.
The MSDS-YOLO model proposed in this paper significantly improves the performance of small target detection. Existing feature extraction and fusion methods may not be able to fully utilize the global information, capture certain detailed features insufficiently, or may lose part of the original information during the feature fusion process, especially when the fusion method is not fine enough. To address these issues, the dynamic multi-scale feature extraction and dimensionally selective feature pyramid network proposed by MSDS-YOLO can effectively deal with the above challenges. The C3k2_DMSFE module effectively captures multi-scale and diversified feature information through adaptive tuning and cross-layer information fusion. The DSFPN module reduces information loss in the process of information fusion at different scales by utilizing the contextual information of the target information. Therefore, compared with other models, the MSDS-YOLO model proposed in this paper can more accurately detect the location of small-target objects.
In addition, the MSDS-YOLO model has a low number of parameters and model size while maintaining high accuracy, significantly reducing the storage and memory requirements of the model. Although the GFLOPs of the MSDS-YOLO model are slightly higher, this increase is due to the optimization of the DSFPN module for small-target detection, which enhances the utilization of contextual information between different feature maps, and fully integrates the contextual information between different scales, thus improving the localization and recognition ability of small-target detection. This optimization not only improves the performance of the model, but also provides a more effective solution for the small-target detection task. Overall, the MSDS-YOLO model shows excellent performance in small-target detection and provides an effective technical tool for pest monitoring in agricultural production.

4.3.2. Ablation Experiments

To assess the effectiveness of the proposed enhancement method on model performance, we performed a series of ablation studies. These studies involved incrementally incorporating various modules into the baseline model. The outcomes of these experiments are detailed in Table 5.
Table 5 illustrates the findings from the ablation study conducted using self-built Cottonpest2 dataset. The experiments show that our baseline model achieves a mAP50 of 83.7% and an F1-Score of 78.55% on all categories. Conversely, the inclusion of solely the C3k2_DMSFE module results in a boost of 1.6% in mAP50 and 0.54% in the F1-Score, a result that demonstrates the ability of the C3k2_DMSFE module to adaptively effectiveness of the C3k2_DMSFE module in utilizing multi-scale feature information to enhance small target detection performance. Further, using the DSFPN module alone can improve the mAP50 and F1-Score by 2.3% and 1.6%, respectively, which fully demonstrates the ability of the DSFPN module in utilizing contextual information at different scales. In addition, the use of NWD combined with the CIoU loss function is able to improve the mAP50 and F1-Score by 0.9% and 1.4%, respectively, which indicates that NWD is insensitive to target scale variations and has better stability for small-target detection.
When these three modules are used in combination of two, they can all improve the detection performance of small targets to different degrees compared with the baseline model. Ultimately, when C3k2_DMSFE, DSFPN and NWD loss function are combined, the model’s mAP50 reaches 86.7% and the F1-Score reaches 80.83%, which are 3% and 2.28% improvement compared to the baseline YOLO11n model, showing the optimal performance among all the evaluated metrics. Considering the data presented, it is evident that the improved model is more suitable for the task of detecting small-target pests in field environments.

4.4. Visualization Analysis

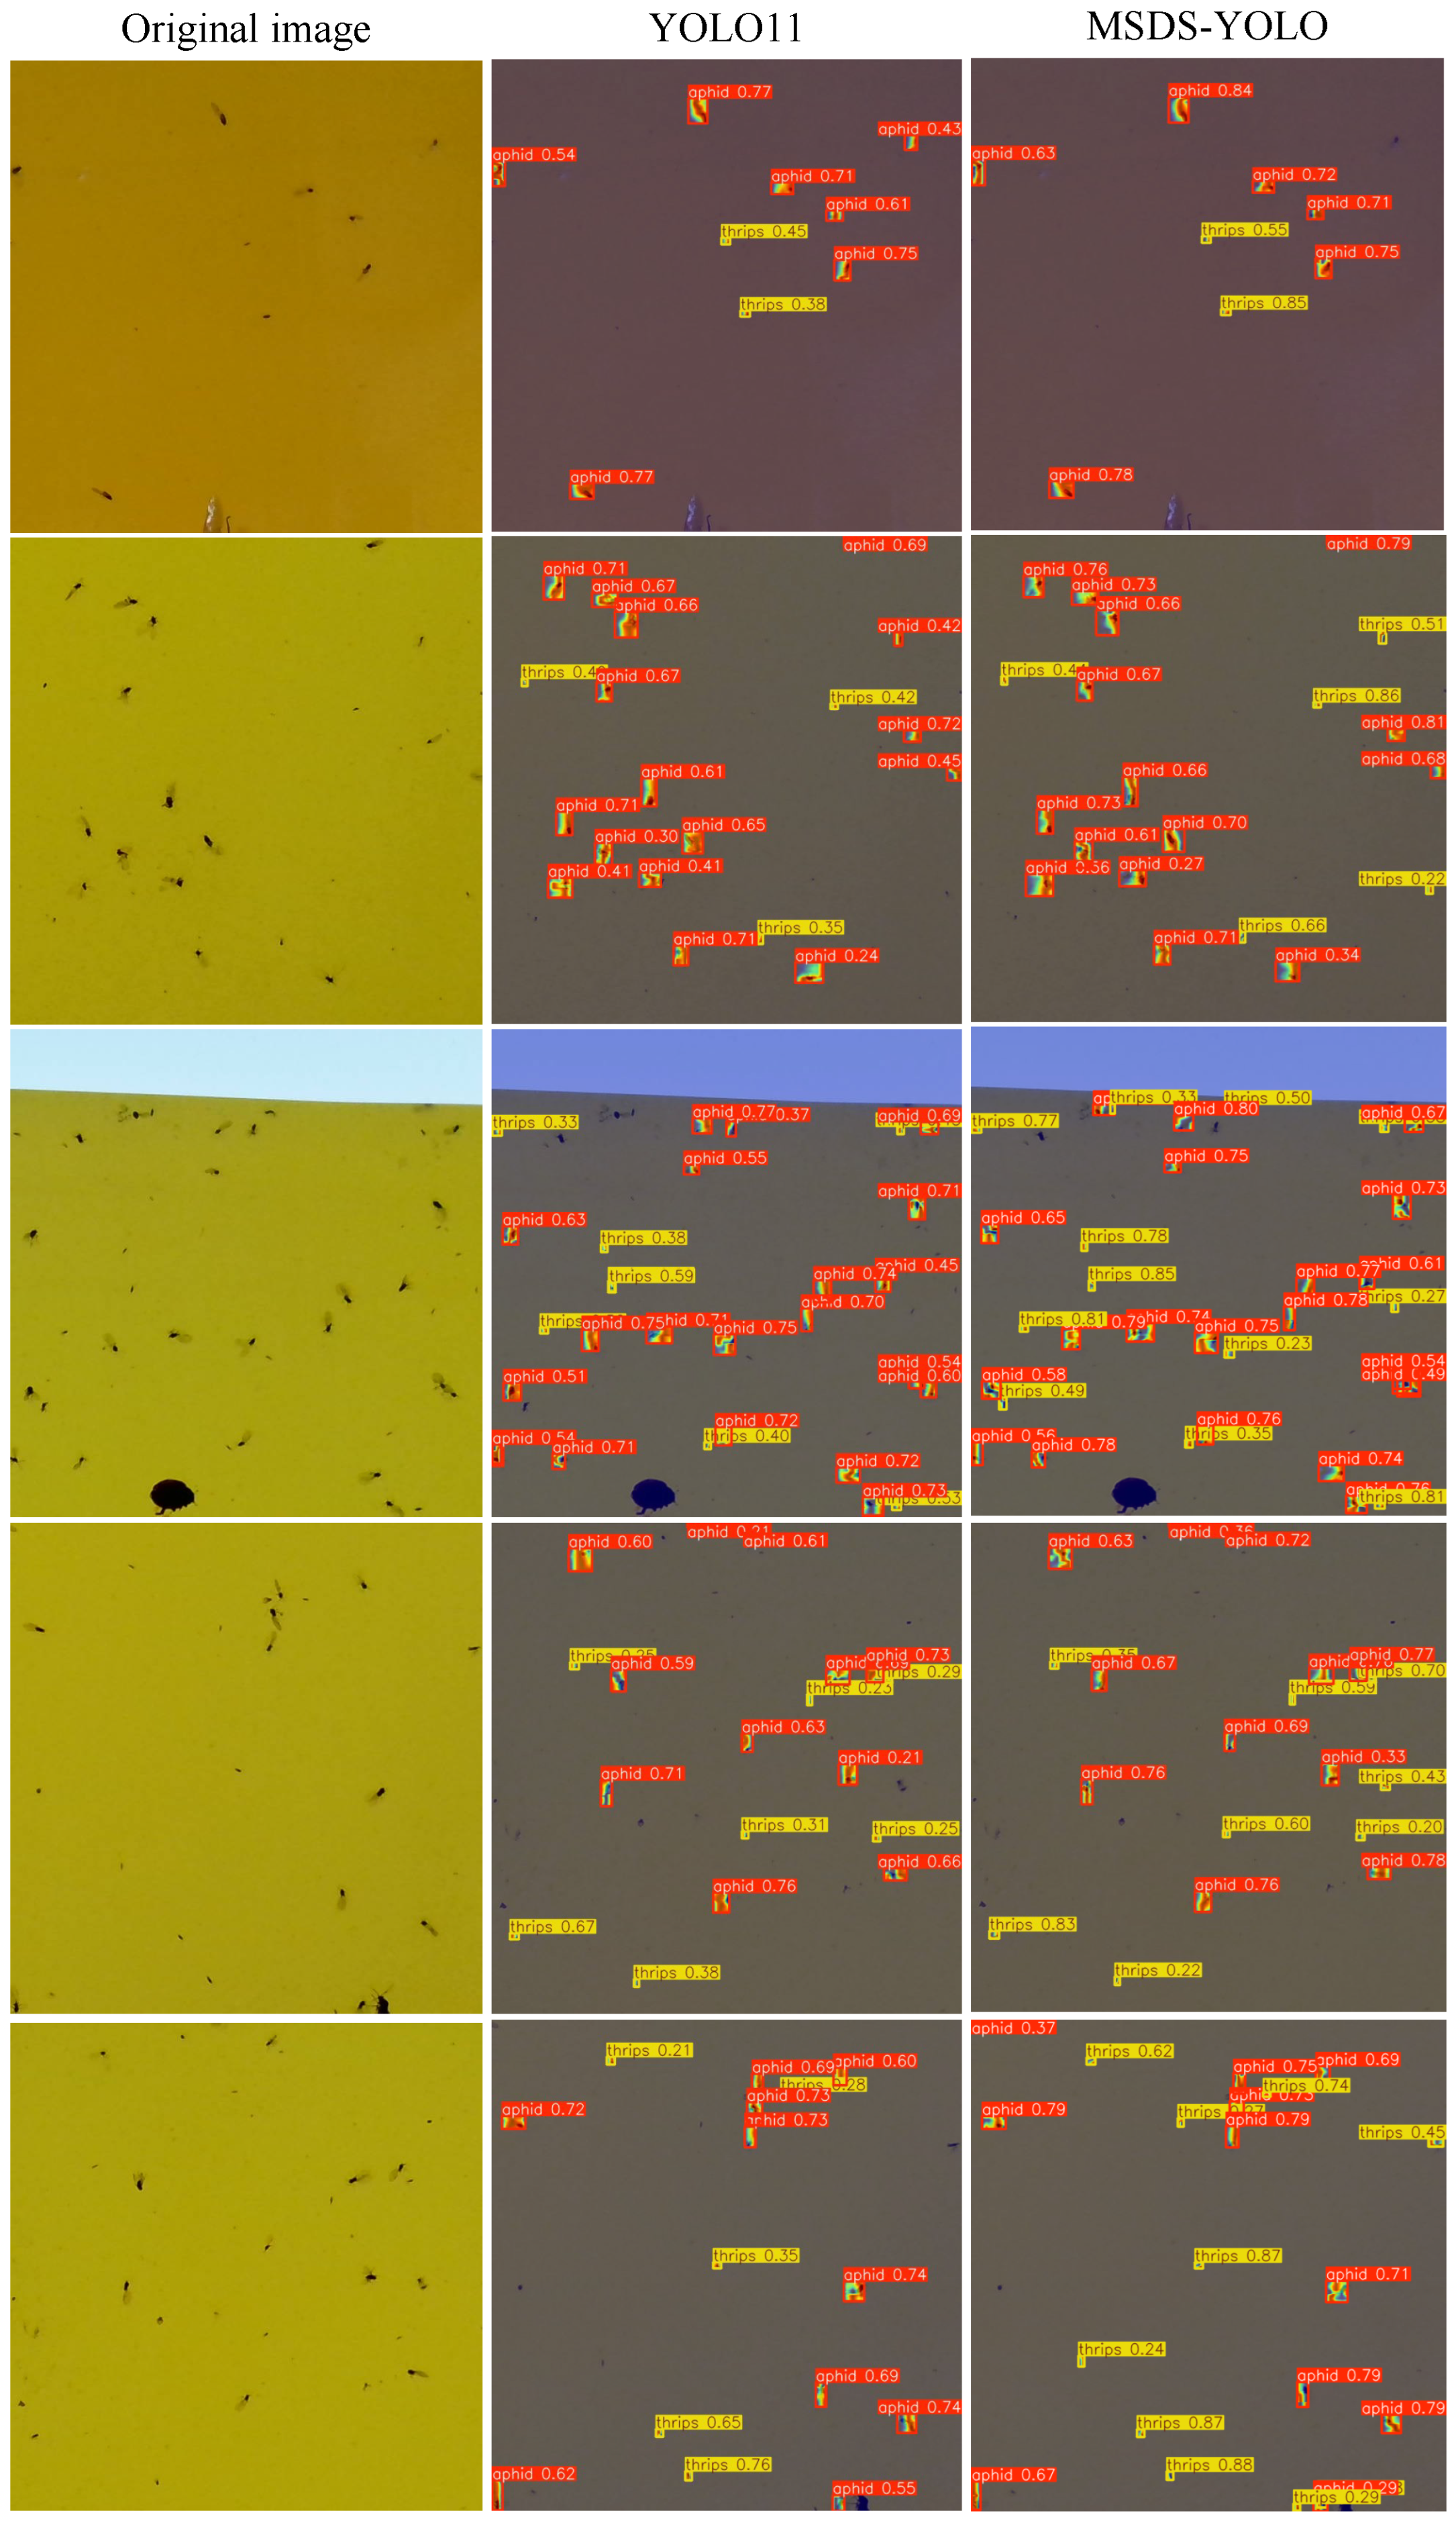
Examining the performance of pest detection methods through a visual analysis specific to cotton fields, our MSDS-YOLO model demonstrated significantly better performance than YOLOv11. The model enhances detection precision by not only increasing the accuracy of identifications but also substantially decreasing the rates of false positives and false negatives. Consequently, it bolsters the reliability of small-target pest detection in agricultural settings.
Figure 7 shows the detection results of five images selected from the selected test set that reveal the pest species and detection confidence, visually comparing the detection effectiveness of the MSDS-YOLO model with the baseline model. In contrast, the YOLOv11 model suffers from misdetection and omission in the detection of small-target pests and its detection confidence is lower than that of MSDS-YOLO. This indicates that YOLOv11 has lower detection accuracy and misidentification is more common when recognizing smaller or densely distributed targets. On the other hand, the MSDS-YOLO model shows superior performance in detecting smaller or densely distributed targets, which verifies that the introduction of dynamic multiscale feature extraction and dimensionality selective feature pyramid network can effectively utilize the multiscale information of small-targeted pests to enhance the detection performance of small-targeted pests and reduce the risk of missed and misidentified detection.
In summary, the visual assessment outcomes robustly showcase the MSDS-YOLO model’s capability to precisely identify small-target pests, highlighting its promising utility for real-world pest surveillance and control initiatives.

4.5. Model Deployment

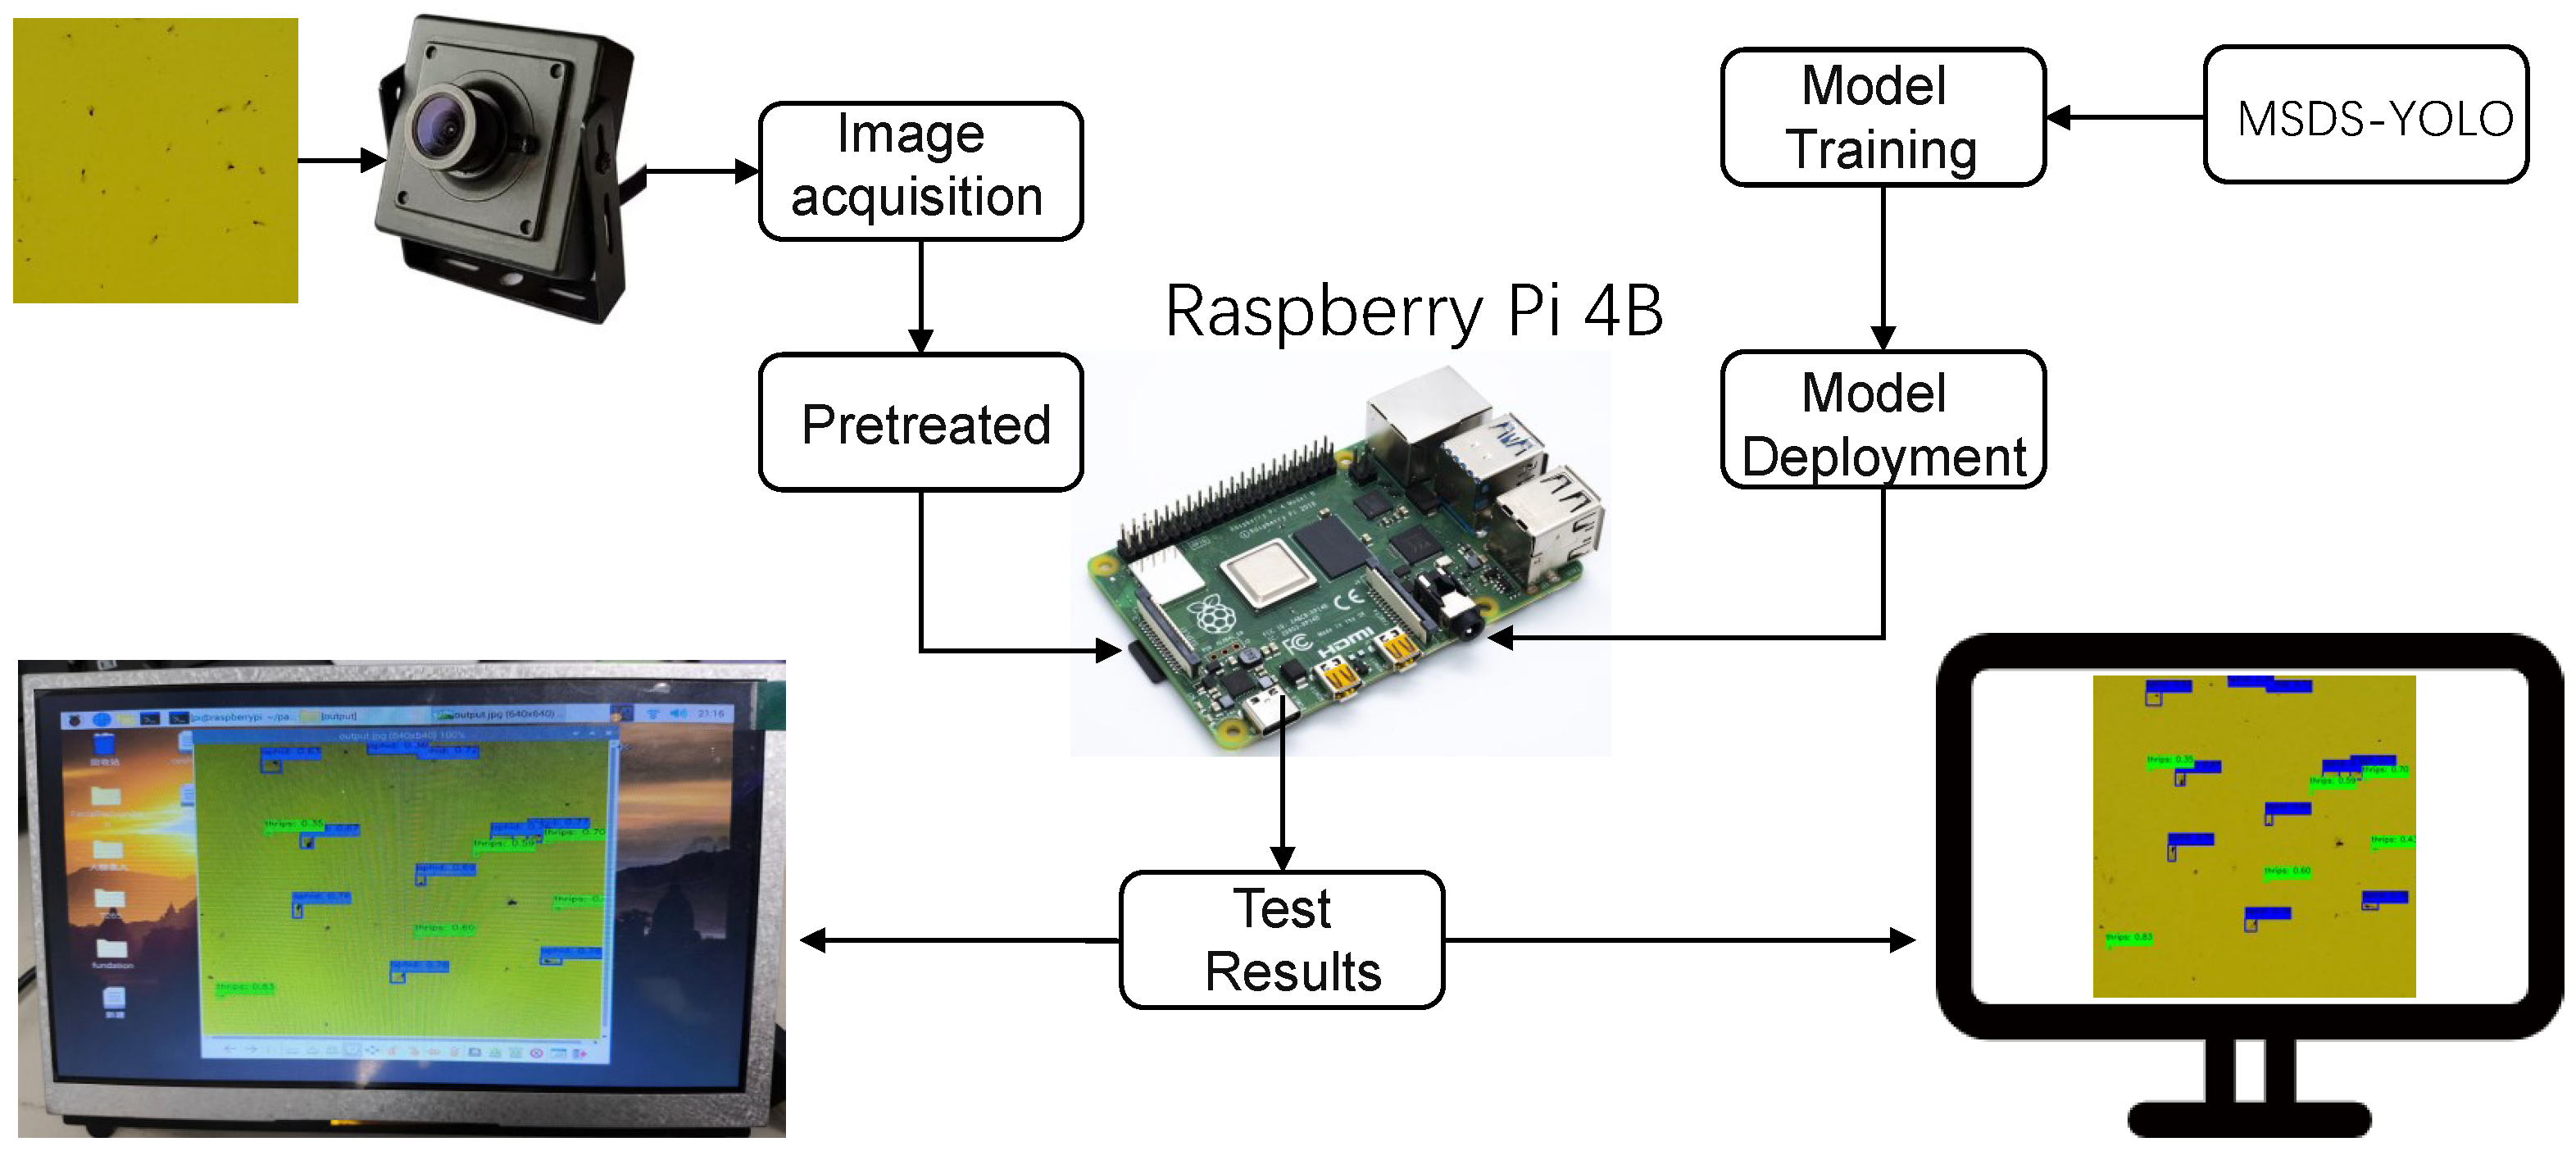
In order to put the MSDS-YOLO model into practical applications, we constructed a pest detection system that uses a Raspberry Pi 4B as the main control unit. The system captures pest images in real time through a connected camera, and processes and detects them instantly. The detection results can be optionally stored on the Raspberry Pi 4B or wirelessly transmitted to a personal computer. By deploying the MSDS-YOLO model to the Raspberry Pi, we realize the close integration of IoT technology and smart detection, which greatly improves the automation and efficiency of pest monitoring and brings significant enhancement to smart agricultural management.
As shown in the system flowchart in Figure 8, we first deploy the trained MSDS-YOLO model to the Raspberry Pi 4B, and then use the camera to capture pest images. The captured images are preprocessed and subsequently analyzed for detection. The detection results can not only be saved on the Raspberry Pi, but also automatically synchronized to the computer. The system developed in this research is able to realize real-time detection of pests in smart farms, providing a practical solution for real-time automated management of pests in farms, which in turn promotes the intelligence and precision of agricultural production.

5. Conclusions

In this paper, we propose a new target detection method, MSDS-YOLO, specifically designed to enhance the detection performance of small-target pests. The model consists of three core modules: a dynamic multi-scale feature extraction module, a dimensionally selected feature pyramid network, and a combination of CIoU and NWD as a localization loss function. The dynamic multi-scale feature extraction module can adaptively adjust according to the different input features to effectively capture multi-scale and diverse feature information. The dimensionally selective feature pyramid network module, on the other hand, finely fuses the feature maps of different scales and enhances the feature utilization of small target information. The design of the localization loss function makes the model insensitive to small changes in target size, thus reducing the error. Together, these modules build an efficient and unified framework. In addition, this study constructed a farmland small-target pest dataset with the aim of advancing the development of small-target pest detection techniques in farmland environments. Experimental evaluations on the publicly available datasets Yellow-Sticky-Traps-Datasets, VisDrone2019, and the self-constructed dataset Cottonpest2 show that our proposed method achieves satisfactory results in target detection accuracy. A large number of experimental results confirm the superiority of MSDS-YOLO over other YOLO family of target detection algorithms.
Although the MSDS-YOLO model achieves significant improvement in detection accuracy, it still has some limitations. First, although the introduction of the dimensionally selected feature pyramid network improves the accuracy of small-target detection, it also brings the problem of additional computational overhead and parameter increase, which may affect the operation speed of the model. Secondly, this study involves only two small-target pests with a single sample species, which lacks the ability to detect other potential pests. This limitation may affect the generalizability of the results of the study and cannot fully reflect the detection effect of different pest species in practical application scenarios.
In future work, we plan to increase the number of pest species in the dataset so that the model can learn more pest characteristics. In addition, we will conduct multi-session tests in different ecological environments and agricultural scenarios to validate the performance of the model. Ultimately, our ongoing efforts are directed towards devising more efficient algorithms aimed at lowering the computational load and enhancing the system’s real-time capabilities. These advancements will expand the practicality and broaden the application horizons of the model.

Author Contributions

J.L.: Writing—original draft, Formal analysis, Methodology, Data curation, Conceptualization. W.L.: Writing—review & editing, Conceptualization. Z.J.: Writing—review & editing, Project administration, Funding acquisition. G.Z.: Writing— review & editing, Methodology, Conceptualization. J.W.: Writing—review & editing, Resources, Project administration. G.C.: Investigation, Formal analysis, Data curation. Y.W.: Investigation, Formal analysis, Data curation. Y.G.: Writing—review & editing, Conceptualization. All authors have read and agreed to the published version of the manuscript.

Funding

This work was supported by the Major Science and Technology Innovation Project of the Ministry of Science and Technology of China (No. 2022ZD0115802) and Research Project of Xinjiang Space-Air-Ground Integrated Intelligent Computing Technology Laboratory (No. 2025A05-1) and the Tianshan Talent Training Project-Xinjiang Science and Technology Innovation Team Program (No. 2023TSYCTD0012).

Institutional Review Board Statement

Not applicable.

Informed Consent Statement

Not applicable.

Data Availability Statement

The raw data supporting the conclusions of this article will be made available by the authors on request.

Conflicts of Interest

The authors declare that they have no known competing financial interests or personal relationships that could have appeared to influence the work reported in this paper.

References

  1. Chen, P.; Xiao, Q.; Zhang, J.; Xie, C.; Wang, B. Occurrence prediction of cotton pests and diseases by bidirectional long short-term memory networks with climate and atmosphere circulation. Comput. Electron. Agric. 2020, 176, 105612. [Google Scholar] [CrossRef]
  2. Jing, R.; Zhang, W.; Li, Y.; Li, W.; Liu, Y. Feature aggregation network for small object detection. Expert Syst. Appl. 2024, 255, 124686. [Google Scholar] [CrossRef]
  3. Chen, X.; Fang, H.; Lin, T.-Y.; Vedantam, R.; Gupta, S.; Dollár, P.; Zitnick, C.L. Microsoft COCO Captions: Data collection and evaluation server. arXiv 2015, arXiv:1504.00325. [Google Scholar] [CrossRef]
  4. Viola, P.; Jones, M. Rapid object detection using a boosted cascade of simple features. In Proceedings of the 2001 IEEE Computer Society Conference on Computer Vision and Pattern Recognition, Kauai, HI, USA, 8–14 December 2001. [Google Scholar]
  5. Lowe, D.G. Distinctive image features from scale-invariant keypoints. Int. J. Comput. Vis. 2004, 60, 91–110. [Google Scholar] [CrossRef]
  6. Dalal, N.; Triggs, B. Histograms of oriented gradients for human detection. In Proceedings of the IEEE Conference on Computer Vision and Pattern Recognition (CVPR 2005), San Diego, CA, USA, 20–25 June 2005; IEEE: Piscataway, NJ, USA, 2005; Volume 1, pp. 886–893. [Google Scholar] [CrossRef]
  7. Cortes, C.; Vapnik, V. Support-vector networks. Mach. Learn. 1995, 20, 273–297. [Google Scholar] [CrossRef]
  8. Schapire, R.E. Explaining adaboost. In Empirical inference: Festschrift in Honor of Vladimir N. Vapnik; Schölkopf, B., Luo, Z., Vovk, V., Eds.; Springer: Berlin/Heidelberg, Germany, 2013; pp. 37–52. [Google Scholar]
  9. Ye, Y.; Huang, Q.; Rong, Y.; Yu, X.; Liang, W.; Chen, Y.; Xiong, S. Field detection of small pests through stochastic gradient descent with genetic algorithm. Comput. Electron. Agric. 2023, 206, 107694. [Google Scholar] [CrossRef]
  10. Li, W.; Zheng, T.; Yang, Z.; Li, M.; Sun, C.; Yang, X. Classification and detection of insects from field images using deep learning for smart pest management: A systematic review. Ecol. Inform. 2021, 66, 101460. [Google Scholar] [CrossRef]
  11. Ren, S.; He, K.; Girshick, R.; Sun, J. Faster R-CNN: Towards real-time object detection with region proposal networks. IEEE Trans. Pattern Anal. Mach. Intell. 2017, 39, 1137–1149. [Google Scholar] [CrossRef]
  12. Redmon, J.; Divvala, S.; Girshick, R.; Farhadi, A. You only look once: Unified, real-time object detection. In Proceedings of the IEEE Conference on Computer Vision and Pattern Recognition, Las Vegas, NV, USA, 27–30 June 2016; pp. 779–788. [Google Scholar]
  13. Xie, Y.-L.; Lin, C.-W. YOLO-ResTinyECG: ECG-based lightweight embedded AI arrhythmia small object detector with pruning methods. Expert Syst. Appl. 2025, 263, 125691. [Google Scholar] [CrossRef]
  14. Tian, Y.; Wang, S.; Li, E.; Yang, G.; Liang, Z.; Tan, M. MD-YOLO: Multi-scale Dense YOLO for small target pest detection. Comput. Electron. Agric. 2023, 213, 108233. [Google Scholar] [CrossRef]
  15. Hu, X.; Li, X.; Huang, Z.; Chen, Q.; Lin, S. Detecting tea tree pests in complex backgrounds using a hybrid architecture guided by transformers and multi-scale attention mechanism. J. Sci. Food Agric. 2024, 104, 3570–3584. [Google Scholar] [CrossRef]
  16. Wang, J.; Wang, J. A lightweight YOLOv8 based on attention mechanism for mango pest and disease detection. J. Real-Time Image Process. 2024, 21, 136. [Google Scholar] [CrossRef]
  17. Tang, Z.; Lu, J.; Chen, Z.; Qi, F.; Zhang, L. Improved Pest-YOLO: Real-time pest detection based on efficient channel attention mechanism and transformer encoder. Ecol. Inform. 2023, 78, 102340. [Google Scholar] [CrossRef]
  18. Hu, J.; Li, Z.; Huang, H.; Hong, T.; Jiang, S.; Zeng, J. Citrus psyllid detection based on improved YOLOv4-Tiny model. Trans. Chin. Soc. Agric. Eng. 2021, 37, 197–203. [Google Scholar]
  19. Chu, J.; Li, Y.; Feng, H.; Weng, X.; Ruan, Y. Research on Multi-Scale Pest Detection and Identification Method in Granary Based on Improved YOLOv5. Agriculture 2023, 13, 364. [Google Scholar] [CrossRef]
  20. Xu, H.; Zheng, W.; Liu, F.; Li, P.; Wang, R. Unmanned Aerial Vehicle Perspective Small Target Recognition Algorithm Based on Improved YOLOv5. Remote Sens. 2023, 15, 3583. [Google Scholar] [CrossRef]
  21. Guo, A.; Jia, Z.; Ge, B.; Chen, W.; Song, S.; He, C.; Zhou, G.; Wang, J.; Lv, X. RLCFE-Net: A reparameterization large convolutional kernel feature extraction network for weed detection in multiple scenarios. Expert Syst. Appl. 2025, 274, 126941. [Google Scholar] [CrossRef]
  22. Bai, C.; Zhang, K.; Jin, H.; Qian, P.; Zhai, R.; Lu, K. SFFEF-YOLO: Small object detection network based on fine-grained feature extraction and fusion for unmanned aerial images. Image Vis. Comput. 2025, 156, 105469. [Google Scholar] [CrossRef]
  23. Jiang, L.; Yuan, B.; Du, J.; Chen, B.; Xie, H.; Tian, J.; Yuan, Z. MFFSODNet: Multiscale Feature Fusion Small Object Detection Network for UAV Aerial Images. IEEE Trans. Instrum. Meas. 2024, 73, 1–14. [Google Scholar] [CrossRef]
  24. Dong, S.; Teng, Y.; Jiao, L.; Du, J.; Liu, K.; Wang, R. ESA-Net: An efficient scale-aware network for small crop pest detection. Expert Syst. Appl. 2024, 236, 121308. [Google Scholar] [CrossRef]
  25. Iqra; Giri, K.J. SO-YOLOv8: A novel deep learning-based approach for small object detection with YOLO beyond COCO. Expert Syst. Appl. 2025, 280, 127447. [Google Scholar]
  26. Ding, S.; Xiong, M.; Wang, X.; Zhang, Z.; Chen, Q.; Zhang, J.; Wang, X.; Zhang, Z.; Li, D.; Xu, S.; et al. Dynamic feature and context enhancement network for faster detection of small objects. Expert Syst. Appl. 2025, 265, 125732. [Google Scholar]
  27. Zhang, Y.; Zhang, H.; Huang, Q.; Han, Y.; Zhao, M. DsP-YOLO: An anchor-free network with DsPAN for small object detection of multiscale defects. Expert Syst. Appl. 2024, 241, 122669. [Google Scholar] [CrossRef]
  28. Shi, P.; He, Q.; Zhu, S.; Li, X.; Fan, X.; Xin, Y. Multi-scale fusion and efficient feature extraction for enhanced sonar image object detection. Expert Syst. Appl. 2024, 256, 124958. [Google Scholar] [CrossRef]
  29. Zhang, Y.; Wu, C.; Guo, W.; Zhang, T.; Li, W. CFANet: Efficient Detection of UAV Image Based on Cross-Layer Feature Aggregation. IEEE Trans. Geosci. Remote Sens. 2023, 61, 1–11. [Google Scholar] [CrossRef]
  30. Zhang, Y.; Zhang, T.; Wu, C.; Tao, R. Multi-Scale Spatiotemporal Feature Fusion Network for Video Saliency Prediction. IEEE Trans. Multimed. 2024, 26, 4183–4193. [Google Scholar]
  31. Chen, Z.; Ji, H.; Zhang, Y.; Zhu, Z.; Li, Y. High-Resolution Feature Pyramid Network for Small Object Detection on Drone View. IEEE Trans. Circuits Syst. Video Technol. 2024, 34, 475–489. [Google Scholar] [CrossRef]
  32. Wang, H.; Liu, J.; Zhao, J.; Zhang, J.; Zhao, D. Precision and speed: LSOD-YOLO for lightweight small object detection. Expert Syst. Appl. 2025, 269, 126440. [Google Scholar] [CrossRef]
  33. Zhao, W.; Kang, Y.; Chen, H.; Zhao, Z.; Zhao, Z.; Zhai, Y. Adaptively Attentional Feature Fusion Oriented to Multiscale Object Detection in Remote Sensing Images. IEEE Trans. Instrum. Meas. 2023, 72, 1–11. [Google Scholar] [CrossRef]
  34. Yu, W.; Zhou, P.; Yan, S.; Wang, X. InceptionNeXt: When Inception Meets ConvNeXt. In Proceedings of the IEEE/CVF Conference on Computer Vision and Pattern Recognition (CVPR), Seattle, WA, USA, 16–22 June 2024; IEEE: Piscataway, NJ, USA, 2024; pp. 5672–5683. [Google Scholar]
  35. Shi, D. TransNeXt: Robust Foveal Visual Perception for Vision Transformers. In Proceedings of the IEEE/CVF Conference on Computer Vision and Pattern Recognition (CVPR), Seattle, WA, USA, 16–22 June 2024; IEEE: Piscataway, NJ, USA, 2024; pp. 17773–17783. [Google Scholar]
  36. Xu, S.; Zheng, S.; Xu, W.; Xu, R.; Wang, C.; Zhang, J.; Teng, X.; Li, A.; Guo, L. HCF-Net: Hierarchical Context Fusion Network for Infrared Small Object Detection. In Proceedings of the 2024 IEEE International Conference on Multimedia and Expo (ICME), Niagara Falls, ON, Canada, 15–19 July 2024; IEEE: Piscataway, NJ, USA, 2024; pp. 1–6. [Google Scholar]
  37. Wang, J.; Xu, C.; Yang, W.; Yu, L. A Normalized Gaussian Wasserstein Distance for Tiny Object Detection. arXiv 2021, arXiv:2110.13389. [Google Scholar]
  38. Nieuwenhuizen, A.; Hemming, J.; Janssen, D.; Suh, H.K.; Bosmans, L.; Sluydts, V.; Brenard, N.; Rodríguez, E.; Tellez, M. Raw data from Yellow Sticky Traps with insects for training of deep learning Convolutional Neural Network for object detection. Wagening. Univ. Res. 2019, 3, S2. [Google Scholar]
  39. Shi, J.; Jia, Y.; Zhou, G.; Wang, J.; Jia, Z. Small Target Insect Detection Based on Improved YOLOv8n. In Proceedings of the ICASSP 2025—2025 IEEE International Conference on Acoustics, Speech and Signal Processing (ICASSP), Hyderabad, India, 6–11 April 2025; IEEE: Piscataway, NJ, USA, 2025; pp. 1–5. [Google Scholar]
  40. Du, D.; Zhu, P.; Wen, L.; Bian, X.; Lin, H.; Hu, Q.; Peng, T.; Zheng, J.; Wang, X.; Zhang, Y.; et al. VisDrone-DET2019: The Vision Meets Drone Object Detection in Image Challenge Results. In Proceedings of the 2019 IEEE/CVF International Conference on Computer Vision Workshop (ICCVW), Seoul, Republic of Korea, 27–28 October 2019; IEEE: Piscataway, NJ, USA, 2019; pp. 213–226. [Google Scholar]
  41. Redmon, J.; Farhadi, A. YOLOv3: An Incremental Improvement. arXiv 2018, arXiv:1804.02767. [Google Scholar] [CrossRef]
  42. Jocher, G.; Stoken, A.; Borovec, J.; Liu, C.; Hogan, A.; Diaconu, L.; Poznanski, J.; Yu, L.; Rai, P.; Ferriday, R.; et al. ultralytics/yolov5: V3.0. Zenodo. 12 August 2020. Available online: https://zenodo.org/records/3983579 (accessed on 8 January 2026).
  43. Wang, C.-Y.; Bochkovskiy, A.; Liao, H.-Y.M. YOLOv7: Trainable Bag-of-Freebies Sets New State-of-the-Art for Real-Time Object Detectors. In Proceedings of the IEEE/CVF Conference on Computer Vision and Pattern Recognition (CVPR), Vancouver, BC, Canada, 18–22 June 2023; IEEE: Piscataway, NJ, USA, 2023; pp. 7464–7475. [Google Scholar]
  44. Yaseen, M. What is YOLOv8: An In-Depth Exploration of the Internal Features of the Next-Generation Object Detector. arXiv 2024, arXiv:2408.15857. [Google Scholar]
  45. Wang, C.-Y.; Yeh, I.-H.; Liao, H.-Y.M. YOLOv9: Learning What You Want to Learn Using Programmable Gradient Information. arXiv 2024, arXiv:2402.13616. [Google Scholar] [CrossRef]
  46. Wang, A.; Chen, H.; Liu, L.; Chen, K.; Lin, Z.; Han, J.; Ding, G. YOLOv10: Real-Time End-to-End Object Detection. arXiv 2024, arXiv:2405.14458. [Google Scholar]
  47. Khanam, R.; Hussain, M. YOLOv11: An Overview of the Key Architectural Enhancements. arXiv 2024, arXiv:2410.17725. [Google Scholar] [CrossRef]
  48. Tian, Y.; Ye, Q.; Doermann, D. Yolov12: Attention-centric real-time object detectors. arXiv 2025, arXiv:2502.12524. [Google Scholar]
Figure 1. Detailed architecture diagrams of MSDS-YOLO (a) Backbone. (b) Neck(DSFPN). (c) Head.
Applsci 16 00793 g001
Figure 2. Detail structure of the DynamicInceptionDWConv2d.
Applsci 16 00793 g002
Figure 3. Detail structure of the DynamicInceptionMixer.
Applsci 16 00793 g003
Figure 4. Detail structure of the DynamicIncMixerBlock.
Applsci 16 00793 g004
Figure 5. Detail structure of the dimensional selective feature pyramid network (DSFPN).
Applsci 16 00793 g005
Figure 6. Illustration of dataset segmentation.
Applsci 16 00793 g006
Figure 7. Visualization results of MSDS-YOLO model in Cottonpest2.
Applsci 16 00793 g007
Figure 8. Structure of the pest detection system in cotton fields.
Applsci 16 00793 g008
Table 1. Details of the labeled boxes in the Cottonpest2 dataset.
DatasetClassInstancesBox SizeTarget Amount
MaxSizeMinSizeSmallMediumLarge
Training Setaphids575454 × 5311 × 653044500
thrips429230 × 309 × 3429200
Val Setaphids174670 × 3811 × 716231230
thrips122633 × 289 × 3122600
Test Setaphids75152 × 4714 × 8653620
thrips58226 × 218 × 458200
Table 2. Hyperparameters used in the experiment.
ParameterSetup
Image size 640 × 640
Momentum 0.937
BatchSize8
Epoch750
Patience100
Initial learning rate 0.01
Final learning rate 0.01
Weight decay 0.0005
Warmup epochs 3.0
IoU 0.7
Close-Mosaic0
OptimizerSGD
Seed0
Table 3. Comparison experiments of different models on Cottonpet2, with the best results highlighted in bold and the second-best underlined.
ModelParametersFLOPS (G)Size (MB)F1-ScoremAP (50)mAP (50:95)
YOLOv3-tiny8,671,31212.933.0867.1268.730.4
YOLOv5n1,761,8714.16.7278.9984.538.3
YOLOv7n6,010,30213.022.9373.0577.033.4
YOLOv8n3,006,0388.111.4779.6184.640.0
YOLOv9-t2,801,64411.710.6978.8083.439.4
GELAN-t1,879,0147.17.1779.6284.140.2
YOLOv10n2,695,1968.210.2876.6981.638.0
YOLOv11n2,582,5426.39.8578.5583.739.9
YOLOv12n2,508,7345.89.5777.7583.739.5
MSDS-YOLO (ours)2,818,09418.810.7580.8386.740.6
Table 4. Model comparison experiments on different datasets.
Different DatasetsModelsParametersFLOPs (G)Size (MB)F1-CoremAP(50)mAP(50:95)
YOLOv3-tiny8,671,31212.933.0857.0450.718.5
YOLOv5n1,763,2244.16.7385.0085.634.9
YOLOv7n6,013,00813.022.9468.7870.025.2
Public DatasetYOLOv8n3,006,2338.111.4781.8883.937.1
YOLOv9-t2,802,03411.710.6974.7779.234.9
Yellow-Sticky-GELAN-t1,879,2097.17.1776.1680.936.0
Traps-DatasetsYOLOv10n2,695,5868.210.2879.1583.834.8
YOLOv11n2,582,7376.39.8582.6986.236.4
YOLOv12n2,508,9295.89.5782.4087.540.6
MSDS-YOLO (Our)2,818,28918.810.7587.6591.540.2
YOLOv3-tiny8,687,48212.933.1421.8914.46.09
YOLOv5n1,772,6954.26.7630.7424.012.1
YOLOv7n6,031,95013.123.0138.7831.215.8
Public DatasetYOLOv8n3,007,5988.111.4735.0028.316.0
YOLOv9-t2,804,76411.710.7018.5231.918.4
VisdroneGELAN-t1,880,5747.17.1737.2331.017.0
2019YOLOv10n2,698,3168.210.2935.0328.615.9
YOLOv11n2,584,1026.39.8634.8228.115.7
YOLOv12n2,510,2945.89.5834.6028.115.8
MSDS-YOLO (Our)2,819,65418.810.7738.8232.217.3
1 In the column of models, bold indicates the network model proposed in this paper; and in the evaluation index, bold indicates the optimal performance. 2 Underline indicates second performance.
Table 5. Ablation experiments on cottonpest2. The bold values indicate the best performance, underlined values indicate the second best, and the ✓ denotes that join this module.
Basic (YOLO11)+C3k2_DMSFE+DSFPN+NWDParametersFLOPS (G)Size (MB)F1-ScoremAP(50)mAP(50:95)
2,582,5426.39.8578.5583.739.9
2,320,9585.88.8579.0985.340.5
2,982,23819.711.3880.1586.040.3
2,582,5426.39.8579.9584.639.5
2,818,09418.810.7580.4286.341.7
2,320,9585.88.8579.0584.439.2
2,982,23819.711.3880.1985.540.1
2,818,09418.810.7580.8386.740.6
Disclaimer/Publisher’s Note: The statements, opinions and data contained in all publications are solely those of the individual author(s) and contributor(s) and not of MDPI and/or the editor(s). MDPI and/or the editor(s) disclaim responsibility for any injury to people or property resulting from any ideas, methods, instructions or products referred to in the content.