Article

Ethanol Pretreatment Before Air Drying of Beetroot: Water Sorption Isotherms, Glass Transition Temperature and Shrinkage During Drying


by
Dimitrios Fotiou
and
Athanasia M. Goula
*
Department of Food Science and Technology, School of Agriculture, Forestry and Natural Environment, Aristotle University, 54124 Thessaloniki, Greece
*
Author to whom correspondence should be addressed.
Appl. Sci. 2026, 16(2), 768; https://doi.org/10.3390/app16020768
Submission received: 2 December 2025 / Revised: 21 December 2025 / Accepted: 28 December 2025 / Published: 12 January 2026
(This article belongs to the Special Issue Innovative Engineering Technologies for the Agri-Food Sector)

Abstract

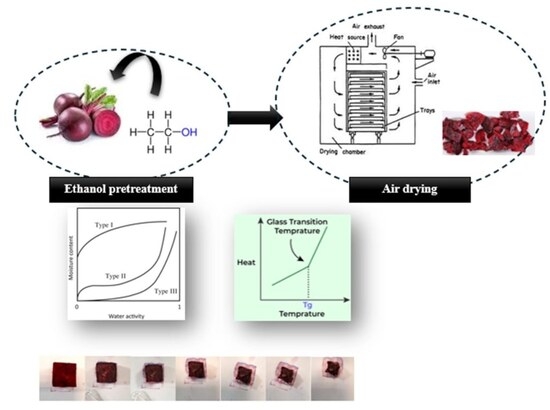
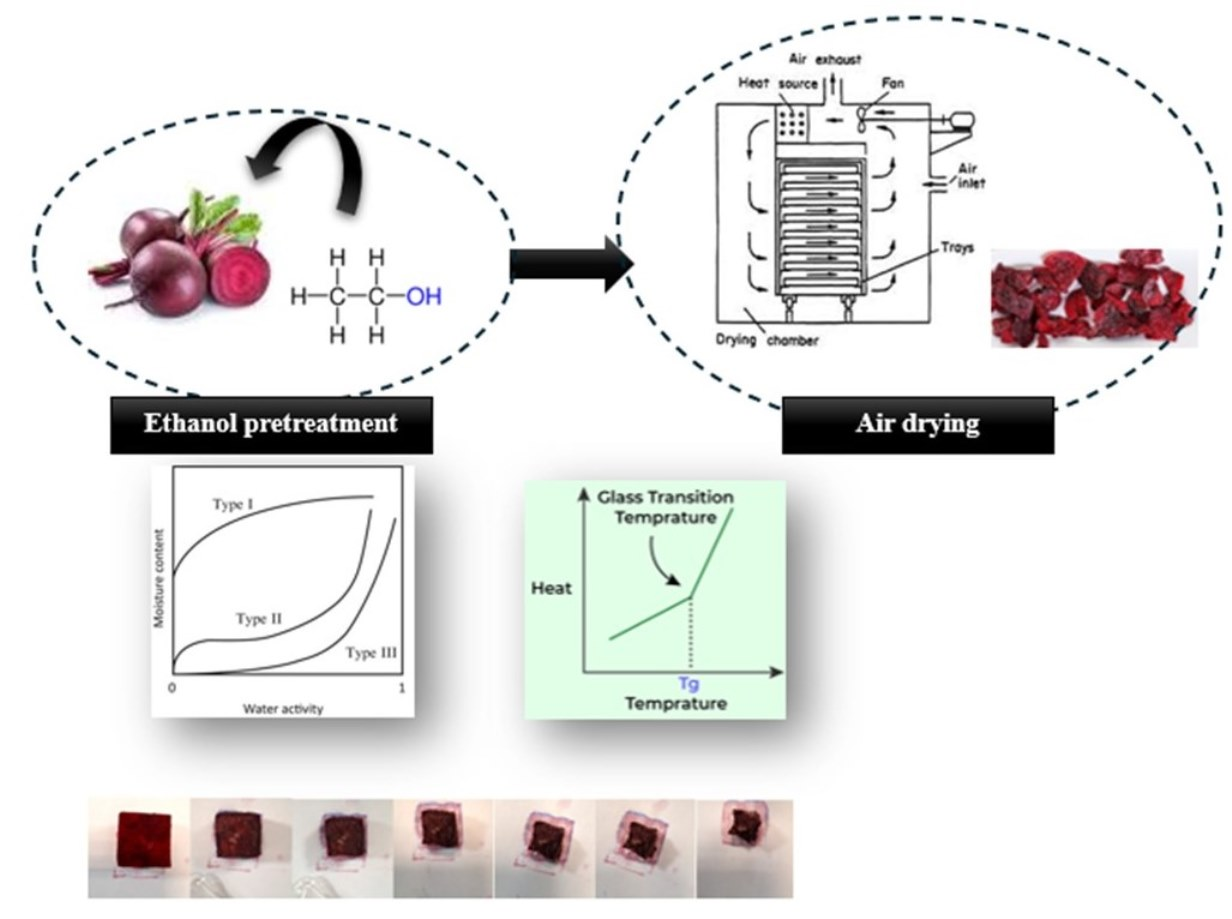
This study investigates the effects of ethanol pretreatment on the drying characteristics, thermodynamic properties, and shrinkage of beetroot. Ethanol pretreatment was applied under various conditions prior to air drying at 70 °C. Water sorption isotherms were determined at different temperatures and six models were evaluated for their ability to describe sorption behavior. Ethanol-treated beetroot demonstrated a lower equilibrium moisture content and a diminished capacity for water absorption in comparison to untreated samples. Thermodynamic parameters, including isosteric heat of sorption and entropy were analyzed, revealing that the sorption process is enthalpy-driven. Water functioned as a plasticizer, resulting in a reduction of the glass transition temperature (Tg), which was effectively predicted by the Gordon-Taylor model. The ethanol pretreatment led to a slight increase in Tg values, thereby enhancing structural integrity during the drying process. Shrinkage was closely linked to moisture loss and was more accurately characterized by integrating the concept of glass transition.

Graphical Abstract

1. Introduction

Globally, there is an increasing demand for nutritious diets, which encompasses the consumption of functional foods, as people seek to improve their overall health and quality of life. Specific fruits and vegetables, owing to their diverse components, serve as functional foods. The beneficial effects of betaine, carotenoids, vitamins, fiber, and various phytochemicals exhibit a preventive function against cardiovascular diseases, cancer, type 2 diabetes, aging-related conditions, and liver diseases [1]. Beetroot is widely acknowledged as a functional food, both in its raw and processed forms, due to its appealing taste and its nutritional and medicinal benefits.
The nutritional composition of beetroots is affected by various factors, including the specific variety, genetic makeup, environmental conditions, and methods of harvesting. The macronutrients present in beetroot include starch, fructose, sucrose, glucose, protein, fat, and fiber [2]. Beetroot typically contains around 5–8 g of sucrose and 2–3 g of dietary fiber per 100 g. Furthermore, it is abundant in amino acids such as methionine, threonine, lysine, leucine, isoleucine, tryptophan, phenylalanine, valine, tyrosine, and cysteine [3]. The distinguishing color of beetroots is associated with a specific class of pigments, betalains, accepted as a legal food additive in the European Union.
Dried beetroot is a convenient and practical means of distribution and can be used into tea, chips, bakery products, cereals, confections, desserts, sauces, jellies, jams, ice creams, tomato pastes. Ozaki et al. [4] used beetroot powder in fermented sausages as a replacement for nitrites.
In general, drying is a conventional practice to protect fruits and vegetables from spoiling. It can efficiently decrease moisture levels and prolong the shelf life of products. Nevertheless, traditional convective drying is a time-consuming procedure that requires a significant amount of energy. Additionally, the extended processing time and high temperatures involved can lead to unfavorable outcomes, such as nutrient deterioration and reduced rehydration ability. Consequently, various approaches are being investigated to improve food drying, including the utilization of pre-treatments. In this regard, ethanol emerges as a potential and advantageous substitute in the realm of food processing. The improvement in the process is primarily due to the structural changes induced by ethanol. However, while many studies mention these mechanisms, few actually show the extent of the pretreatment’s impact on the mass transfer or the significance of the parameters involved. In addition, the decrease in volume is a significant physical change that occurs when food is dried. The combination of water loss and heat causes strain in the cellular structure of the food, resulting in alterations in shape and a decrease in size [5].
Limited studies exist in the literature concerning the drying of beetroot, with the vast majority directing on hot air drying [6,7,8,9,10]. As far as the use of ethanol in beetroot drying is concerned, recently Kian-Pour, Ceyhan, Ozmen, and Toker [11] examined the use of ultrasound-ethanol pretreatment for the air drying of beetroot. Furthermore, numerous researchers have examined the drying kinetics of various agricultural products to ascertain the water diffusivity coefficient and identify the suitable mathematical model for the specific drying process. Nevertheless, there is a lack of information regarding the drying characteristics of beetroot following ethanol pretreatment in existing literature. The primary aim of the initial segment of our study was to analyze the phenomena that influence the diffusion process during the drying of beetroot post-ethanol pretreatment, assessing the impact of pretreatment parameters on diffusivity and articulating these effects through empirical models. These models are intended to facilitate the control or optimization of variables within the drying process. However, there are no previous works on the investigation of volume reduction in beetroot samples during convective drying or after ethanol pretreatment [12].
Furthermore, researching the thermodynamic properties of dry products is important for several reasons, as they influence their quality, stability, safety, and functionality during processing and use [12,13]. When examining the thermodynamic properties of dry beetroot, namely the net isosteric heat of sorption, differential entropy, and Gibbs free energy, key considerations include the moisture isotherms and glass transition temperature, both of which influence its stability, texture, and shelf life.
Water sorption isotherms are an important tool, especially for foods with low moisture content, which are usually used to improve drying or rehydration conditions and evaluate storage stability. Sorption isotherms are typically depicted through mathematical models that are grounded in empirical and/or theoretical principles. Moreover, the differential heat of sorption, also referred to as isosteric heat of sorption, relates to the state of water that is adsorbed onto solid particles, and understanding this concept is crucial for the design of drying equipment. The differential entropy is relative to the extent of sorption sites which are accessible at an explicit energy degree. On the contrary, the Gibbs free energy shows the attraction for water. Recently, the comprehension of water activity in food has been improved by incorporating the concept of glass transition temperature (Tg). This combined approach provides a thorough perspective on the function of water in food. The glass transition temperature is the temperature at which a material changes from a glassy, stiff condition to a more rubber, plastic state. For dry beetroot, this change effects different properties and stability during storage.
Τhermodynamic properties data for a variety of foods is extensively documented in the literature, encompassing vegetables such as peppers, spinach, onion, and potato [13,14,15,16]. Nevertheless, there is a notable absence of moisture sorption and thermodynamic data specifically for dried beetroot. Regarding glass transition temperature, state diagrams have been published for various vegetables such as garlic, potato, carrots, and tomato [17,18,19,20]. However, no data were found for ethanol pretreated dried beetroot.
The objective of this study was to investigate the sorption properties of dried beetroot after ethanol pretreatment, with a view to model the sorption isotherms through specific equations and to clarify the associations among water activity, water content, glass transition temperature. Another objective was to study the phenomena governing the diffusion process during beetroot drying after ethanol pretreatment, determining the effects of pretreatment parameters and glass transition temperature on shrinkage and expressing these effects with appropriate models. Numerous empirical models have been developed to elucidate the physical phenomena associated with shrinkage, drawing upon experimental data tailored to specific products and processing conditions. Nevertheless, the too basic statements of these models deter their ability to present a thorough understanding of the major reasons of shrinkage during drying. On the contrary, theoretical models are based on elementary assets, allowing them to precisely foresee the physicochemical changes that appear during drying of fruits and vegetables. By addressing these aspects, the present work aims to improve understanding of ethanol’s influence on beetroot drying behavior and contribute foundational data useful for optimizing drying processes and enhancing quality attributes of dried beetroot products.

2. Materials and Methods

2.1. Drying of Beetroot

Fresh beetroots (Beta vulgaris L., cv. Detroit) were procured from a commercial farm in Pella, Greece, harvested in 2023. The plant material was characterized by a total soluble solids content of 12.13% w.b. and an ash and a fiber content of 1.12 and 3.24% w.b., respectively. Beetroots of uniform size and maturity were selected to minimize compositional variability. Samples were washed under tap water, peeled, and cut into 2 cm cubes. Initial moisture content was determined using oven drying at 103 ± 2 °C until constant weight and reported on a wet basis (87.66 ± 0.54% w.b.).
Beetroot cubes were randomly assigned to experimental batches to ensure biological replication, with three independent batches processed on different days. Within each batch, samples were treated and analyzed in triplicate, where triplicates represent independent biological replicates (distinct samples from the same batch), not repeated measurements of the same piece.
Ethanol pretreatment was conducted using an aqueous ethanol solution. The ethanol (≥99.5% purity, food grade) was obtained from Sigma-Aldrich (MilliporeSigma, Burlington, MA, USA). Use of ethanol in foods is controlled by the U.S. Food and Drug Administration (FDA) and the Bureau of Alcohol, Tobacco, and Firearms. FDA has identified ethanol as a Generally Recognized as Safe (GRAS) ingredient and ethanol pretreatment can be considered a safe procedure because it does not leave residue after drying. Pretreatment solutions of 30–100% v/v (Ec) were prepared using deionized water. For each condition, beetroot cubes were immersed in ethanol solution (solid:liquid ratio 1:8 g/mL) in covered glass beakers to minimize ethanol evaporation. The beakers were maintained in a temperature-controlled water bath at target temperatures (Tp) ranging from 25 to 55 °C for pretreatment times (tp) of 10–30 min. Based on results of our previous study, the pretreatment conditions of tp = 30 min, Ec = 100% v/v, and Tp = 55 °C were selected as optimal, as they led to the highest effective moisture diffusivity during convective drying. These conditions were therefore adopted for all subsequent analyses. Ethanol loss due to evaporation was monitored by weighing the beakers before and after treatment; changes were within ±3% and deemed negligible under sealed conditions.
Subsequent to pretreatment, cubes were instantly drained and moved to a laboratory dryer (Memmert, Type U40, Memmert GmbH, Schwabach, Germany) with an air temperature and velocity of 70 °C and 1.2 m/s, respectively. Drying was conducted until samples reached constant mass. Two glass dishes of approximately 100 g each were used per run to monitor moisture loss and volume change. Moisture content during drying was determined gravimetrically by periodic weighing using a balance (KERN PCB 1000-2, Kern & Sohn GmbH, Balingen, Germany).

2.2. Determination of Sorption Isotherms

Dried beetroot pretreated with ethanol at the optimal conditions was characterized for its equilibrium moisture content at nine relative humidities (RH) between 10 and 85% (temperatures of 20, 35 and 50 °C) by a gravimetric procedure. Salt solutions (LiCl, K(CH3COO), MgCl2, K2CO3, Mg(NO3)2, NaNO2, NaCl, (NH4)2SO4, KCl) were used to maintain the specified relative humidity inside the desiccators [12,13,14].
Dried samples, weighing 3 ± 0.001 g, were situated in weighed aluminum plates and exposed to drying at 45 °C in an air oven for three days. Following this, the samples were stored in desiccators containing salt solutions with established relative humidity levels. To inhibit mold development during storage, a test tube filled with thymol was introduced into the desiccators with elevated relative humidity. The desiccators were then put within cabinets at 20, 35, or 50 °C (±1 °C), letting the samples to equilibrize till no significant weight change (±0.001 g), about three weeks. The complete procedure of removing, weighing, and subsequently placing the samples back into the desiccators was finalized in approximately 30 s, thus minimizing the likelihood of moisture absorption from the atmosphere during the weighing phase. The equilibrium moisture content was determined by drying the samples in an oven at a temperature of 103 ± 2 °C until a stable weight was reached (as per AOAC method 925.10). All measurements were taken in triplicate, and further analyses were conducted if any individual values from the triplicates varied by more than 0.6% from the average of the triplicates.

2.3. Measurement of Glass Transition Temperature

Dried beetroot samples, which were pretreated with ethanol under optimal conditions and weighed around 1 g (±0.01 g), were conditioned in salt solutions at a temperature of 25 °C to establish a water activity range between 0.15 and 0.65, in accordance with the principles of sorption isotherm methodology. After equilibrium, about 10 mg of each sample was used for differential scanning calorimetry (DSC), whereas the remaining material was utilized for moisture content measurement by drying at 103 °C. A Perkin–Elmer Pyris 1 differential scanning calorimeter was used. The characteristic Tg value was the midpoint of the glass transition, whereas the samples were heated at a rate of 10 °C/min through a temperature range of −60 to 80 °C in an inert atmosphere. Initial experiments performed at heating rates of 2 and 5 °C/min produced results that were almost indistinguishable, which prompted the choice of the 10 °C/min rate for practical considerations. A vacant pan was used as the reference, and liquid nitrogen was employed to cool the samples. All DSC analyses were done in triplicate, and the mean values ± standard deviation are used.

2.4. Microstructure of the Dried Beetroot

The microstructure of dried beetroot samples was examined using scanning electron microscopy (SEM). Cross-sectioned samples were mounted on aluminum stubs and coated with a thin (~10 nm) platinum layer to improve conductivity. SEM imaging was conducted on a Quanta 200 microscope (FEI, Hillsboro, OR, USA) at an accelerating voltage of 15 kV under high vacuum. At least five random fields per sample were imaged to ensure representative microstructural characterization. SEM observations were used for qualitative interpretation only; no quantitative porosity or pore-size analysis was performed.

2.5. Data Analysis

2.5.1. Sorption Isotherms

Six distinct mathematical models (GAB, BET, Halsey, Smith, Oswin, Peleg) were utilized to evaluate the data. The parameters for the models were determined with non-linear regression, whereas the effectiveness of each model’s fitting was assessed calculating the mean relative percentage deviation, Me:
M e = 100 N i = 1 N m i m p i m i
where mi represents the experimental value, mpi denotes the predicted value, and N signifies the total number of experimental data points.

2.5.2. Thermodynamic Properties

The net isosteric heat of sorption can be calculated using Equation (2), which is based on the Clausius-Clapeyron equation with the subsequent assumptions: (1) the moisture content is constant, and (2) the vaporization heat of water and the additional heat of sorption do not change with temperature [21].
ln a w 1 / T X = q s t R
where X represents the equilibrium moisture content measured in kg/kg of dry solid, aw denotes the water activity, T indicates the absolute temperature expressed in Kelvin (K), qst refers to the net isosteric heat of sorption quantified in J/mol, and R signifies the universal gas constant, valued at 8.314 J/mol K.
The modification in differential entropy is computed using Gibbs-Helmholtz equation:
Δ S = q s t Δ G T
where ΔS is the change of specific entropy in J/mol K and ΔG is the free energy in J/mol:
Δ G = R T ln a w
Combining Equations (3) and (4) and rearranging:
l n a w = q s t R T + Δ S R
The isosteric heat of sorption and the moisture content was correlated with the following equation [22]:
q st = q 0 exp X / X 0
where q0 is the isosteric heat of sorption for the first absorbed water, in J/mol, whereas X0 signifies a specific moisture content, in kg/kg dry solid, at which the isosteric heat of sorption decreases by 63%. The compensation theory was deemed relevant to sorption owing to the robust linear relationship noted between enthalpy and entropy, as illustrated by the subsequent equation:
q s t = T B Δ S + Δ G B
The term TB (in K) is the isokinetic temperature, at which all reactions within the sorption follow the same rate. Krug, Hunter, and Grieger [23] related the isokinetic temperature with the harmonic mean temperature, Thm (in K):
T h m = n i = 1 n 1 / T
where n represents the total count of isotherms. A linear chemical compensation pattern is present only if when TB is not equal to Thm. When TB exceeds Thm, the process is driven by enthalpy; conversely, if TB is less than Thm, the process is regarded as being controlled by entropy.

2.5.3. Water Plasticization Behavior

The effect of water on plasticization was expressed by the Gordon and Taylor equation [24]:
T g = 1 x w T gs + k x w T gw 1 x w + k x w
where Tg, Tgs, and Tgw denote the glass transition temperatures of the mixture, solids, and water, respectively in K. The variable xw represents the mass fraction of water, while k signifies the Gordon-Taylor parameter.
The correlation between glass transition temperature and water activity was modelled by Khalloufi, El-Maslouhi, and Ratti [25]:
T g = C a w 2 + D a w + E c a w 2 + d a w + 1
where Tg represents the glass transition temperature measured in K and A1, A2, C, D, E, c, and d denote the parameters of the model.

2.6. Statistical Analysis

All findings are expressed as mean ± standard deviation. Biological triplicates were incorporated for every experimental condition. Data normality and homogeneity of variance were evaluated using Shapiro–Wilk test prior to analysis. Comparisons between ethanol-treated and untreated samples (moisture content, Tg, model parameters) were made using one-way ANOVA followed by Tukey’s HSD test at α = 0.05.

3. Results and Discussion

3.1. Sorption Isotherms

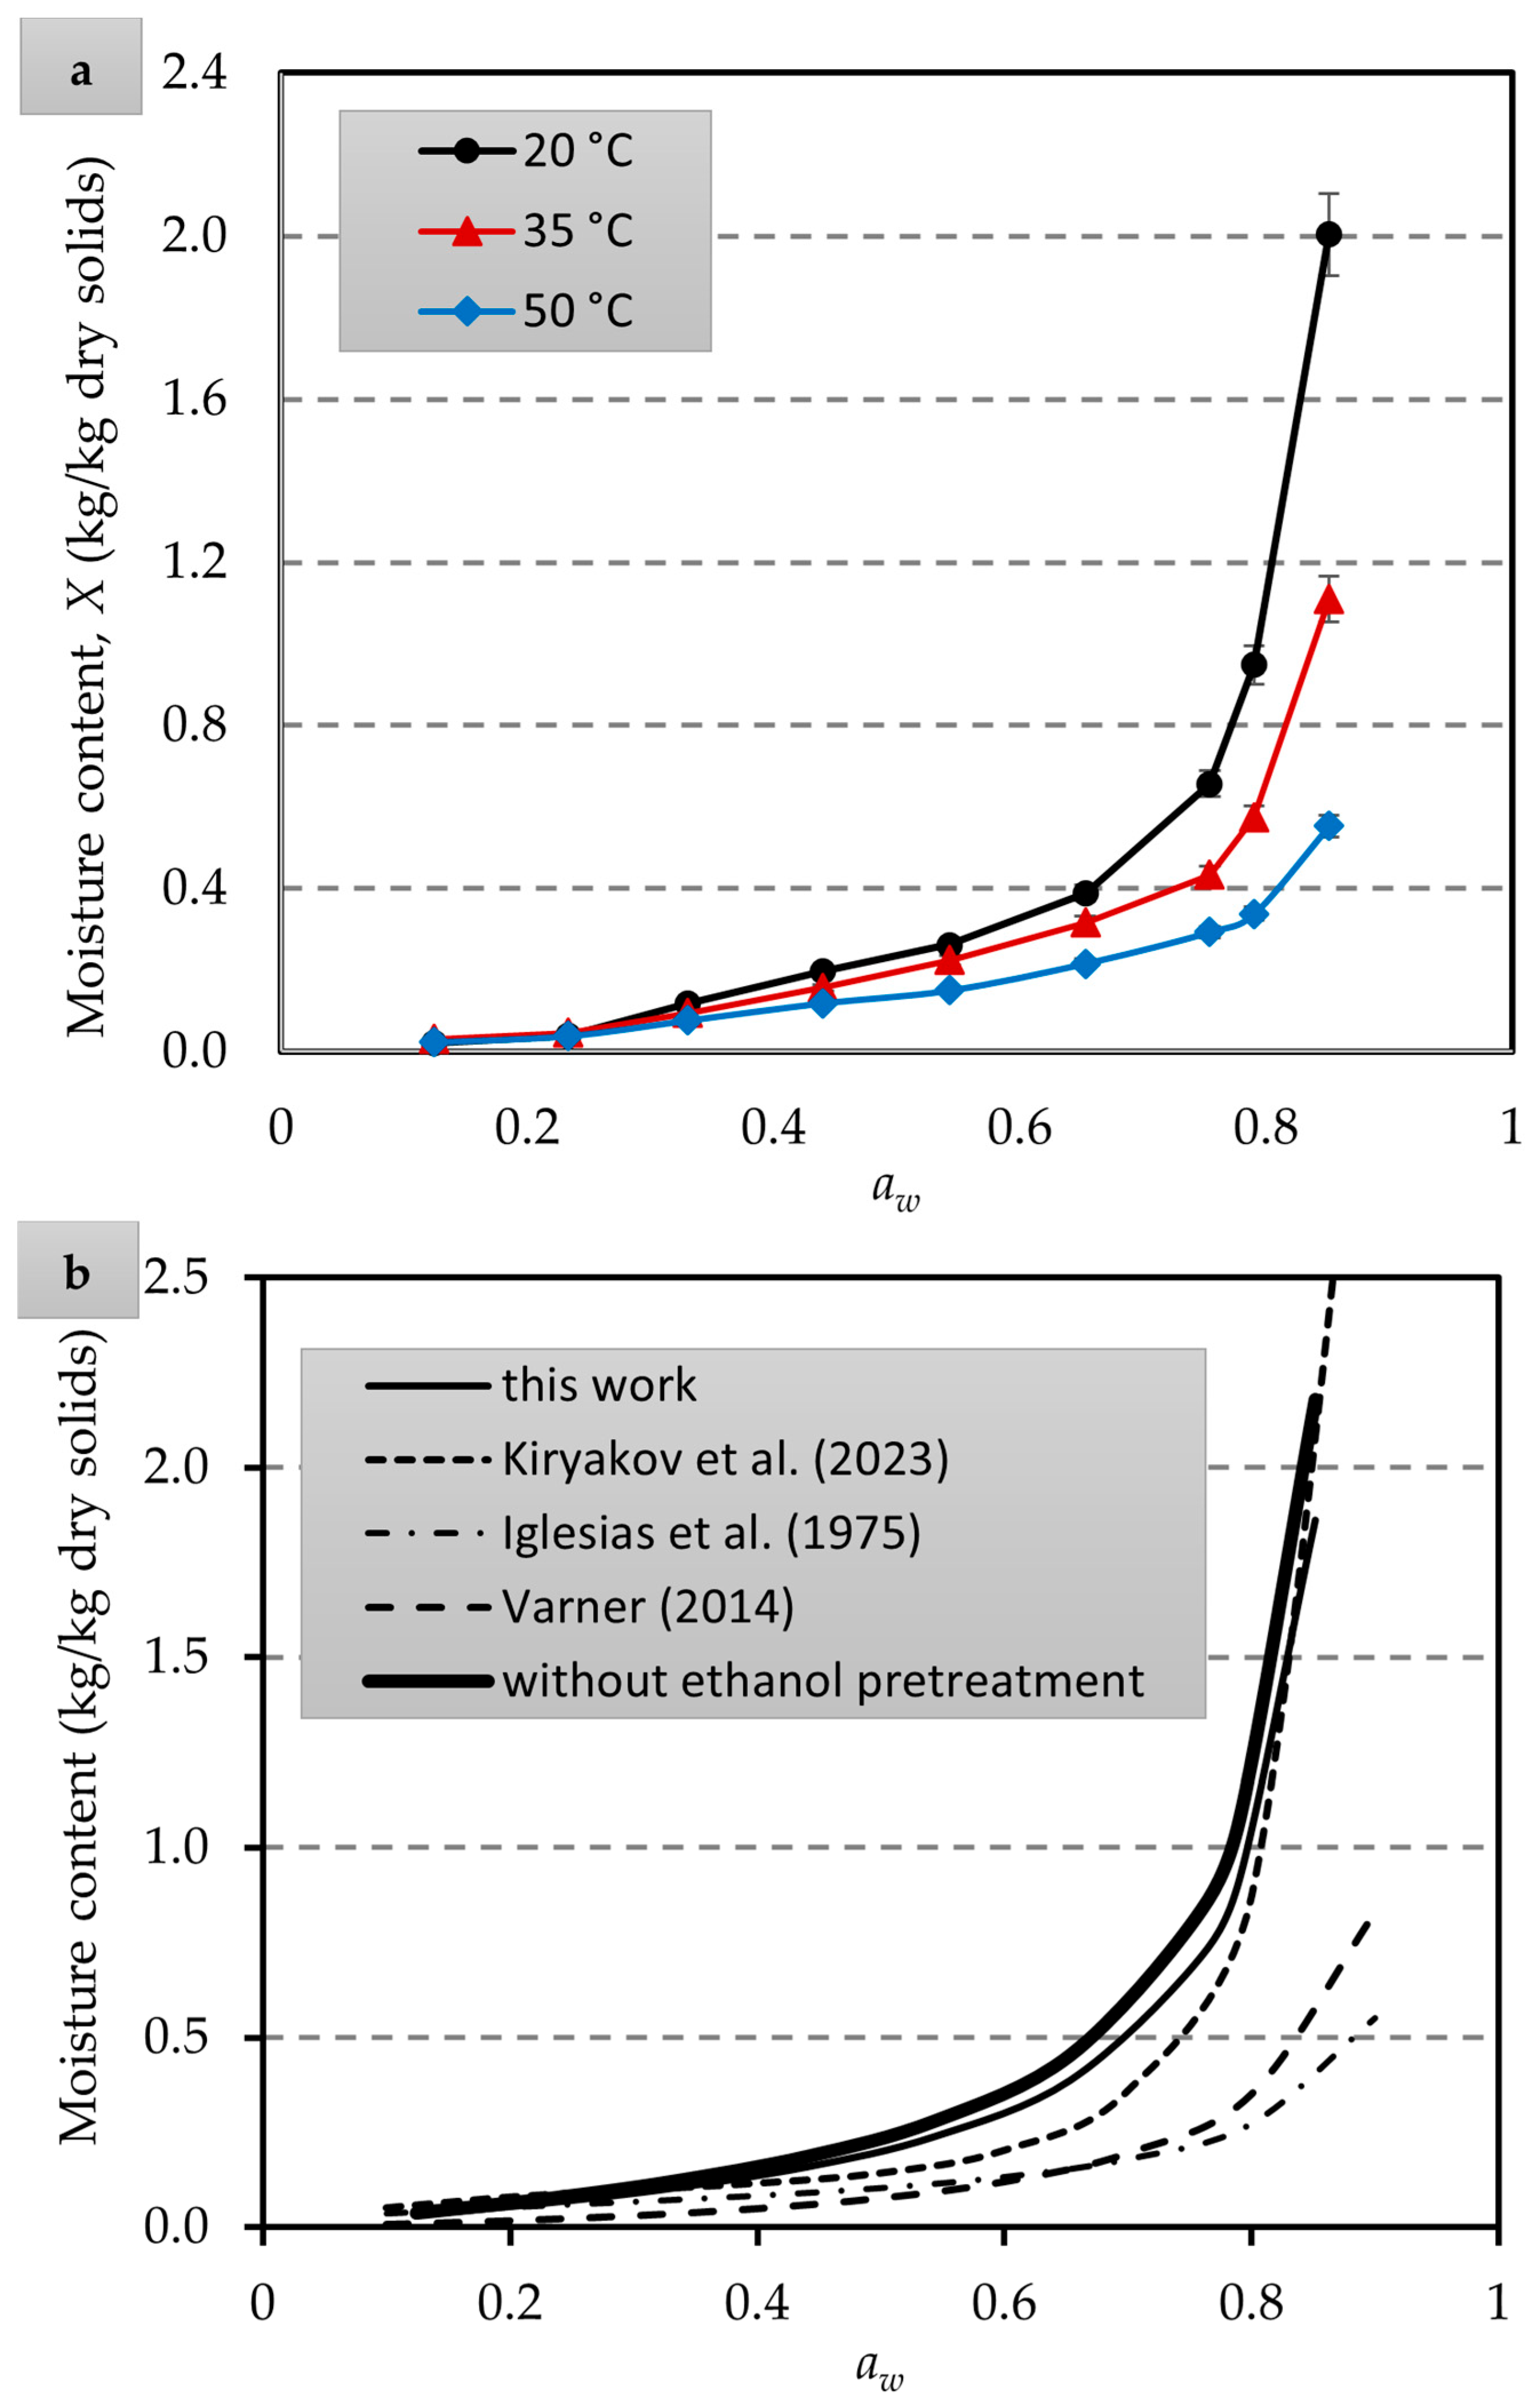
The characteristics of a sorption isotherm profile are indicative of a product’s hygroscopic properties. Products with high hygroscopicity display steep sorption isotherms, whereas those with low hygroscopicity present flatter isotherms. The experimental data on moisture sorption for dry beetroots at temperatures of 20, 35, and 50 °C are illustrated in Figure 1. According to the classification established by Brunauer, dry food products typically exhibit isotherms of types II or III [26]. The sorption isotherm of dry beetroot is characterized as type III, suggesting that the material preserves minimum moisture at low water activity while absorbing significant quantities at higher relative humidity. This phenomenon is characteristic of products with quite high percentages of fiber, sugars, and proteins. Analogous opinions have been stated by many researchers [27,28,29,30,31,32] for lemon peels, “Maltaise” orange peels and leaves, banana peels, jackfruit peels, yacon bagasse, and orange peels, at temperature ranges from 20 to 70 °C. In the low to intermediate water activity range, that is in the multilayer sorption region, moisture raises linearly with water activity. This observation can be explained by the physical sorption on the highly active sites of the biopolymer at low water activity, where water is principally adsorbed on the surface –OH groups of crystalline sugars. Furthermore, Falade and Aworh [33] propose that at low aw, dissolution of sugar alcohols may occur, yielding to swelling and the development of new active sites.
Furthermore, the shape of the isotherm at low aw levels may be associated with the formation of a relatively rigid surface layer during drying, which can restrict in-ternal moisture migration and is often described as case-hardening. Conversely, in the higher water activity region, referred to as the capillary condensation region, there is a significant increase in water content with aw. Within this range, sorption transitions to less active sites, and with an increase in water activity, there is a progressive dissolution of sugars, ultimately leading to the total exudation of sugars into solution at elevated water activities. This incident has been reported for various foods with high sugar contents, such as apples, grapes, orange peels, and orange juice powder [28,37,38].
The isotherms for numerous food items at ambient temperature have been extensively documented. Nevertheless, there is a scarcity of research focused on isotherms at temperatures exceeding room temperature. The effect of temperature on the sorption isotherm is very meaningful, as food products are exposed to various temperatures throughout storage and processing. Temperature impacts the transfer of water molecules and the active equilibrium between vapor and adsorbed phases. Figure 1 shows that the equilibrium moisture content of beetroot decreases as temperature rises, while maintaining a constant water activity. This phenomenon can be attributed to a decrease in the total number of active sites available for water binding, resulting from physical and/or chemical alterations induced by temperature variations [39]. At higher temperatures, water molecules reach higher energy states, letting them remove from the water-binding sites, thereby lowering the equilibrium moisture [40]. A similar observation was reported by Goula, Karapantsios, Achilias and Adamopoulos [40], Bejar et al. [28], and Yogendrarajah, et al. [41] for tomato pulp powder, orange peel and leaf powder, and whole black peppercorns, respectively. On the contrary, numerous studies have indicated that the presence of substantial amounts of crystalline sugars in dehydrated foods can lead to the intersection of water sorption isotherms obtained at different temperatures. The experimental sorption data illustrated in Figure 1 does not exhibit intersections at varying temperatures within the specified aw range. This may be attributed to the high insoluble solids and protein content present in dry beetroot. Falade and Aworh [33] suggested that the crossing of isotherms may not occur under certain conditions. Ayranci, Ayranci and Dogantan [42] concluded that products with high sugar concentrations, such as dried apricots, figs, and raisins, demonstrate isotherm crossing behavior. This phenomenon occurs because these products dissolve more sugar, resulting in an increased retention of water at elevated temperatures. In contrast, some fruits may not display this behavior, as the sugars present are typically already dissolved across the entire spectrum of water activity [43].
Six empirical mathematical models were used for moisture sorption data. Based on the R2 and Me values, most models were judged appropriate for expressing the sorption characteristics of dried beetroot. The GAB and Peleg models offered the most accurate predictions. The GAB model recorded the lowest Me value and the highest R2 value, with mean values of 3.12% and 0.995, respectively, closely followed by the Peleg model. The GAB model (Equation (11)) has been widely utilized to predict the isotherms of various products [44].
X = X m · C · K a w / 1 K · a w 1 K · a w + C · K · a w
The GAB model offers several advantages over alternative isotherm models, including a robust theoretical foundation, as it is an enhancement of the Langmuir and BET theories of physical adsorption, and its parameters possess physical significance [45]. The constant C, which varies from 1.21 to 3.92 for dried beetroot, is associated with thermal effects and is characterized as the proportion of the partition function of the initial molecule that is adsorbed at a site compared to the partition function of the molecules that are adsorbed beyond the first in the multilayer. This parameter expresses the binding of water to the main binding sites and a higher value of C means a greater binding and a more meaningful difference in enthalpy between the molecules in the monolayer and in the multilayer [46]. Given that the water molecules remain localized within the multilayer, the entropic contributions to C are relatively minor when compared to the enthalpic contributions. The parameter K is the percentage of the partition function of molecules in bulk liquid to the partition function of molecules in the multilayer [47]. Alongside an enthalpic component, K also includes a considerable entropic component. The enthalpic contribution to K is comparatively small in relation to C, mainly because of the significantly lower interaction enthalpy between the multilayer molecules and the sorbent. The K constant for dehydrated beetroot varied between 1.022 and 1.102, which is consistent with the values documented for various vegetables and fruits. According to Koc, Yilmazer, Balkır and Ertekin [48], a K value of 1 signifies that multilayers demonstrate characteristics similar to those of liquid water. In such instances, the molecules past the monolayer do not display multilayer arranging but assign characteristics of molecules in the bulk liquid [49].
The parameter Xm indicates the extent to which active sites are accessible for the absorption of water by the material. The investigation of Xm is crucial as it denotes the moisture content that allows for the longest duration with minimal quality degradation at a specified temperature. Below this threshold, the rates of deteriorative reactions, with the exception of the oxidation of unsaturated fats, remain negligible [40]. Villa-Velez, Fereira de Souza, Ramos, Polachini and Telis-Romero [32] state that Xm means the lowest water content needed to cover hydrophilic sites on the product surface, thus offering considerable understandings of the physical and chemical stability of dried products in relation to lipid oxidation, enzyme activity, non-enzymatic browning, and structural integrity. The Xm values for beetroot, which ranged from 7.35 to 12.78% on a dry basis, fell within the documented values for vegetables. [22]. In addition, it was found that the monolayer moisture content diminishes with increasing temperature, a pattern also reported for potato, quince and loquat, yacon bagasse, and orange juice powder [31,38]. This temperature dependence has been linked to a reduction in the sorption of active sites, attributed to the physicochemical changes caused by temperature.
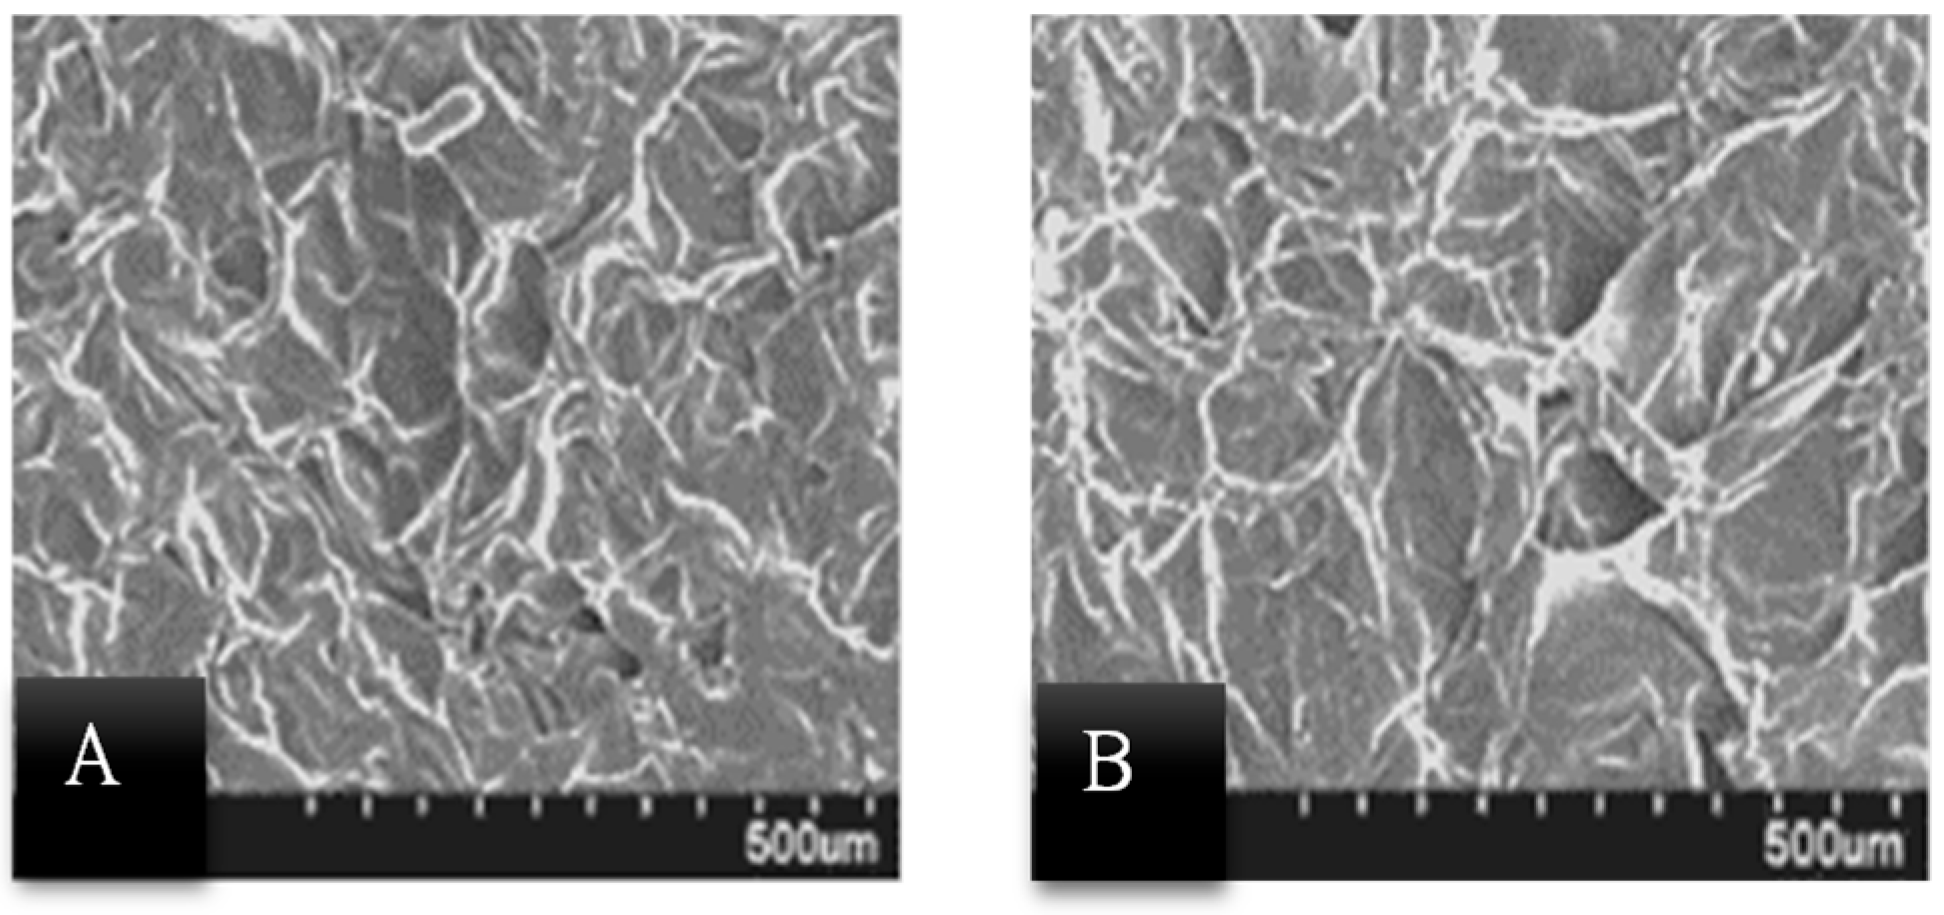
The GAB equation was also used to model sorption data for air dried beetroots without pretreatment. The lower water uptake of the ethanol pretreated samples can be associated with their more intact cellular matrix that results in diminished ability to reabsorb water. Ethanol preserves the structural integrity of the material during drying, often leading to a more stable and uniform pore structure [49]. Ethanol pretreatment resulted in a more compact structure, with observable thinning of the affected cells in certain regions, as illustrated in Figure 2.
Kiryakov et al. [47] also presented experimental sorption data for beetroot of the Matador variety. The relevant desorption isotherm at 20 °C is shown in Figure 1 along with this for ethanol pretreated dry beetroot. The samples of Kiryakov et al. [34] presented a lower water uptake, although the process involved desorption and not adsorption. Thus, the data of Figure 1 do not present a hysteresis phenomenon. In general, hysteresis between adsorption and desorption isotherms is typically observed in materials where capillary condensation or specific pore structures significantly influence moisture behavior. In the case of dry vegetables, hysteresis may not be observed since they are largely composed of cellular materials (e.g., starches, fibers, proteins) that do not exhibit the mesoporous structure necessary for capillary condensation, which is a primary cause of hysteresis. In addition, hysteresis is typically caused by capillary condensation in mesoporous materials, where water molecules fill and empty the pores at different relative humidities due to surface tension and contact angle differences. In dry vegetables, moisture interactions are driven more by adsorption to the matrix and less by capillary effects, minimizing hysteresis. Furthermore, dry vegetables are hygroscopic, meaning moisture is primarily adsorbed into the solid matrix via physical and chemical interactions (e.g., hydrogen bonding with starch or proteins) that are relatively reversible, leading to closely matching adsorption and desorption curves. A possible reason for the lower water uptake of the beetroots reported by Kiryakov et al. [34] is that the samples were from a variety, Matador, that is usually indicated lower contents of soluble solids, such as glucose and fructose. In beetroot, the sugars bind to water molecules, contributing significantly to moisture adsorption at lower relative humidities. With less sugars, the beetroot material will rely more on its structural components (e.g., cellulose, pectin), which are less hygroscopic compared to sugars.
As far as the data of Varner [35] in Figure 1 is concerned, their samples presented also a lower water uptake. This observation may be associated with the structural and physical changes caused by the drying method. Varner [35] employed the vacuum drying method that operates at low pressure, which reduces thermal degradation of the cell structure. The gentle drying process preserves a more intact cellular matrix, leading to lower porosity and less capacity to reabsorb water. On the contrary, the hot air-drying method used in the present work tends to cause more intense shrinkage and microchannel formation. These microchannels act as capillaries, enhancing water uptake. Finally, regarding the isotherm of Iglesias, Chirife and Lombardi [49], the researchers used the BET equation to describe their experimental sorption data. The BET isotherm generally predicts lower moisture contents than the GAB isotherm for the same water activity, especially in the intermediate to high water activity range (aw > 0.3). The GAB model introduces a third parameter, K, which adjusts for the enhanced binding energy in multilayer adsorption. This results in higher predicted moisture content at intermediate and high aw.

3.2. Sorption Thermodynamic Properties

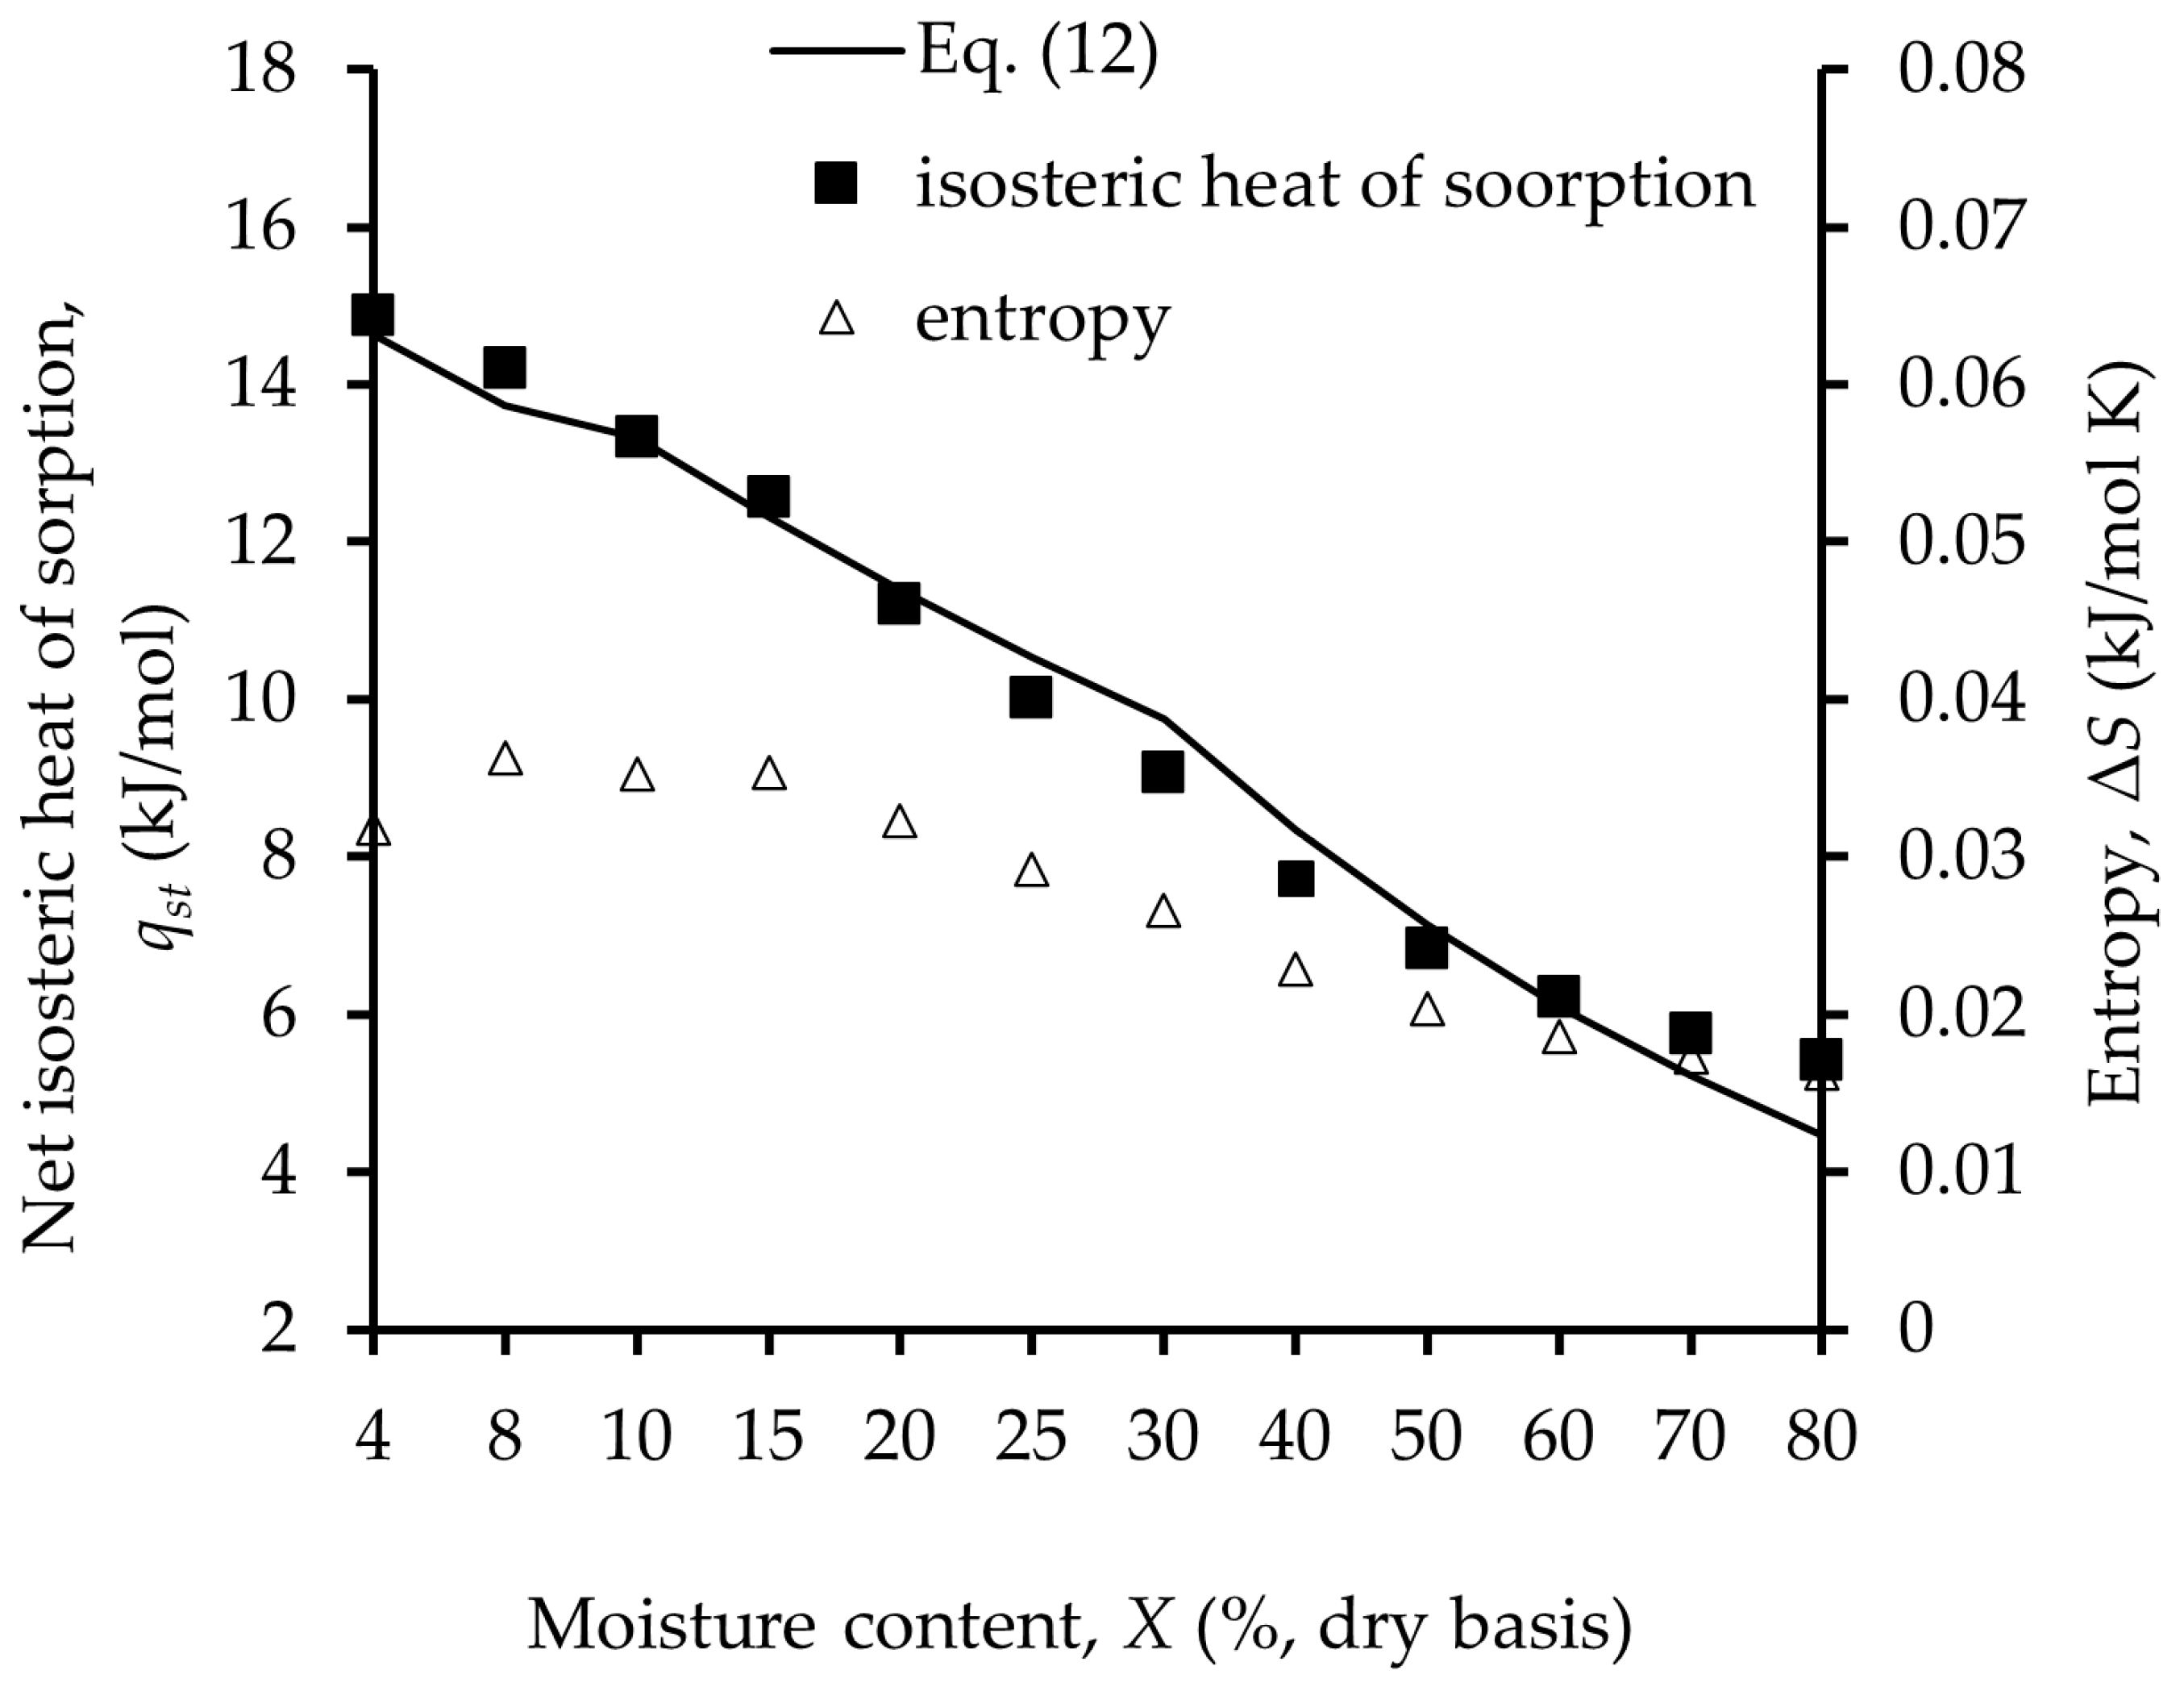
The assessment of thermodynamic sorption properties improves the understanding of the molecular interactions between water molecules and the sorbent [50,51,52]. The net isosteric heat of water sorption throughout different moisture contents was estimated with the Clausius-Clapeyron equation. As depicted in Figure 3, the isosteric heat of sorption for desiccated beetroot demonstrated a significant correlation with moisture content. At reduced moisture levels, the isosteric heat was remarkably elevated, reaching approximately 15 kJ/mole, and exhibited a gradual decline as moisture content increased, eventually stabilizing at around 6 kJ/mole. A comparable pattern was observed for various foods such as rice, orange peels and fibers, black peppercorns, and spray dried tomato [28,39,40,41,53]. In addition, this conclusion allies with the assumptions of Kiranoudis, Maroulis, Tsami and Marinos-Kouris [54] that the net isosteric heat of desorption for vegetables was higher for moisture contents between 6% and 36% (dry basis). On the contrary, for fruits, this heat was considered insignificant within the same moisture range but demonstrated a significant increase as the moisture content approached zero. Additionally, it was concluded that for fruits, the heat of sorption showed a marginally negative value at elevated moisture, due to the endothermic dissolution of sugars in the absorbed water, a phenomenon that does not occur in dry beetroot. The effect of moisture content on the net isosteric heat of sorption is strictly related to the intensity of water binding. At lower moisture levels, the surface shows a high density of active polar sites. Consequently, at high moisture levels, the number of available binding sites reduces, indicating the occupation of these sites by water molecules with lower energy, leading to reduced values of qst [55]. As the moisture content rises, the saturation of less active sorption sites and the formation of a multilayer structure are indicated by a reduction in the heat of sorption. Additionally, Quirijns, Van Boxtel, Van Loon, and Van Straten [46] reported that the association between moisture content and isosteric heat of sorption proves the presence of distinct classes of water, particularly three categories from strongly bound water to more freely accessible water molecules.
The correlation between moisture content and isosteric heat of sorption is described as follows:
q s t = 15.56 exp X / 64.09        ( R 2 = 0.979 )
where X is the moisture content on a dry basis, whilst qst is the isosteric heat of sorption in kJ/mol.
The values of ΔS were derived from the linear equations established by Equation (5) across various moisture levels. The findings indicated a significant correlation between differential entropy and moisture content, exhibiting an exponential trend similar to that of differential enthalpy. This aligns with the results reported by Al-Muhtaseb, McMinn and Magee [56], who investigated the thermodynamic properties of water sorption in starch powder. Given that the law of compensation applies within the moisture range examined, the results were analyzed in accordance with Equation (7), leading to the determination of the isokinetic temperature of sorption as TB = 436.19 K. The harmonic mean temperature was determined to be Thm = 302.93 K, significant different from TB, verifying the application of isokinetic theory to water sorption in dry beetroot. According to Telis, Gabas, Menegalli and Telis-Romero [43], a process is classified as enthalpy-driven if it is influenced by enthalpy, while the opposite condition indicates an entropy-controlled process. Consequently, the adsorption of water vapor in dry beetroot can be regarded as enthalpy-driven. Beristain, Garcia, and Azuara [57] examined enthalpy-entropy compensation in sugar-rich foods and found that a singular enthalpy-controlled adsorption mechanism prevails throughout the moisture range studied. This statement means that the microstructure of sugar-rich foods stays stable, with no changes in water adsorption mechanisms within the temperature range of 20 to 50 °C.
The change in free energy, denoted as ΔGB, was determined to be −1.939 kJ/mole. A negative free energy change indicates that the sorption process is thermodynamically favorable and occurs spontaneously. This indicates that the relations between water molecules and the material is actively positive, with the system proceeding to a more stable state as water is absorbed [39]. In the context of sorption isotherms, a negative ΔG is typically associated with the material’s affinity for water, reflecting favorable adsorption or binding of water molecules to the material’s surface or internal sites [14,58]. This data is critical in understanding the hygroscopic performance of the material, which can control its stability, shelf life, and presentation in various applications.

3.3. Water Plasticization Behavior

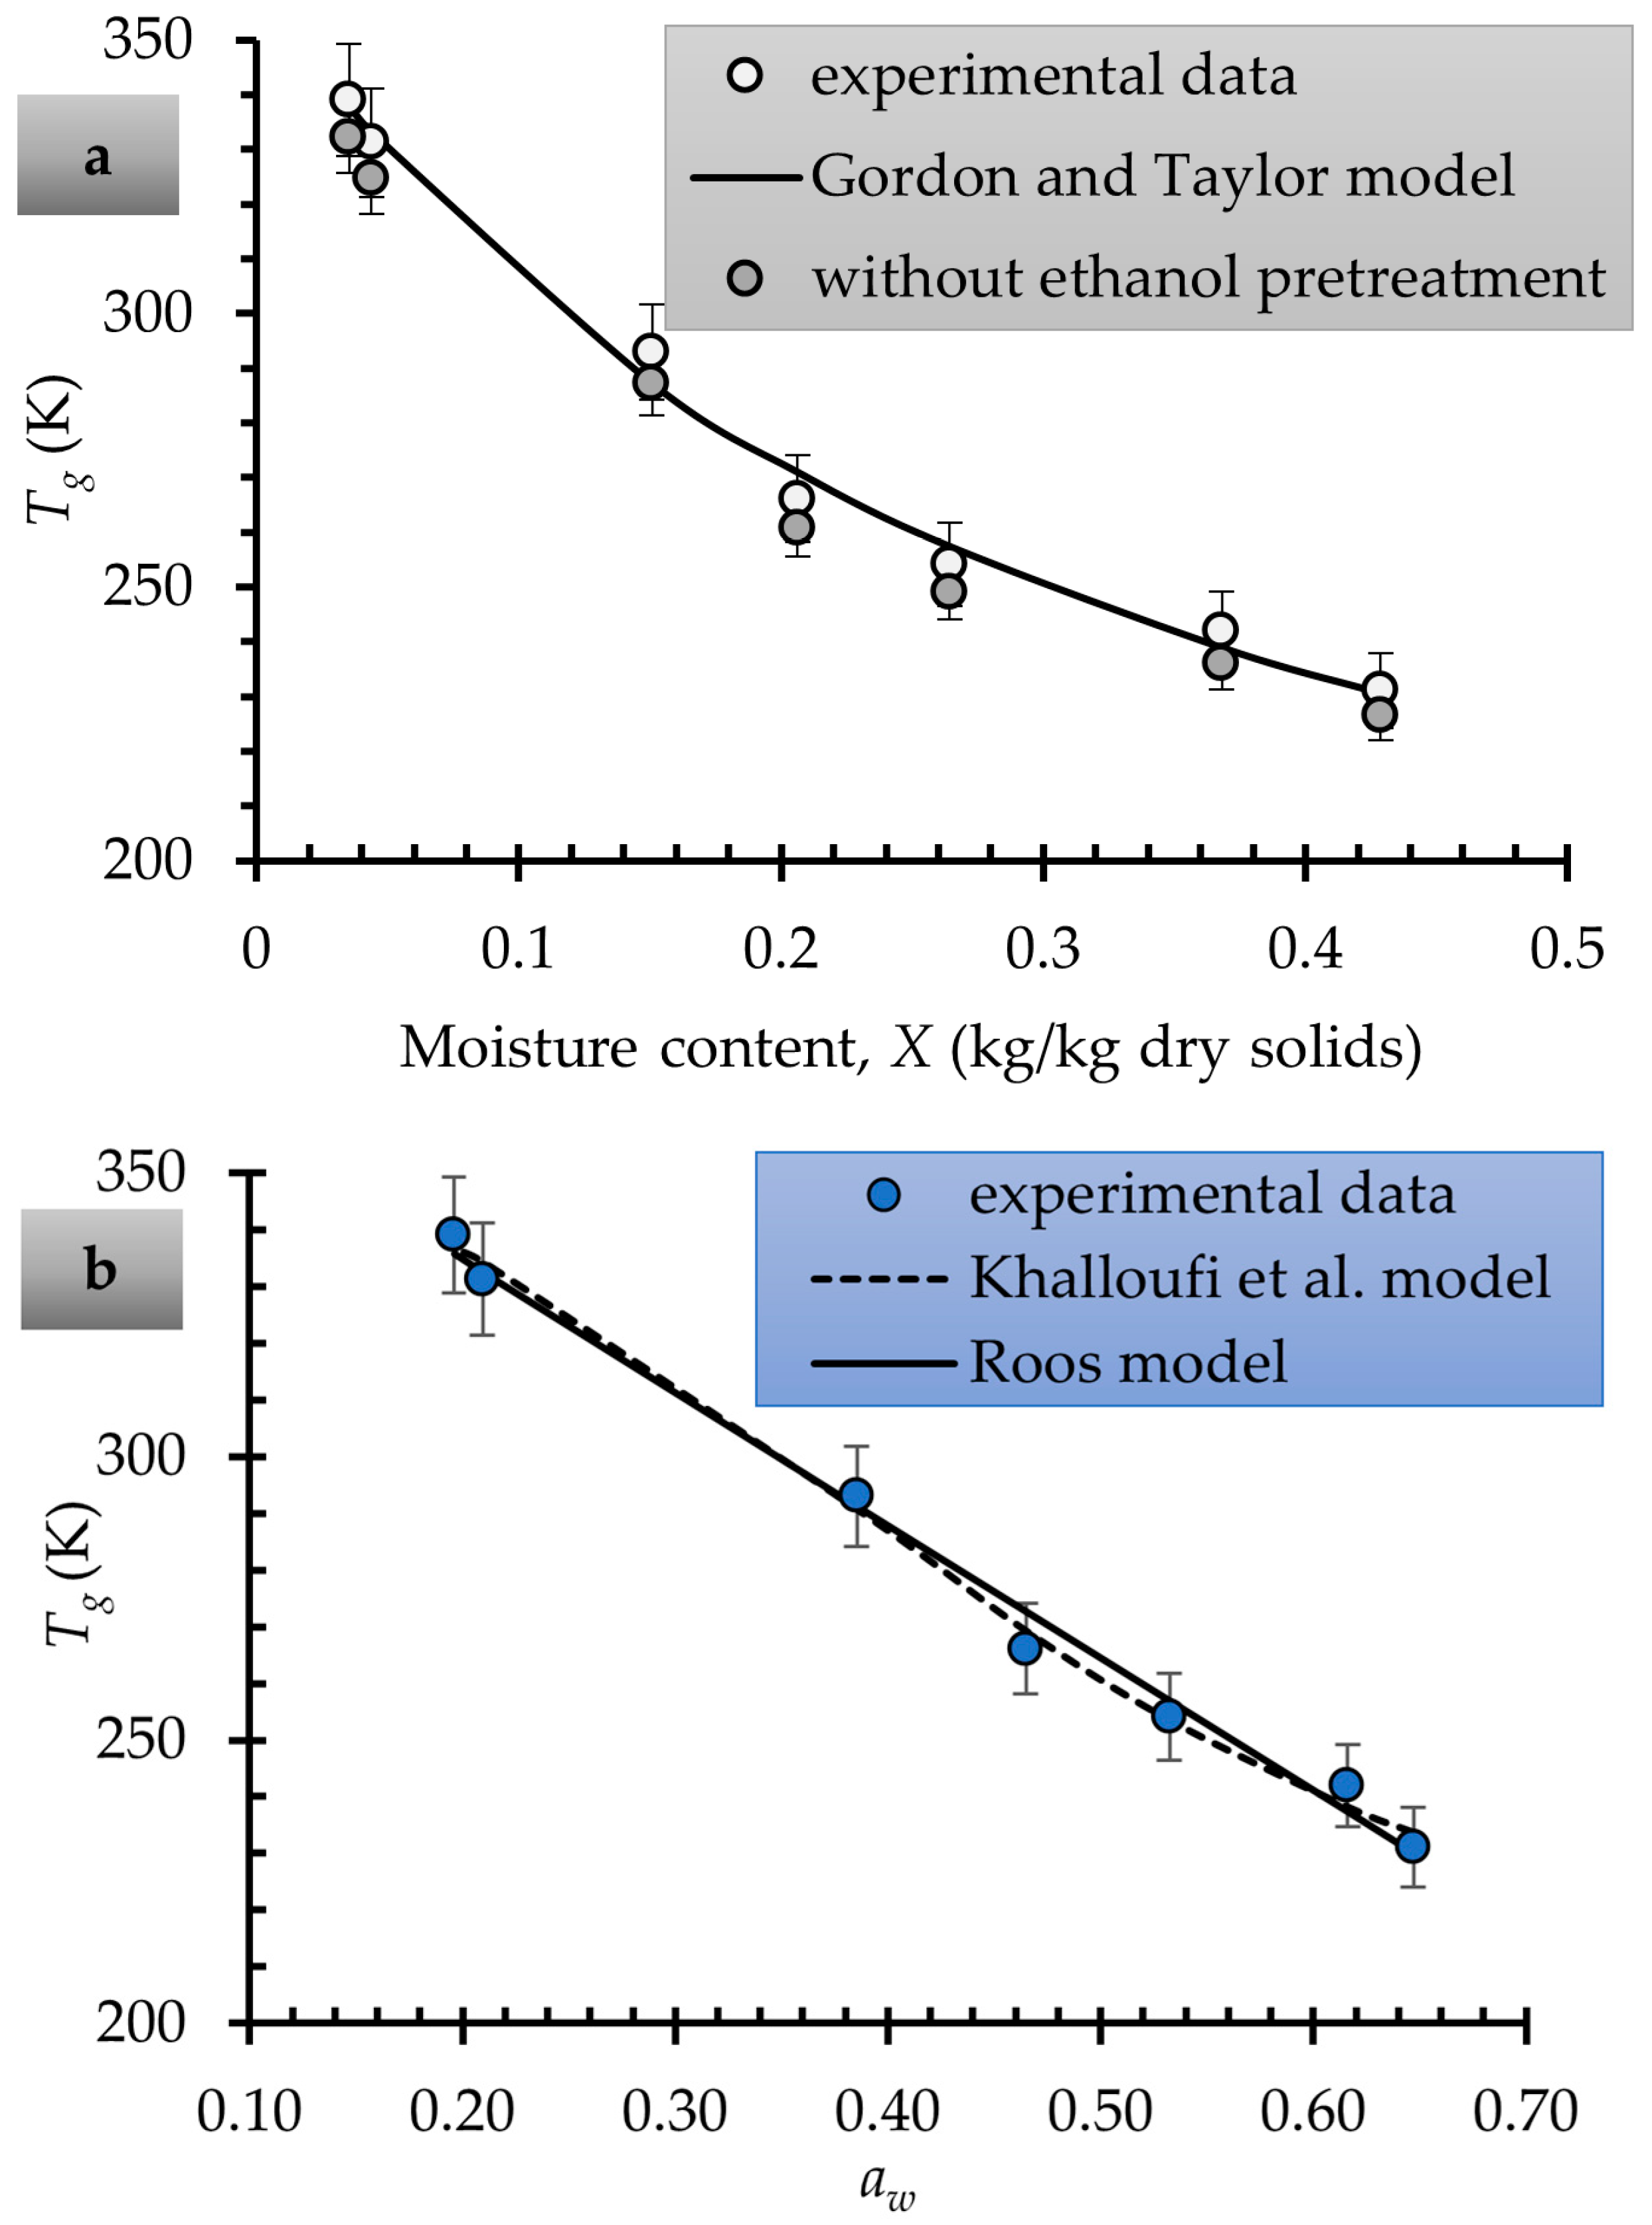
Differential scanning calorimetry was employed to ascertain the glass transition temperature (Tg) of beetroot across different moisture content levels. The thermograms exhibited a characteristic second-order transition, indicated by a rapid alteration in heat flow resulting from changes in heat capacity during the phase transition temperature [40]. Figure 4 demonstrates the influence of moisture content on the Tg of beetroot. The observed reduction in Tg with increased moisture content is ascribed to the plasticizing effect of water on the non-crystalline constituents of the material [35]. Goula, Karapantsios, Achilias, and Adamopoulos [40] reported that this effect may be due to the weakening of hydrogen bonds and dipole-dipole interactions within and between macromolecules, as water molecules provide a protecting result against these forces. Furthermore, the lower Tg of amorphous water plays a role in decreasing the viscosity of biopolymer-water mixtures at various temperatures. Similar findings were reported by Moraru, Lee, Karwe and Kokini [59], Goula, Karapantsios, Achilias and Adamopoulos [40], and Linnenkugel, Paterson, Huffman and Bronlund [60] for meat-starch matrix, spray-dried tomato pulp, and various fruit powders, respectively. Figure 4 also presents Tg data for air dried beetroots without ethanol pretreatment. Ethanol-pretreated samples exhibited slightly higher Tg values compared to untreated beetroot at equivalent moisture contents. This behavior may be attributed to ethanol-induced modifications in molecular interactions within the amorphous matrix, potentially altering hydrogen bonding and macromolecular mobility.
The Gordon and Taylor equation was employed to simulate the influence of moisture content on Tg. According to the Gordon and Taylor model, as the water fraction increases, the theoretical concept of the ‘complete glass curve’ approximates the glass transition temperature of the plasticizer [61]. Nevertheless, natural foods do not align with the predictions established by this model. At aw levels greater than 0.90, the Tg curve displays a discontinuity, marked by a sudden increase in Tg that eventually stabilizes at a fixed value [20]. This value is the Tg of the concentrated amorphous matrix [62]. The Gordon and Taylor model was changed to adjust the experimental data. The parameters Tgs = 88.03 °C and k = 3.29 were estimated by non-linear regression, with R2 of 0.954 (Figure 4). The parameter k determines the curvature of the Tg-water content relationship and demonstrates the robustness of the interaction among system components [63]. Its value is comparable to the literature k values associated with various food products. Previous studies have reported k values of 4.5, 5.9, 13.7, for apple, carrot, potato [64] and 4.4, 5.0, 5.4 for dehydrated apple, banana, mango [65]. The Tgs value is in accordance with those reported by other authors [65,66] whereas no references were found for beetroot. In general, the Tgs values of products with cellulose, hemicellulose, lignin, and pectin are in the range 105–120 °C, whereas fruits and vegetables with an elevated content of lower molecular weight compounds, such as sugars, report lower Tgs values.
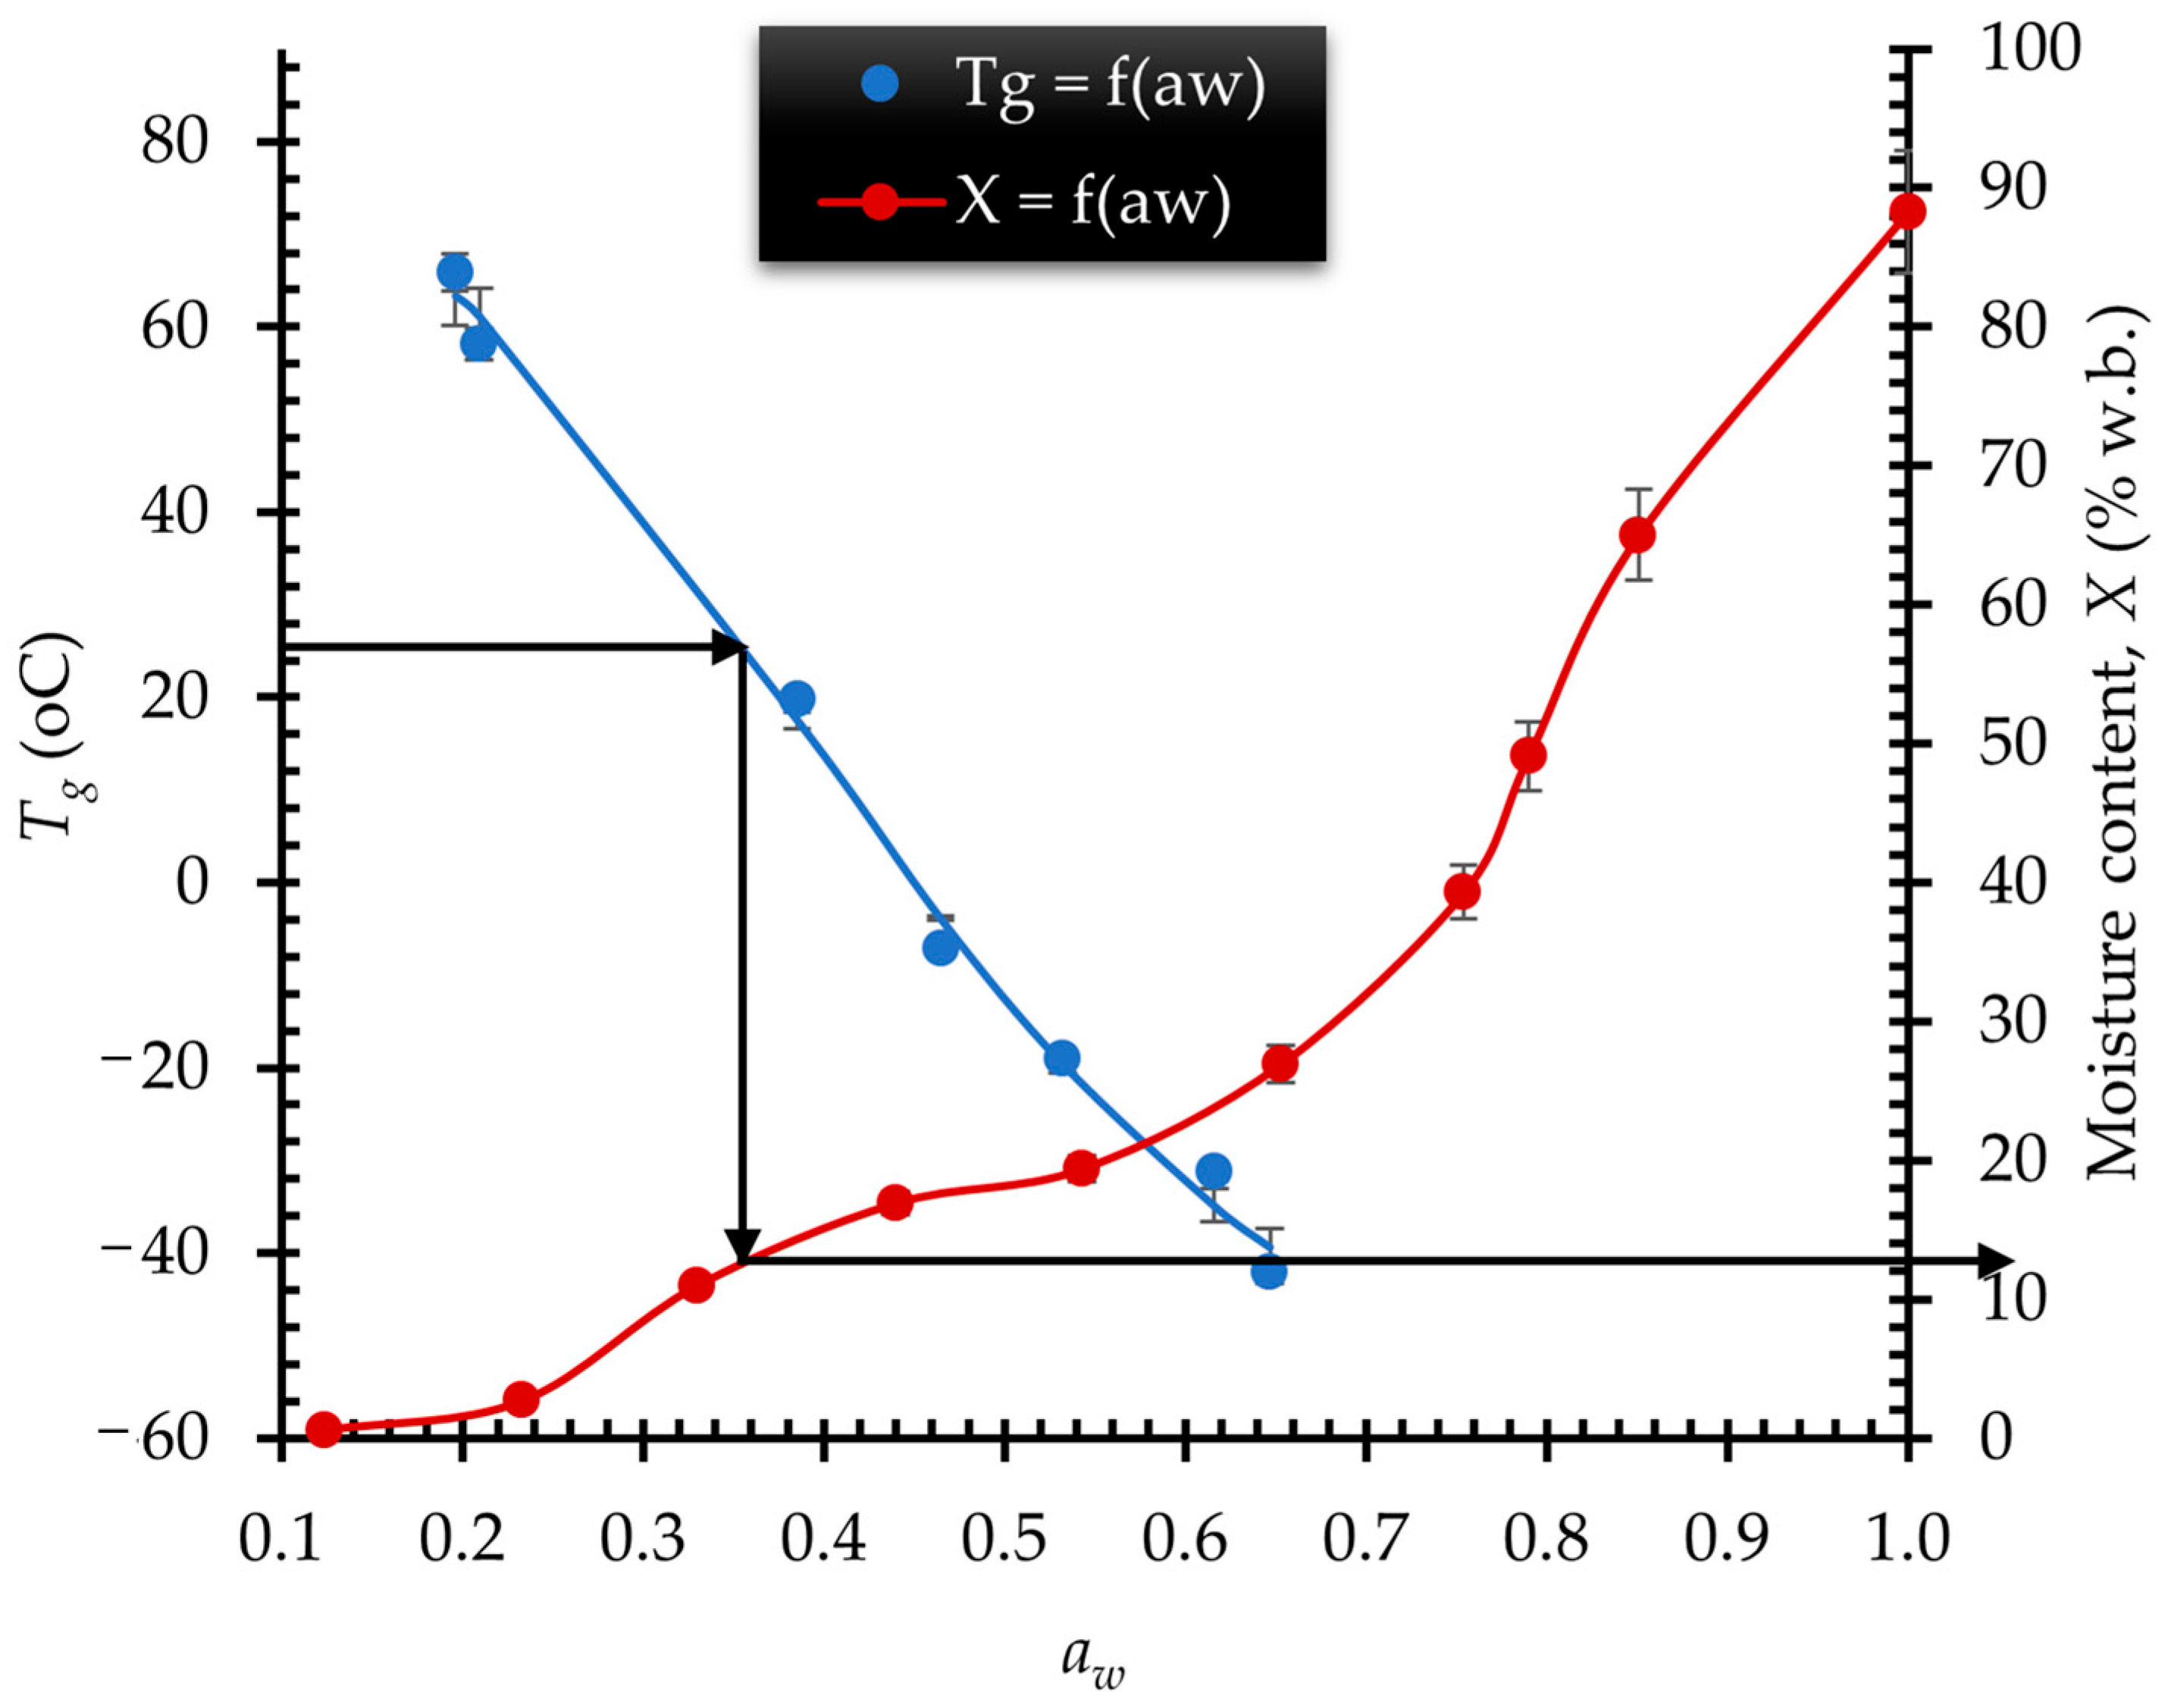
Figure 5 presents the effect of aw on Tg that was modeled using the equation of Khalloufi, El-Maslouhi and Ratti [25] (Equation (10)). This relationship has been reported by several authors, such as Goula, Karapantsios, Achilias and Adamopoulos [40] and Kaderidis and Goula [39]. Conversely, in the middle aw range, a linear correlation was observed, as reported for breakfast cereals and strawberries by Martínez-Navarrete, Pedro, Martínez-Monzó and Chiralt [67] and Moraga, Martínez-Navarrete, and Chiralt [68].
Shrestha, Howes, Adhikari, and Bhandari [69] report the critical water content, or water activity, as the stage at which the glass transition temperature of a product agrees with room temperature, that is typically 25 °C. Roos [70] proposed combining moisture sorption data with glass transition temperature data to evaluate food stability. Thus, moisture sorption and Tg data were given in a joined graph (Figure 5). The sorption data were obtained by utilizing the GAB model on moisture content values, while the Tg values corresponding to particular aw and water content were approximated using the Gordon-Taylor model. The critical water activity and moisture content for dry beetroot are denoted by arrows, showing values of 0.35 and 13% w.b., respectively, at a storage temperature of 25 °C. This proposes that dry beetroot is possible to demonstrate a rubbery surface in an environment with relative humidity above 35% or when its moisture content goes over 13 g per 100 g of product. In contrast, untreated beetroot reached a rubbery state at approximately 35% moisture content due to its lower glass transition temperature.
The estimated critical moisture content goes beyond the monolayer moisture content, Xm, as identified by the GAB equation. The principle of water activity shows that food products attain greatest stability at their monolayer moisture content, while the glass transition theory suggests that formulations keep stability at or below the glass transition temperature. Syamaladevi, Sablani, Tang, Powers, and Swanson [71] reported that water activity is related to the equilibrium state that sets a thermodynamic limit to a mechanism, whereas glass development is a kinetic equilibrium process that takes place at temperatures lower than Tg. This research showed that the glass transition theory often overestimates the critical moisture content in comparison to the water activity theory. Comparable findings have been documented by Kaderides and Goula [39] in their research on orange waste powder. Conversely, Syamaladevi, Sablani, Tang, Powers, and Swanson [71], Moraga et al. [68,72], and Yu et al. [73] suggested a critical moisture content which is is lower than the monolayer moisture content. Sablani, Kasapis, and Rahman [74] suggest that the glass transition concept frequently results in an underestimation of the stability temperature in dried fruits with elevated sugar concentrations, while concurrently overestimating the stability temperatures for substances with high molecular weights.

3.4. Shrinkage

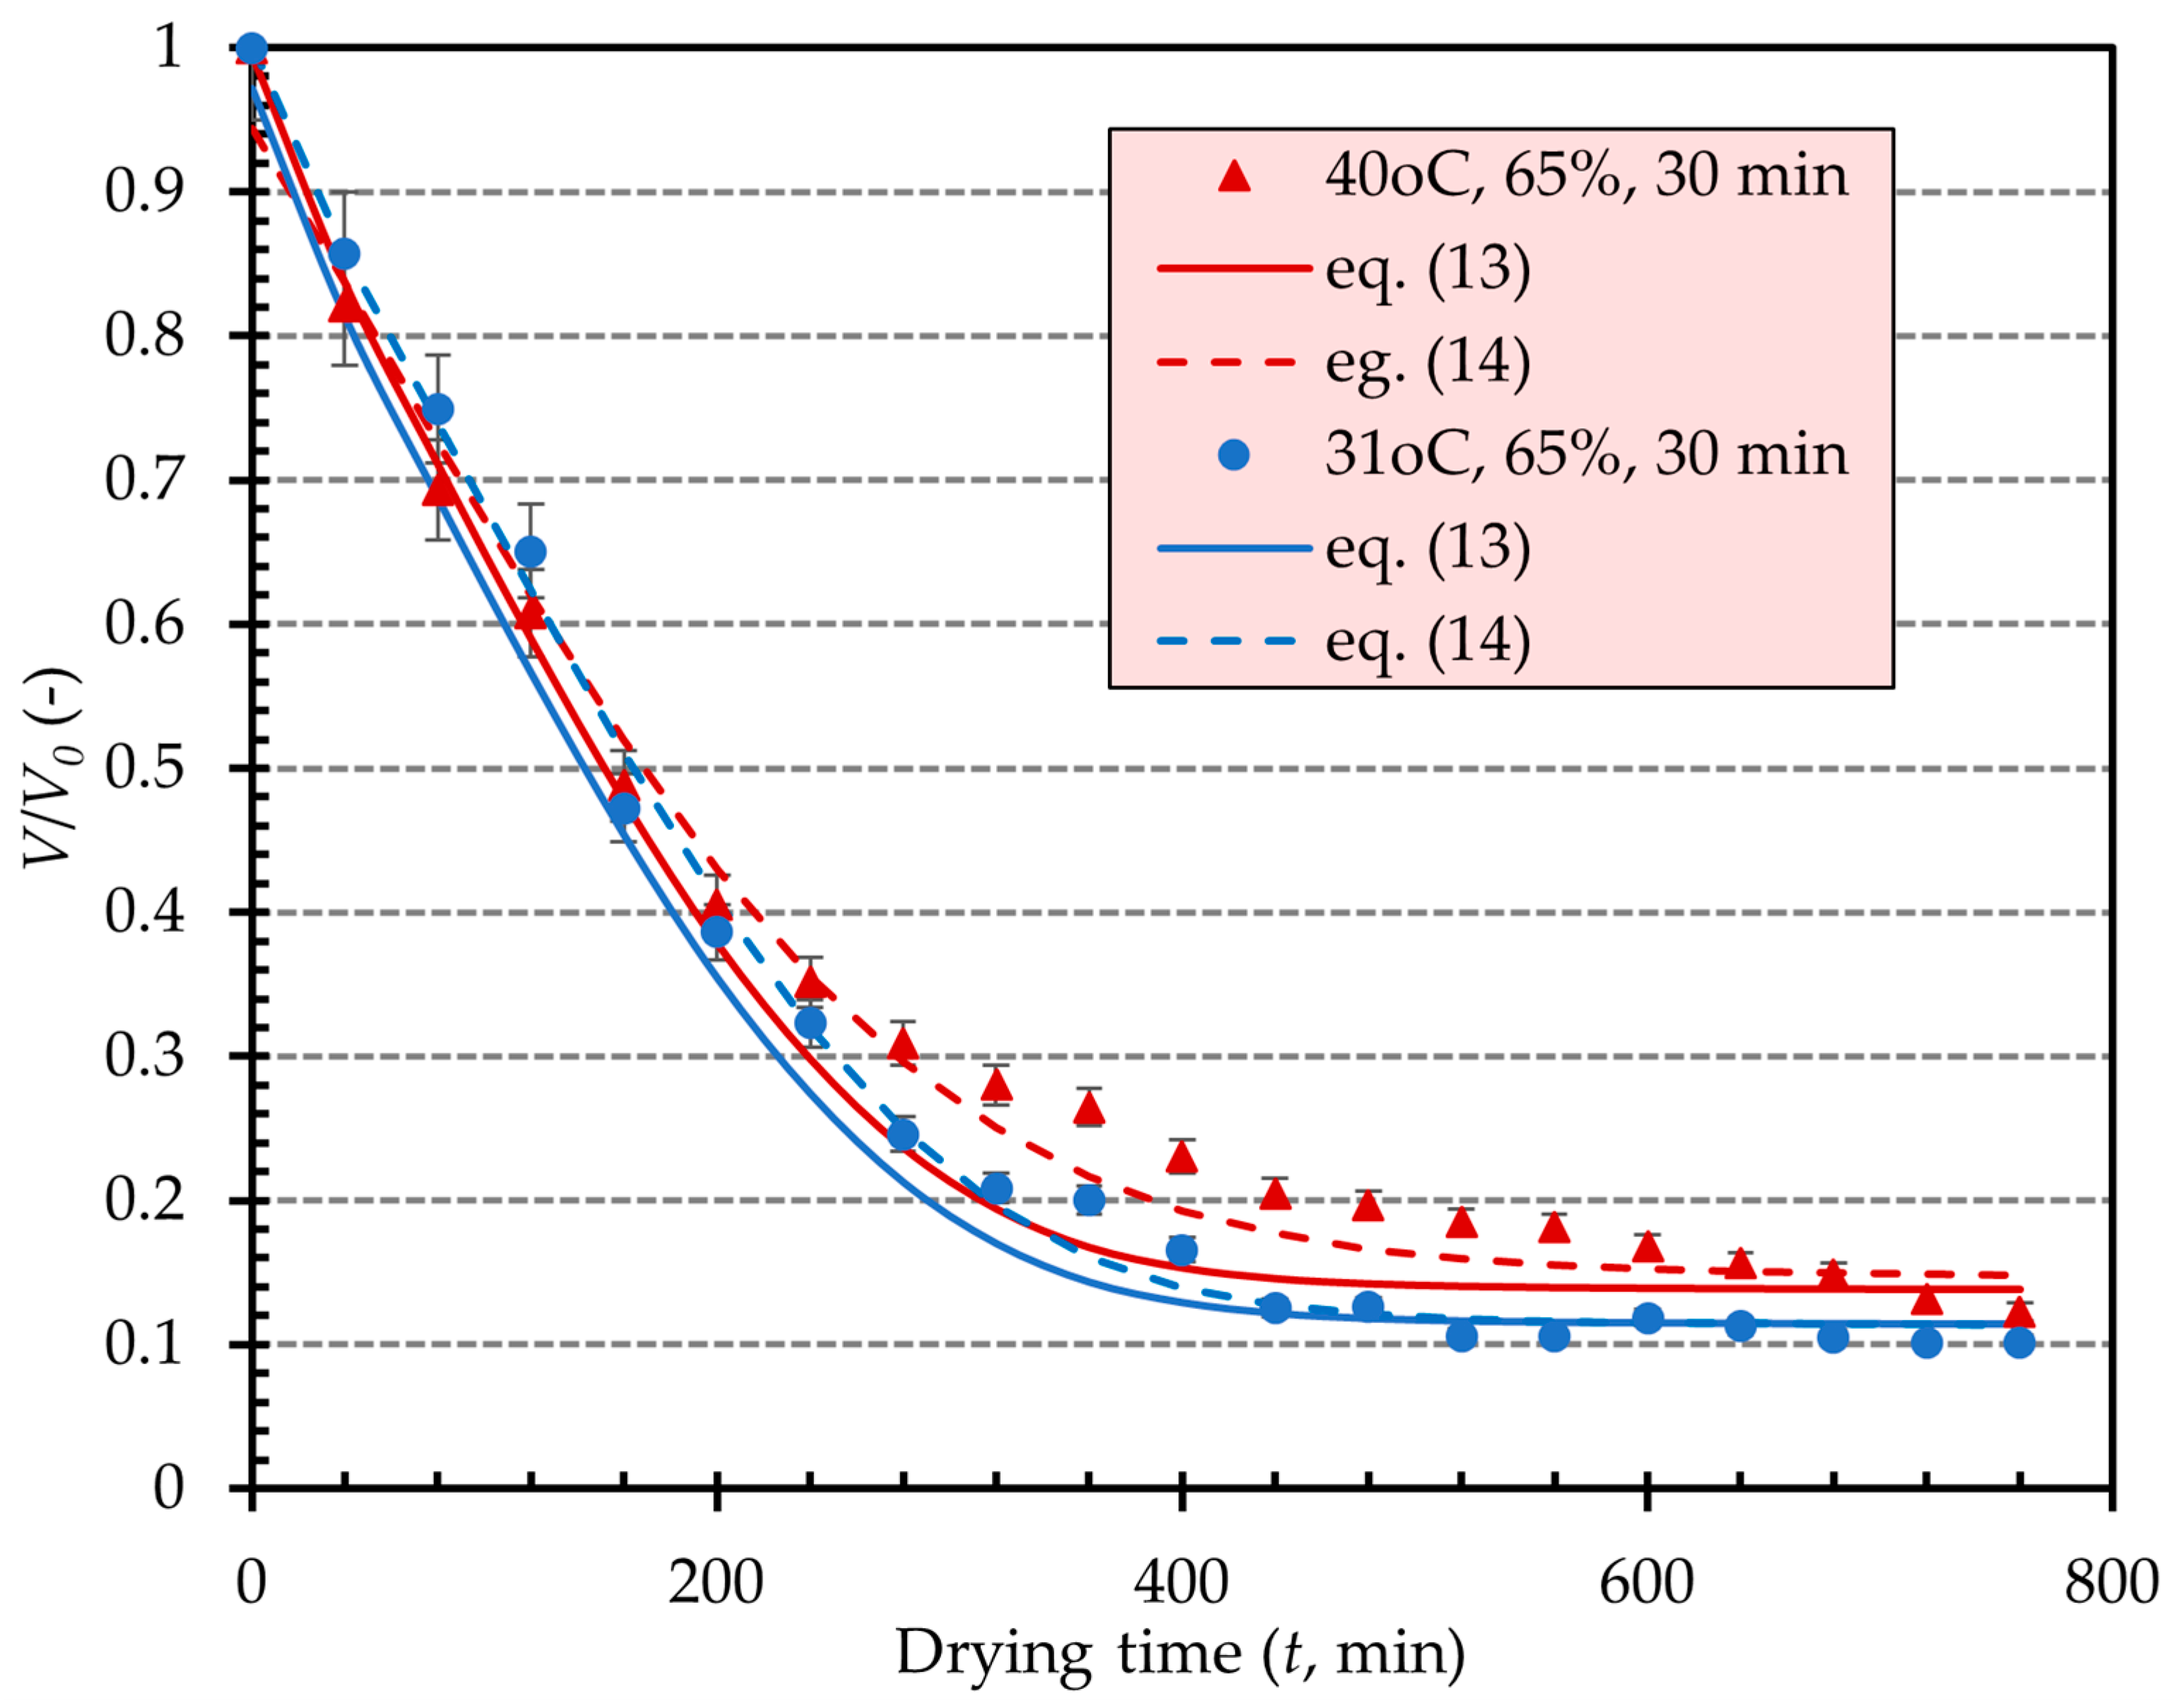
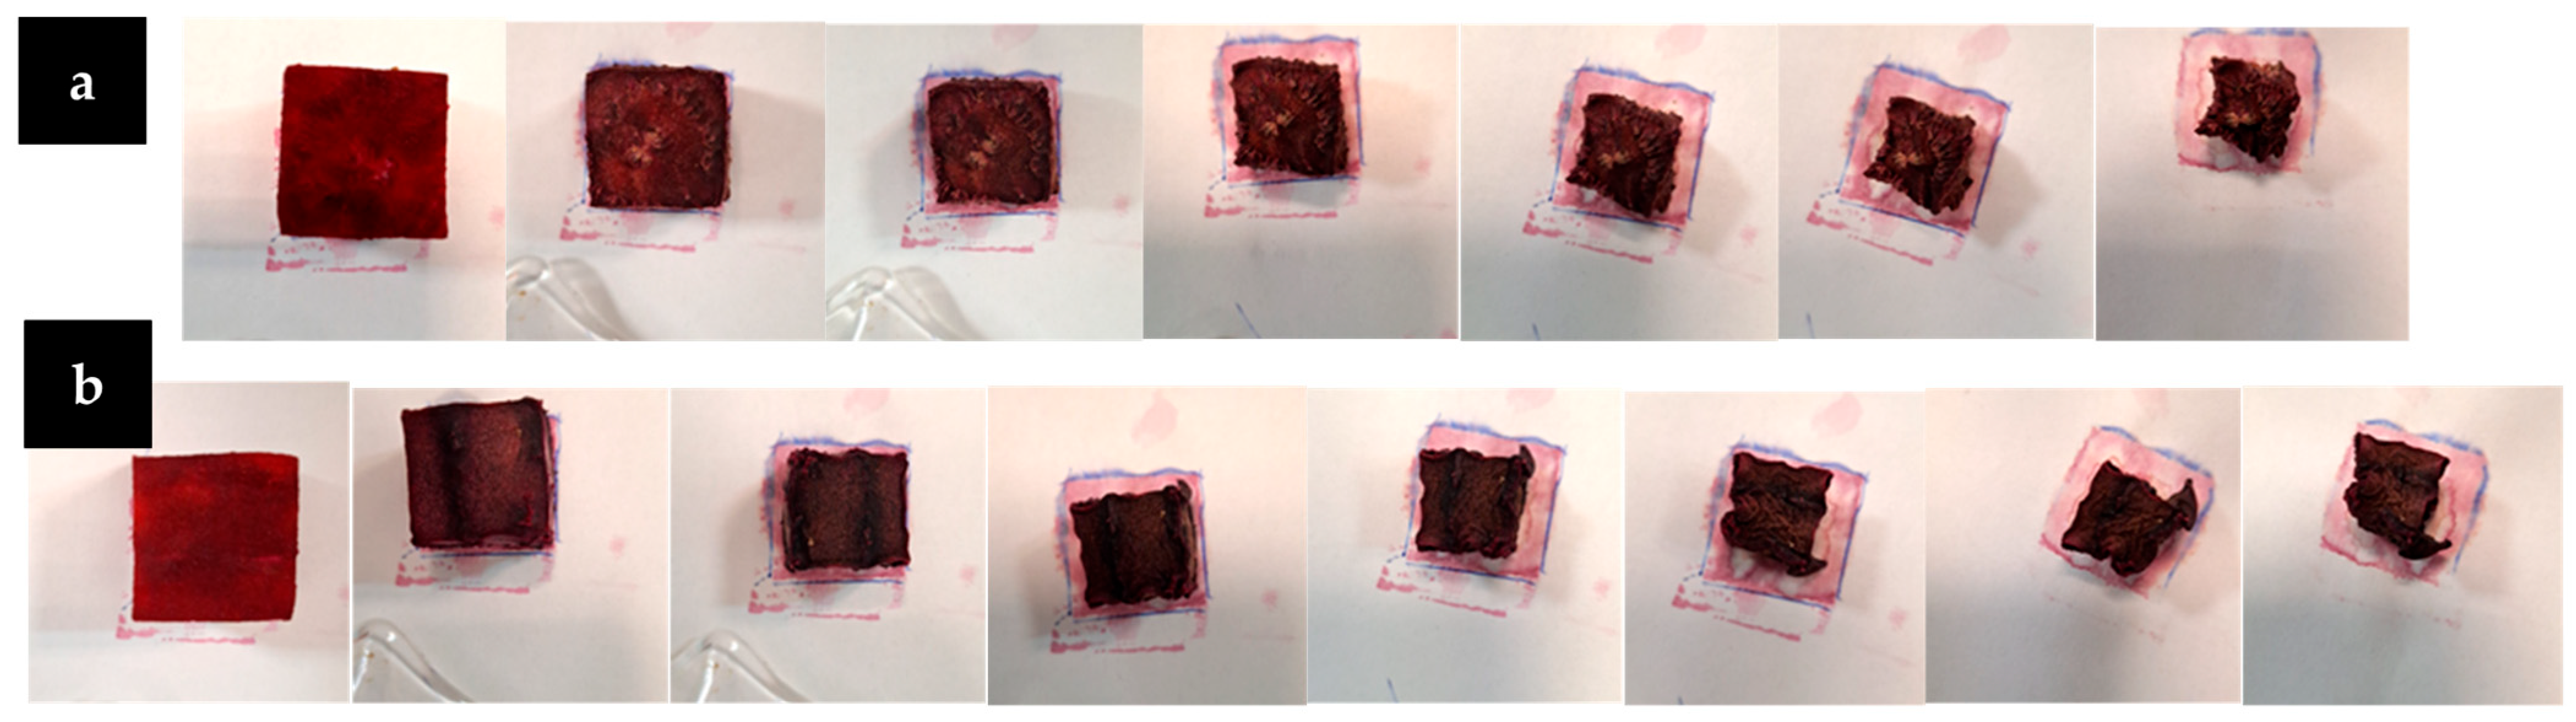
Figure 6 illustrates the reduction in size of beetroot samples over time during drying after ethanol pretreatment at two different experimental conditions. Comparable findings were observed across all conditions. Figure 7 shows the shrinkage of beetroot during drying without and with ethanol pretreatment at the optimum conditions. Shrinkage typically aligns with the characteristics of conventional drying curves, exhibiting significant initial shrinkage followed by a gradual stabilization as drying progresses. The degree of shrinkage is directly proportional to the amount of water extracted; as water removal intensifies, the resultant shrinkage pressures within the material also escalate. In certain instances, a state of mechanical equilibrium is attained when the shrinkage relates to the volume of water that has been removed [5]. According to Cavion, Tonet, Miola, Perottoni and Zorzi [75], the process of drying is commonly divided into two stages: an initial stage where the rate of shrinkage remains constant and a final stage where the rate of shrinkage declines with only minor changes. However, as shown in Figure 6, the relationship between shrinkage and moisture change of beetroots cannot be explained by a single linear relationship.
This phenomenon can be ascribed to the fact that shrinkage behavior results from the interplay of numerous concurrent factors, including the type of material, its state, cellular characteristics, tissue construction, drying conditions, and variations in moisture content [76,77]. Therefore, in this study, the influence of the relative moisture content (X/X0) on the shrinkage (V/V0) was articulated through the subsequent equation:
V V 0 = C 0 + a · e x p b · X X 0
where V is the volume (cm3), V0 is the initial volume (cm3), X is the moisture content (% w.b.), and X0 is the initial moisture content (% w.b.). The parameter C0 is mostly associated with the stage where shrinkage stabilizes. On the contrary, the parameters a and b are correlated with the initial rate of volume change and their values were significantly different (p = 0.05) between pretreatment experiments. This can be attributed to the fact that the cellular structure, the mechanical properties of the food material, and the conditions under which drying occurs are the primary elements that significantly influence the rate of volume shrinkage. In the case of drying after ethanol pretreatment, the cellular structure is highly dependent on the pretreatment conditions. Thus, their effect on the model constants were expressed by the regression equations of Table S1.
Gulati and Datta [76] ascribed the change in shrinkage to the phenomenon of case hardening, which is related to glass transition. This process outcomes in the outer layer of the product drying at a notably quicker rate than the inner. The effect of glass transition temperature on the variation of the shrinkage curve’s slope during the drying of banana and papaya has been also reported by Kurozawa, Hubinger and Park [78]. The glass transition temperature, often referred to as the solid mobility temperature, plays a crucial role in understanding the shrinkage phenomenon during the drying process [79]. In the rubbery state, food materials exhibit significant mobility within their solid matrix. In contrast, the glassy state is characterized by reduced mobility due to increased viscosity. When the temperature of the food material exceeds the glass transition temperature, it remains in the rubbery state. The rate of shrinkage is remarkably higher in this state, as molecular movement is more pronounced than in the glassy state. In addition, the shrinkage in the rubbery state is clearly related to the removal of water.
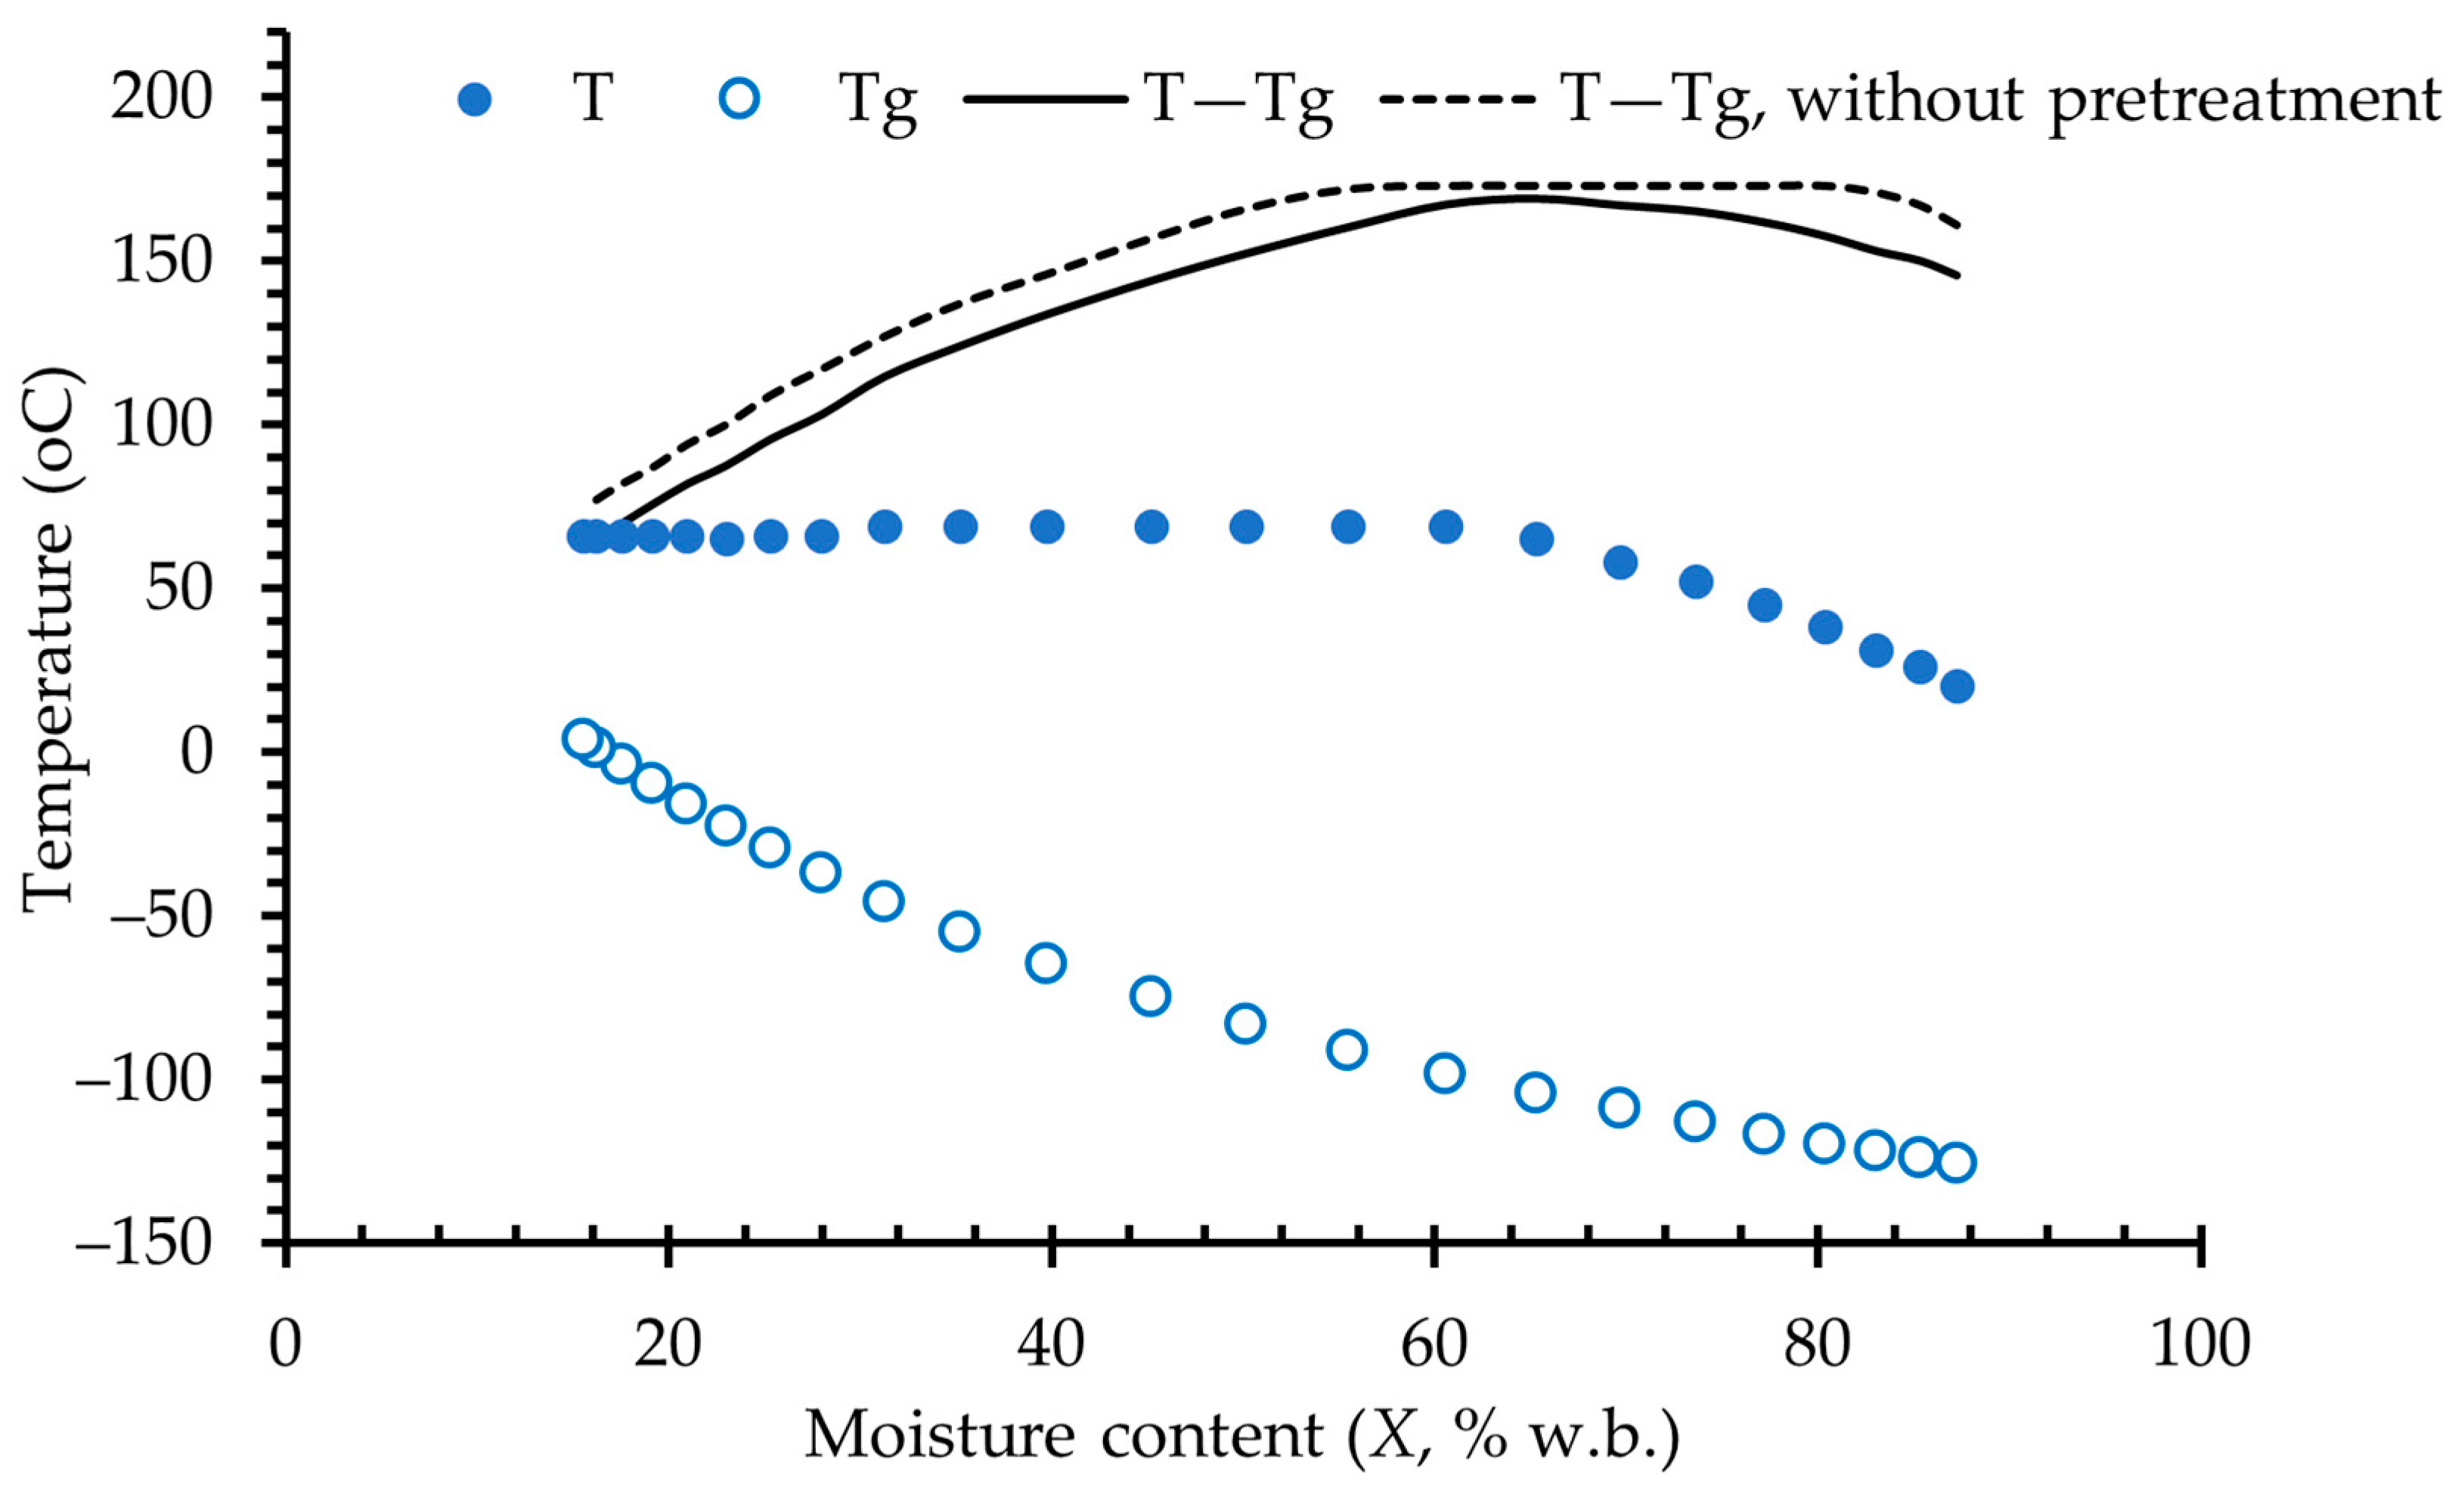
Figure 8 illustrates the state diagram of beetroot after a pretreatment experiment, which includes the line demonstrating the glass transition temperature (Tg) as described by the Gordon-Taylor equation, together with the temperature differences observed during air drying. The surface-averaged beetroot temperature (Τ) initially rises rapidly from the initial product temperature of 20 °C to the wet-bulb temperature, which is approximately 35 °C. Subsequently, this temperature continues to increase from the wet-bulb level until it reaches the ambient air temperature throughout the remainder of the drying process. The beetroot temperature surpassed the glass transition temperature, suggesting that the material stayed entirely in a rubbery state throughout the drying process, without undergoing any state transition.
Taking into account the above discussed effect of glass transition temperature, the shrinkage was described more accurately, as it can be seen in Figure 6, by the following equation:
V V 0 = 128.15 · exp 144.71 · T T g + C · e x p D · X 100 + E
Figure 6 presents the comparison of predicted and experimental values of shrinkage for two drying experiments with different ethanol pretreatment conditions. Similar trends were observed for all experiments. The parameters of the model are highly dependent on the pretreatment conditions, as presented in Figure S1. The mean R2 and SEE values for the model of Equation (14) were found equal to 0.981 and 0.023, whereas the corresponding values for the model of Equation (13) were 0.898 and 0.101, respectively.
It is important to emphasize that the TTg curve for drying subsequent to ethanol pretreatment, as demonstrated in Figure 8, is lower compared to that observed without pretreatment. This difference may be attributed to the slightly higher Tg values of the samples that underwent pretreatment. The reduced TTg values noted after ethanol pretreatment can be associated with the moderated shrinkage, as illustrated in Part I of this study. Research by Kurozawa, Hubinger and Park [78] and Gulati and Datta [76] indicates a positive correlation between the degree of shrinkage and case hardening with the TTg value.
The findings support the theory of glass transition as it relates to material shrinkage. Some researchers, including Katekawa and Silva [80] and Karathanos [81], have utilized the glass transition concept to elucidate the shrinkage and collapse of products during the drying process. Nevertheless, various studies have indicated that this theory falls short in accounting for the shrinkage observed in products subjected to hot-air drying [82]. Rahman [83] assumed that relying on a single concept is inadequate to entirely give explanation to pore formation and shrinkage. The phenomenon of shrinkage may be affected by numerous processes, including glass transition, pore pressure, and the mechanical strength of the matrix. The observed reduction in shrinkage after ethanol pretreatment is consistent with a moderated development of capillary stresses and reduced structural collapse. While glass transition theory provides a useful framework for interpreting these trends, shrinkage during convective drying is likely governed by a combination of mechanisms, including pore pressure, matrix viscoelasticity, and surface tension effects. Similar improvements in drying kinetics following ethanol pretreatment have been also reported for pineapple and beetroot chips [11,36].
The increased levels of shrinkage and case-hardening that occur during the drying process in the absence of pretreatment result in a more significant barrier that hinders the removal of water from the material. This observation aligns with the experimental findings regarding water diffusivities presented in Part I of this study, which demonstrated that the effective diffusivity (Deff) values obtained without pretreatment were considerably lower than those observed under identical drying conditions following ethanol pretreatment. In addition, the TΤg curve for drying after ethanol pretreatment exhibited an increasing trend from the onset until the moisture content reached approximately 65% w.b. In contrast, this trend was not evident in drying with no pretreatment, which showed no significant changes in TΤg values during the mid-stage of the drying process. The rise in TΤg values during the mid-stage of drying after ethanol pretreatment facilitated improved water diffusion, counteracting the diffusion-restrictive effects associated with case-hardening. As a result, the effective diffusion coefficients remained at a relatively elevated level throughout the drying process. Thus, the shorter drying times obtained after ethanol pretreatment may be associated with the resulted higher levels of TTg during the drying process. This correlation was also reported by Zhou et al. [84], who mentioned that a more comprehensive understanding of water diffusion and drying behavior can be achieved through the application of glass transition theory.

4. Conclusions

This study proved that ethanol pretreatment considerably influences the drying behavior, moisture sorption characteristics, glass transition temperature, and shrinkage of beetroot during air drying. Ethanol-pretreated samples showed lower equilibrium moisture contents and decreased water uptake compared to untreated beetroot over the studied water activity range, revealing modified sorption behavior that was well explained by the GAB model.
Thermodynamic analysis showed that water sorption in both treated and untreated beetroot was principally enthalpy-driven, with the net isosteric heat of sorption declining as moisture content increased. Integration of sorption isotherms with glass transition data enabled the identification of critical moisture contents and water activity levels relevant to the physical stability of dried beetroot during processing and storage.
Water acted as an effective plasticizer, substantially reducing the glass transition temperature of beetroot matrices. Ethanol pretreatment resulted in slightly higher glass transition temperatures, by approximately 3–6 °C, at comparable moisture contents, suggesting modifications in molecular interactions within the amorphous phase and contributing to improved resistance against structural collapse. Incorporation of the glass transition concept provided a useful framework for interpreting shrinkage behavior, which was reduced in ethanol-pretreated samples across the studied drying conditions.
Qualitative SEM observations supported the macroscopic findings, showing a more compact and less collapsed cellular structure in ethanol-treated beetroot; however, the absence of quantitative microstructural metrics represents a limitation of the present study. Additionally, detailed compositional profiling and direct quantification of residual ethanol were beyond the scope of this work and should be addressed in future research.
Overall, ethanol pretreatment emerges as a promising strategy to improve drying efficiency and enhance the physicochemical stability of dried beetroot. Future studies should focus on quantitative microstructural analysis, detailed compositional characterization, and the extension of this approach to other food matrices in order to further evaluate its technological feasibility and industrial applicability.

Supplementary Materials

The following supporting information can be downloaded at: https://www.mdpi.com/article/10.3390/app16020768/s1, Figure S1: Effect of pretreatment conditions on the parameters of the shrinkage model (Equation (14)) for beetroot drying after ethanol pretreatment; Table S1: Effect of pretreatment parameters on the constants of the shrinkage Equation (13).

Author Contributions

Conceptualization, A.M.G.; methodology, D.F.; software, D.F.; validation, D.F.; formal analysis, D.F.; investigation, D.F.; resources, A.M.G.; data curation, D.F. and A.M.G.; writing—original draft preparation, D.F.; writing—review and editing, A.M.G.; visualization, A.M.G.; supervision, A.M.G.; project administration, A.M.G.; funding acquisition, A.M.G. All authors have read and agreed to the published version of the manuscript.

Funding

This research received no external funding.

Data Availability Statement

The datasets used and/or analyzed during the current study are available from the corresponding author on reasonable request.

Conflicts of Interest

The authors declare no conflicts of interest.

References

  1. Ceclu, L.; Nistor, O.V. Red beetroot: Composition and health effects—A review. J. Nutr. Med. Diet Care 2020, 6, 43. [Google Scholar] [CrossRef]
  2. Tan, M.L.; Hamid, S.B.S. Beetroot as a potential functional food for cancer chemoprevention, a narrative review. J. Cancer Prev. 2021, 26, 1–17. [Google Scholar] [CrossRef]
  3. Nemzer, B.; Pietrzkowski, Z.; Spórna, A.; Stalica, P.; Thresher, W.; Michałowski, T.; Wybraniec, S. Betalainic and nutritional profiles of pigment-enriched red beet root (Beta vulgaris L.) dried extracts. Food Chem. 2011, 127, 42–53. [Google Scholar] [CrossRef]
  4. Ozaki, M.M.; Munekata, P.E.; Jacinto-Valderrama, R.A.; Efraim, P.; Pateiro, M.; Lorenzo, J.M.; Pollonio, M.A.R. Beetroot and radish powders as natural nitrite source for fermented dry sausages. Meat Sci. 2021, 171, 108275. [Google Scholar] [CrossRef]
  5. Mayor, L.; Sereno, A.M. Modelling shrinkage during convective drying of food materials: A review. J. Food Eng. 2004, 61, 373–386. [Google Scholar] [CrossRef]
  6. Lech, K.; Figiel, A.; Wojdyło, A.; Korzeniowska, M.; Serowik, M.; Szarycz, M. Drying kinetics and bioactivity of beetroot slices pretreated in concentrated chokeberry juice and dried with vacuum microwaves. Dry. Technol. 2015, 33, 1644–1653. [Google Scholar] [CrossRef]
  7. Liu, Y.; Duan, Z.; Sabadash, S. Bioactive compounds and antioxidant activity of beetroots prepared by different drying methods. Ukr. J. Food Sci. 2021, 9, 246–258. [Google Scholar] [CrossRef]
  8. Nistor, O.V.; Seremet, L.; Andronoiu, D.G.; Rudi, L.; Botez, E. Influence of different drying methods on the physicochemical properties of red beetroot (Beta vulgaris L. var. Cylindra). Food Chem. 2017, 236, 59–67. [Google Scholar] [CrossRef] [PubMed]
  9. Malakar, S.; Alam, M.; Arora, V.K. Evacuated tube solar and sun drying of beetroot slices: Comparative assessment of thermal performance, drying kinetics, and quality analysis. Sol. Energy 2022, 233, 246–258. [Google Scholar] [CrossRef]
  10. Mella, C.; Vega-Gálvez, A.; Uribe, E.; Pasten, A.; Mejias, N.; Quispe-Fuentes, I. Impact of vacuum drying on drying characteristics and functional properties of beetroot (Beta vulgaris). Appl. Food Res. 2022, 2, 100120. [Google Scholar] [CrossRef]
  11. Kian-Pour, N.; Ceyhan, T.; Ozmen, D.; Toker, O.S. Effect of ultrasound-ethanol immersion, microwave and starch-blanching pretreatments on drying kinetics, rehydration, and quality properties of beetroot chips. Int. J. Food Eng. 2024, 20, 85–99. [Google Scholar] [CrossRef]
  12. Bernstein, A.; Noreña, C.P.Z. Study of thermodynamic, structural, and quality properties of yacon (Smallanthus sonchifolius) during drying. J. Food Bioprocess. Eng. 2014, 7, 148–160. [Google Scholar] [CrossRef]
  13. Kaymak-Ertekin, F.; Gedik, A. Sorption isotherms and isosteric heat of sorption for grapes, apricots, apples and potatoes. LWT-Food Sci. Technol. 2004, 37, 429–438. [Google Scholar] [CrossRef]
  14. Lago, C.C.; Liendo-Cárdenas, M.; Noreña, C.P.Z. Thermodynamic sorption properties of potato and sweet potato flakes. Food Bioprod. Process. 2013, 91, 389–395. [Google Scholar] [CrossRef]
  15. Majid, I.; Hussain, S.; Nanda, V. Moisture sorption isotherms and quality characteristics of onion powder during storage as affected by sprouting. J. Food Meas. Charact. 2019, 13, 775–784. [Google Scholar] [CrossRef]
  16. Foke, V. Modelling of sorption isotherms of blanched and unblanched spinach leaves. Int. J. Process. Post Harvest. Technol. 2013, 4, 79–82. [Google Scholar]
  17. Fante, L.; Noreña, C.P.Z. Quality of hot air dried and freeze-dried of garlic (Allium sativum L.). J. Food Sci. Technol. 2015, 52, 211–220. [Google Scholar] [CrossRef]
  18. Krishna Kumar, P.; Bhunia, K.; Tang, J.; Rasco, B.A.; Takhar, P.S.; Sablani, S.S. Thermal transition and thermo-physical properties of potato (Solanum tuberosum L.) var. Russet brown. J. Food Meas. Charact. 2018, 12, 1572–1580. [Google Scholar] [CrossRef]
  19. Xu, C.; Li, Y.; Yu, H. Effect of far-infrared drying on the water state and glass transition temperature in carrots. J. Food Eng. 2014, 136, 42–47. [Google Scholar] [CrossRef]
  20. Telis, V.R.N.; Sobral, P.J.D.A. Glass transitions for freeze-dried and air-dried tomato. Food Res. Int. 2002, 35, 435–443. [Google Scholar] [CrossRef]
  21. Al-Muhtaseb, A.H.; McMinn, W.A.M.; Magee, T.R.A. Water sorption isotherms of starch powders. Part 2: Thermodynamic characteristics. J. Food Eng. 2004, 62, 135–142. [Google Scholar] [CrossRef]
  22. Tsami, E.; Maroulis, Z.B.; Marinos-Kouris, D.; Saravacos, G.D. Heat of sorption of water in dried fruits. Int. J. Food Sci. Technol. 1990, 25, 350–359. [Google Scholar] [CrossRef]
  23. Krug, R.R.; Hunter, W.G.; Grieger, R.A. Enthalpy-entropy compensation. 1. Some fundamental statistical problems associated with the analysis of vant Hoff and Arrhenius data. J. Phys. Chem. 1976, 80, 2335–2341. [Google Scholar] [CrossRef]
  24. Gordon, M.; Taylor, J.S. Ideal copolymers and the second-order transitions of synthetic rubbers. I. Non-crystalline copolymers. J. Appl. Chem. 1952, 2, 493–500. [Google Scholar] [CrossRef]
  25. Khalloufi, S.; El-Maslouhi, Y.; Ratti, C. Mathematical model for prediction of glass transition temperature of fruit powders. J. Food Sci. 2000, 65, 842–848. [Google Scholar] [CrossRef]
  26. Yan, Z.; Sousa-Gallagher, M.J.; Oliveira, F.A. Sorption isotherms and moisture sorption hysteresis of intermediate moisture content banana. J. Food Eng. 2008, 86, 342–348. [Google Scholar] [CrossRef]
  27. García-Pérez, J.V.; Cárcel, J.A.; Clemente, G.; Mulet, A. Water sorption isotherms for lemon peel at different temperatures and isosteric heats. LWT-Food Sci. Technol. 2008, 41, 18–25. [Google Scholar] [CrossRef]
  28. Bejar, A.K.; Mihoubi, N.B.; Kechaou, N. Moisture sorption isotherms–Experimental and mathematical investigations of orange (Citrus sinensis) peel and leaves. Food Chem. 2012, 132, 1728–1735. [Google Scholar] [CrossRef]
  29. Villa-Vélez, H.A.; Váquiro, H.A.; Bon, J.; Telis-Romero, J. Modelling thermodynamic properties of banana waste by analytical derivation of desorption isotherms. Int. J. Food Eng. 2012, 8, 1–19. [Google Scholar] [CrossRef]
  30. Prette, A.P.; Almeida, F.D.A.C.; Villa-Velez, H.A.; Telis-Romero, J. Thermodynamic properties of water sorption of jackfruit (Artocarpus heterophyllus Lam.) as a function of moisture content. Food Sci. Technol. 2013, 33, 199–208. [Google Scholar] [CrossRef]
  31. Lago, C.C.; Noreña, C.P.Z. Thermodynamic analysis of sorption isotherms of dehydrated yacon (Smallanthus sonchifolius) bagasse. Food Bio. 2015, 12, 26–33. [Google Scholar] [CrossRef]
  32. Villa-Vélez, H.A.; Ferreira de Souza, S.J.; Ramos, A.P.; Polachini, T.; Telis-Romero, J. Thermodynamic properties of water adsorption from orange peels. J. Bioenergy Food Sci. 2015, 2, 72–81. [Google Scholar] [CrossRef]
  33. Falade, K.O.; Aworh, O.C. Adsorption isotherms of osmo-oven dried African star apple (Chrysophyllum albidum) and African mango (Irvingia gabonensis) slices. Eur. Food Res. Technol. 2004, 218, 278–283. [Google Scholar] [CrossRef]
  34. Kiryakov, I.; Georgieva, M.; Tashev, A.; Tashev, I. Equilibrium isotherms of red beetroots. BIO Web Conf.-EDP Sci. 2023, 58, 03002. [Google Scholar] [CrossRef]
  35. Varner, A.S. Modeling and Optimization of the Dehydration of Beets for Use as a Value-Added Food Ingredient. Ph.D. Thesis, University of Georgia, Athens, GA, USA, 2014. [Google Scholar]
  36. Iglesias, H.A.; Chirife, J.; Lombardi, J.L. Comparison of water vapour sorption by sugar beet root components. Int. J. Food Sci. Technol. 1975, 10, 385–391. [Google Scholar] [CrossRef]
  37. Kaymak-Ertekin, F.; Sultanoglu, M. Moisture sorption isotherm characteristics of peppers. J. Food Eng. 2001, 477, 225–231. [Google Scholar] [CrossRef]
  38. Sormoli, M.E.; Langrish, T.A. Moisture sorption isotherms and net isosteric heat of sorption for spray-dried pure orange juice powder. LWT-Food Sci. Technol. 2015, 62, 875–882. [Google Scholar] [CrossRef]
  39. Kaderides, K.; Goula, A.M. Development and characterization of a new encapsulating agent from orange juice by-products. Food Res. Int. 2017, 100, 612–622. [Google Scholar] [CrossRef] [PubMed]
  40. Goula, A.M.; Karapantsios, T.D.; Achilias, D.S.; Adamopoulos, K.G. Water sorption isotherms and glass transition temperature of spray dried tomato pulp. J. Food Eng. 2008, 85, 73–83. [Google Scholar] [CrossRef]
  41. Yogendrarajah, P.; Samapundo, S.; Devlieghere, F.; De Saeger, S.; De Meulenaer, B. Moisture sorption isotherms and thermodynamic properties of whole black peppercorns (Piper nigrum L.). LWT-Food Sci. Technol. 2015, 64, 177–188. [Google Scholar] [CrossRef]
  42. Ayranci, E.; Ayranci, G.; Dogantan, Z. Moisture sorption isotherms of dried apricot, fig and raisin at 20 °C and 36 °C. J. Food Sci. 1990, 55, 1591–1593. [Google Scholar] [CrossRef]
  43. Telis, V.R.N.; Gabas, A.L.; Menegalli, F.C.; Telis-Romero, J. Water sorption thermodynamic properties applied to persimmon skin and pulp. Thermochim. Acta 2000, 343, 49–56. [Google Scholar] [CrossRef]
  44. Maroulis, Z.B.; Tsami, E.; Marinos-Kouris, D.; Saravacos, G.D. Application of the GAB model to the moisture sorption isotherms for dried fruits. J. Food Eng. 1988, 7, 63–78. [Google Scholar] [CrossRef]
  45. Andrade, R.D.P.; Lemus, R.M.; Pérez, C.E.C. Models of sorption isotherms for food: Uses and limitations. Vitae 2011, 18, 325–334. [Google Scholar] [CrossRef]
  46. Quirijns, E.J.; Van Boxtel, A.J.; Van Loon, W.K.; Van Straten, G. Sorption isotherms, GAB parameters and isosteric heat of sorption. J. Sci. Food Agric. 2005, 85, 1805–1814. [Google Scholar] [CrossRef]
  47. Martinez-Monteagudo, S.I.; Salais-Fierro, F. Moisture sorption isotherms and thermodynamic properties of mexican mennonite-style cheese. J. Food Sci. Technol. 2014, 51, 2393–2403. [Google Scholar] [CrossRef][Green Version]
  48. Koc, B.; Yilmazer, M.S.; Balkır, P.; Ertekin, F.K. Moisture sorption isotherms and storage stability of spray-dried yogurt powder. Dry. Technol. 2010, 28, 816–822. [Google Scholar] [CrossRef]
  49. McMinn, W.A.M.; Magee, T.R.A. Thermodynamic properties of moisture sorption of potato. J. Food Eng. 2003, 60, 157–165. [Google Scholar] [CrossRef]
  50. Moreira, R.; Chenlo, F.; Torres, M.D.; Vallejo, N. Thermodynamic analysis of experimental sorption isotherms of loquat and quince fruits. J. Food Eng. 2008, 88, 514–521. [Google Scholar] [CrossRef]
  51. Mrad, N.D.; Bonazzi, C.; Courtois, F.; Kechaou, N.; Mihoubi, N.B. Moisture desorption isotherms and glass transition temperatures of osmo-dehydrated apple and pear. Food Bioprod. Process. 2013, 91, 121–128. [Google Scholar] [CrossRef]
  52. de Freitas, L.D.C.; Brandão, S.C.R.; Fernandes da Silva, J.H.; Sá da Rocha, O.R.; Azoubel, P.M. Effect of ethanol and ultrasound pretreatments on pineapple convective drying. Food Technol. Biotechnol. 2021, 59, 209–215. [Google Scholar] [CrossRef] [PubMed]
  53. Toğrul, H.; Arslan, N. Moisture sorption behaviour and thermodynamic characteristics of rice stored in a chamber under controlled humidity. Biosyst. Eng. 2006, 95, 181–195. [Google Scholar] [CrossRef]
  54. Kiranoudis, C.T.; Maroulis, Z.B.; Tsami, E.; Marinos-Kouris, D. Equilibrium moisture content and heat of desorption of some vegetables. J. Food Eng. 1993, 20, 55–74. [Google Scholar] [CrossRef]
  55. Xiao, Q.; Tong, Q. Thermodynamic properties of moisture sorption in pullulan–sodium alginate based edible films. Food Res. Int. 2013, 54, 1605–1612. [Google Scholar] [CrossRef]
  56. Al-Muhtaseb, A.H.; McMinn, W.A.M.; Magee, T.R.A. Water sorption isotherms of starch powders: Part 1: Mathematical description of experimental data. J. Food Eng. 2004, 61, 297–307. [Google Scholar] [CrossRef]
  57. Beristain, C.I.; Garcia, H.S.; Azuara, E. Enthalpy-entropy compensation in food vapor adsorption. J. Food Eng. 1996, 30, 405–415. [Google Scholar] [CrossRef]
  58. Cladera-Olivera, F.; Marczak, L.D.F.; Noreña, C.P.Z.; Pettermann, A.C. Modeling water adsorption isotherms of pinhão (Araucaria angustifolia seeds) flour and thermodynamic analysis of the adsorption process. J. Food Process. Eng. 2011, 34, 826–843. [Google Scholar] [CrossRef]
  59. Moraru, C.I.; Lee, T.C.; Karwe, M.V.; Kokini, J.L. Plasticizing and Antiplasticizing Effects of Water and Polyols on a Meat-Starch Extruded Matri. J. Food Sci. 2002, 67, 3396–3401. [Google Scholar] [CrossRef]
  60. Linnenkugel, S.; Paterson, A.H.; Huffman, L.M.; Bronlund, J.E. Prediction of the effect of water on the glass transition temperature of low molecular weight and polysaccharide mixtures. Food Hydrocoll. 2022, 128, 107573. [Google Scholar] [CrossRef]
  61. Telis, V.R.N.; Sobral, P.J.D.A. Glass transitions and state diagram for freeze-dried pineapple. LWT-Food Sci. Technol. 2001, 34, 199–205. [Google Scholar] [CrossRef]
  62. Slade, L.; Levine, H. A food polymer science approach to structure-property relationships in aqueous food systems: Non-equilibrium behavior of carbohydrate-water systems. In Water Relationships in Foods: Advances in the 1980s and Trends for the 1990s; Springer: New York, NY, USA, 1991; pp. 29–101. [Google Scholar]
  63. Mrad, N.D.; Bonazzi, C.; Boudhrioua, N.; Kechaou, N.; Courtois, F. Influence of sugar composition on water sorption isotherms and on glass transition in apricots. J. Food Eng. 2012, 111, 403–411. [Google Scholar] [CrossRef]
  64. Iaccheri, E.; Castagnini, J.M.; Dalla Rosa, M.; Rocculi, P. New insights into the glass transition of dried fruits and vegetables and the effect of pulsed electric field treatment. Innov. Food Sci. Emerg. Technol. 2021, 67, 102566. [Google Scholar] [CrossRef]
  65. Caballero-Cerón, C.; Serment-Moreno, V.; Velazquez, G.; Torres, J.A.; Welti-Chanes, J. Hygroscopic properties and glass transition of dehydrated mango, apple and banana. J. Food Sci. Technol. 2018, 55, 540–549. [Google Scholar] [CrossRef]
  66. Moraga, G.; Talens, P.; Moraga, M.J.; Martínez-Navarrete, N. Implication of water activity and glass transition on the mechanical and optical properties of freeze-dried apple and banana slices. J. Food Eng. 2011, 106, 212–219. [Google Scholar] [CrossRef]
  67. Martinez-Navarrete, N.; Pedro, R.; Martínez-Monzó, J.; Chiralt, A. Water sorption and plasticization effect in breakfast cereals. Changes in texture. In Proceedings of the 3rd Karlsruhe Nutrition Symposium European Research Towards Safer and Better Food, Karlsruhe, Germany, 18–20 October 1998; p. 485. [Google Scholar]
  68. Moraga, G.; Martınez-Navarrete, N.; Chiralt, A. Water sorption isotherms and glass transition in strawberries: Influence of pretreatment. J. Food Eng. 2004, 62, 315–321. [Google Scholar] [CrossRef]
  69. Shrestha, A.K.; Howes, T.; Adhikari, B.P.; Bhandari, B.R. Water sorption and glass transition properties of spray dried lactose hydrolysed skim milk powder. LWT-Food Sci. Technol. 2007, 40, 1593–1600. [Google Scholar] [CrossRef]
  70. Roos, Y. Melting and glass transitions of low molecular weight carbohydrates. Carbohydr. Res. 1993, 238, 39–48. [Google Scholar] [CrossRef]
  71. Syamaladevi, R.M.; Sablani, S.S.; Tang, J.; Powers, J.; Swanson, B.G. State diagram and water adsorption isotherm of raspberry (Rubus idaeus). J. Food Eng. 2009, 91, 460–467. [Google Scholar] [CrossRef]
  72. Moraga, G.; Martínez-Navarrete, N.; Chiralt, A. Water sorption isotherms and phase transitions in kiwifruit. J. Food Eng. 2006, 72, 147–156. [Google Scholar] [CrossRef]
  73. Yu, H.; Zheng, Y.; Li, Y. Shelf life and storage stability of spray-dried bovine colostrum powders under different storage conditions. J. Food Sci. Technol. 2015, 52, 944–951. [Google Scholar] [CrossRef]
  74. Sablani, S.S.; Kasapis, S.; Rahman, M.S. Evaluating water activity and glass transition concepts for food stability. J. Food Eng. 2007, 78, 266–271. [Google Scholar] [CrossRef]
  75. Cavion, C.; Tonet, J.; Miola, L.D.S.; Perottoni, C.A.; Zorzi, J.E. A heuristic approach to the automated analysis of drying curves. Int. J. Appl. Ceram. Technol. 2019, 16, 400–403. [Google Scholar] [CrossRef]
  76. Gulati, T.; Datta, A.K. Mechanistic understanding of case-hardening and texture development during drying of food materials. J. Food Eng. 2015, 166, 119–138. [Google Scholar] [CrossRef]
  77. Nguyen, T.K.; Mondor, M.; Ratti, C. Shrinkage of cellular food during air drying. J. Food Eng. 2018, 230, 8–17. [Google Scholar] [CrossRef]
  78. Kurozawa, L.E.; Hubinger, M.D.; Park, K.J. Glass transition phenomenon on shrinkage of papaya during convective drying. J. Food Eng. 2012, 108, 43–50. [Google Scholar] [CrossRef]
  79. Cnossen, A.G.; Siebenmorgen, T.J. The glass transition temperature concept in rice drying and tempering: Effect on milling quality. Trans. ASAE 2000, 43, 1661–1667. [Google Scholar] [CrossRef]
  80. Katekawa, M.E.; Silva, M.A. On the influence of glass transition on shrinkage in convective drying of fruits: A case study of banana drying. Dry. Technol. 2007, 25, 1659–1666. [Google Scholar] [CrossRef]
  81. Karathanos, V. Collapse of structure during drying of celery. Dry. Technol. 1993, 11, 1005–1023. [Google Scholar] [CrossRef]
  82. Del Valle, J.M.; Cuadros, T.R.M.; Aguilera, J.M. Glass transitions and shrinkage during drying and storage of osmosed apple pieces. Food Res. Int. 1998, 31, 191–204. [Google Scholar] [CrossRef]
  83. Rahman, M.S. Toward prediction of porosity in foods during drying: A brief review. Dry. Technol. 2001, 19, 1–13. [Google Scholar] [CrossRef]
  84. Zhou, M.; Li, C.; Bi, J.; Jin, X.; Lyu, J.; Li, X. Towards understanding the enhancement of moisture diffusion during intermediate-infrared drying of peach pomace based on the glass transition theory. Innov. Food Sci. Emerg. Technol. 2019, 54, 143–151. [Google Scholar] [CrossRef]
Figure 1. (a) Sorption isotherms of dry beetroot at various temperatures, (b) sorption isotherms at 20 °C for various dry beetroot products [34,35,36].
Applsci 16 00768 g001
Figure 2. SEM images of beetroot dried by the hot air method at 70 °C (A) without and (B) with ethanol pretreatment.
Applsci 16 00768 g002
Figure 3. Values of isosteric heat of sorption (qst) and entropy (ΔS) for beetroot dried at various moisture contents (X).
Applsci 16 00768 g003
Figure 4. Experimental (symbols) and predicted by (a) Gordon and Taylor model (line) and (b) Roos and Khalloufi et al. [25] models (lines) data for the relationship between glass transition temperature (Tg) and (a) moisture content (X) and (b) aw for dry beetroot.
Applsci 16 00768 g004
Figure 5. Relationship between the water activity (aw) at 25 °C, moisture content (X), and glass transition temperature (Tg) of dry beetroot.
Applsci 16 00768 g005
Figure 6. Experimental and predicted shrinkage values (V/V0) of beetroot over time (t) during drying after ethanol pretreatment at two different experimental conditions.
Applsci 16 00768 g006
Figure 7. Shrinkage of beetroot cube (2 cm) during drying at 70 °C (a) without and (b) with ethanol pretreatment (pretreatment conditions of tp = 30 min, Ec = 100% v/v, and Tp = 55 °C).
Applsci 16 00768 g007
Figure 8. State diagram of beetroot: fitted line for Tg modeled and temperature variation curves during drying.
Applsci 16 00768 g008
Disclaimer/Publisher’s Note: The statements, opinions and data contained in all publications are solely those of the individual author(s) and contributor(s) and not of MDPI and/or the editor(s). MDPI and/or the editor(s) disclaim responsibility for any injury to people or property resulting from any ideas, methods, instructions or products referred to in the content.