Article

Green Transportation Planning for Smart Cities: Digital Twins and Real-Time Traffic Optimization in Urban Mobility Networks

Faculty of Mechanical Engineering and Aeronautics, Rzeszow University of Technology, 35-959 Rzeszow, Poland
*
Author to whom correspondence should be addressed.
Appl. Sci. 2026, 16(2), 678; https://doi.org/10.3390/app16020678
Submission received: 23 December 2025 / Revised: 4 January 2026 / Accepted: 7 January 2026 / Published: 8 January 2026
(This article belongs to the Special Issue Green Transportation and Pollution Control)

Featured Application

The proposed Digital Twin framework with Adaptive Inflow Metering (AIM) logic is designed for direct application by municipal Traffic Management Centers (TMC) and urban planners. It serves as a decision-support tool for diagnosing congestion hotspots in real-time and testing “soft” optimization strategies (e.g., smart traffic signals) before committing to capital-intensive infrastructure investments. The system is particularly applicable to mid-sized cities aiming to reduce emission levels at critical network nodes without extensive geometric reconstruction.

Abstract

This paper proposes a comprehensive framework for integrating Digital Twins (DT) with real-time traffic optimization systems to enhance urban mobility management in Smart Cities. Using the Pobitno Roundabout in Rzeszów as a case study, we established a calibrated microsimulation model (validated via the GEH statistic) that serves as the core of the proposed Digital Twin. The study goes beyond static scenario analysis by introducing an Adaptive Inflow Metering (AIM) logic designed to interact with IoT sensor data. While traditional geometrical upgrades (e.g., turbo-roundabouts) were analyzed, simulation results revealed that geometrical changes alone—without dynamic control—may fail under peak load conditions (resulting in LOS F). Consequently, the research demonstrates how the DT framework allows for the testing of “Software-in-the-Loop” (SiL) solutions where Python-based algorithms dynamically adjust inflow parameters to prevent gridlock. The findings confirm that combining physical infrastructure changes with digital, real-time optimization algorithms is essential for achieving sustainable “green transport” goals and reducing emissions in congested urban nodes.

1. Introduction

The rapid intensification of traffic in urbanized areas is a direct consequence of accelerated urbanization, uncontrolled suburbanization processes (“urban sprawl”), and the exponentially increasing demand for the transport of goods and services [1,2]. In particular, the boom in e-commerce has revolutionized urban logistics, leading to a fragmented delivery structure that generates significant loads on road infrastructure [3,4]. This phenomenon exacerbates severe congestion and operational delays, but crucially, it contributes to the deterioration of air quality through increased emission of Nitrogen Oxides (NOx), Particulate Matter (PM 2.5/10), and Carbon Dioxide (CO2) [5,6]. These negative externalities stand in direct contradiction to the goals of the European Green Deal and the principles of Sustainable Urban Mobility Planning (SUMP), which prioritize the reduction in the carbon footprint of the transport sector [7,8]. The environmental impact of congestion is non-linear; it is most severe during “stop-and-go” driving conditions, where frequent acceleration and braking cycles drastically increase fuel consumption compared to smooth-flow conditions [9,10]. Consequently, the adverse effects are most visible at key nodal points of the road network—such as intersections and roundabouts. In these locations, limited geometric capacity determines the flow conditions for the entire surrounding ecosystem [11,12]. When a critical node fails, the shockwave of congestion propagates through the network, turning the intersection into a primary source of local pollution hotspots [13,14]. Therefore, improving the fluidity of traffic at these nodes is not merely a technical engineering challenge but a critical environmental necessity [15,16].
To mitigate these challenges—especially given the physical limitations of expanding road infrastructure in dense city centers—modern cities are undergoing a paradigm shift toward the Smart City concept [17,18]. This approach leverages Information and Communication Technologies (ICT) and the principles of Industry 4.0 to monitor, manage, and optimize infrastructure usage dynamically [19,20]. Within the transport domain, Intelligent Transport Systems (ITS) have evolved from passive monitoring tools into active Cyber-Physical Systems (CPS). These systems are pivotal, integrating massive datasets from heterogeneous sources: induction loops, video detection, Floating Car Data (FCD), and increasingly, the Internet of Things (IoT) infrastructure embedded in the roadway [21,22]. This data ecosystem allows for the real-time assessment of traffic parameters (volume, occupancy, speed) and serves as a foundation for both operational traffic control and long-term strategic planning [23,24]. By transitioning from reactive to predictive management, cities can optimize existing capacity to serve “green” mobility goals without costly construction projects.
In recent years, the concept of a Digital Twin (DT) has transitioned from manufacturing and aerospace industries to become a central pillar of transportation research [25,26]. A Digital Twin in the context of mobility is defined as a high-fidelity virtual representation of a physical transport system that is continuously updated based on real-world data and used for advanced simulation, monitoring, and optimization analyses [27,28]. Unlike traditional static models or Building Information Modeling (BIM) repositories, a true Digital Twin implies a dynamic, bi-directional connection between the physical and virtual worlds [29,30]. The application of DTs in urban transport theoretically enables the “safe” testing of traffic organization variants and the assessment of high-cost infrastructure decisions (e.g., constructing flyovers) without interfering with the live, operational system [31,32].
However, a critical review of the current state of the art reveals a significant gap in the practical implementation of this technology within traffic engineering. While numerous studies describe “Digital Twins” for smart cities, a substantial portion of them remains limited to the level of “Digital Shadows”—systems that visualize data flowing from sensors but lack the capability to influence the physical object automatically [33]. Existing literature frequently focuses on:
  • Structural Health Monitoring: Analyzing the physical wear of bridges or tunnels using DTs [34,35];
  • Pure Visualization: Using 3D engines (e.g., Unity, Unreal Engine) to display traffic flows for public consultation, without rigorous traffic engineering physics behind them [36,37];
  • Static Scenario Planning: Using microsimulation solely for offline capacity analysis, disconnected from real-time control logic [38,39].
Consequently, there is a scarcity of research frameworks that integrate high-fidelity microsimulation (calibrated to specific local conditions) with “Software-in-the-Loop” (SiL) capabilities allowing for the testing of active algorithmic control logic [40]. Most existing models stop at the diagnosis stage (identifying congestion) and do not proceed to the automated mitigation stage (optimizing flow in real-time loops) [41,42]. This study aims to bridge this gap by proposing a framework where the calibrated model serves not just as a mirror of reality, but as a testing ground for Adaptive Inflow Metering (AIM) algorithms, moving closer to the full functional definition of a Digital Twin in urban logistics.
A key component of a functional Digital Twin is a traffic model characterized by a high level of fidelity and compliance with real-world conditions. For local road networks, microsimulation models are widely used to replicate individual vehicle trajectories and stochastic interactions between road users. Tools such as PTV Vissim allow for the evaluation of intersection performance using indicators like average delay, queue length, and Level of Service (LOS), provided that a rigorous calibration and validation process is conducted.
This paper addresses the need for a comprehensive framework that combines rigorous microsimulation with green transport planning goals. It presents a framework for integrating Digital Twins with real-time traffic optimization logic for smart city management. The study utilizes the Pobitno Roundabout in Rzeszów—a critical node in the city’s transport network—as a case study. We establish a calibrated traffic microsimulation model (validated via the GEH statistic) serving as the core of the Digital Twin. Furthermore, beyond traditional infrastructure comparisons (e.g., turbo-roundabouts vs. grade-separated interchanges), this study introduces a conceptual framework for Adaptive Inflow Metering (AIM). This approach demonstrates how coupling simulation techniques with IoT connectivity and AI-based algorithms creates a platform for adaptive traffic management, reducing system overload and supporting decisions related to sustainable urban logistics.

2. Materials and Methods

2.1. Study Area and Empirical Data

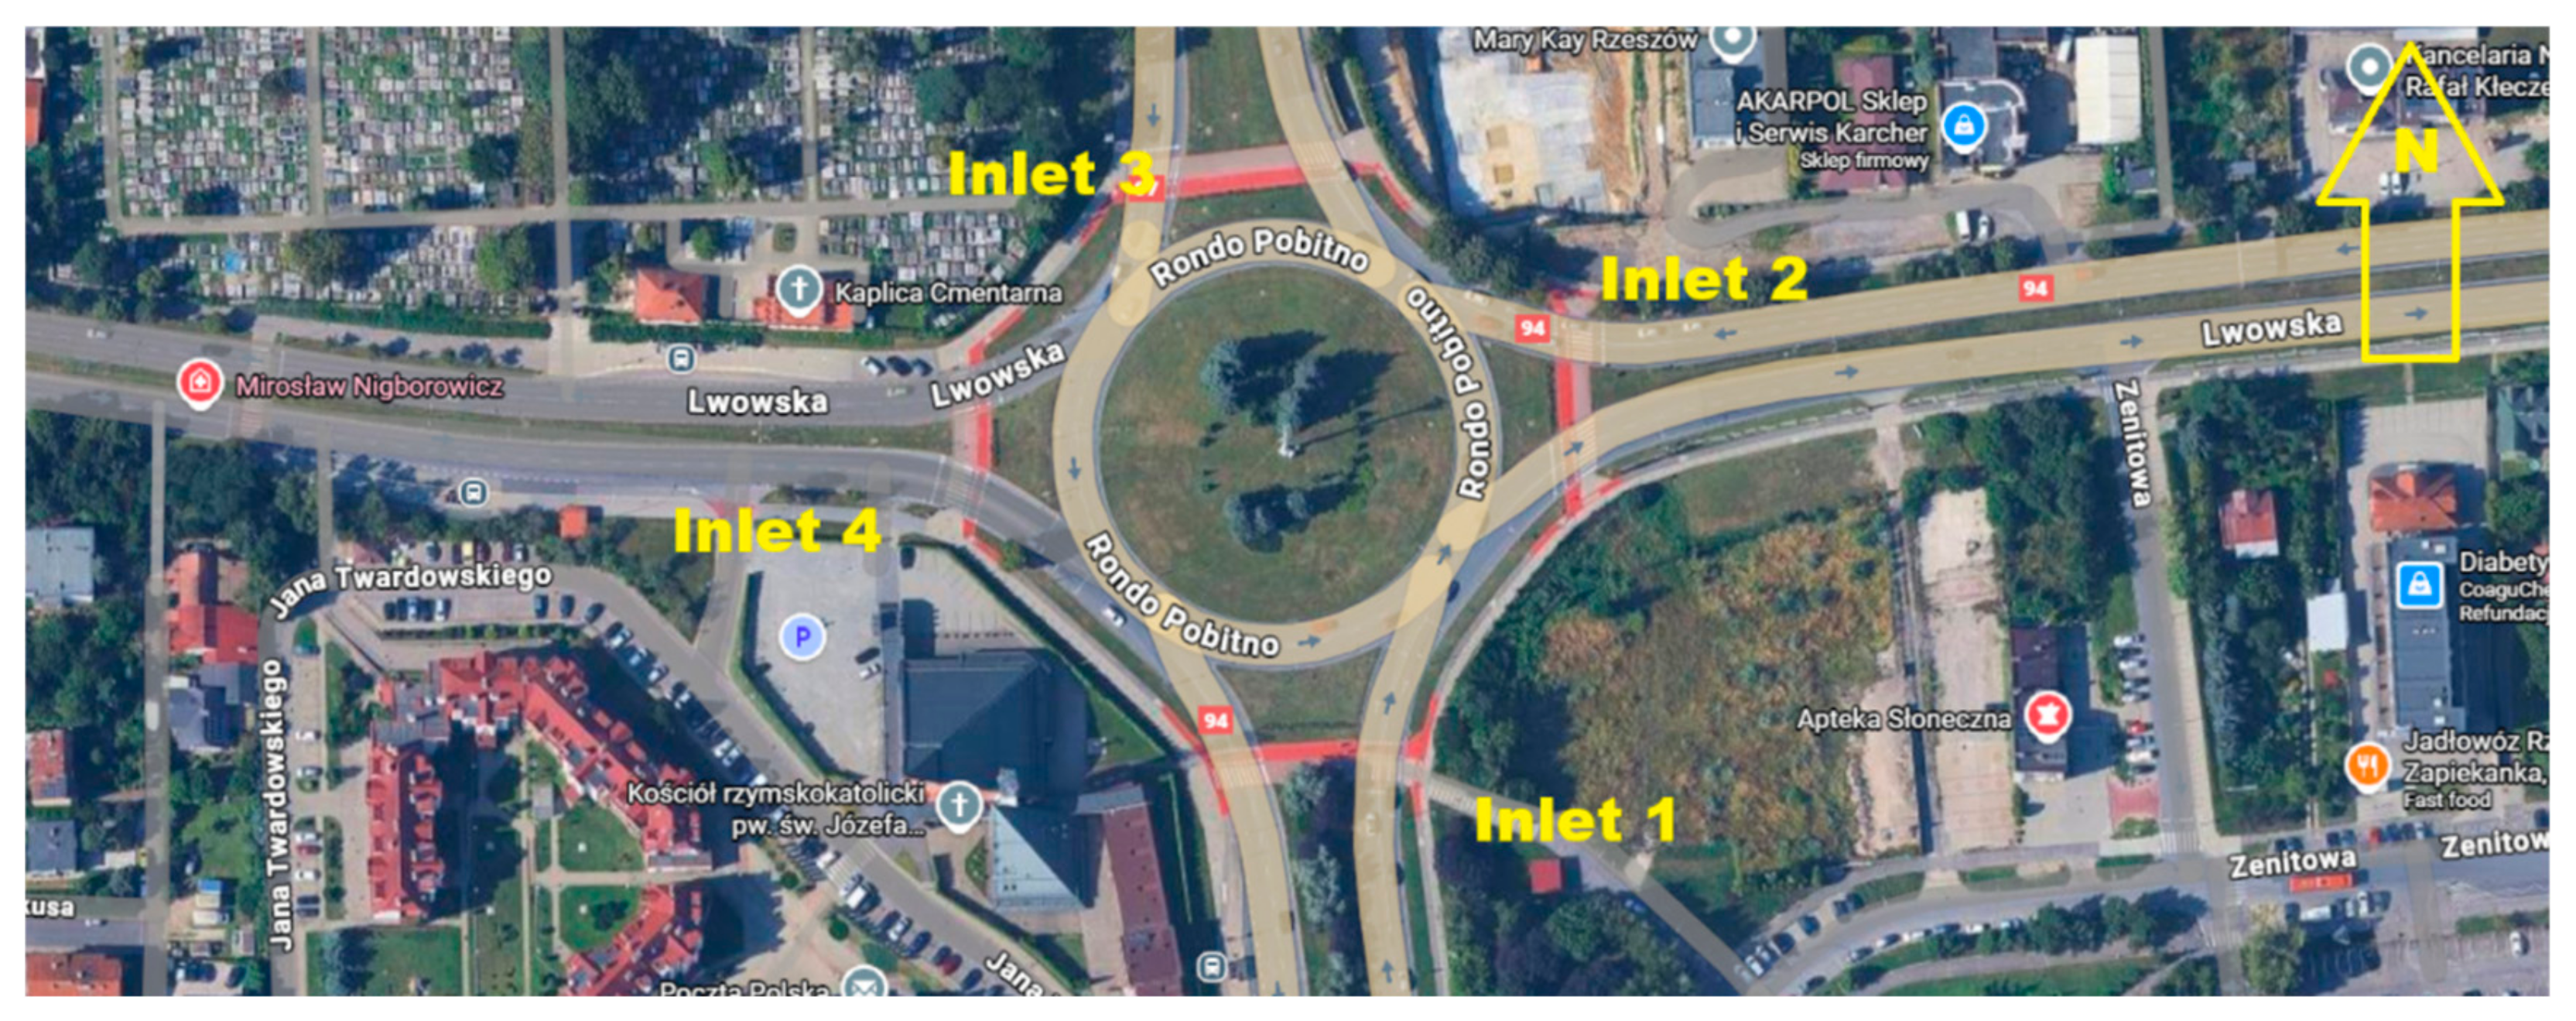
The case study focuses on the Pobitno Roundabout located in the city of Rzeszów (Poland), which constitutes a critical node within the urban road network and is characterized by high traffic volumes during peak hours. The roundabout serves both local traffic and regional through-traffic, linking major arterial roads and providing access to adjacent residential and commercial areas. Its geometric configuration and the uneven loading of individual approaches significantly affect traffic conditions in the wider surrounding network, making it an ideal candidate for Digital Twin-based analysis of green transport scenarios. Figure 1 shows a view of the road network area under study.
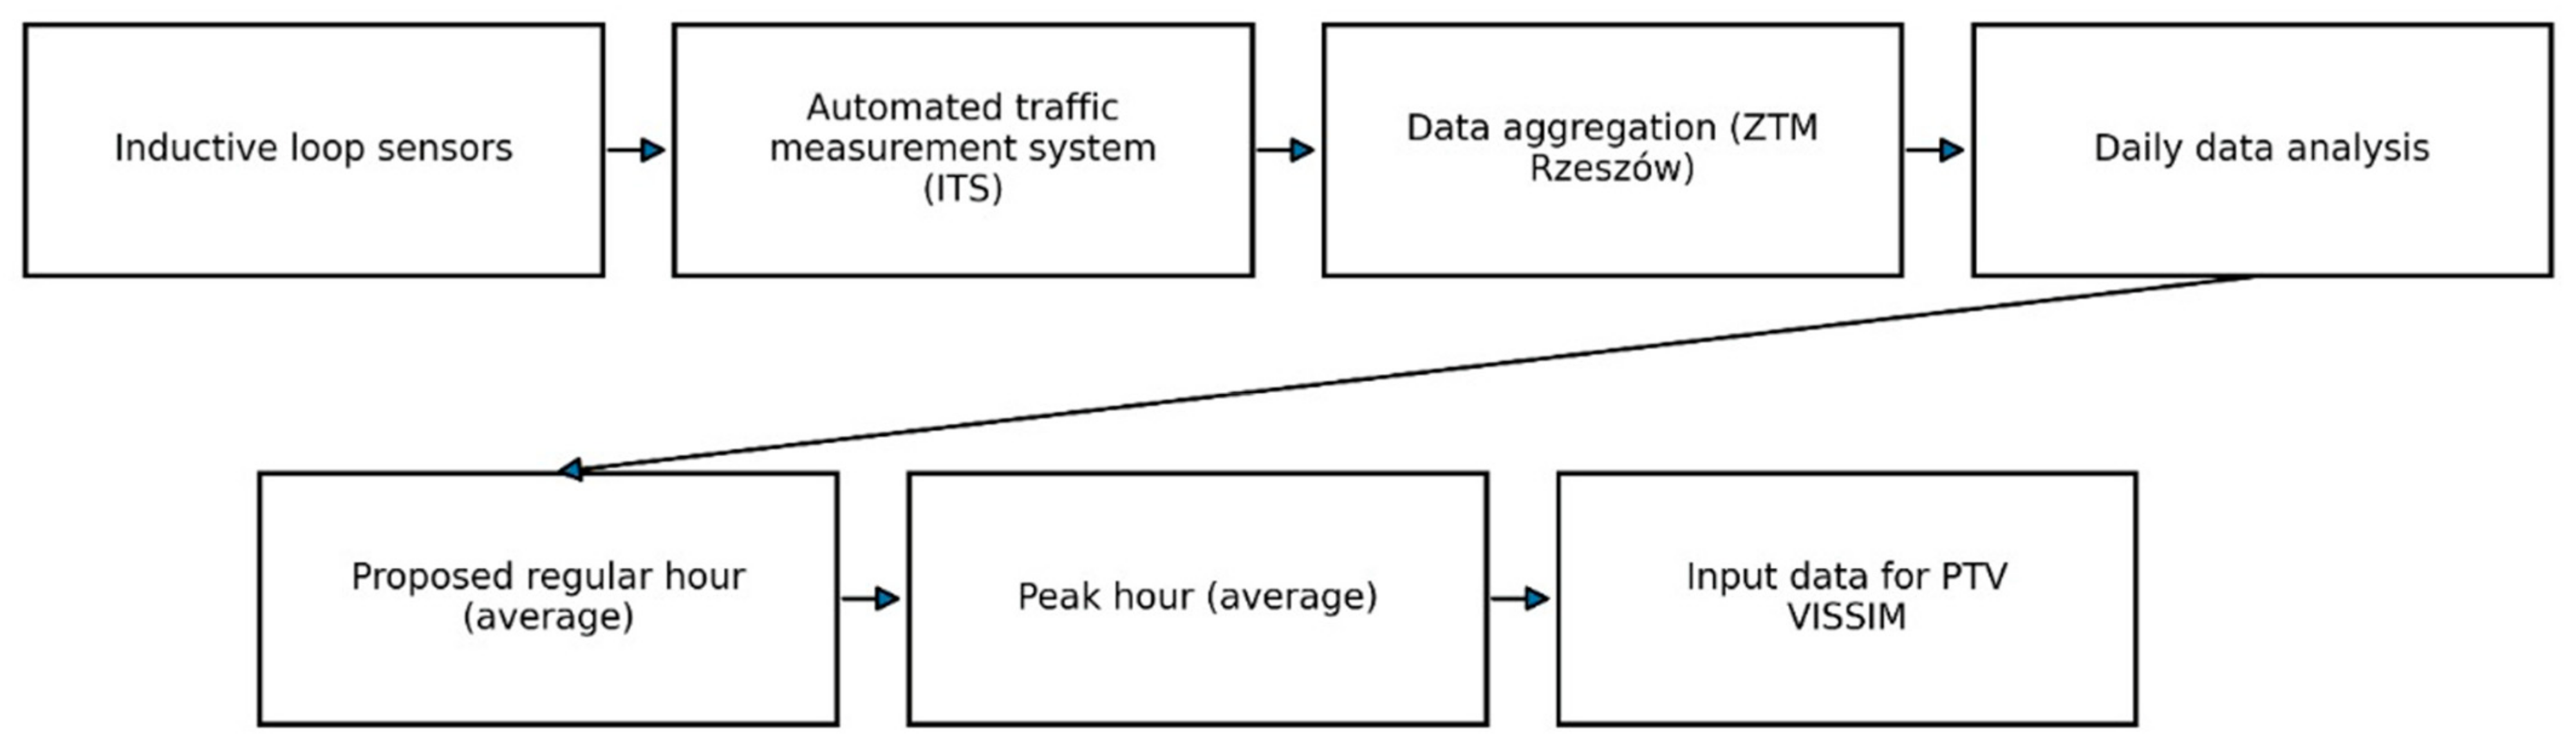
Input data for the traffic model were obtained from an automatic traffic measurement system operated by the Municipal Transport Authority in Rzeszów (ZTM). The system is based on inductive loop detectors installed on the approaches to the roundabout and provides aggregated traffic volumes per lane. The raw data covered multiple working days and weekend days and were delivered as lane-specific hourly volumes without turn-movement breakdowns.
To ensure representativeness, two characteristic demand levels were defined:
  • a “regular hour” representing average traffic conditions, computed as the mean hourly volume for a selected time interval across several weekdays;
  • a peak hour, defined as the mean of the daily maximum hourly volume identified for each day of the observation period.
The procedure of data collection, aggregation, and averaging in the ZTM system is illustrated in Figure 2 and was replicated in this study as the basis for scenario definition.
To characterize the traffic demand patterns at the Pobitno Roundabout, Table 1 presents the observed hourly traffic volumes aggregated from the ZTM measurement system across the four approaches during representative demand scenarios. The data reveals significant demand asymmetry: Inlets 1 (Aleja Armii Krajowej) and Inlet 2 (Aleja Żołnierzy I Armii Wojska Polskiego) dominate traffic flow, collectively accounting for approximately 49% of total peak-hour demand. The peak-hour demand surge exhibits differential amplification across approaches, with growth factors ranging from 1.69× to 2.19×, indicating that certain approaches experience more pronounced congestion buildup than others. This asymmetric loading pattern is a key characteristic of the case study and provides the physical motivation for understanding why geometric infrastructure designs without dynamic flow management become vulnerable to gridlock under peak conditions.
The table demonstrates that peak-hour traffic demand doubles overall (2.20× factor), but this increase is unevenly distributed. Inlets 1 and 2 experience growth factors of 1.90× and 2.19× respectively, while Inlets 3 and 4 see relatively moderate increases (1.69× and 1.99×). This imbalance creates a critical condition: during peak hour, the combined flow from Inlets 1 and 2 (1700 veh/h out of 3483 total, or 48.8%) exerts dominance on the circulatory roadway. In a Turbo-roundabout configuration with rigid, physically separated lanes, this asymmetric demand pattern can lead to capacity starvation at subordinate approaches, as vehicles entering via Inlets 3 and 4 compete for limited gaps created by the mandatory lane discipline. This phenomenon is central to the simulation results presented in Section 3, where the Turbo-roundabout variant exhibits performance degradation (LOS F, delays ~28.5 s) precisely under these asymmetric peak-hour conditions.

2.2. Data Preparation and Model Input Parameters

In the data preparation stage, the empirical measurements were aggregated into hourly traffic flows assigned to individual approach lanes of the roundabout for both demand levels (regular and peak hour). Due to the lack of direct information on turn movements, the internal circulation pattern was inferred from the existing geometry and the current traffic organization, following standard practice in microsimulation studies when only lane-based counts are available.
The vehicle fleet was simplified into two main categories:
  • light vehicles (passenger cars and vans),
  • heavy vehicles (trucks and buses).
The share of heavy vehicles in each approach stream was determined based on supplementary information provided by ZTM and typical reference values commonly used in urban traffic analyses. For each vehicle class, basic kinematic parameters were defined, including desired speed, acceleration, and deceleration characteristics. Initial values were adopted from literature recommendations and the default parameter sets of the PTV Vissim environment, with the option for subsequent adjustment during calibration.

2.3. Microsimulation Model Development

The microsimulation model of the Pobitno Roundabout was developed in PTV Vissim 2025, which enables detailed representation of road infrastructure and driver behaviour at the microscopic level [43]. The geometric layout of the intersection was coded based on cartographic data and design documentation, including:
  • the number and width of lanes on each approach,
  • the shape and width of the circulatory roadway,
  • entry and exit radii,
  • the existing traffic organization and priority rules.
Priority rules and conflict areas were implemented according to the real-world right-of-way regulations at the roundabout, and the corresponding horizontal and vertical traffic signs were reflected in the model configuration. Vehicle movements were simulated using the built-in car-following and lane-changing models of Vissim, with parameters adjusted in later stages.
Each simulation run included an initial warm-up period to eliminate the influence of empty-network conditions on performance indicators [44,45]. Each simulation run consisted of a total duration of 3800 s: an initial warm-up period of 200 s to eliminate empty-network effects, followed by an effective analysis period of 3600 s (1 h) of steady-state operation. Data collection and performance metric extraction were performed exclusively during the effective analysis period, excluding the warm-up phase to ensure unbiased results.

2.4. Model Calibration and Validation

Calibration aimed at adjusting driver behaviour parameters and vehicle dynamics so that simulated hourly volumes on individual approach lanes matched the aggregated empirical values from ZTM. Particular attention was paid to:
  • desired speed distributions on approach links,
  • car-following sensitivity parameters,
  • lane-change aggressiveness and gap-acceptance settings.
The GEH statistic was employed as the primary measure of goodness-of-fit between observed and simulated traffic volumes [46]. For an individual lane, the GEH value is defined as (results in Table 2):
G E H = ( M P ) 2 ( M + P ) 2
where: M denotes the measured (observed) flow and P the simulated flow for the same time interval.
Calibration and validation were conducted for both the regular and peak hour demand levels. The model was considered acceptably calibrated when the GEH value was below the commonly used threshold (GEH < 5.0) for the majority of analysed lanes. In the final calibrated model, GEH values for the key approaches ranged approximately between 0.4 and 0.9, indicating very good agreement between simulated and measured volumes and confirming the reliability of the model as the analytical core of the Digital Twin.
The calibration process involved a systematic adjustment of driver behaviour parameters using an iterative approach. Initial model parameters were derived from PTV Vissim default settings and literature recommendations for urban traffic conditions. During the calibration phase, the following key parameters were sequentially refined: (1) desired speed distributions on approach links, adjusted to match observed field speeds; (2) car-following sensitivity parameters (Wiedemann 74 model parameters: cc0, cc1, cc2), tuned to reproduce realistic vehicle spacing and acceleration profiles; (3) lane-change aggressiveness and gap-acceptance thresholds, calibrated to achieve observed turning movements and lane utilization patterns. The iterative calibration procedure compared simulated traffic volumes against empirical ZTM detector data using the GEH statistic as the primary convergence criterion. Calibration was considered complete when GEH values fell below the acceptance threshold (GEH < 5.0) for at least 85% of analysed lanes across both demand levels (regular and peak hour). To assess the sensitivity of results to random variation in driver behaviour and traffic arrival patterns, all simulations were executed with ten different random seeds, with reported results representing mean values and standard deviations across these independent runs. Assumed Vissim parameters are presented in Table 3.

2.5. Microsimulation Model as the Core of the Digital Twin

The calibrated microsimulation model of the Pobitno Roundabout forms the analytical core of the proposed Digital Twin framework for the urban transport system. In this study, the Digital Twin is understood as a combination of:
  • a high-fidelity, empirically validated simulation model,
  • a data layer capable of ingesting sensor-based measurements (IoT/ITS),
  • and a control layer embedding optimization and decision-making logic.
In its current implementation, the model operates in an offline mode but is structured to be compatible with future real-time data integration. The Vissim model acts as a “what-if” engine, enabling the testing of infrastructure and control strategies under realistic, location-specific traffic conditions. This structure provides a foundation for extending the Digital Twin towards real-time applications where live detector data would continuously update model inputs and drive algorithmic control decisions.

2.6. Infrastructure Variants and Simulation Scenarios

The validated base model of the Pobitno Roundabout was used as a reference for the definition of alternative infrastructure scenarios. Three main infrastructure variants were considered:
  • Variant 1—Existing conventional roundabout (Base Case):
Representation of the current physical layout and traffic organization as observed in the field.
  • Variant 2—Turbo-roundabout (modernisation):
A redesigned multilane roundabout with physically separated lanes on the circulatory roadway, forcing early lane choice and eliminating lane changes within the roundabout. This configuration aims to improve capacity and reduce conflict points but may increase sensitivity to the directional structure of flows.
  • Variant 3—Flyover-based grade-separated junction (expansion):
A grade-separated solution in which dominant traffic streams are routed via an overpass, significantly reducing the load on the at-grade roundabout. This design aims at maximizing throughput and stability under high demand.
To mitigate the impact of stochastic variability inherent in microsimulation models and verify the robustness of simulation results, each infrastructure variant and demand level combination was executed multiple times using different random seed values. Specifically, ten independent simulation runs (random seeds = 1 through 10) were conducted for each of the six core scenarios (3 variants × 2 demand levels), yielding a total of 60 simulation runs. This multi-seed approach enables assessment of result stability and provides confidence intervals for key performance metrics. All reported results (delay, LOS, queue length, speed) represent mean values calculated across these ten independent runs, with variability bands indicating the standard deviation of outcomes across different random seeds. This methodology aligns with established best practices in traffic microsimulation research for uncertainty quantification and reduces the risk of drawing conclusions based on a single deterministic simulation realization.
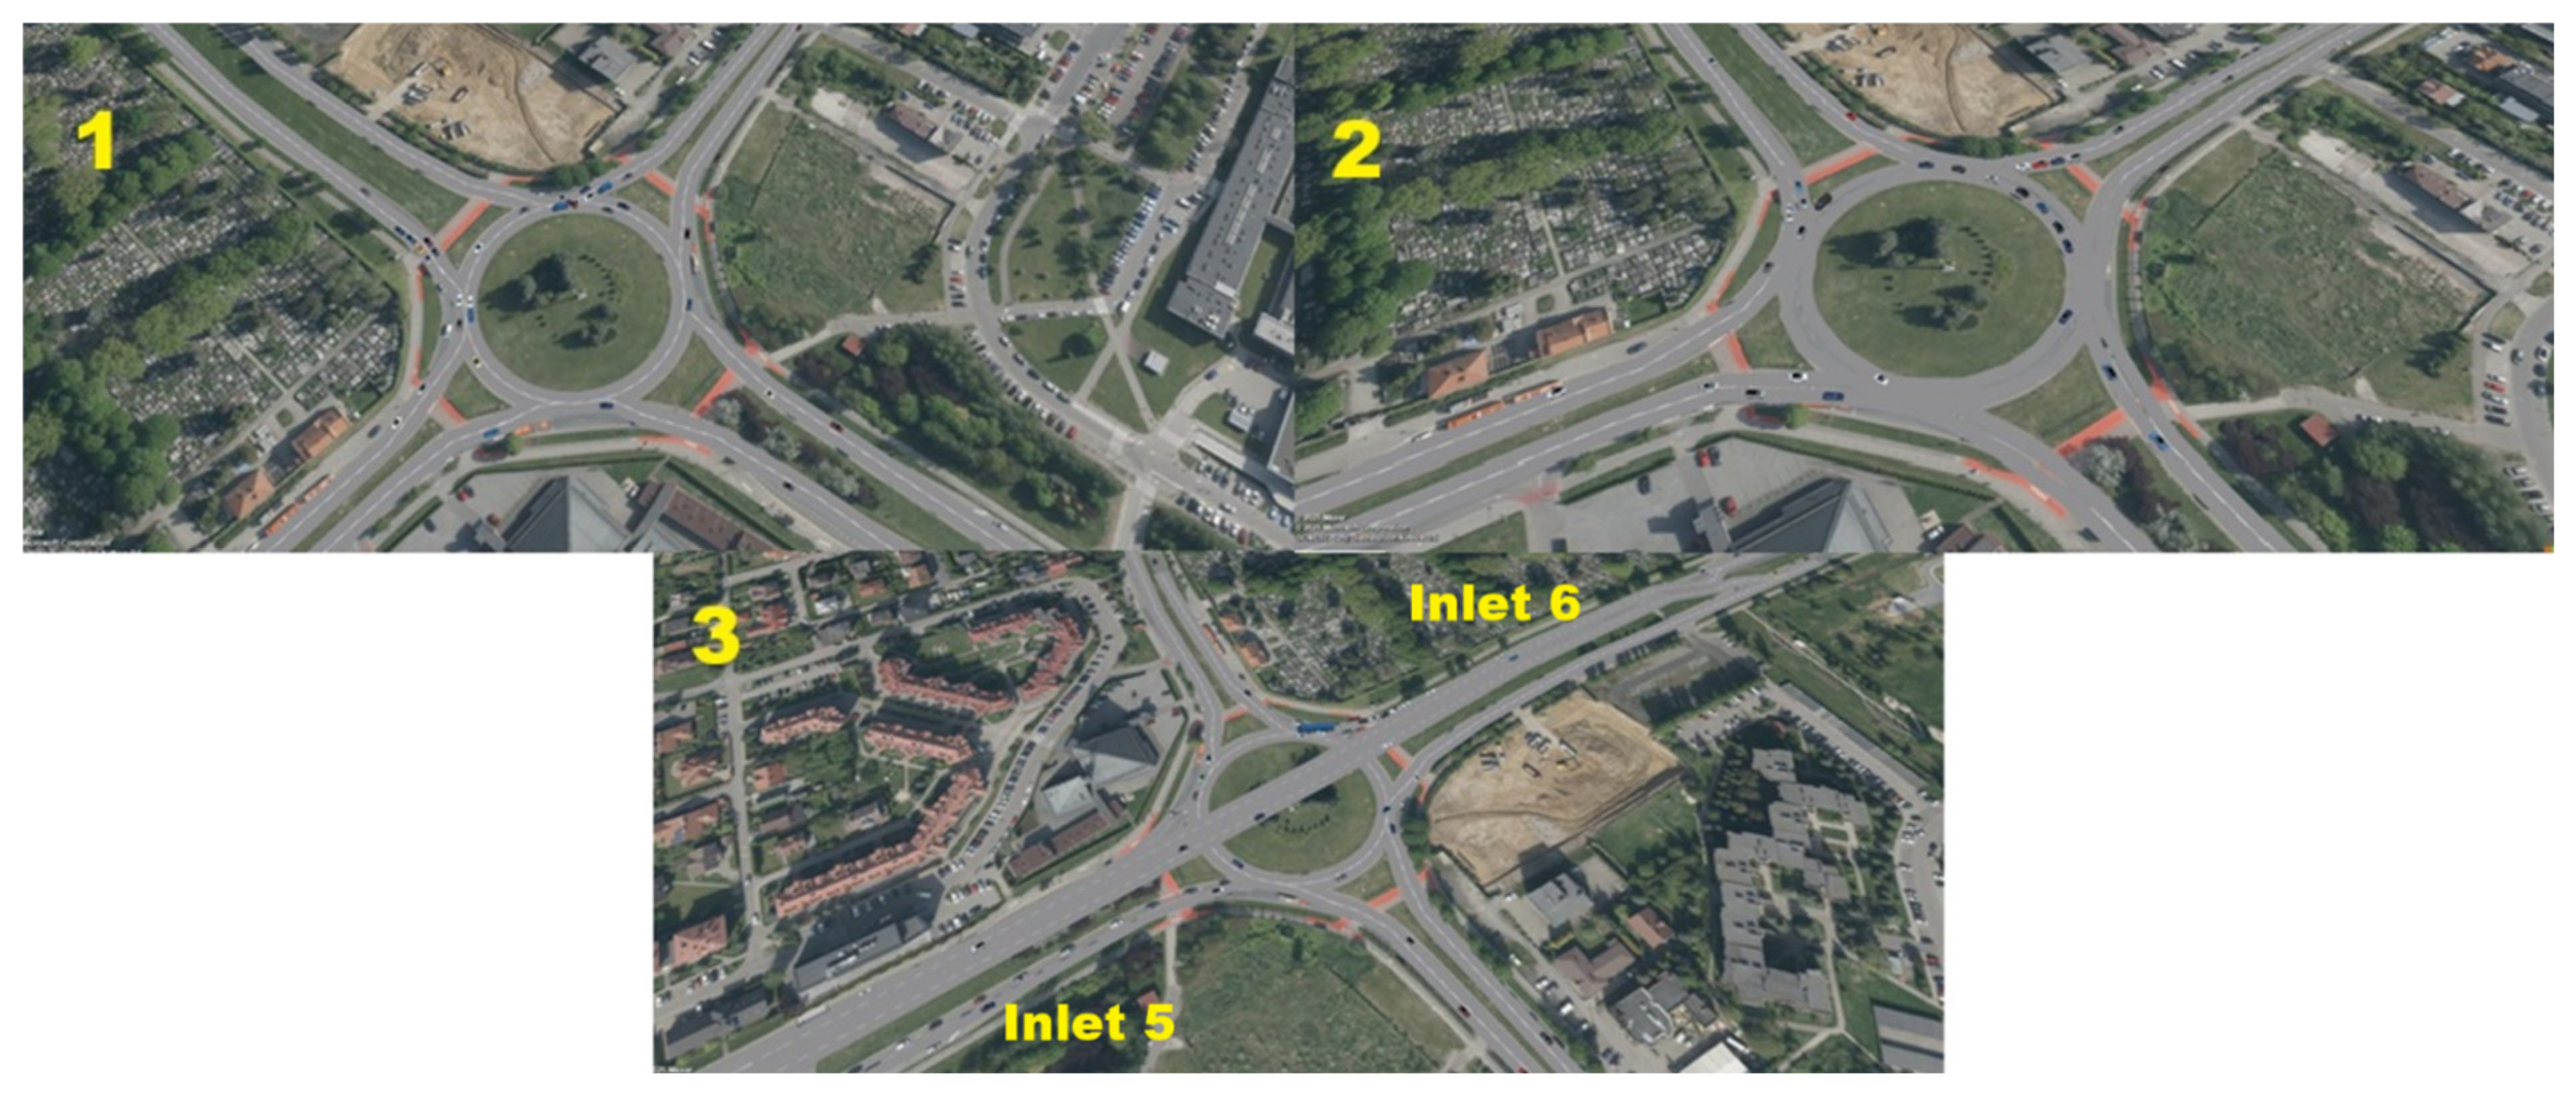
Geometric schemes and screenshots of the simulation models for the three variants correspond to Figure 3 and were fully implemented in Vissim for comparative analysis. For each infrastructure variant, simulations were performed under both regular and peak-hour demand, resulting in a set of six core scenarios.

2.7. Digital Twin Architecture and Functional Layers

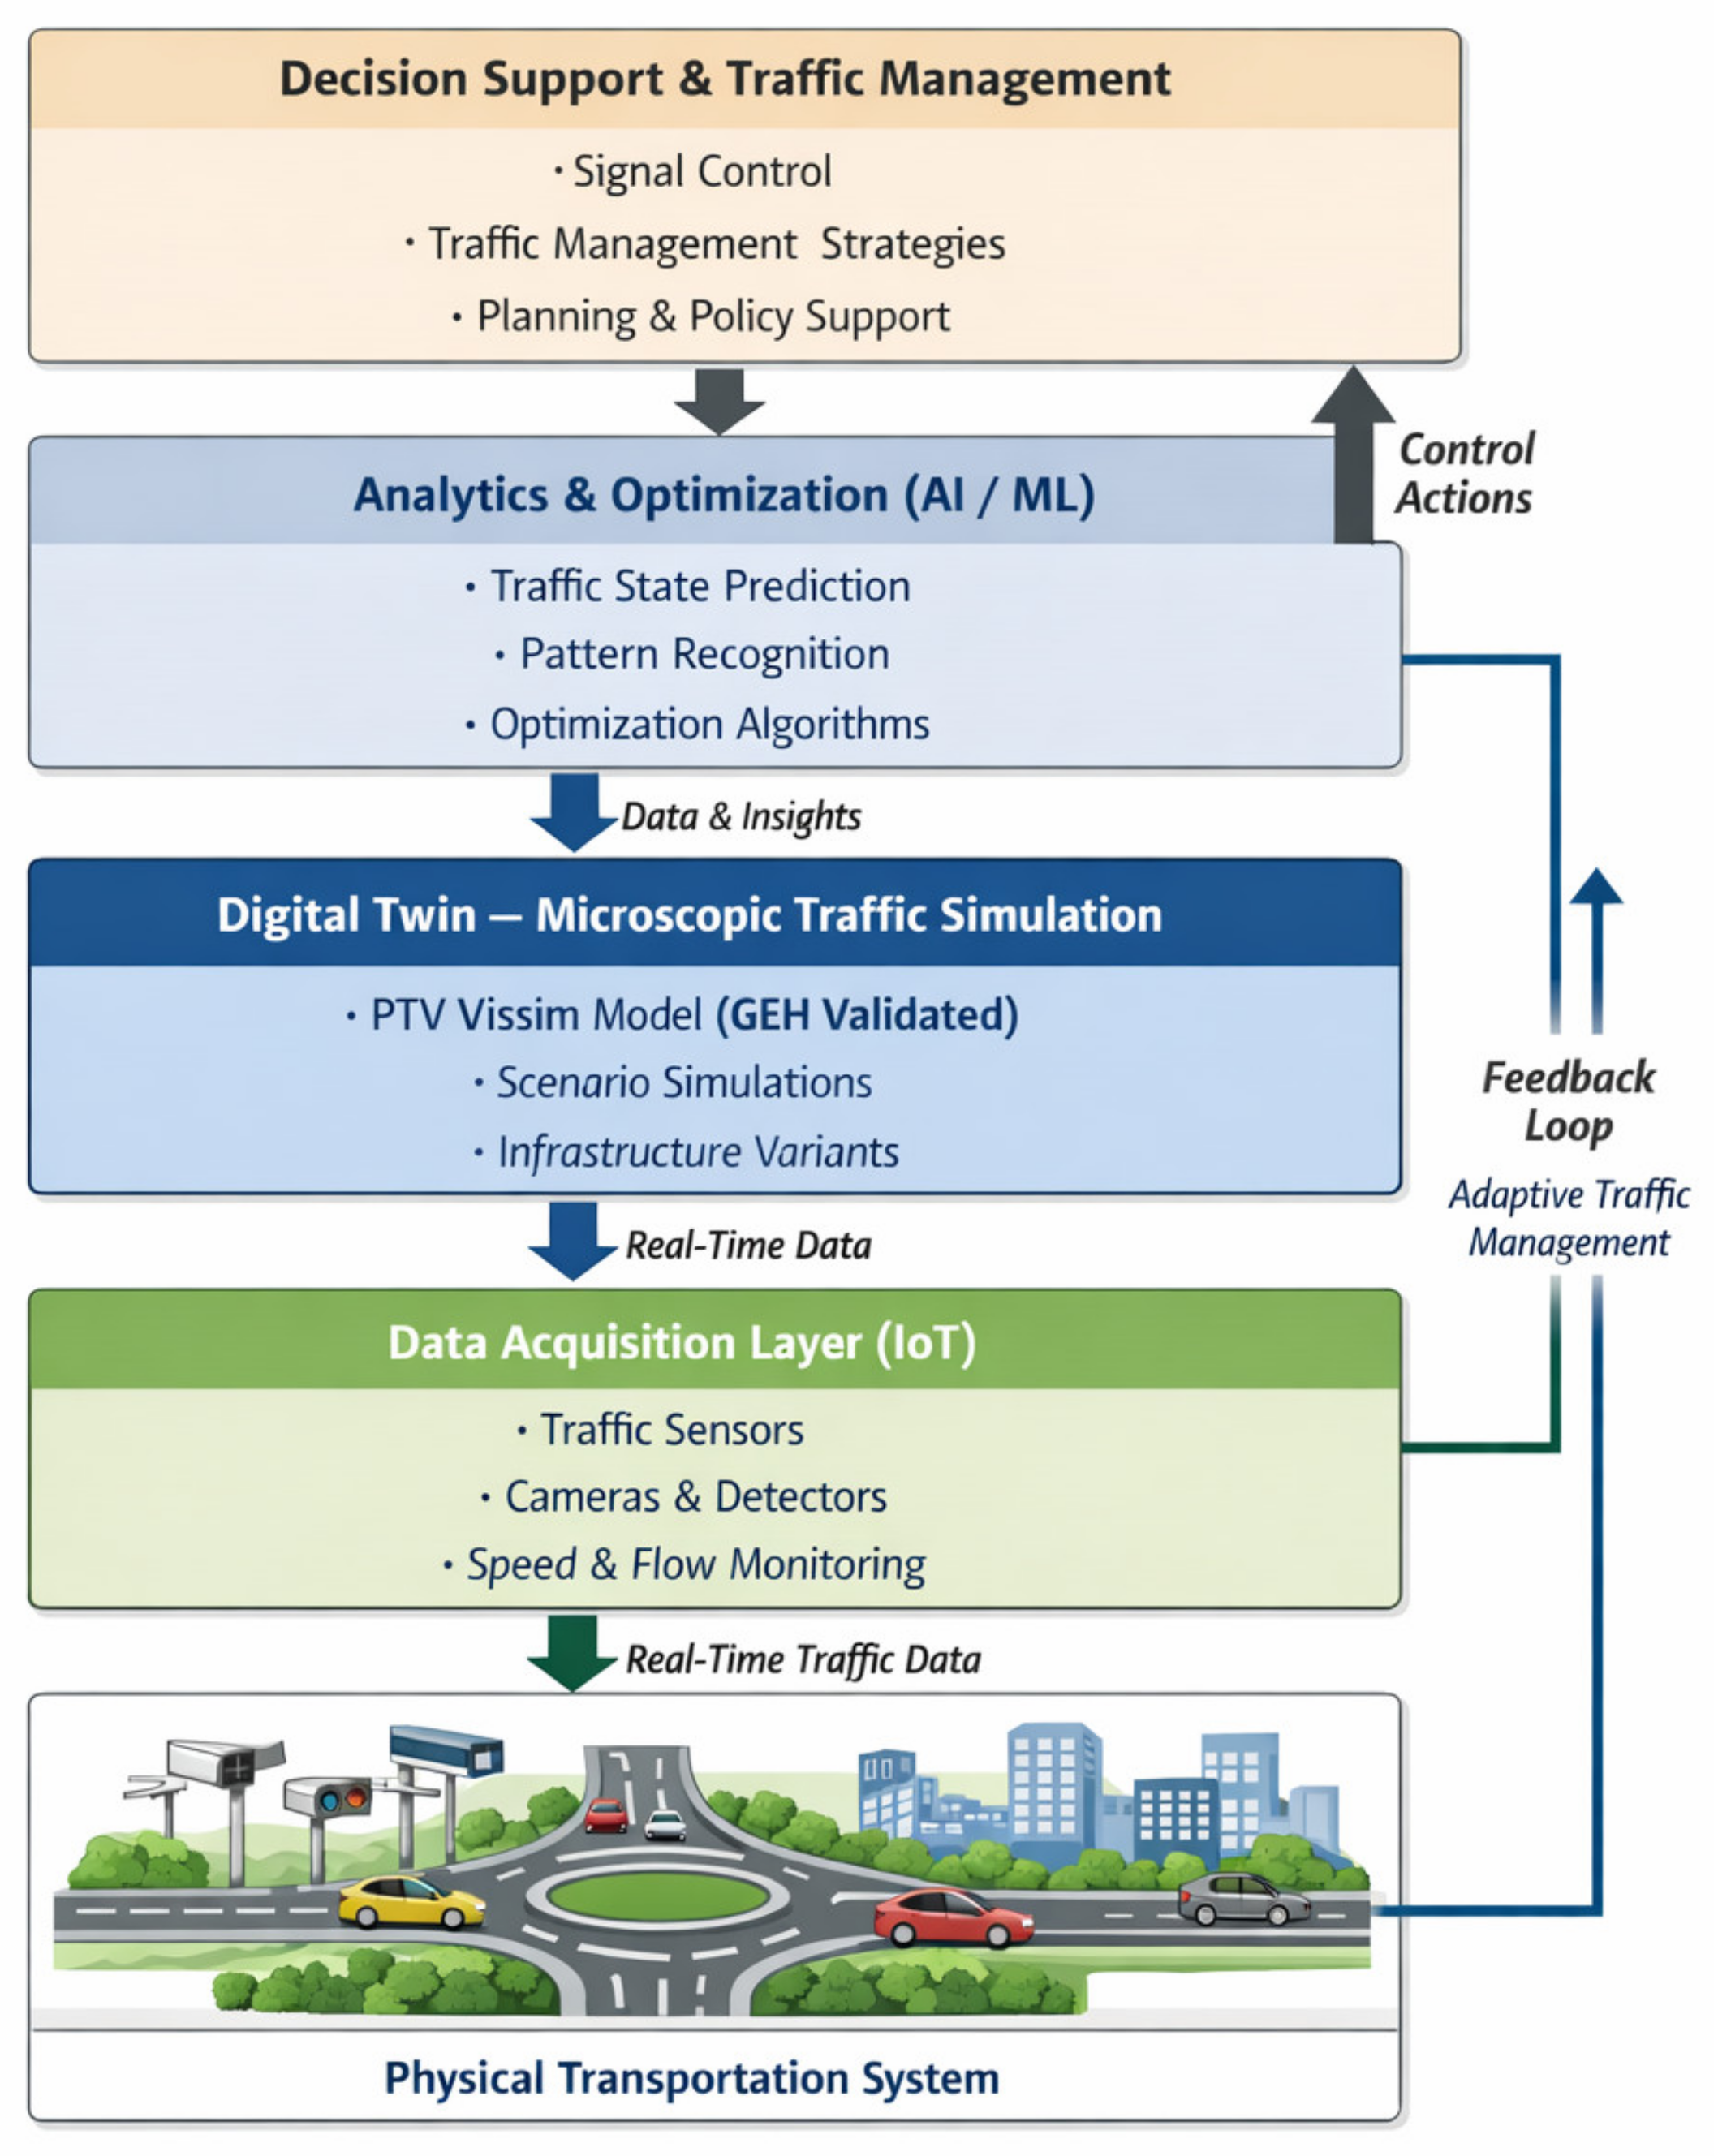
To extend the classical microsimulation approach, an original Digital Twin framework for the transport system was proposed (Figure 4).
The architecture is structured into five logical functional layers, between which data flows and feedback loops are defined:
  • Physical Layer—the real-world transport system, including the studied roundabout, surrounding road network, and actual traffic streams.
  • Data Acquisition Layer (IoT/ITS)—responsible for collecting information on current traffic conditions using detectors, cameras, and other ITS components. In this study, this layer is represented by empirical detector data from ZTM and is considered conceptually extendable to real-time streaming.
  • Digital Twin Layer (Microsimulation Core)—the calibrated and validated Vissim model, updated using empirical data and capable of representing traffic conditions under varying demand and infrastructure configurations.
  • Analytics and Optimization Layer—a conceptual layer hosting AI, machine learning, and optimization algorithms that process simulation outputs and sensor data to identify congestion patterns and propose control strategies (detailed in Section 2.8).
  • Decision and Control Layer—the level at which analytical results are translated into concrete operational or strategic actions, such as traffic signal timing plans, access control, or infrastructure investment decisions.
Although the simulations presented in this paper are conducted in an offline mode, the architecture is explicitly designed to support future real-time integration, where continuous feedback between the physical system and the Digital Twin would enable adaptive traffic management and contribute to green transport objectives.

2.8. Real-Time Optimization Logic: Adaptive Inflow Metering (AIM)

To operationalize the Digital Twin concept, we designed an Adaptive Inflow Metering (AIM) algorithm capable of interacting with the microsimulation core via the Component Object Model (COM) interface. This logic addresses the specific congestion patterns identified in the turbo-roundabout scenario, where high circulatory saturation leads to blocking of entry lanes.
The proposed control strategy follows a closed-loop feedback mechanism (Software-in-the-Loop). The system state is monitored by virtual induction loops (D1, D2, …, Dn) located on the circulatory roadway. The aggregate occupancy O(t) at time step t is calculated as the weighted average of individual detector readings:
O ( t ) = 1 N i = 1 N ω i o c c i ( t )
where:
o c c i ( t ) represents the occupancy of the i-th detector,
ω i is a weighting factor based on the geometric criticality of the specific section.
To prevent rapid oscillation of the control signal (chattering effect), the algorithm employs a hysteresis loop with two distinct thresholds:
  • Activation Threshold (Thigh = 85%): When O(t) ≥ Thigh, the system detects a “Gridlock Risk” state. The algorithm activates inflow metering (red signal) on the dominant approach to cut off the supply of new vehicles into the critical conflict area.
  • Deactivation Threshold (Tlow = 60%): The metering remains active until the circulatory occupancy drops below Tlow. This ensures that the roundabout is sufficiently cleared before normal flow is restored.
The control function S(t) for the signal head state can be mathematically expressed as follows:
  • If O(t) ≥ Thigh, then S(t) = RED (Metering Active)
  • If O(t) ≤ Tlow, then S(t) = GREEN (Free Flow)
  • If Tlow < O(t) < Thigh, then S(t) = S(t − 1) (Maintain previous state)
The logic defined above was translated into a Python script interacting with PTV Vissim via the win32com library. This setup emulates an external Traffic Management Center (TMC) receiving IoT data streams and sending back control commands. The implementation structure is presented in Algorithm 1.
Algorithm 1. Core Python implementation of the AIM logic with hysteresis control
import win32com.client # COM Interface for Vissim
def adaptive_inflow_metering(vissim):
       # Hysteresis Control Parameters
       THRESH_HIGH = 0.85 # 85% Occupancy -> Trigger RED
       THRESH_LOW = 0.60 # 60% Occupancy -> Revert to GREEN
       
       # Gridlock State Memory (0 = Normal, 1 = Metering Active)
       gridlock_state = 0

       # Main Simulation Loop
       while vissim.Simulation.AttValue("SimBreakAt") == 0:
              # 1. DATA ACQUISITION LAYER
              # Retrieve real-time data from virtual IoT sensors
              detectors = vissim.Net.Detectors.GetAll()
              # Calculate average occupancy (simplified for N detectors)
              # In a real scenario, this would be a weighted average
              total_occ = sum([d.AttValue("Occ") for d in detectors])
              avg_occupancy = total_occ/len(detectors)

              # 2. DECISION LAYER (Hysteresis Logic)
              if gridlock_state == 0:
                     if avg_occupancy ≥ THRESH_HIGH:
                            gridlock_state = 1 # Activate Metering
                            control_action = "RED"
                     else:
                            control_action = "GREEN"
              else:
                     # If already in metering mode, wait until occupancy drops
                     if avg_occupancy ≤ THRESH_LOW:
                            gridlock_state = 0 # Deactivate Metering
                            control_action = "GREEN"
                     else:
                            control_action = "RED" # Sustain Metering

              # 3. CONTROL LAYER (Actuation)
              # Send command to the Signal Group controlling the approach
              # Assuming Signal Group key is 1
              sg_metering = vissim.Net.SignalControllers.ItemByKey(1).SGs.ItemByKey(1)
              sg_metering.SetAttValue("State", control_action)

              # 4. SIMULATION STEP
              # Advance the Digital Twin by one time-step
              vissim.Simulation.RunSingleStep()
This implementation demonstrates the practical utility of the Digital Twin framework. Unlike static models, this SiL (Software-in-the-Loop) environment allows for the rigorous testing of algorithmic interventions before their deployment in the physical infrastructure. In the context of green transport planning, such logic is crucial for reducing stop-and-go waves, which are primary contributors to local emissions at urban intersections.

3. Results

The calibrated Digital Twin model was used to simulate traffic conditions under three infrastructure variants (Conventional, Turbo-roundabout, Flyover) and two demand levels (Regular Hour and Peak Hour). The performance assessment focused on key efficiency indicators: Stop Delay (STOPDELAY), Level of Service (LOS), Queue Length (QLEN), and Speed Profiles. These metrics are critical not only for traffic fluidity but also for “green transport” objectives, as stop-and-go events are directly correlated with exhaust emissions.

3.1. Analysis of Vehicle Stop Delays (STOPDELAY)

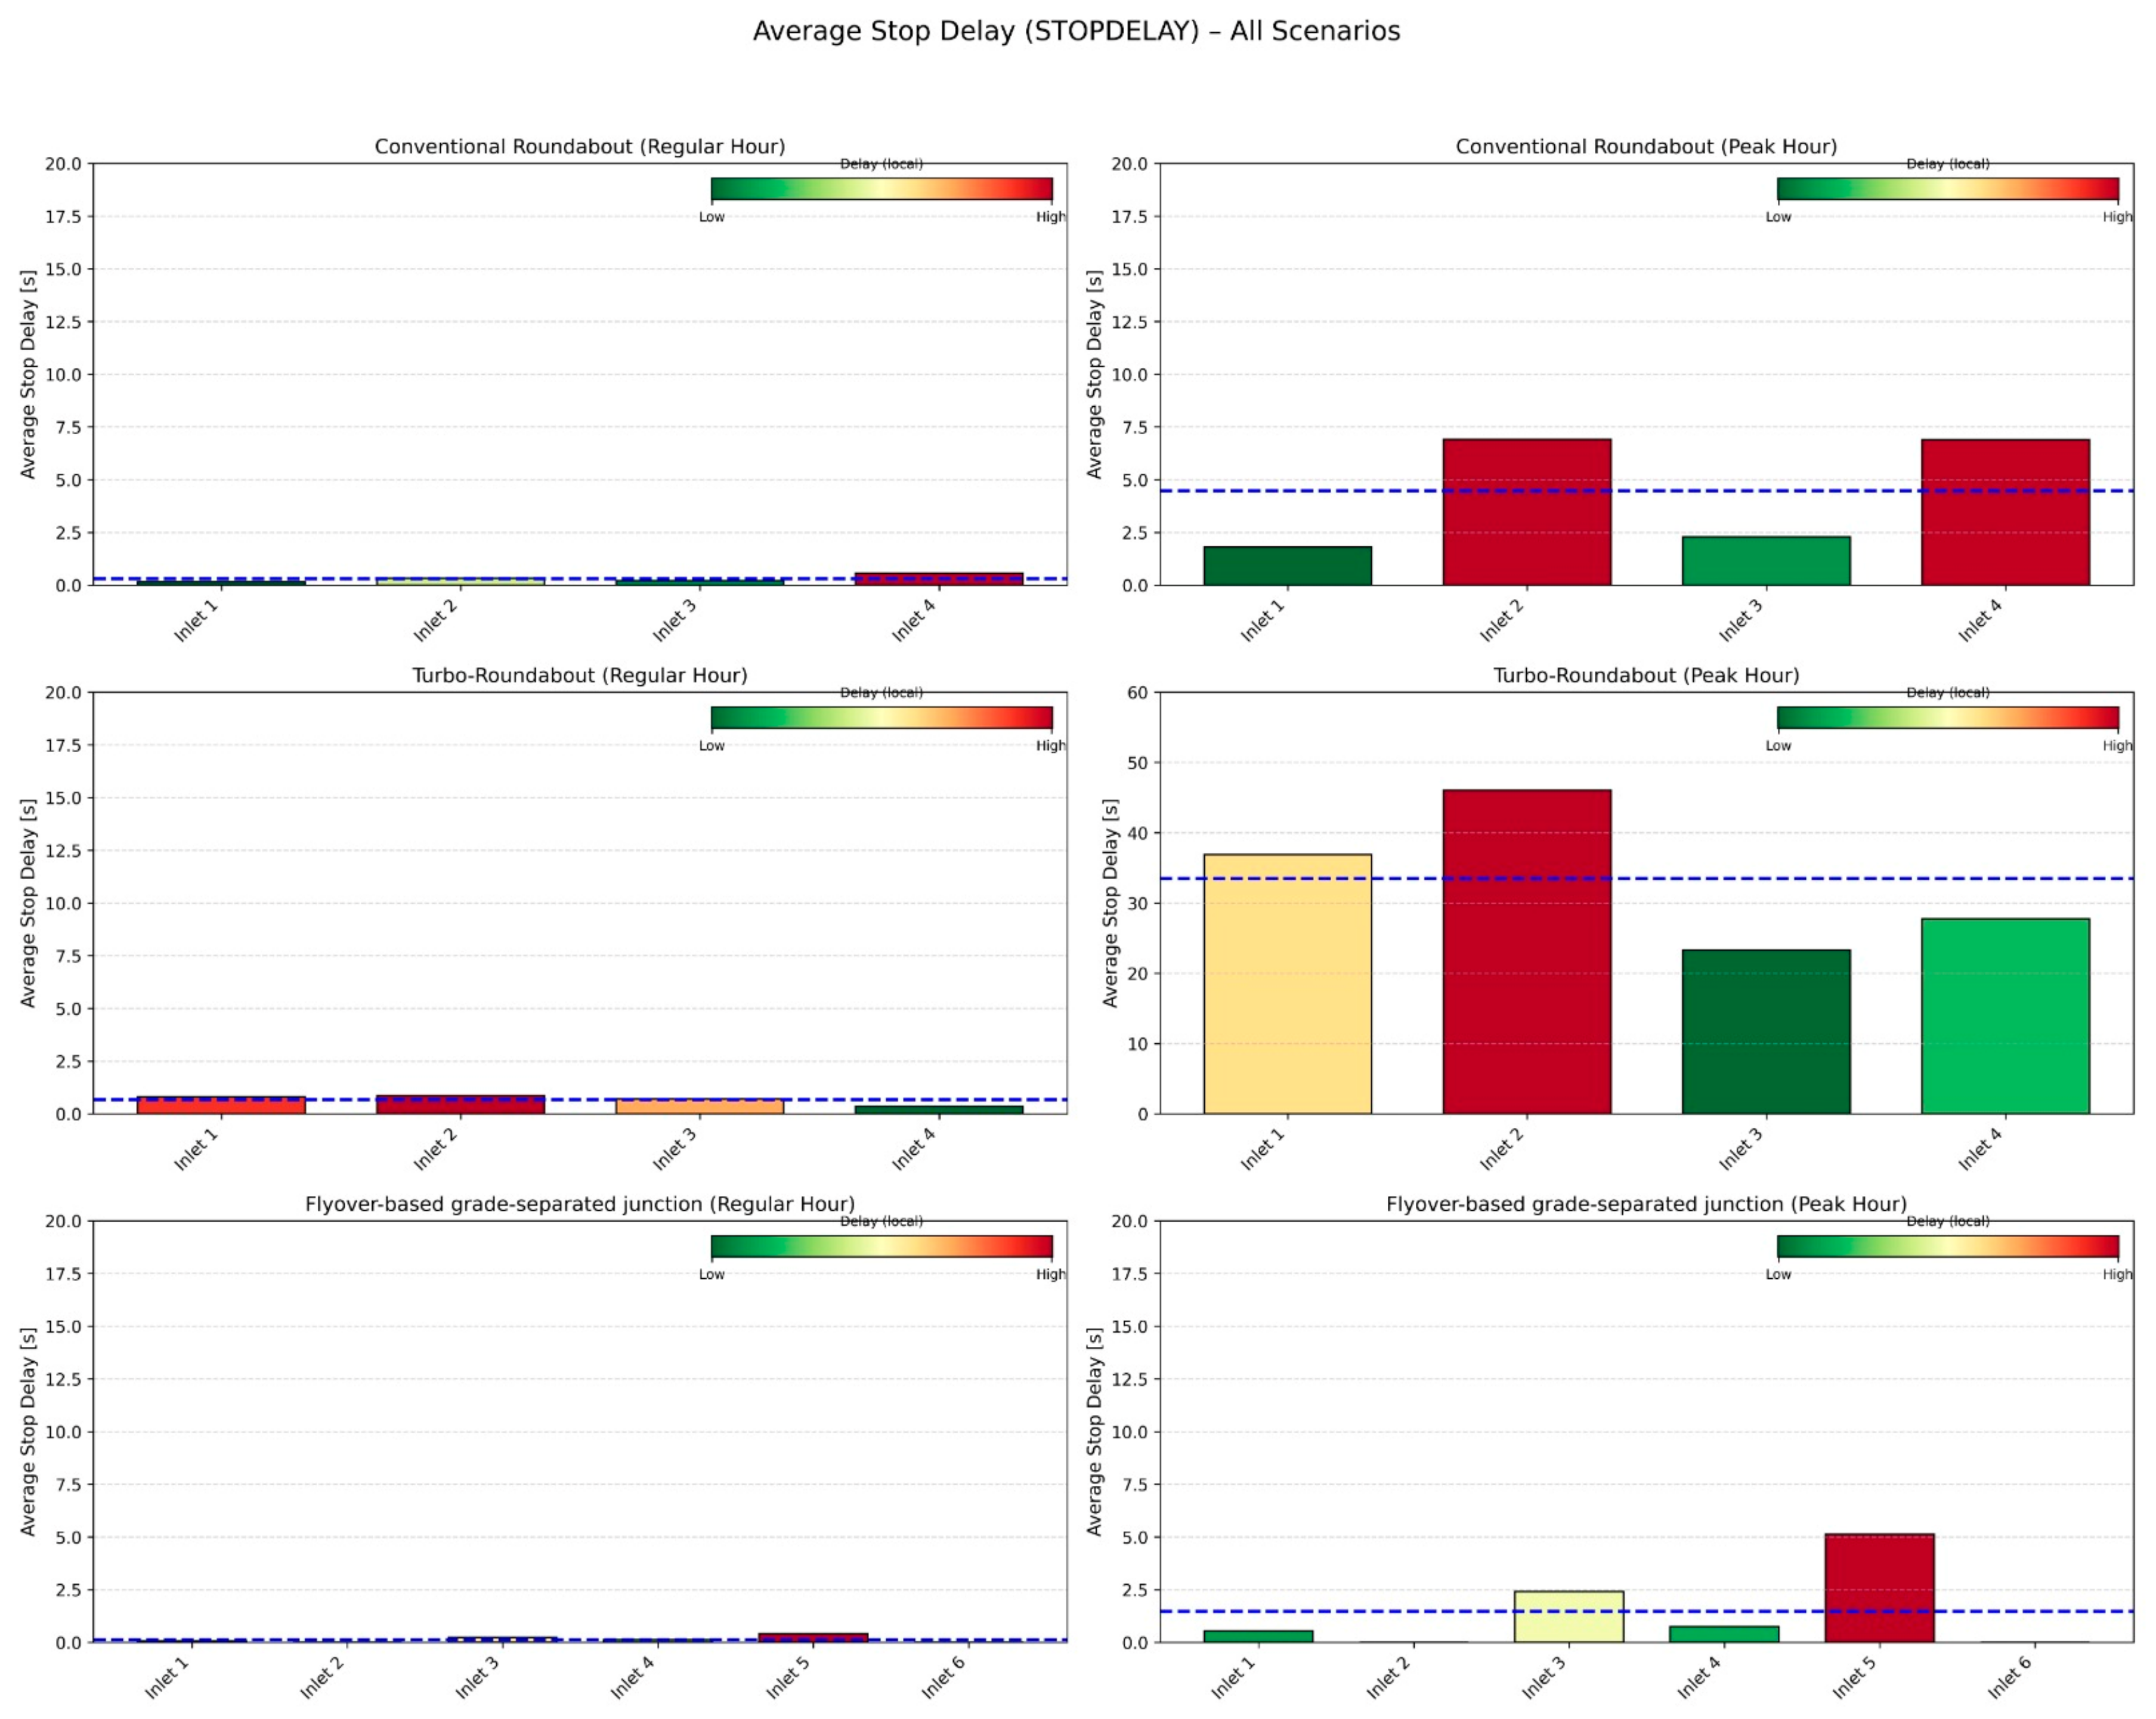
The average stop delay per vehicle was analyzed to evaluate the fluidity of the network (Figure 5).
During the Regular Hour, the conventional roundabout (Base Scenario) operates efficiently, with negligible delays (~0.5 s). The Turbo-roundabout shows slightly higher delays (~2.0 s) due to the geometric constraints forcing speed reduction and strict lane discipline. The Flyover variant provides the best performance, allowing for nearly free-flow conditions.
In the Peak Hour, significant disparities emerge. The conventional roundabout experiences increased delays (~4.8 s) but remains stable. However, the Turbo-roundabout scenario reveals a critical performance drop, with average delays soaring to ~28.5 s. This suggests that without active flow management, the rigid geometry of the turbo-roundabout is susceptible to gridlock under specific heavy load patterns. The Flyover variant maintains high efficiency (~2.0 s), effectively segregating the dominant traffic streams.
Table 4 confirms that, while grade separation (Flyover) offers the highest theoretical capacity, the at-grade Turbo-roundabout—often considered a “modern” solution—requires careful calibration of flows. The high delay values in the Turbo scenario highlight the potential necessity for the Adaptive Inflow Metering (AIM) logic proposed in Section 2.8 to prevent such saturation.

3.2. Level of Service (LOS) and Queue Lengths (QLEN)

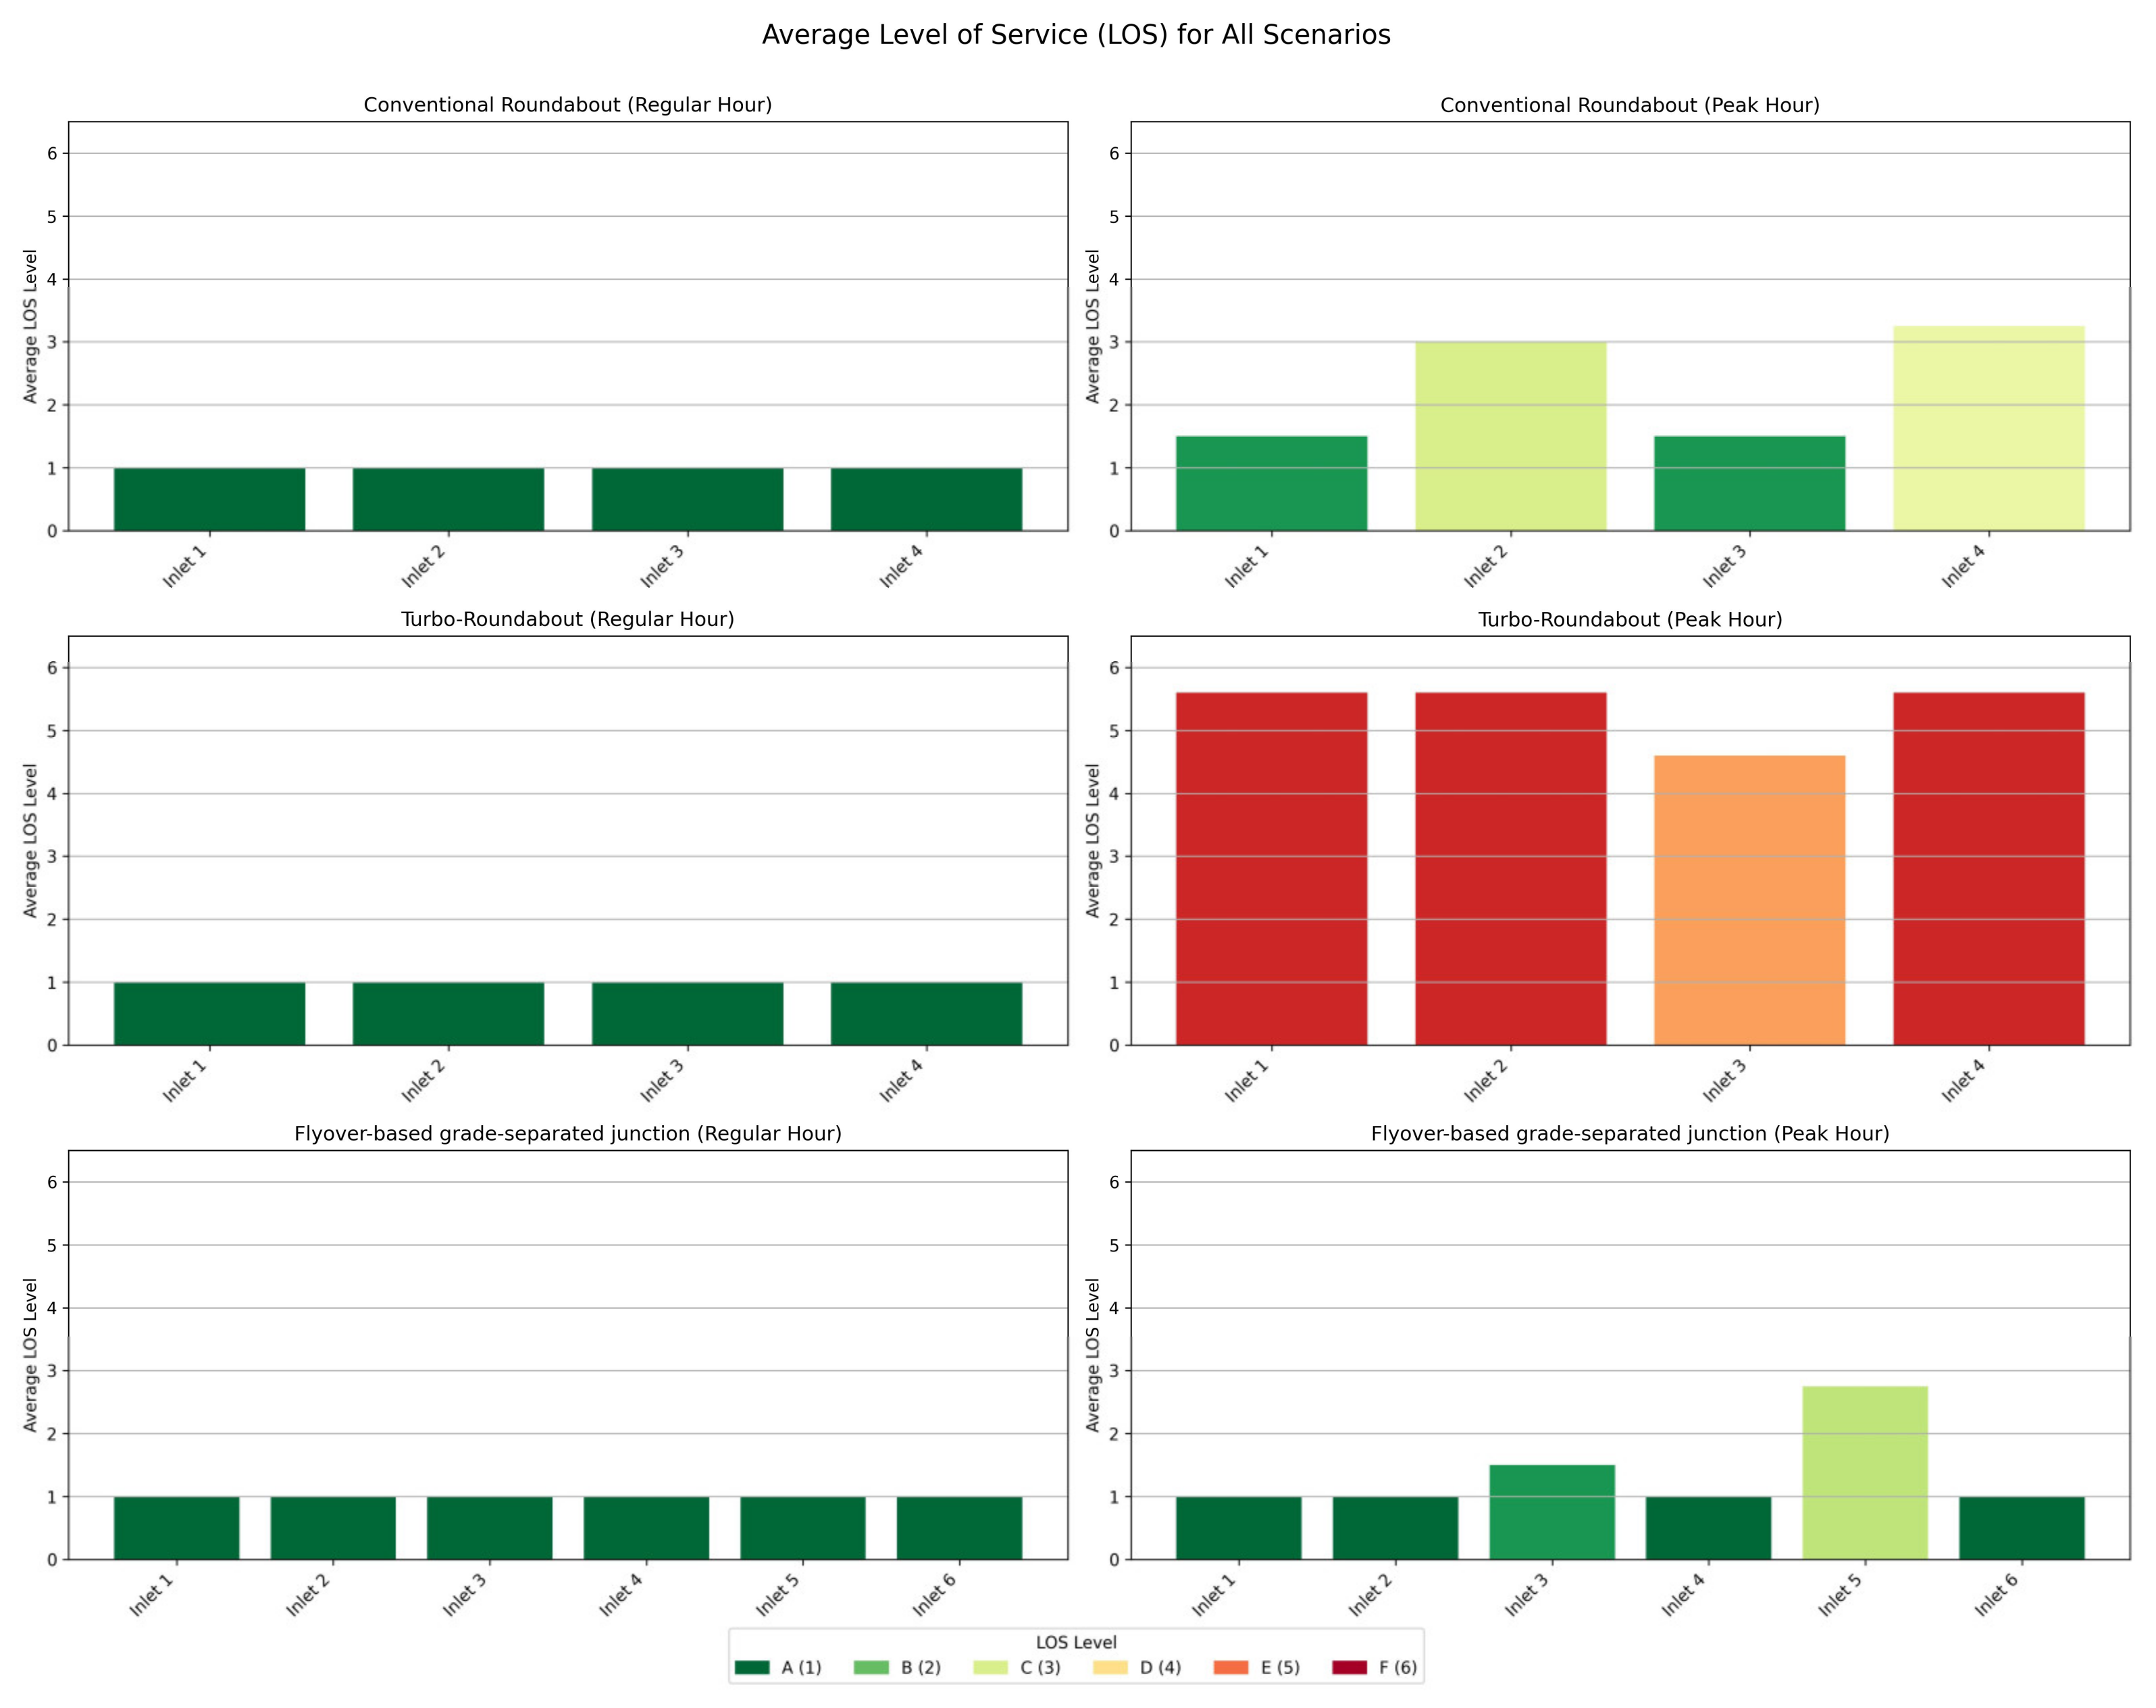
Level of Service (LOS) serves as a qualitative measure of the Digital Twin’s operational state, ranging from A (Free Flow) to F (Breakdown).
As shown in Figure 6, all variants maintain LOS A during the Regular Hour. However, the Peak Hour analysis exposes the limitations of static infrastructure:
  • Conventional Roundabout: Operates at LOS B/C, indicating stable but busy conditions.
  • Turbo-roundabout: Degrades to LOS F on key approaches. The physical separation of lanes prevents vehicles from utilizing gaps in adjacent lanes, leading to rapid queue accumulation.
  • Flyover: Maintains LOS A/B, confirming its robustness against demand surges.
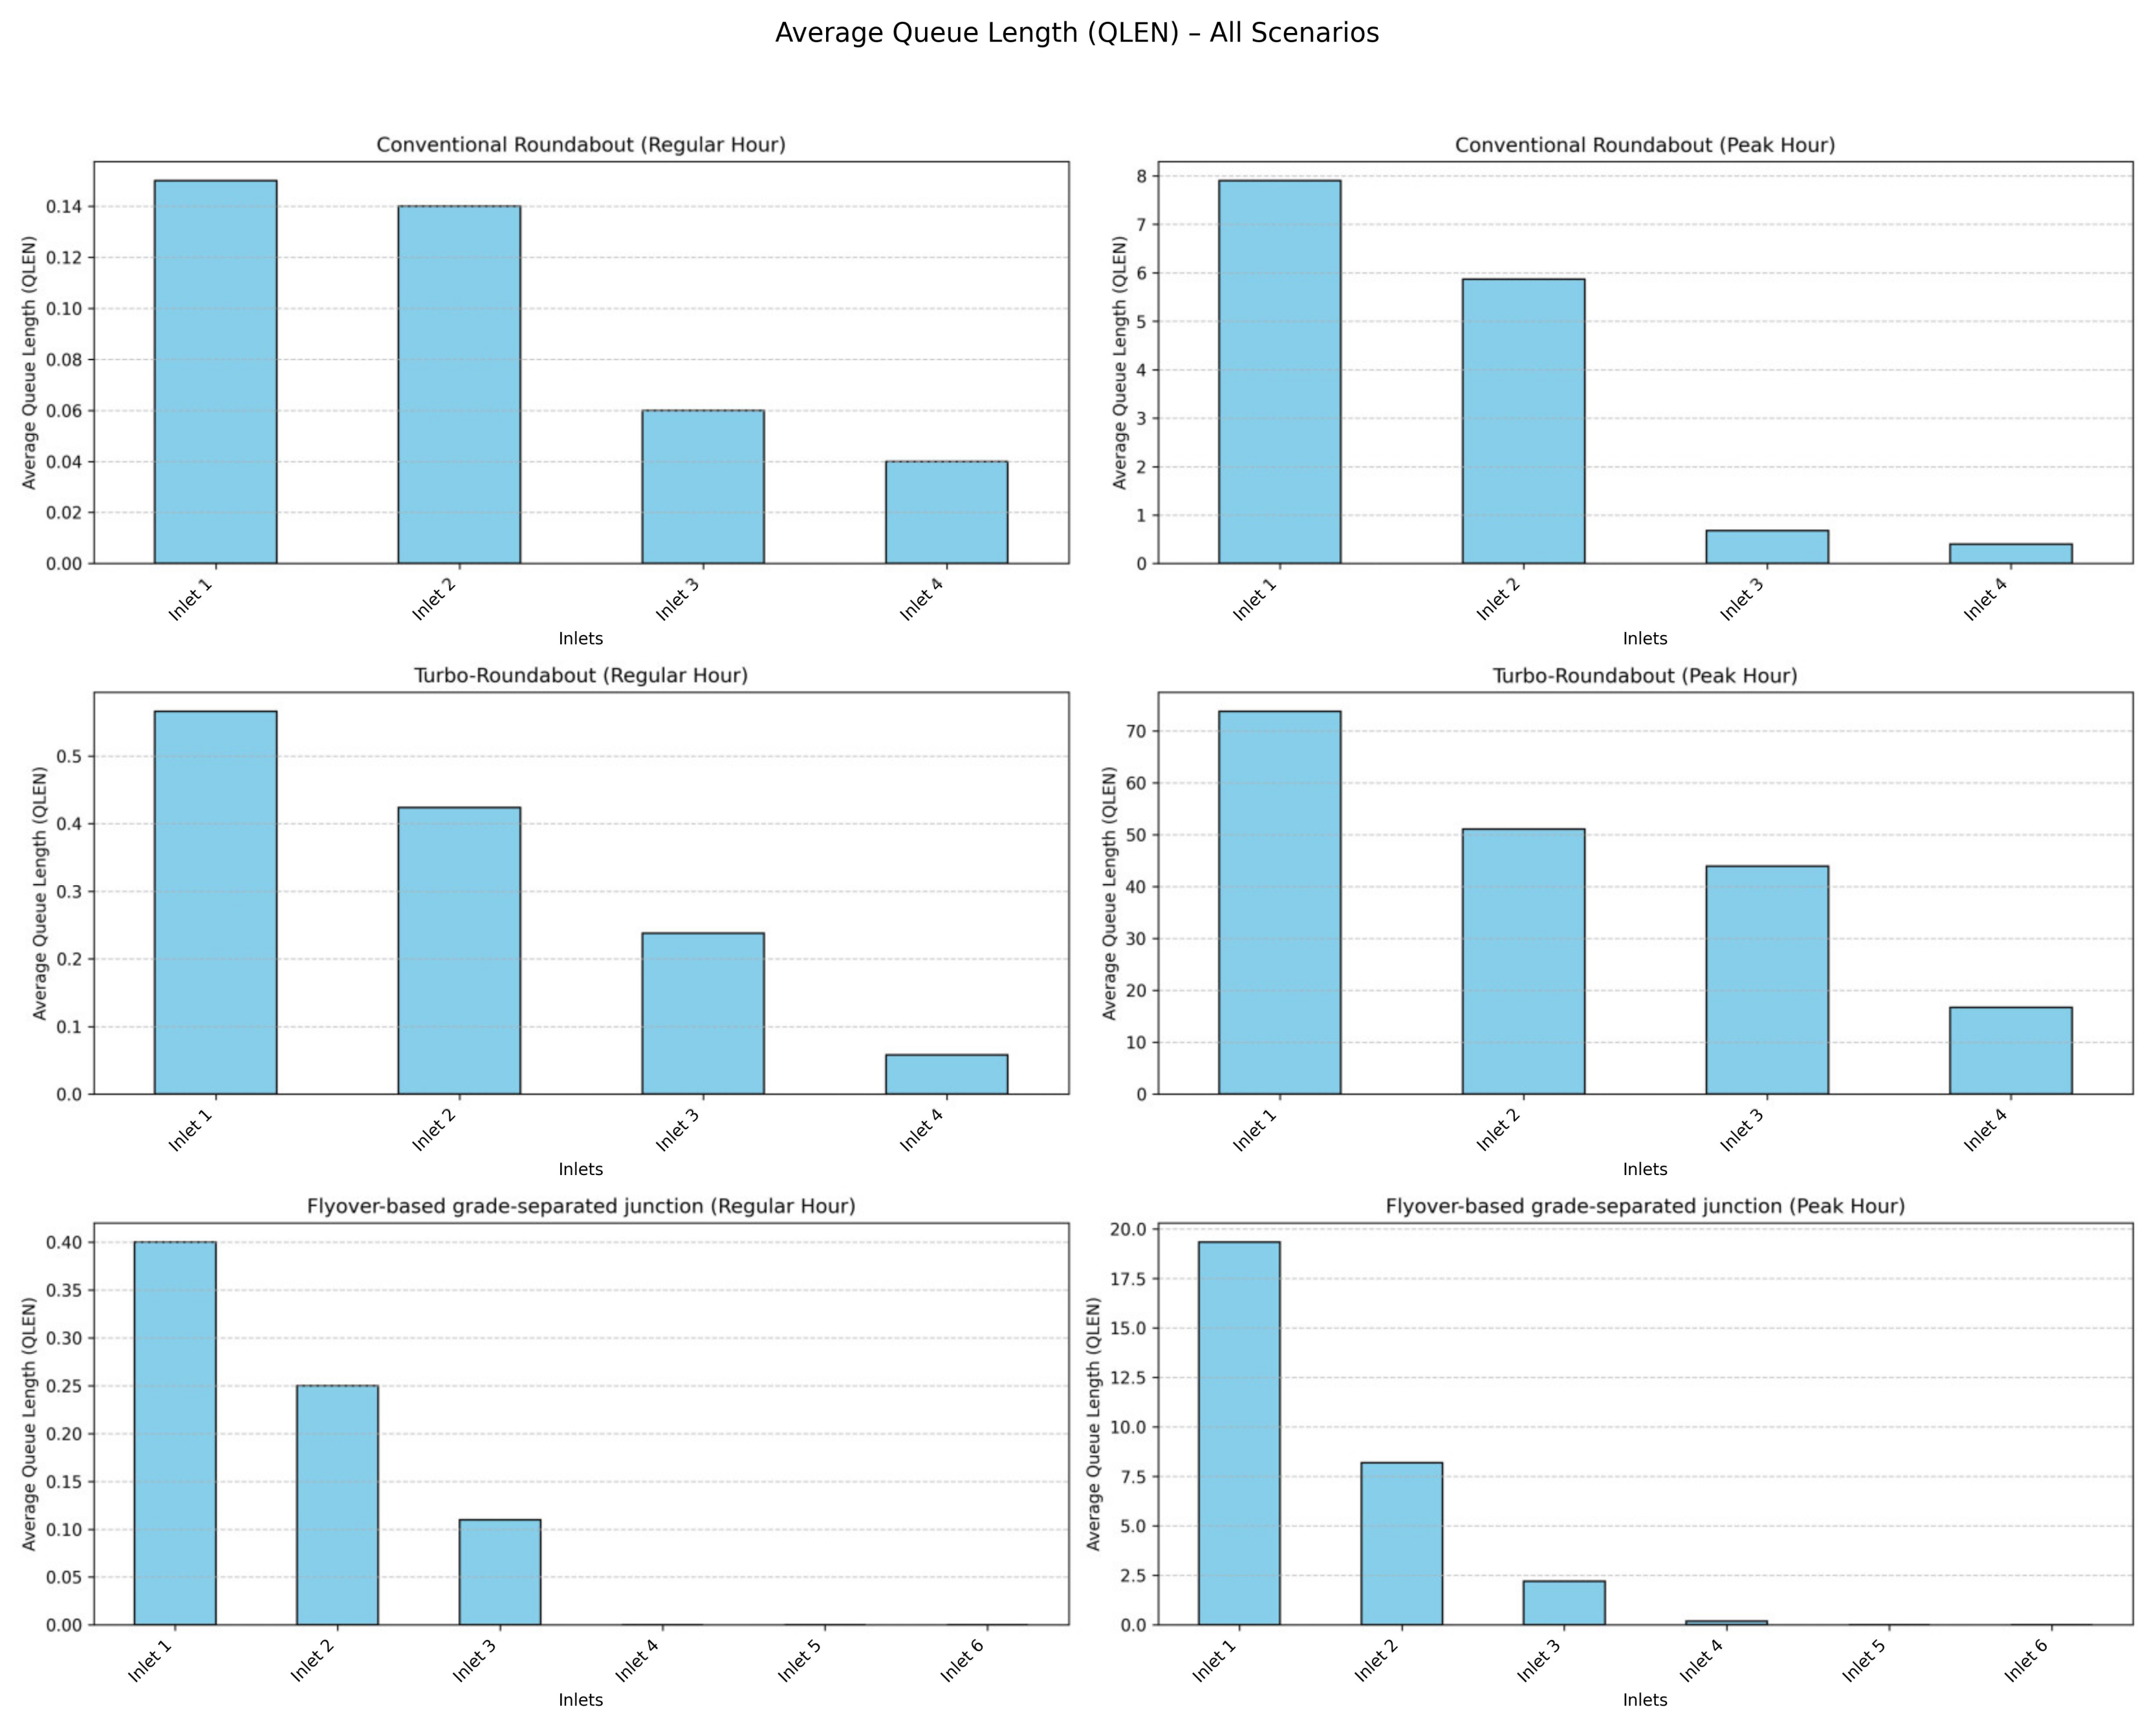
The Queue Length analysis (Figure 7) correlates with the LOS findings. The Turbo-roundabout generates significant queues extending beyond the immediate intersection area. From a Smart City perspective, such queues represent “pollution hotspots.” The visualization of these queues in the Digital Twin environment provides the necessary evidence that geometric changes alone (converting to a turbo-roundabout) may be insufficient without auxiliary active traffic control.

3.3. Speed Profiles and Driving Dynamics

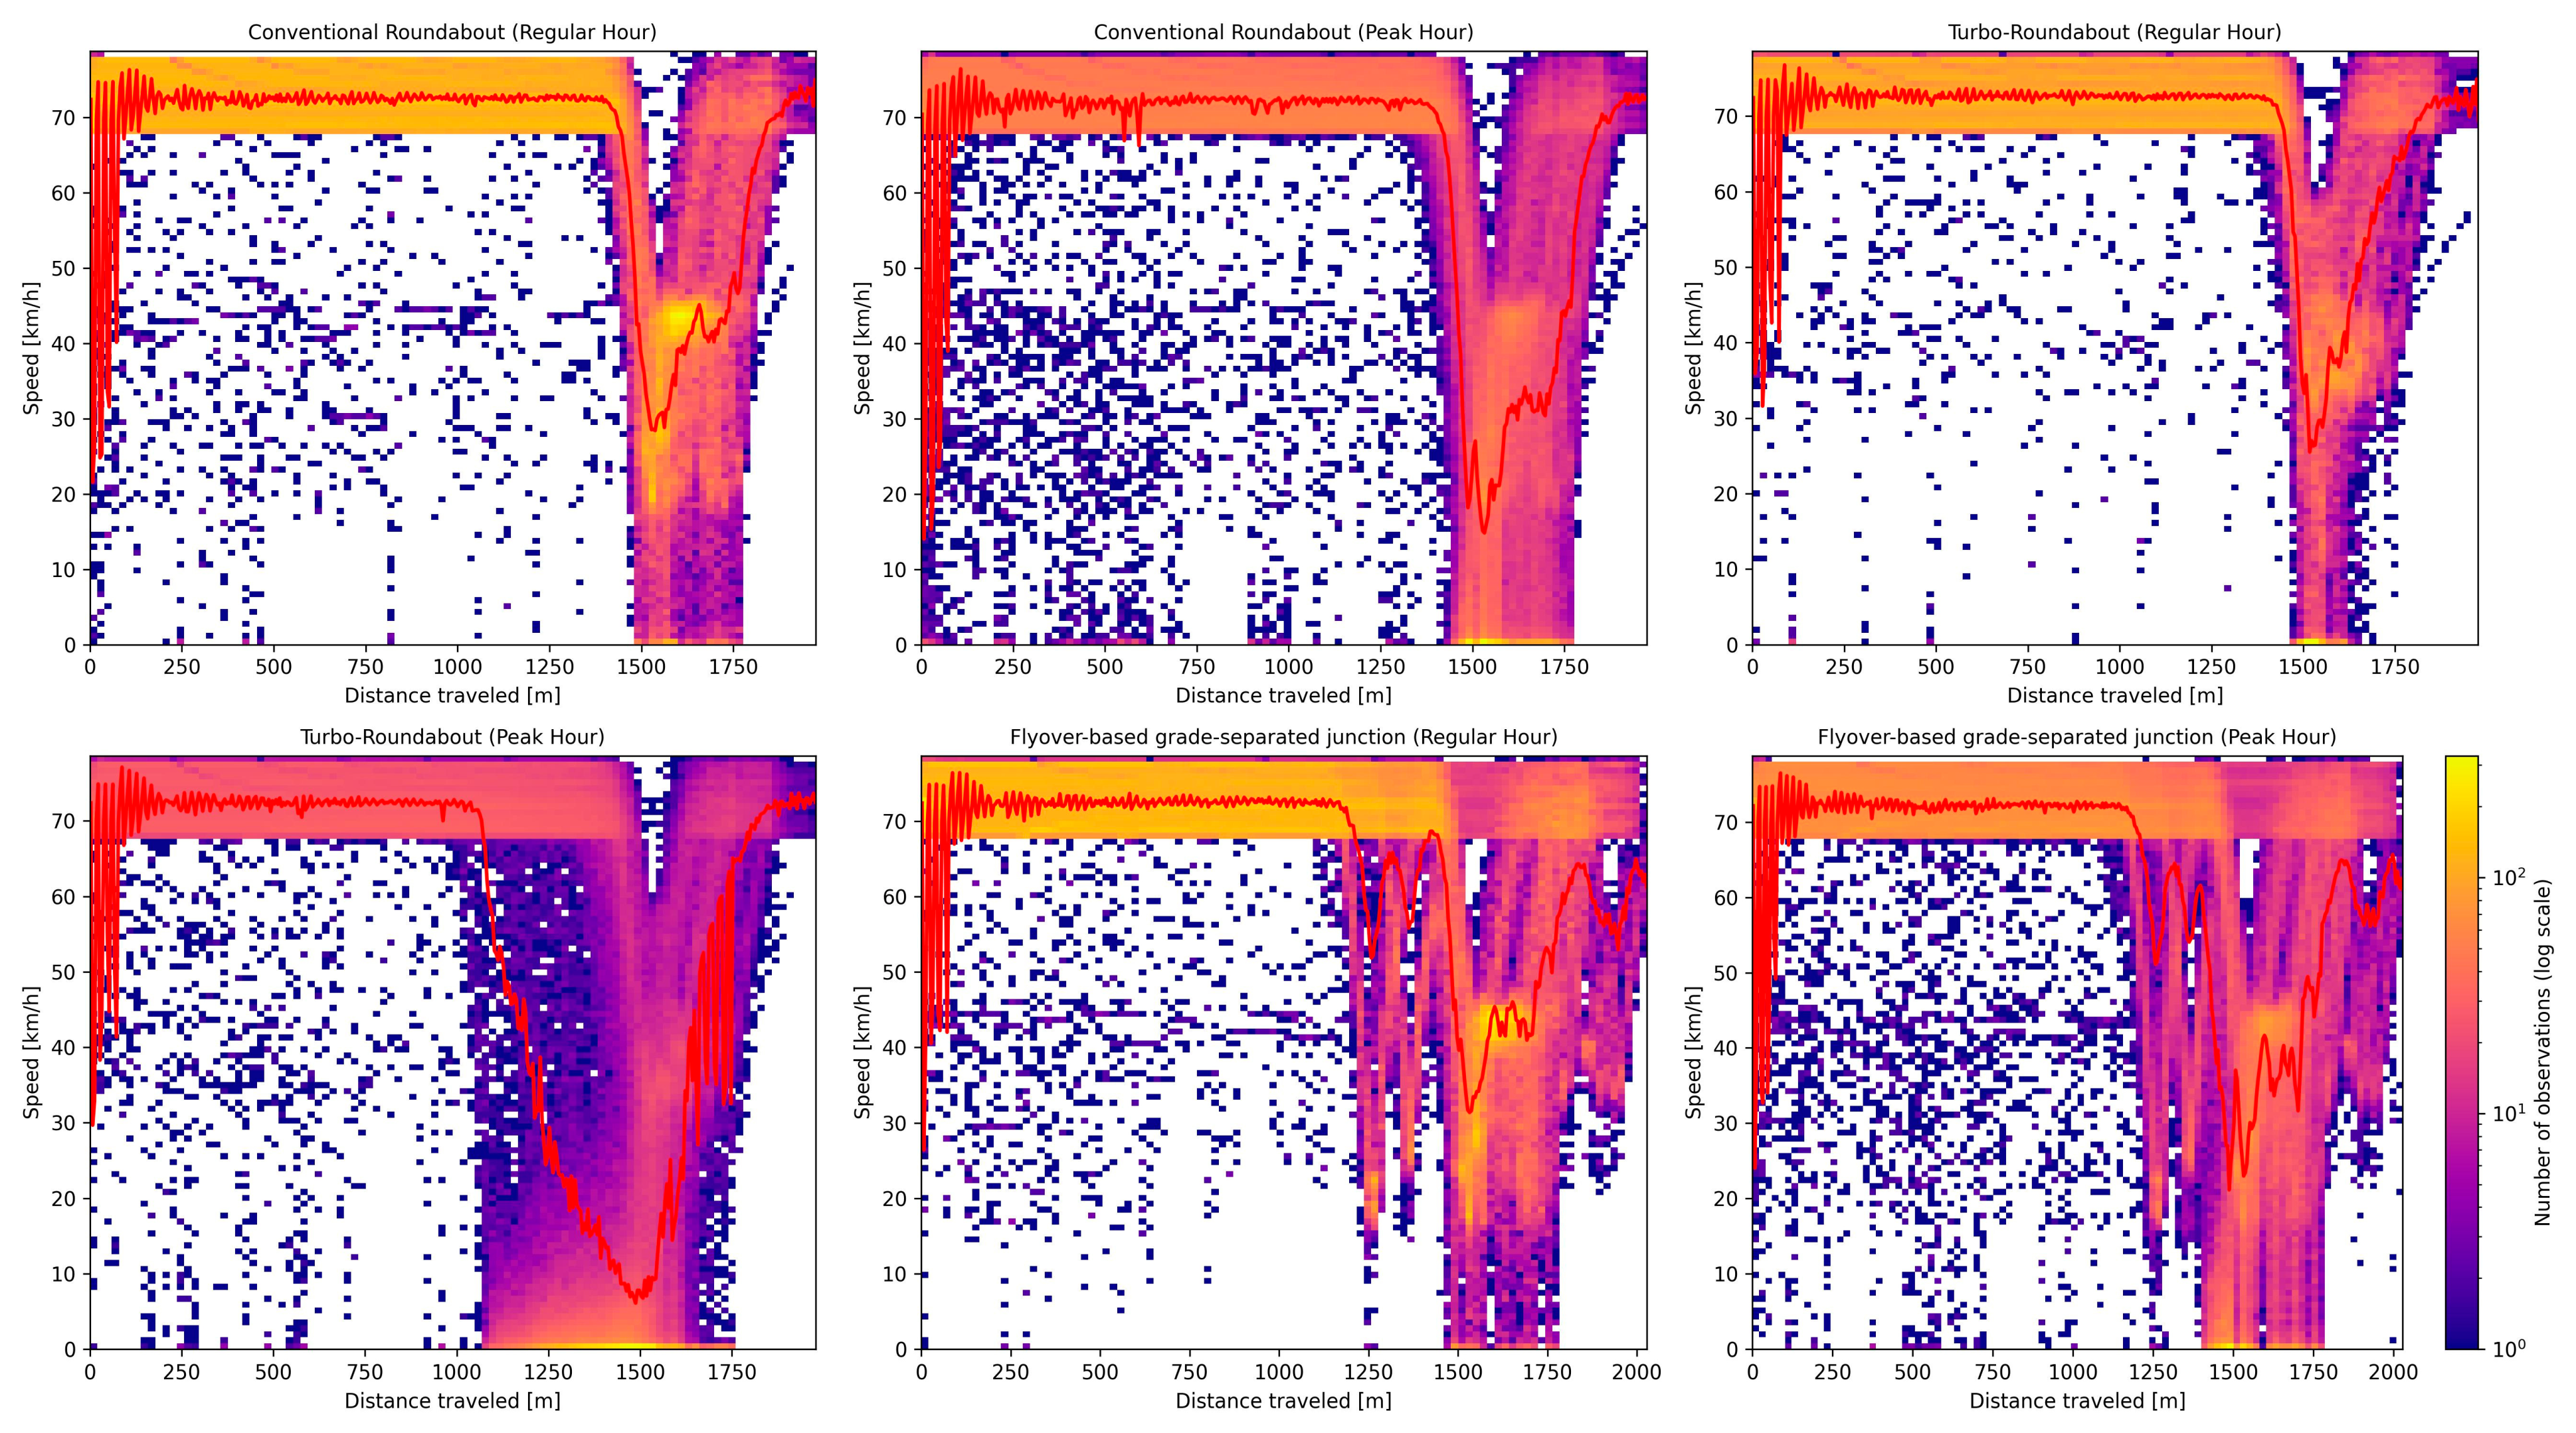
To assess the environmental impact (Green Transport aspect), speed profiles were extracted from vehicle trajectories. Smooth speed profiles indicate lower fuel consumption, while sharp fluctuations (braking/accelerating) indicate high emission events.
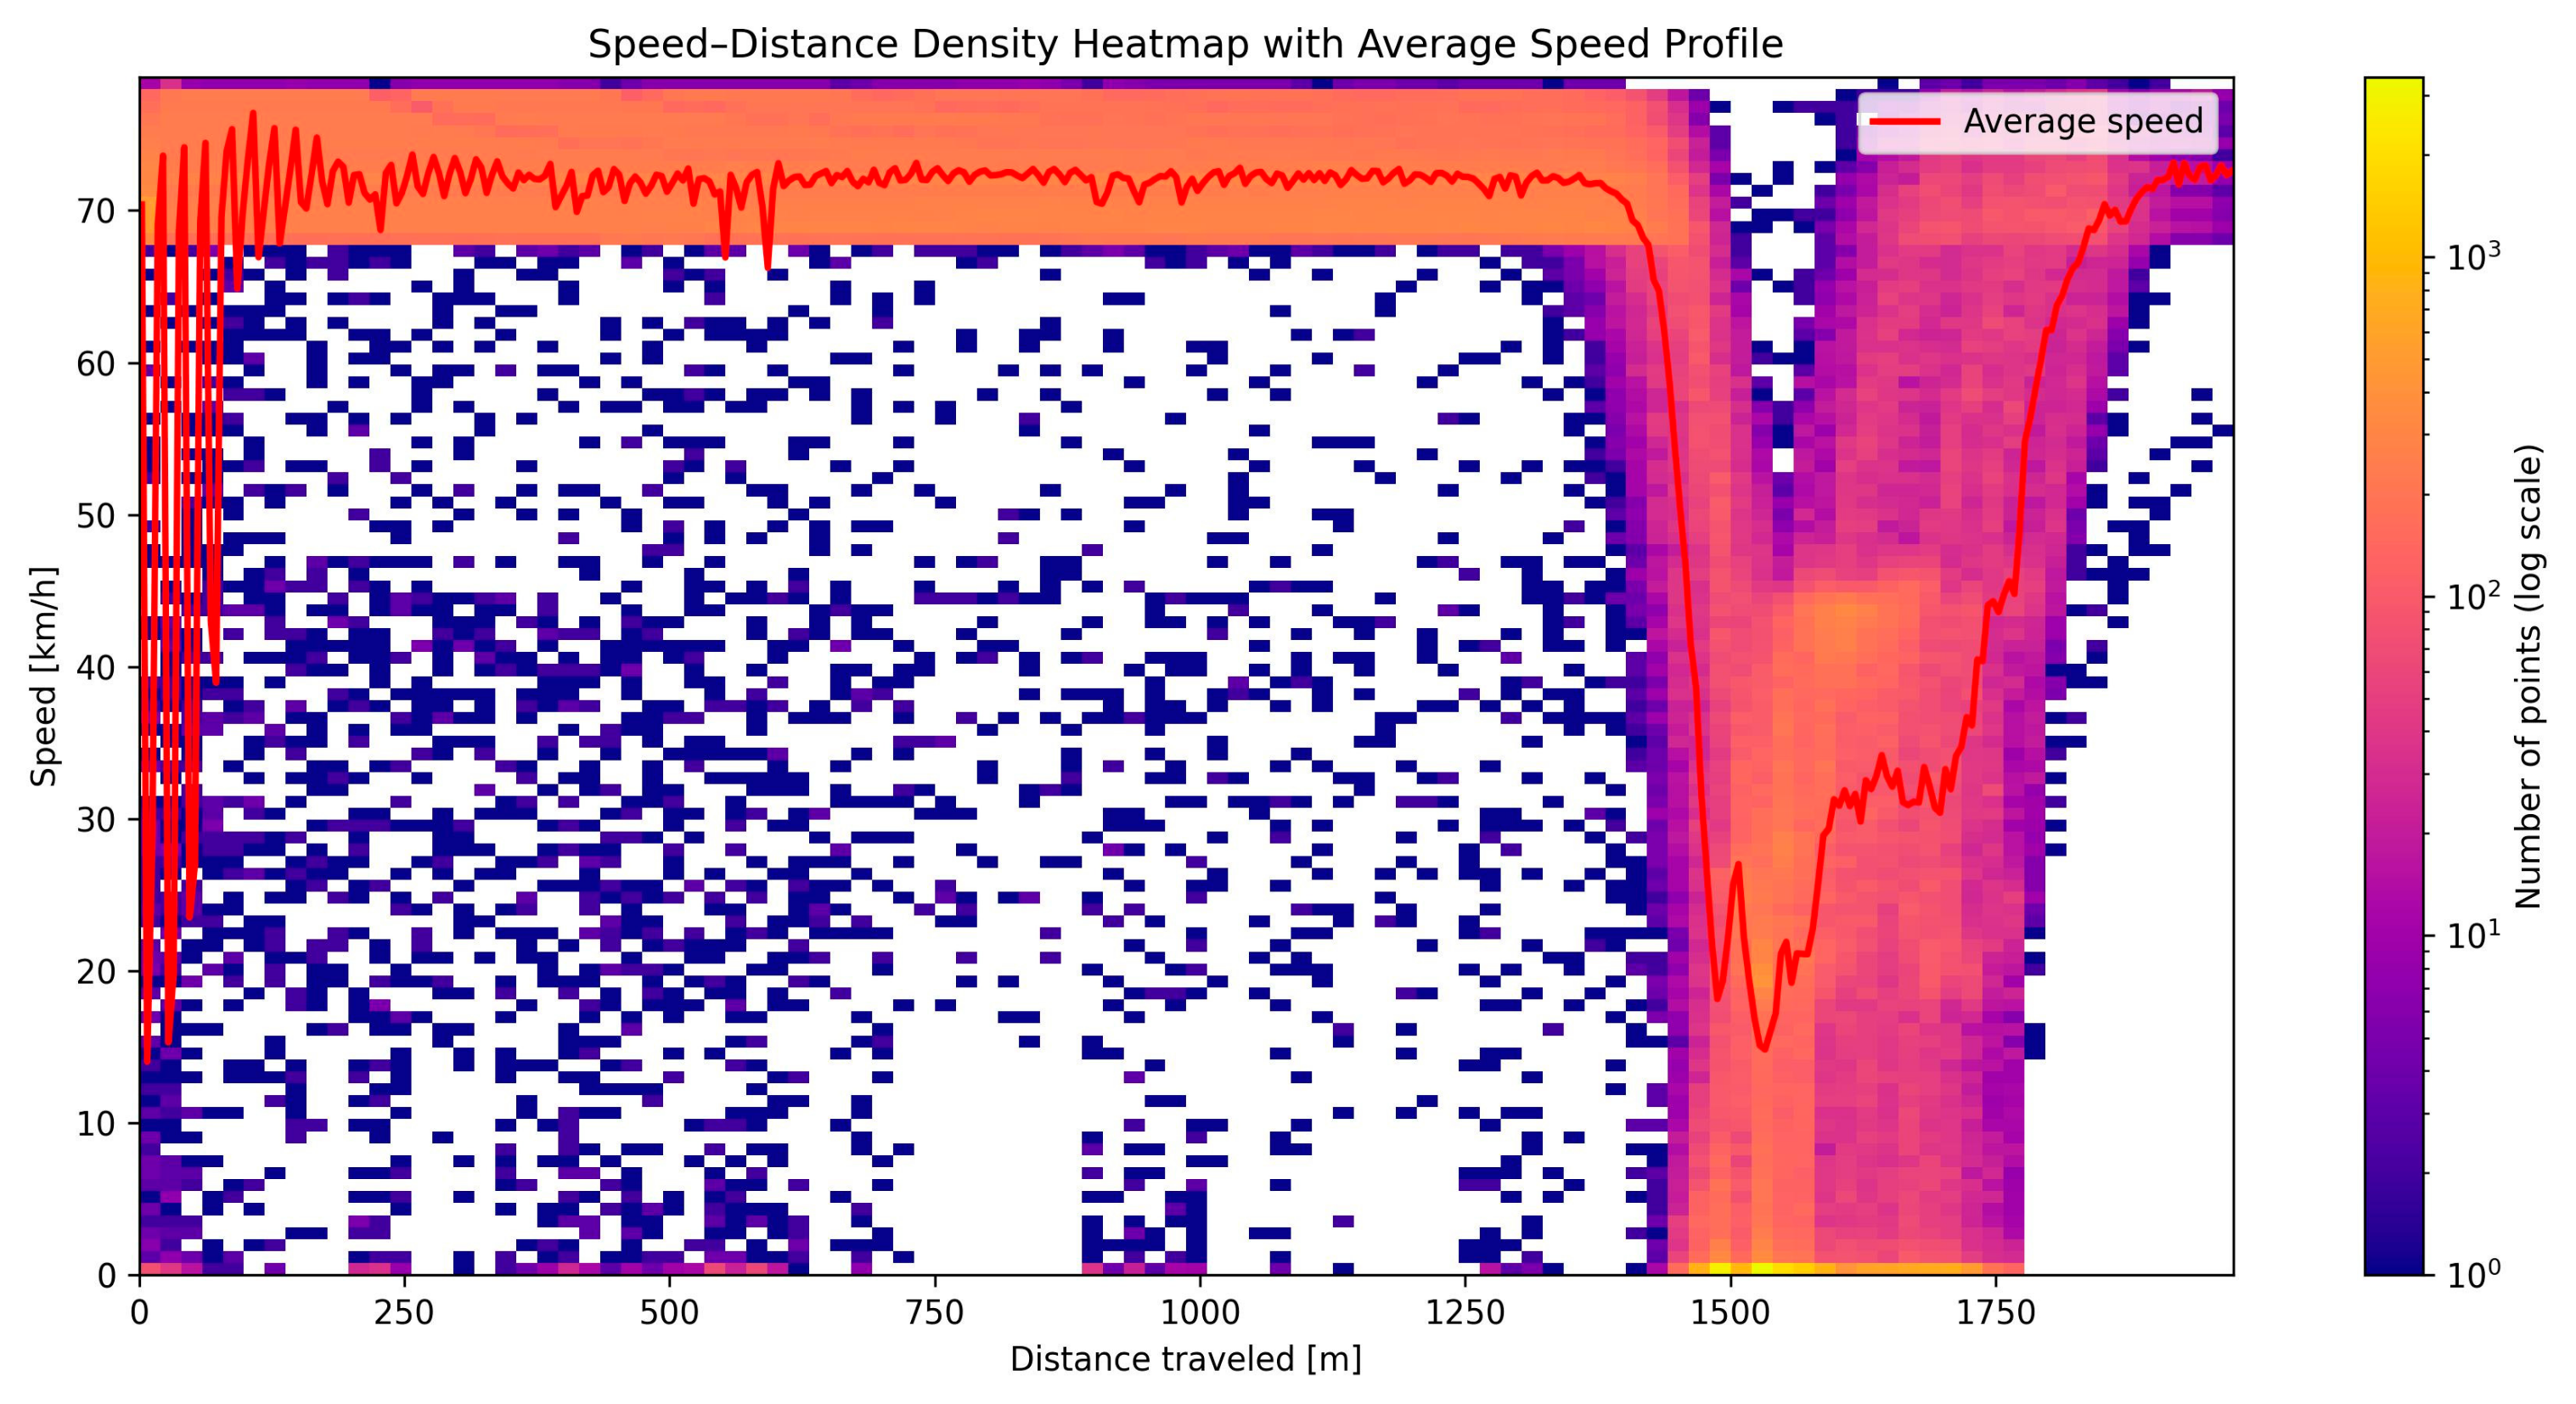
Figure 8 illustrates the baseline dynamics, where vehicles decelerate sharply from ~70 km/h to <20 km/h.
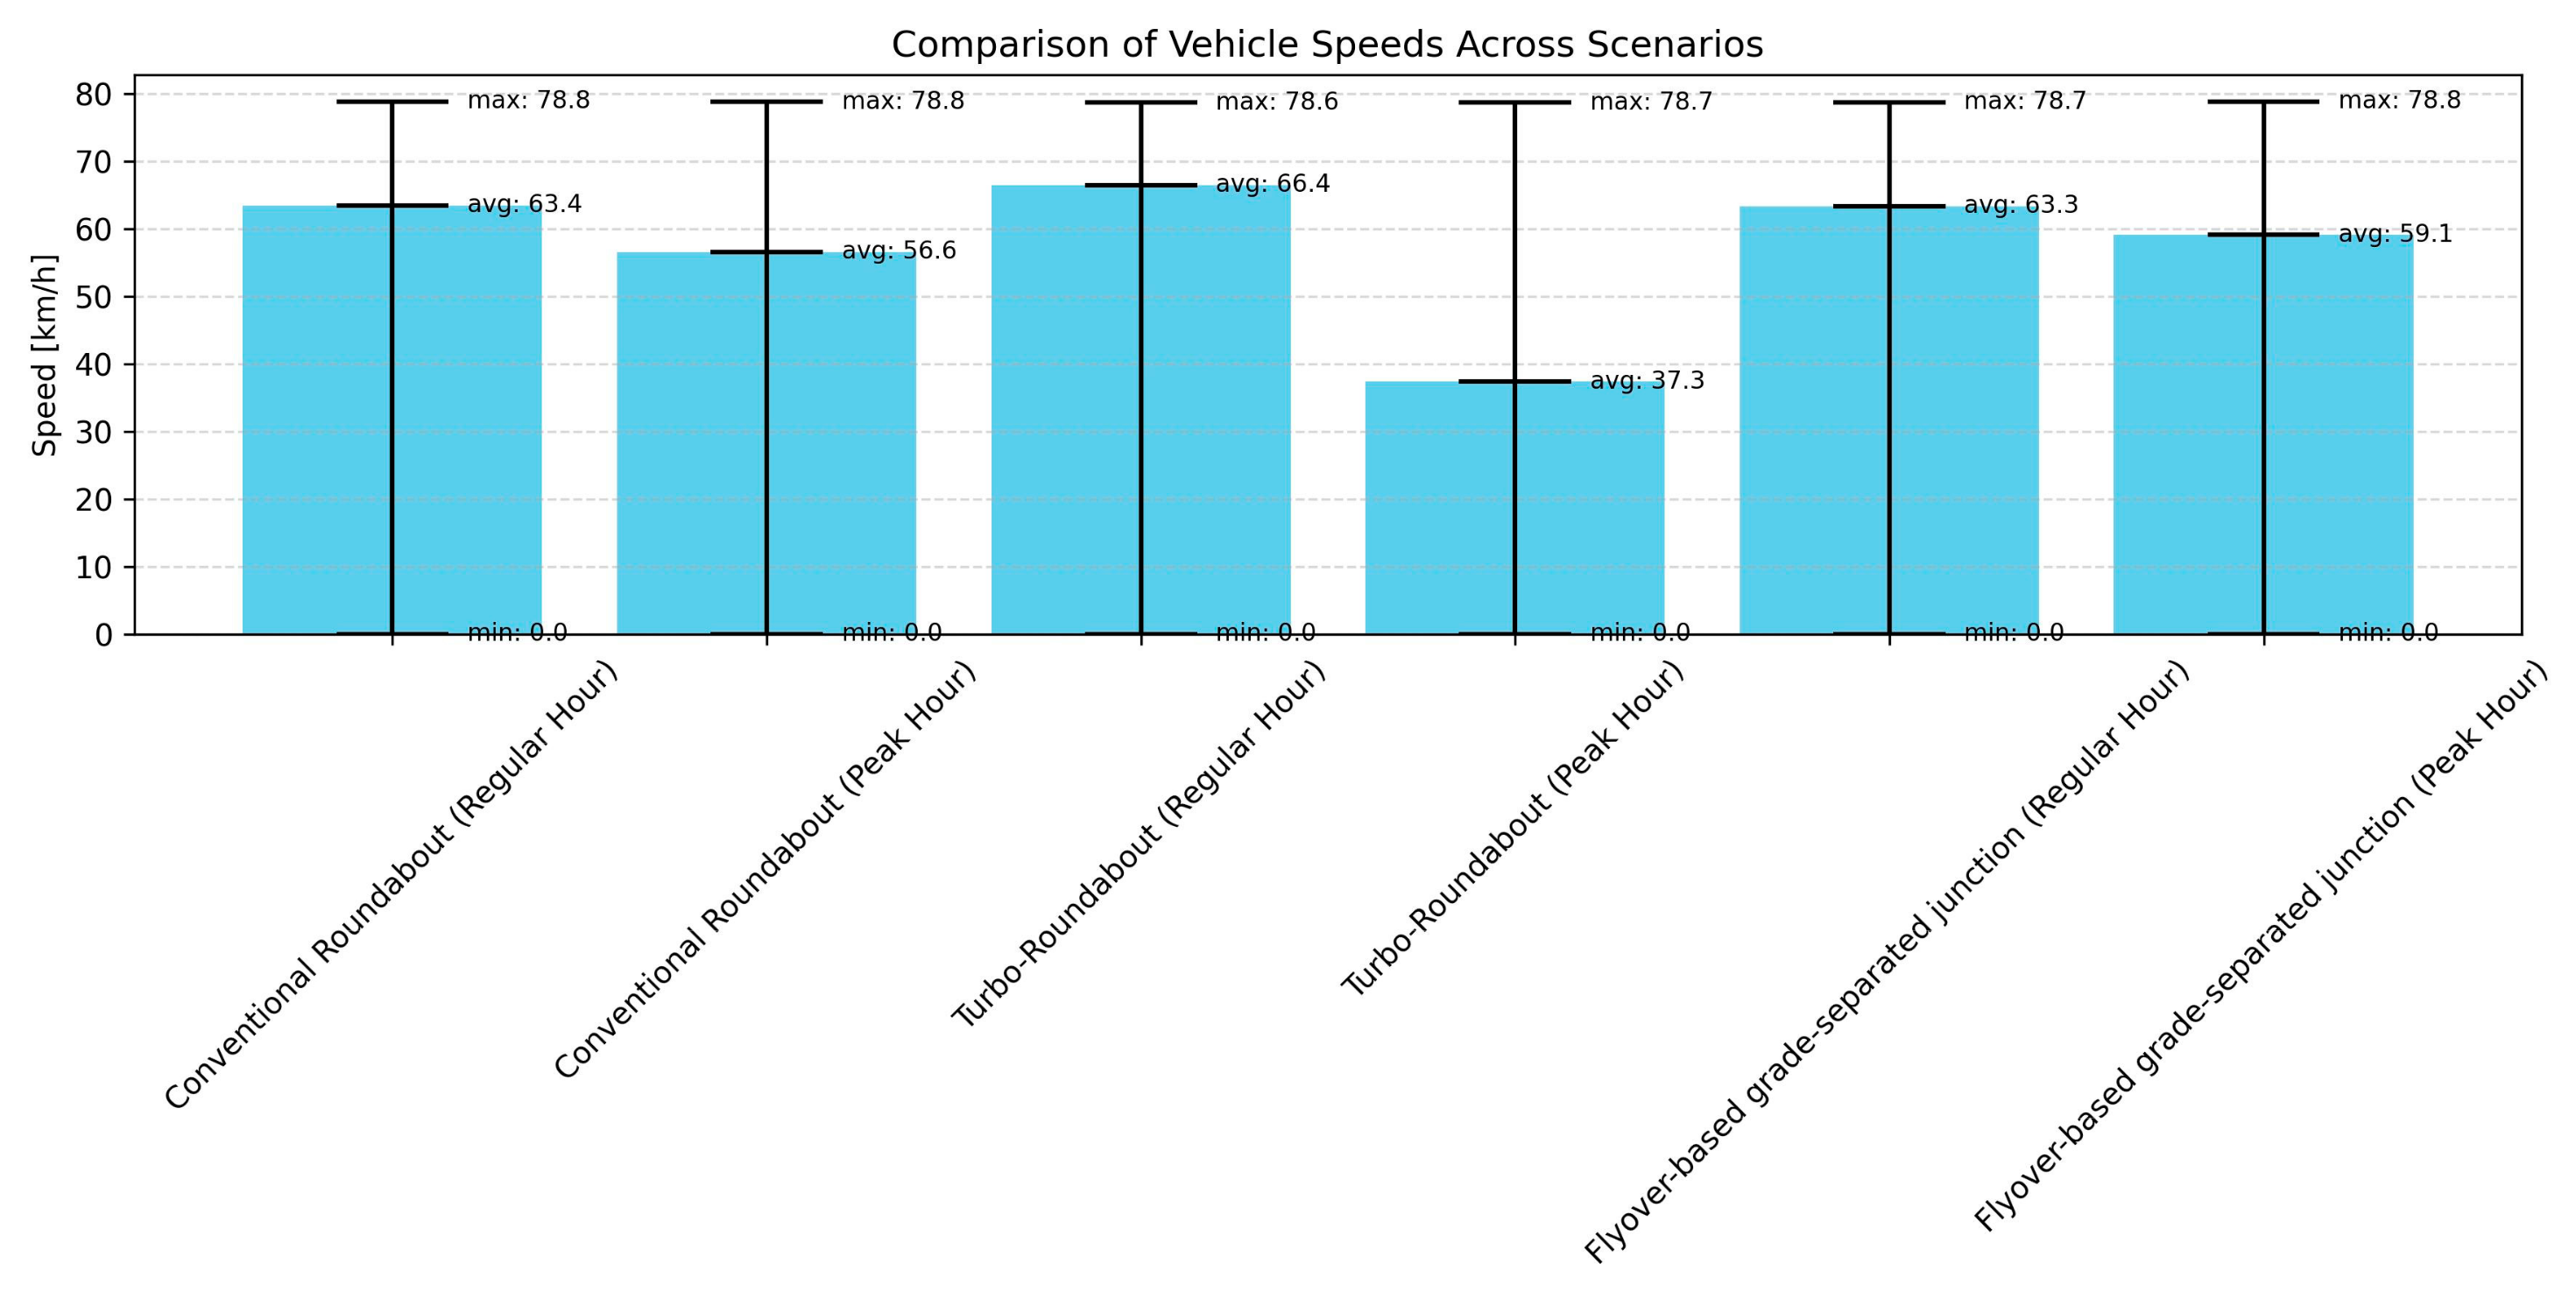
Figure 9 presents a comparative analysis of aggregated vehicle speeds for the six investigated scenarios. In the “Regular Hour” conditions (columns 1, 3, 5), all infrastructure variants maintain high average speeds ranging from 63.3 km/h to 66.4 km/h, indicating free-flow conditions with minimal stops
However, during the “Peak Hour”, the performance gap widens significantly:
  • The Conventional Roundabout (column 2) experiences a moderate drop to 56.6 km/h, showing resilience but noticeable friction.
  • The Turbo-Roundabout (column 4) suffers a drastic performance collapse, with the average speed plummeting to 37.3 km/h. This nearly 50% reduction in speed compared to free-flow conditions indicates severe congestion, characterized by frequent “stop-and-go” cycles that are highly detrimental to fuel efficiency and air quality.
  • The Flyover variant (column 6) demonstrates the highest stability, maintaining an average speed of 59.1 km/h even under peak load, confirming its superior capacity to handle heavy traffic volumes.
From a Digital Twin perspective, the critical velocity drop observed in the Turbo-Roundabout scenario (37.3 km/h) serves as a quantitative trigger for the proposed Adaptive Inflow Metering (AIM) system. An automated intervention would be required to prevent speeds from falling into this inefficient range.
The detailed profiles in Figure 10 demonstrate that the Flyover variant offers the most stable velocity profile, minimizing the “stop-and-go” phenomenon. In contrast, the Turbo-roundabout in peak hours forces vehicles into an extended “crawl” phase (low speed over a long distance), which is detrimental to engine efficiency.

3.4. Validation of the Need for Real-Time Optimization

The results presented above highlight a critical paradox: the Turbo-roundabout, theoretically designed to improve safety, led to LOS F under the specific peak load conditions of the Rzeszów case study.
This empirical finding from the Digital Twin simulation validates the conceptual framework proposed in this paper. Static infrastructure upgrades (Variant 2) proved insufficient to handle peak demand stochasticity. This justifies the integration of the Adaptive Inflow Metering (AIM) logic (described in Section 2.8). If the “Gridlock Risk” detected in the Turbo-roundabout simulation (Occupancy > 85%) were managed by the AIM algorithm, the inflow would be metered, potentially preventing the breakdown to LOS F. These results demonstrate that a Digital Twin is not merely a visualization tool, but a critical diagnostic instrument for identifying where and why “Green Transport” solutions require algorithmic support.

4. Discussion

One of the most significant findings of this study is the underperformance of the Turbo-roundabout variant under peak loading conditions (average delay ~28.5 s, LOS F), which contradicts the general heuristic that turbo-roundabouts provide superior capacity compared to conventional designs.
Existing literature, such as the foundational work by Fortuijn [47], suggests that turbo-roundabouts typically increase capacity by 30–50% due to the reduction in conflict points. However, our results align with more recent critical studies by Vasconcelos et al. [48] and Gallelli et al. [49], which demonstrate that the rigid lane separation in turbo-roundabouts makes them highly sensitive to unbalanced traffic flows. In the case of the Pobitno Roundabout, the Digital Twin simulation revealed that a dominant traffic stream effectively “starved” the entry capacities of subordinate approaches. Unlike a conventional roundabout, where drivers can aggressively utilize gaps in multiple lanes, the turbo-geometry forced vehicles into specific, single-lane queues that could not dissipate, leading to a “gridlock” state. This validates the hypothesis that “modern” geometry without adaptive control is insufficient for highly saturated, unbalanced nodes.
This study advances the state of the art by moving beyond traditional “offline” microsimulation. While standard studies, such as those by Ciuffo et al. [50], focus primarily on calibration for reproduction of past events, our framework introduces the “Software-in-the-Loop” (SiL) paradigm.
As noted in the comprehensive review by Deng et al. [51], a significant gap exists in transitioning from “Digital Shadows” (visualization) to true “Digital Twins” (actuation). By integrating the Adaptive Inflow Metering (AIM) logic via the Python–COM interface, this research demonstrates a practical pathway to close this loop. The simulation proves that, when the physical infrastructure (Turbo-roundabout) hits its geometric limit (LOS F), the digital layer must intervene. This supports the concept presented by Batty [52], arguing that in the Smart City era, the “soft” infrastructure (algorithms) is as critical as the “hard” infrastructure (concrete).
From an environmental perspective, the analysis of speed profiles (Figure 10) provides direct evidence for the “Green Transport” impact of the tested solutions. The “stop-and-go” waves observed in the Turbo-roundabout scenario are known to be the primary contributors to local NOx and PM hotspots, as demonstrated in emission modelling studies by Madziel [53].
The Flyover variant, while offering the smoothest velocity profile (avg. ~59.1 km/h) and lowest theoretical emissions, presents high implementation costs and spatial challenges. The Digital Twin analysis suggests a middle ground: by applying the AIM algorithm to the existing or modified infrastructure, cities can potentially smooth out the speed trajectories without the massive carbon footprint associated with constructing heavy grade-separated interchanges. This aligns with the European Green Deal’s emphasis on “optimizing existing assets” before expanding infrastructure [54,55]. Finally, it is essential to acknowledge the broader technological ecosystem required to support such Digital Twin frameworks in real-world deployments [56,57]. The operational reliability of the proposed AIM logic is intrinsically linked to the quality, latency, and granularity of incoming data streams, emphasizing the critical need for robust IoT sensor networks and advanced multi-source data fusion techniques. Moreover, while this study utilized a deterministic heuristic control algorithm, future iterations of urban Digital Twins will likely transition towards Deep Reinforcement Learning (DRL) agents capable of self-calibrating against stochastic traffic patterns withoutuman intervention [58,59]. Such an evolution from “automated” to “autonomous” traffic management aligns with the strategic objectives of Sustainable Urban Mobility Plans (SUMP), providing city administrators with scalable tools to balance mobility demands with climate neutrality targets [4,60].

5. Conclusions

This paper presented a comprehensive framework for planning green transport solutions using a calibrated Digital Twin of the example roundabout. By integrating microsimulation with a conceptual real-time control logic, the study bridges the gap between static traffic modelling and dynamic Smart City management.
The key findings are as follows:
  • Model Validity: The developed microsimulation model achieved high fidelity (GEH < 5.0), proving its suitability as a core engine for a Digital Twin.
  • Infrastructure Limitations: Geometric modernization (Turbo-roundabout) is not a universal remedy. Under specific peak loads, it generated the highest delays (~28.5 s), proving that rigid lane separation can be detrimental without active control.
  • Role of Digital Twins: The proposed framework successfully demonstrated that “smart” mobility requires more than just sensors; it requires an algorithmic brain. The conceptual Adaptive Inflow Metering (AIM) logic provides a pathway to optimize existing infrastructure, offering a sustainable alternative to costly physical expansions.
Future work will focus on the field deployment of the AIM Python script within the physical ITS infrastructure of Rzeszów to validate the “Software-in-the-Loop” results in a real-world environment. This transition from simulation to practice will address several important considerations that extend beyond the current study’s scope. First, the microsimulation model relied on aggregated hourly traffic data from inductive loop detectors without detailed turn-movement information; field deployment will enable calibration against more granular, real-time sensor data and validation of the inferred circulation patterns. Second, the control thresholds (85% and 60% occupancy) were derived from conceptual principles; empirical field testing will allow optimization of these parameters under actual traffic dynamics and seasonal variability. Third, real-time implementation will require robust IoT sensor networks, multi-source data fusion techniques, and cybersecurity protocols—considerations that will shape the practical feasibility of the framework. Additionally, future research should investigate the generalizability of findings to other intersections with different geometric characteristics and traffic patterns, as well as the scalability of the approach to network-scale coordination across multiple critical nodes. Investigation of machine learning and reinforcement learning approaches for adaptive parameter optimization, alongside direct quantification of emissions impacts through integrated air quality monitoring, would strengthen both the methodological rigor and the environmental claims of the framework. Finally, assessment of how emerging technologies—such as autonomous vehicles and connected vehicle networks—interact with Digital Twin-based optimization represents an essential direction for ensuring the long-term relevance of these solutions in rapidly evolving urban mobility ecosystems.

Author Contributions

Conceptualization, M.L. and M.M.; methodology, M.L.; software, M.L.; validation, M.M.; formal analysis, M.M.; investigation, M.L.; resources, M.L.; data curation, M.L.; writing—original draft preparation, M.L.; writing—review and editing, M.M.; visualization, M.L.; supervision, M.M.; project administration, M.M.; funding acquisition, M.M. All authors have read and agreed to the published version of the manuscript.

Funding

This research received no external funding.

Institutional Review Board Statement

Not applicable.

Informed Consent Statement

Not applicable.

Data Availability Statement

The original contributions presented in this study are included in the article. Further inquiries can be directed to the corresponding author.

Conflicts of Interest

The authors declare no conflicts of interest.

Abbreviations

The following abbreviations are used in this manuscript:
DTDigital Twin
ITSIntelligent Transport Systems
IoTInternet of Things
AIMAdaptive Inflow Metering
SiLSoftware-in-the-Loop
LOSLevel of Service
GEHGeoffrey E. Havers (statistic used in traffic modelling)
TMCTraffic Management Center
SUMPSustainable Urban Mobility Plan
ZTMZarząd Transportu Miejskiego (Municipal Transport Authority)
COMComponent Object Model (interface)
PMParticulate Matter
NOxNitrogen Oxides
QLENQueue Length
STOPDELAYStop Delay per Vehicle

References

  1. Gachowski, M.; Walusiak, Ł. Urban Phenomena in Lesser Poland Through GIS-Based Metrics: An Exceptional Form of Urban Sprawl Challenging Sustainable Development. Sustainability 2025, 17, 9394. [Google Scholar] [CrossRef]
  2. Karimi, F.; Sultana, S. Urban expansion prediction and land use/land cover change modeling for sustainable urban development. Sustainability 2024, 16, 2285. [Google Scholar] [CrossRef]
  3. Zhang, P.; Bian, S.; He, Y. Integration of e-commerce traffic supply chain and product supply chain in the era of digital economy. Int. Trans. Oper. Res. 2025, early view. [Google Scholar] [CrossRef]
  4. Uribe-Chavert, P.; Posadas-Yagüe, J.L.; Poza-Lujan, J.L. Evaluating traffic control parameters: From efficiency to sustainable development. Smart Cities 2025, 8, 57. [Google Scholar] [CrossRef]
  5. Mądziel, M. Phase-Specific Mixture of Experts Architecture for Real-Time NOx Prediction in Diesel Vehicles: Advancing Euro 7 Compliance. Energies 2025, 18, 5853. [Google Scholar] [CrossRef]
  6. Mądziel, M.; Campisi, T. Predicting Auxiliary Energy Demand in Electric Vehicles Using Physics-Based and Machine Learning Models. Energies 2025, 18, 6092. [Google Scholar] [CrossRef]
  7. García-Vaquero, M.; Daumann, F.; Sánchez-Bayón, A. European Green Deal, Energy Transition and Greenflation Paradox under Austrian Economics Analysis. Energies 2024, 17, 3783. [Google Scholar] [CrossRef]
  8. Tarulescu, S.; Tarulescu, R.; Soica, A.; Covaciu, D.; Leahu, C.I.; Duguleana, M.; Szigeti, R. Measures to Reduce the Environmental Impact of Transport Proposed in SUMPs for Small Cities. In CONAT 2024 International Congress of Automotive and Transport Engineering—Part Two: Automobile and Environment; Springer Nature: Cham, Switzerland, 2024; pp. 44–55. [Google Scholar]
  9. Mądziel, M. Quantifying emissions in vehicles equipped with energy-saving start–stop technology: THC and NOx modeling insights. Energies 2024, 17, 2815. [Google Scholar] [CrossRef]
  10. Lee, J.; Cho, J.; Rodrigazo, S.A.; Lee, K.S.; Yeon, J. Impact Analysis of Energy and Emissions in Lane-Closure-Free Road Inspections. Energies 2025, 18, 5848. [Google Scholar] [CrossRef]
  11. Tumminello, M.L.; Macioszek, E.; Granà, A. Insights into simulated smart mobility on roundabouts: Achievements, lessons learned, and steps ahead. Sustainability 2024, 16, 4079. [Google Scholar] [CrossRef]
  12. Zare, N.; Macioszek, E.; Granà, A.; Giuffrè, T. Blending efficiency and resilience in the performance assessment of urban intersections: A novel heuristic informed by literature review. Sustainability 2024, 16, 2450. [Google Scholar] [CrossRef]
  13. Mystakidis, A.; Koukaras, P.; Tjortjis, C. Advances in traffic congestion prediction: An overview of emerging techniques and methods. Smart Cities 2025, 8, 25. [Google Scholar] [CrossRef]
  14. Vieira, M.; Vieira, M.A.; Galvão, G.; Louro, P.; Véstias, M.; Vieira, P. Enhancing urban intersection efficiency: Utilizing visible light communication and learning-driven control for improved traffic signal performance. Vehicles 2024, 6, 666–692. [Google Scholar] [CrossRef]
  15. Drliciak, M.; Cingel, M.; Celko, J.; Panikova, Z. Research on vehicle congestion group identification for evaluation of traffic flow parameters. Sustainability 2024, 16, 1861. [Google Scholar] [CrossRef]
  16. Pielecha, J.; Gis, W. Testing Exhaust Emissions of Plug-In Hybrid Vehicles in Poland. Energies 2024, 17, 6288. [Google Scholar] [CrossRef]
  17. Zaman, M.; Puryear, N.; Abdelwahed, S.; Zohrabi, N. A review of IoT-based smart city development and management. Smart Cities 2024, 7, 1462–1501. [Google Scholar] [CrossRef]
  18. Matei, A.; Cocoșatu, M. Artificial Internet of Things, sensor-based digital twin urban computing vision algorithms, and blockchain cloud networks in sustainable smart city administration. Sustainability 2024, 16, 6749. [Google Scholar] [CrossRef]
  19. Veloso, Á.; Fonseca, F.; Ramos, R. Insights from smart city initiatives for urban sustainability and contemporary urbanism. Smart Cities 2024, 7, 3188–3209. [Google Scholar] [CrossRef]
  20. Fatorachian, H.; Kazemi, H.; Pawar, K. Enhancing smart city logistics through IoT-enabled predictive analytics: A digital twin and cybernetic feedback approach. Smart Cities 2025, 8, 56. [Google Scholar] [CrossRef]
  21. Jonek-Kowalska, I.; Wolny, M. Age sustainability in smart city: Seniors as urban stakeholders in the light of literature studies. Sustainability 2025, 17, 6333. [Google Scholar] [CrossRef]
  22. Kapanski, A.A.; Klyuev, R.V.; Boltrushevich, A.E.; Sorokova, S.N.; Efremenkov, E.A.; Demin, A.Y.; Martyushev, N.V. Geospatial clustering in smart city resource management: An initial step in the optimisation of complex technical supply systems. Smart Cities 2025, 8, 14. [Google Scholar] [CrossRef]
  23. Bakirci, M. Internet of Things-enabled unmanned aerial vehicles for real-time traffic mobility analysis in smart cities. Comput. Electr. Eng. 2025, 123, 110313. [Google Scholar] [CrossRef]
  24. Khang, A.; Singh, K. Internet of Things (IoT) Smart Sensing Traffic Lights for Revolutionizing Urban Traffic Management. In Driving Green Transportation System Through Artificial Intelligence and Automation: Approaches, Technologies and Applications; Springer Nature: Cham, Switzerland, 2025; pp. 105–118. [Google Scholar]
  25. Xu, Z.; Jiang, T.; Zheng, N. Developing and analyzing eco-driving strategies for on-road emission reduction in urban transport systems-A VR-enabled digital-twin approach. Chemosphere 2022, 305, 135372. [Google Scholar] [CrossRef] [PubMed]
  26. Sellitto, G.P.; Masi, M.; Pavleska, T.; Aranha, H. A cyber security digital twin for critical infrastructure protection: The intelligent transport system use case. In The Practice of Enterprise Modeling: Proceedings of the 14th IFIP WG 8.1 Working Conference, PoEM 2021, Riga, Latvia, 24–26 November 2021; Springer International Publishing: Cham, Switzerland, 2021; pp. 230–244. [Google Scholar]
  27. Belfadel, A.; Hörl, S.; Tapia, R.J.; Politaki, D.; Kureshi, I.; Tavasszy, L.; Puchinger, J. A conceptual digital twin framework for city logistics. Comput. Environ. Urban Syst. 2023, 103, 101989. [Google Scholar] [CrossRef]
  28. Zhou, J.; Yu, M.; Guo, Y.; Li, B.; Ying, S.; Li, Z. A high-definition map architecture for transportation digital twin system construction. Int. J. Appl. Earth Obs. Geoinf. 2025, 144, 104822. [Google Scholar] [CrossRef]
  29. Li, J.; Wang, J. Digital twin-driven management strategies for logistics transportation systems. Sci. Rep. 2025, 15, 12186. [Google Scholar] [CrossRef]
  30. Mądziel, M.; Campisi, T. Predictive Artificial Intelligence Models for Energy Efficiency in Hybrid and Electric Vehicles: Analysis for Enna, Sicily. Energies 2024, 17, 4913. [Google Scholar] [CrossRef]
  31. Xing, L.; Li, B.; Deng, K.; Gao, J.; Wu, H.; Ma, H.; Zhang, X. Advancing intelligent transportation through digital twin: Challenges, models, and future prospects. Ad Hoc Netw. 2025, 181, 104077. [Google Scholar] [CrossRef]
  32. Mądziel, M. Future Cities Carbon Emission Models: Hybrid Vehicle Emission Modelling for Low-Emission Zones. Energies 2023, 16, 6928. [Google Scholar] [CrossRef]
  33. Nag, D.; Brandel-Tanis, F.; Pramestri, Z.A.; Pitera, K.; Frøyen, Y.K. Exploring digital twins for transport planning: A review. Eur. Transp. Res. Rev. 2025, 17, 15. [Google Scholar] [CrossRef]
  34. Chang, X.; Fan, H.; Fu, Y.; Han, C.; Wang, H.; Mao, J. A transformer-based surrogate modeling strategy for tunnel digital twin in full-field displacement prediction under adjacent tunnel construction. Adv. Eng. Inform. 2026, 69, 104045. [Google Scholar] [CrossRef]
  35. Sunny, S.R. Digital twin framework for wind tunnel-based aeroelastic structure evaluation. Authorea 2025. Preprints. [Google Scholar]
  36. Gu, R.; Kuai, X.; He, X.; Lin, H.; Xia, Y. Research and implementation of multilevel visualization of urban traffic flow based on unreal engine. In Proceedings of the Fourth International Conference on Intelligent Traffic Systems and Smart City (ITSSC 2024), Xi’an, China, 23–25 August 2024; SPIE: Cergy-Pontoise, France, 2025; Volume 13422, pp. 686–691. [Google Scholar]
  37. Kocsis, M.; Heinrich, E.; Schnepf, F.; Zöllner, R. Infrastructure Based Detection, Tracking and Modelling of Traffic Participants for Realistic Digital Twin Representation and Behavior Prediction. In Proceedings of the 2025 IEEE Intelligent Vehicles Symposium (IV), Cluj, Romania, 22–25 June 2025; IEEE: New York, NY, USA, 2025; pp. 255–260. [Google Scholar]
  38. Mądziel, M. Impact of Weather Conditions on Energy Consumption Modeling for Electric Vehicles. Energies 2025, 18, 1994. [Google Scholar] [CrossRef]
  39. Mądziel, M. State of Charge Prediction for Li-Ion Batteries in EVs for Traffic Microsimulation. Energies 2025, 18, 4992. [Google Scholar] [CrossRef]
  40. Kwesiga, D.K.; Guin, A.; Hunter, M. Corridor-wide Adaptive Transit Signal Priority based on Reinforcement Learning, and Software in the Loop Simulation. Available online: https://papers.ssrn.com/sol3/papers.cfm?abstract_id=5589455 (accessed on 15 December 2025).
  41. Ištoka Otković, I.; Karleuša, B.; Deluka-Tibljaš, A.; Šurdonja, S.; Marušić, M. Combining traffic microsimulation modeling and multi-criteria analysis for sustainable spatial-traffic planning. Land 2021, 10, 666. [Google Scholar] [CrossRef]
  42. Oikonomou, M.G.; Ziakopoulos, A.; Yannis, G. Advancing traffic microsimulation: A systematic review of parameter selection for connected and autonomous vehicles. J. Simul. 2025, 1–38. [Google Scholar] [CrossRef]
  43. Erol, D.; Baskan, O. Developing a Capacity Model for Roundabouts Using SIDRA Calibrated via Simula-tion-Based Optimization. Sustainability 2025, 17, 10289. [Google Scholar] [CrossRef]
  44. Qin, M.X.; Tang, T.Q.; Wen, S.W.; Yuan, X.T. Risk analysis of pedestrian crosswalks in airport drop-off zones based on integrated VISSIM–SSAM model. Accid. Anal. Prev. 2026, 224, 108279. [Google Scholar] [CrossRef]
  45. Akbarpoor, H.; Monajjem, S. Innovative Algorithms for VISSIM Microsimulation Calibration and Traffic Breakdown Modeling at On-Ramp Bottlenecks. In Operations Research Forum; Springer International Publishing: Cham, Switzerland, 2025; Volume 6, p. 59. [Google Scholar]
  46. Szarata, M.; Olszewski, P.; Bichajło, L. Simulation study of dynamic bus lane concept. Sustainability 2021, 13, 1302. [Google Scholar] [CrossRef]
  47. Fortuijn, L.G. Turbo roundabouts: Design principles and safety performance. Transp. Res. Rec. 2009, 2096, 16–24. [Google Scholar] [CrossRef]
  48. Vasconcelos, L.; Silva, A.B.; Seco, Á.M.; Fernandes, P.; Coelho, M.C. Turboroundabouts: Multicriterion assessment of intersection capacity, safety, and emissions. Transp. Res. Rec. 2014, 2402, 28–37. [Google Scholar] [CrossRef]
  49. Gallelli, V.; Perri, G.; Vaiana, R. Operational and safety management at intersections: Can the turbo-roundabout be an effective alternative to conventional solutions? Sustainability 2021, 13, 5103. [Google Scholar] [CrossRef]
  50. Ciuffo, B.; Punzo, V.; Torrieri, V. Comparison of simulation-based and model-based calibrations of traffic-flow microsimulation models. Transp. Res. Rec. 2008, 2088, 36–44. [Google Scholar] [CrossRef]
  51. Deng, T.; Zhang, K.; Shen, Z.J.M. A systematic review of a digital twin city: A new pattern of urban governance toward smart cities. Journal of management science and engineering 2021, 6, 125–134. [Google Scholar] [CrossRef]
  52. Batty, M. Digital twins. Environ. Plan. B Urban Anal. City Sci. 2018, 45, 817–820. [Google Scholar] [CrossRef]
  53. Mądziel, M. Predictive methods for CO2 emissions and energy use in vehicles at intersections. Sci. Rep. 2025, 15, 6463. [Google Scholar] [CrossRef]
  54. Olczyk, M.; Kuc-Czarnecka, M. European Green Deal Index: A new composite tool for monitoring European Union’s Green Deal strategy. J. Clean. Prod. 2025, 495, 145077. [Google Scholar] [CrossRef]
  55. Charłampowicz, J.; Mathiyazhagan, K.; Saikouk, T.; Gwalani, H. Strategic evaluation of European Inland transport companies for European green deal compliance: A multi-criteria decision making-analysis. J. Environ. Manag. 2025, 374, 124105. [Google Scholar] [CrossRef]
  56. Bais, R.G.; Kumar, V.; Joshi, M.; Sharma, J.; Borkar, P.; Hossain, M.A. Role of AI and Digital Twin for Smart Transportation. In 6G Urban Innovation: AI and Digital Twin for Next-Gen Sustainable Cities; ISTE: London, UK, 2025; pp. 123–142. [Google Scholar]
  57. Wakhare, P.; Patil, P.; Bakare, A.A.; Nikam, R.; Kumar, V.; Sood, Y.; Kose, U. 6G-enabled Digital Twin for Smart Transportation. In 6G Urban Innovation: AI and Digital Twin for Next-Gen Sustainable Cities; ISTE: London, UK, 2025; pp. 143–162. [Google Scholar]
  58. Zong, Z.; Feng, T.; Wang, J.; Xia, T.; Li, Y. Deep Reinforcement Learning for Demand-Driven Services in Logistics and Transportation Systems: A Survey. ACM Trans. Knowl. Discov. Data 2025, 19, 1–42. [Google Scholar] [CrossRef]
  59. Chen, J.; Huang, D.; Wang, Y.; Yu, Z.; Zhao, Z.; Cao, X.; Liu, Y.; Quek, T.Q.S.; Wu, D.O. Enhancing Routing Performance through Trajectory Planning with DRL in UAV-aided VANETs. IEEE Trans. Mach. Learn. Commun. Netw. 2025, 3, 517–533. [Google Scholar] [CrossRef]
  60. Alqubaysi, T.; Asmari, A.F.A.; Alanazi, F.; Almutairi, A.; Armghan, A. Federated learning-based predictive traffic management using a contained privacy-preserving scheme for autonomous vehicles. Sensors 2025, 25, 1116. [Google Scholar] [CrossRef]
Figure 1. The examined area of the road network.
Applsci 16 00678 g001
Figure 2. Schematic diagram of the data collection process.
Applsci 16 00678 g002
Figure 3. View of the simulated model under investigation: 1. Conventional roundabout 2. Turbo roundabout 3. Flyover-based grade-separated junction.
Applsci 16 00678 g003
Figure 4. Framework architecture diagram.
Applsci 16 00678 g004
Figure 5. Comparison of average stop delays [s] for different approaches across analyzed scenarios.
Applsci 16 00678 g005
Figure 6. Level of Service (LOS) distribution for different approaches in analyzed variants. 1—A, 2—B, 3—C, 4—D, 5—E, 6—F.
Applsci 16 00678 g006
Figure 7. Average queue lengths (QLEN) [m] observed in simulation scenarios.
Applsci 16 00678 g007
Figure 8. Speed profile for the conventional roundabout showing velocity drops near the intersection area.
Applsci 16 00678 g008
Figure 9. Comparison of average, minimum, and maximum speeds across all scenarios.
Applsci 16 00678 g009
Figure 10. Detailed speed trajectories for Conventional, Turbo, and Flyover variants.
Applsci 16 00678 g010
Table 1. Observed hourly traffic volumes at each approach to the Pobitno Roundabout during regular and peak hours.
InletRegular Hour (veh/h)Peak Hour (veh/h)Growth Factor
Inlet 1—Aleja Armii Krajowej4548621.90
Inlet 2—Aleja Żołnierzy I Armii Wojska Polskiego3838382.19
Inlet 3—Aleja Lwowska (West)3996721.69
Inlet 4—Aleja Lwowska (East)3486911.99
TOTAL—Roundabout158434832.20
Table 2. Results of GEH indicator.
ObservedPredictedGEHInlet No.
4544680.6520451
3833910.4066632
3994120.6455773
3483640.8479984
Table 3. VISSIM Simulation Parameters and Configuration Settings for the Pobitno Roundabout Model.
ParameterValueRemarks/Source
Simulation softwarePTV VissimMicrosimulation environment
Car-following modelWiedemann 74Default Vissim model
Lane-changing modelDefaultVissim default settings
Vehicle classesPassenger cars, Heavy vehiclesSimplified fleet structure
Heavy vehicle shareAccording to ZTM dataEmpirical reference
Desired speed (passenger cars)Default urban distributionVissim default
Desired speed (heavy vehicles)Default urban distributionVissim default
Standstill distance2.0 mVissim default
Look-ahead distance250 mVissim default
Simulation duration3800 sIncluding warm-up
Warm-up time200 sNo data collection
Effective analysis period3600 sSteady-state operation
Random seedMultiple seeds (n = 10) for uncertainty mitigationVolume-based calibration
Calibration criterionGEH statisticEmpirical ZTM data
Table 4. Aggregate comparison of average stop delays for all simulated scenarios.
ScenarioAverage Stop Delay [s]
Conventional Roundabout (Regular Hour)~0.5
Conventional Roundabout (Peak Hour)~4.8
Turbo-Roundabout (Regular Hour)~2.0
Turbo-Roundabout (Peak Hour)~28.5
Flyover Interchange (Regular Hour)~0.2
Flyover Interchange (Peak Hour)~2.0
Disclaimer/Publisher’s Note: The statements, opinions and data contained in all publications are solely those of the individual author(s) and contributor(s) and not of MDPI and/or the editor(s). MDPI and/or the editor(s) disclaim responsibility for any injury to people or property resulting from any ideas, methods, instructions or products referred to in the content.