The experimental plan was designed to comprehensively evaluate the suitability of waste mirror glass (MGW) as an aggregate in geopolymer composites by linking the properties of the raw material with the resulting microstructure and performance of the composites. The chemical and phase compositions of the raw MGW and geopolymer composites (MGW-G) were determined using XRF and XRD analyses. The characterization of the metallic layers present on the glass surface and the effect of MGW incorporation on the composite microstructure were investigated using SEM and EDS analyses, while porosity measurements were used to assess changes in pore structure induced by the glass aggregate. Thermogravimetric (TG) and FTIR analyses were employed to evaluate the thermal stability and the formation of geopolymer bonds in the composites, respectively. Mechanical properties were evaluated using flexural and compressive strength tests as the primary performance indicators. In addition, thermal conductivity (λ), thermal diffusivity (α), and volumetric heat capacity were measured to assess the thermal performance of the composites and their potential applicability in construction-related applications.
3.1. The Characterization of Mirror Glass Waste
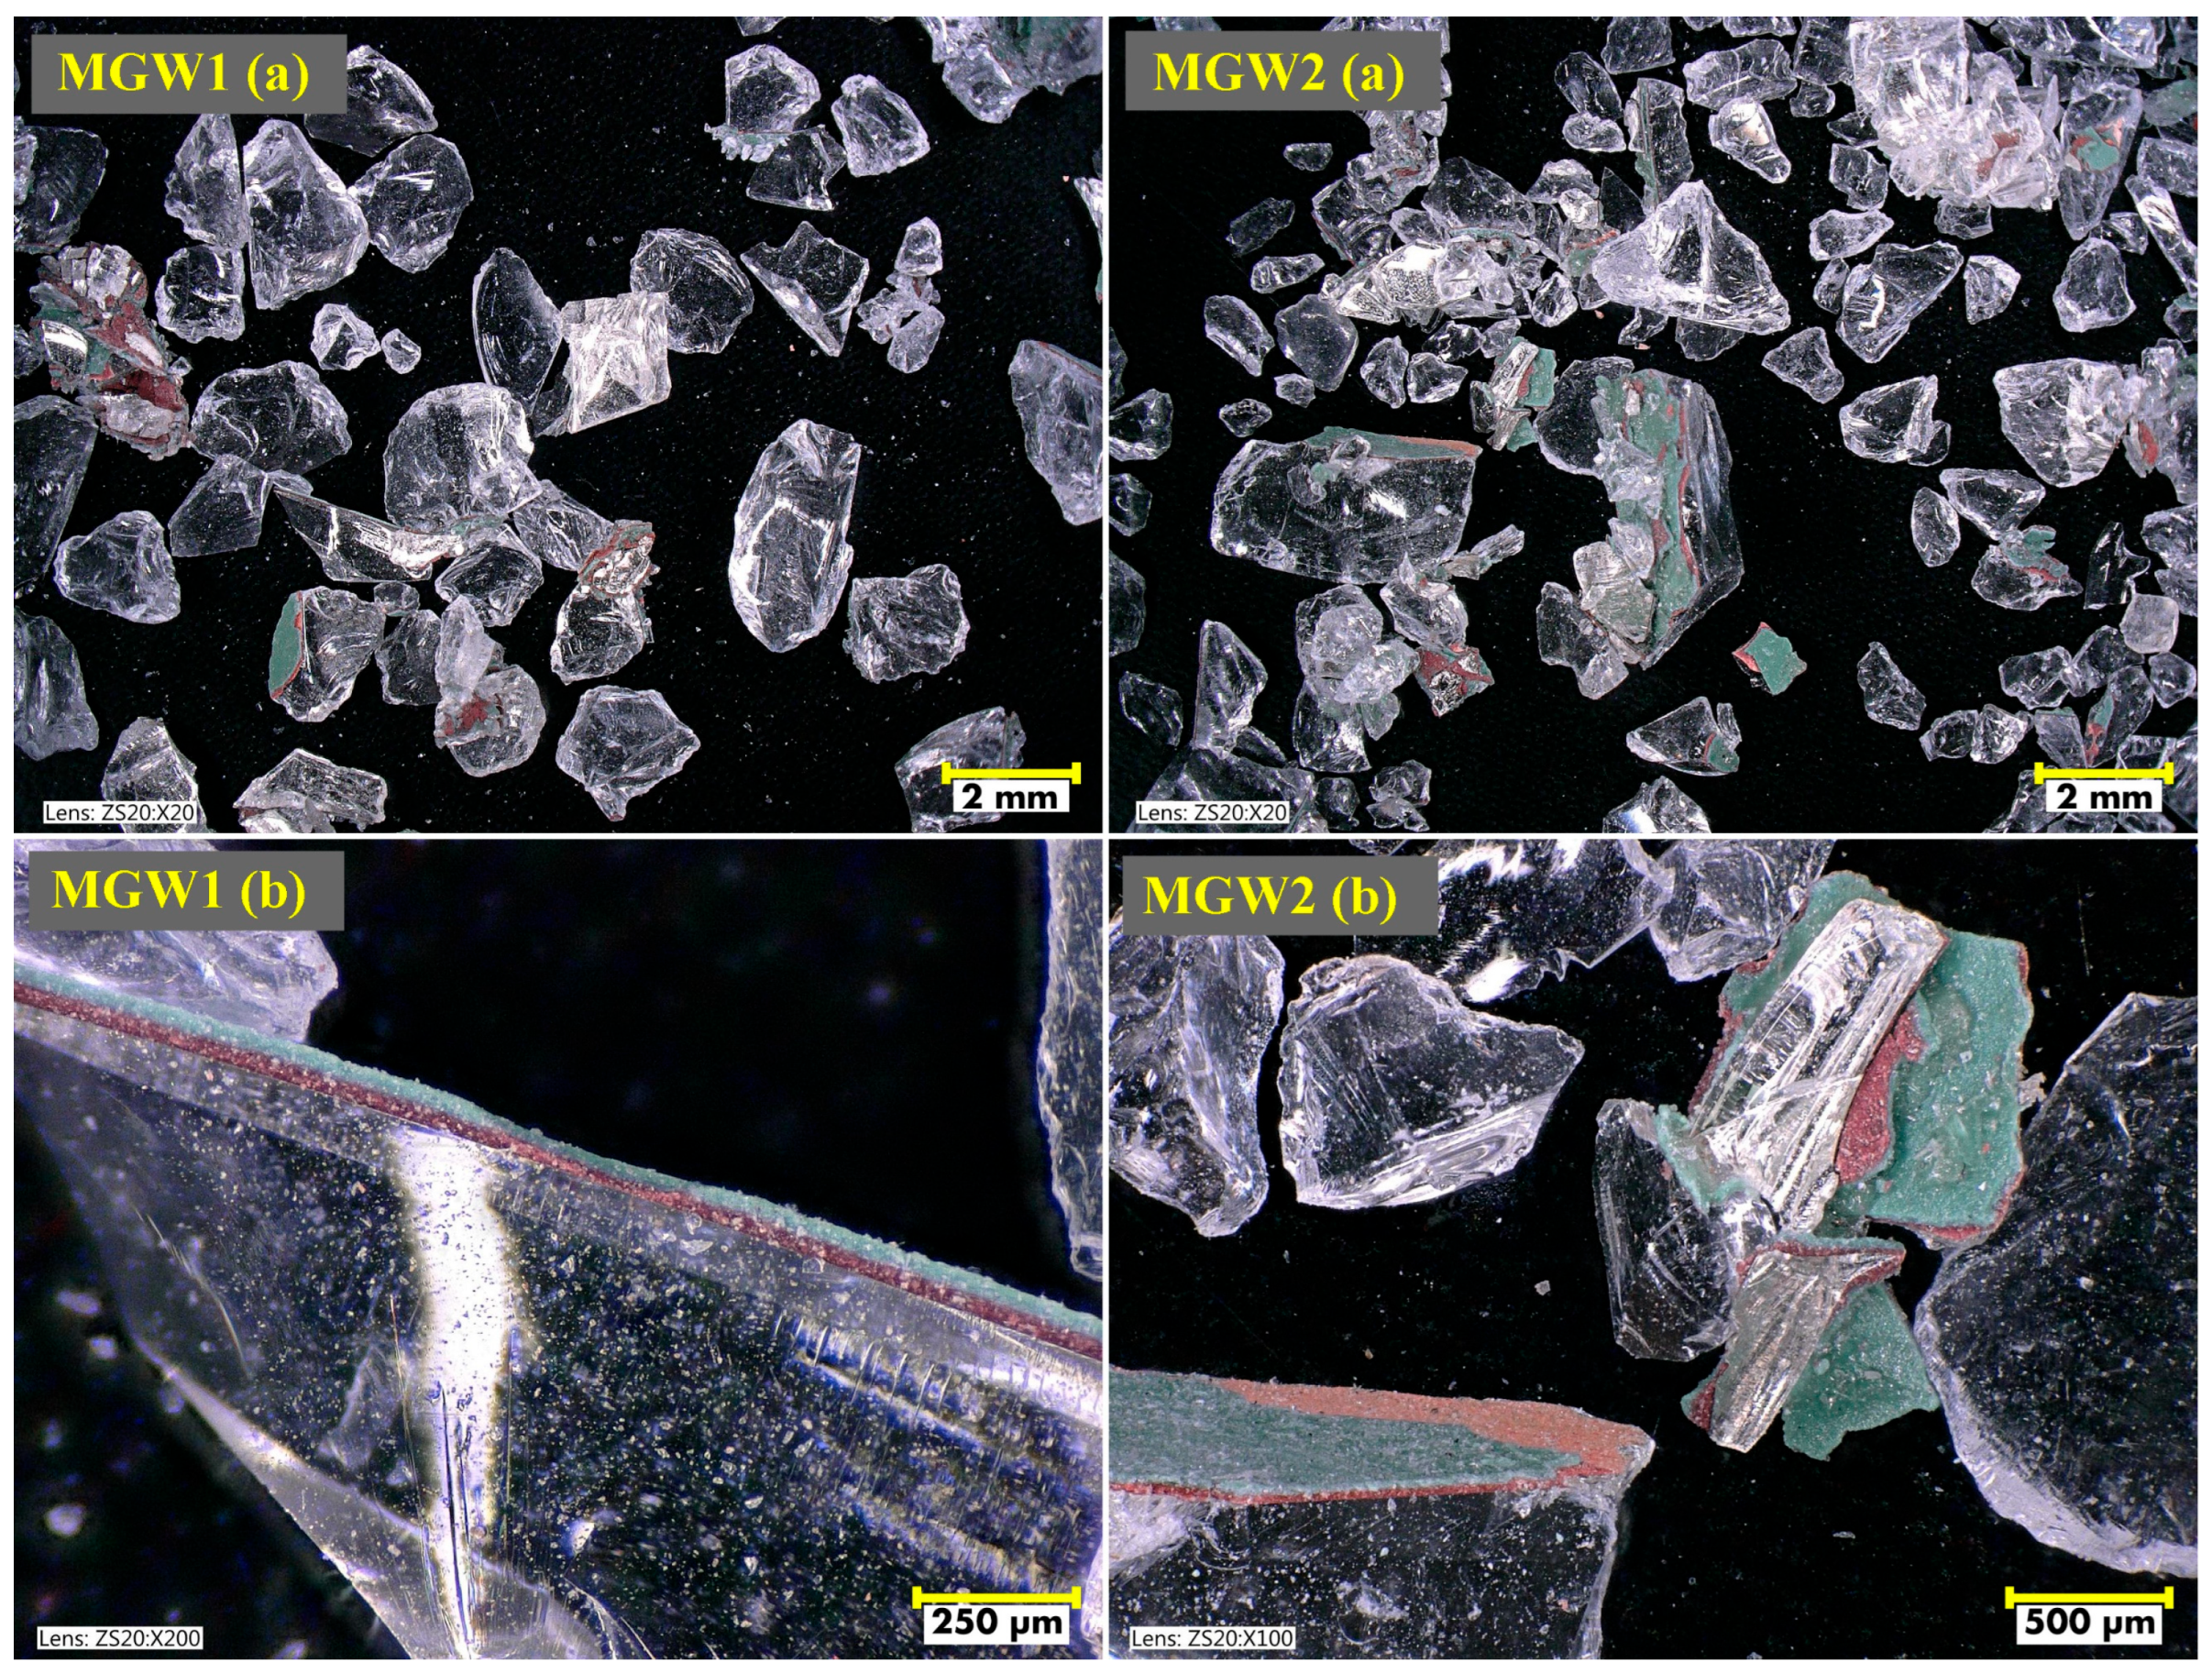
Figure 1 shows the mirror glass debris MGW1 and MGW2, observed using a digital microscope. The particles exhibit irregular, non-spherical shapes with sharp edges and a wide range of sizes. Residual layers originating from the original mirror coating are visible on the surface of some particles.
The chemical analysis of two types of mirror glass waste (MGW1 and MGW2), presented in
Table 2, has revealed a very similar composition typical of soda-lime glass. Both samples contain approximately 69% of SiO
2, confirming their predominantly silicate character. There is also a significant proportion of Na
2O (about 10%) and CaO (about 11%), which act as fluxing components and glass stabilizers. The MgO content is around 4.6%, whereas Al
2O
3 is present only in low concentrations (0.5–0.6%). The loss on ignition (LOI) is low (~1.5–1.6%), indicating that the material is predominantly inorganic in nature and does not contain significant amounts of volatile components or organic admixtures.
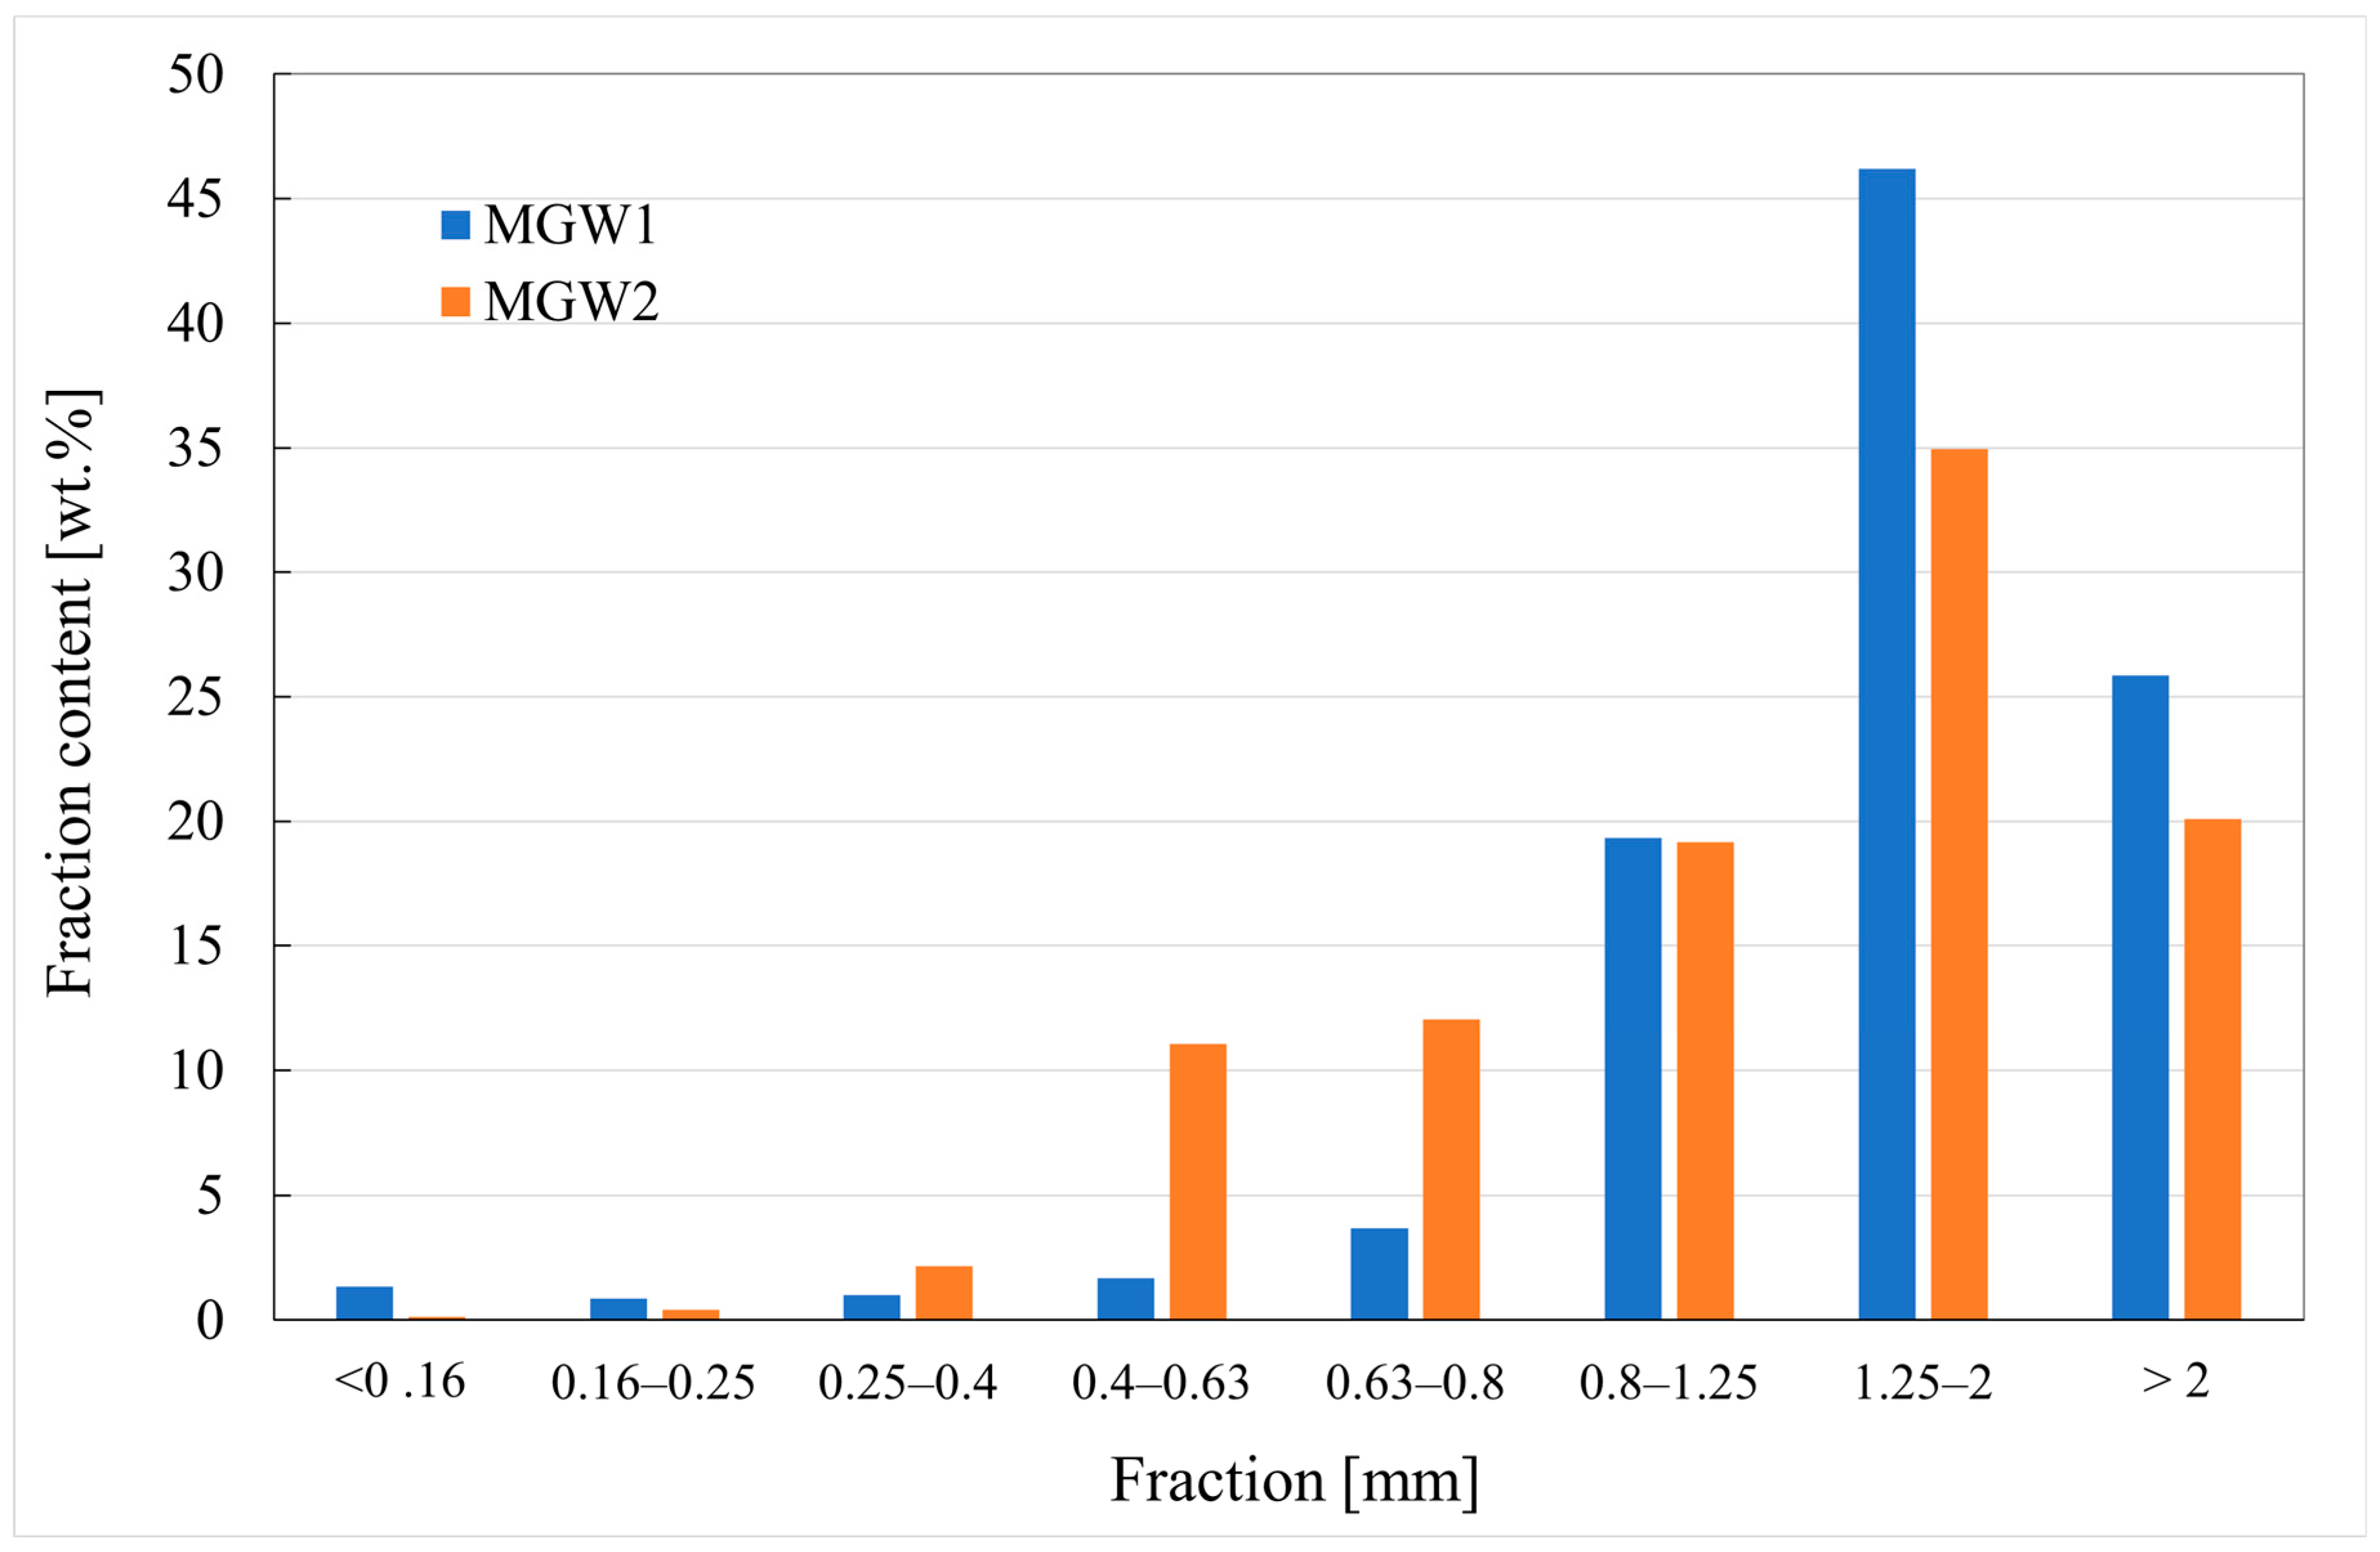
The grain-size distributions of the MGW1 and MGW2 fractions determined by sieving show similar characteristics, with slight differences in the proportion of each fraction (
Figure 2). In both samples, there is a predominance of particles larger than 1.25 mm, accounting for approximately 72% in MGW1 and 55% in MGW2. MGW2 contains a higher proportion of medium-fine fractions (mainly 0.4–0.8 mm) than MGW1, which may slightly affect its workability or the structure of the resulting material. The proportion of fine particles (<0.4 mm) is relatively low in both materials, with its being slightly higher in MGW2 than in MGW1.
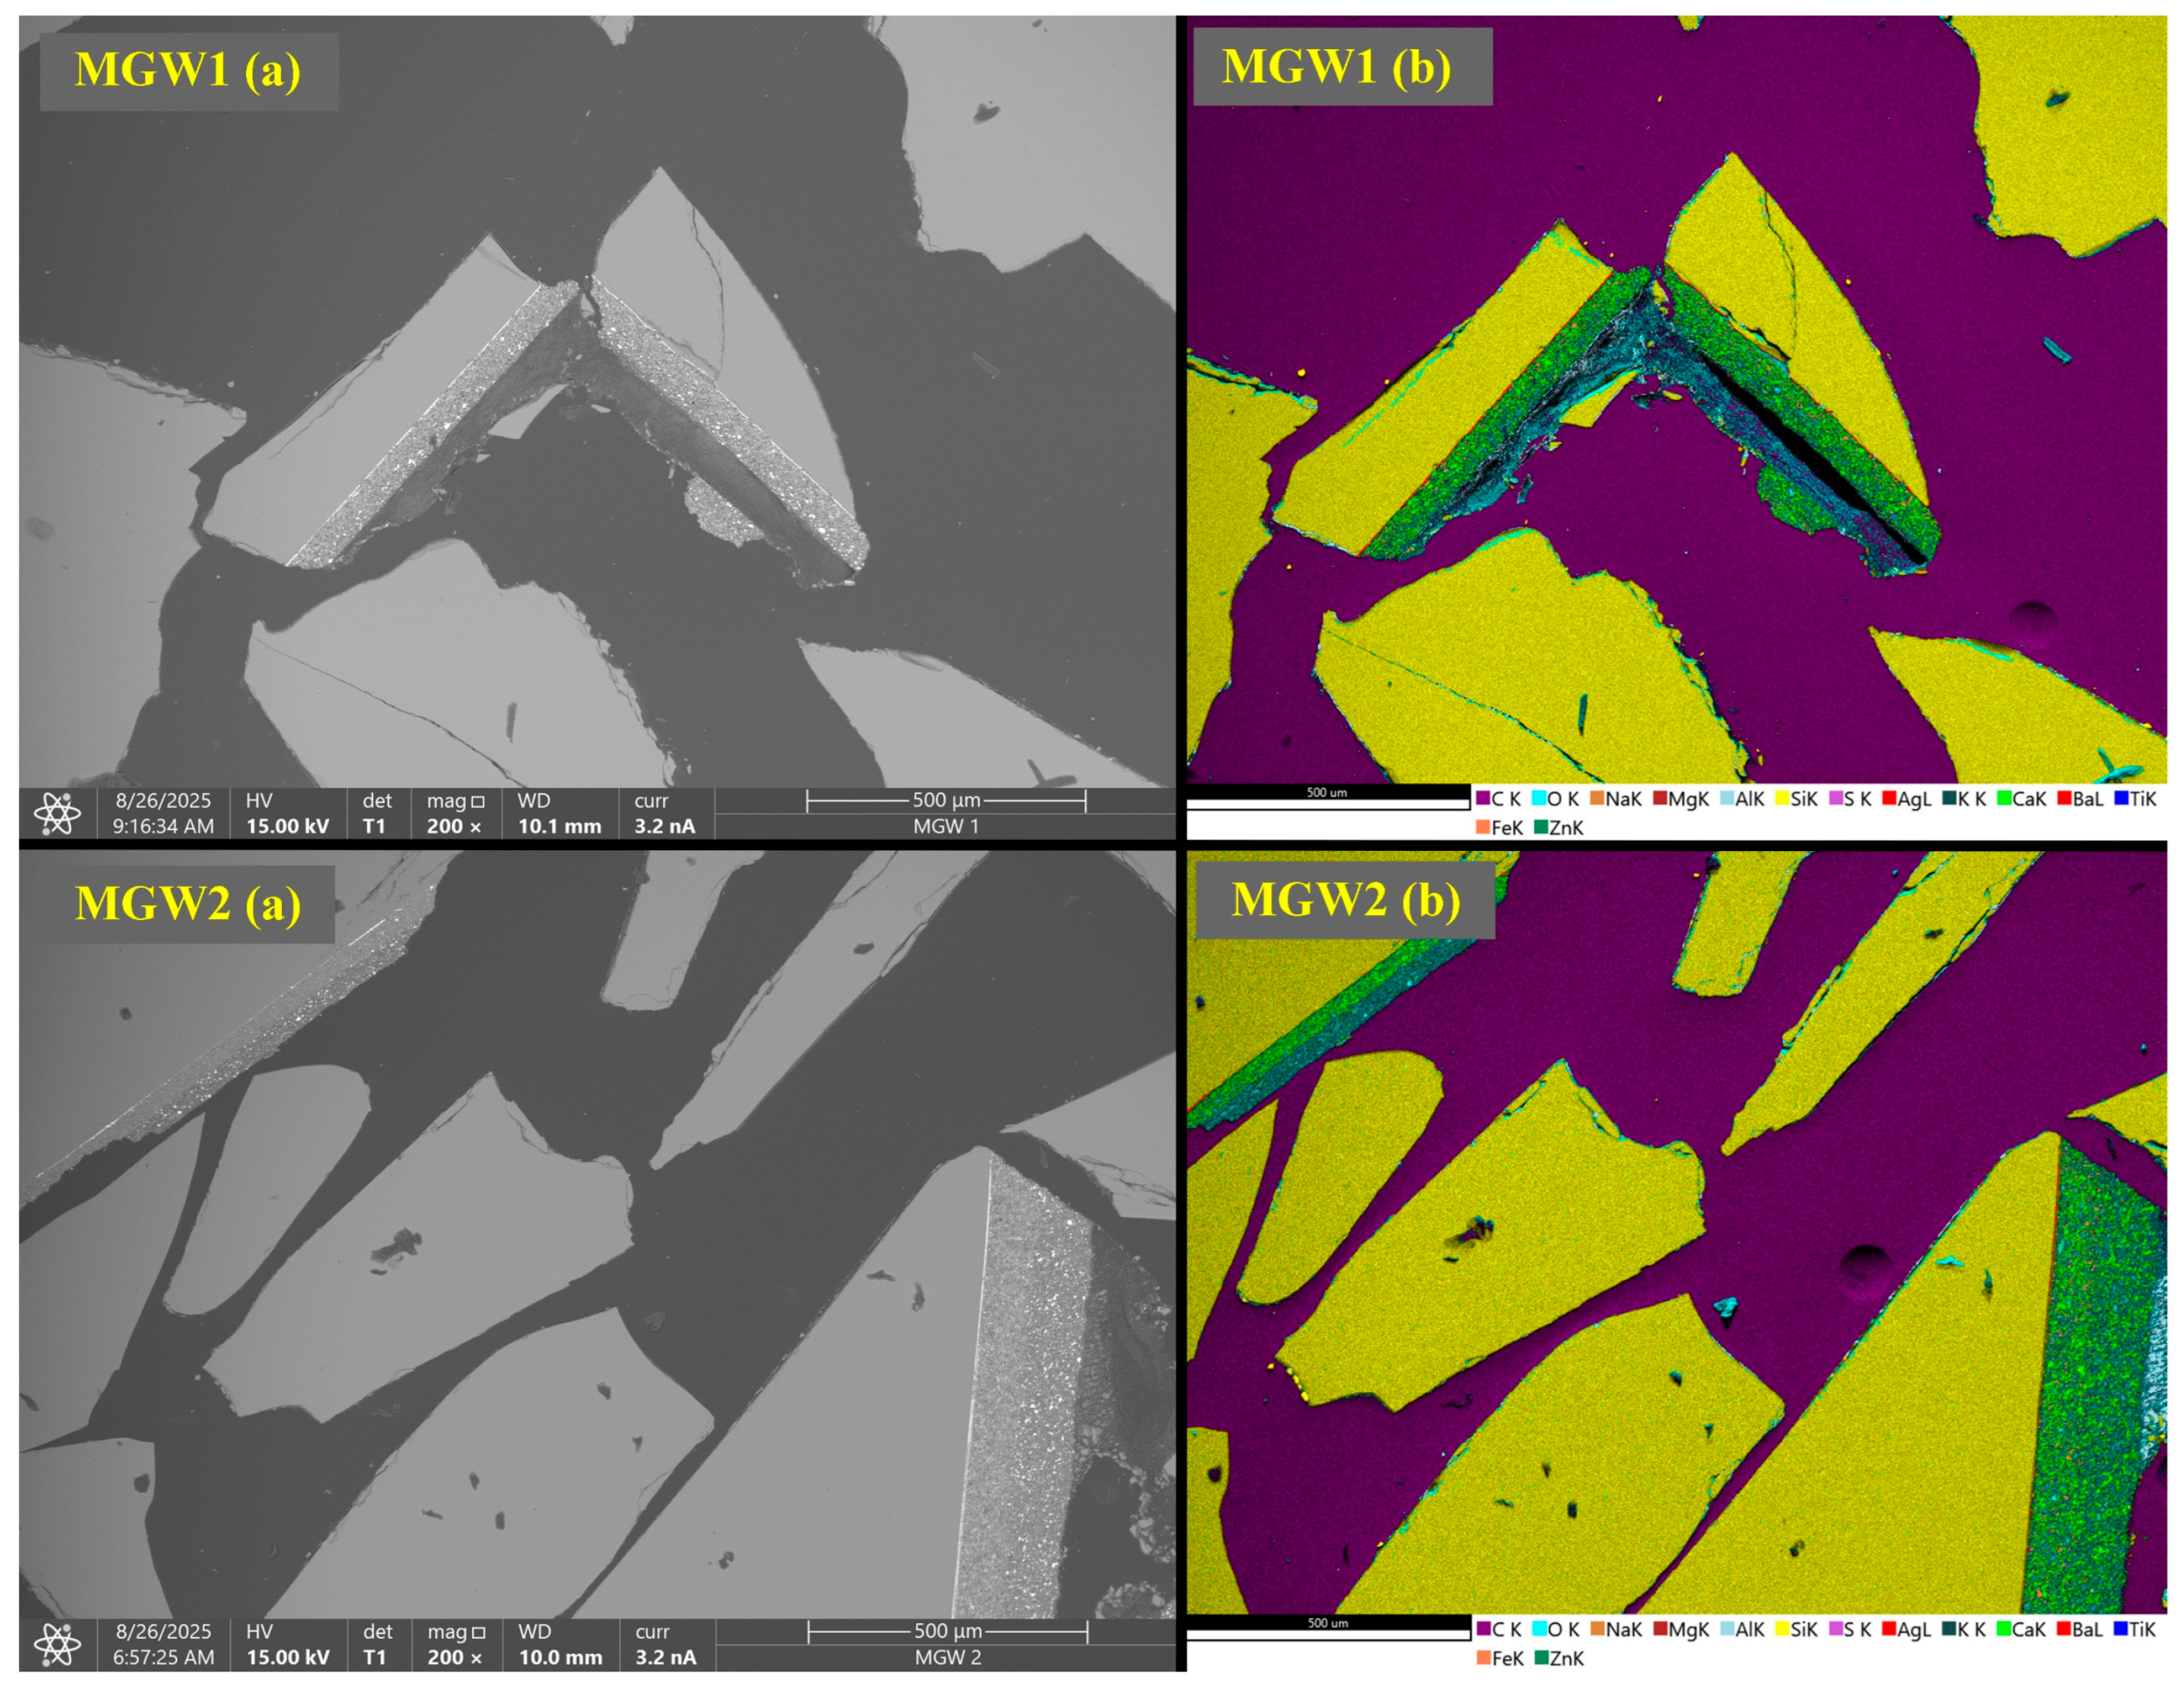
Figure 3 shows SEM images (a) and EDS maps (b) of the mirror glass waste samples MGW1 and MGW2. Detailed EDS analyses of both types of MGW are presented in
Figures S1 and S2 and in Tables S3 and S4 of the Supplementary Materials. The results are consistent with the chemical analysis of both types of mirror glass waste (
Table 2). The glass matrix consists mainly of silicon, oxygen, sodium and calcium, corresponding to soda-lime glass.
The layers forming the mirror are clearly visible in the SEM images. EDS maps of the cross-sections (MGW1 and MGW2, 200×) and EDS analyses reveal the presence of three thin coatings. The first layer contains predominantly silver (Ag) with minor traces of silicon (Si) and sulfur (S). The second layer consists of calcium (Ca) accompanied by zinc (Zn), magnesium (Mg) and silicon (Si). The third layer is formed by barium (Ba), silicon (Si), calcium (Ca), magnesium (Mg), sulfur (S) and titanium (Ti). These elements correspond to a typical mirror structure—a silver reflective layer deposited on barium-based backing layers (likely BaSO
4 and/or BaTiO
3), possibly covered by a zinc-containing protective paint [
31,
32,
33,
34]. Minor traces of Fe and Al are also present.
From the mineralogical point of view (
Table 3), both MGW samples contain the majority of the amorphous phase (over 98 wt.%) and trace amounts of quartz, calcite and zincite (up to 0.5 wt.%).
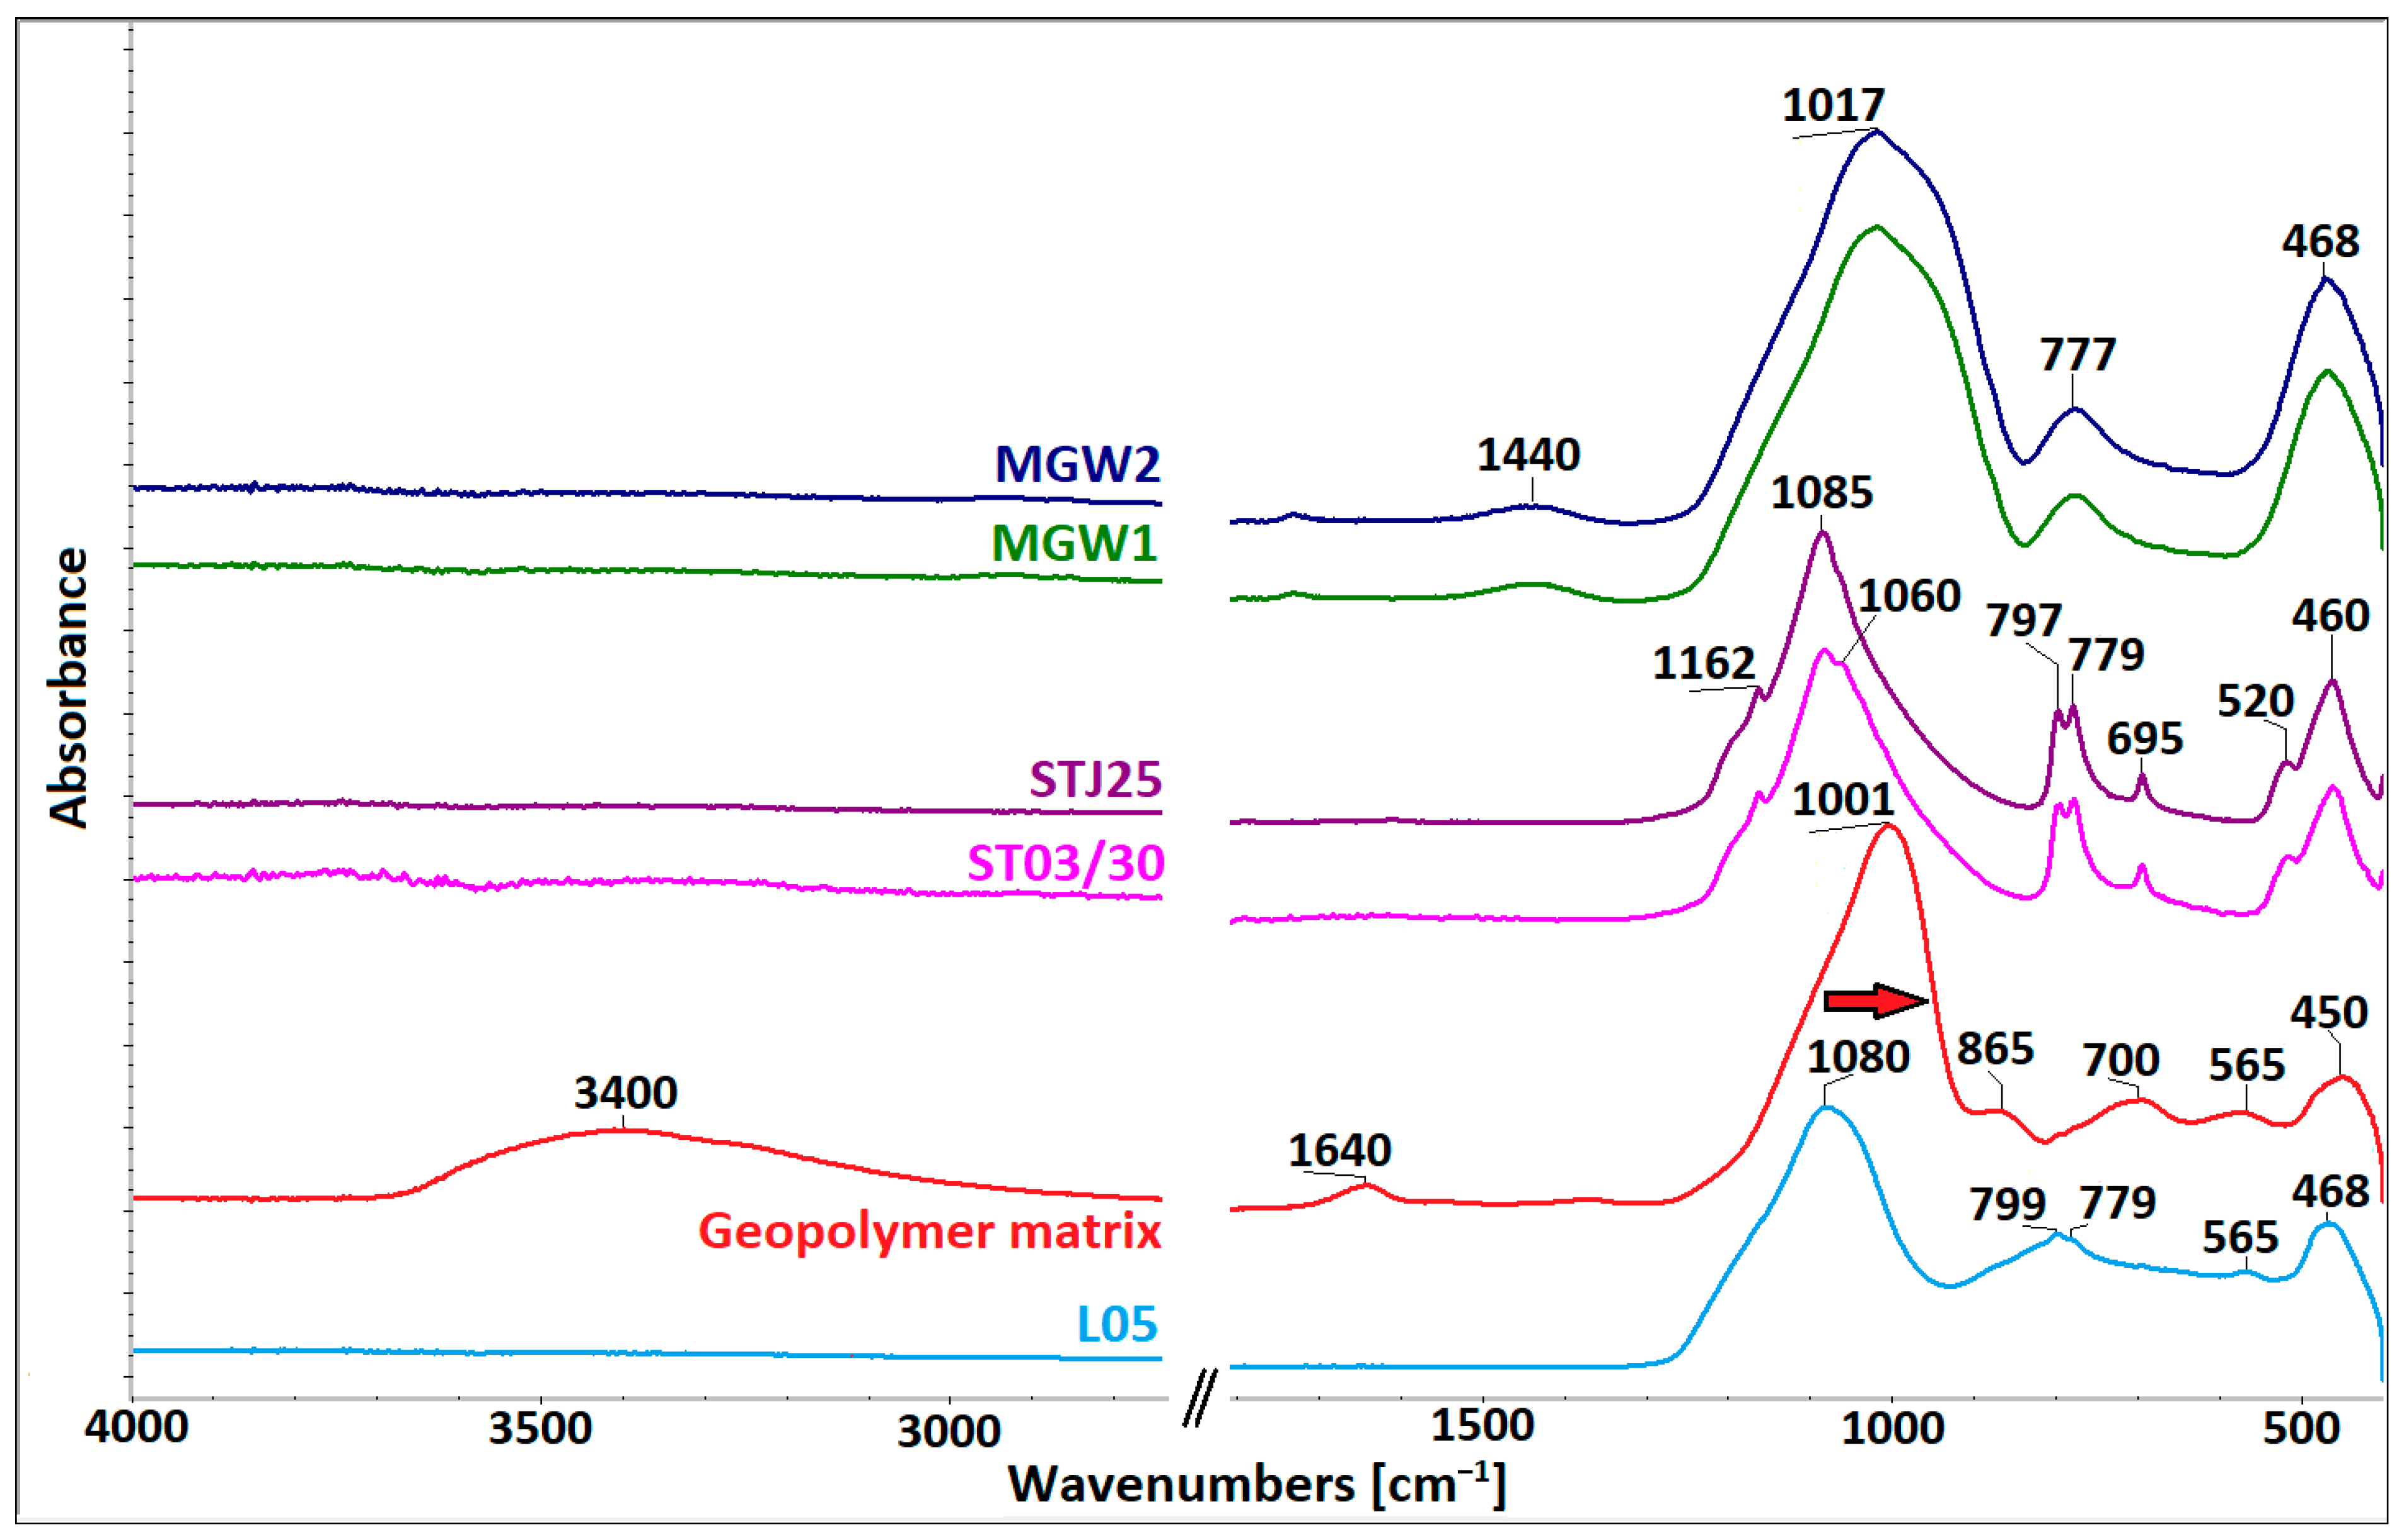
The ATR-FTIR spectra of all input materials and their comparison with the L05 clay material and the geopolymer matrix are shown in
Figure 4.
The clay material (L05) shows broad bands associated with the asymmetric stretching and bending of Si–O, as well as the asymmetric stretching of Si–O–Al groups, at 1080 cm
−1, ~780 cm
−1, and 468 cm
−1. Distinct peaks at 799 and 779 cm
−1 indicate the presence of quartz [
35] as a minor impurity. Alkaline activation of L05 and the subsequent formation of the geopolymer matrix are indicated by a shift in the main Si–O–T asymmetric stretching band from 1080 cm
−1 to 1001 cm
−1 (red arrow in
Figure 4). This change reflects the incorporation of AlO
4 units into SiO
4 tetrahedra, forming a Si–O–Al network [
36,
37]. Additional weak band at 865 cm
−1 arises from Si–OH bending [
38], while the shoulder near 560 cm
−1 is attributed to silicates or aluminosilicates with long-range order [
39]. Bands at 3400 cm
−1 and 1640 cm
−1 correspond to the stretching and bending of OH groups in water, indicating residual moisture in geopolymer matrix [
40].
The ATR-FTIR spectra of MGW1 and MGW2 mirror glass waste samples exhibit identical spectral features. They display a broad, intense band between 1250 and 840 cm
−1 with a peak at 1017 cm
−1, and a band at 450–470 cm
−1, attributed to O–Si–O bending (ν
4) and Si–O asymmetric stretching (ν
3) in SiO
4 tetrahedra [
35]. A weak band at 777 cm
−1 reflects Si–O–Si symmetric stretching of bridging oxygens [
41], while another at 1440 cm
−1 corresponds to the asymmetric stretching of C–O bond and out-of-plane bending of O-C-O in carbonate groups. The major absorption band in the spectra of STJ25 and ST03/30 is located at 1200–850 cm
−1. This broad band contains several subbands assigned to asymmetric stretching vibrations belonging to various optically active symmetries (A2 and E) in quartz [
42]. The remaining absorption features located in the region of 800–400 cm
−1 are attributable to symmetric stretching and to the Si–O–Si bending in SiO
4, respectively [
43]. The differences in the ST spectra are related to the width of the main absorption band at 1200–850 cm
−1; the material ST03/30 exhibits broadening of the entire envelope, which may be attributed to decreased internal order, i.e., reduced crystallinity [
44].
3.2. The Characterization of Geopolymer Composites
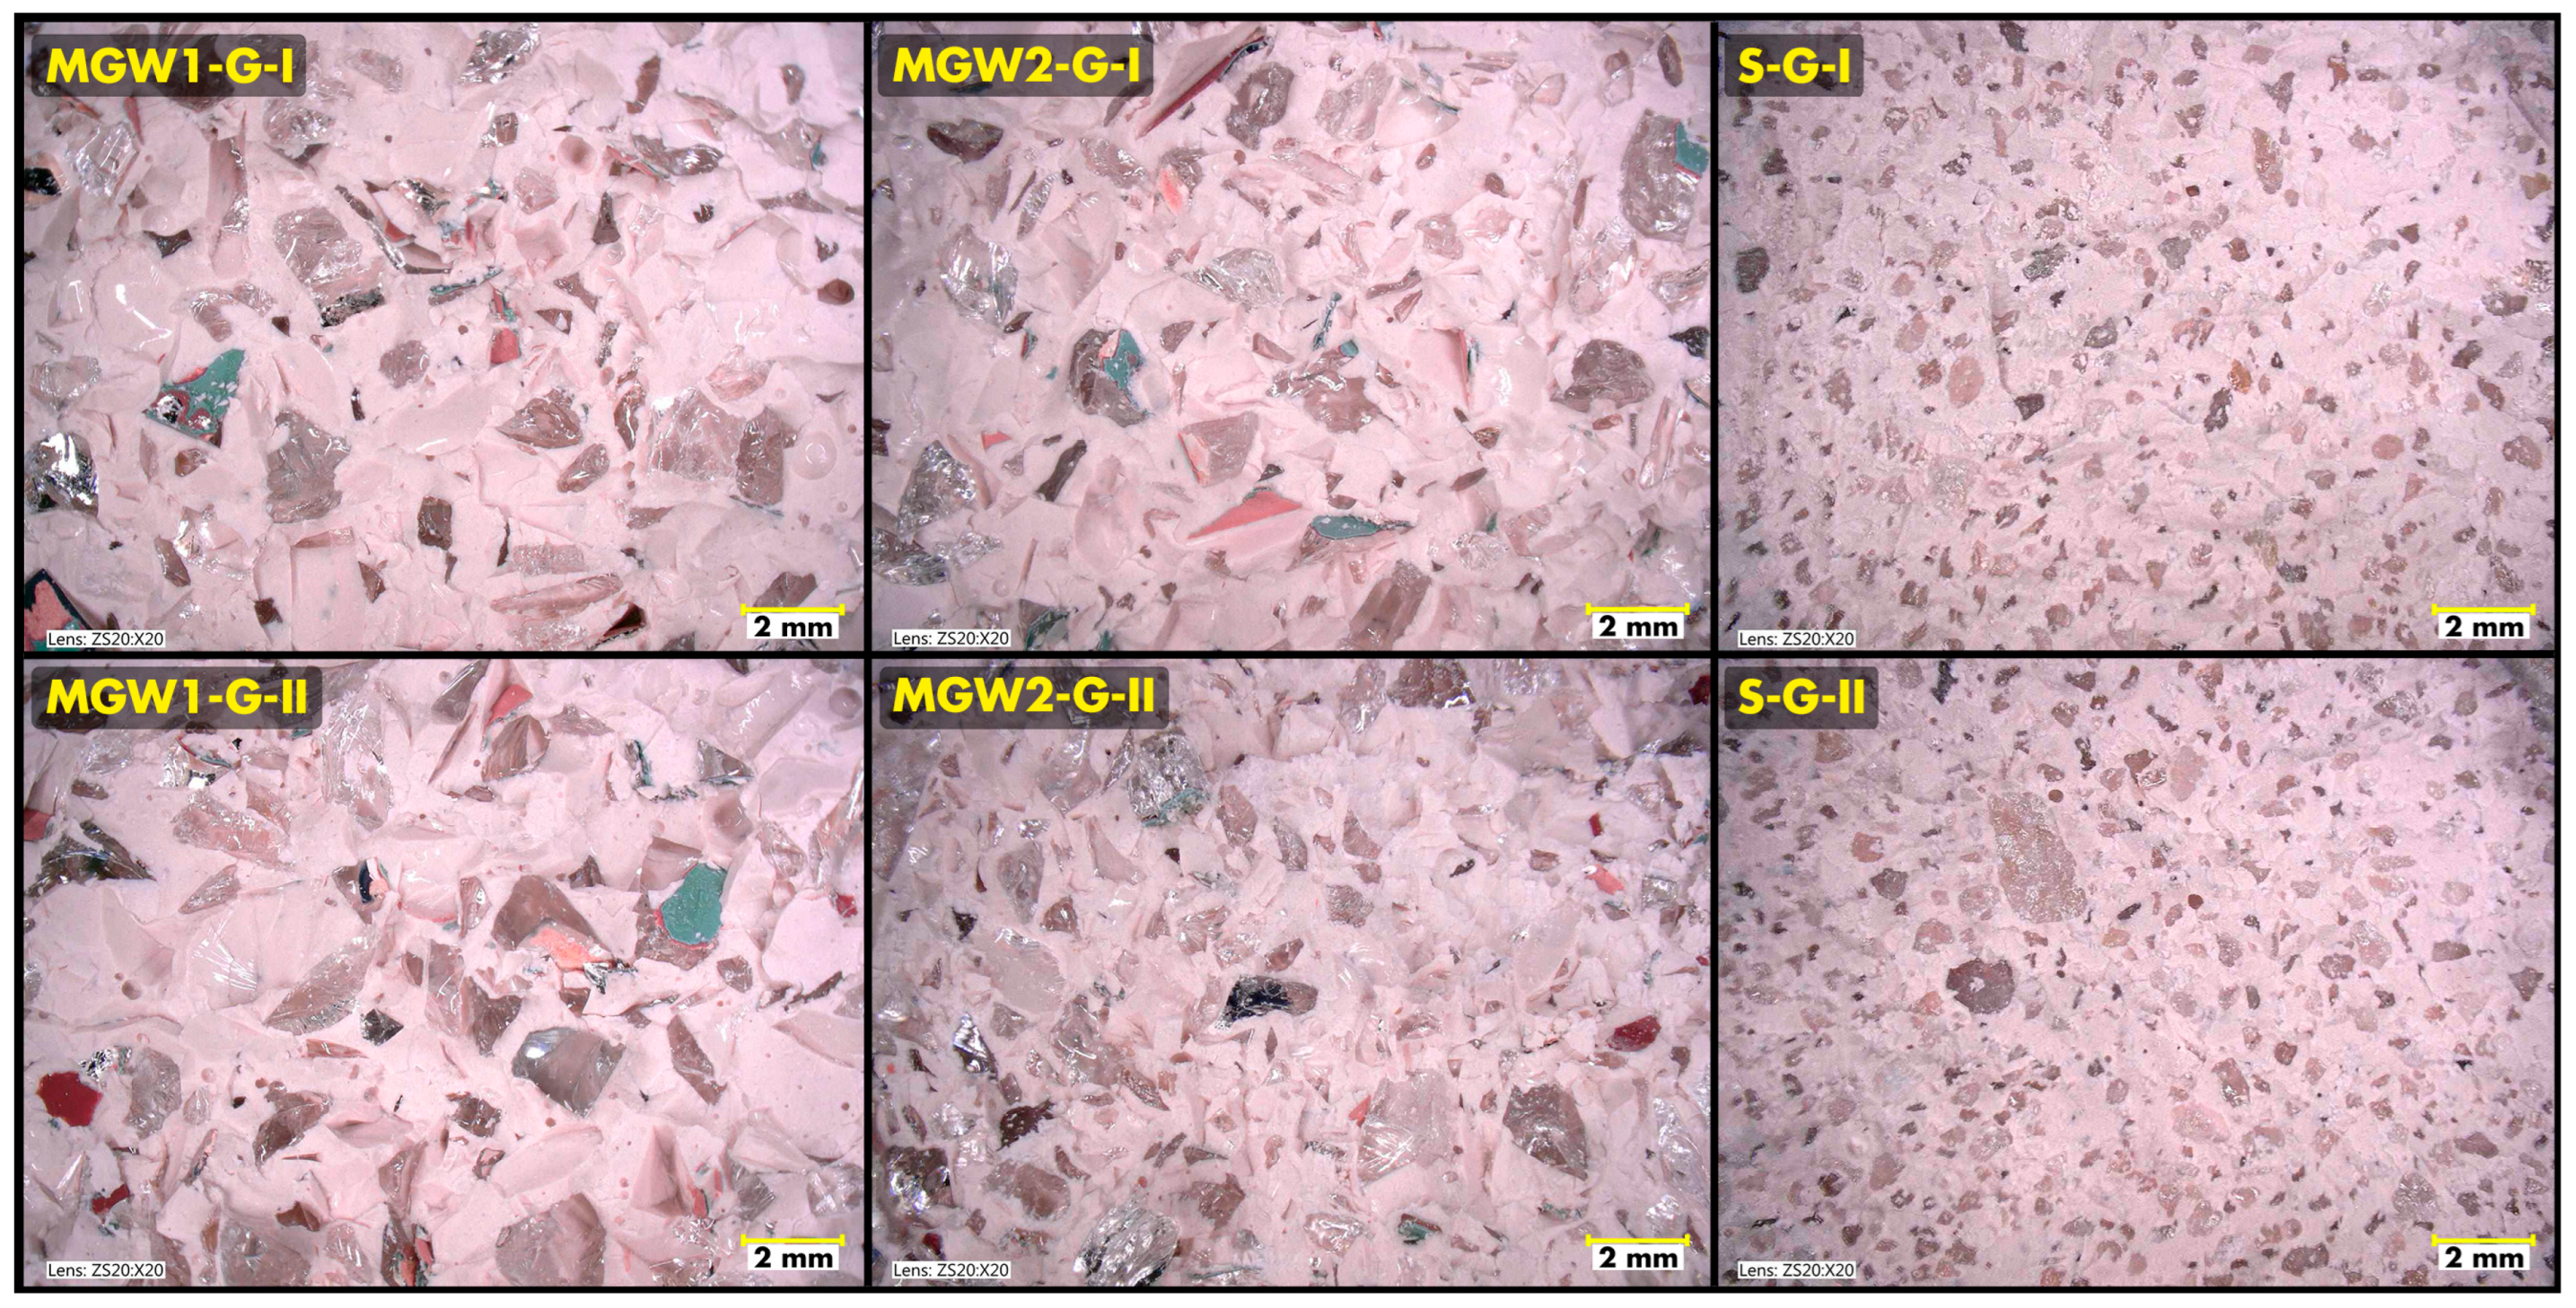
Digital-microscope images (
Figure 5) have revealed clear differences in the distribution and morphology of the aggregates used in geopolymer composites on their fracture surfaces. In both MGW1 and MGW2 systems, mirror glass waste appears as angular, reflective fragments that are well embedded in the geopolymer matrix. An increase in aggregate content from variant I to II results in a visibly denser distribution of MGW particles, although the overall distribution remains relatively uniform. MGW2 exhibits slightly finer and more heterogeneous fragments than MGW1, which is consistent with the granulometric analysis (
Figure 2). In contrast, sand-based composites (S-G-I and S-G-II) have displayed a much more homogeneous microstructure with uniformly sized, rounded particles and a more continuous matrix phase. The smoother morphology of sand composites may contribute to their slightly higher mechanical strength observed in the tested systems. Overall, the images confirm the effective incorporation of both types of mirror glass waste while highlighting the internal morphological differences between recycled glass and natural sand.
The chemical composition of geopolymer samples (
Table 4) varies significantly depending on the type and quantity of the aggregate used. Samples with mirror glass aggregate (MGW1-G, MGW2-G) exhibit higher contents of alkali oxides (Na
2O, K
2O) and CaO than samples with silica sand (S-G), indicating partial reactivity of glass aggregate in an alkaline environment [
45]. As the aggregate content increases (variant II), there is generally a slight increase in SiO
2 and a corresponding decrease in Al
2O
3 and alkali oxides, consistent with the dilution of the geopolymer matrix by the inactive component. This trend is most pronounced in samples with inert sand, where higher aggregate content leads to a more significant decrease in active components and a parallel increase in SiO
2.
Loss-on-ignition (LOI) observed in the hardened mixtures probably reflects the release of physically and chemically bound water and the decomposition of partially carbonated reaction products in the binder during heating to 1000 °C. For this reason, LOI values are generally higher in samples with lower aggregate content, where the proportion of binder is higher. These assumptions are further discussed and supported by XRD results and thermal analysis presented later in the manuscript.
The data obtained confirm that both the type and the amount of aggregate significantly influence the chemical composition and, consequently, the potential reactivity and properties of geopolymer composites, which is consistent with the literature [
46,
47].
The results presented in
Table 5 show that the flexural strength of samples with waste mirror glass (MGW-G) was significantly lower than that of sand-based reference geopolymers (S-G) at all curing stages. MGW-based samples achieved values between 3.9 and 5.7 MPa, while S-G mixtures reached 8–11 MPa. For all samples, flexural strength increased slightly from 7 to 28 days, indicating ongoing geopolymerization, followed by a slight decrease or stabilization after 90 days.
Among MGW-based mixtures, MGW2-G variants generally exhibited slightly higher flexural strength than MGW1-G, which may be related to differences in the particle size distribution or surface properties of the glass aggregate, affecting the matrix–aggregate interface. The differences between variants I and II (i.e., lower and higher aggregate contents, respectively) were small, suggesting that the aggregate content had only a limited effect on flexural strength.
The compressive-strength results summarized in
Table 6 show a trend similar to that of flexural strength (
Table 5). Geopolymers with sand (S-G) achieved the highest values, reaching up to 93.5 MPa after 28 days, whereas samples containing waste mirror glass (MGW-G) exhibited lower strength, typically in the range of 60–70 MPa. All mixtures exhibited an increase in compressive strength between 7 and 28 days, confirming ongoing geopolymerization and matrix densification during this period. Between 28 and 90 days, only minor changes were observed, suggesting that the reaction was nearly complete within the first month of curing. In particular, the slight decrease in compressive strength seen for S-G-II between 28 and 90 days is minor and can be attributed to slight drying, redistribution of internal moisture, or minor microstructural changes over time. In mixtures with higher aggregate content, such effects may become more noticeable due to a more sensitive matrix–aggregate interface, whereas systems with lower aggregate content generally exhibit a more continuous matrix and less pronounced variations. Overall, the mechanical properties of the studied geopolymers remain stable over time.
The differences between the MGW1-G and MGW2-G mixtures were marginal, indicating that the properties of the two types of mirror glass waste did not significantly affect the compressive strength overall. Similarly, the influence of aggregate content (variants I and II) was limited, although the S-G-II sample exhibited the highest strength of all. Overall, the replacement of sand with mirror glass waste led to a slight decrease in compressive strength, but the values obtained still indicate good mechanical performance for MGW-based geopolymers.
X-ray diffraction (XRD) analysis, presented in
Table 7, shows significant differences in the mineralogical composition of geopolymer composites depending on the type of aggregate used. The initial mirror glass (MGW1 and MGW2) exhibits an almost completely amorphous character (98.4% amorphous phase) with only trace amounts of crystalline phases such as quartz, calcite and zincite. In the resulting MGW1-G-II and MGW2-G-II composites, the amorphous content remains high (96.0 and 96.3%), with crystalline phases present in similar concentrations as in the glass itself.
In contrast, the S-G-II sample with sand shows a completely different composition: The amorphous fraction is only 51%, while quartz constitutes almost half of the sample (48.7%). This result is consistent with the use of an inert, crystalline aggregate that does not participate in the geopolymer reaction and significantly reduces the relative amount of the geopolymer phase. The presence of other phases originating from the clay material (anatase, calcite) is minimal and does not significantly affect the interpretation.
These XRD results further suggest that the loss on ignition (LOI) values reported in
Table 2 are primarily due to the release of physically and chemically bound water, given the low or negligible amount of carbonate phases in the geopolymer samples.
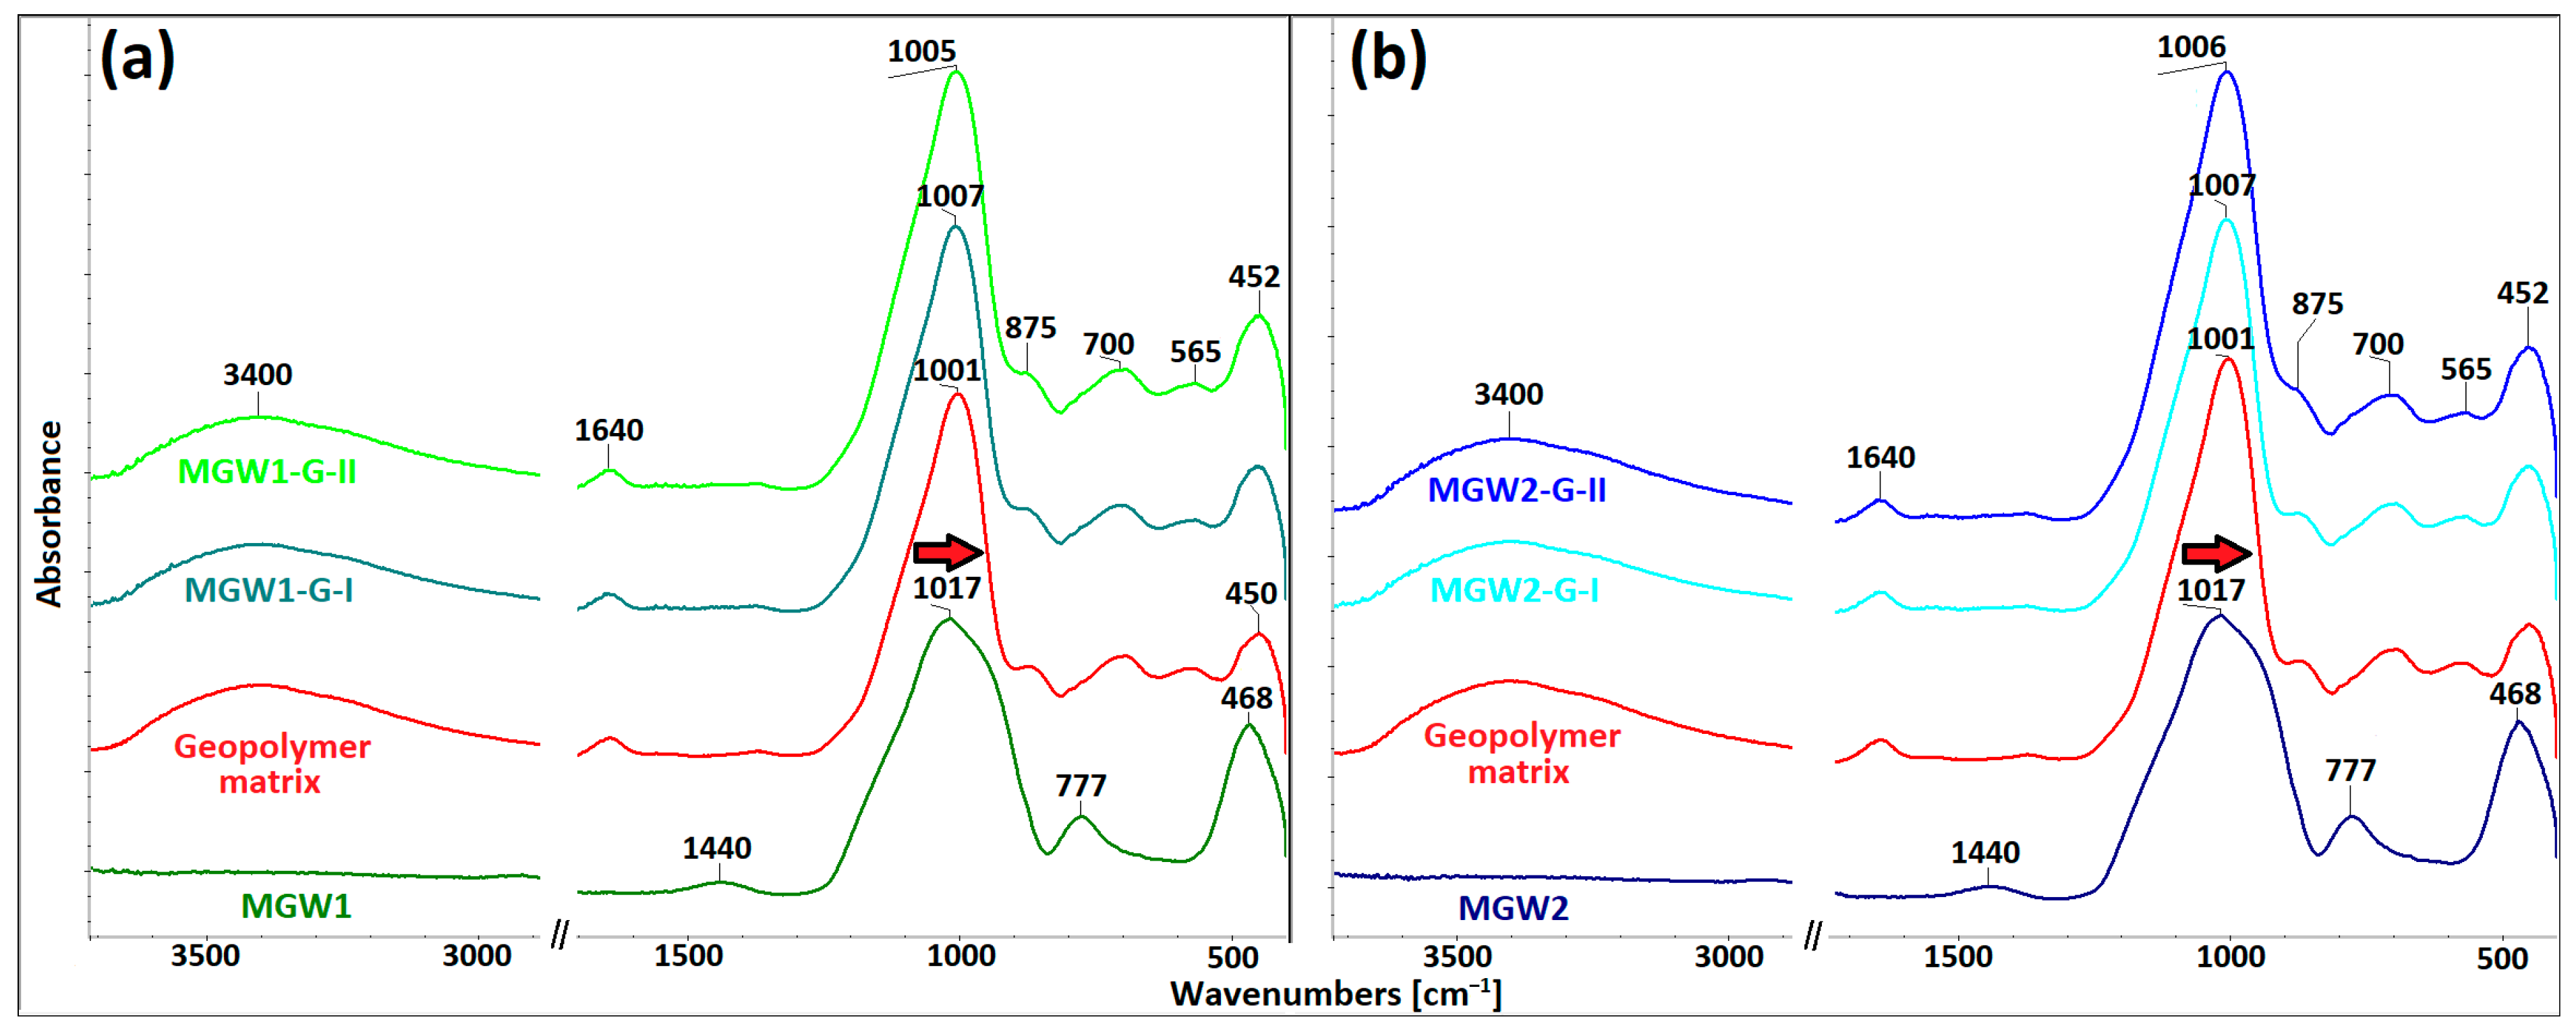
Spectroscopically, all final geopolymer materials, both the series MGW1 (
Figure 6a) and MGW2 (
Figure 6b), are identical. The positions of the principal band in MGW1 and MGW2 are 1017 cm
−1, in the geopolymer matrix 1001 cm
−1, and the geopolymer composites exhibit positions in the range of 1005–1007 cm
−1. These values are within the resolution limit of the method (up to 4 cm
−1). This shift (10–12 cm
−1, red arrow in
Figure 6) is smaller than that observed for automotive glass in our previous research [
21], where this shift was 27–29 cm
−1. A new weak band at approximately 700 cm
−1 is attributable to the stretching and bending vibrations of Si–O–Al, providing another fingerprint for the generation of the geopolymer structure [
48]. On the other hand, the original band at 777 cm
−1, characterizing Si–O bonds in MGW1 and MGW2, disappears due to the geopolymer reaction.
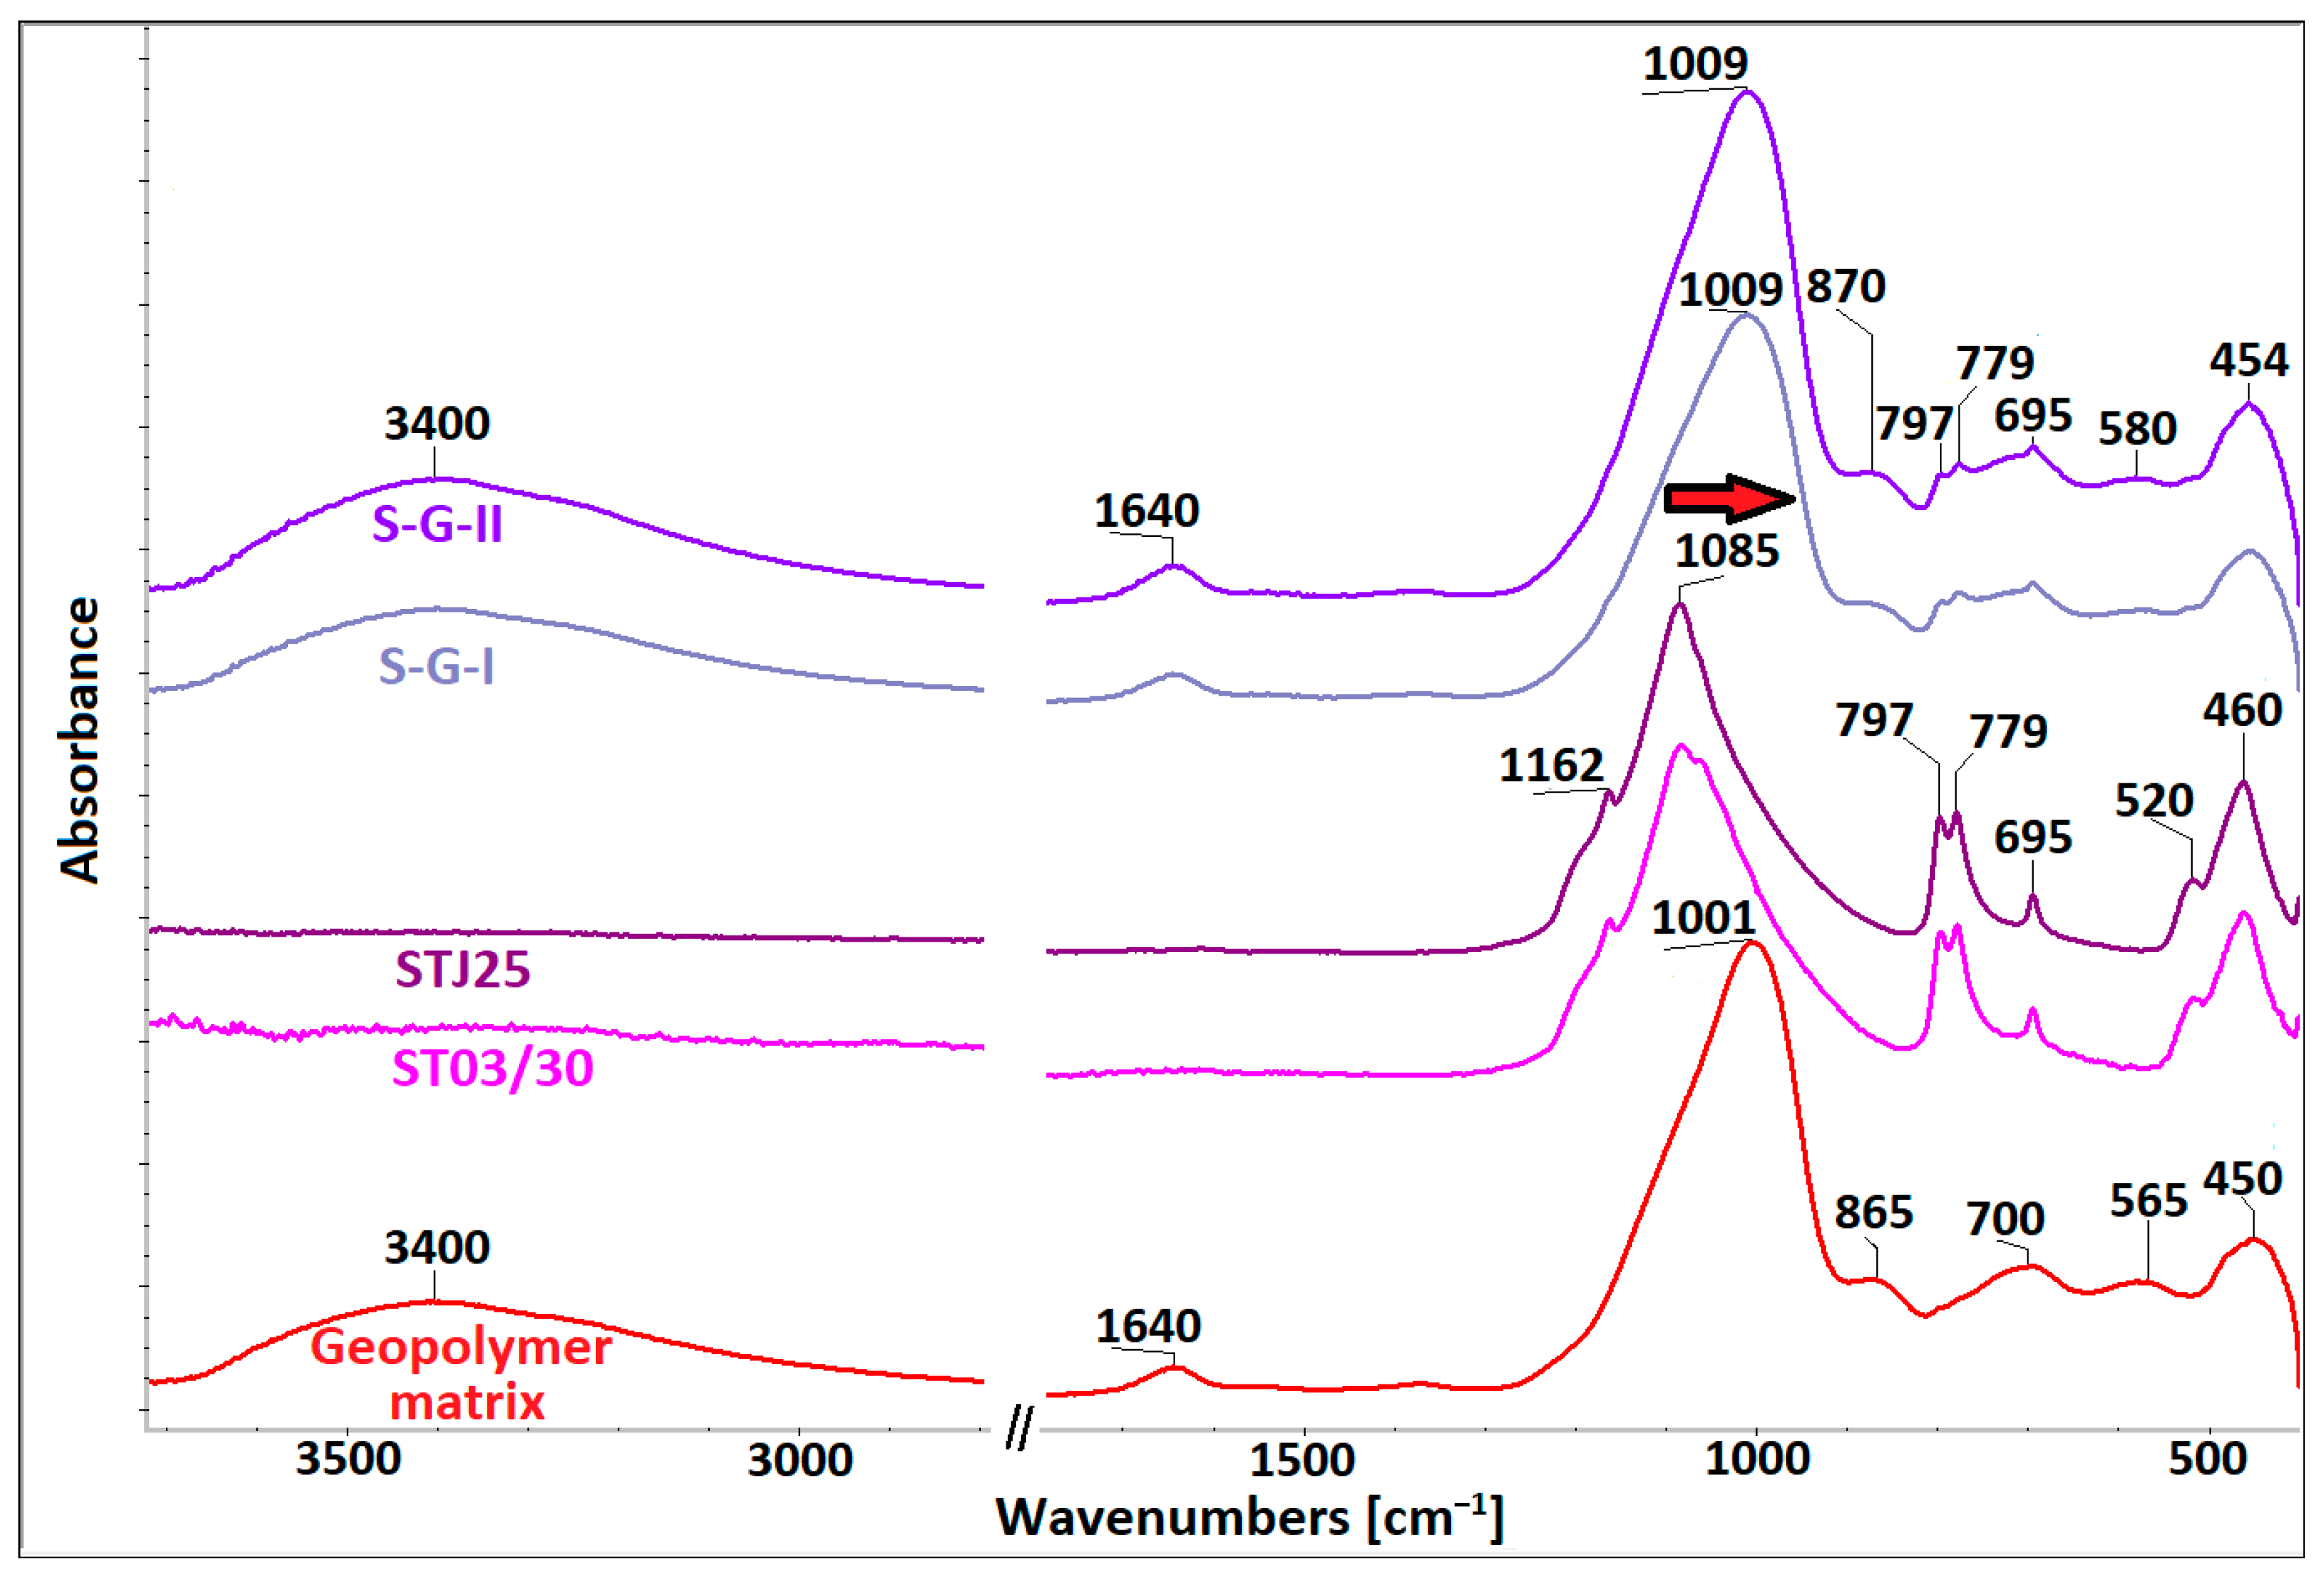
The sand filler is a mixture of STJ25 and ST03/30 materials; the positions of the principal bands in both spectra are at 1085 cm
−1. The final geopolymer materials S-G-I and S-G-II (
Figure 7) are identical, with the principal band in both spectra located at 1009 cm
−1 and the shift of the principal band after geopolymerization to lower wavenumbers being 76 cm
−1. A new weak band at approximately 700 cm
−1, corresponding to the vibrations of Si–O–Al, provides further evidence of the generation of the geopolymer structure [
48]. Very weak remnants of the bands at 779 and 797 cm
−1, which originate from the sand filler, are still visible in the spectra of S-G geopolymers.
All the spectra of geopolymer composites also contain bands of the hydroxy groups (3400 and 1640 cm−1) originating from the geopolymer matrix. ATR-FTIR analysis has confirmed that the content of neither mirror glass waste nor sand filler negatively affects the progress of the geopolymer reaction.
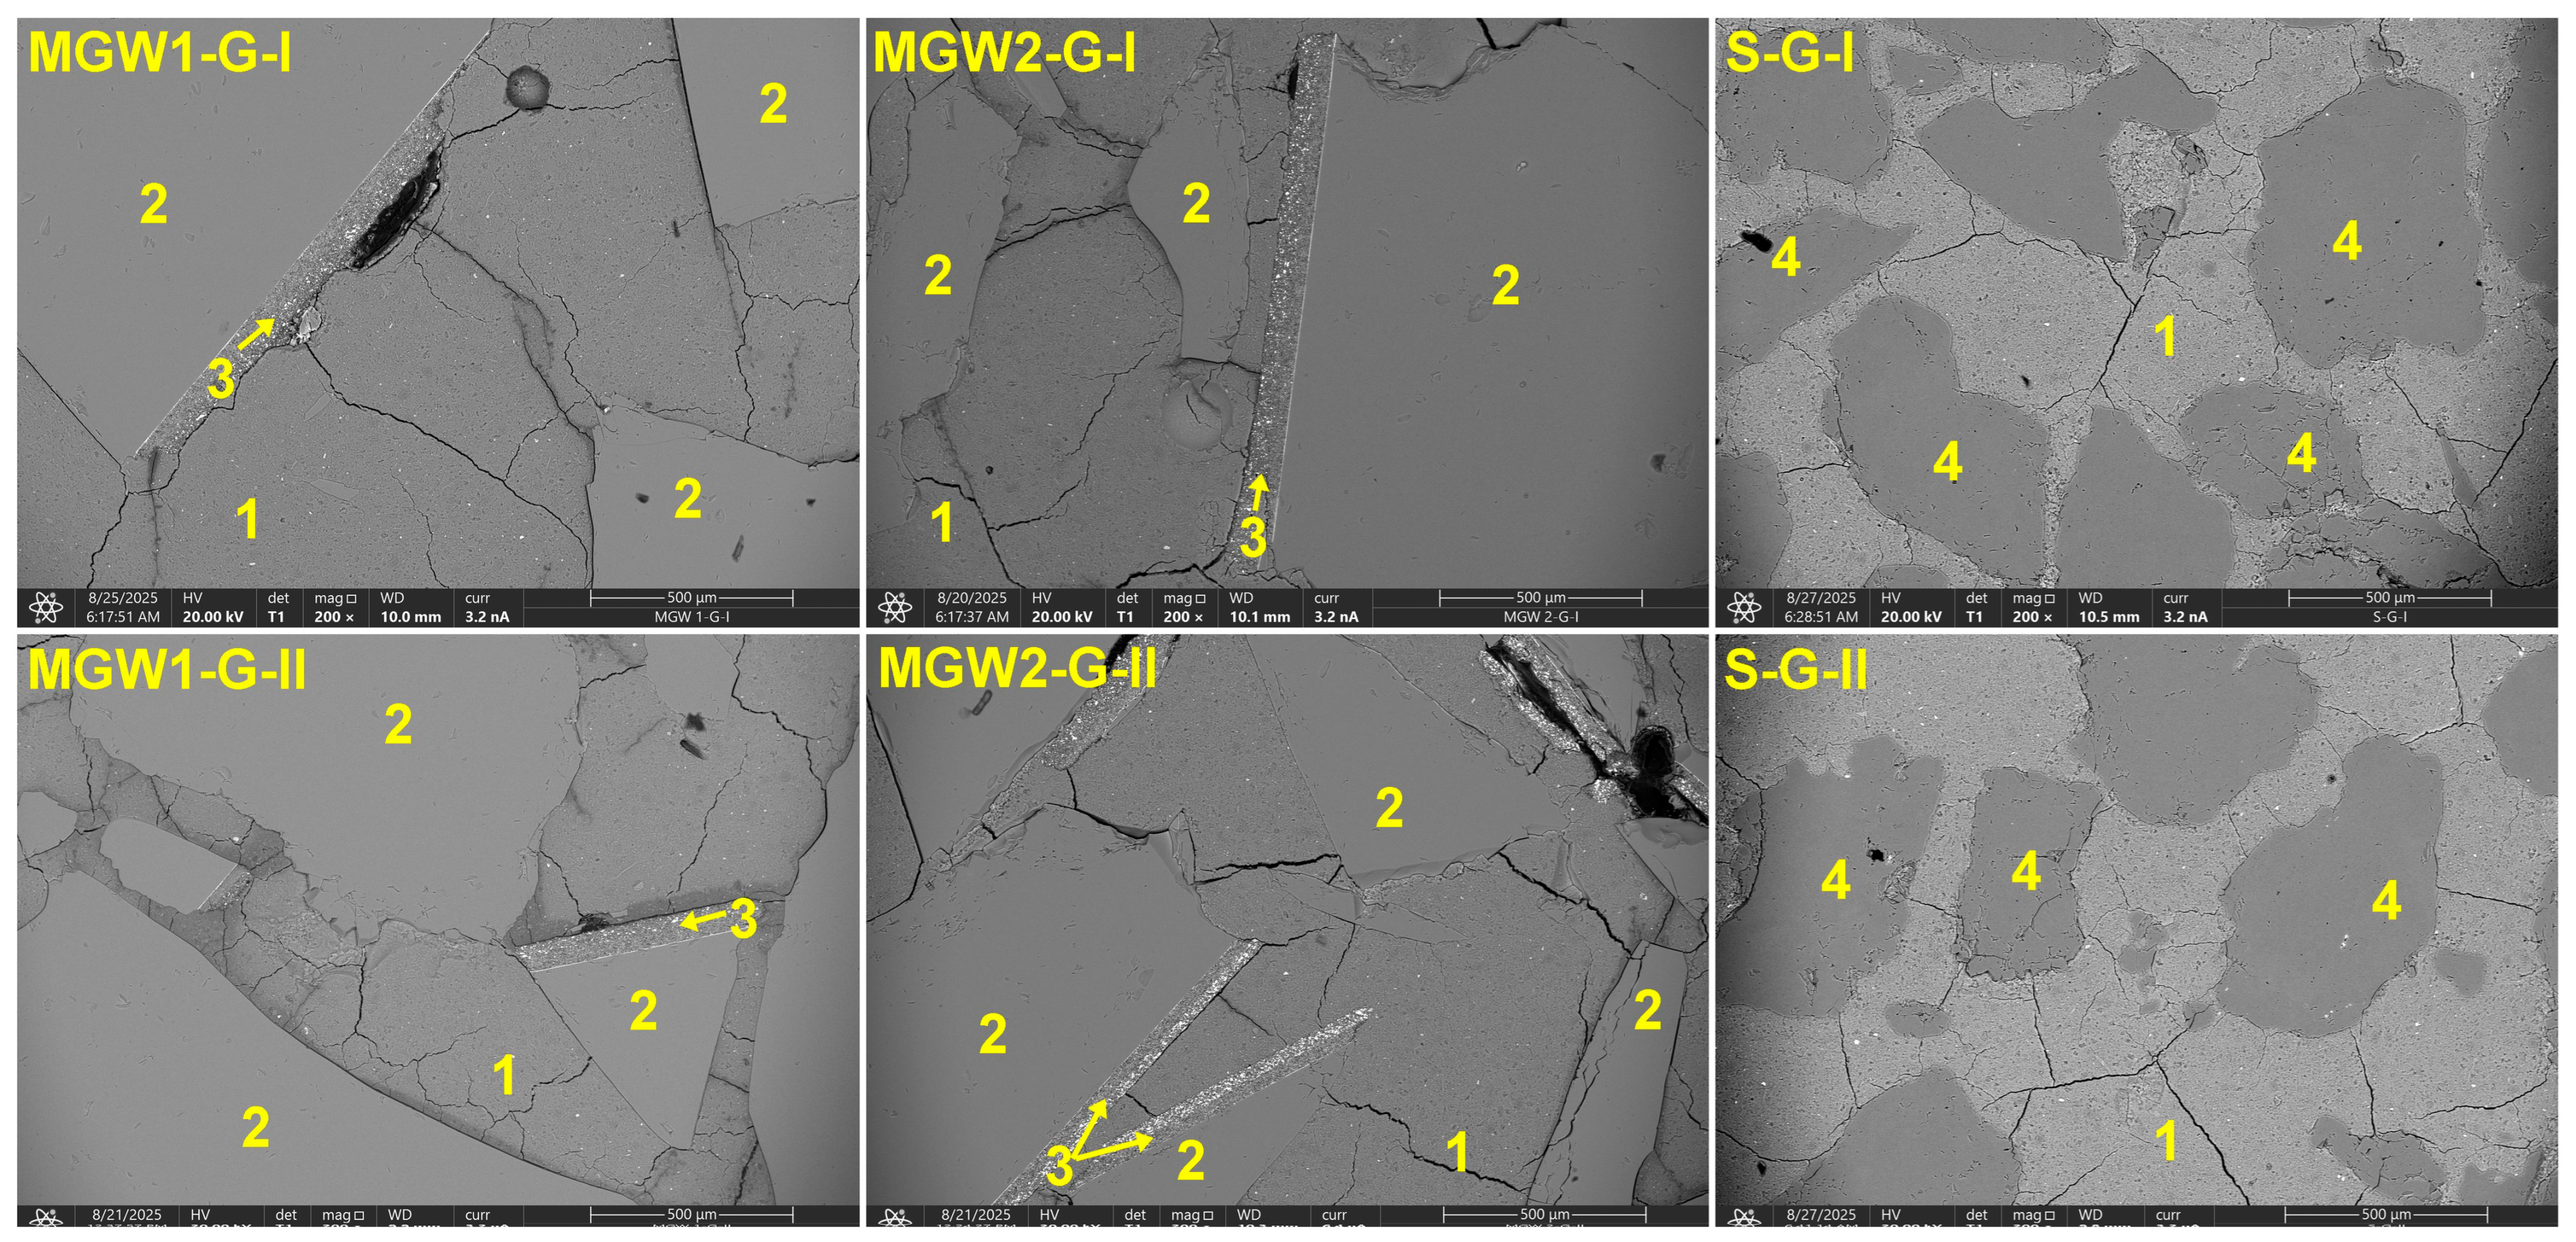
The SEM microstructures in
Figure 8 show clear differences between the composites, arising from the distinct morphology of the mirror glass waste (MGW) and silica sand used as aggregates. MGW fragments (2) are sharp-edged and often carry thin metal coatings (3), which remain locally attached to their surfaces and form additional interfacial features. In contrast, silica sand grains (4) are rounded and smoother, resulting in simpler and more uniform interfaces with the geopolymer matrix (1). The matrix (1) forms a continuous phase in all samples; however, in type-II specimens, the higher aggregate content brings the particles into closer contact, reducing the proportion of continuous matrix and creating a more interconnected granular structure. In some cases, microcracks can be observed, which may originate either during the drying and shrinkage of the material or during the preparation of polished cross-sections for SEM analysis. The latter possibility is supported by the fact that some microcracks propagate through glass or quartz grains (e.g., MGW2-G-II and S-G-II). Overall, MGW-containing composites have a microstructure that reflects the angular shape of glass fragments and the presence of metal surface layers, whereas sand-filled composites exhibit a more uniform microstructure due to the rounded shape of quartz grains and their consistent bonding with the matrix. This observation is consistent with Kuri et al. [
49], who reported that weak bonding at the interfacial transition zone between glass aggregates and the matrix can reduce compressive strength and increase porosity.
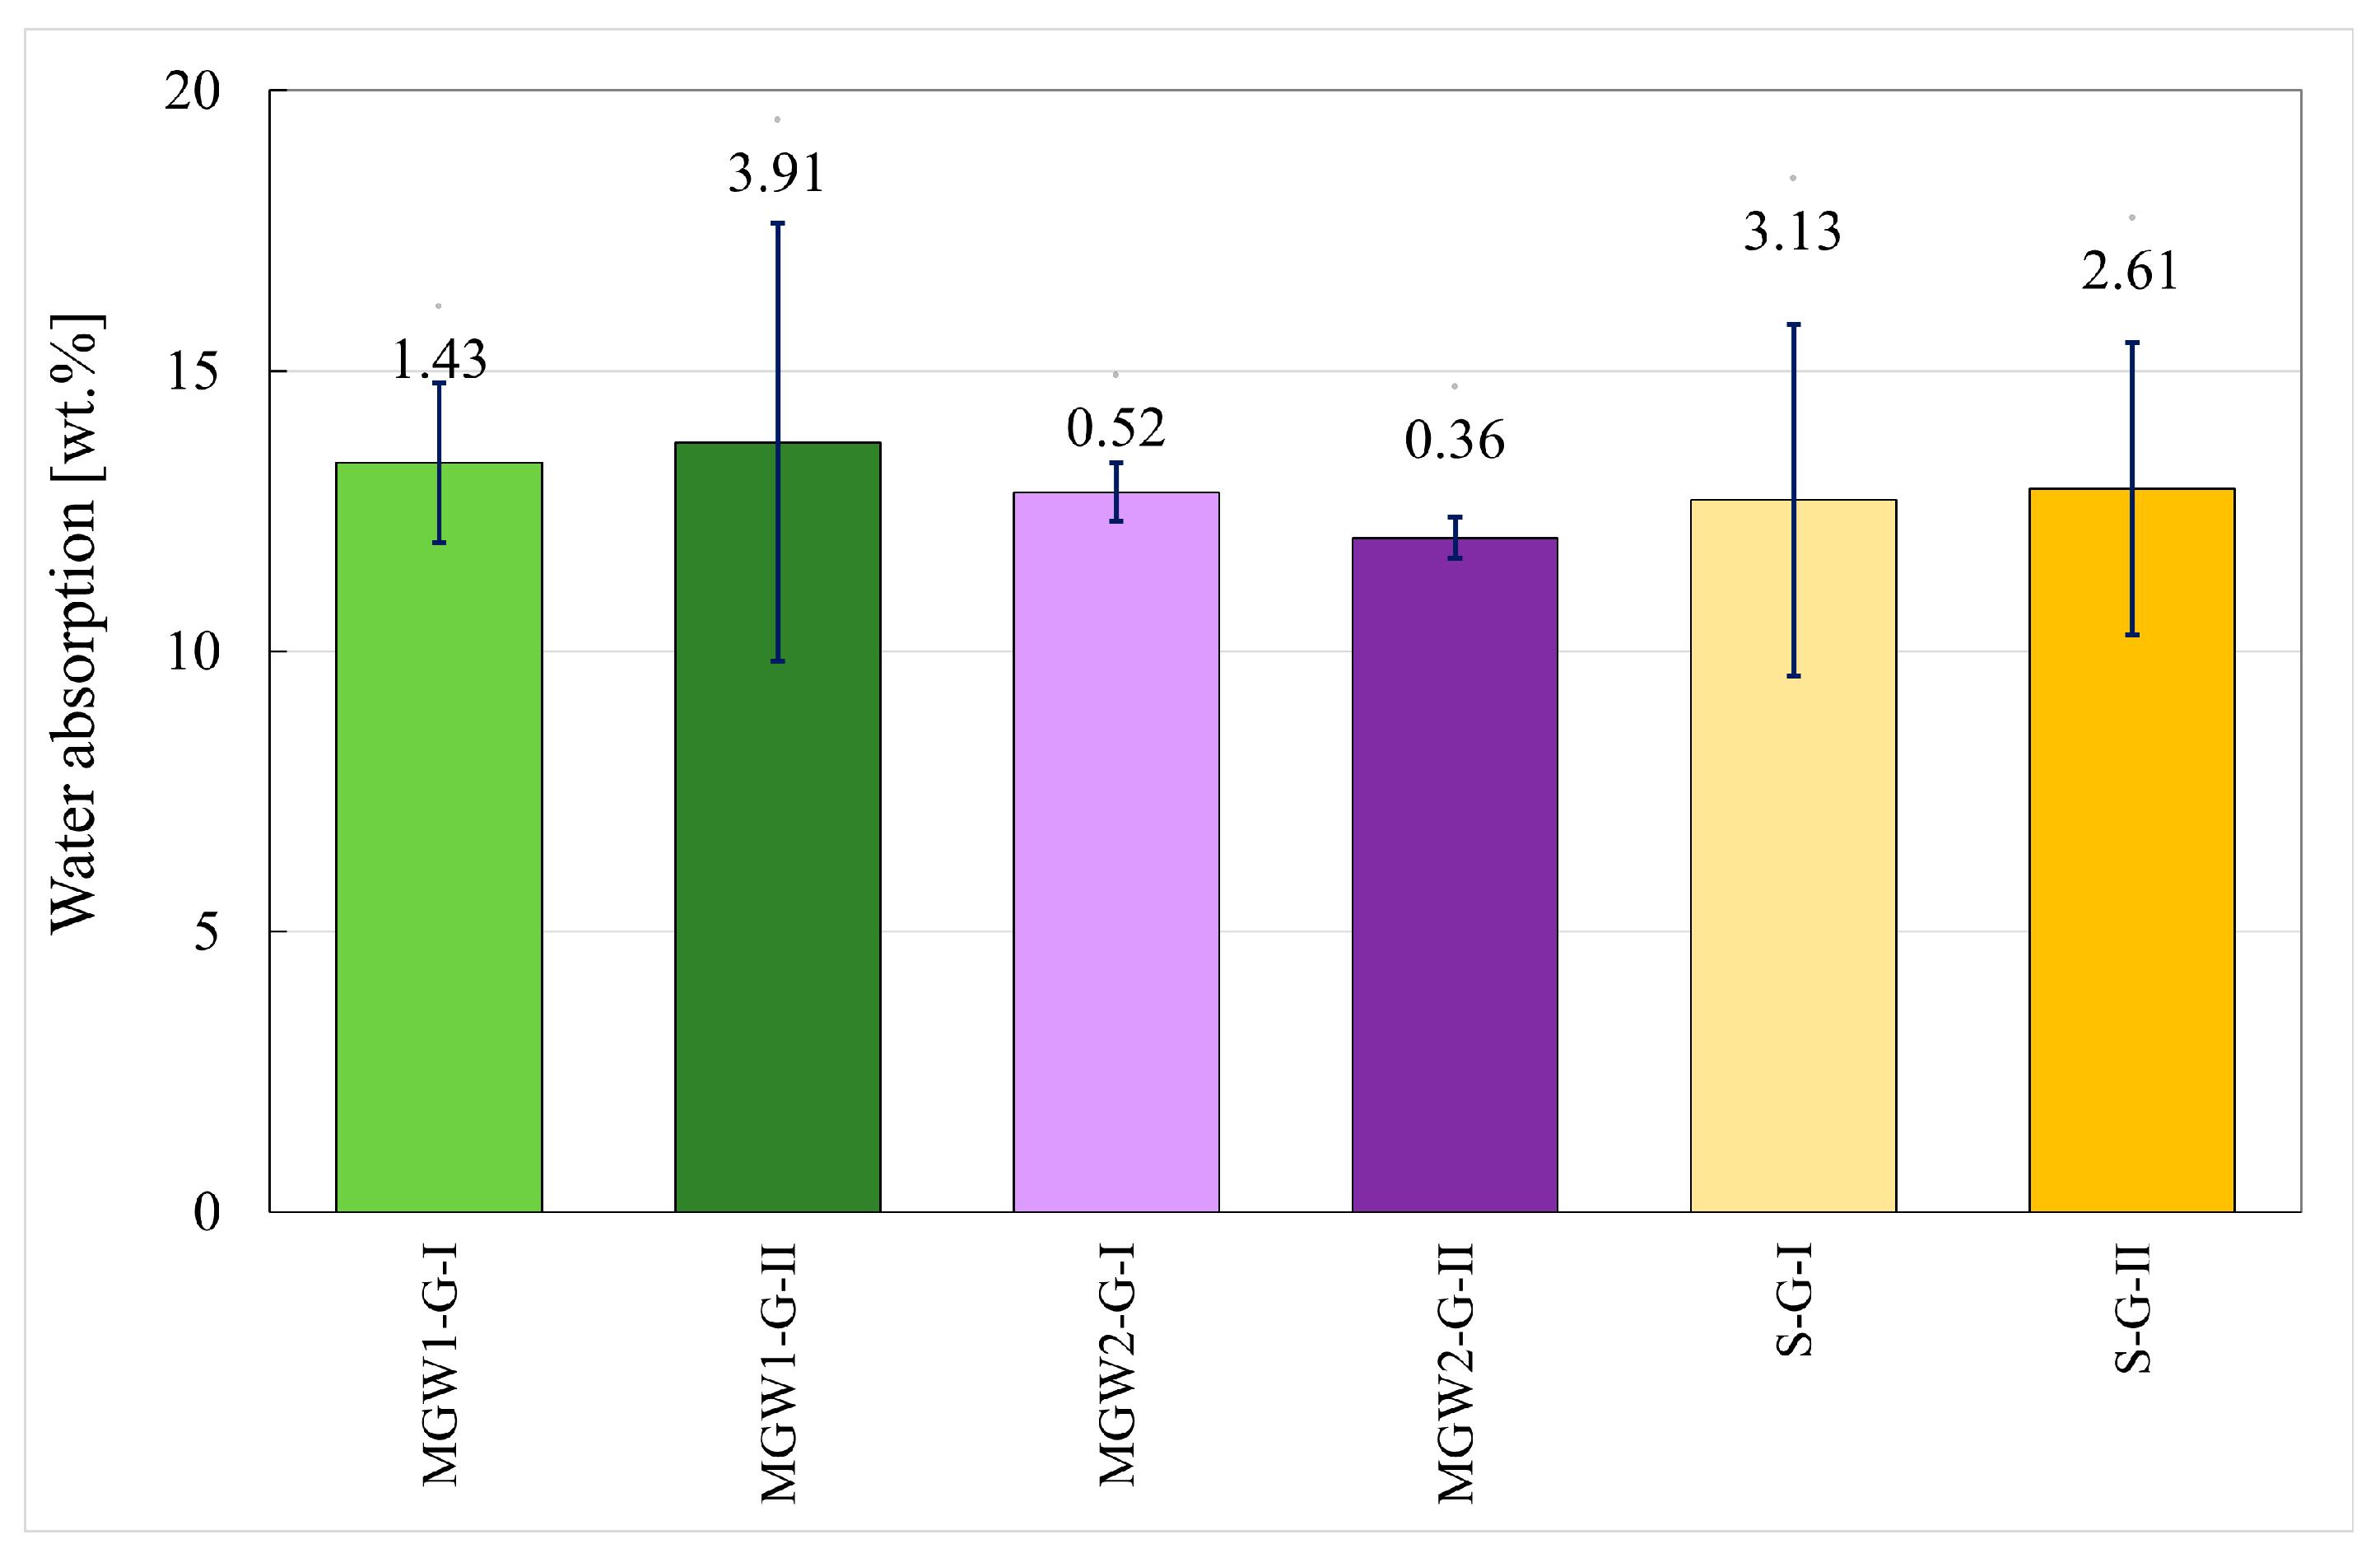
The water absorption values of all geopolymer composites (
Figure 9) fall within a narrow range (approximately 12–14% wt.%), indicating comparable overall porosity regardless of the type of aggregate used. Differences between the mixtures with lower (I) and higher (II) aggregate content are only minor within the error ranges, suggesting that aggregate content does not significantly affect water absorption. MGW2-containing composites exhibit slightly lower absorption than those with MGW1, whereas sand-based samples (S-G-I and S-G-II) show values similar to MGW systems. The higher variability observed in MGW1-G-II may be related to the less uniform distribution of waste mirror glass at its higher content. Overall, the results suggest that neither the type nor the amount of aggregate has a significant effect on water absorption in the geopolymers studied.
The results of mercury intrusion porosimetry (MIP) measurements reveal the pore volume and overall porosity of the various composites and raw materials (see
Table 8).
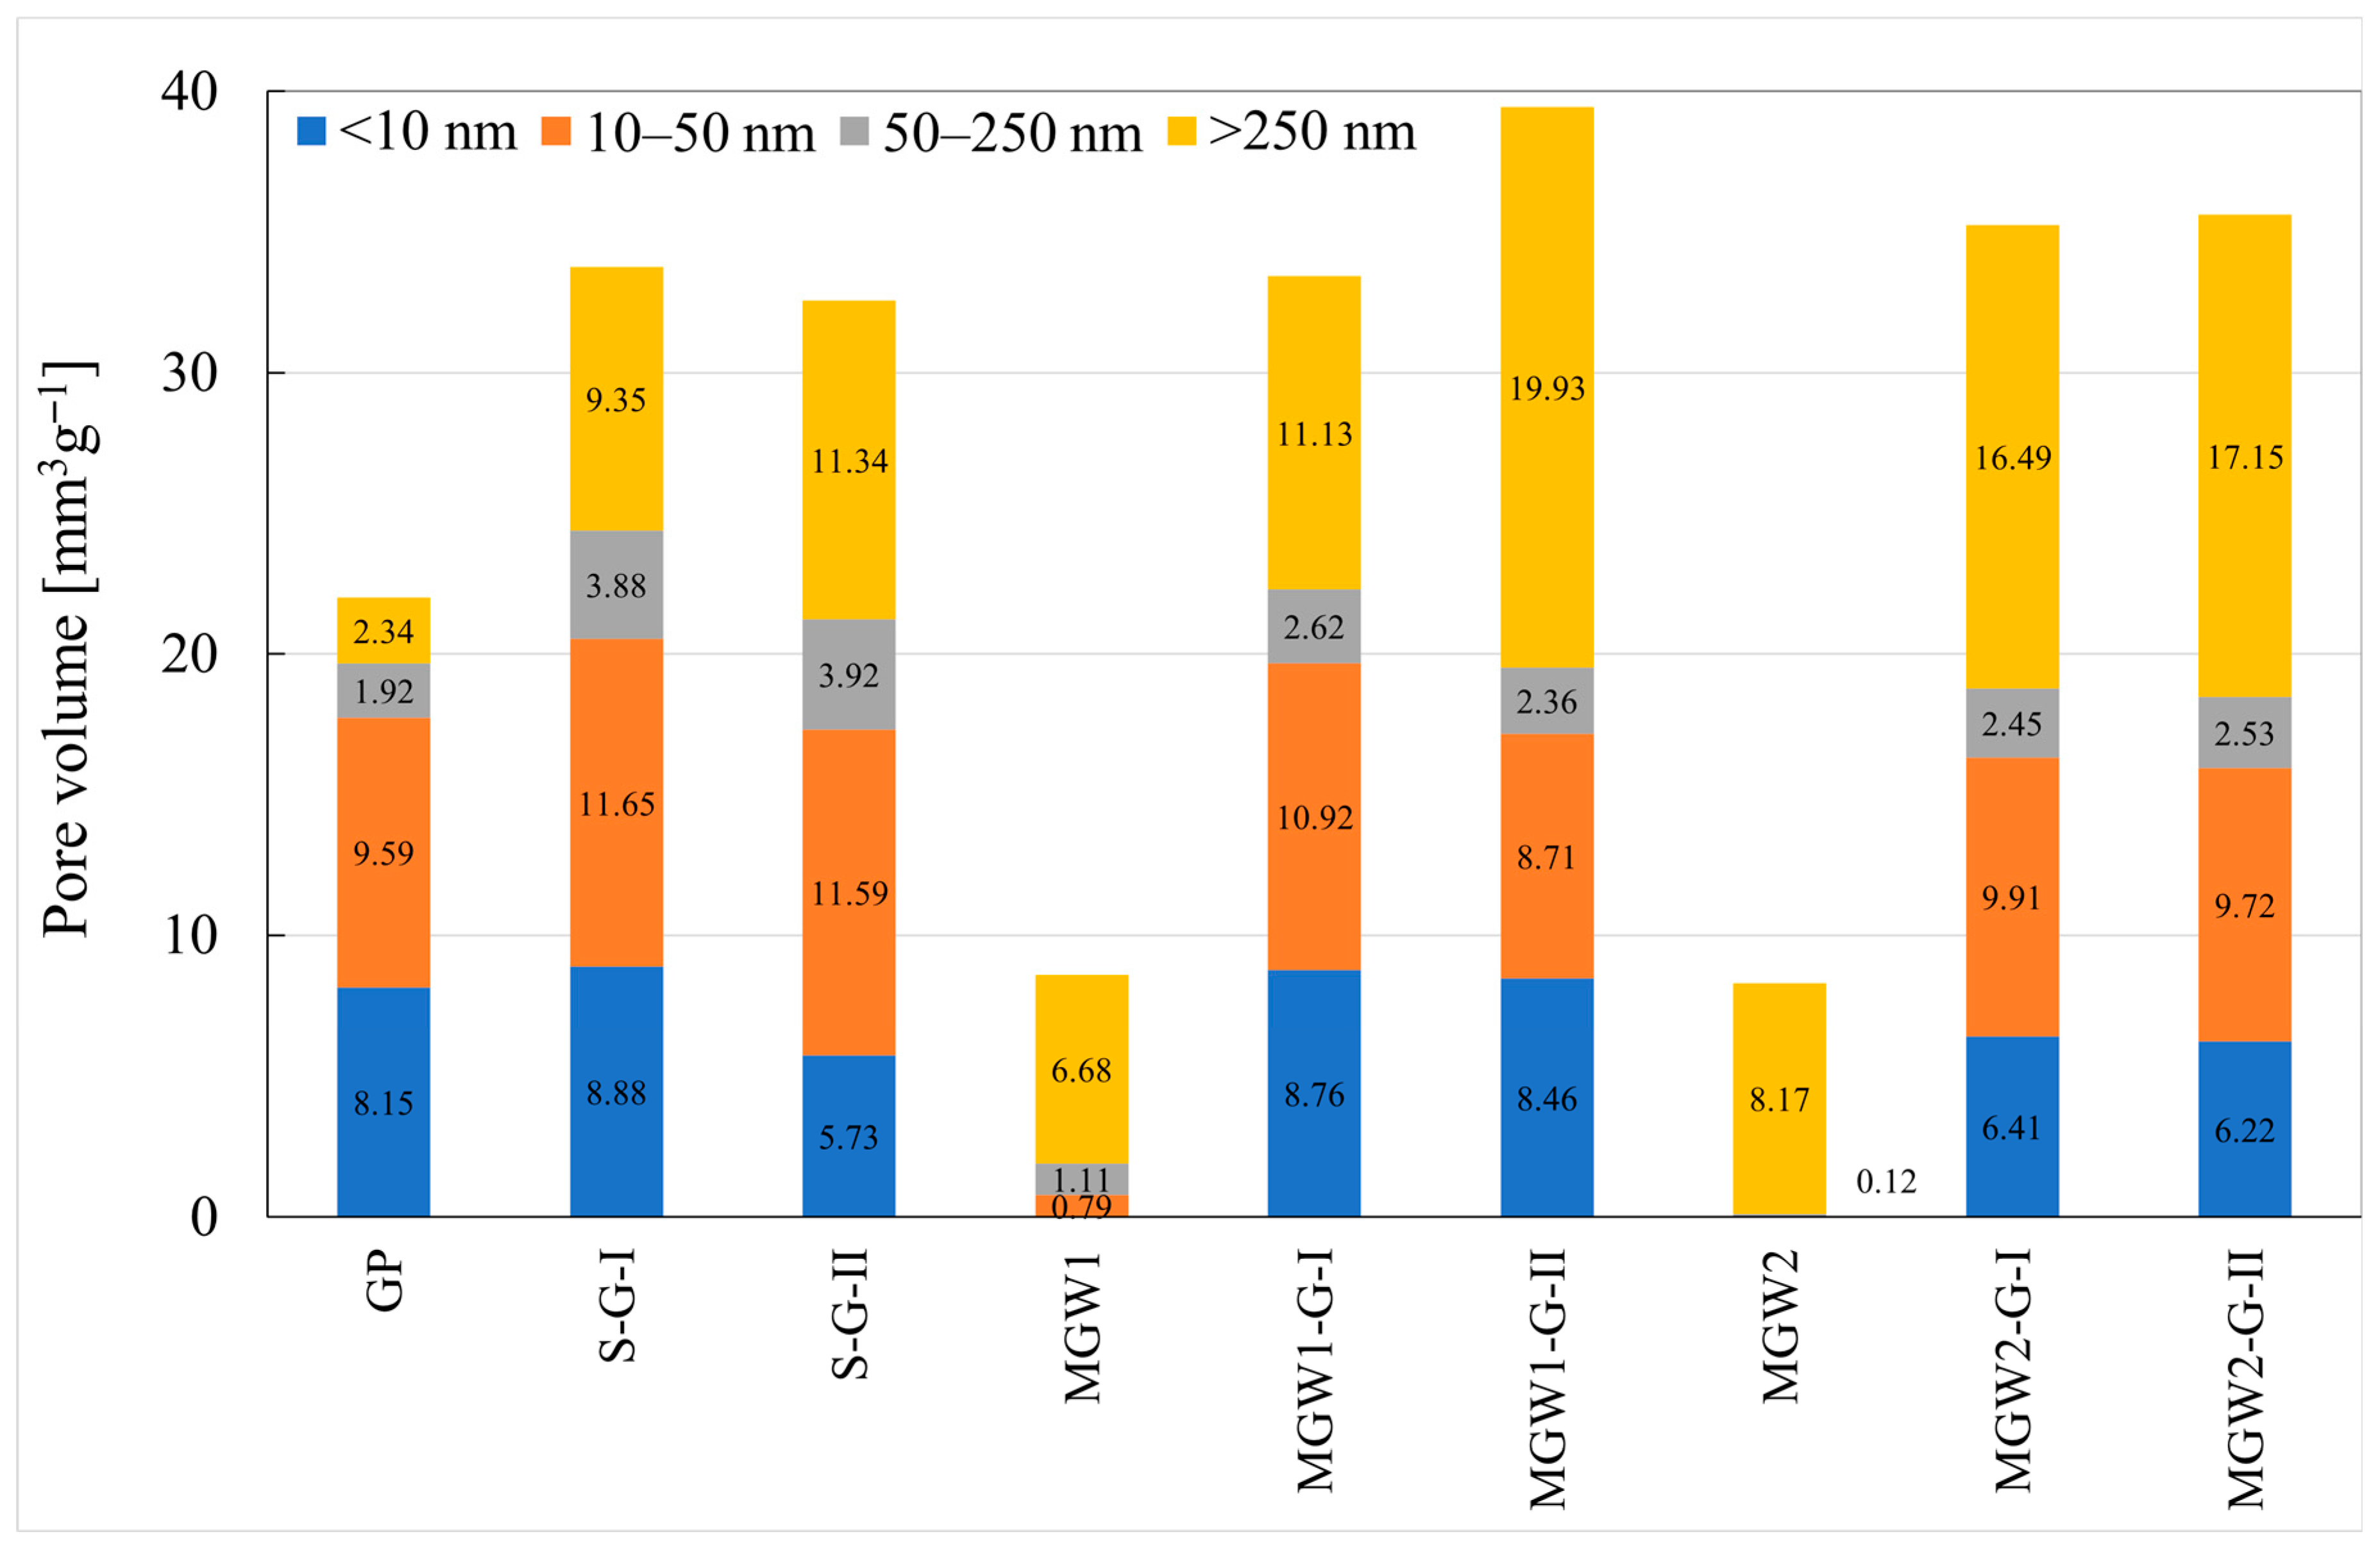
Figure 10 presents the pore-size distributions for all samples, grouped into four categories: <10 nm, 10–50 nm, 50–250 nm, and >250 nm. This classification effectively highlights differences in porosity across the sample set.
As shown in
Figure 10, composites containing mirror fragments exhibit similar pore-size distributions. The presence of fine-grained mirror particles or sand does not significantly affect the pore-size profile. In contrast, the addition of a higher proportion of MWG1 (MWG1-G-II) leads to an increase in pores larger than 250 nm. Composites incorporating either type of mirror glass waste maintain similar compressive and flexural strengths, whereas the sand-based composites achieve slightly higher values.
For raw mirror samples, the relative pore volume tends to decrease with increasing pore diameter, which may be attributed to the presence of intergranular pores. The total pore volumes of the composites and the geopolymer (GP) matrix exceed 20 mm3·g−1, with the average pore diameters smaller than 30 nm, whereas the total pore volume of raw mirrors is lower than 9 mm3·g−1, with the average pore diameters of 400 nm for MWG1 and 3944 nm for MGW2.
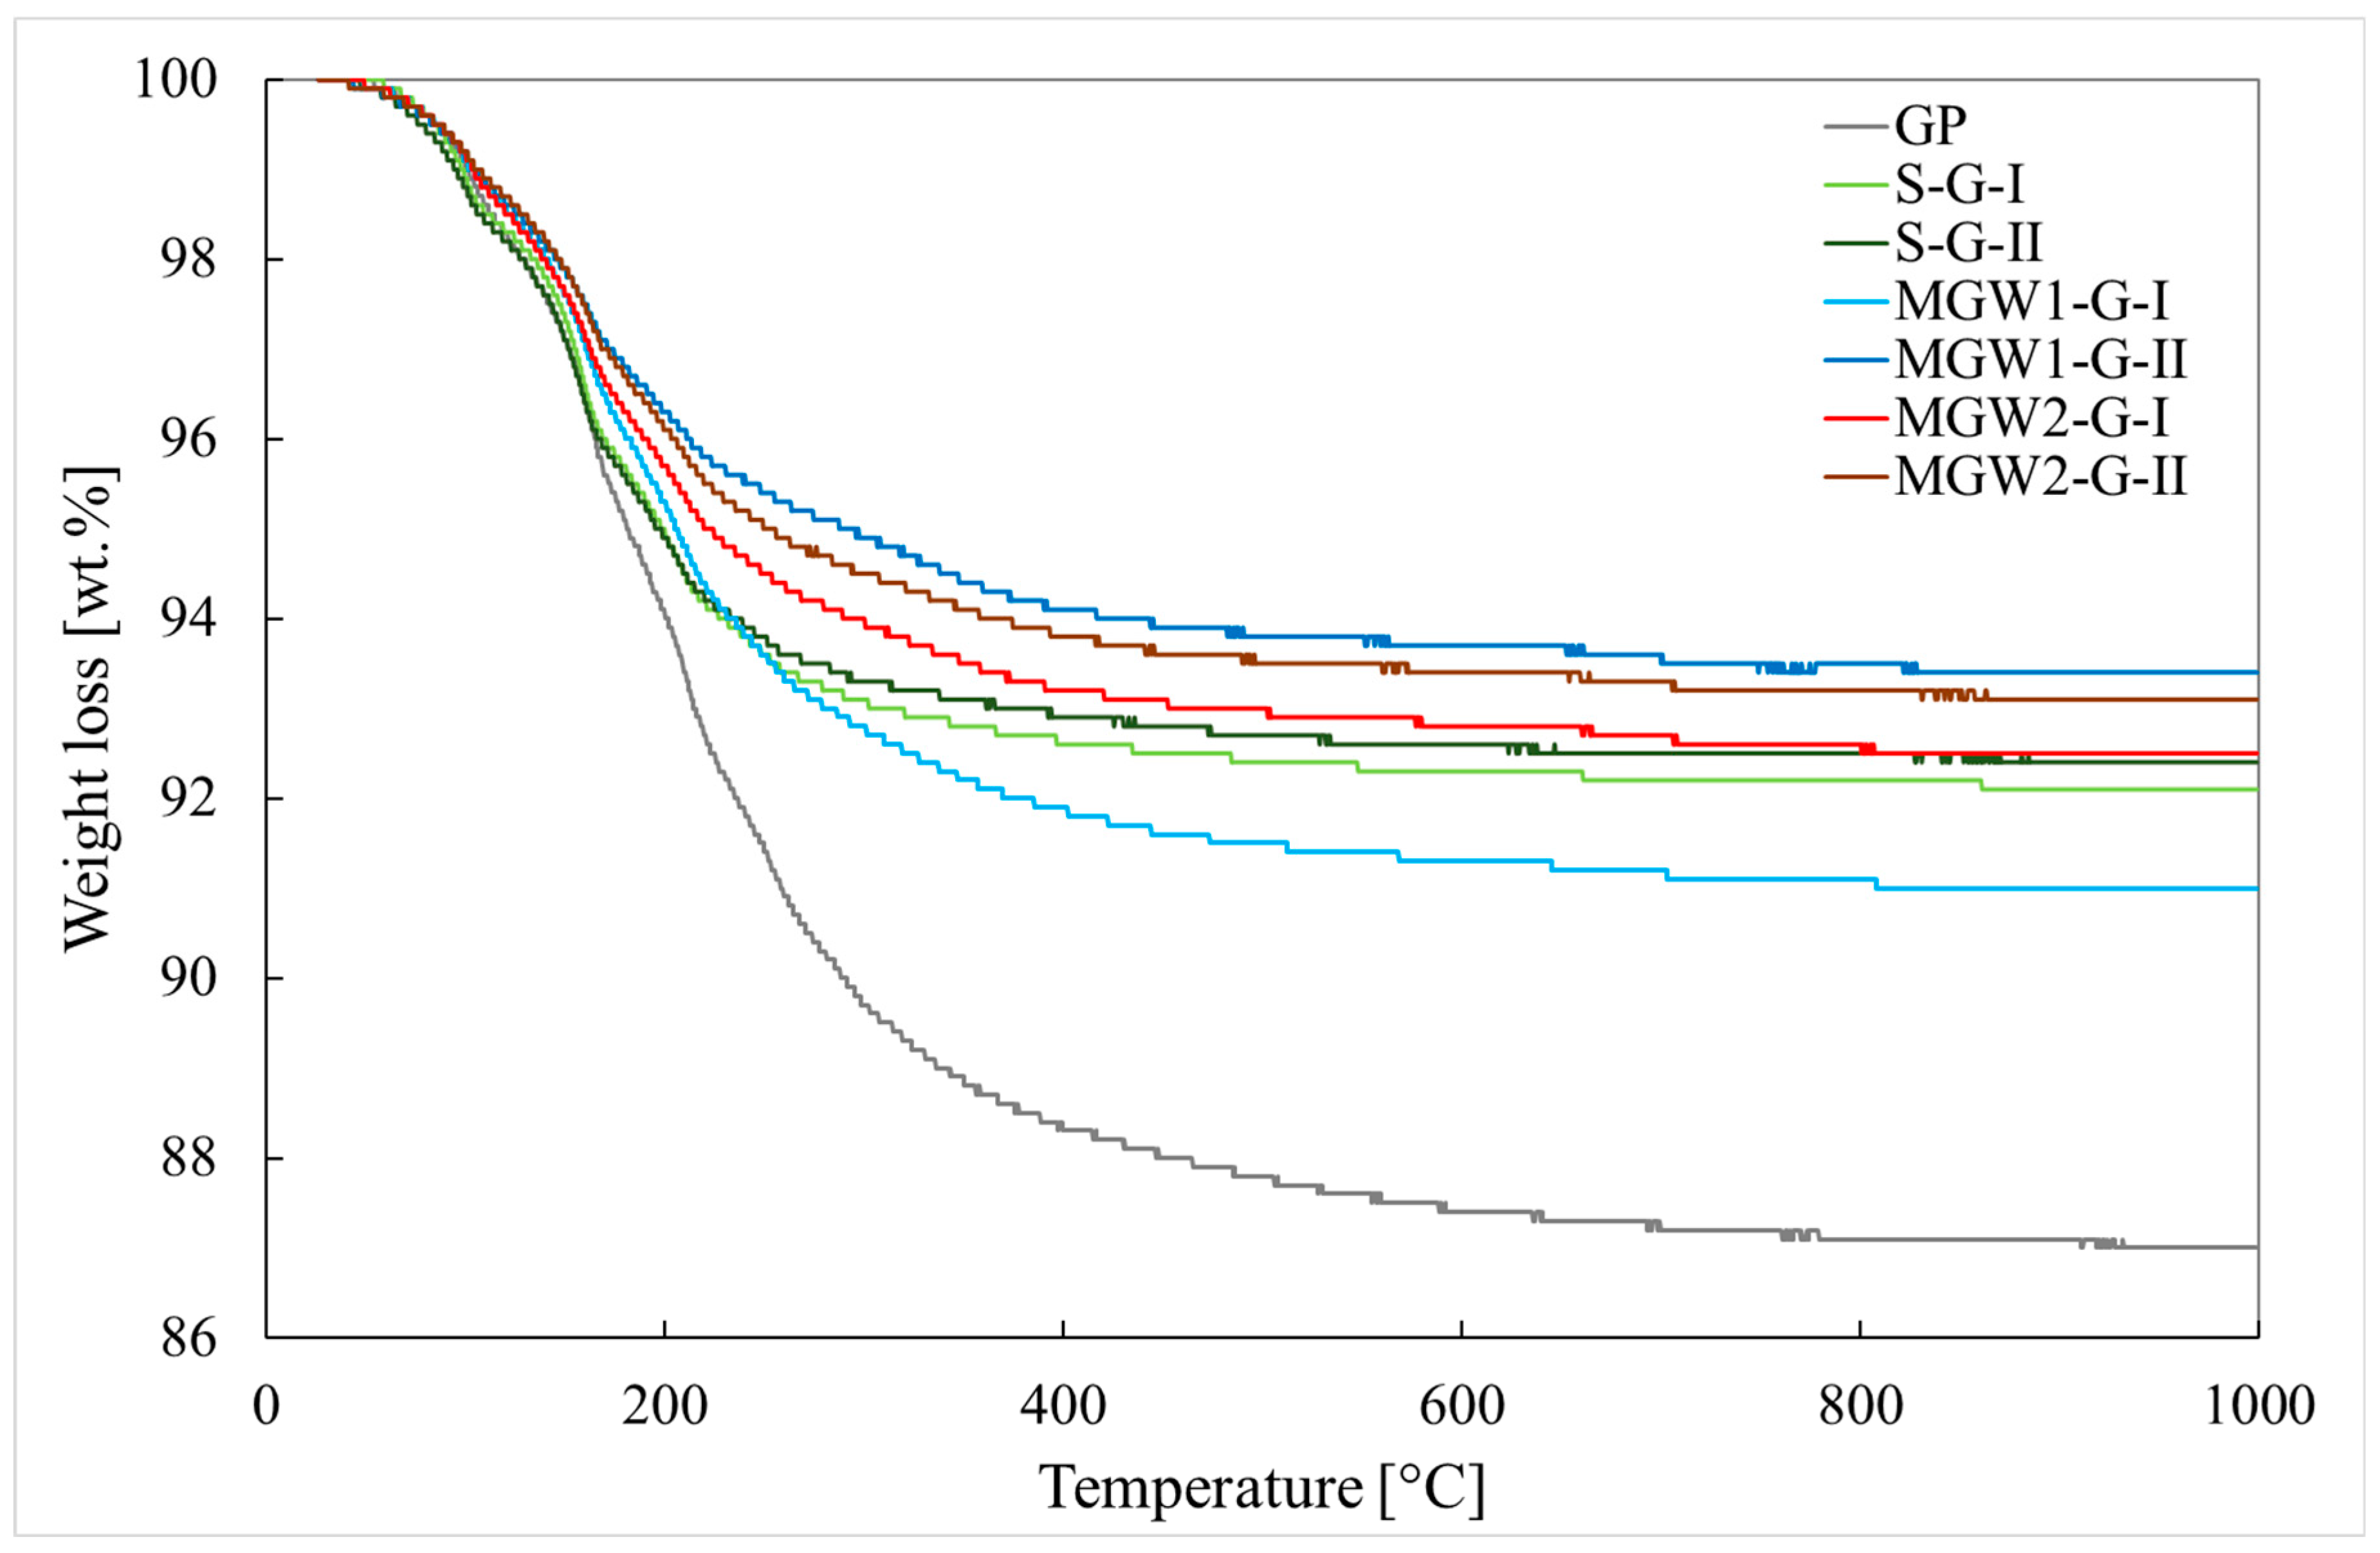
The thermal behavior of geopolymer composites was investigated using TGA under controlled heating in air, revealing a gradual weight loss associated with both physically and chemically bound water. The TGA curves (
Figure 11) indicate that the pure geopolymer exhibited the highest weight loss, as water is gradually released during heating—physically bound up to 100 °C and chemically bound up to 300 °C—which is consistent with the results presented [
50]. At temperatures above 300 °C, water is released through dihydroxylation [
51].
Since MGW is practically an inert material, its addition enhances the thermal stability of the composites, as evidenced by the much lower weight losses. The total weight changes in the pure geopolymer and geopolymer composites may also be influenced by structural modifications occurring at high temperatures (
Figure S3 of the Supplementary Materials). This effect is particularly noticeable in MGW-containing samples, which maintain better structural integrity than the pure geopolymer.
A comparison of MGW1 additions shows that a lower amount results in a higher weight loss, corresponding to lower density and increased porosity. This trend confirms the relationship between MGW content, microstructural compactness, and thermal stability, in agreement with previous studies [
52,
53].
Conversely, MGW2 samples demonstrated slightly better stability (weight loss) than MGW1, which may be attributed to a higher proportion of finer fractions and, consequently, better incorporation into the geopolymer matrix. Composites with MGW2 also exhibit lower porosity than those with MGW1, which is related to the increased density of the geopolymer composite and the higher proportion of MGW, and thus to a lower TGA weight loss [
52,
53].
As shown in the microstructural analysis (
Figure 3;
Figures S1 and S2; Tables S3 and S4), the MGW samples contain metallic layers that can locally influence the microstructure at temperatures around 1000 °C by promoting the fusion of glass particles and the formation of a glassy phase, which is evident on the surface of the cubes (
Figure S3).
The thermal conductivity (λ), thermal diffusivity (a), and volumetric-heat capacity (Cρ) of metakaolin-based geopolymers containing different aggregates (mirror glass waste and sand) were measured to assess their suitability for thermally resistant applications.
The results (see
Table 9) showed that geopolymers with sand (S-G) exhibited significantly higher thermal conductivity and diffusivity than those with mirror glass waste (MGW-G). For example, S-G-II reached a thermal conductivity of 1.0851 W∙m
−1∙K
−1, whereas MGW-based samples remained below 0.53 W∙m
−1∙K
−1. Overall, the measured values of thermal conductivity ranged from 0.4487 to 1.0851 W∙m
−1∙K
−1, those of thermal diffusivity from 0.3008 to 0.7335 × 10
−6 m
2∙s
−1, and those of volumetric-heat capacity from 1.4244 to 1.6733 × 10
6 J∙m
−3∙K
−1, depending on the specific composition.
These findings are generally consistent with data reported by Ziejewska et al. [
54] for geopolymer foams containing waste glass (thermal conductivity 0.080–0.117 W∙m
−1∙K
−1), although their samples were highly porous, with total porosity ranging from 58.7% to 67.3%, whereas our dense composites have a porosity of approximately 20%. Despite the differences in porosity and sample type, the trend of lower thermal conductivity for glass-containing geopolymers is similar.
In a broader context, typical thermal-conductivity values for compact geopolymer composites based on slag and/or metakaolin generally fall within the range of 0.2–1.2 W∙m
−1∙K
−1, depending on porosity, binder composition, and the inclusion of fillers or aggregates [
55,
56,
57,
58]. In particular, higher slag content and reduced porosity are commonly associated with increased thermal conductivity. Correlations between pore structure, compressive strength, and thermal conductivity have also been reported in similar systems [
58], confirming the importance of microstructure optimization for the design of geopolymer composites, as pore distribution and connectivity strongly influence both mechanical and thermal performance.
Compared with traditional construction materials [
59,
60,
61], such as Portland-cement concrete (0.8–2.0 W∙m
−1∙K
−1), the studied geopolymers exhibit lower to comparable thermal conductivity. Specifically, S-G samples approached or exceeded 1 W∙m
−1∙K
−1, suggesting potential for thermal stability, whereas MGW-G samples showed lower conductivity, indicating better thermal insulation potential.
Microscopic observations of thin sections (
Figure 8) revealed the presence of microcracks within the geopolymer matrix as well as gaps between mirror particles and the geopolymer binder. These create additional void space that is easily accessible to helium (in ground samples) but may be partially inaccessible to mercury (in intact samples), especially in the case of poorly connected or extremely fine pores. Consequently, helium pycnometry consistently yields higher porosity values than MIP. The discrepancies between these two methods reflect both the physical principles of measurement and the actual morphology of the pore system, as well as the different sensitivities of the techniques.
The replacement of natural sand with MGW in geopolymer composites reduces the consumption of natural resources and decreases landfill waste, thereby supporting circular economy principles. This study on geopolymer composites containing glass-waste additives highlights the potential of these waste materials for sustainable construction applications [
45]. The use of geopolymers in mirror recycling is thus not only environmentally friendly but also economically advantageous, with the potential to drive innovation in waste management. Moreover, the mechanical properties and stability of the MGW-based geopolymers indicate that they are suitable for practical applications such as paving elements, protective layers, or other non-load-bearing components, where moderate mechanical performance is sufficient. These findings highlight the feasibility of integrating waste-derived geopolymers into real construction practices, contributing to both sustainability and resource efficiency.




 ,
,