Article

The Synthesis and Characterization of Geopolymers Using Metakaolin and Mirror Glass Waste

Institute of Rock Structure and Mechanics, Czech Academy of Sciences, V Holešovičkách 94/41, 182 09 Prague 8, Czech Republic
*
Author to whom correspondence should be addressed.
Appl. Sci. 2026, 16(2), 667; https://doi.org/10.3390/app16020667
Submission received: 9 December 2025 / Revised: 5 January 2026 / Accepted: 6 January 2026 / Published: 8 January 2026

Abstract

This study investigates a metakaolin-based geopolymer matrix in which two types of non-recyclable mirror glass waste (MGW) were used as alternative aggregates. The composition, properties and contents of MGW materials as well as their impact on the structure and performance of the geopolymer composites (MGW-Gs) have been characterized using X-ray fluorescence (XRF), X-ray diffraction (XRD), scanning electron microscopy (SEM), thermogravimetric analysis (TG), and Fourier transform infrared spectroscopy (FTIR). Mechanical properties, porosity and thermal conductivity have been evaluated, and compared with silica sand reference composites. The results show that MGW-based composites achieved flexural strengths of 3.9–5.7 MPa and compressive strengths of 60–70 MPa, which are lower than those of sand-based materials (8–11 MPa and up to 93.5 MPa, respectively) but remain adequate performance for applications with moderate load. FTIR analysis has indicated that the incorporation of MGW does not adversely affect the geopolymer network. All composites display similar porosity (approximately 18–22%) and water absorption (12–14%), while MGW incorporation has improved their thermal stability and significantly reduced their thermal conductivity to values below 0.53 W·m−1·K−1, compared with up to 1.09 W·m−1·K−1 for sand-based composites, emphasizing their insulation potential and sustainability benefits. The findings indicate that MGW aggregates can influence the microstructure, mechanical performance, and thermal properties of geopolymer composites, suggesting their potential use in specific construction applications.

1. Introduction

Since prehistoric times, people have been fascinated by their own image. The earliest primitive mirrors used were natural surfaces of standing water, such as ponds or vessels filled with water. Over time, people developed solid mirrors that were easier to carry and use. The earliest known examples, dating from around 6000 BC, were discovered in Anatolia (modern-day Turkey). They were made of polished obsidian, a type of volcanic glass. In the same period, mirrors made of polished metal—initially mainly bronze and later silver—appeared in Mesopotamia and Egypt. These metal mirrors, however, provided a poorer-quality reflection and required regular maintenance, because their surfaces oxidized and lost their luster over time [1].
Glass mirrors emerged much later. The first were produced in the Roman Empire around the first century AD, when a glass plate was coated with a thin layer of metal. Nevertheless, truly high-quality glass mirrors did not appear until the Renaissance in Venice. In the sixteenth century, Venetian glassmakers, especially those from the island of Murano, gained renown as Europe’s finest mirror makers. Their mirrors were backed with a thin layer of mercury or tin, which ensured an exceptionally clear reflection [2].
A major breakthrough came in the nineteenth century with the discovery of chemical silvering, which enabled mass and affordable mirror production. The process was invented by the German chemist Justus von Liebig in 1835 [3]. This innovation made mirrors widely available, with applications not only in households but also in architecture and industry.
Modern mirrors consist of a thin metal layer applied to the back of a glass pane (commonly silver (Ag), gold (Au), chromium (Cr), copper (Cu) or aluminum (Al)), often protected by an additional coating to prevent metal corrosion and damage.
However, the materials used in mirrors make them difficult to recycle. The main challenge lies in the strong bonding between the glass layer and the thin reflective metal layer, typically aluminum or silver. This bond complicates separation for individual processing. Additionally, the metal can contaminate the glass and damage recycling equipment. The presence of the metal layer and associated chemicals reduces the quality of the recycled glass, further complicating the recycling process. Consequently, alternative methods for the reuse or safe disposal of mirrors are being actively explored. A promising approach is the incorporation of mirror glass waste (MGW) into geopolymer materials.
Geopolymers are amorphous to semi-crystalline inorganic polymers [4,5] formed at the molecular level by a two- or three-dimensional network of tetrahedra, in which central aluminum and silicon atoms are connected via oxygen atoms [6]. The negative charge resulting from the four-fold coordination of aluminum resides on the surrounding oxygen atoms and is neutralized by alkali and alkaline-earth metal cations, primarily originating from the alkaline activating solution [5].
In general, the geopolymerization mechanism depends on the raw materials used [7]. During geopolymer synthesis, the covalent bonds in the aluminosilicate structure are first broken, after which the solid dissolves in an alkaline solution [4,8,9]. This is followed by the formation of reactive oligomers, which subsequently evolve into larger molecules through gelation and crosslinking via polycondensation reactions [4]. As a result of these reactions, geopolymers exhibit a porous structure, with most pores falling within the range of 2–100 nm [10].
In addition to thermally treated natural aluminosilicates (metakaolin), it is possible to prepare geopolymers from various secondary raw materials (e.g., power-plant fly ash, slag, mining residues) [11,12,13,14,15,16]. When converting kaolin to metakaolin with the release of water molecules, temperatures of approximately 750 °C are sufficient. In comparison with geopolymer cement (of poly(sialate-disiloxo) type), the less environmentally friendly production of Portland cement generates approximately six times more carbon dioxide through decarbonation and combustion of larger amounts of fuel (temperatures of up to 1500 °C) [6], thereby contributing to global warming.
The advantages of geopolymer materials include their high mechanical strength [4,16], excellent resistance to elevated temperatures [4,9], and remarkable thermal stability, with some formulations maintaining structural integrity even at temperatures exceeding 1000 °C and enhanced tensile ductility in certain formulations, as reported by Huang et al. [16]. Furthermore, they exhibit good chemical durability, including resistance to acids such as hydrochloric and sulfuric acid [4,8], as well as the ability to immobilize selected heavy-metal ions (Me+ and Me2+) within the matrix [17,18]. These properties make geopolymers attractive for use in harsh environments, including waste stabilization, refractory linings, and fire-resistant construction materials.
This article presents a comprehensive characterization of mirror glass waste (MGW), its innovative application as an alternative aggregate in metakaolin-based geopolymers, and a systematic evaluation of the properties of the resulting solid materials. Two different types of MGW have been used. They were crushed using a jaw crusher and incorporated into the geopolymer matrix in the resulting particle size fraction. The geopolymer bonds were analyzed using Fourier-transform infrared spectroscopy (FTIR). In addition, the samples were characterized in terms of their mechanical properties (compressive and flexural strength), mineralogical composition (X-ray diffraction, XRD), water absorption and structure (porosity measurements and scanning electron microscopy, SEM), and thermal properties (thermogravimetric analysis, TGA; thermal conductivity; thermal diffusivity and volumetric-heat capacity).
Recycling waste mirror glass remains highly challenging due to the presence of reflective metal coatings and underlying layers that prevent its inclusion in standard glass-recycling processes. While the overall particle shape of crushed mirror glass is similar to ordinary waste glass, its surface can be affected by metal coatings, introducing potential microstructural heterogeneities. As a result, waste mirrors are typically disposed of as mixed municipal waste, and their reuse is marginal, irregular, or practically non-existent. Only a few studies have explored new uses for this material, such as in the synthesis of ceramic pigments from mirror waste [19].
Compared with ordinary waste glass, mirror glass waste (MGW) presents several additional challenges. Besides its irregular and sharp-edged particle shape, similar to ordinary waste glass, and back layers, typically based on barium or zinc, which can modify the particle surface and promote interface defects in the composite. These coatings can influence particle distribution, porosity, and ultimately the mechanical performance of the resulting materials. In addition, the presence of multilayer coatings contributes to the poor recyclability of MGW and explains why its reuse remains limited and only sporadically addressed in the literature.
This study therefore explores the use of MGW as an aggregate in metakaolin-based geopolymers, focusing on how these specific features of MGW manifest in the resulting materials. The findings provide new insight into the behavior of MGW in alkali-activated systems and demonstrate its potential as a viable secondary raw material.

2. Materials and Methods

2.1. Materials

The clay material L05 (ČLUZ a.s., Prague, Czech Republic) was used as the primary aluminosilicate source for the geopolymer matrix. An alkaline solution was prepared using potassium silicate (Vodní sklo, a.s., Prague, Czech Republic), which provided soluble silica and promoted the polycondensation process, and potassium hydroxide (Penta, Prague, Czech Republic), which increased the alkalinity and facilitated the dissolution of the clay precursor. Chemical composition and particle size distribution of the calcined clay material used are provided in Tables S1 and S2 of the Supplementary Materials. X-ray diffraction (XRD) evaluation indicated that the L05 clay sample is predominantly amorphous. Crystalline phases include significant amounts of quartz (SiO2) and anatase (TiO2), with minor presence of muscovite (KAl2(AlSi3O10)(OH)2) and hematite (Fe2O3).
The aggregate employed was mirror glass, originating from different waste streams (MGW1 and MGW2). The material was crushed using a jaw crusher and incorporated into the geopolymer matrix as obtained from the crusher. The chemical composition and granulometry of the mirror glass waste are discussed further in the Section 3.
For comparison, reference samples were also prepared using the quartz sands STJ25 and ST03/30, whose chemical composition and particle size distribution are guaranteed by the producer (Sklopísek Střeleč, a.s., Újezd pod Troskami, Czech Republic) [20]. These two types of sand were combined to obtain a particle size distribution approximately matching that of the waste glass.

2.2. Sample Preparation

As the first step, the L05 clay material was heat-activated at 750 °C for four hours. An alkaline solution was then prepared by mixing potassium water glass U-Tonasil K 3150 (K2SiO3, Vodní sklo, a.s., Prague, Czech Republic) with potassium hydroxide (KOH, PENTA s.r.o., Prague, Czech Republic). The parameters of the potassium water glass, as guaranteed by the manufacturer, are: K2O content 12.25%, SiO2 content 24.04%, density at 20 °C 1358 kg m−3, molar ratio SiO2/K2O = 3.20, and solid content 35.40%. KOH was added directly to the potassium water glass under stirring in proportions resulting in molar ratios of K2O/SiO2 = 0.72 and H2O/K2O = 12.43, and the mixture was allowed to cool to room temperature (20 °C). The cooled components (calcined L05 clay and alkaline solution) were combined in a planetary mixer (Kenwood, Watford, UK) and mixed for 20 min. Aggregates were subsequently added and mixed for an additional 5 min. The fresh geopolymer mixtures (both with waste glass and with reference quartz sand) were cast into molds according to the requirements of the specific tests (see the Section 2.3 for details).
The solid samples were demolded after 24 h and stored in a sealed plastic bag at room temperature (20 °C) for 21 days to limit moisture loss during curing. Afterward, they were conditioned under laboratory conditions (20 °C, 31% relative humidity) for an additional 7 days. To ensure reproducibility of the 7-day mechanical tests, these samples were removed from the bag 2 h prior to testing and equilibrated under laboratory conditions; all other samples were handled according to the standard curing protocol described above. All samples were prepared and conditioned following this same protocol, without further modifications for specific tests. The resulting specimens were subsequently used for all experiments. All physicochemical analyses (see below) were performed on specimens that were at least 28 days old, ensuring that the materials were fully cured prior to testing.
The mix design is summarized in Table 1. The MGW content was selected based on previous experience [21,22,23,24,25] and the observed workability of the mixture during preliminary experiments. The following designations are used: MGW1 and MGW2 are mirror glass waste originating from different waste streams; MGW1-G and MGW2-G denote geopolymers prepared with MGW1 and MGW2, respectively; S-G refers to geopolymers prepared with quartz sand as aggregate. The suffixes I and II indicate different aggregate contents within each formulation.

2.3. Methods

Non-destructive X-ray fluorescence (XRF) spectrometry was performed using a Spectro IQ instrument (Kleve, Germany) equipped with a palladium target positioned at 90° to the central beam. The focal spot size was 1 × 1 mm, and the maximum anode power was 50 W with forced-air cooling. The spectrometer was fitted with a HOPG Barkla crystal. Samples were prepared as pressed pellets by mixing 4.0 g of powdered material (15–20 µm) with 0.9 g of a wax binder CEREOX (FLUXANA GmbH &Co. KG, Bedburg-Hau, Germany) and homogenizing the mixture for 10 min. The pellets were pressed at 80 kN. The results were automatically converted from elemental composition to oxides using X-LabPro software version 5.1 (Spectro IQ, Kleve, Germany).
Loss on ignition (LOI) was determined at 1000 °C using a gravimetric procedure in accordance with ČSN 72 0103 [26].
Particle size analysis was determined using a Microtrac Sync 5001 particle size analyzer (Microtrac Inc., Montgomeryville, PA, USA) with a measurement range of 0.02–2800 μm. The device is equipped with three red laser resistors and a Flowsync module, which ensures uniform dispersion of the powdered samples in a liquid medium prior to measurement. Approximately 50–100 mg of sample was ultrasound-dispersed in water for 30 s and then transported to the measuring cell. The resulting data represent the average of three measurements.
Strength tests were conducted in accordance with the European Standard EN 196-1 [27] using prisms with standard dimensions of 40 × 40 × 160 mm, tested after 7, 28 and 90 days under laboratory conditions (20 °C, 31% relative humidity). The tests were performed using an E156 motorized press (strain rate: 0.6 ± 0.2 MPa∙s−1) equipped with appropriate devices from Matest (Treviolo, Italy). A three-point bending configuration (support span 100 mm) was employed to determine the flexural strength, using an E172-01 testing device. The fractured portions of the 40 × 40 × 160 mm prisms were then utilized to determine compressive strength using an E170 compression device. Each flexural strength value represents the average of three measurements, whereas compressive-strength values represent the average of six measurements.
X-ray diffraction (XRD) analysis as carried out on a Bruker D8 Advance powder diffractometer operating in Bragg–Brentano geometry with a LynxEye XE detector and CuKα radiation (Bruker AXS, Karlsruhe, Germany). Powdered samples were mounted on a planar, diffraction-free silicon holder. Diffraction patterns were acquired over an angular range of 4–80° 2θ (a step size of 0.015°, a counting time of 0.8 s per step). The resulting XRD patterns were qualitatively evaluated using Diffrac.Eva 4.1 software (Bruker AXS, Karlsruhe, Germany, 2015) together with the ICDD PDF-2 database (ICDD version 2018).
The influence of controlled thermal heating on geopolymer composites was investigated under defined conditions using a MOM thermal analyzer (MOM, Budapest, Hungary), which can measure samples in a compact state. The composites were prepared as cubes with the dimensions of 10 × 10 × 10 mm and were heated in air (30 mL∙min−1) at a constant rate of 10 °C∙min−1 up to 1000 °C. The weight loss of each geopolymer composite cube was evaluated based on the recorded data. Each measurement was performed twice to ensure reproducibility. The influence of MGW incorporation on the thermal stability of the composites and the structural changes in the cubes before and after heating were also assessed.
Fourier-transform infrared (FTIR) spectra were recorded using an iS50 spectrometer (Thermo Nicolet Instruments Co., Madison, WI, USA) equipped with an attenuated total reflection (ATR) accessory with a diamond crystal. The spectra were collected over the spectral range of 400–4000 cm−1, with 32 scans averaged at a resolution of 4 cm−1. Spectral processing was performed using OMNIC 9 software (Thermo Electron Scientific Instruments LLC, Madison, WI, USA).
Water absorption of the samples was evaluated in compliance with ČSN 72 2603, employing standardized saturation and weighing procedures [28].
Skeletal density (ρHe) of the solid samples was determined using helium gas pycnometry as a non-destructive technique. The measurements were carried out on ground samples at 25 °C using a Pycnomatic ATC instrument (Thermo Fisher Scientific, Monza, Italy). Since helium has a small atomic size and high diffusivity, it can penetrate even the finest open pores within the solid structure.
Porosity and pore-size distribution were characterized using mercury intrusion porosimetry (MIP) with PASCAL 140 and PASCAL 440 instruments (Thermo Fisher Scientific, Waltham, MA, USA). The measurements were conducted on pre-dried intact-sample pieces of approximately 5 mm in size, targeting pores in the range of 7 nm to 112 µm. Each sample was measured twice to minimize the variability caused by internal heterogeneity. Key parameters such as total porosity (φ), total pore volume, and material density were determined [29]. A comprehensive explanation of sample preparation, methodology, and evaluation procedures can be found, for example, in reference [30].
Particle morphology was examined using a Keyence VHX-6000 digital microscope (Keyence International, Osaka, Japan).
EDS and SEM analyses were performed on polished cross-sections, which were attached to aluminum carriers with carbon tape and coated with carbon (18.9 nm, 16.5 nm for sand) using a Leica EM ACE600 sputter coater (Specion s.r.o., Prague, Czech Republic). EDS maps were obtained using a STEM Apreo S LoVac scanning electron microscope (ThermoFisher Scientific, Waltham, MA, USA) equipped with an Octane Elite SDD (EDAX, Ametek, Berwyn, PA, USA) EDS detector under high-vacuum conditions, with an acceleration voltage of 20 keV and a magnification of 200×. Detailed EDS elemental analyses of each mirror layer were carried out on the same samples at 3500× magnification. Data acquisition was done on EDAX TSL OIM software APEX Advanced V3.0.0601.0001 (EDAX, Ametek, Berwyn, PA, USA). SEM images were acquired on the same microscope at 20 keV using a T1 Trinity Inlens detector with BSE electrons to highlight material differences at 200× magnification.
Thermal conductivity (λ), thermal diffusivity (a), and volumetric-heat capacity (Cρ) were measured using an ISOMET 2114 analyzer (Applied Precision, Bratislava, Slovakia), which operates via a dynamic method based on the temperature response to the heat pulses generated within the probe. The measurements were performed on cylindrical specimens with a diameter of 60 mm and a height of 40 mm. Surface probes with the ranges of 0.04–0.3, 0.3–3.0 and 3.0–6.0 W∙m−1∙K−1 were selected according to the thermal properties of each material. To reduce the influence of temperature fluctuations, the probe and sample were placed in a polystyrene thermal box during the measurement. The final values represent the average of three measurements.

3. Results and Discussion

The experimental plan was designed to comprehensively evaluate the suitability of waste mirror glass (MGW) as an aggregate in geopolymer composites by linking the properties of the raw material with the resulting microstructure and performance of the composites. The chemical and phase compositions of the raw MGW and geopolymer composites (MGW-G) were determined using XRF and XRD analyses. The characterization of the metallic layers present on the glass surface and the effect of MGW incorporation on the composite microstructure were investigated using SEM and EDS analyses, while porosity measurements were used to assess changes in pore structure induced by the glass aggregate. Thermogravimetric (TG) and FTIR analyses were employed to evaluate the thermal stability and the formation of geopolymer bonds in the composites, respectively. Mechanical properties were evaluated using flexural and compressive strength tests as the primary performance indicators. In addition, thermal conductivity (λ), thermal diffusivity (α), and volumetric heat capacity were measured to assess the thermal performance of the composites and their potential applicability in construction-related applications.

3.1. The Characterization of Mirror Glass Waste

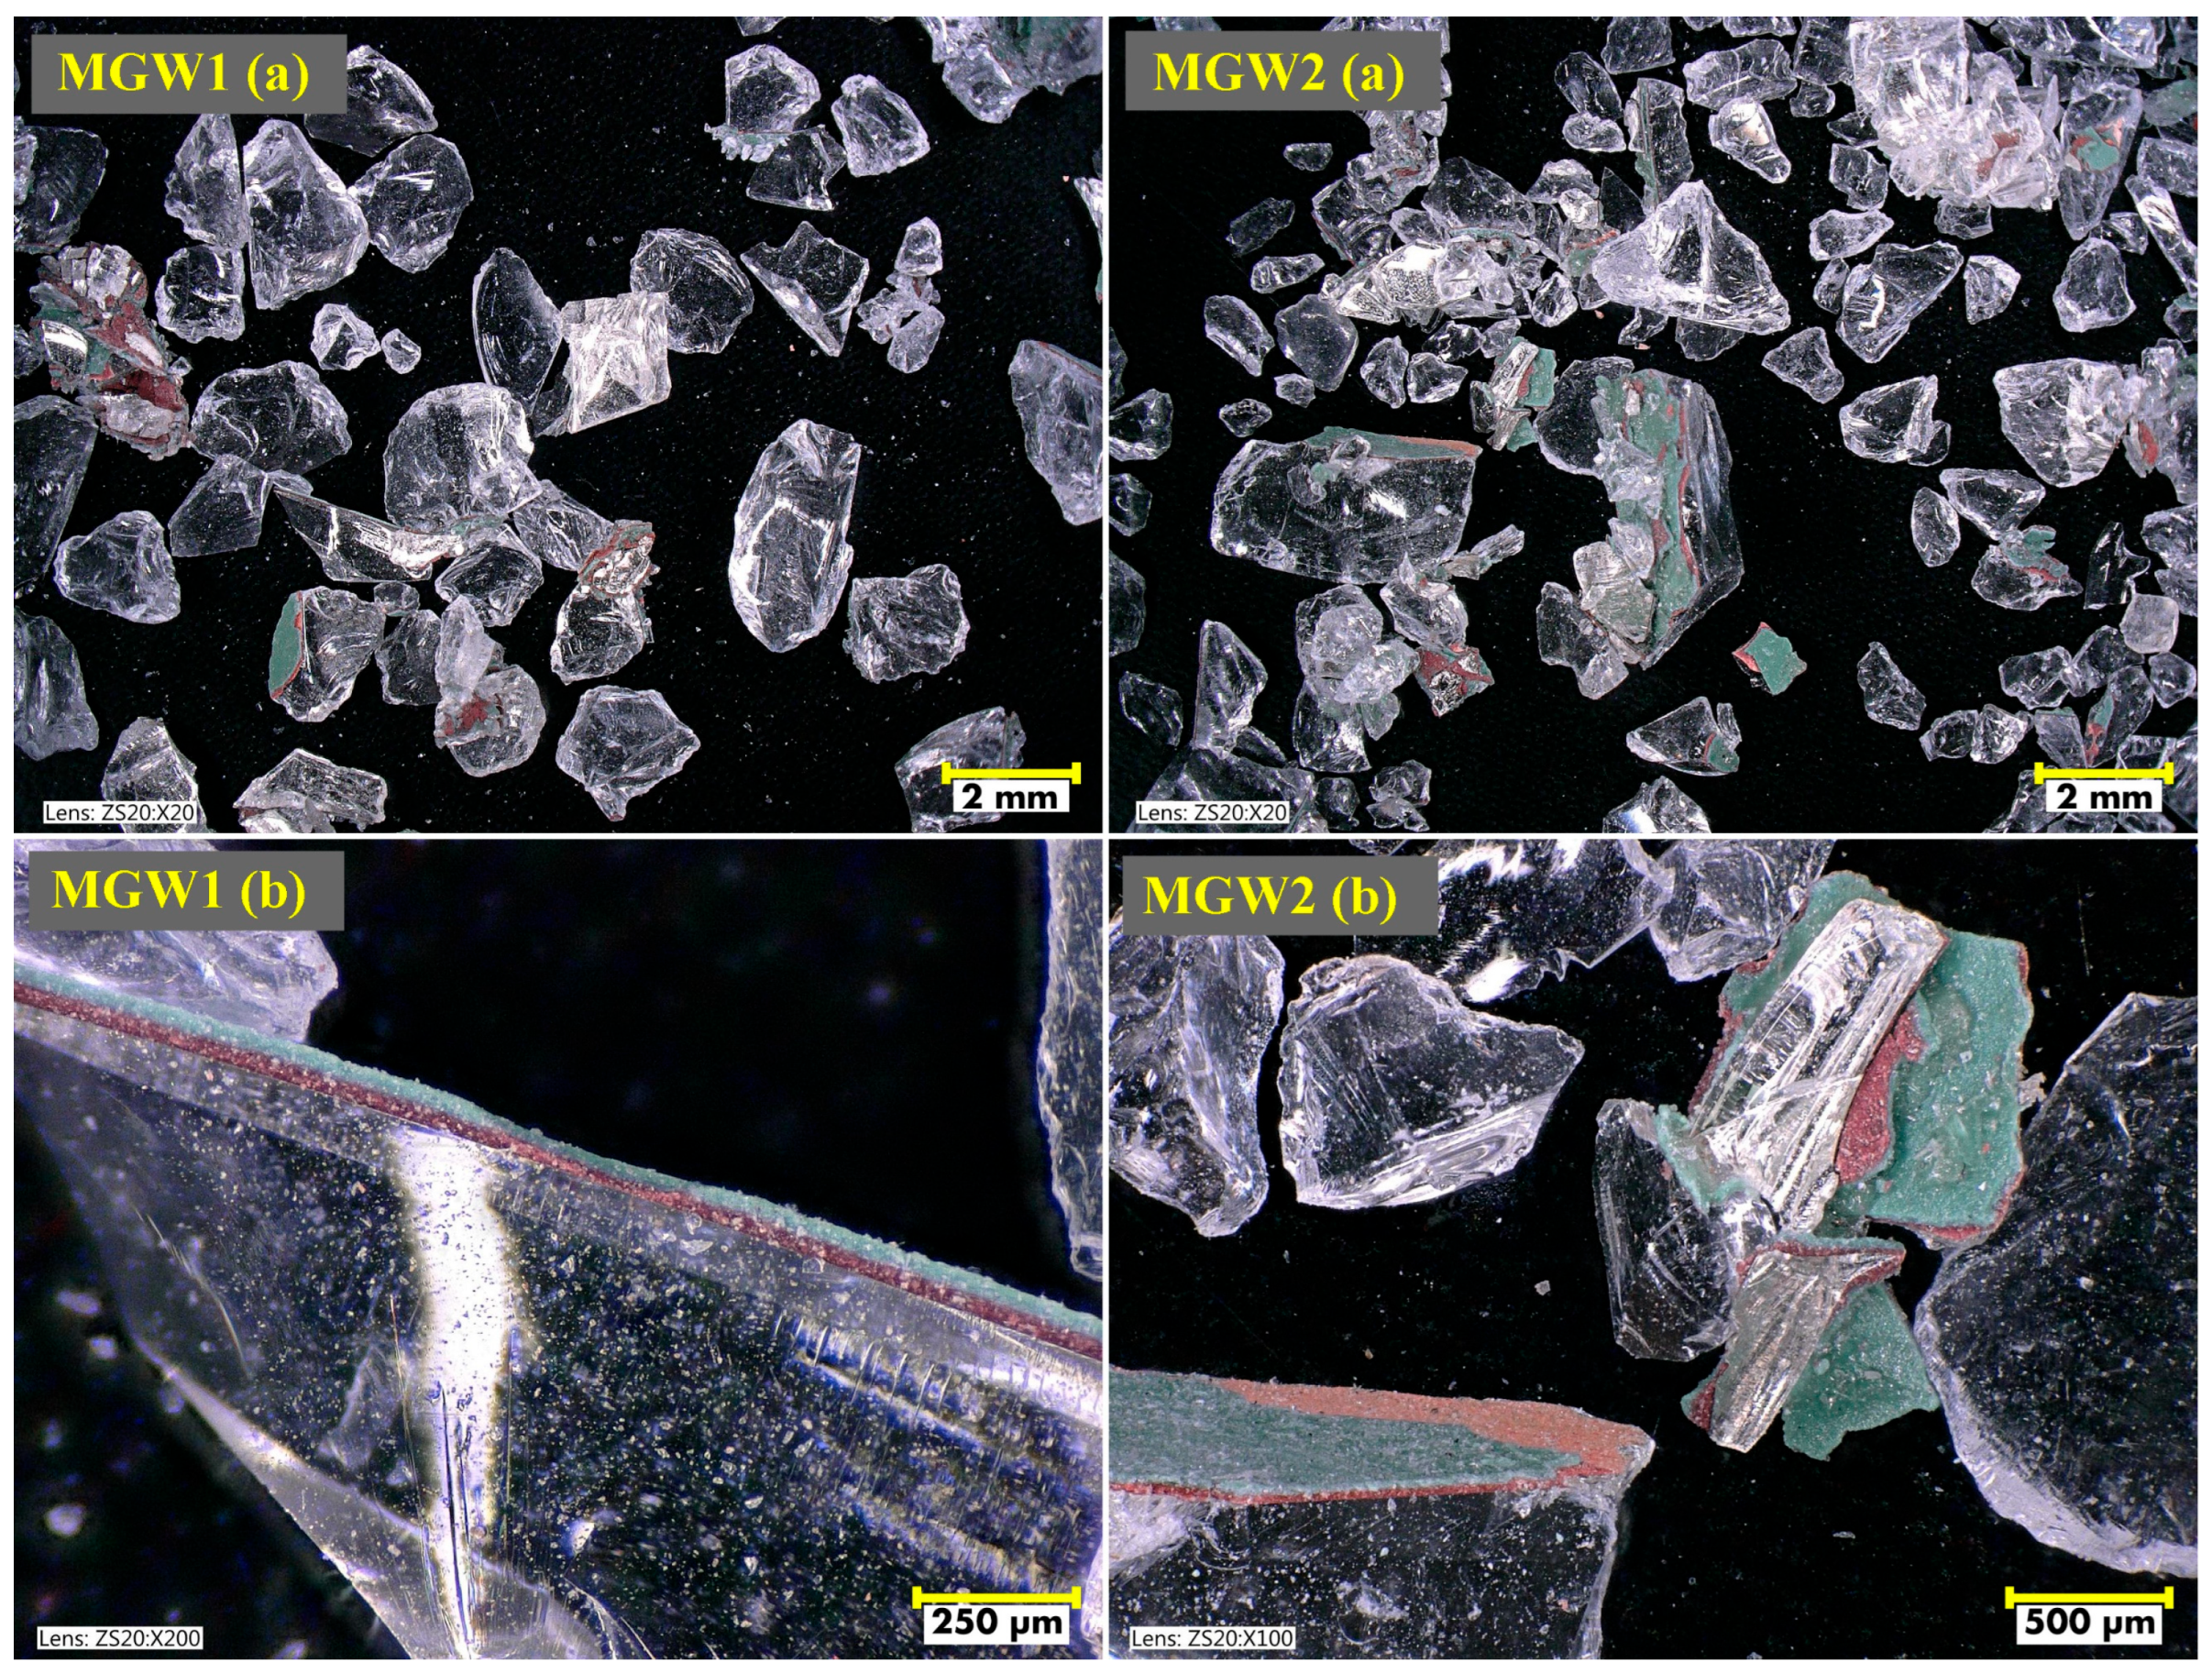
Figure 1 shows the mirror glass debris MGW1 and MGW2, observed using a digital microscope. The particles exhibit irregular, non-spherical shapes with sharp edges and a wide range of sizes. Residual layers originating from the original mirror coating are visible on the surface of some particles.
The chemical analysis of two types of mirror glass waste (MGW1 and MGW2), presented in Table 2, has revealed a very similar composition typical of soda-lime glass. Both samples contain approximately 69% of SiO2, confirming their predominantly silicate character. There is also a significant proportion of Na2O (about 10%) and CaO (about 11%), which act as fluxing components and glass stabilizers. The MgO content is around 4.6%, whereas Al2O3 is present only in low concentrations (0.5–0.6%). The loss on ignition (LOI) is low (~1.5–1.6%), indicating that the material is predominantly inorganic in nature and does not contain significant amounts of volatile components or organic admixtures.
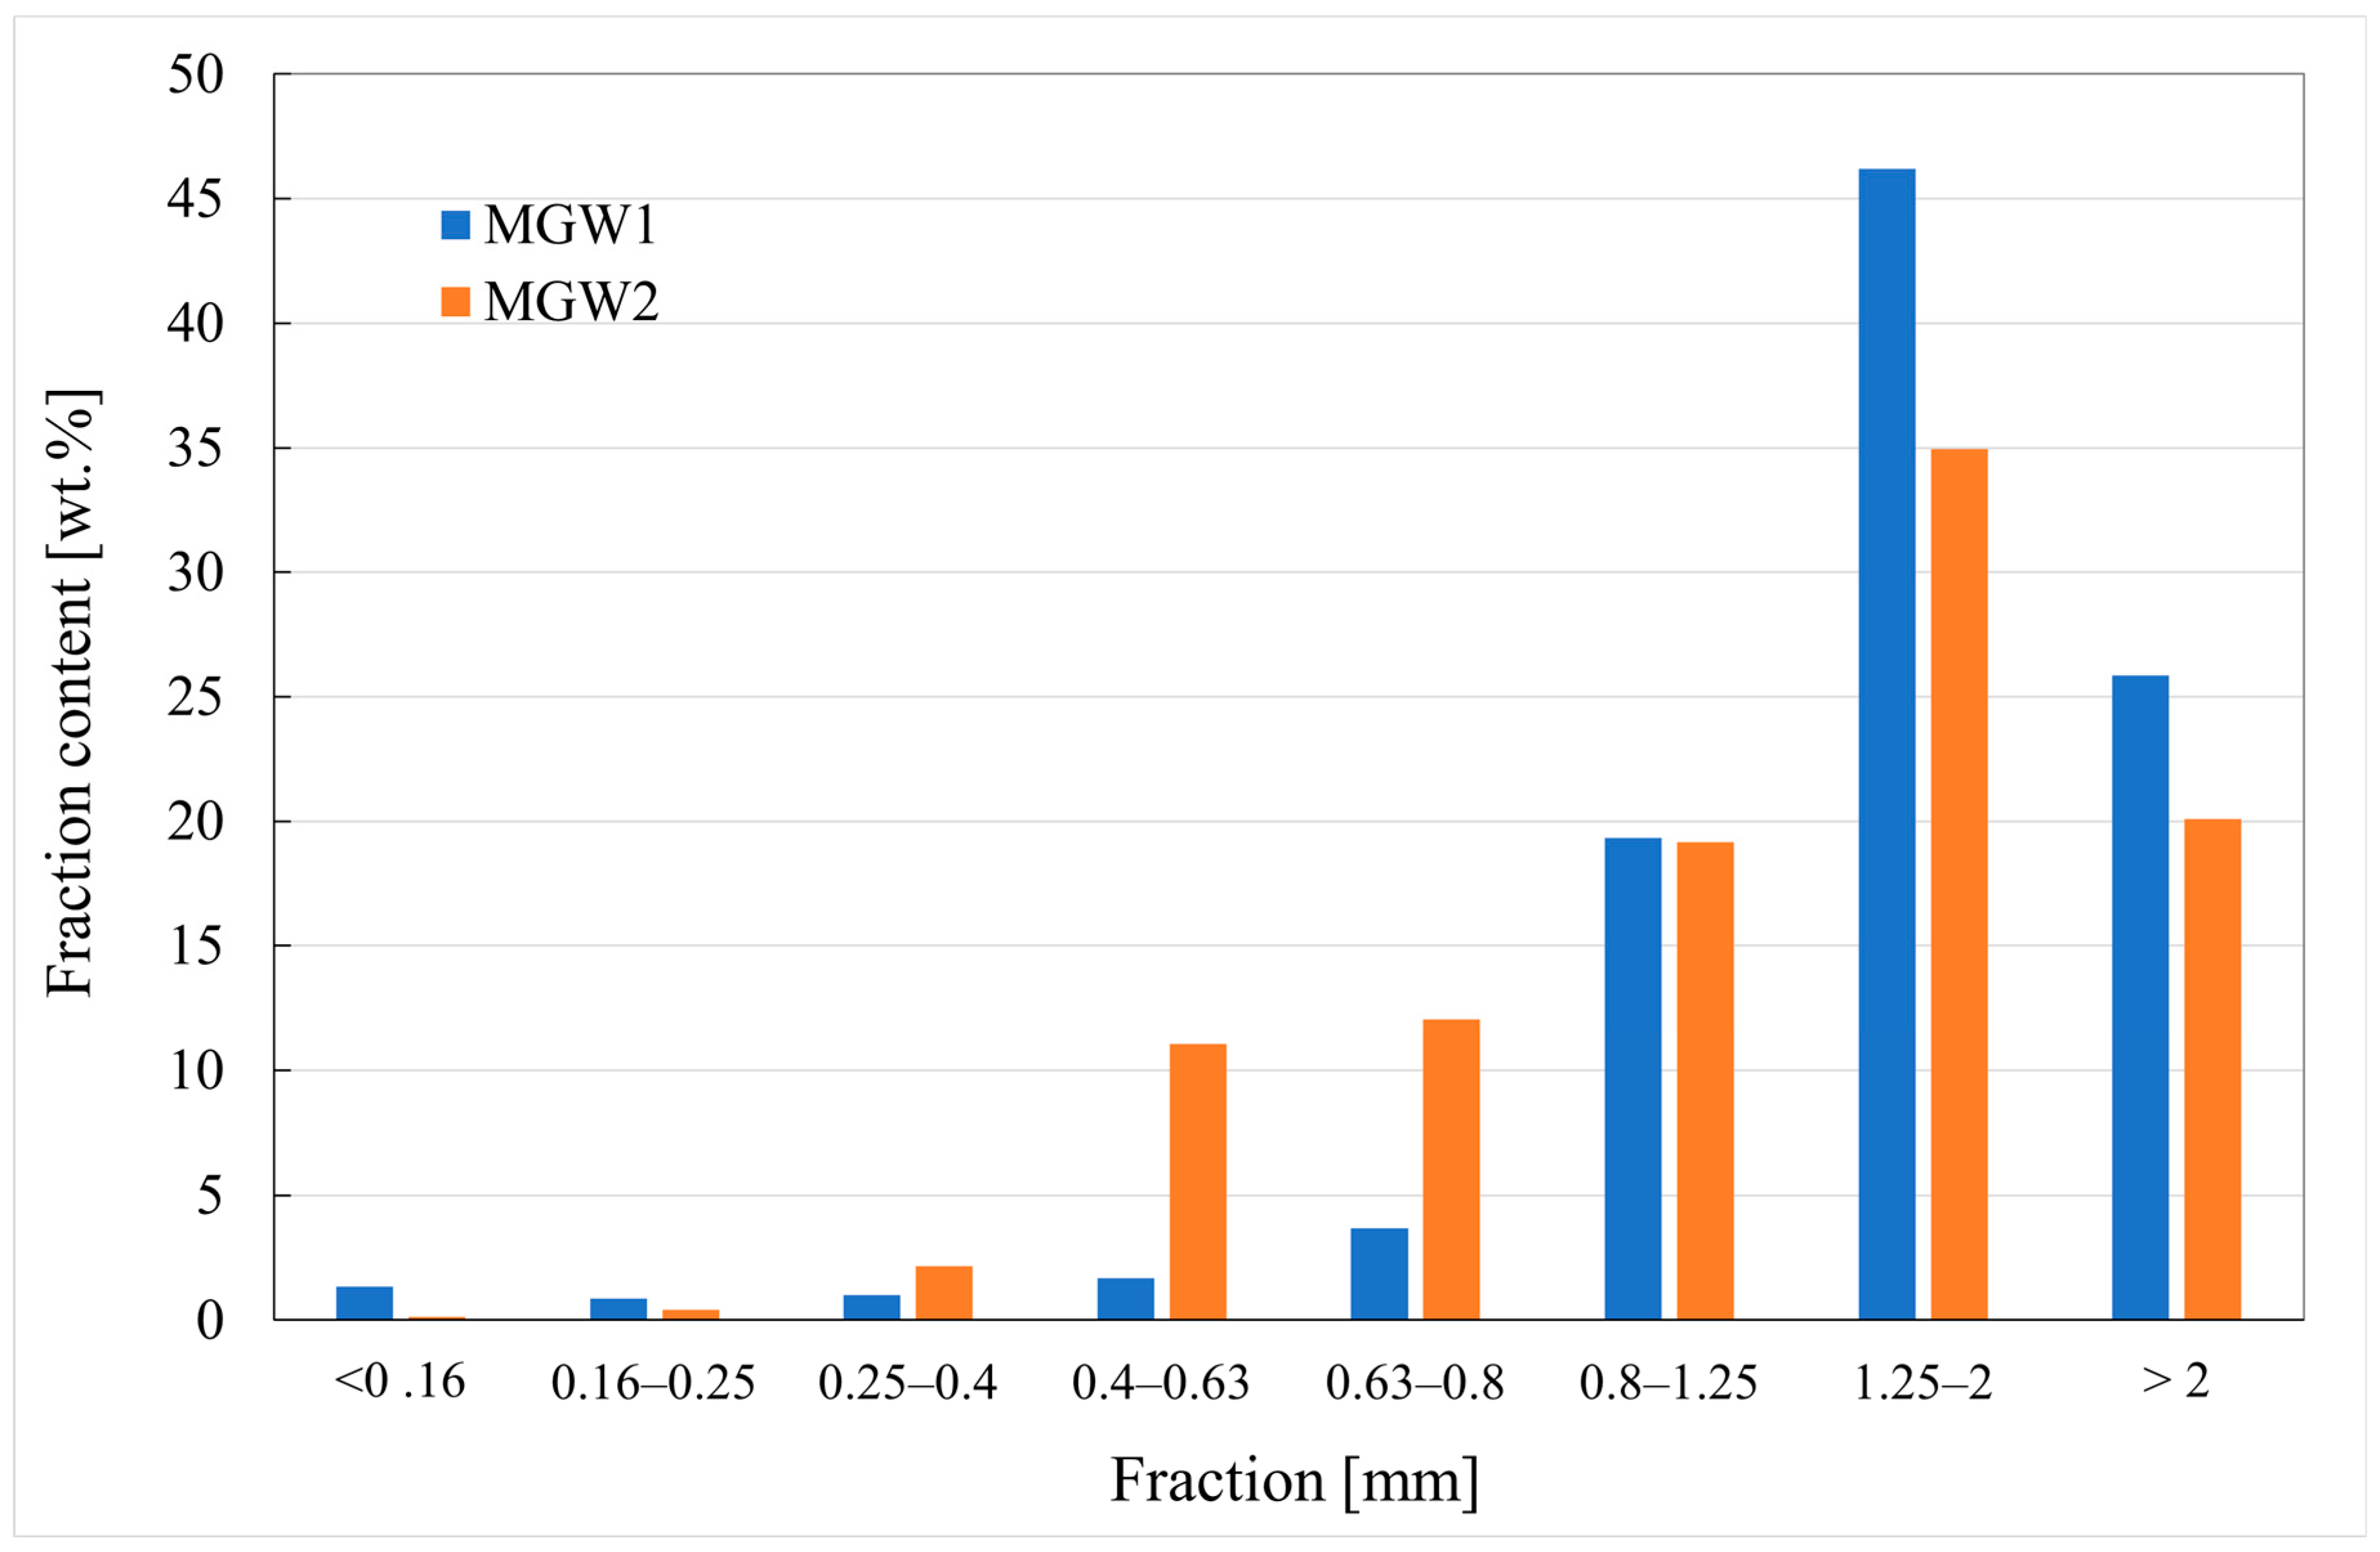
The grain-size distributions of the MGW1 and MGW2 fractions determined by sieving show similar characteristics, with slight differences in the proportion of each fraction (Figure 2). In both samples, there is a predominance of particles larger than 1.25 mm, accounting for approximately 72% in MGW1 and 55% in MGW2. MGW2 contains a higher proportion of medium-fine fractions (mainly 0.4–0.8 mm) than MGW1, which may slightly affect its workability or the structure of the resulting material. The proportion of fine particles (<0.4 mm) is relatively low in both materials, with its being slightly higher in MGW2 than in MGW1.
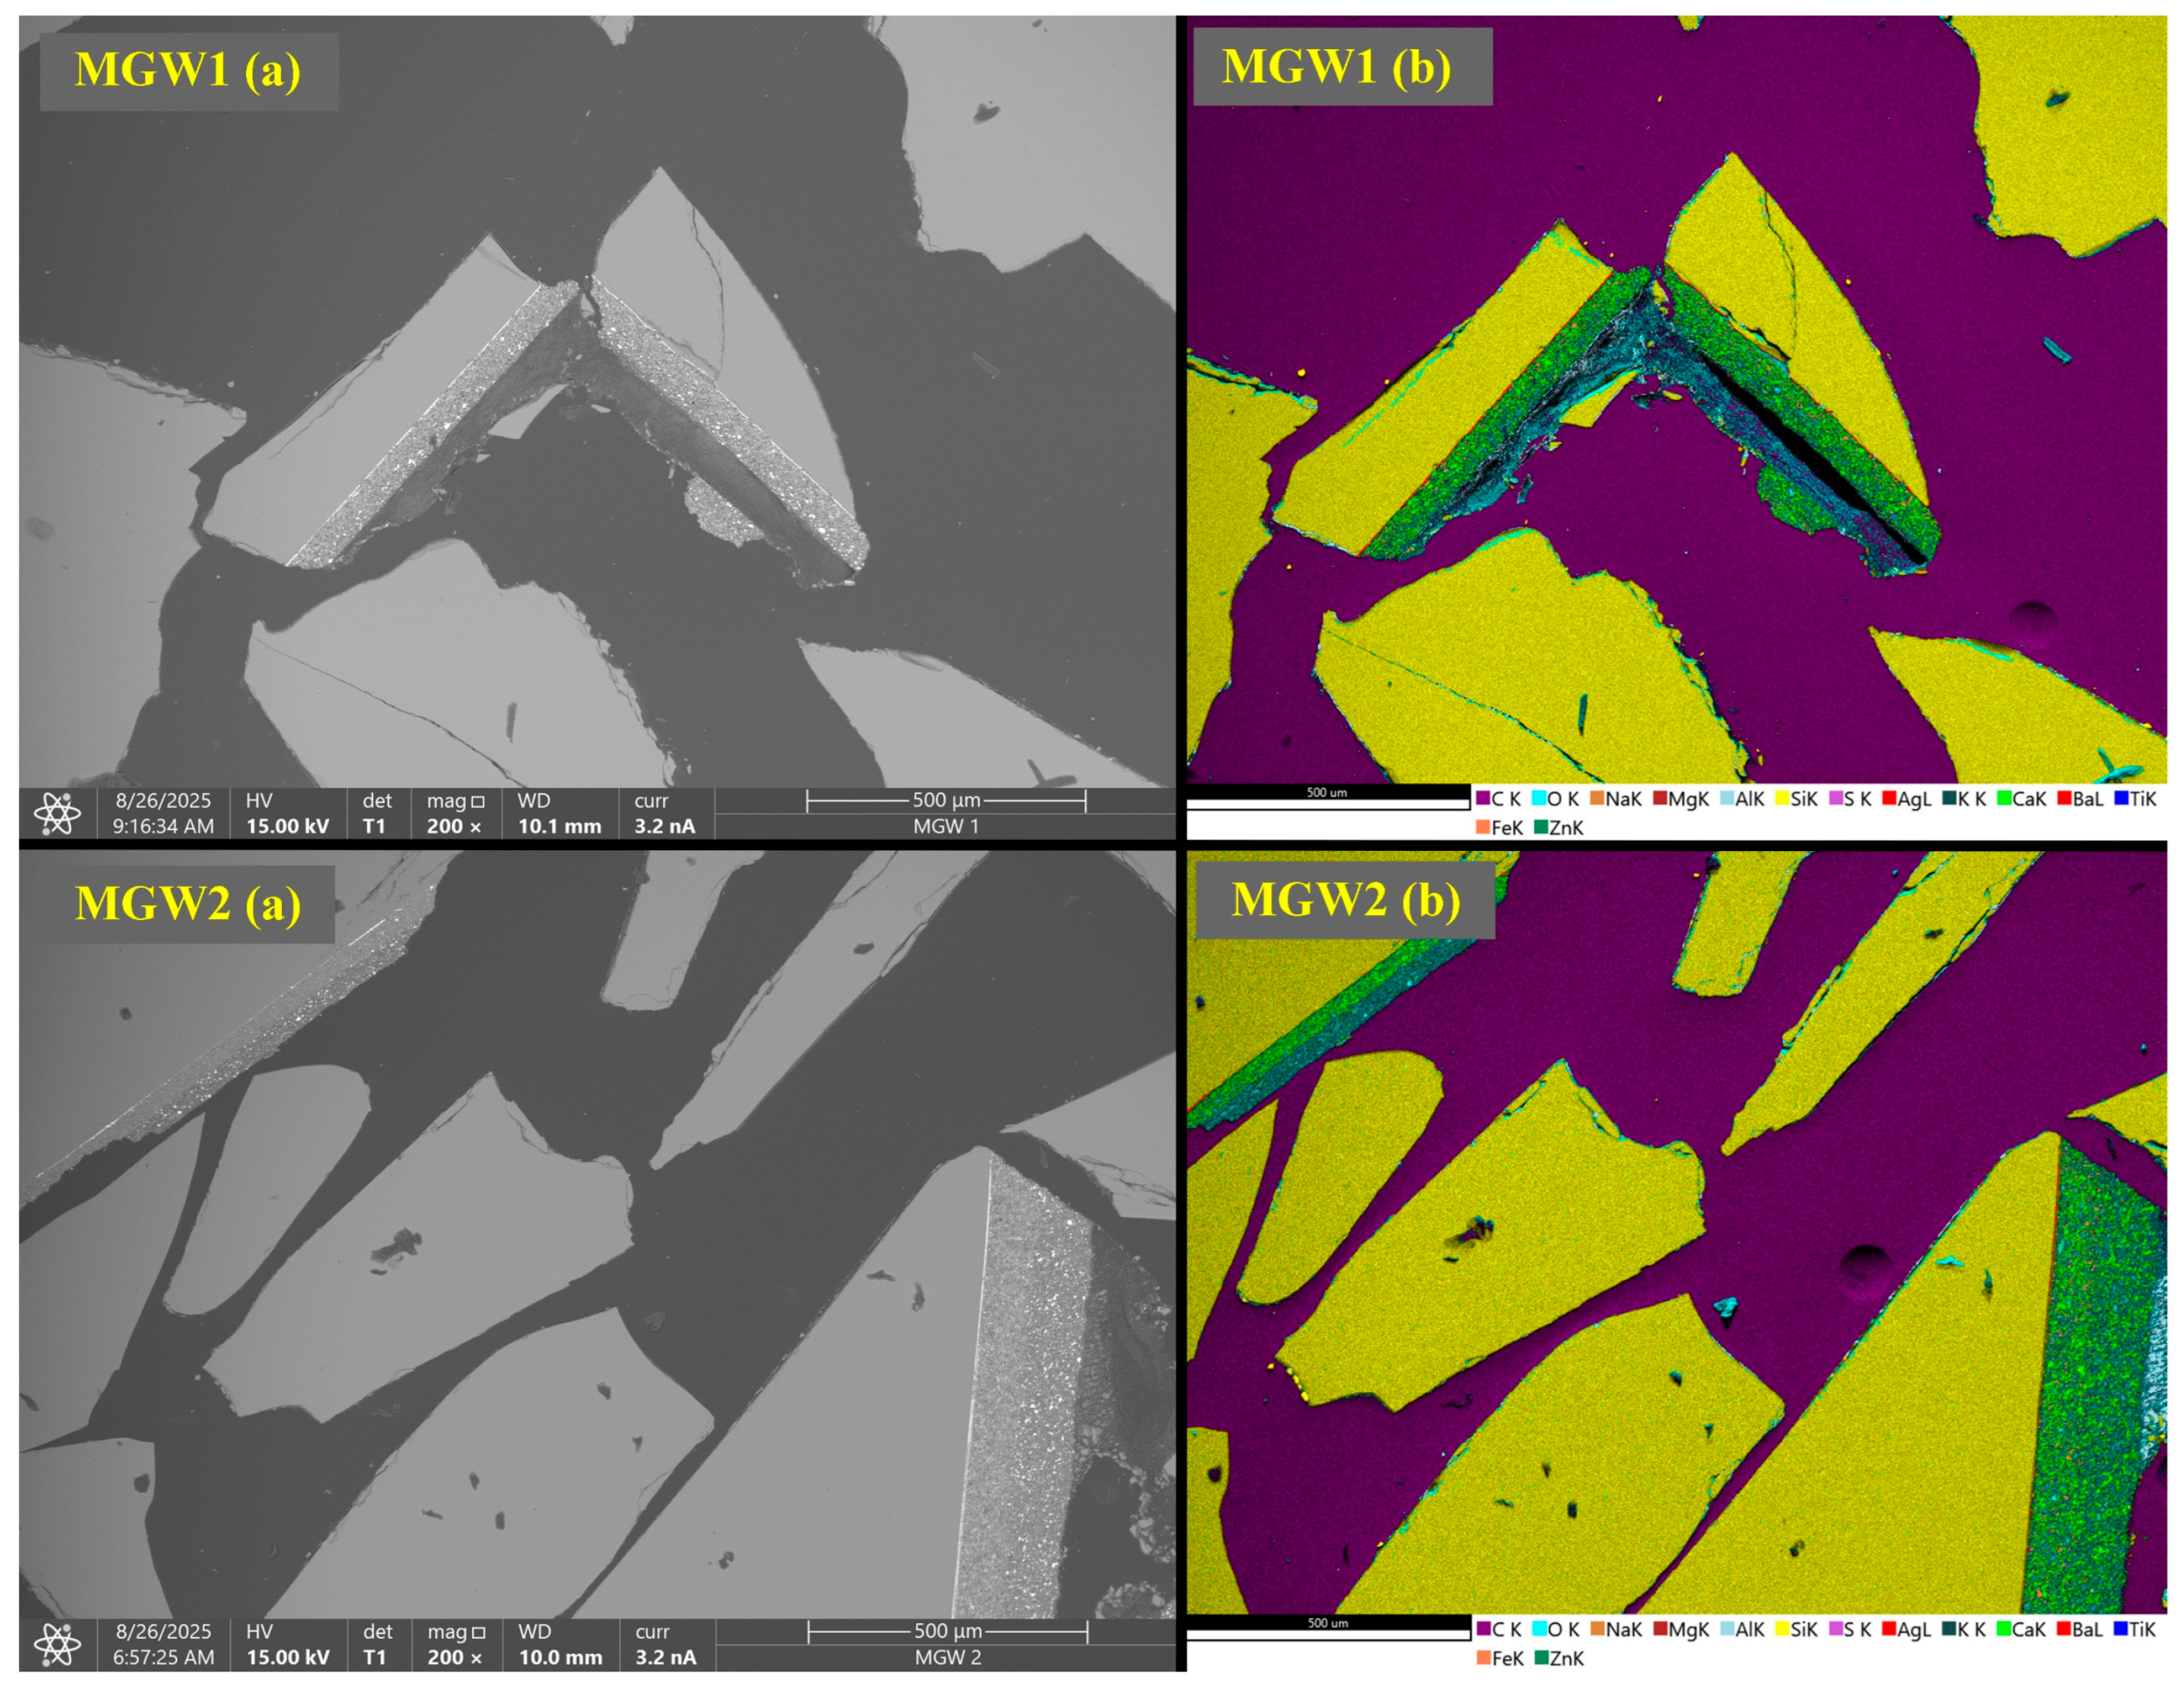
Figure 3 shows SEM images (a) and EDS maps (b) of the mirror glass waste samples MGW1 and MGW2. Detailed EDS analyses of both types of MGW are presented in Figures S1 and S2 and in Tables S3 and S4 of the Supplementary Materials. The results are consistent with the chemical analysis of both types of mirror glass waste (Table 2). The glass matrix consists mainly of silicon, oxygen, sodium and calcium, corresponding to soda-lime glass.
The layers forming the mirror are clearly visible in the SEM images. EDS maps of the cross-sections (MGW1 and MGW2, 200×) and EDS analyses reveal the presence of three thin coatings. The first layer contains predominantly silver (Ag) with minor traces of silicon (Si) and sulfur (S). The second layer consists of calcium (Ca) accompanied by zinc (Zn), magnesium (Mg) and silicon (Si). The third layer is formed by barium (Ba), silicon (Si), calcium (Ca), magnesium (Mg), sulfur (S) and titanium (Ti). These elements correspond to a typical mirror structure—a silver reflective layer deposited on barium-based backing layers (likely BaSO4 and/or BaTiO3), possibly covered by a zinc-containing protective paint [31,32,33,34]. Minor traces of Fe and Al are also present.
From the mineralogical point of view (Table 3), both MGW samples contain the majority of the amorphous phase (over 98 wt.%) and trace amounts of quartz, calcite and zincite (up to 0.5 wt.%).
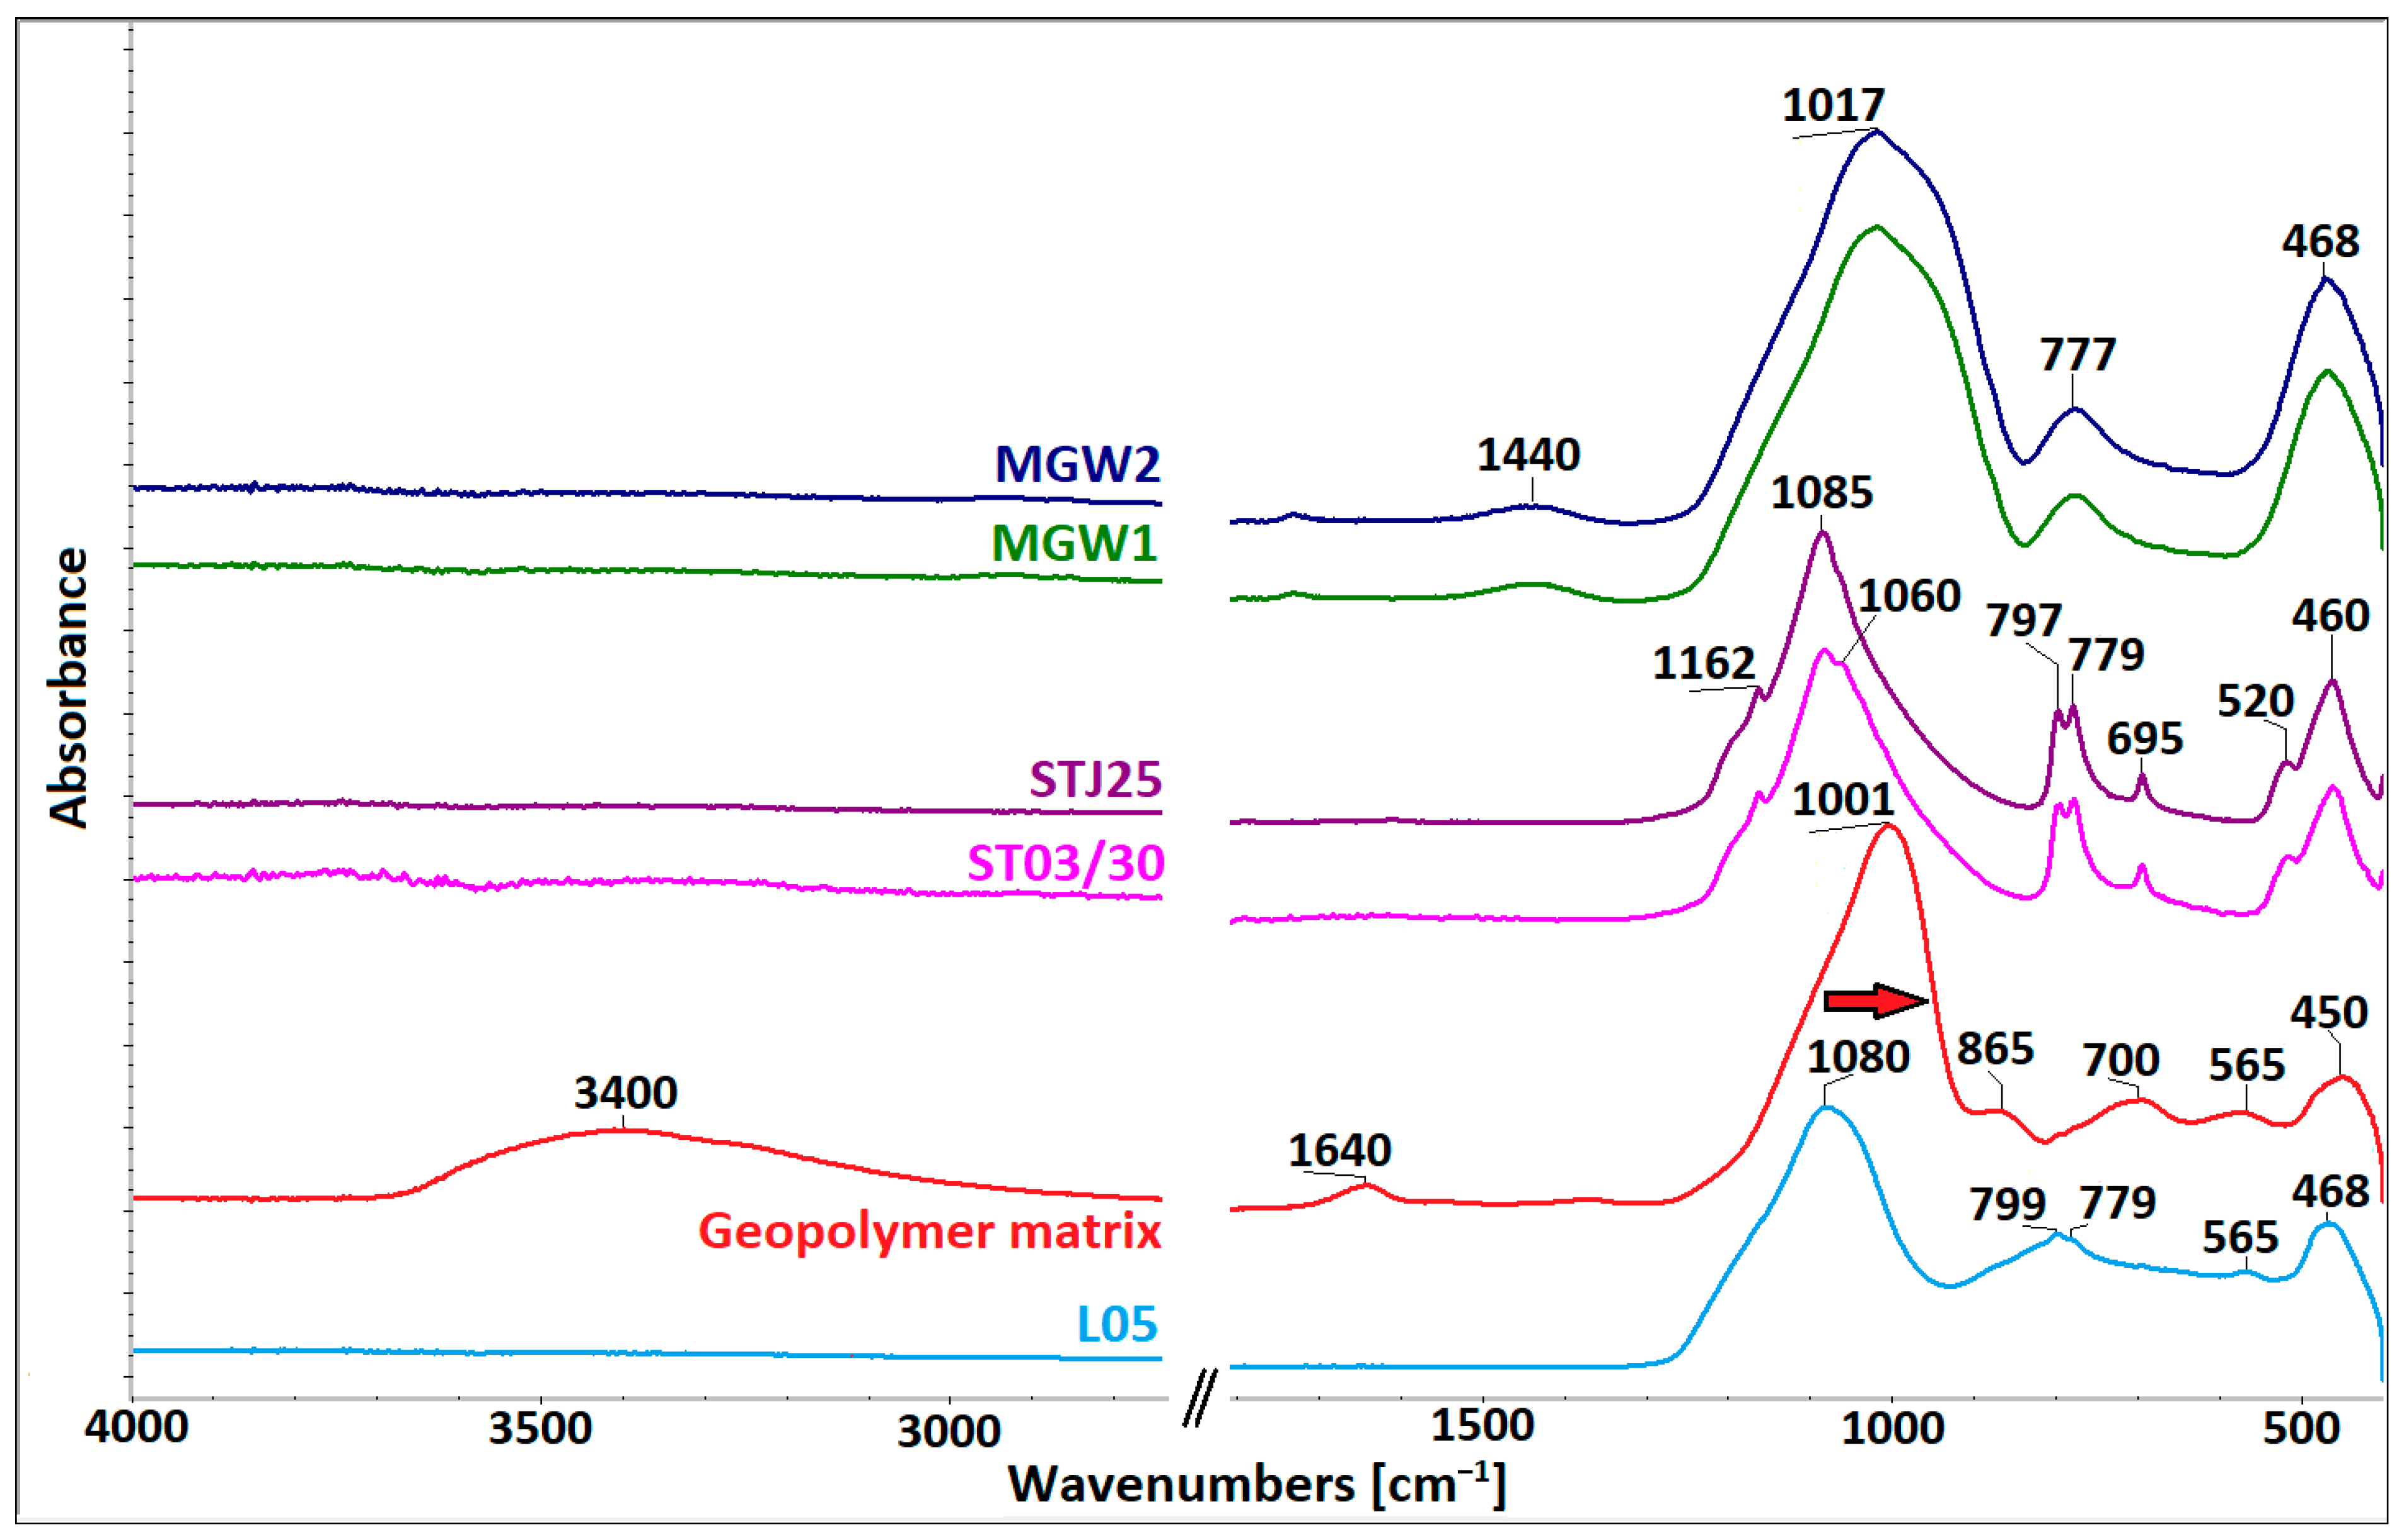
The ATR-FTIR spectra of all input materials and their comparison with the L05 clay material and the geopolymer matrix are shown in Figure 4.
The clay material (L05) shows broad bands associated with the asymmetric stretching and bending of Si–O, as well as the asymmetric stretching of Si–O–Al groups, at 1080 cm−1, ~780 cm−1, and 468 cm−1. Distinct peaks at 799 and 779 cm−1 indicate the presence of quartz [35] as a minor impurity. Alkaline activation of L05 and the subsequent formation of the geopolymer matrix are indicated by a shift in the main Si–O–T asymmetric stretching band from 1080 cm−1 to 1001 cm−1 (red arrow in Figure 4). This change reflects the incorporation of AlO4 units into SiO4 tetrahedra, forming a Si–O–Al network [36,37]. Additional weak band at 865 cm−1 arises from Si–OH bending [38], while the shoulder near 560 cm−1 is attributed to silicates or aluminosilicates with long-range order [39]. Bands at 3400 cm−1 and 1640 cm−1 correspond to the stretching and bending of OH groups in water, indicating residual moisture in geopolymer matrix [40].
The ATR-FTIR spectra of MGW1 and MGW2 mirror glass waste samples exhibit identical spectral features. They display a broad, intense band between 1250 and 840 cm−1 with a peak at 1017 cm−1, and a band at 450–470 cm−1, attributed to O–Si–O bending (ν4) and Si–O asymmetric stretching (ν3) in SiO4 tetrahedra [35]. A weak band at 777 cm−1 reflects Si–O–Si symmetric stretching of bridging oxygens [41], while another at 1440 cm−1 corresponds to the asymmetric stretching of C–O bond and out-of-plane bending of O-C-O in carbonate groups. The major absorption band in the spectra of STJ25 and ST03/30 is located at 1200–850 cm−1. This broad band contains several subbands assigned to asymmetric stretching vibrations belonging to various optically active symmetries (A2 and E) in quartz [42]. The remaining absorption features located in the region of 800–400 cm−1 are attributable to symmetric stretching and to the Si–O–Si bending in SiO4, respectively [43]. The differences in the ST spectra are related to the width of the main absorption band at 1200–850 cm−1; the material ST03/30 exhibits broadening of the entire envelope, which may be attributed to decreased internal order, i.e., reduced crystallinity [44].

3.2. The Characterization of Geopolymer Composites

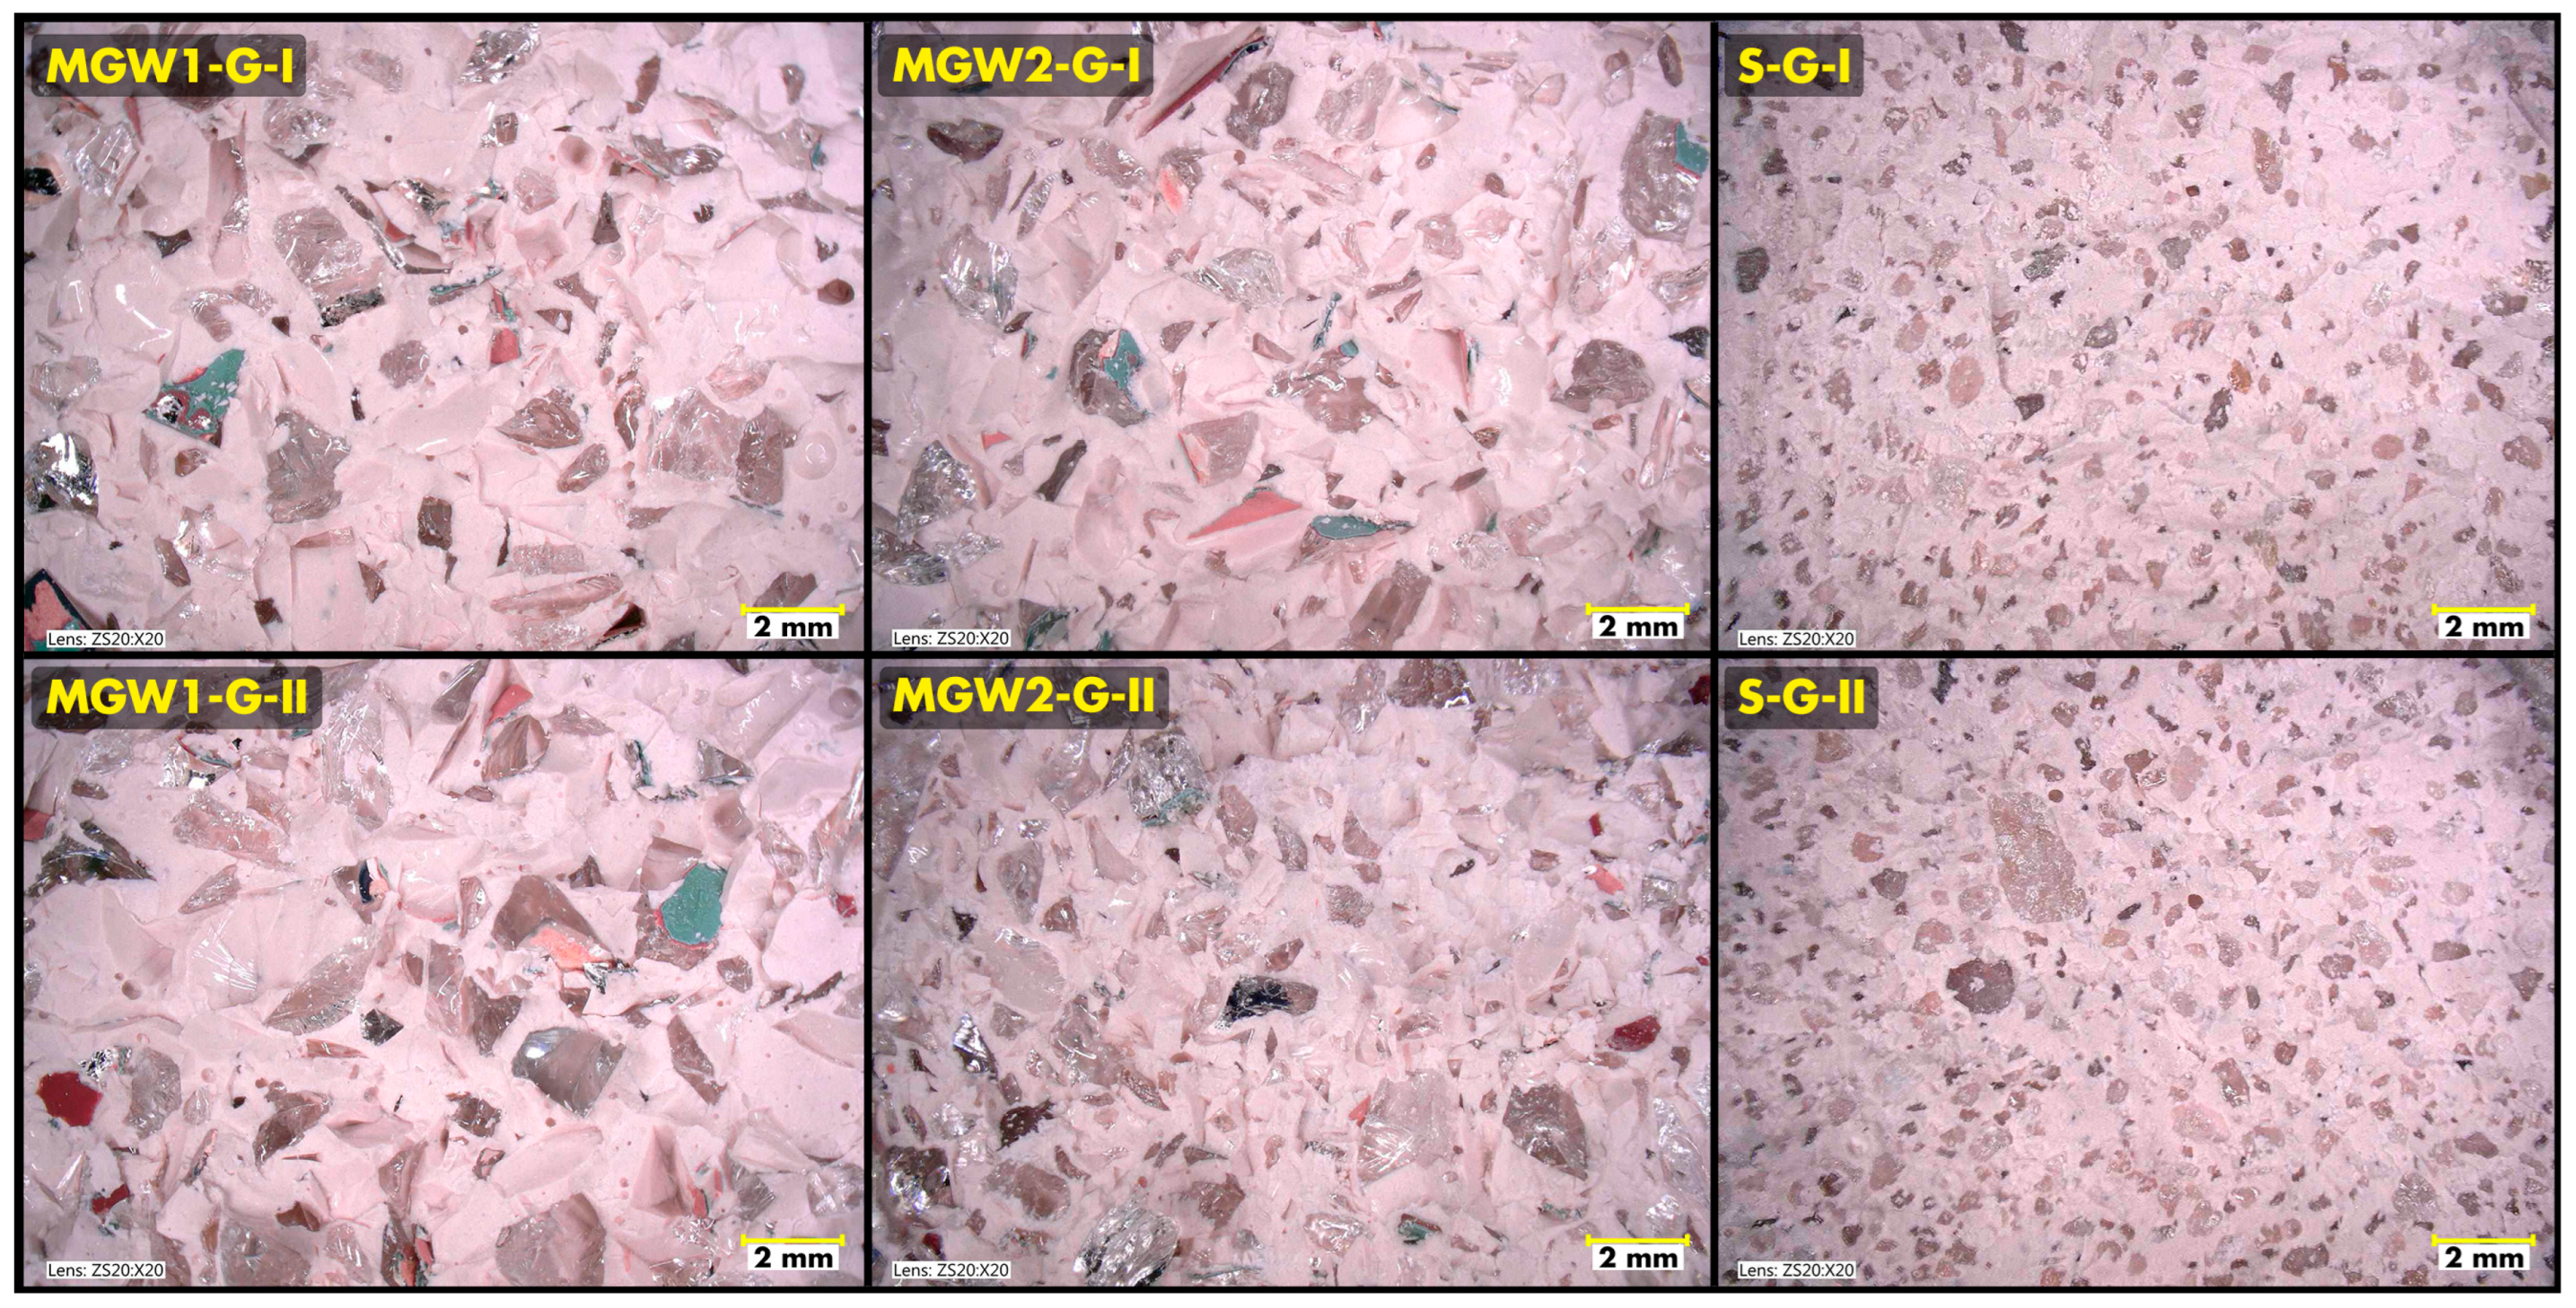
Digital-microscope images (Figure 5) have revealed clear differences in the distribution and morphology of the aggregates used in geopolymer composites on their fracture surfaces. In both MGW1 and MGW2 systems, mirror glass waste appears as angular, reflective fragments that are well embedded in the geopolymer matrix. An increase in aggregate content from variant I to II results in a visibly denser distribution of MGW particles, although the overall distribution remains relatively uniform. MGW2 exhibits slightly finer and more heterogeneous fragments than MGW1, which is consistent with the granulometric analysis (Figure 2). In contrast, sand-based composites (S-G-I and S-G-II) have displayed a much more homogeneous microstructure with uniformly sized, rounded particles and a more continuous matrix phase. The smoother morphology of sand composites may contribute to their slightly higher mechanical strength observed in the tested systems. Overall, the images confirm the effective incorporation of both types of mirror glass waste while highlighting the internal morphological differences between recycled glass and natural sand.
The chemical composition of geopolymer samples (Table 4) varies significantly depending on the type and quantity of the aggregate used. Samples with mirror glass aggregate (MGW1-G, MGW2-G) exhibit higher contents of alkali oxides (Na2O, K2O) and CaO than samples with silica sand (S-G), indicating partial reactivity of glass aggregate in an alkaline environment [45]. As the aggregate content increases (variant II), there is generally a slight increase in SiO2 and a corresponding decrease in Al2O3 and alkali oxides, consistent with the dilution of the geopolymer matrix by the inactive component. This trend is most pronounced in samples with inert sand, where higher aggregate content leads to a more significant decrease in active components and a parallel increase in SiO2.
Loss-on-ignition (LOI) observed in the hardened mixtures probably reflects the release of physically and chemically bound water and the decomposition of partially carbonated reaction products in the binder during heating to 1000 °C. For this reason, LOI values are generally higher in samples with lower aggregate content, where the proportion of binder is higher. These assumptions are further discussed and supported by XRD results and thermal analysis presented later in the manuscript.
The data obtained confirm that both the type and the amount of aggregate significantly influence the chemical composition and, consequently, the potential reactivity and properties of geopolymer composites, which is consistent with the literature [46,47].
The results presented in Table 5 show that the flexural strength of samples with waste mirror glass (MGW-G) was significantly lower than that of sand-based reference geopolymers (S-G) at all curing stages. MGW-based samples achieved values between 3.9 and 5.7 MPa, while S-G mixtures reached 8–11 MPa. For all samples, flexural strength increased slightly from 7 to 28 days, indicating ongoing geopolymerization, followed by a slight decrease or stabilization after 90 days.
Among MGW-based mixtures, MGW2-G variants generally exhibited slightly higher flexural strength than MGW1-G, which may be related to differences in the particle size distribution or surface properties of the glass aggregate, affecting the matrix–aggregate interface. The differences between variants I and II (i.e., lower and higher aggregate contents, respectively) were small, suggesting that the aggregate content had only a limited effect on flexural strength.
The compressive-strength results summarized in Table 6 show a trend similar to that of flexural strength (Table 5). Geopolymers with sand (S-G) achieved the highest values, reaching up to 93.5 MPa after 28 days, whereas samples containing waste mirror glass (MGW-G) exhibited lower strength, typically in the range of 60–70 MPa. All mixtures exhibited an increase in compressive strength between 7 and 28 days, confirming ongoing geopolymerization and matrix densification during this period. Between 28 and 90 days, only minor changes were observed, suggesting that the reaction was nearly complete within the first month of curing. In particular, the slight decrease in compressive strength seen for S-G-II between 28 and 90 days is minor and can be attributed to slight drying, redistribution of internal moisture, or minor microstructural changes over time. In mixtures with higher aggregate content, such effects may become more noticeable due to a more sensitive matrix–aggregate interface, whereas systems with lower aggregate content generally exhibit a more continuous matrix and less pronounced variations. Overall, the mechanical properties of the studied geopolymers remain stable over time.
The differences between the MGW1-G and MGW2-G mixtures were marginal, indicating that the properties of the two types of mirror glass waste did not significantly affect the compressive strength overall. Similarly, the influence of aggregate content (variants I and II) was limited, although the S-G-II sample exhibited the highest strength of all. Overall, the replacement of sand with mirror glass waste led to a slight decrease in compressive strength, but the values obtained still indicate good mechanical performance for MGW-based geopolymers.
X-ray diffraction (XRD) analysis, presented in Table 7, shows significant differences in the mineralogical composition of geopolymer composites depending on the type of aggregate used. The initial mirror glass (MGW1 and MGW2) exhibits an almost completely amorphous character (98.4% amorphous phase) with only trace amounts of crystalline phases such as quartz, calcite and zincite. In the resulting MGW1-G-II and MGW2-G-II composites, the amorphous content remains high (96.0 and 96.3%), with crystalline phases present in similar concentrations as in the glass itself.
In contrast, the S-G-II sample with sand shows a completely different composition: The amorphous fraction is only 51%, while quartz constitutes almost half of the sample (48.7%). This result is consistent with the use of an inert, crystalline aggregate that does not participate in the geopolymer reaction and significantly reduces the relative amount of the geopolymer phase. The presence of other phases originating from the clay material (anatase, calcite) is minimal and does not significantly affect the interpretation.
These XRD results further suggest that the loss on ignition (LOI) values reported in Table 2 are primarily due to the release of physically and chemically bound water, given the low or negligible amount of carbonate phases in the geopolymer samples.
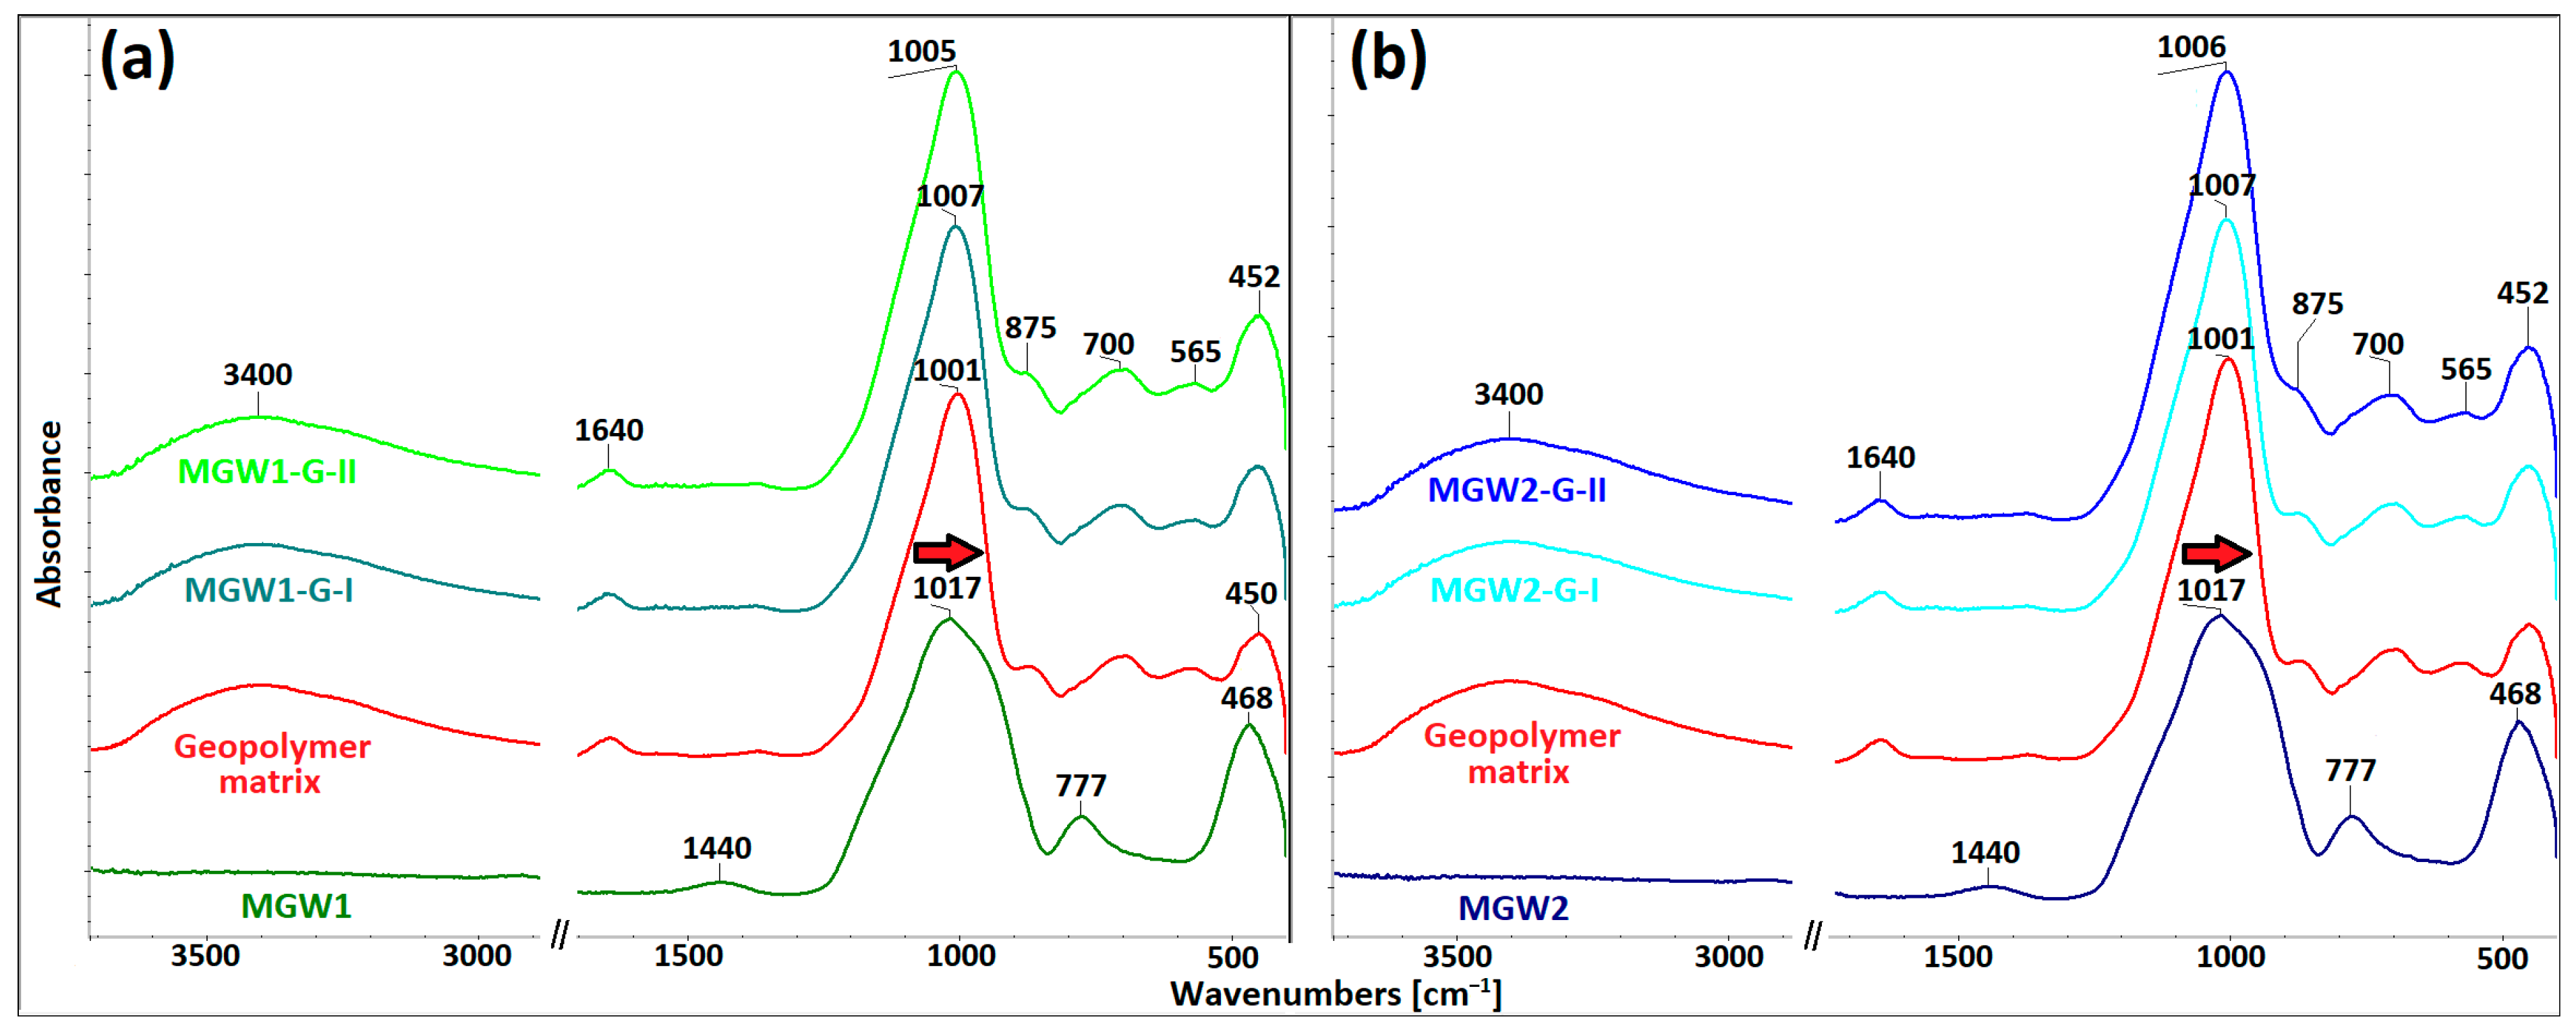
Spectroscopically, all final geopolymer materials, both the series MGW1 (Figure 6a) and MGW2 (Figure 6b), are identical. The positions of the principal band in MGW1 and MGW2 are 1017 cm−1, in the geopolymer matrix 1001 cm−1, and the geopolymer composites exhibit positions in the range of 1005–1007 cm−1. These values are within the resolution limit of the method (up to 4 cm−1). This shift (10–12 cm−1, red arrow in Figure 6) is smaller than that observed for automotive glass in our previous research [21], where this shift was 27–29 cm−1. A new weak band at approximately 700 cm−1 is attributable to the stretching and bending vibrations of Si–O–Al, providing another fingerprint for the generation of the geopolymer structure [48]. On the other hand, the original band at 777 cm−1, characterizing Si–O bonds in MGW1 and MGW2, disappears due to the geopolymer reaction.
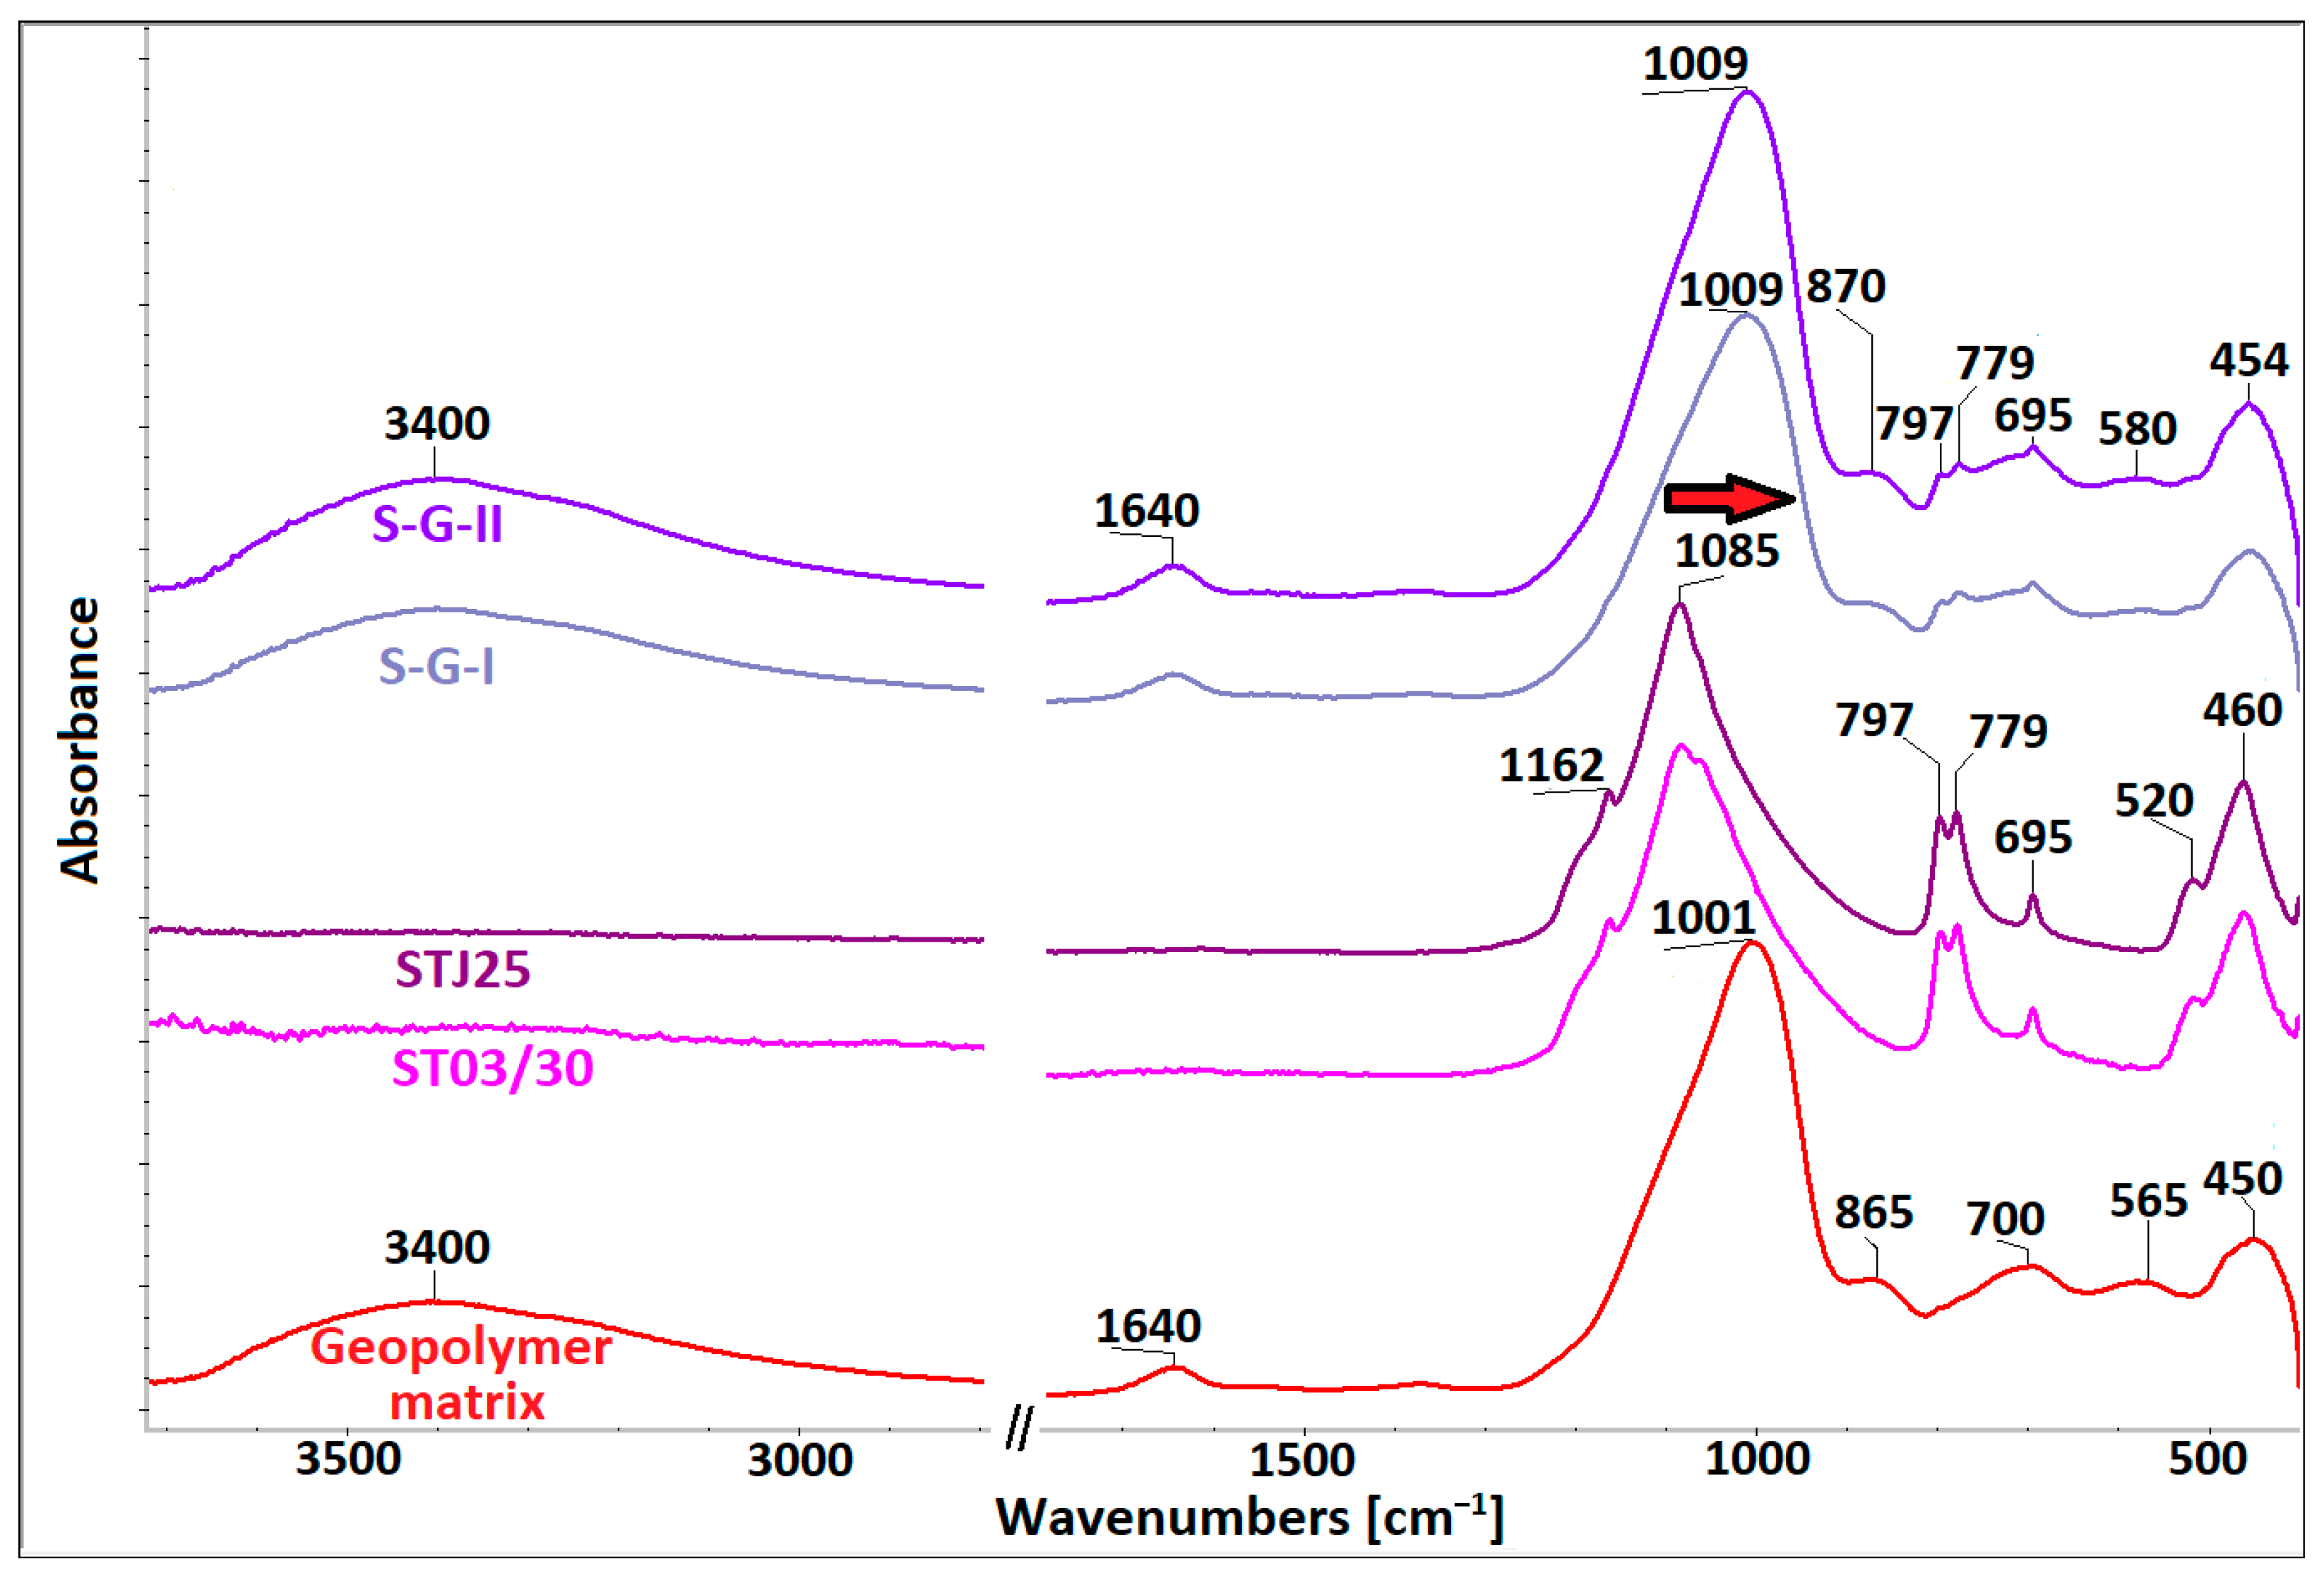
The sand filler is a mixture of STJ25 and ST03/30 materials; the positions of the principal bands in both spectra are at 1085 cm−1. The final geopolymer materials S-G-I and S-G-II (Figure 7) are identical, with the principal band in both spectra located at 1009 cm−1 and the shift of the principal band after geopolymerization to lower wavenumbers being 76 cm−1. A new weak band at approximately 700 cm−1, corresponding to the vibrations of Si–O–Al, provides further evidence of the generation of the geopolymer structure [48]. Very weak remnants of the bands at 779 and 797 cm−1, which originate from the sand filler, are still visible in the spectra of S-G geopolymers.
All the spectra of geopolymer composites also contain bands of the hydroxy groups (3400 and 1640 cm−1) originating from the geopolymer matrix. ATR-FTIR analysis has confirmed that the content of neither mirror glass waste nor sand filler negatively affects the progress of the geopolymer reaction.
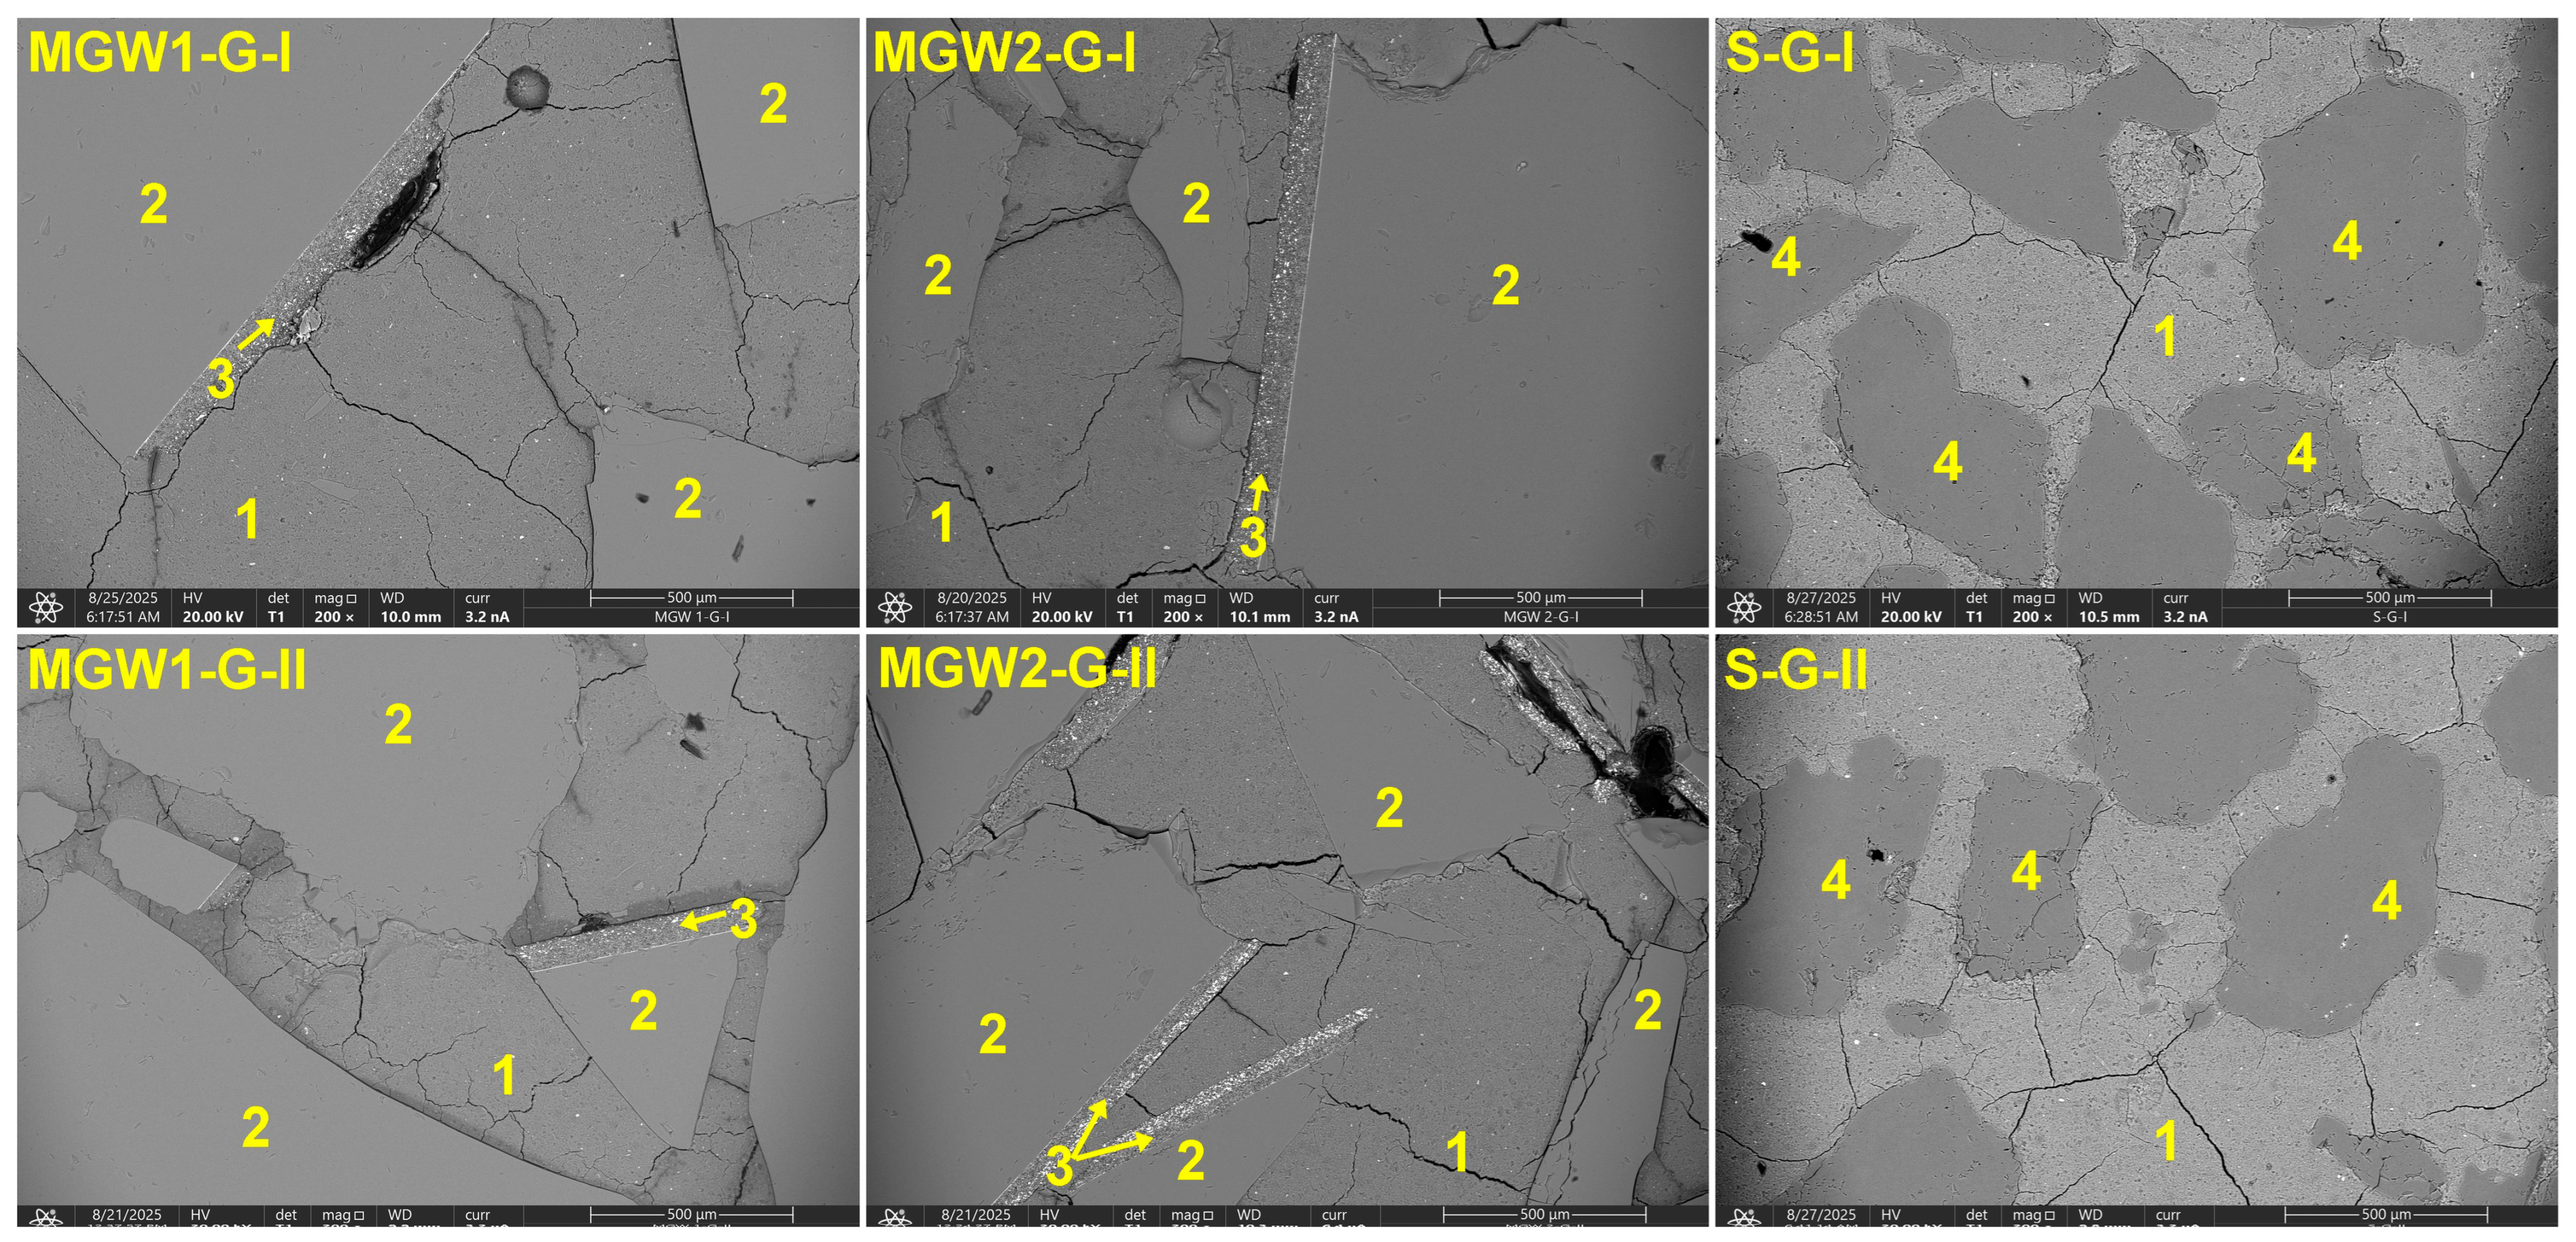
The SEM microstructures in Figure 8 show clear differences between the composites, arising from the distinct morphology of the mirror glass waste (MGW) and silica sand used as aggregates. MGW fragments (2) are sharp-edged and often carry thin metal coatings (3), which remain locally attached to their surfaces and form additional interfacial features. In contrast, silica sand grains (4) are rounded and smoother, resulting in simpler and more uniform interfaces with the geopolymer matrix (1). The matrix (1) forms a continuous phase in all samples; however, in type-II specimens, the higher aggregate content brings the particles into closer contact, reducing the proportion of continuous matrix and creating a more interconnected granular structure. In some cases, microcracks can be observed, which may originate either during the drying and shrinkage of the material or during the preparation of polished cross-sections for SEM analysis. The latter possibility is supported by the fact that some microcracks propagate through glass or quartz grains (e.g., MGW2-G-II and S-G-II). Overall, MGW-containing composites have a microstructure that reflects the angular shape of glass fragments and the presence of metal surface layers, whereas sand-filled composites exhibit a more uniform microstructure due to the rounded shape of quartz grains and their consistent bonding with the matrix. This observation is consistent with Kuri et al. [49], who reported that weak bonding at the interfacial transition zone between glass aggregates and the matrix can reduce compressive strength and increase porosity.
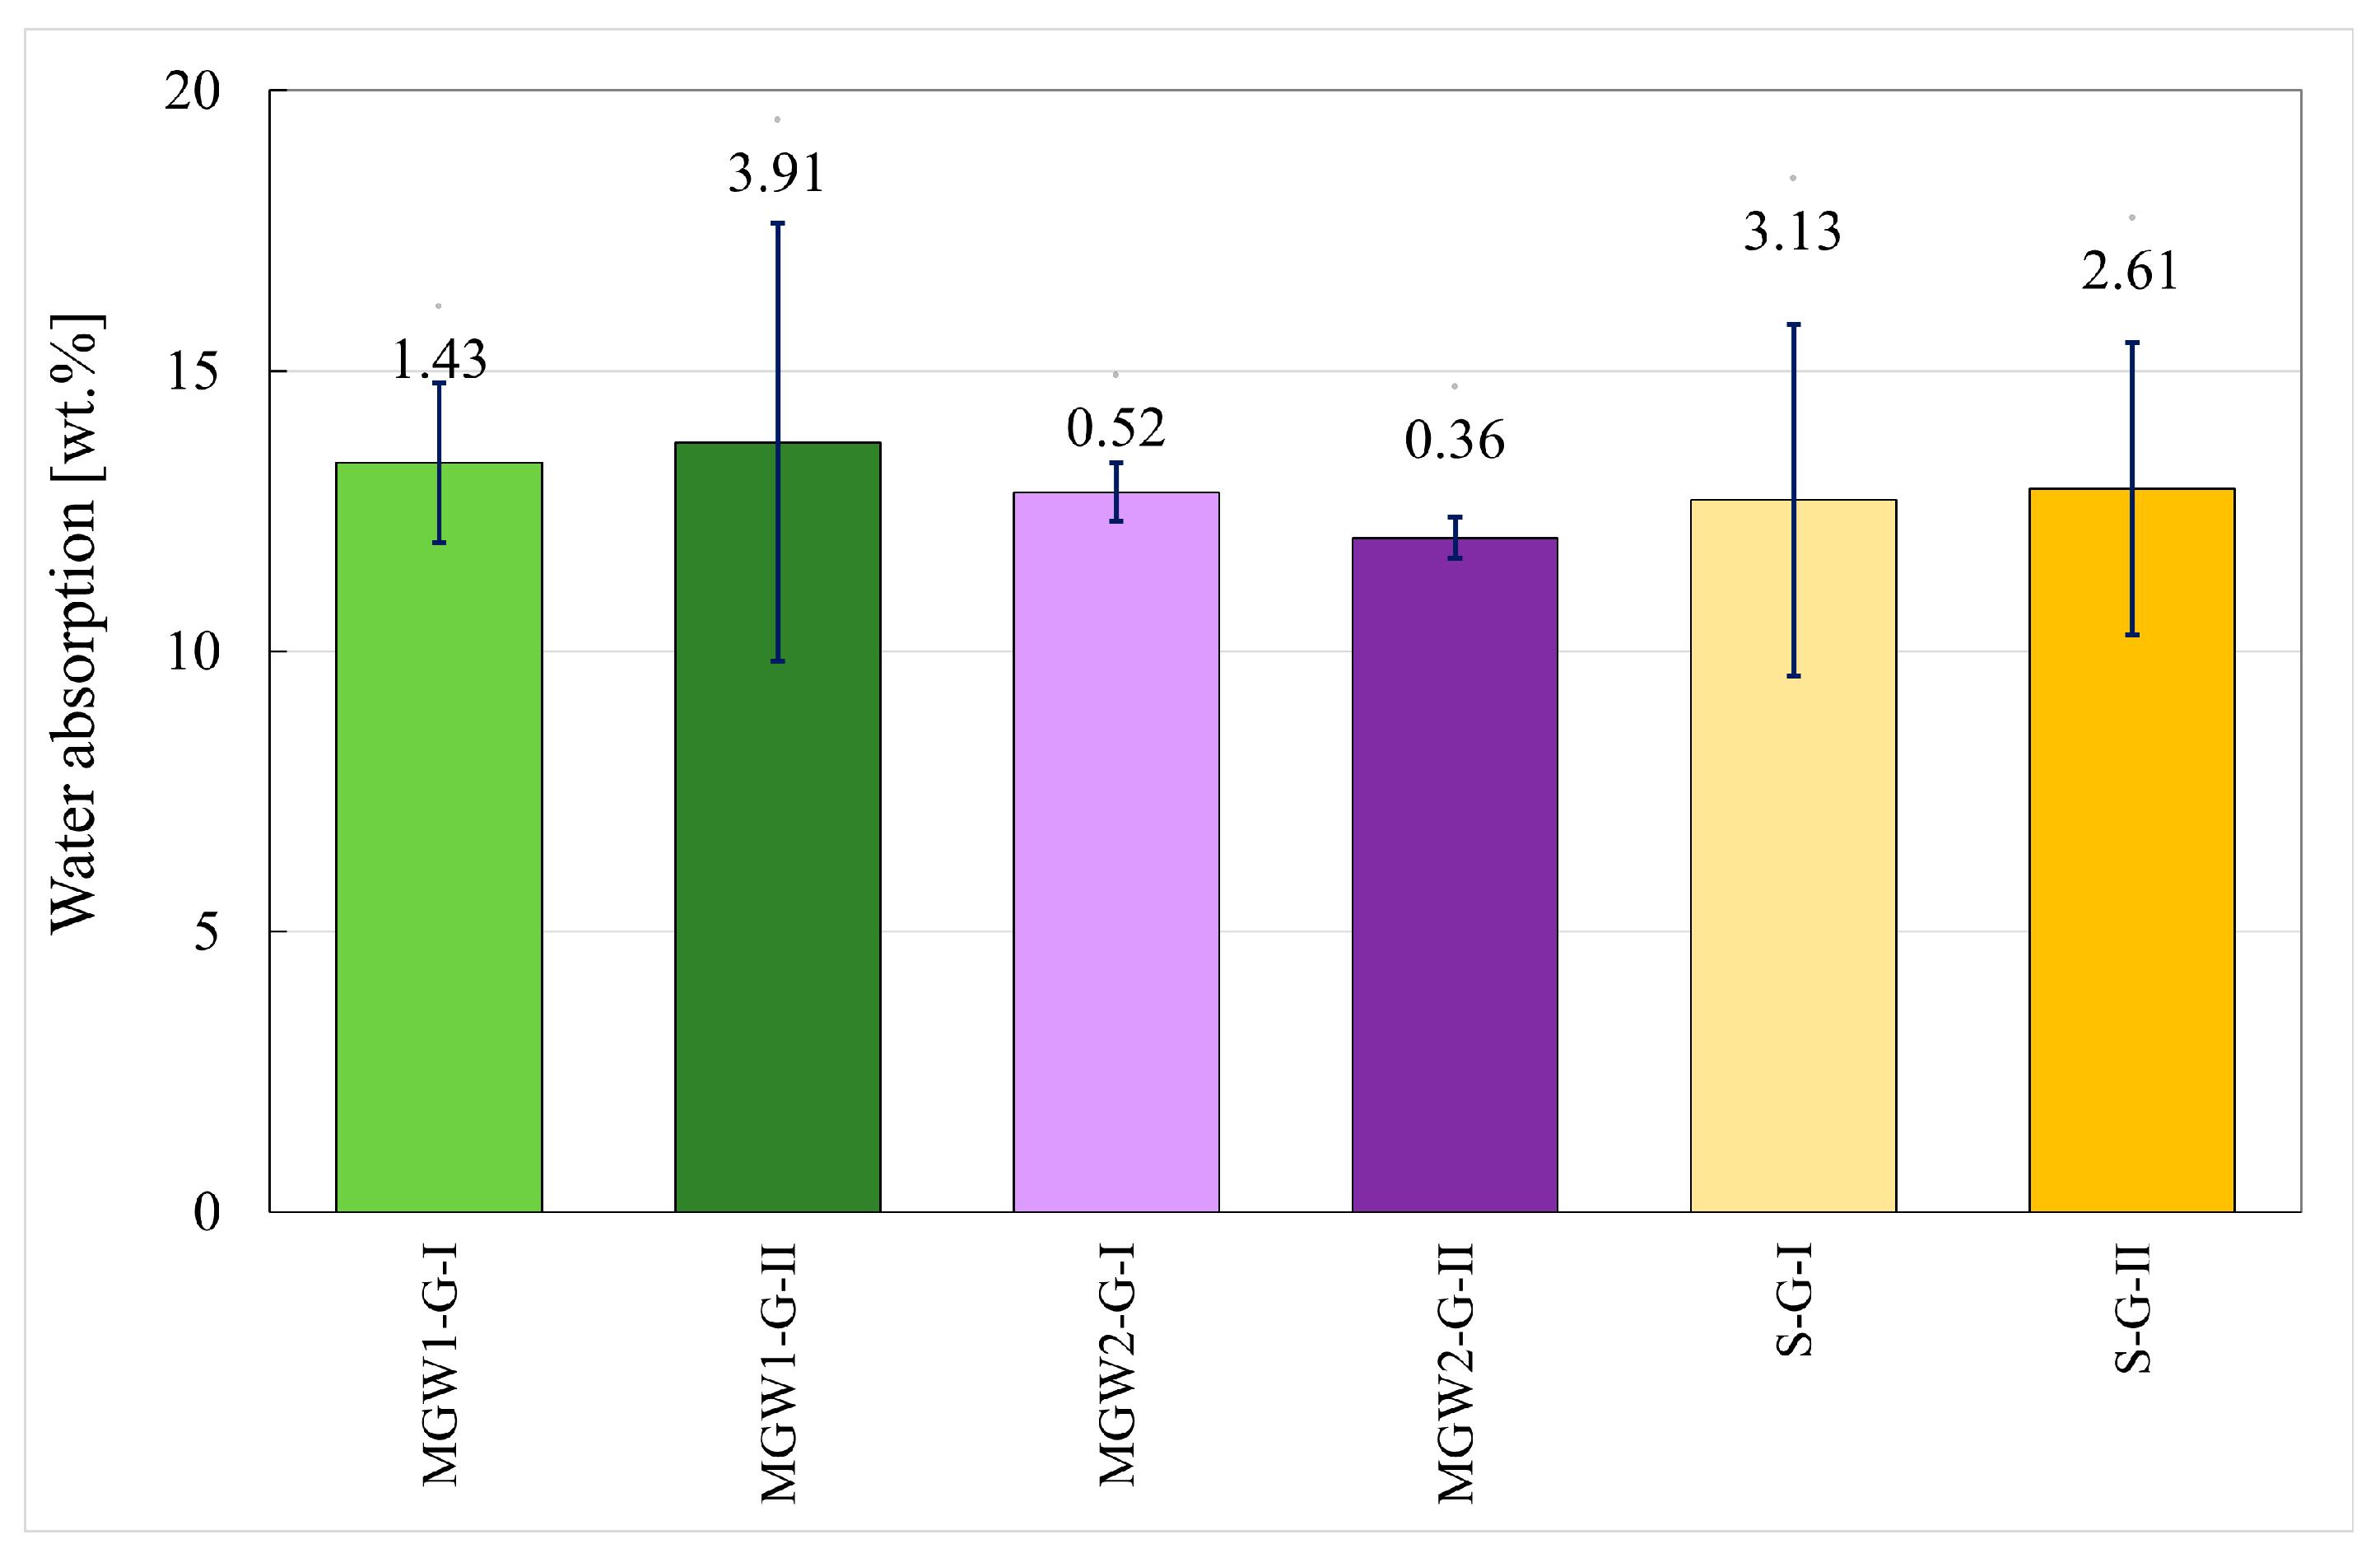
The water absorption values of all geopolymer composites (Figure 9) fall within a narrow range (approximately 12–14% wt.%), indicating comparable overall porosity regardless of the type of aggregate used. Differences between the mixtures with lower (I) and higher (II) aggregate content are only minor within the error ranges, suggesting that aggregate content does not significantly affect water absorption. MGW2-containing composites exhibit slightly lower absorption than those with MGW1, whereas sand-based samples (S-G-I and S-G-II) show values similar to MGW systems. The higher variability observed in MGW1-G-II may be related to the less uniform distribution of waste mirror glass at its higher content. Overall, the results suggest that neither the type nor the amount of aggregate has a significant effect on water absorption in the geopolymers studied.
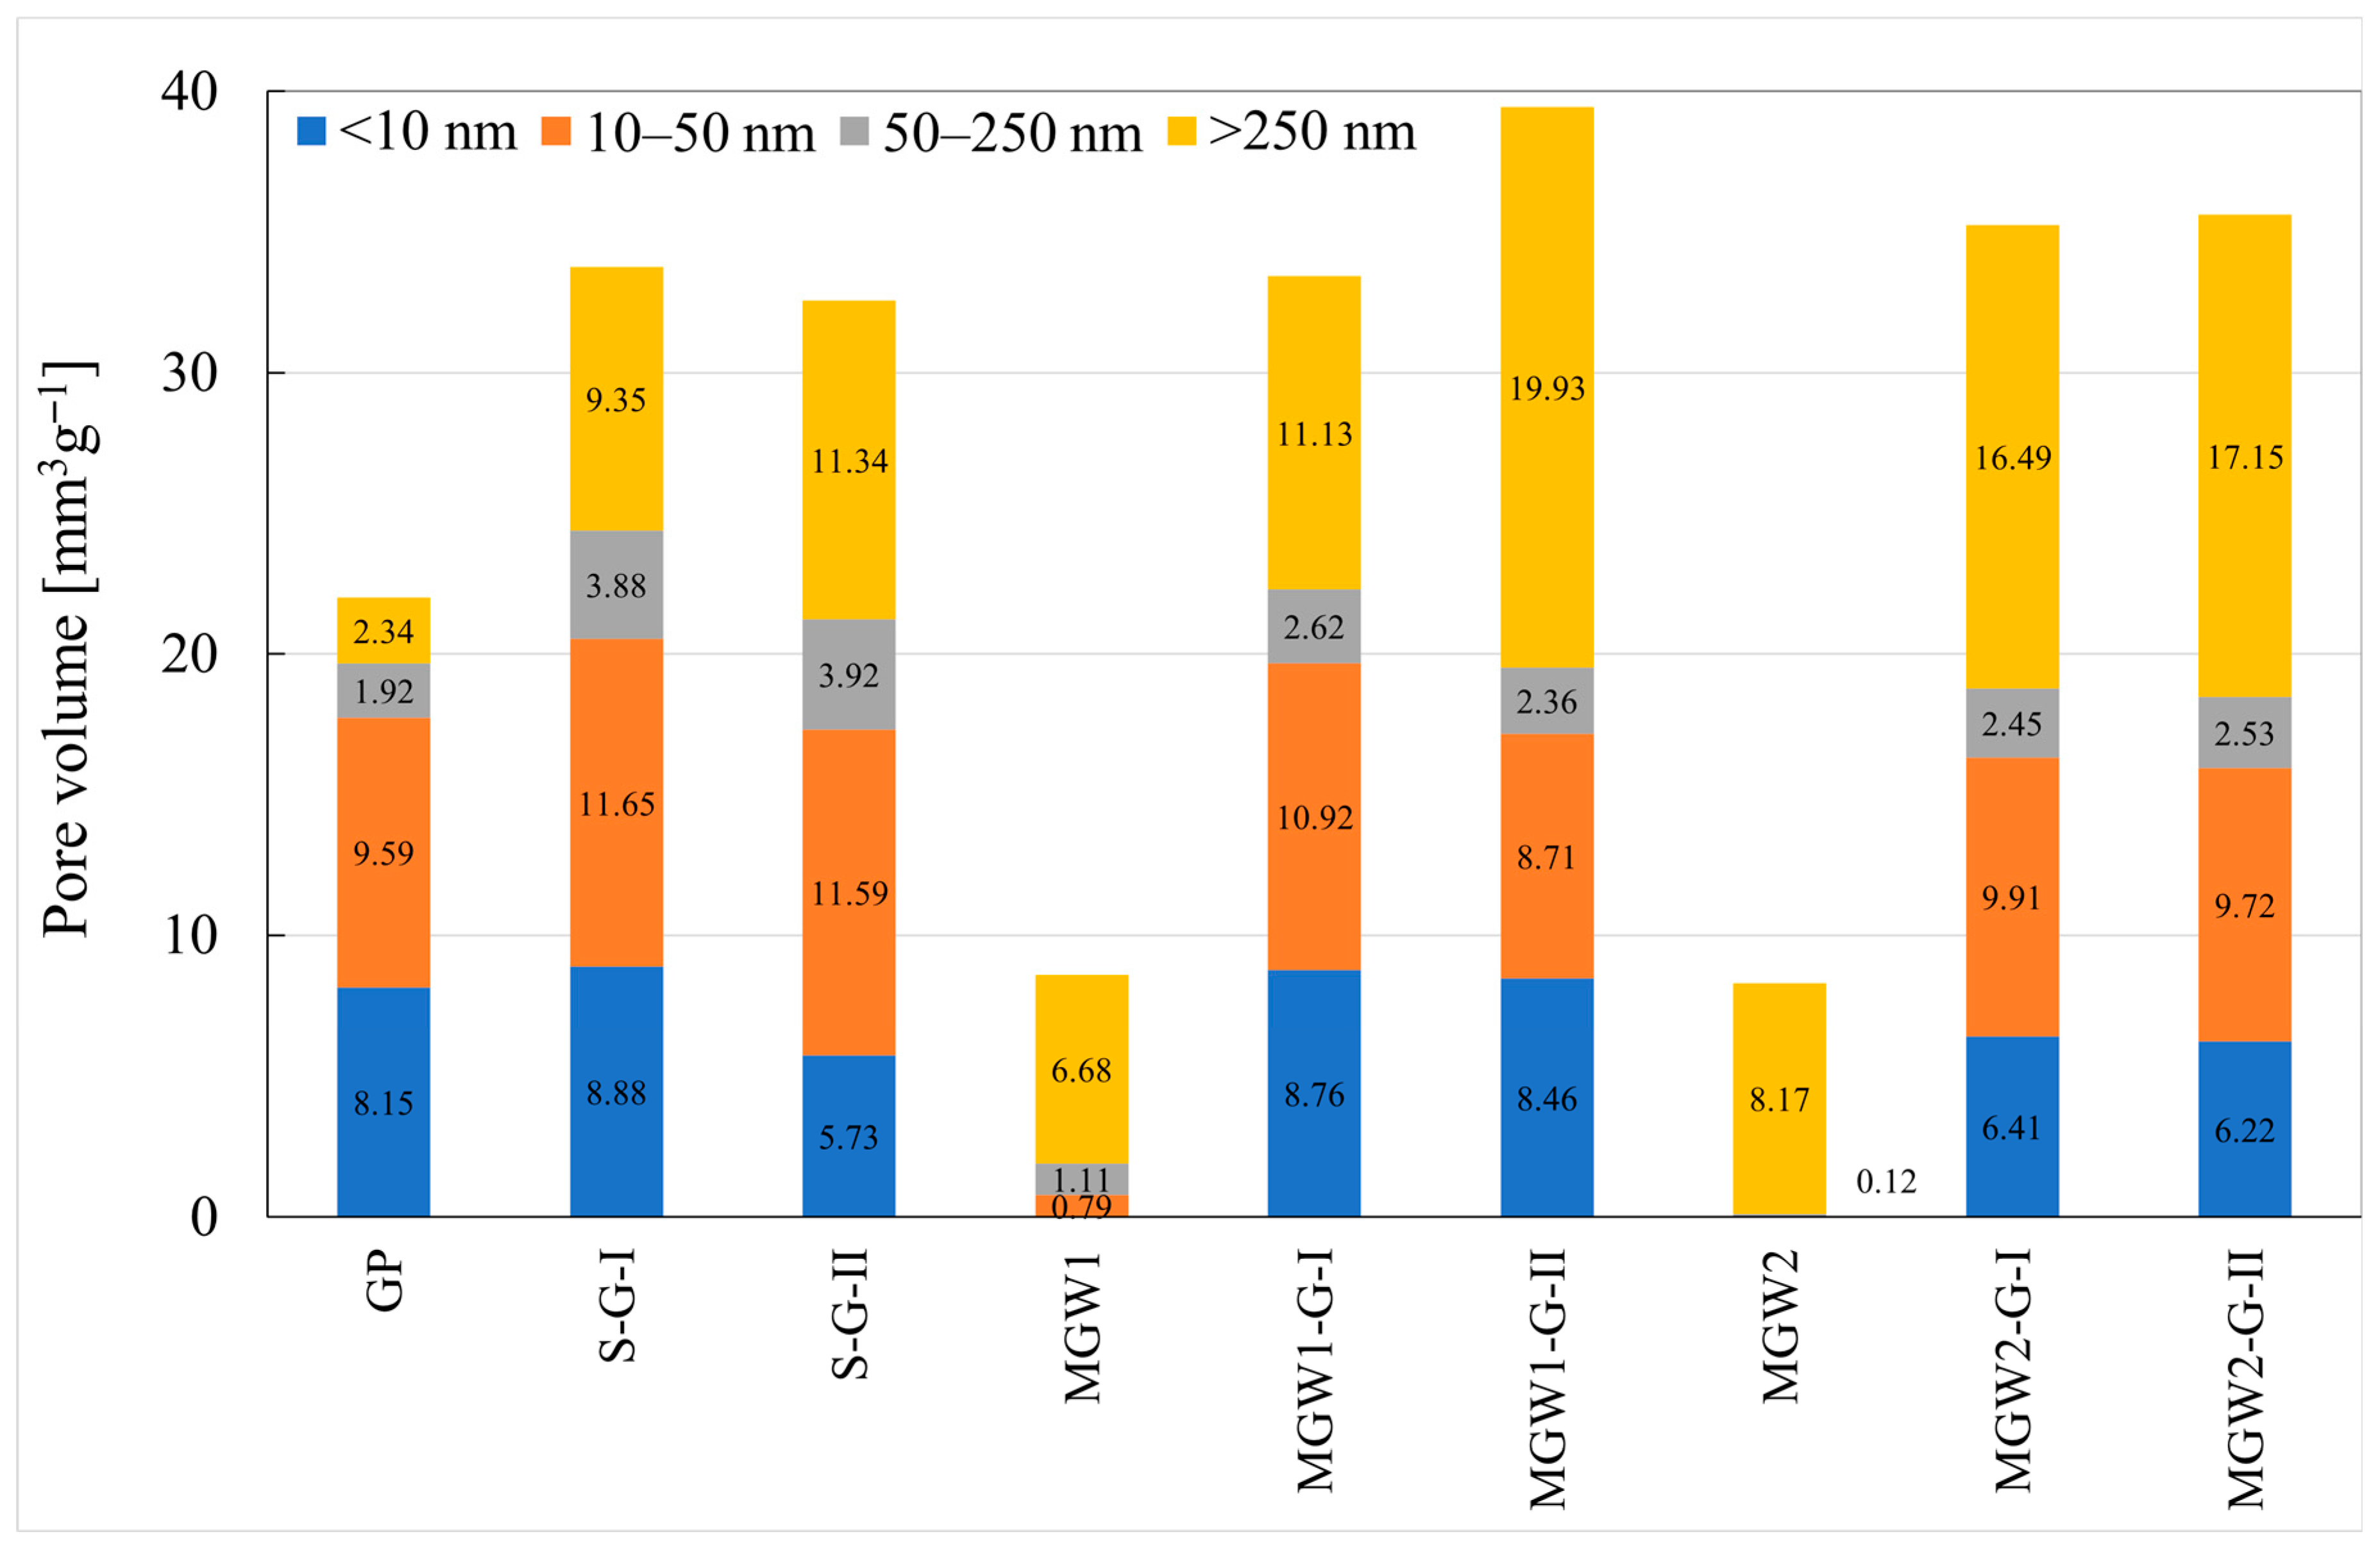
The results of mercury intrusion porosimetry (MIP) measurements reveal the pore volume and overall porosity of the various composites and raw materials (see Table 8). Figure 10 presents the pore-size distributions for all samples, grouped into four categories: <10 nm, 10–50 nm, 50–250 nm, and >250 nm. This classification effectively highlights differences in porosity across the sample set.
As shown in Figure 10, composites containing mirror fragments exhibit similar pore-size distributions. The presence of fine-grained mirror particles or sand does not significantly affect the pore-size profile. In contrast, the addition of a higher proportion of MWG1 (MWG1-G-II) leads to an increase in pores larger than 250 nm. Composites incorporating either type of mirror glass waste maintain similar compressive and flexural strengths, whereas the sand-based composites achieve slightly higher values.
For raw mirror samples, the relative pore volume tends to decrease with increasing pore diameter, which may be attributed to the presence of intergranular pores. The total pore volumes of the composites and the geopolymer (GP) matrix exceed 20 mm3·g−1, with the average pore diameters smaller than 30 nm, whereas the total pore volume of raw mirrors is lower than 9 mm3·g−1, with the average pore diameters of 400 nm for MWG1 and 3944 nm for MGW2.
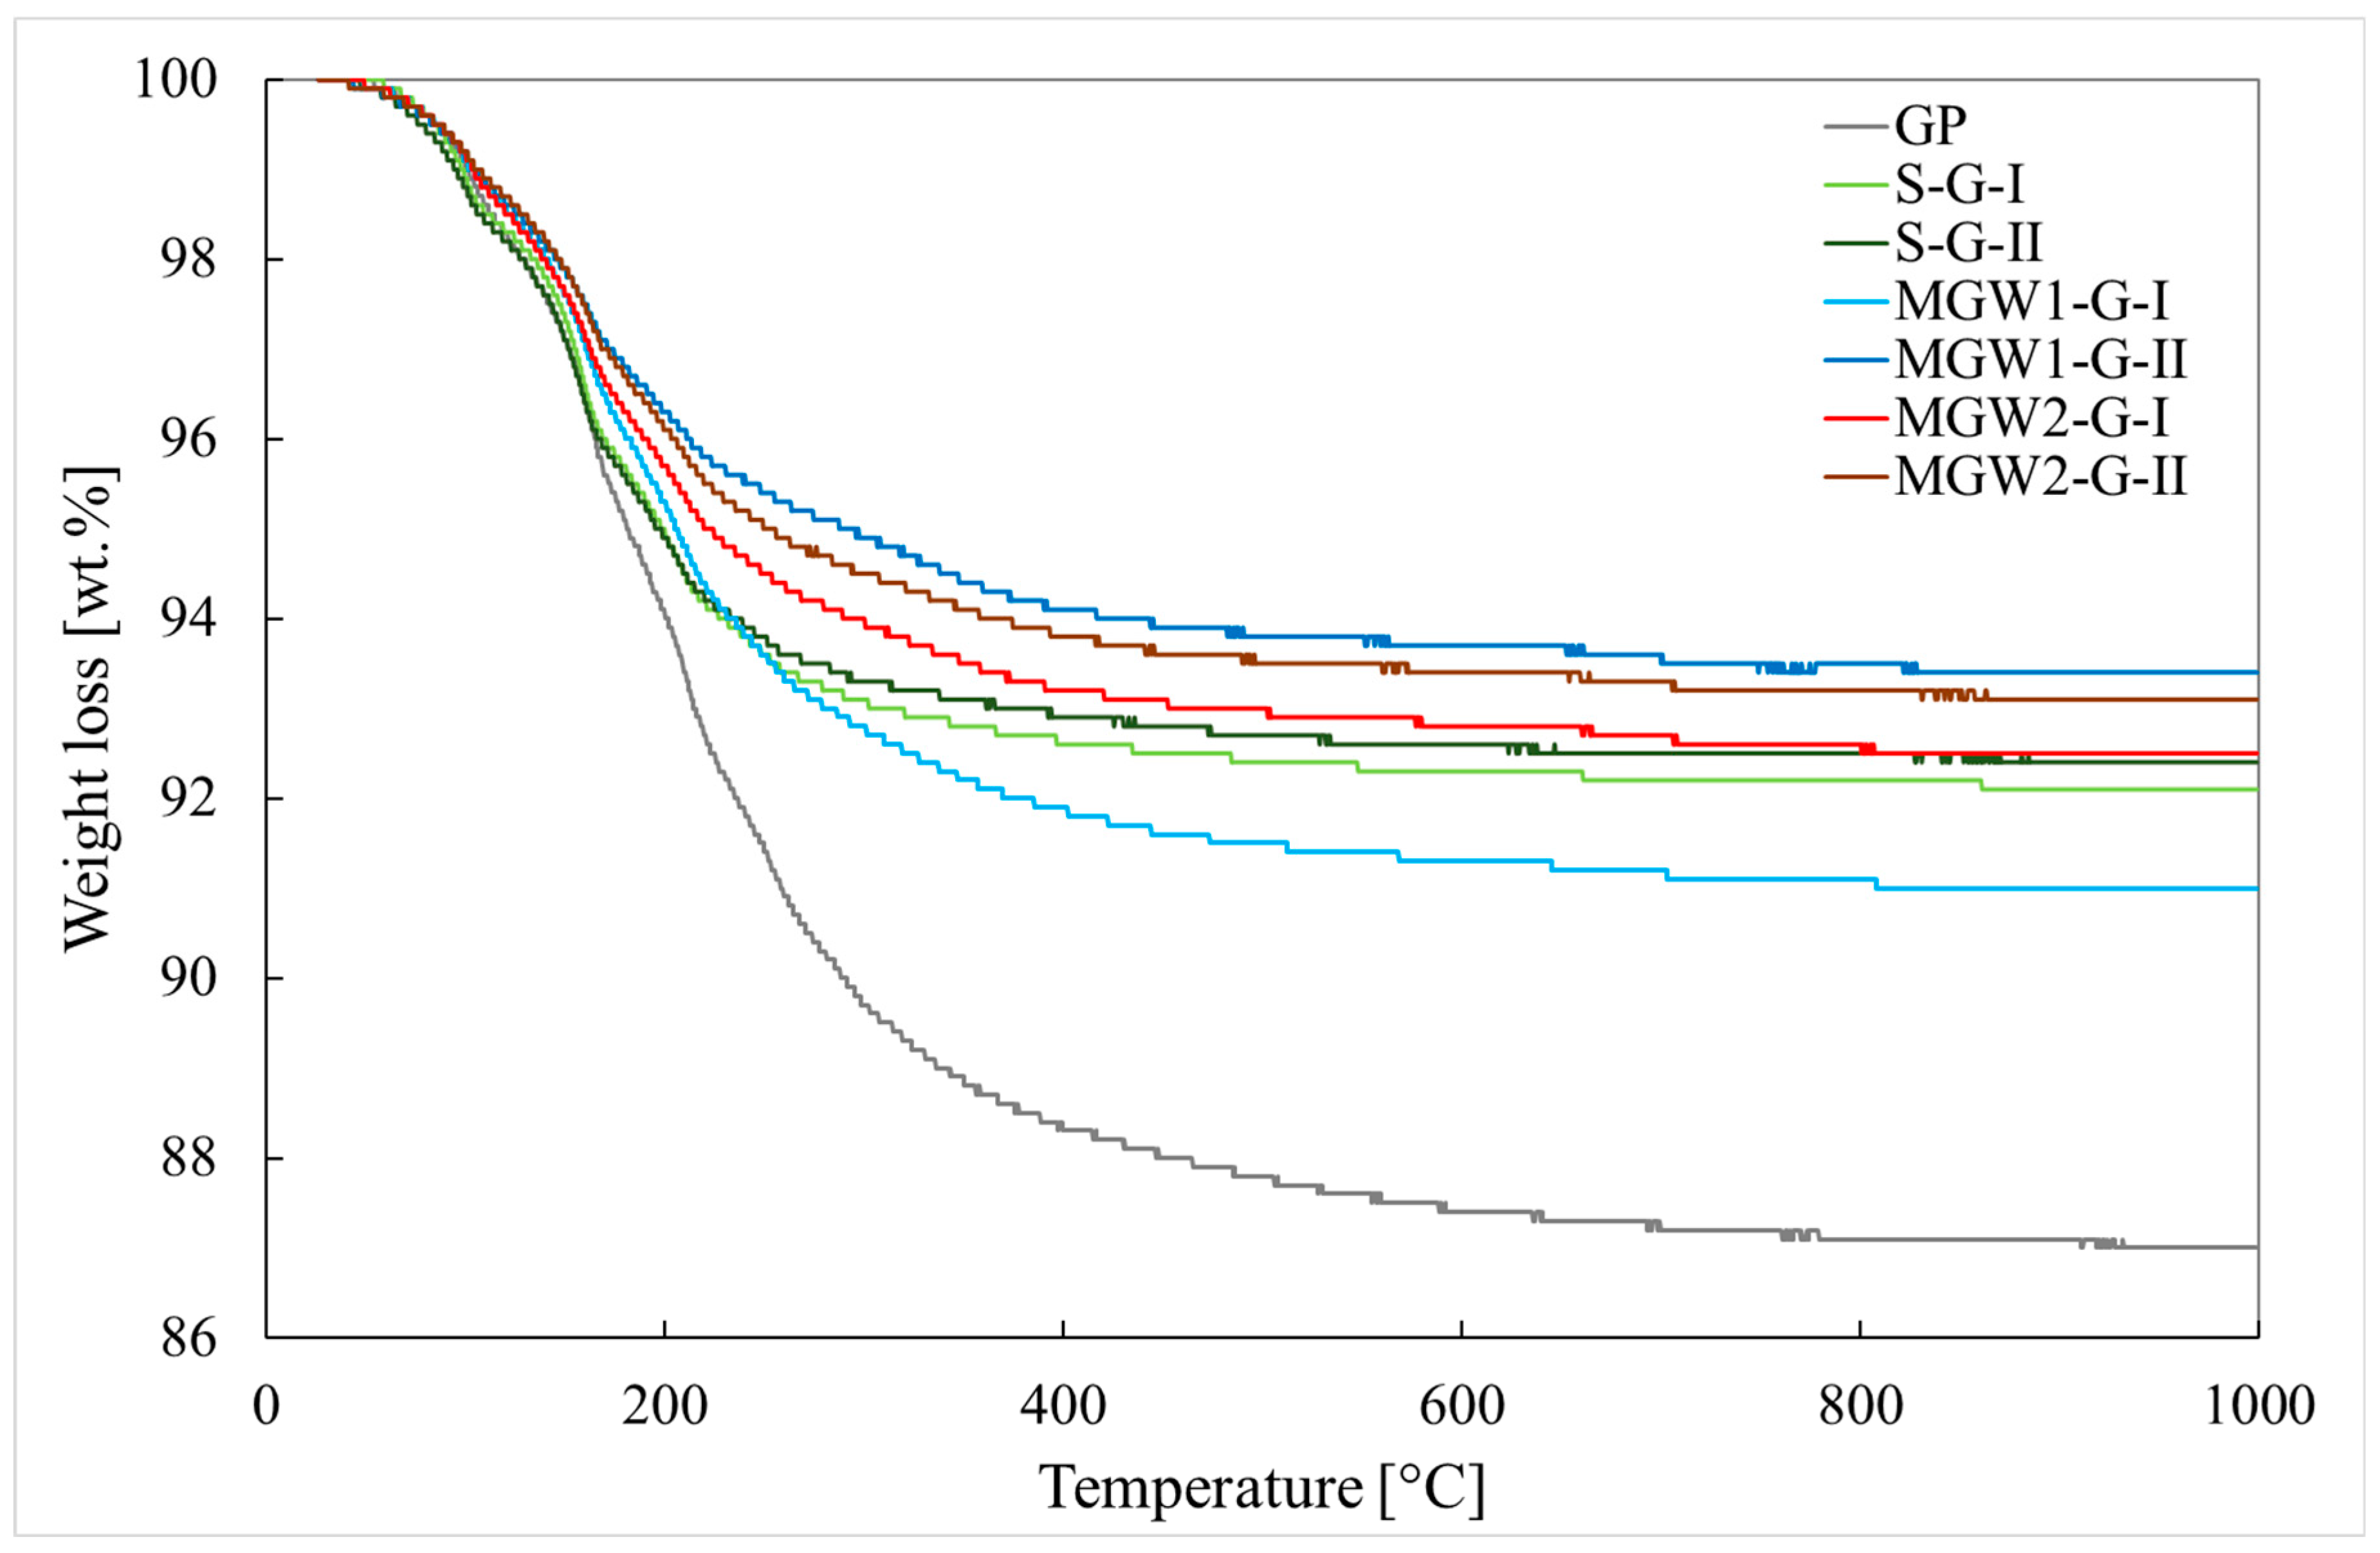
The thermal behavior of geopolymer composites was investigated using TGA under controlled heating in air, revealing a gradual weight loss associated with both physically and chemically bound water. The TGA curves (Figure 11) indicate that the pure geopolymer exhibited the highest weight loss, as water is gradually released during heating—physically bound up to 100 °C and chemically bound up to 300 °C—which is consistent with the results presented [50]. At temperatures above 300 °C, water is released through dihydroxylation [51].
Since MGW is practically an inert material, its addition enhances the thermal stability of the composites, as evidenced by the much lower weight losses. The total weight changes in the pure geopolymer and geopolymer composites may also be influenced by structural modifications occurring at high temperatures (Figure S3 of the Supplementary Materials). This effect is particularly noticeable in MGW-containing samples, which maintain better structural integrity than the pure geopolymer.
A comparison of MGW1 additions shows that a lower amount results in a higher weight loss, corresponding to lower density and increased porosity. This trend confirms the relationship between MGW content, microstructural compactness, and thermal stability, in agreement with previous studies [52,53].
Conversely, MGW2 samples demonstrated slightly better stability (weight loss) than MGW1, which may be attributed to a higher proportion of finer fractions and, consequently, better incorporation into the geopolymer matrix. Composites with MGW2 also exhibit lower porosity than those with MGW1, which is related to the increased density of the geopolymer composite and the higher proportion of MGW, and thus to a lower TGA weight loss [52,53].
As shown in the microstructural analysis (Figure 3; Figures S1 and S2; Tables S3 and S4), the MGW samples contain metallic layers that can locally influence the microstructure at temperatures around 1000 °C by promoting the fusion of glass particles and the formation of a glassy phase, which is evident on the surface of the cubes (Figure S3).
The thermal conductivity (λ), thermal diffusivity (a), and volumetric-heat capacity (Cρ) of metakaolin-based geopolymers containing different aggregates (mirror glass waste and sand) were measured to assess their suitability for thermally resistant applications.
The results (see Table 9) showed that geopolymers with sand (S-G) exhibited significantly higher thermal conductivity and diffusivity than those with mirror glass waste (MGW-G). For example, S-G-II reached a thermal conductivity of 1.0851 W∙m−1∙K−1, whereas MGW-based samples remained below 0.53 W∙m−1∙K−1. Overall, the measured values of thermal conductivity ranged from 0.4487 to 1.0851 W∙m−1∙K−1, those of thermal diffusivity from 0.3008 to 0.7335 × 10⁻⁶ m2∙s−1, and those of volumetric-heat capacity from 1.4244 to 1.6733 × 10⁶ J∙m−3∙K−1, depending on the specific composition.
These findings are generally consistent with data reported by Ziejewska et al. [54] for geopolymer foams containing waste glass (thermal conductivity 0.080–0.117 W∙m−1∙K−1), although their samples were highly porous, with total porosity ranging from 58.7% to 67.3%, whereas our dense composites have a porosity of approximately 20%. Despite the differences in porosity and sample type, the trend of lower thermal conductivity for glass-containing geopolymers is similar.
In a broader context, typical thermal-conductivity values for compact geopolymer composites based on slag and/or metakaolin generally fall within the range of 0.2–1.2 W∙m−1∙K−1, depending on porosity, binder composition, and the inclusion of fillers or aggregates [55,56,57,58]. In particular, higher slag content and reduced porosity are commonly associated with increased thermal conductivity. Correlations between pore structure, compressive strength, and thermal conductivity have also been reported in similar systems [58], confirming the importance of microstructure optimization for the design of geopolymer composites, as pore distribution and connectivity strongly influence both mechanical and thermal performance.
Compared with traditional construction materials [59,60,61], such as Portland-cement concrete (0.8–2.0 W∙m−1∙K−1), the studied geopolymers exhibit lower to comparable thermal conductivity. Specifically, S-G samples approached or exceeded 1 W∙m−1∙K−1, suggesting potential for thermal stability, whereas MGW-G samples showed lower conductivity, indicating better thermal insulation potential.
Microscopic observations of thin sections (Figure 8) revealed the presence of microcracks within the geopolymer matrix as well as gaps between mirror particles and the geopolymer binder. These create additional void space that is easily accessible to helium (in ground samples) but may be partially inaccessible to mercury (in intact samples), especially in the case of poorly connected or extremely fine pores. Consequently, helium pycnometry consistently yields higher porosity values than MIP. The discrepancies between these two methods reflect both the physical principles of measurement and the actual morphology of the pore system, as well as the different sensitivities of the techniques.
The replacement of natural sand with MGW in geopolymer composites reduces the consumption of natural resources and decreases landfill waste, thereby supporting circular economy principles. This study on geopolymer composites containing glass-waste additives highlights the potential of these waste materials for sustainable construction applications [45]. The use of geopolymers in mirror recycling is thus not only environmentally friendly but also economically advantageous, with the potential to drive innovation in waste management. Moreover, the mechanical properties and stability of the MGW-based geopolymers indicate that they are suitable for practical applications such as paving elements, protective layers, or other non-load-bearing components, where moderate mechanical performance is sufficient. These findings highlight the feasibility of integrating waste-derived geopolymers into real construction practices, contributing to both sustainability and resource efficiency.


4. Conclusions

This study has demonstrated that geopolymers offer a promising route for recycling mirror glass waste. The characterization of MGW1 and MGW2 has confirmed their typical composition, consisting of an amorphous silicate matrix (>90%) with a silver reflective coating and barium-based backing layers. Both materials have been chemically and structurally stable and exhibited very similar properties.
After crushing, MGW1 contained a higher proportion of coarse particles, whereas MGW2 had more medium-fine fractions, which may influence workability and microstructure. MGW particles appeared as sharp-edged, irregular fragments with heterogeneous spatial distribution, while sand produced a smoother and more homogeneous internal structure. This difference correlated with the higher mechanical strength observed in sand-based composites.
Flexural and compressive strengths of MGW composites were lower than those of sand-based materials. MGW composites reached flexural strength values of 3.9–5.7 MPa and compressive strengths of 60–70 MPa, whereas sand-based composites achieved 8–11 MPa in flexural strength and up to 93.5 MPa in compressive. Nevertheless, the strength values of the MGW composites remain sufficient for applications subjected to moderate mechanical loading, such as paving elements, protective layers, or other non-load-bearing or secondary construction components, where compressive stresses below approximately 60 MPa and flexural stresses below about 4 MPa are expected and are significantly lower than those in primary structural components.
ATR-FTIR analysis demonstrated that the incorporation of either mirror glass waste or sand filler into the geopolymer matrix results in only a slight shift in the main spectral band, while having no adversely effect on the geopolymerization process during the formation of the composite.
All composites exhibited similar water absorption values (~12–14%). The type and amount of additive has only a minor effect. Composites with MGW show similar pore-size distributions, although MGW1 increases the volume of pores larger than 250 nm. The total pore volumes of MGW-G composites and the geopolymer matrix exceeded 20 mm3·g−1 with average pore diameters below 30 nm. In contrast, the raw MGW materials had much lower pore volumes (<9 mm3·g−1) and larger average-pore diameters (400 and 4000 nm).
In terms of thermal stability, the pure geopolymer exhibited the highest weight loss associated with water release up to 300 °C. The incorporation of MGW improves thermal stability, resulting in lower overall mass losses, with MGW2 composites showing slightly better performance than MGW1. This improvement is likely related to the higher proportion of finer MGW2 particles, which may enhance the formation of a glassy phase during heating to approximately 1000 °C. All MGW composites showed significantly lower thermal conductivity (<0.53 W·m−1·K−1) than the sand-based materials (up to 1.085 W·m−1·K−1), demonstrating their superior insulation potential.
Overall, this study indicates that mirror glass waste can be effectively integrated into geopolymer composites, transforming an underutilized material into a valuable resource. While MGW-based composites show lower mechanical strength than sand-based systems, they provide enhanced sustainability and functional advantages, including reduced landfill burden, conservation of natural resources, and markedly improved thermal insulation. These combined benefits highlight MGW as a viable and environmentally meaningful alternative aggregate, particularly for applications where moderate strength, enhanced insulation, and circular economy principles are desirable.
Future research will include leaching tests on the composites under different environmental conditions and a long-term evaluation of potential metal/ion release, in order to more comprehensively verify the environmental safety of MGW-based geopolymers. In addition, the detailed influence of reflective coatings and possible interface defects on geopolymerization and durability remains to be clarified and will be addressed in future studies.

Supplementary Materials

The following supporting information can be downloaded at: https://www.mdpi.com/article/10.3390/app16020667/s1, Table S1. The chemical composition of the clay material used (major oxides in wt.%); Table S2. The particle size distribution of the clay material used; Figure S1. A SEM image for EDS analysis of the layered structure forming the mirror coating on the MGW1 aggregate; Table S3. EDS analysis of MGW1; Figure S2. A SEM image for EDS analysis of the layered structure forming the mirror coating on the MGW2 aggregate; Table S4. EDS analysis of MGW2; Figure S3. Photographs of geopolymer composite cubes before thermal treatment (top row), after heating at 1000 °C (middle row), and detailed views of the thermally exposed cubes (bottom row).

Author Contributions

Conceptualization: I.P.; methodology: I.P., D.Ř., M.Š., M.Ž. and O.B.; formal analysis: I.P., D.Ř., M.Š., M.Ž., M.N. and O.B.; investigation: I.P., D.Ř., M.Š., M.Ž. and O.B.; data curation: I.P.; writing—original draft preparation: I.P., D.Ř., M.Š. and O.B.; writing—review and editing: I.P., D.Ř., M.Š., M.Ž., M.N. and O.B.; supervision: I.P. All authors have read and agreed to the published version of the manuscript.

Funding

This work was supported by the long-term project for the conceptual development of the research organization No. 67985891 and the Strategy AV21 Research Program of the Czech Academy of Sciences: Sustainable Energy (VP27).

Institutional Review Board Statement

Not applicable.

Informed Consent Statement

Not applicable.

Data Availability Statement

The raw data supporting the conclusions of this article will be made available by the authors on request.

Conflicts of Interest

The authors declare no conflicts of interest.

References

  1. Enoch, J.M. History of Mirrors Dating Back 8000 Years. Optom. Vis. Sci. 2006, 83, 775–781. [Google Scholar] [CrossRef] [Scilit]
  2. Venetian Mirrors. History of Venetian Mirrors. Available online: https://www.venetian-mirrors.com/en/content/7-history-of-venetian-mirrors (accessed on 3 December 2025).
  3. Anderson, K.J. Reflections on Mirror Coating Materials. MRS Bull. 1989, 14, 68–69. [Google Scholar] [CrossRef] [Scilit]
  4. Zhang, M.; Deskins, N.A.; Zhang, G.; Cygan, R.T.; Tao, M. Modeling the Polymerization Process for Geopolymer Synthesis through Reactive Molecular Dynamics Simulations. J. Phys. Chem. C 2018, 122, 6760–6773. [Google Scholar] [CrossRef] [Scilit]
  5. Provis, J.L.; Van Deventer, J. (Eds.) Geopolymers: Structures, Processing, Properties and Industrial Applications; Woodhead Publishing Limited: Cambridge, UK, 2009. [Google Scholar]
  6. Davidovits, J. Geopolymer Chemistry and Applications, 5th ed.; Geopolymer Institute: Saint-Quentin, France, 2020. [Google Scholar]
  7. Siyal, A.A.; Radin Mohamed, R.M.S.; Shamsuddin, R.; Ridzuan, M.B. A Comprehensive Review of Synthesis Kinetics and Formation Mechanism of Geopolymers. RSC Adv. 2024, 14, 446–462. [Google Scholar] [CrossRef] [Scilit]
  8. Petrus, H.T.B.M.; Hulu, J.; Dalton, G.S.P.; Malinda, E.; Prakosa, R.A. Effect of Bentonite Addition on Geopolymer Concrete from Geothermal Silica. Mater. Sci. Forum 2016, 841, 7–15. [Google Scholar] [CrossRef] [Scilit]
  9. Castillo, H.; Collado, H.; Droguett, T.; Vesely, M.; Garrido, P.; Palma, S. State of the Art of Geopolymers: A Review. e-Polymers 2022, 22, 108–124. [Google Scholar] [CrossRef] [Scilit]
  10. Chen, S.; Ruan, S.; Zeng, Q.; Liu, Y.; Zhang, M.; Tian, Y.; Yan, D. Pore Structure of Geopolymer Materials and Its Correlations to Engineering Properties: A Review. Constr. Build. Mater. 2022, 328, 127064. [Google Scholar] [CrossRef] [Scilit]
  11. Podolsky, Z.; Liu, J.; Dinh, H.; Doh, J.H.; Guerrieri, M.; Fragomeni, S. State of the Art on the Application of Waste Materials in Geopolymer Concrete. Case Stud. Constr. Mater. 2021, 15, e00637. [Google Scholar] [CrossRef] [Scilit]
  12. Nagaraju, T.V.; Bahrami, A.; Azab, M.; Naskar, S. Development of Sustainable High Performance Geopolymer Concrete and Mortar Using Agricultural Biomass—A Strength Performance and Sustainability Analysis. Front. Mater. 2023, 10, 1128095. [Google Scholar] [CrossRef] [Scilit]
  13. Toniolo, N.; Boccaccini, A.R. Fly Ash-Based Geopolymers Containing Added Silicate Waste. A Review. Ceram. Int. 2017, 43, 14545–14551. [Google Scholar] [CrossRef] [Scilit]
  14. Mabroum, S.; Moukannaa, S.; El Machi, A.; Taha, Y.; Benzaazoua, M.; Hakkou, R. Mine Wastes Based Geopolymers: A Critical Review. Clean. Eng. Technol. 2020, 1, 100014. [Google Scholar] [CrossRef] [Scilit]
  15. Ren, B.; Zhao, Y.; Bai, H.; Kang, S.; Zhang, T.; Song, S. Eco-Friendly Geopolymer Prepared from Solid Wastes: A Critical Review. Chemosphere 2021, 267, 128900. [Google Scholar] [CrossRef] [Scilit]
  16. Huang, B.T.; Xi, H.; Ma, R.Y.; Zhang, Z.L.; Lao, J.C.; Zhang, H.; Shen, Y.N.; Shi, D.D.; Xu, L.Y. Ultra-High-Strength Engineered Geopolymer Composites (UHS-EGC) with Mineral Processing Waste: Probabilistic Modeling of Cracking Behavior. Theor. Appl. Fract. Mech. 2025, 140, 105138. [Google Scholar] [CrossRef] [Scilit]
  17. Hanzlicek, T.; Steinerova, M.; Straka, P. Radioactive Metal Isotopes Stabilized in a Geopolymer Matrix: Determination of a Leaching Extract by a Radiotracer Method. J. Am. Ceram. Soc. 2006, 89, 3541–3543. [Google Scholar] [CrossRef] [Scilit]
  18. Minaříková, M.; Škvára, F. Fixation of Heavy Metals in Geopolymeric Materials Based on Brown Coal Fly Ash. Ceram.-Silik. 2006, 50, 200–207. [Google Scholar]
  19. Yongvanich, N.; Supanichwatin, K.; Penglan, J.; Triamnak, N. Synthesis and Characterizations of (CoxMg(2−x))SiO4 Forsterite Ceramic Pigments from Mirror Waste. Materials 2018, 11, 1210. [Google Scholar] [CrossRef] [Scilit]
  20. Sklopísek Střeleč, a. s. Available online: https://glassand.eu/ (accessed on 23 December 2025).
  21. Perná, I.; Havelcová, M.; Šupová, M.; Žaloudková, M.; Bičáková, O. The Synthesis and Characterization of Geopolymers Based on Metakaolin and on Automotive Glass Waste. Appl. Sci. 2024, 14, 3439. [Google Scholar] [CrossRef] [Scilit]
  22. Perná, I.; Novotná, M.; Řimnáčová, D.; Šupová, M. New Metakaolin-Based Geopolymers with the Addition of Different Types of Waste Stone Powder. Crystals 2021, 11, 983. [Google Scholar] [CrossRef] [Scilit]
  23. Perná, I.; Novotná, M.; Hanzlíček, T.; Šupová, M.; Řimnáčová, D. Metakaolin-Based Geopolymer Formation and Properties: The Influence of the Maturation Period and Environment (Air, Demineralized and Sea Water). J. Ind. Eng. Chem. 2024, 134, 415–424. [Google Scholar] [CrossRef] [Scilit]
  24. Perná, I.; Zárybnická, L.; Mácová, P.; Šupová, M.; Ševčík, R. Physico-Mechanical Properties of Geopolymers after Thermal Exposure: Influence of Filler, Temperature and Dwell Time. Constr. Build. Mater. 2024, 451, 138893. [Google Scholar] [CrossRef] [Scilit]
  25. Perná, I.; Hanzlíček, T.; Straka, P.; Steinerová, M. Acoustic Absorption of Geopolymer/Sand Mixture. Ceram.-Silik. 2009, 53, 48–51. [Google Scholar]
  26. ČSN 72 0103; Základní Postup Rozboru Silikátů-Stanovení Ztráty Žíháním. TECHNOR print, s.r.o.: Hradec Králové, Czech Republic, 2009.
  27. EN 196-1; Methods of Testing Cement–Part 1. Determination of Strength. European Committee for Standardization: Brusel, Belgium, 2016.
  28. ČSN 72 2603; Stanovení Nasákavosti. TECHNOR print, s.r.o.: Hradec Králové, Czech Republic, 1979.
  29. Washburn, E.W. The Dynamics of Capillary Flow. Phys. Rev. 1921, 17, 273–283. [Google Scholar] [CrossRef] [Scilit]
  30. Košek, F.; Dudák, J.; Tymlová, V.; Žemlička, J.; Řimnáčová, D.; Jehlička, J. Evaluation of Pore-Fracture Microstructure of Gypsum Rock Fragments Using Micro-CT. Micron 2024, 181, 103633. [Google Scholar] [CrossRef] [Scilit]
  31. Sutter, F.; Fernández-García, A.; Heller, P.; Anderson, K.; Wilson, G.; Schmücker, M.; Marvig, P. Durability Testing of Silvered-Glass Mirrors. Energy Procedia 2015, 69, 1568–1577. [Google Scholar] [CrossRef] [Scilit]
  32. Cao, Y.; Liang, H.; Lin, H.L.; Qi, L.; Yang, P.; Fong, X.; Dogheche, E.; Bettiol, A.; Danner, A. Engineering Refractive Index Contrast in Thin Film Barium Titanate-on-Insulator. Nano Lett. 2023, 23, 7267–7272. [Google Scholar] [CrossRef] [Scilit] [PubMed]
  33. SphereOptics GmbH. Barium Sulphate Diffuse Reflectance Coating for Optical Components. Available online: https://sphereoptics.de/products-services-index/optical-materials/barium-sulphate-paint/ (accessed on 3 December 2025).
  34. Photonics Media Publications Mirrors: Coating Choice Makes a Difference. Available online: https://www.photonics.com/Articles/Mirrors-Coating-Choice-Makes-a-Difference/a25501 (accessed on 3 December 2025).
  35. Torres-Carrasco, M.; Palomo, J.G.; Puertas, F. Sodium Silicate Solutions from Dissolution of Glasswastes. Statistical Analysis. Mater. Constr. 2014, 64, e014. [Google Scholar] [CrossRef] [Scilit]
  36. Lee, W.K.W.; Van Deventer, J.S.J. Use of Infrared Spectroscopy to Study Geopolymerization of Heterogeneous Amorphous Aluminosilicates. Langmuir 2003, 19, 8726–8734. [Google Scholar] [CrossRef] [Scilit]
  37. Rees, C.A.; Provis, J.L.; Lukey, G.C.; Van Deventer, J.S.J. Attenuated Total Reflectance Fourier Transform Infrared Analysis of Fly Ash Geopolymer Gel Aging. Langmuir 2007, 23, 8170–8179. [Google Scholar] [CrossRef] [Scilit]
  38. Kouamo Tchakouté, H.; Henning Rüscher, C.; Hinsch, M.; Noël, J.; Djobo, Y.; Kamseu, E.; Leonelli, C. Utilization of Sodium Waterglass from Sugar Cane Bagasse Ash as a New Alternative Hardener for Producing Metakaolin-Based Geopolymer Cement. Geochemistry 2017, 77, 257–266. [Google Scholar] [CrossRef] [Scilit]
  39. Sitarz, M.; Mozgawa, W.; Handke, M. Vibrational Spectra of Complex Ring Silicate Anions-Method of Recognition. J. Mol. Struct. 1997, 404, 193–197. [Google Scholar] [CrossRef] [Scilit]
  40. Sarah, A.-S.; Mohammed, K.; Géber, R.; Simon, A.; Kurovics, E.; Hamza, A. Comparative Study of Metakaolin-Based Geopolymer Characteristics Utilizing Different Dosages of Water Glass in the Activator Solution. Results Eng. 2023, 20, 101469. [Google Scholar] [CrossRef] [Scilit]
  41. ElBatal, H.A.; Hassaan, M.Y.; Fanny, M.A.; Ibrahim, M.M. Optical and FT Infrared Absorption Spectra of Soda Lime Silicate Glasses Containing Nano Fe2O3 and Effects of Gamma Irradiation. Silicon 2017, 9, 511–517. [Google Scholar] [CrossRef] [Scilit]
  42. Anbalagan, G.; Prabakaran, A.R.; Gunasekaran, S. Spectroscopic Characterization of Indian Standard Sand. J. Appl. Spectrosc. 2010, 77, 86–94. [Google Scholar] [CrossRef] [Scilit]
  43. Müller, C.M.; Molinelli, A.; Karlowatz, M.; Aleksandrov, A.; Orlando, T.; Mizaikoff, B. Infrared Attenuated Total Reflection Spectroscopy of Quartz and Silica Micro- and Nanoparticulate Films. J. Phys. Chem. C 2012, 116, 37–43. [Google Scholar] [CrossRef] [Scilit]
  44. Stein, M.; Georgiadis, A.; Gudat, D.; Rennert, T. Formation and Properties of Inorganic Si-Contaminant Compounds. Environ. Pollut. 2020, 265, 115032. [Google Scholar] [CrossRef] [Scilit] [PubMed]
  45. Hajimohammadi, A.; Ngo, T.; Kashani, A. Glass Waste versus Sand as Aggregates: The Characteristics of the Evolving Geopolymer Binders. J. Clean. Prod. 2018, 193, 593–603. [Google Scholar] [CrossRef] [Scilit]
  46. Tammam, Y.; Uysal, M.; Canpolat, O.; Kuranlı, Ö.F. Effect of Waste Filler Materials and Recycled Waste Aggregates on the Production of Geopolymer Composites. Arab. J. Sci. Eng. 2023, 48, 4823–4840. [Google Scholar] [CrossRef] [Scilit]
  47. Joseph, B.; Mathew, G. Influence of Aggregate Content on the Behavior of Fly Ash Based Geopolymer Concrete. Sci. Iran. 2012, 19, 1188–1194. [Google Scholar] [CrossRef] [Scilit]
  48. Zheng, J.; Li, X.; Bai, C.; Zheng, K.; Wang, X.; Sun, G.; Zheng, T.; Zhang, X.; Colombo, P. Rapid Fabrication of Porous Metakaolin-Based Geopolymer via Microwave Foaming. Appl. Clay Sci. 2023, 249, 107238. [Google Scholar] [CrossRef] [Scilit]
  49. Kuri, J.C.; Hosan, A.; Shaikh, F.U.A.; Biswas, W.K. The Effect of Recycled Waste Glass as a Coarse Aggregate on the Properties of Portland Cement Concrete and Geopolymer Concrete. Buildings 2023, 13, 586. [Google Scholar] [CrossRef] [Scilit]
  50. Řimnáčová, D.; Perná, I.; Novotná, M.; Šupová, M.; Nováková, M.; Bičáková, O. Activated Carbon–Geopolymer Composites: Influence of Particle Size and Content on CO2 Adsorption and Mechanical and Thermal Properties. Crystals 2025, 15, 892. [Google Scholar] [CrossRef] [Scilit]
  51. Duxson, P.; Lukey, G.C.; van Deventer, J.S.J. Physical Evolution of Na-Geopolymer Derived from Metakaolin up to 1000 °C. J. Mater. Sci. 2007, 42, 3044–3054. [Google Scholar] [CrossRef] [Scilit]
  52. Schwarz, N.; Cam, H.; Neithalath, N. Influence of a fine glass powder on the durability characteristics of concrete and its comparison to fly ash. Cem. Concr. Compos. 2008, 30, 486–496. [Google Scholar] [CrossRef] [Scilit]
  53. Rodier, L.; da Costa Correia, V.; Savastano, H., Jr. Elaboration of eco-efficient vegetable fibers reinforced cement-based composites using glass powder residue. Cem. Concr. Compos. 2020, 110, 103599. [Google Scholar] [CrossRef] [Scilit]
  54. Ziejewska, C.; Bąk, A.; Hodor, K.; Hebda, M. Eco-Friendly Coal Gangue and/or Metakaolin-Based Lightweight Geopolymer with the Addition of Waste Glass. Materials 2023, 16, 6054. [Google Scholar] [CrossRef] [Scilit] [PubMed]
  55. Agustini, N.K.A.; Triwiyono, A.; Sulistyo, D.; Suyitno. Effects of Water to Solid Ratio on Thermal Conductivity of Fly Ash-Based Geopolymer Paste. IOP Conf. Ser. Earth Environ. Sci. 2020, 426, 012010. [Google Scholar] [CrossRef] [Scilit]
  56. Prałat, K.; Ciemnicka, J.; Koper, A.; Buczkowska, K.E.; Łoś, P. Comparison of the Thermal Properties of Geopolymer and Modified Gypsum. Polymers 2021, 13, 1220. [Google Scholar] [CrossRef] [Scilit]
  57. Huang, Y.; Gong, L.; Pan, Y.; Li, C.; Zhou, T.; Cheng, X. Facile Construction of the Aerogel/Geopolymer Composite with Ultra-Low Thermal Conductivity and High Mechanical Performance. RSC Adv. 2018, 8, 2350–2356. [Google Scholar] [CrossRef] [Scilit]
  58. Jaya, N.A.; Yun-Ming, L.; Cheng-Yong, H.; Abdullah, M.M.A.B.; Hussin, K. Correlation between Pore Structure, Compressive Strength and Thermal Conductivity of Porous Metakaolin Geopolymer. Constr. Build. Mater. 2020, 247, 118641. [Google Scholar] [CrossRef] [Scilit]
  59. Perná, I.; Hanzlíček, T. The Solidification of Aluminum Production Waste in Geopolymer Matrix. J. Clean. Prod. 2014, 84, 657–662. [Google Scholar] [CrossRef] [Scilit]
  60. Demirboǧa, R. Thermal Conductivity and Compressive Strength of Concrete Incorporation with Mineral Admixtures. Build. Environ. 2007, 42, 2467–2471. [Google Scholar] [CrossRef] [Scilit]
  61. Ukrainczyk, N.; Matusinović, T. Thermal Properties of Hydrating Calcium Aluminate Cement Pastes. Cem. Concr. Res. 2010, 40, 128–136. [Google Scholar] [CrossRef] [Scilit]
Figure 1. Digital-microscope images of MGW1 and MGW2 ((a)—general view, (b)—detailed view).
Applsci 16 00667 g001
Figure 2. Grain-size distribution of MGW1 and MGW2.
Applsci 16 00667 g002
Figure 3. SEM images (a) and EDS elemental maps (b) of mirror glass waste samples.
Applsci 16 00667 g003
Figure 4. The ATR-FTIR spectra of input materials; clay material (L05), geopolymer matrix, sand fillers (STJ25 and ST03/30) and mirror glass waste (MGW1 and MGW2). The spectral region of 2500–2000 cm−1 is not shown because it contains only diamond-crystal noise and carbon-dioxide absorption bands.
Applsci 16 00667 g004
Figure 5. Digital-microscope images of geopolymer composites prepared with MGW and silica aggregates.
Applsci 16 00667 g005
Figure 6. The ATR-FTIR spectra of geopolymer materials: the series MGW1-G (a) and MGW2-G (b) with variable MGW concentrations (I and II) and their comparison with the two types of mirror glass waste (MGW1/2) and the geopolymer matrix.
Applsci 16 00667 g006
Figure 7. The ATR-FTIR spectra of geopolymer materials: the series S-G with variable ST concentrations (I and II) and their comparison with sand fillers (STJ25, ST03/30) and the geopolymer matrix.
Applsci 16 00667 g007
Figure 8. SEM images of the geopolymer composites prepared with MGW and silica aggregates (1—geopolymer matrix, 2—glass, 3—thin metal coatings, 4—silica sand grains).
Applsci 16 00667 g008
Figure 9. Water absorption of the geopolymer composites prepared with MGW and silica aggregates.
Applsci 16 00667 g009
Figure 10. Pore-volume distribution across principal pore-size classes determined by mercury intrusion porosimetry.
Applsci 16 00667 g010
Figure 11. TGA curves of the weight loss (wt.%) of cube samples heated to 1000 °C in an air atmosphere at a flow rate of 30 mL∙min−1.
Applsci 16 00667 g011
Table 1. The mix design of geopolymer composites.
Sample Components (g)
L05KOHK2SiO3MGW1MGW2STJ25ST03/30
MGW1-G-I1002080120---
MGW1-G-II1002080160---
MGW2-G-I1002080-120--
MGW2-G-II1002080-160--
S-G-I1002080--3.3116.7
S-G-II1002080--4.4155.6
Table 2. Chemical analysis of MGW1 and MGW2 (main oxides in wt.%).
OxidesNa2OMgOAl2O3SiO2SO3K2OCaOTiO2Fe2O3ZnOBaOLOI
MGW110.204.630.5369.710.470.1011.400.140.320.290.551.54
MGW210.434.630.5868.900.530.1111.350.140.290.340.961.61
Table 3. XRD quantitative phase analyses of MGW1 and MGW2 (wt.%).
SampleAmorphous PhaseQuartzCalciteZincite
MGW198.40.50.70.4
MGW298.40.60.60.4
Table 4. XRF analyses of the geopolymer composites prepared with MGW and silica aggregates.
OxidesNa2OMgOAl2O3SiO2SO3K2OCaOTiO2Fe2O3ZnOBaOLOI
MGW1-G-I1.560.4921.4052.220.1311.443.580.890.710.160.306.94
MGW1-G-II1.690.5720.7353.010.1511.103.970.860.720.160.306.59
MGW2-G-I1.170.3321.9451.120.1212.372.860.920.780.140.387.70
MGW2-G-II1.390.4921.5152.010.1411.713.480.890.740.160.376.91
S-G-I0.33<0.1720.6755.600.0212.670.020.900.730.003<0.0018.91
S-G-II0.28<0.1720.3357.280.0212.1<0.0010.830.680.001<0.0018.27
Table 5. The flexural strength of the geopolymer composites prepared with MGW and silica aggregates.
SampleFlexural Strength
(MPa)
7 Days28 Days90 Days
MGW1-G-I4.7 ± 0.04.1 ± 0.04.10 ± 0.6
MGW1-G-II4.9 ± 0.34.50 ± 0.33.90 ± 0.6
MGW2-G-I5.3 ± 0.65.30 ± 0.53.90 ± 0.3
MGW2-G-II5.7 ± 0.35.50 ± 0.64.30 ± 0.3
S-G-I8.8 ± 0.410.3 ± 1.08.6 ± 0.3
S-G-II8.2 ± 0.510.9 ± 0.69.2 ± 0.3
Table 6. The compressive strength of the geopolymer composites prepared with MGW and silica aggregates.
SampleCompressive Strength
(MPa)
7 Days28 Days90 Days
MGW1-G-I60.2 ± 1.870.1 ± 3.170.8 ± 2.9
MGW1-G-II64.2 ± 1.965.9 ± 2.967.4 ± 2.8
MGW2-G-I70.3 ± 1.270.8 ± 1.969.5 ± 1.8
MGW2-G-II68.2 ± 1.264.5 ± 4.068.5 ± 4.4
S-G-I81.5 ± 4.487.5 ± 7.187.0 ± 5.2
S-G-II92.2 ± 6.493.5 ± 3.290.9 ± 3.8
Table 7. XRD quantitative phase analyses of the geopolymer composites prepared with MGW and silica aggregates (wt.%).
SampleAmorphous PhaseQuartzCalciteAnatase
MGW1-G-II96.030.50.5
MGW2-G-II96.32.80.70.2
S-G-II51.048.7-0.3
Table 8. The average values of the main textural parameters and calculated parameters.
VcφρAppρHgρHeφHe
(mm3·g−1)(%)(g·cm−3)(g·cm−3)(g·cm−3)(%)
GP22.03.531.6631.6052.25428.81
S-G-I33.86.482.0531.9202.38519.52
S-G-II32.66.372.0881.9552.39118.22
MGW18.62.072.4712.4202.4611.66
MGW1-G-I33.45.901.8841.7732.28622.45
MGW1-G-II39. 57.412.0271.8772.30018.38
MGW28.31.952.3972.3502.4202.89
MGW2-G-I35.36.471.9621.8352.23217.79
MGW2-G-II35.66.652.0031.8692.34820.38
Vc—total pore volume, φ/φHe—total porosity by MIP/calculated porosity using helium density, ρApp/ρHg/ρHe—apparent/bulk/helium density.
Table 9. Thermal properties of the geopolymer composites prepared with MGW and silica aggregates.
Sampleλa·106Cρ·10−6T
(W·m−1·K−1)(m2∙s−1)(J∙m−3∙K−1)(°C)
MGW1-G-I0.4693 ± 0.00060.3089 ± 0.00051.5190 ± 0.001929.197
MGW1-G-II0.5286 ± 0.00160.3711 ± 0.00141.4244 ± 0.003430.009
MGW2-G-I0.4487 ± 0.00090.3008 ± 0.00081.4918 ± 0.006630.085
MGW2-G-II0.5284 ± 0.00060.3138 ± 0.00071.6733 ± 0.003830.206
S-G-I0.9364 ± 0.00220.6125 ± 0.00151.5289 ± 0.002729.729
S-G-II1.0851 ± 0.00620.7335 ± 0.00331.4793 ± 0.002830.450
λ—thermal conductivity, a—thermal diffusivity, Cρ—volumetric-heat capacity, T—temperature.
Disclaimer/Publisher’s Note: The statements, opinions and data contained in all publications are solely those of the individual author(s) and contributor(s) and not of MDPI and/or the editor(s). MDPI and/or the editor(s) disclaim responsibility for any injury to people or property resulting from any ideas, methods, instructions or products referred to in the content.