1. Introduction
Power transformers are the critical equipment in power grids, designed for a service life of up to 40 years. However, prolonged operation subjects them to short circuit impacts and other incidents that progressively reduce their lifespan. Short circuit impacts cause irreversible damage to transformer windings and structural components. Once this damage exceeds a critical threshold, it rapidly escalates into catastrophic failures that threaten system stability and incur substantial economic losses [
1,
2,
3]. Therefore, equipping transformers with highly sensitive and reliable detection devices that issue warnings during the initial stages of defect development and enable timely shutdowns for maintenance has become an essential choice for extending transformer lifespan, ensuring grid safety, and maximizing economic benefits [
4,
5,
6,
7,
8].
In current research on detecting methods, most studies focus on winding deformation [
9,
10,
11,
12,
13]. Lin X [
14] analyzed the force characteristics of power transformers during short-circuit moments. The results indicate that during short-circuit moments, the low voltage winding experiences an inward electromagnetic force, while the high voltage winding experiences an outward electromagnetic force. Zhang JC [
15] investigated the deformation of transformers under multiple short-circuit impacts, obtaining a curve showing the cumulative plastic deformation of the windings with increasing number of short-circuit events. Li BY [
16] analyzed various mechanical failure modes of windings following short-circuit impacts, identifying instability caused by severe deformation as the primary failure mechanism.
The above studies all focus on winding deformation. However, by the time significant winding deformation occurs, the transformer has already sustained damage, rendering ideal early warning ineffective. To detect anomalies before noticeable transformer winding failures, this paper investigates online detecting methods targeting the preload between windings. Preload indicates the degree of axial compression experienced by spacers and pressure boards during short circuit impacts. During infrequent short circuit impacts, the low compression of spacers and pressure boards effectively supports the windings, preventing deformation. After multiple impacts, gaps gradually form between the pressure boards and windings, significantly reducing short circuit impact resistance and increasing deformation risk [
17,
18]. Therefore, detecting changes in preload provides an effective method for early warning of winding instability.
Research treating the absence of preload as a cause of winding failure has become quite common. Wang XY [
19] pointed out that after the loss of preload in transformers, the spacers would shift, leading to an increase in the electromagnetic forces acting on the windings and subsequently causing the entire winding to become unstable. Liu J [
20] pointed out that the absence of preload reduces the winding’s resistance to short circuits, significantly impacting the transformer’s lifespan. Jin M [
21] pointed out that multiple short-circuit impacts can cause a reduction in the axial height of the spacer, leading to a significant loss of preload. Sui H [
22] subjected spacers with varying degrees of aging to short-circuit impact tests. The comparative results revealed that prolonged aging significantly accelerates the loss of preload. Gao Z [
23] demonstrated through experiments and simulations that windings with low preload may experience radial buckling at stresses far below their yield strength.
Existing research generally indirectly reflects the degree of preload loss by detecting the axial deformation of windings. Gao SH [
24] quantitatively analyzed cumulative winding deformation by analyzing vibration signals from the surface of power transformer tanks and calculating the deviation between measured and reference values in time domain vibration acceleration signals. Li ZH [
25] obtained the amplitude-frequency and phase-frequency characteristics of the current winding through FRA (Frequency Response Analysis). By quantifying the fault severity using the Minkowski distance of frequency sampling points, axial plastic deformation measurement was achieved. Miyazaki Satoru [
26] installed electromagnetic wave sensors on the inner tank wall to detect signals before and after deformation. Using a regression tree model based on three features, radial deformation was quantitatively analyzed, enabling online detection and localization of radial deformation. These studies calculate preload loss through methods such as vibration signals, FRA, and electromagnetic detection, enabling qualitative preload monitoring. However, during initial short-circuit impacts, the axial height reduction of the spacer typically falls below 0.1 mm. Since detection methods like FRA generally have a precision of 1 mm, they cannot quantitatively measure the preload loss caused by spacer deformation [
27,
28,
29,
30]. Of course, resistive strain gauges, MEMS based wireless strain sensors, and laser Doppler nanometer-level detectors can achieve high precision detection. However, all three are difficult to install inside fuel tanks for long-term online detecting [
31,
32,
33].
To achieve high precision measurements and long-term online detecting, existing research predominantly employs fiber optic sensors [
34,
35,
36,
37,
38]. Fiber optic sensors is a sensor made from optical fiber that remains unaffected by strong electromagnetic fields and short circuit temperature rises, offering extremely high detection accuracy. Additionally, since optical fiber is made of quartz material, its design lifespan can reach 30 years, resulting in very low maintenance costs after installation [
39]. Seifaddini, N [
40] conducted DGA analysis of the internal winding using distributed fiber optic sensors and calculated the degree of insulation aging based on this analysis. Mudabbir Badar [
41] utilized FBG (Fiber Bragger Grating) to measure oil temperatures both inside and outside transformer tanks, achieving measurement results highly consistent with traditional single point thermocouples and infrared imaging. Marceli N. Gonçalves [
42] employed FBG and piezoelectric ceramics to assess power quality in electrical systems, achieving high detection accuracy with a significantly extended sensing range compared to conventional methods. Hong Jiang [
43] utilized FBG to detaect surface vibration signals on winding enclosures, overcoming the susceptibility of traditional vibration monitoring to strong electromagnetic interference, with a fault detection accuracy rate reaching 97.94%. de Melo A.G. [
44] compared FBG performance under two sensor encapsulation materials: polyether ether ketone (PEEK) and transformer board. Results showed FBG sensors encapsulated in PEEK exhibited 4.47 times higher sensitivity than those in transformer board. Tian T [
45] employed phase-shifted FBG as ultrasonic sensors to detect ultrasonic signals generated during transformer partial discharge processes, achieving sensitivity 17.5 times higher than conventional ultrasonic detection methods.
From the above research, it can be seen that due to their immunity to strong electromagnetic fields and temperature rise, fiber optic sensors find extensive application in transformer inspection. However, few studies have applied fiber optic sensors to online stress detection to date. This is because the quartz material used in optical fibers is susceptible to damage during short circuit impacts, making sensor placement challenging. Some studies have examined the survivability of fiber optic sensors under mechanical impact and their installation locations. Ma G [
46] embedded DOFS (Distributed Optical Fiber Sensing) on the surface of transformer windings, obtained continuous optical wavelength signals, and successfully calculated the deformation distribution of the windings. However, in this study, the winding deformation was artificially induced by bending, and the optical fiber sensors themselves were not subjected to short-circuit impacts. Therefore, this installation method does not represent its applicability in engineering practice. Kim SW [
47] conducted research on fiber optic placement patterns on fan blade surfaces to reduce fiber breakage during severe deformation. Through comparative analysis of light wavelength signals during experiments, the new placement scheme demonstrated that fiber optic sensors were less prone to breakage during fan blade rotation.
The above studies were compiled, and the advantages and disadvantages of various detection methods are shown in
Table 1.
The above research demonstrates that fiber optic sensors can effectively measure the preload of windings, but it is necessary to identify suitable sensor placement locations. To address this issue, this paper systematically compares the short-circuit resistance of FBGs across four installation locations—the surface of the winding, inside the support bar, inside the spacer, and on top of the pressure board—through 42 short-circuit impact tests. Short-circuit resistance is evaluated based on the number of short-circuit impacts withstood before sensor detection data exhibits significant anomalies. Experimental results indicate that the optical fiber sensor installed on the top of the pressure board remained unbroken after 42 short-circuit impact tests. Its short-circuit resistance significantly outperformed the other three installation locations, making it the optimal placement for optical fiber sensors. Subsequently, a transformer equipped with an FBG at this location underwent 12 short-circuit impact tests. The results aligned with simulations and inspection findings from the hoisting cover.
Overall, this study addresses the low-precision issue inherent in previous preload detecting research by proposing a high-precision online preload detecting method based on FBG. This method provides a highly sensitive, survivable, and easily deployable technical pathway for transformer condition assessment.
2. Experiment Methods
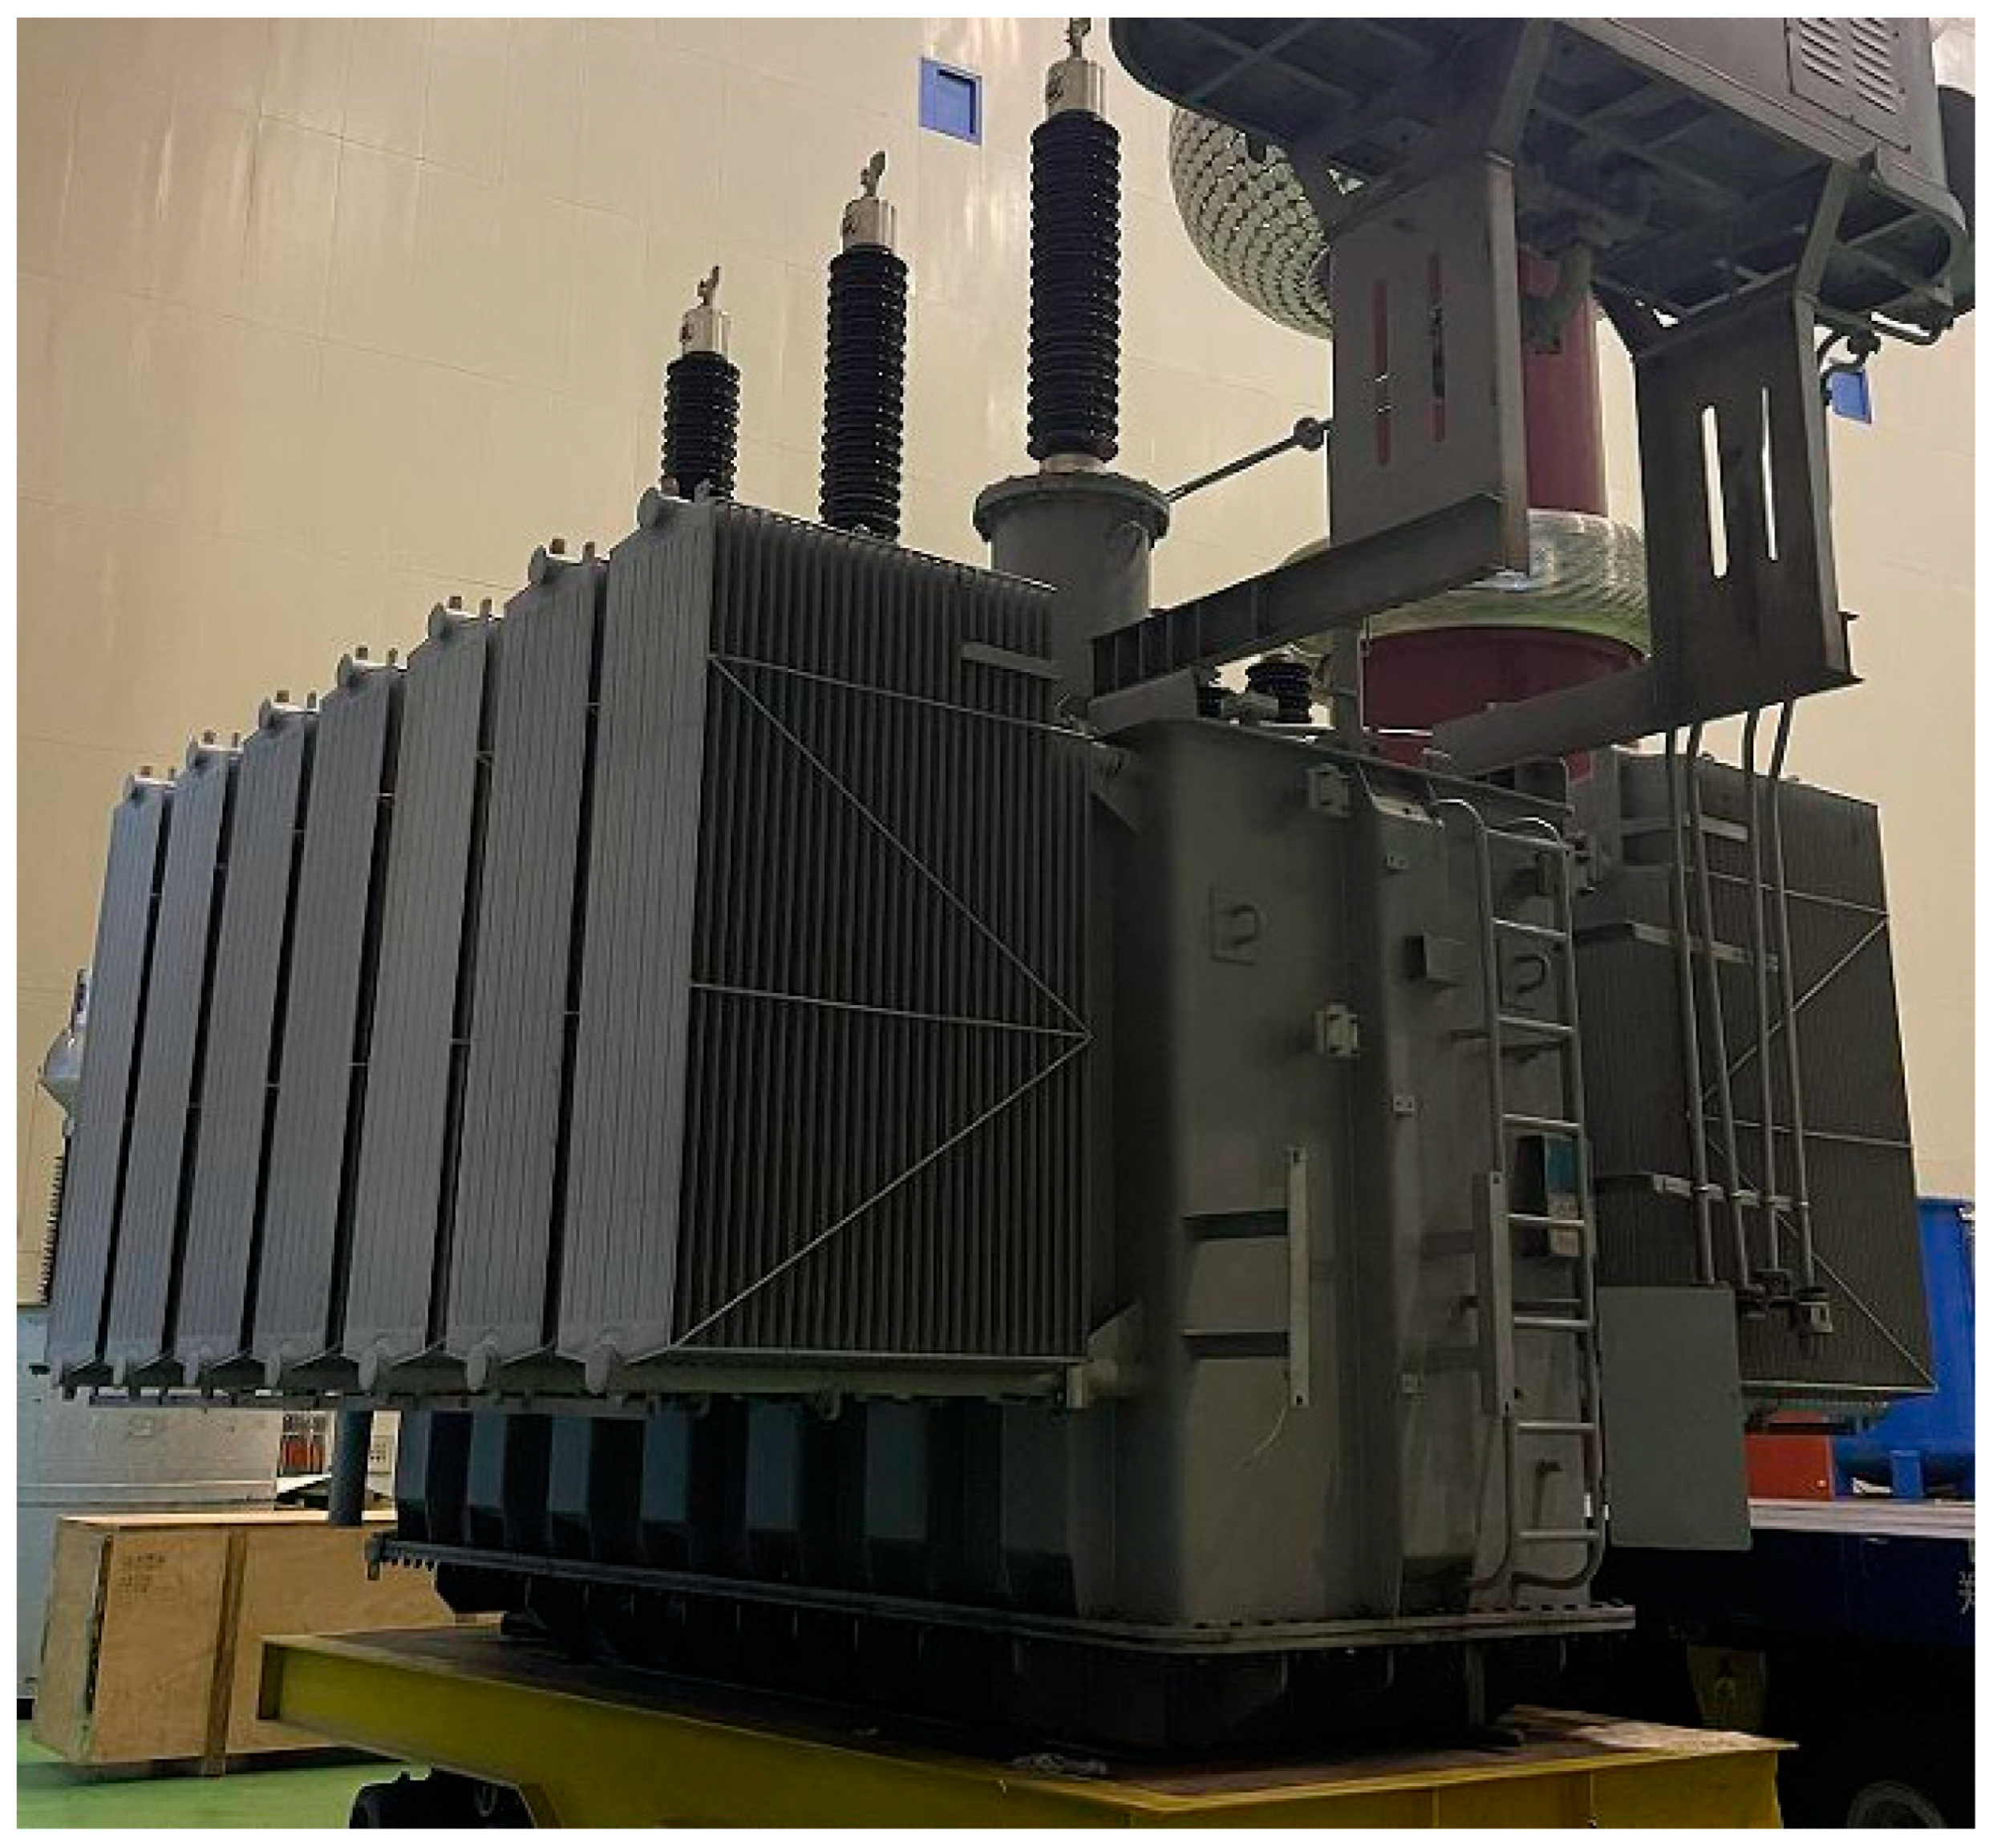
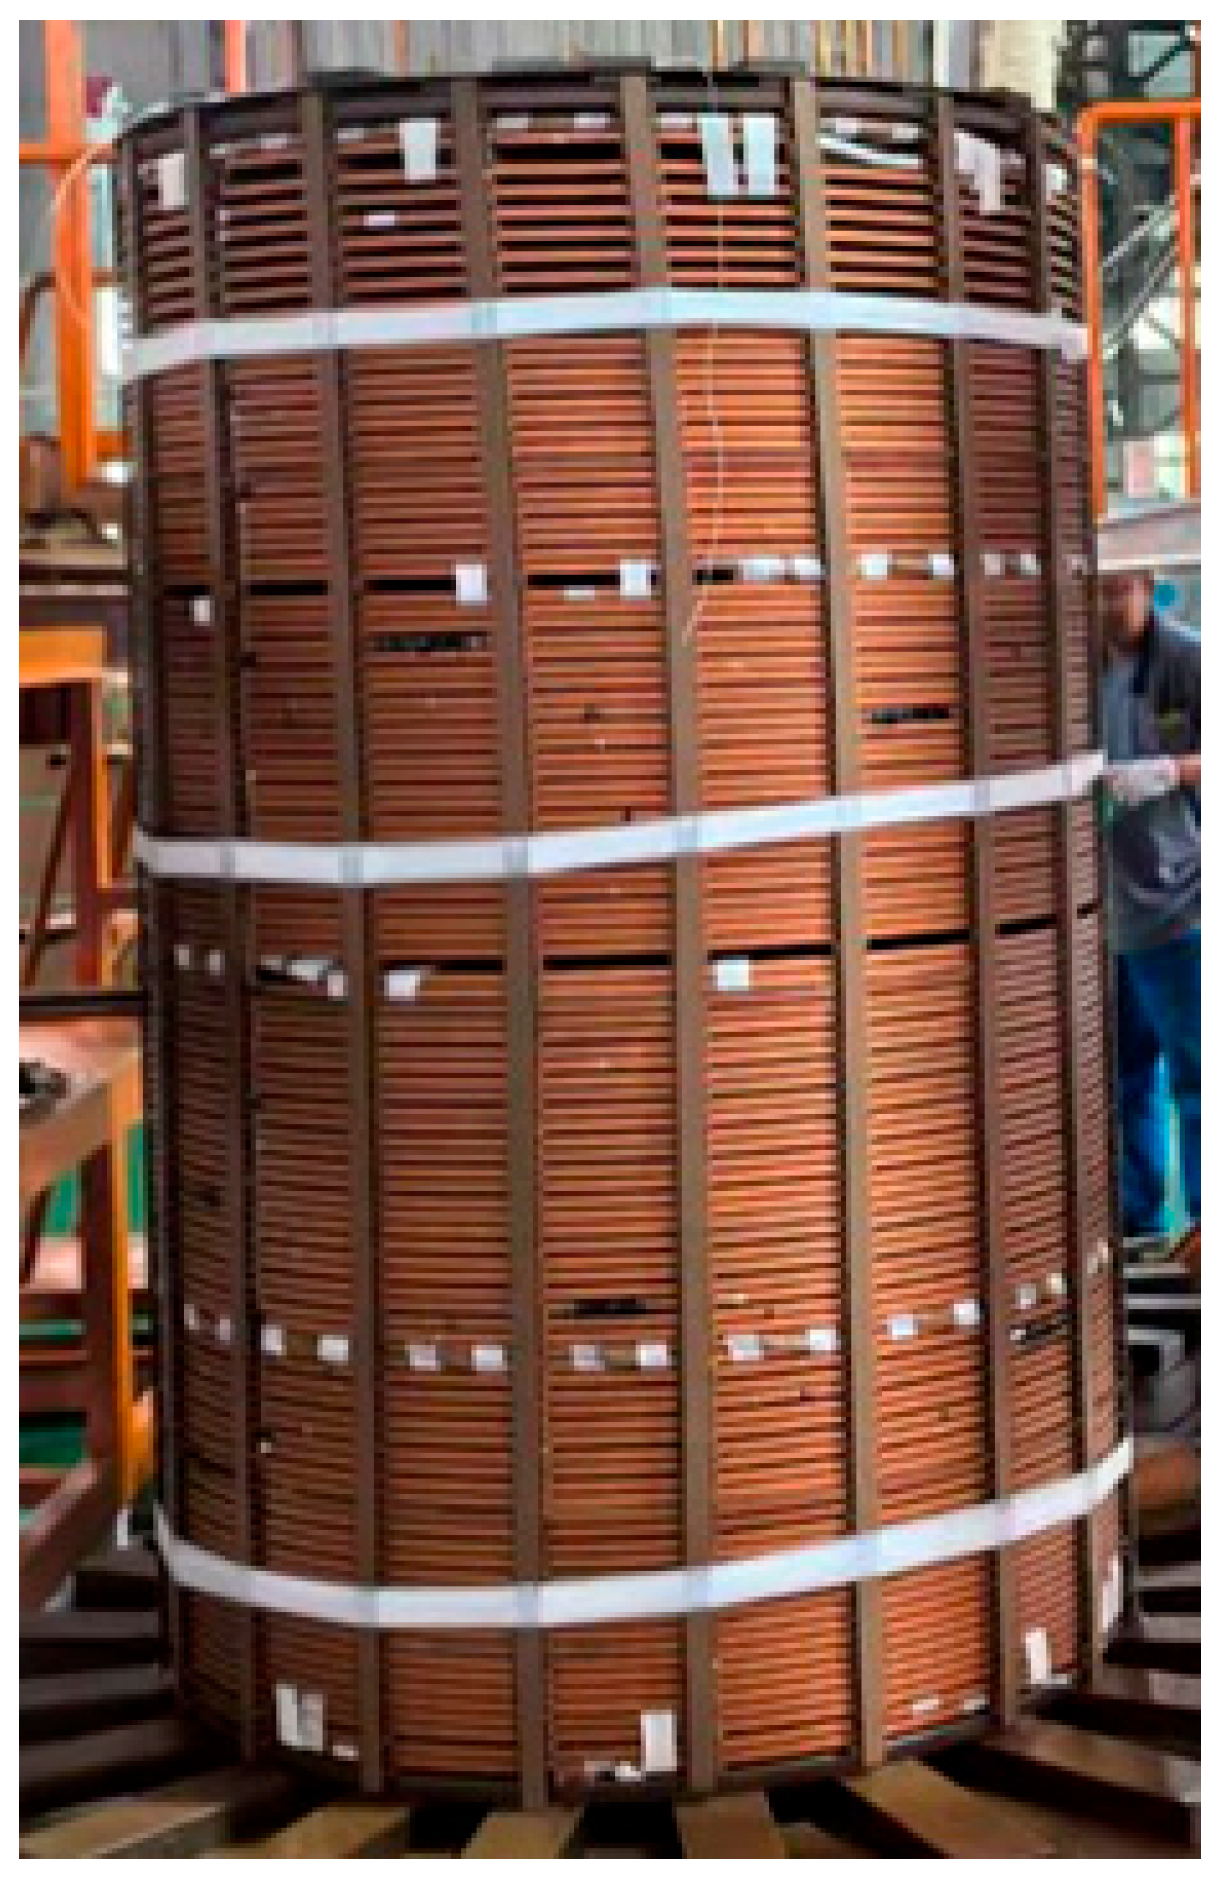
This experiment consists of two sections. In the first section, it was hypothesized that among four fiber optic sensor placement schemes, at least one would enable the fiber to withstand multiple short-circuit impacts with minimal breakage. We subjected four sets of fibers to 42 short-circuit impacts and identified the placement scheme that produced the fewest breaks as the optimal configuration. The results from this first section address the issue of fiber breakage occurring near windings when fiber optic sensors are placed in such locations. After confirming the fibers would not break, we further ensured their operational integrity by designing a second experimental section. This second section verified that the fiber placement scheme identified in the first section not only prevented breakage but also enabled normal data detection. By integrating the findings from both sections, an online preload detecting method for power transformers based on FBG was proposed. Both sections of the experiment were conducted on an SFZ-40000/110 power transformer manufactured by Shenyang Transformer Research Institute in Shenyang, China. The physical diagram is shown in
Figure 1. The transformer winding parameters are listed in
Table 2.
It should be noted that since this experiment was conducted on only one transformer, the proposed method cannot be guaranteed to be universally applicable to all transformers. The conclusions drawn from testing this SFZ-40000/110 power transformer are theoretically applicable only to this specific model and similar models of power transformers.
2.1. Experimental Comparison of Short Circuit Resistance in FBG Sensors Under Different Placement
To achieve online detection by deploying FBG within a transformer, the first step is to determine the placement scheme for the FBG sensors. Since the optical fibers are primarily made of quartz, which has poor short circuit impact resistance, they are prone to breakage during detection due to such impacts. To determine the optimal sensor placement for maximum short circuit resistance, this study installed them on the winding surface, inside the support bar, inside the spacer, and on top of the pressure board, respectively, and subjected them to short circuit impact tests. Although the FBG sensors on the winding surface and inside the support bar cannot be used for preload detection, their experimental results provide valuable guidance for the field of FBG online detection and were therefore included in the comparative experiments. It should be noted that in all the following fiber optic placement schemes, the term “winding” refers exclusively to the low-voltage winding.
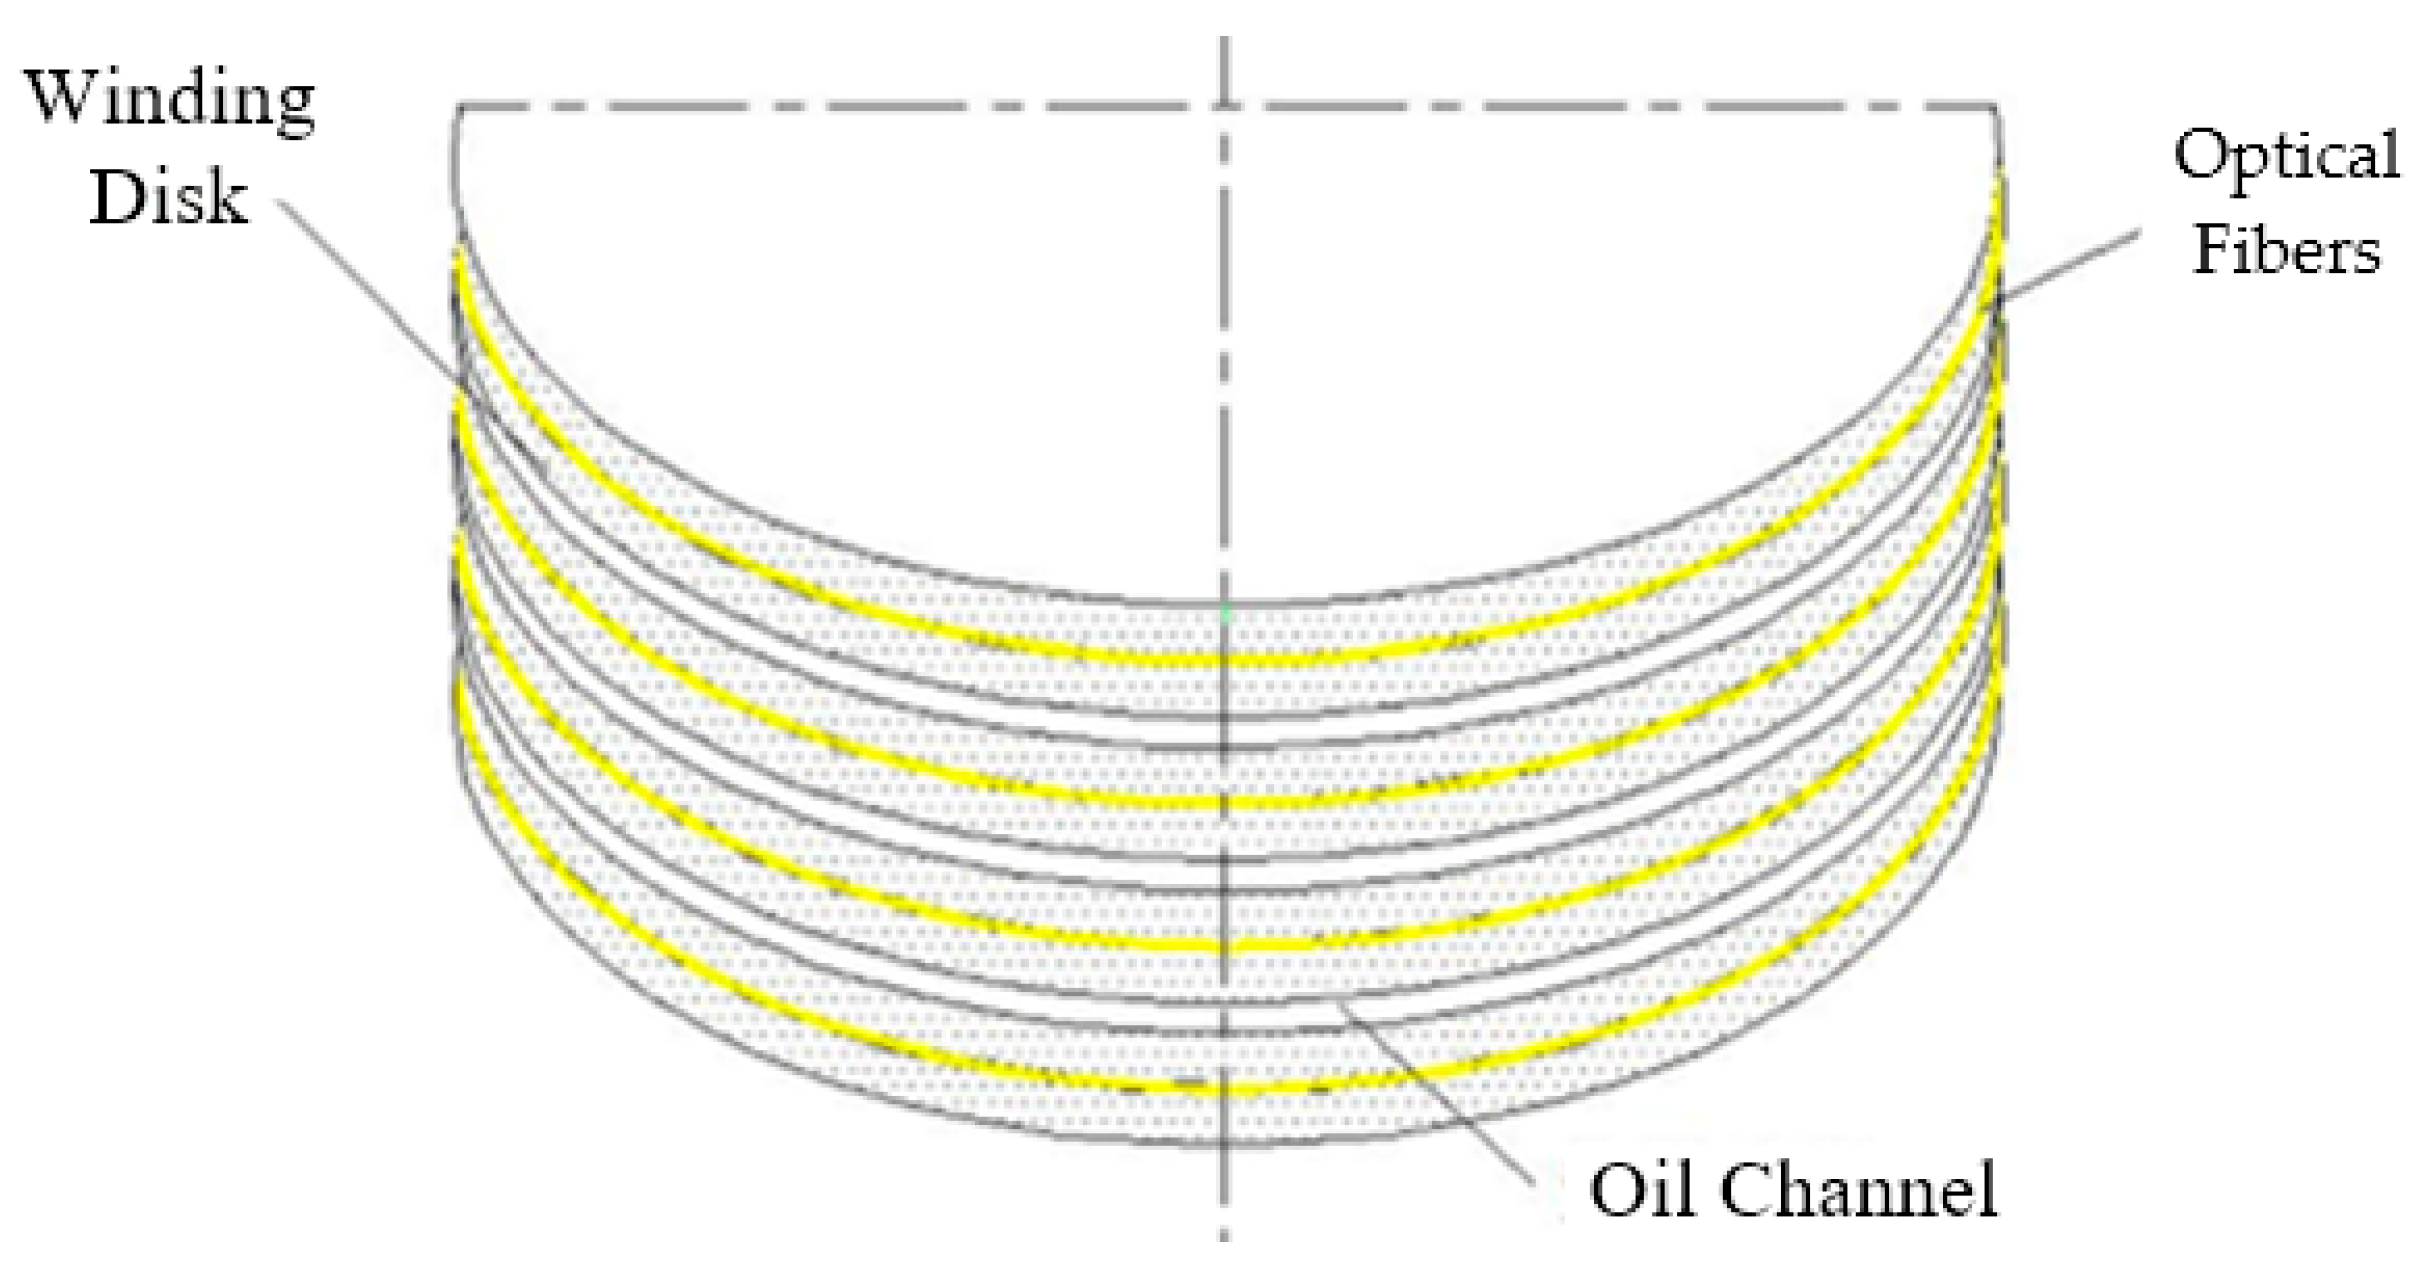
The first set of FBG sensors is arranged on the surface of the winding. The optical fibers are installed in a continuous spiral pattern and bonded to the center of each winding turn using epoxy resin adhesive, as illustrated by the yellow lines in
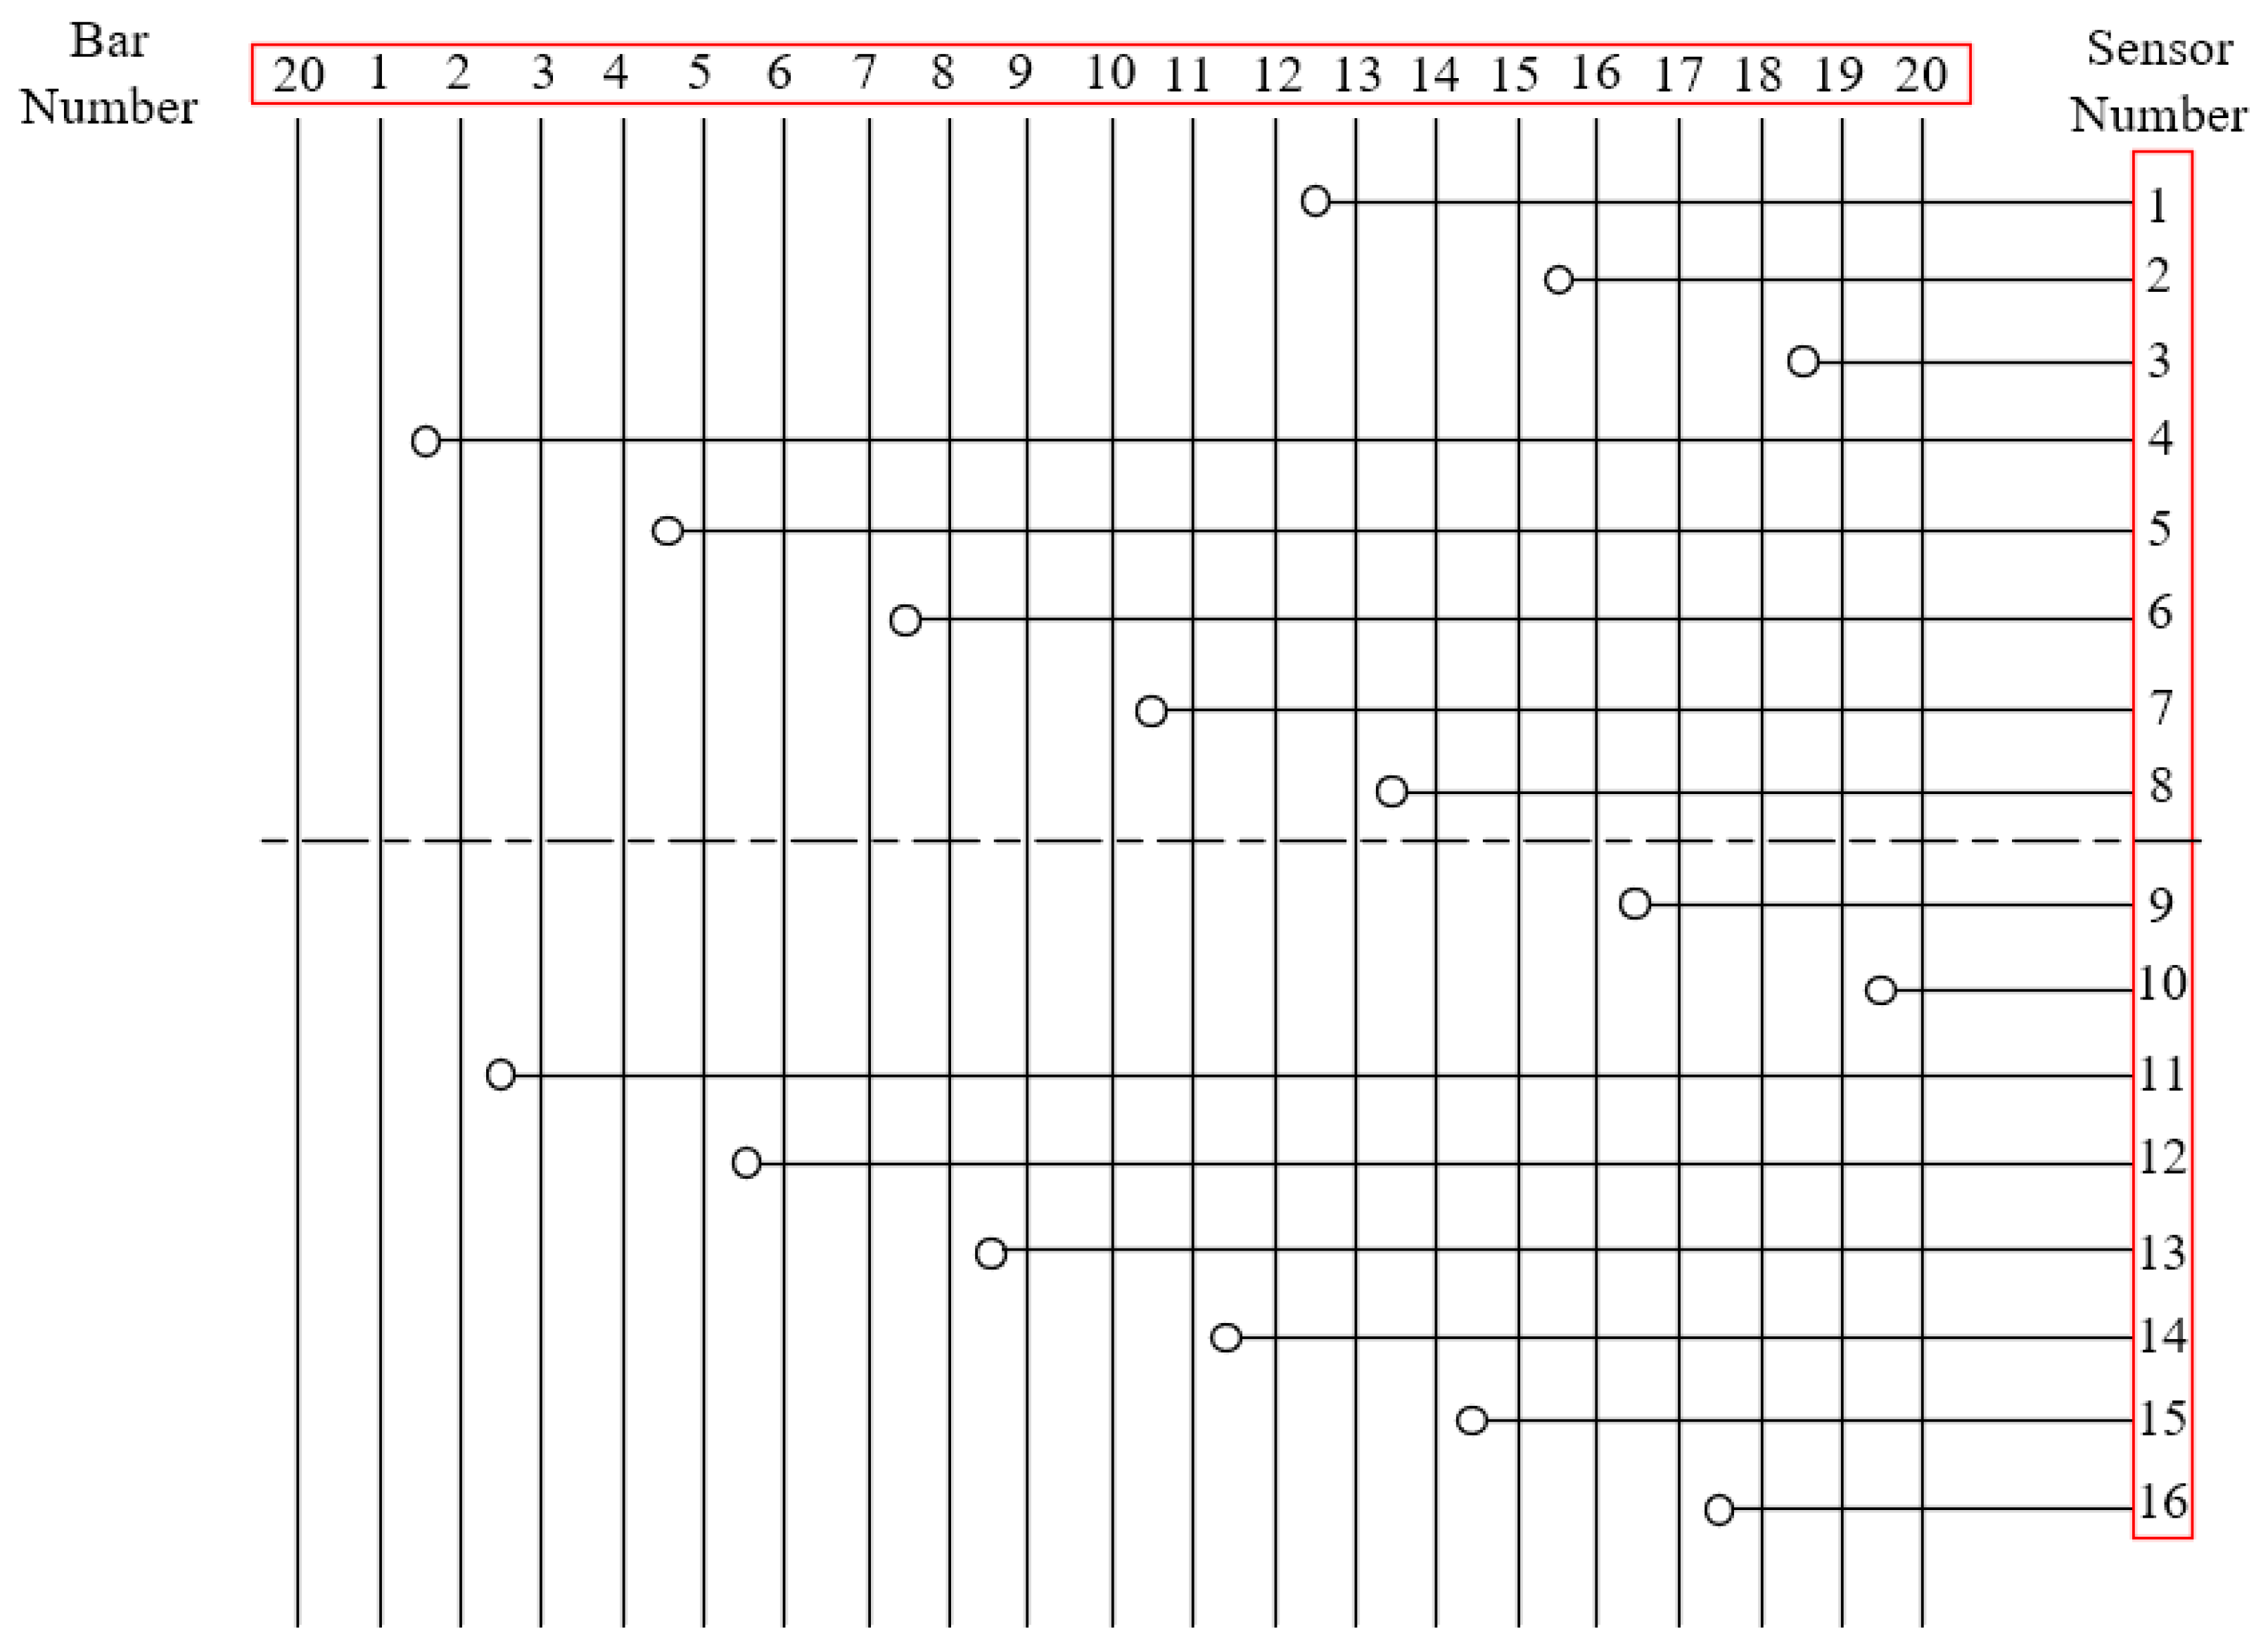
Figure 2. Each phase of the winding was equipped with two optical fibers, each approximately 40 m long, totaling six fibers across all three phases. Each fiber contains eight evenly distributed FBG sensors, totaling 48 FBG sensors across all six fibers. These FBG sensors are uniformly spaced across the winding surface, as illustrated in
Figure 3. The spacing between any two FBG sensors corresponds to three support bars, forming an overall downward spiral distribution pattern.
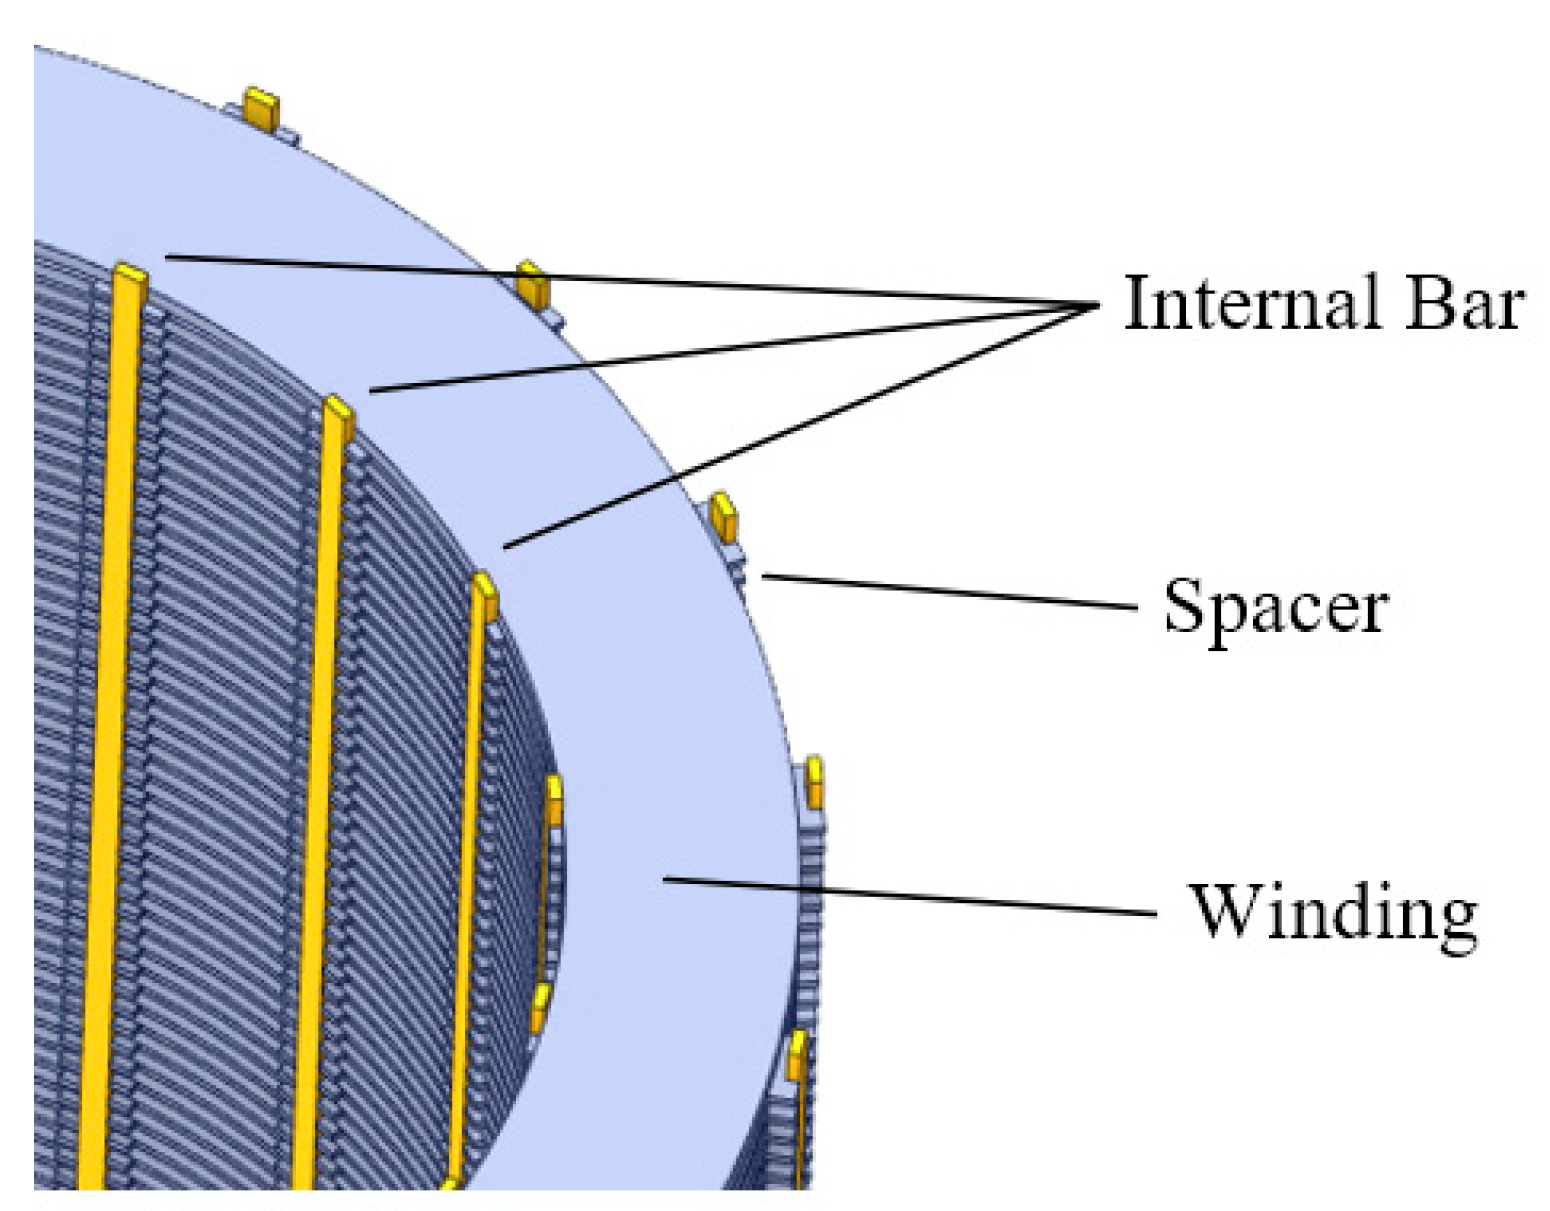
The second set of FBG sensors is arranged inside the support bars, with their fiber optic placement selected within the inner bars of the low-voltage windings. This is because during a short circuit impact, the low-voltage windings contract inward, creating gaps between the outer bars and the windings—making them unsuitable for fiber optic placement. In contrast, the inner bars maintain constant contact with the sensors, so they are more suitable as FBG sensor locations. The position of the inner bars within the winding is shown in
Figure 4, where the yellow sections represent the support bars and the text annotations indicate the inner bars.
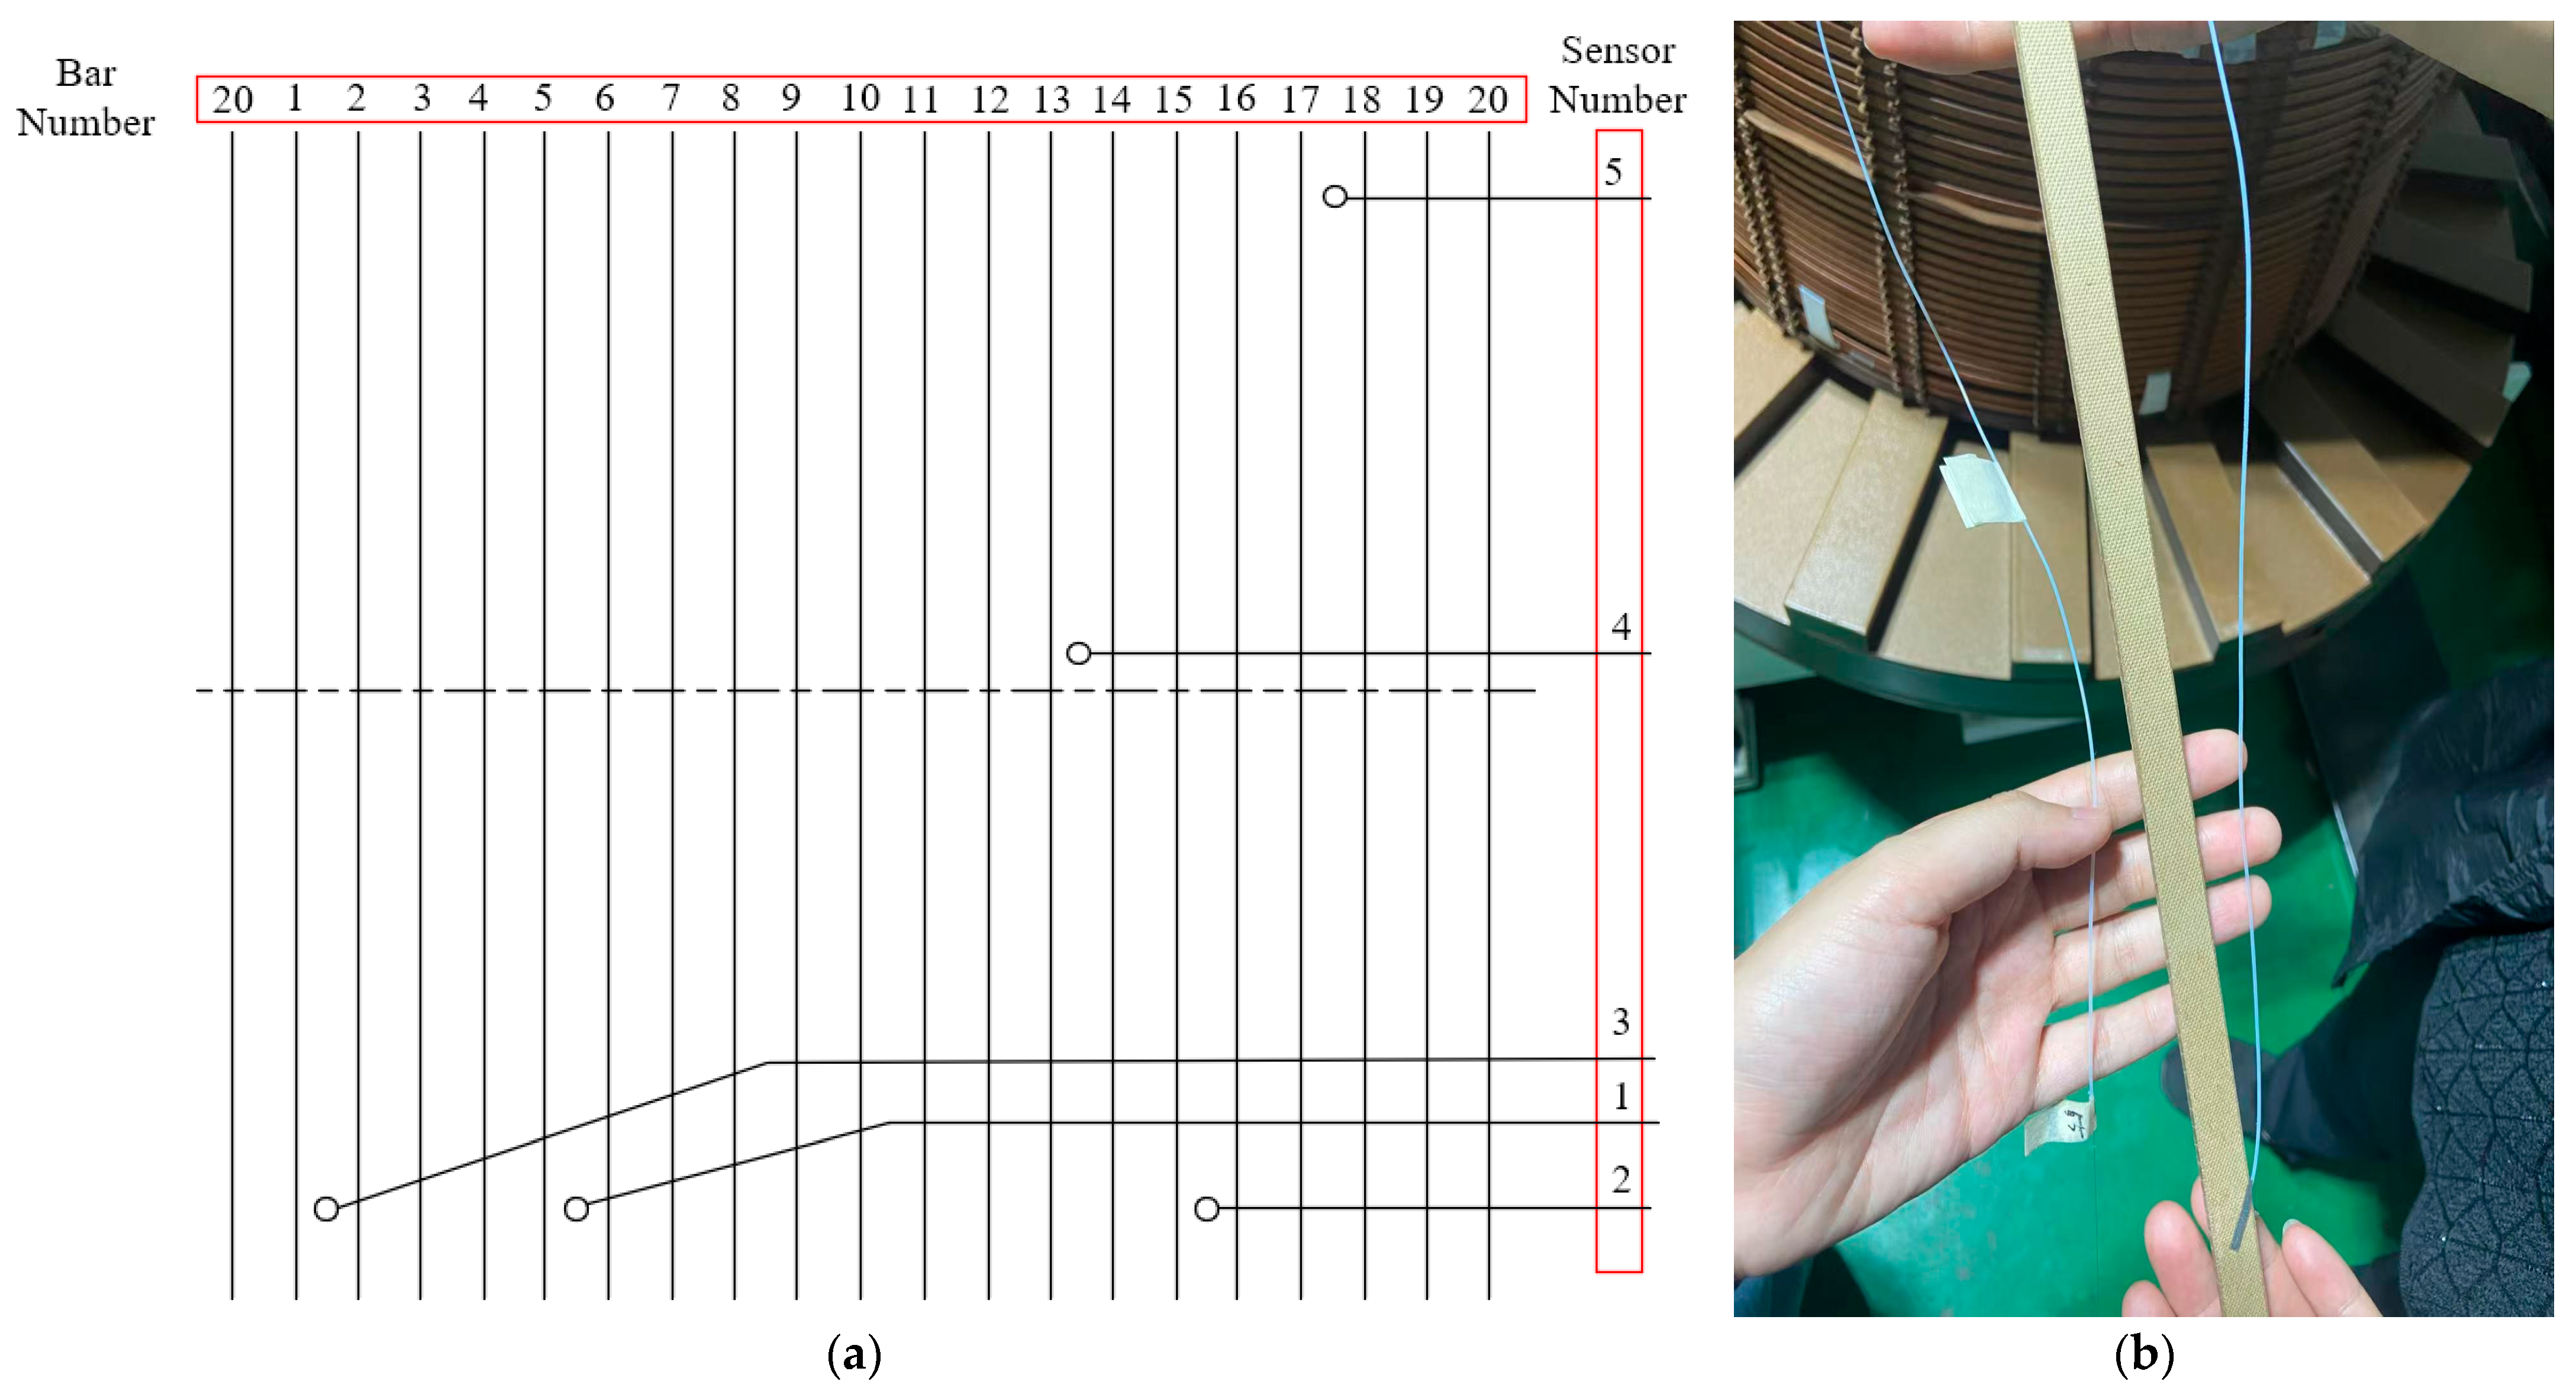
Each phase support bar contains five FBG sensors, totaling fifteen across all three phases. The distribution of FBG sensors within each phase winding is illustrated in
Figure 5a. The FBG sensors are installed within the support bars via a slotted embedding method, with the installation effect shown in
Figure 5b. The slotting width of the bar in this paper is 3 mm, with a depth of 1.5 mm. The slotting forms a 30° angle with the bar edge. The slotting length has minimal impact on the test results. In the experiments conducted in this paper, the slotting length extends from one edge to near the opposite edge.
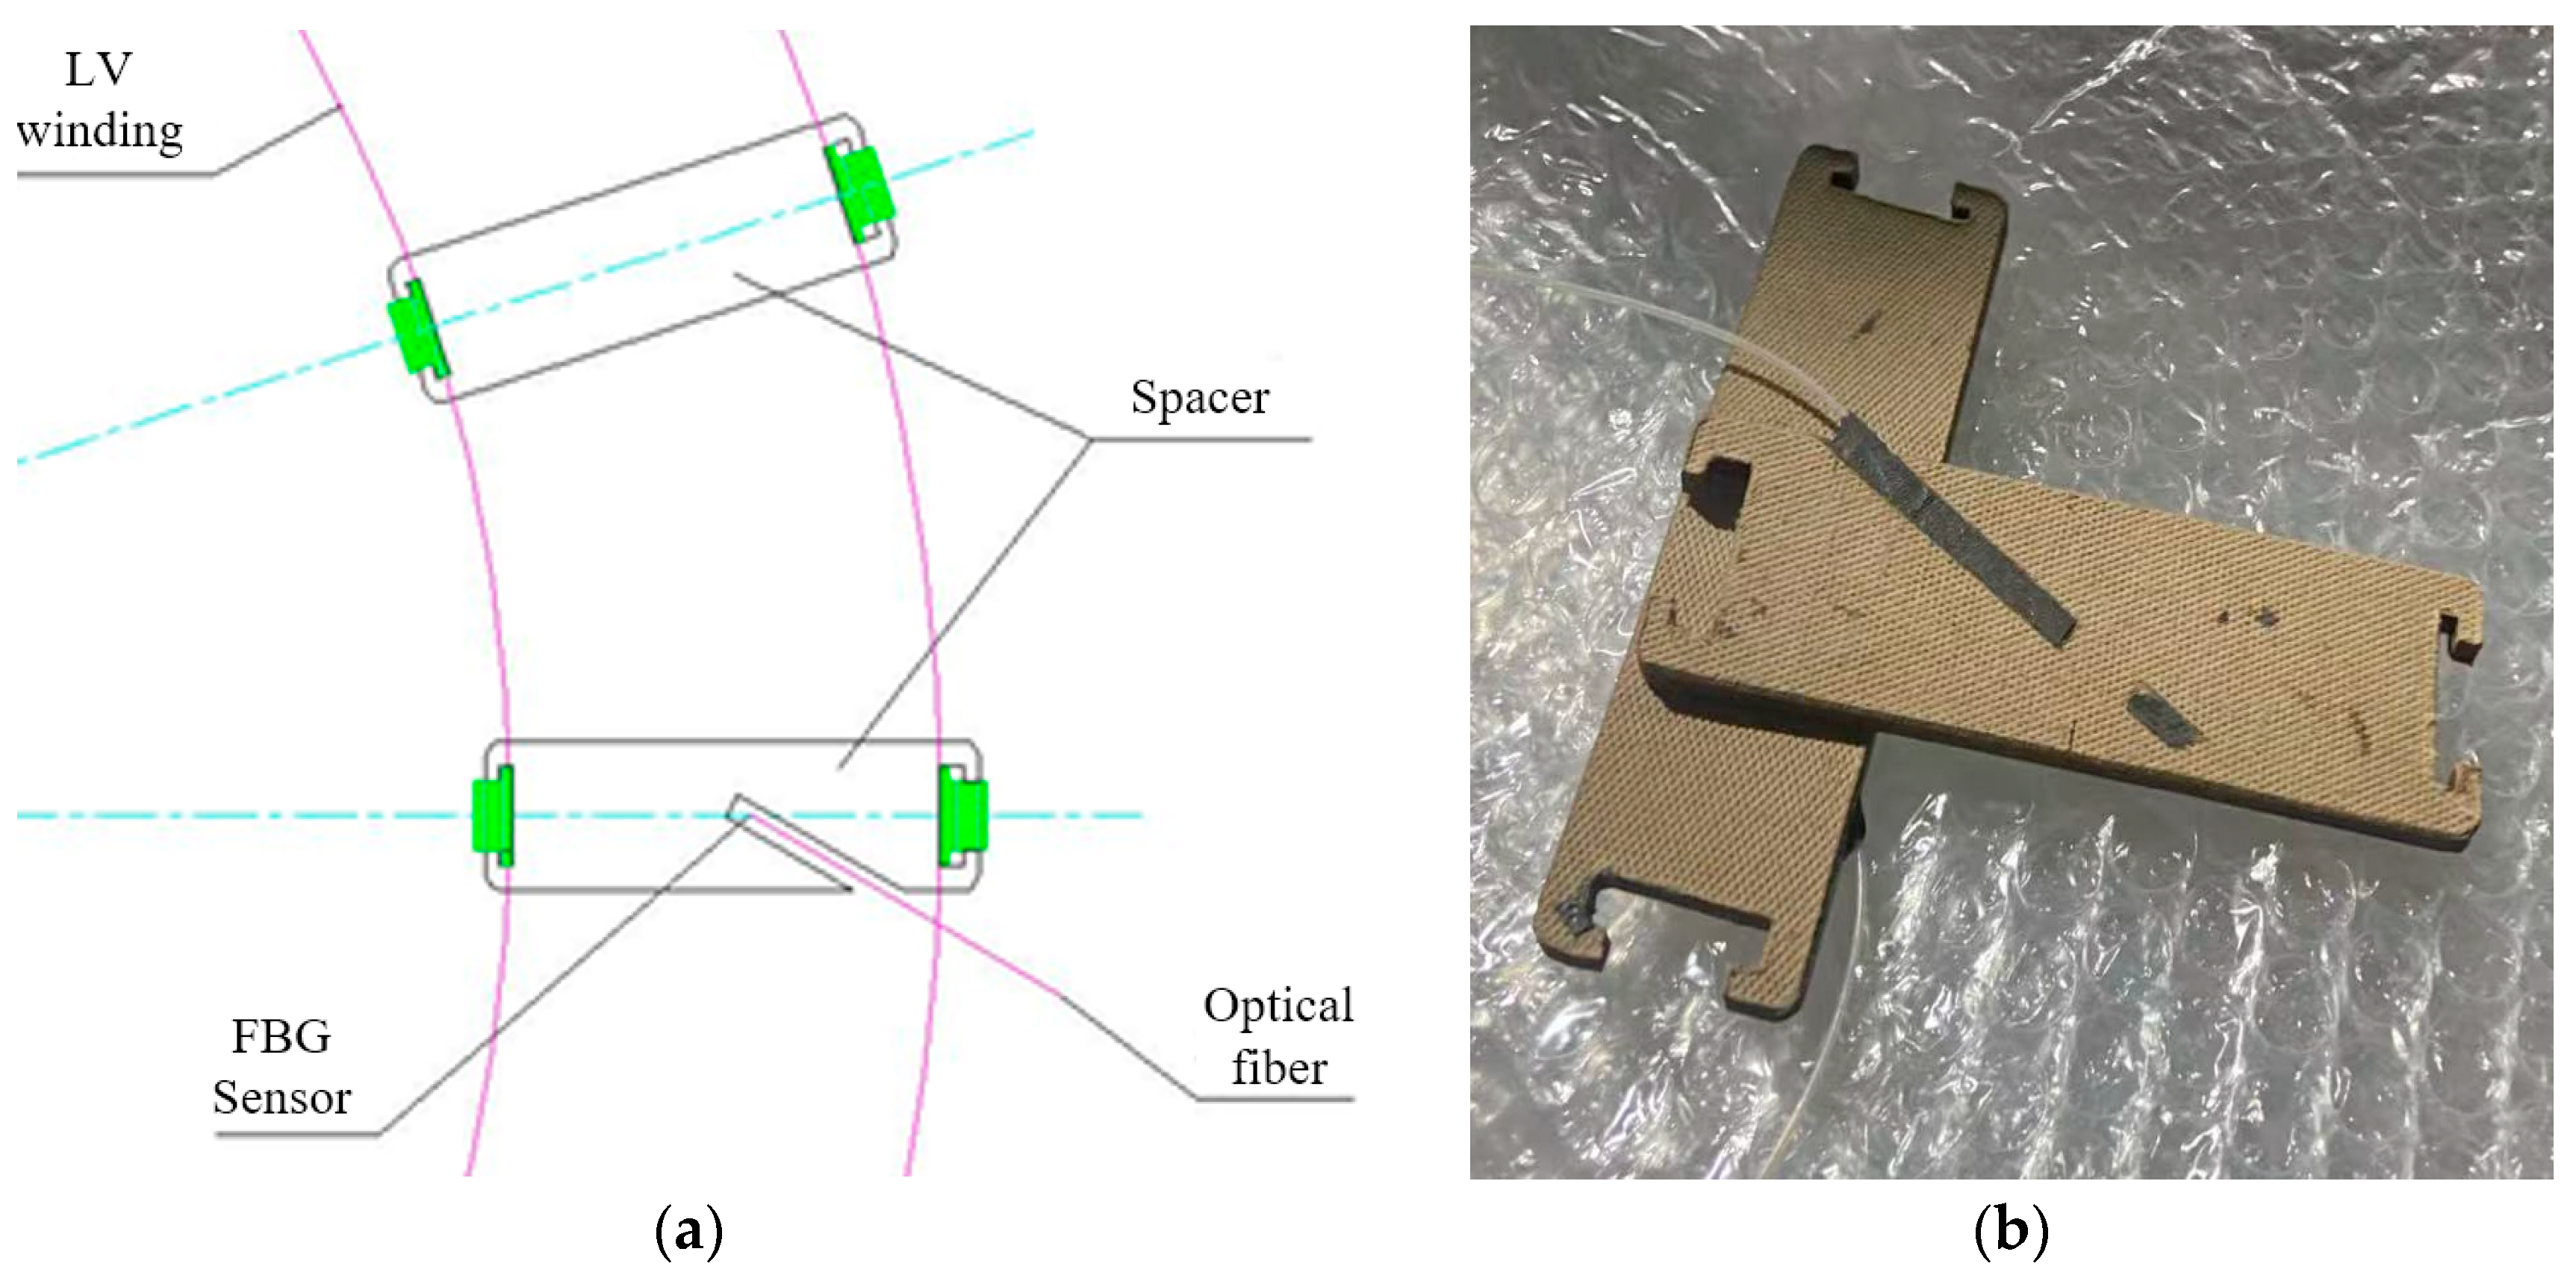
The third set of FBG sensors is installed inside the spacers, with the placement method shown in
Figure 6a and the physical diagram shown in
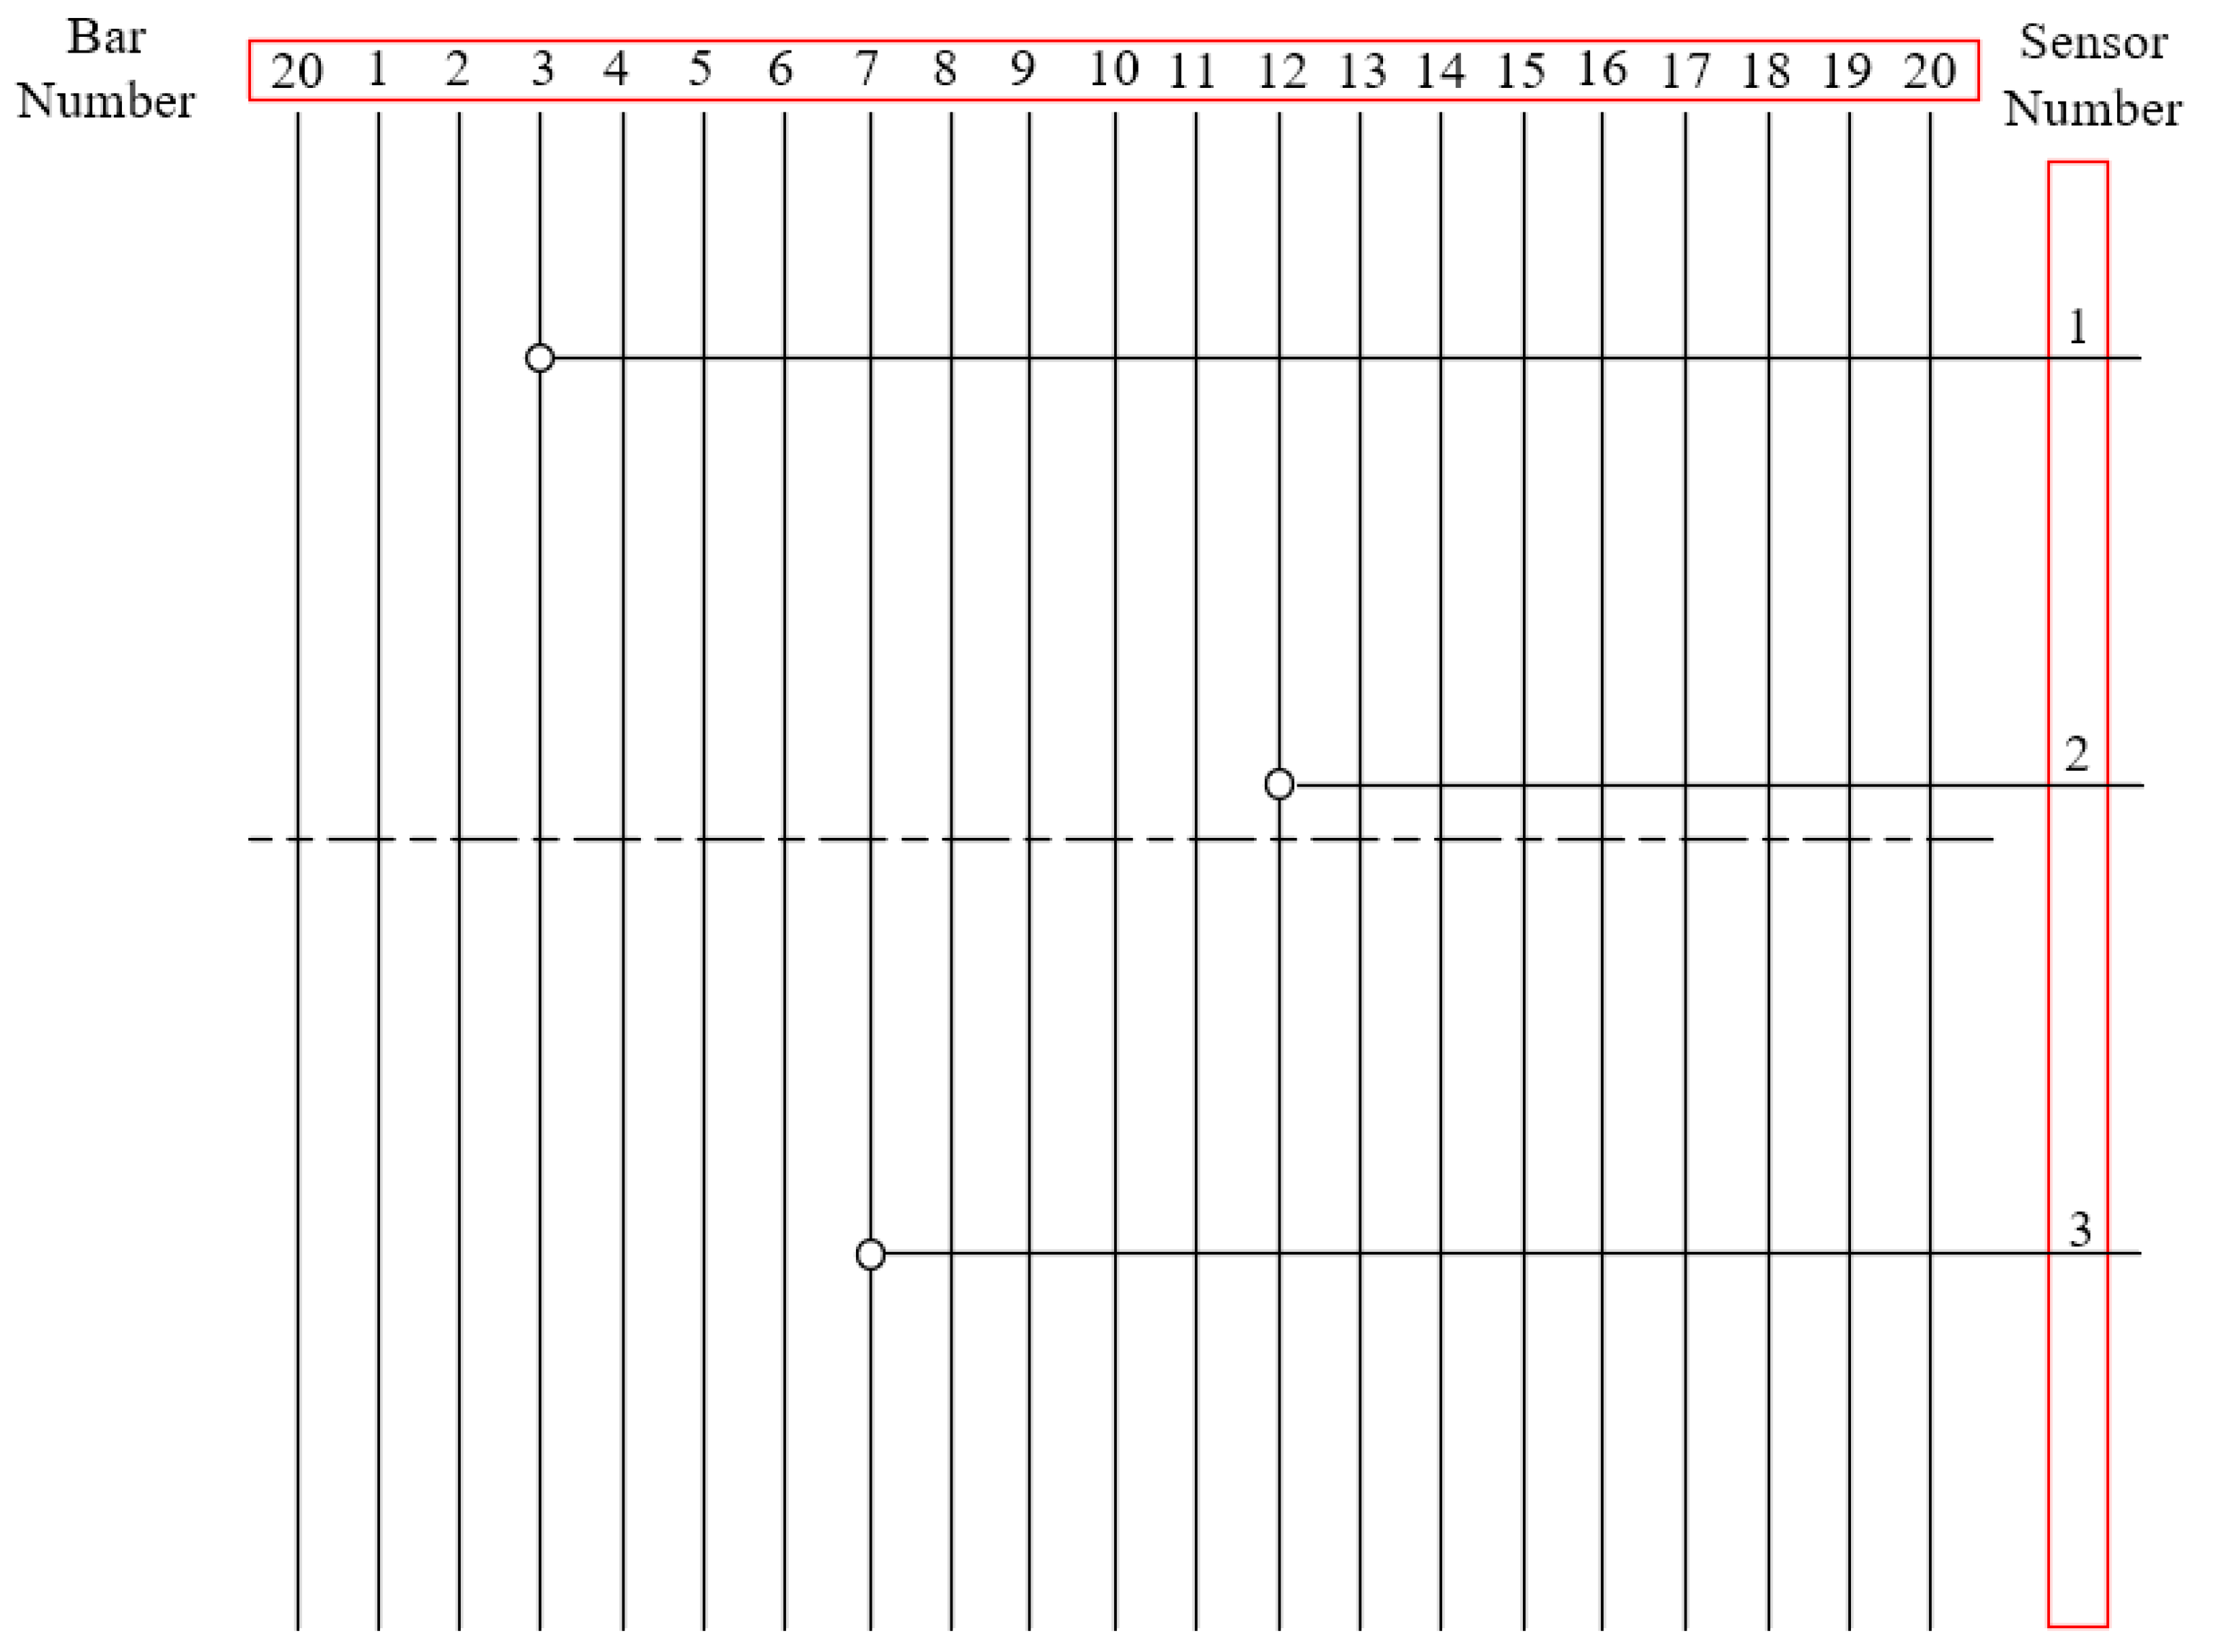
Figure 6b. The slotting parameters for spacers are largely consistent with those for bars, with the only difference being that the slotting length extends from one side of the spacer to the other. After slotting, the optical fiber detection status was confirmed to be normal. Subsequently, the sensors were encapsulated using epoxy resin adhesive. A total of three such sensors were deployed, all positioned on the phase B winding, with specific FBG sensors locations as shown in
Figure 7.
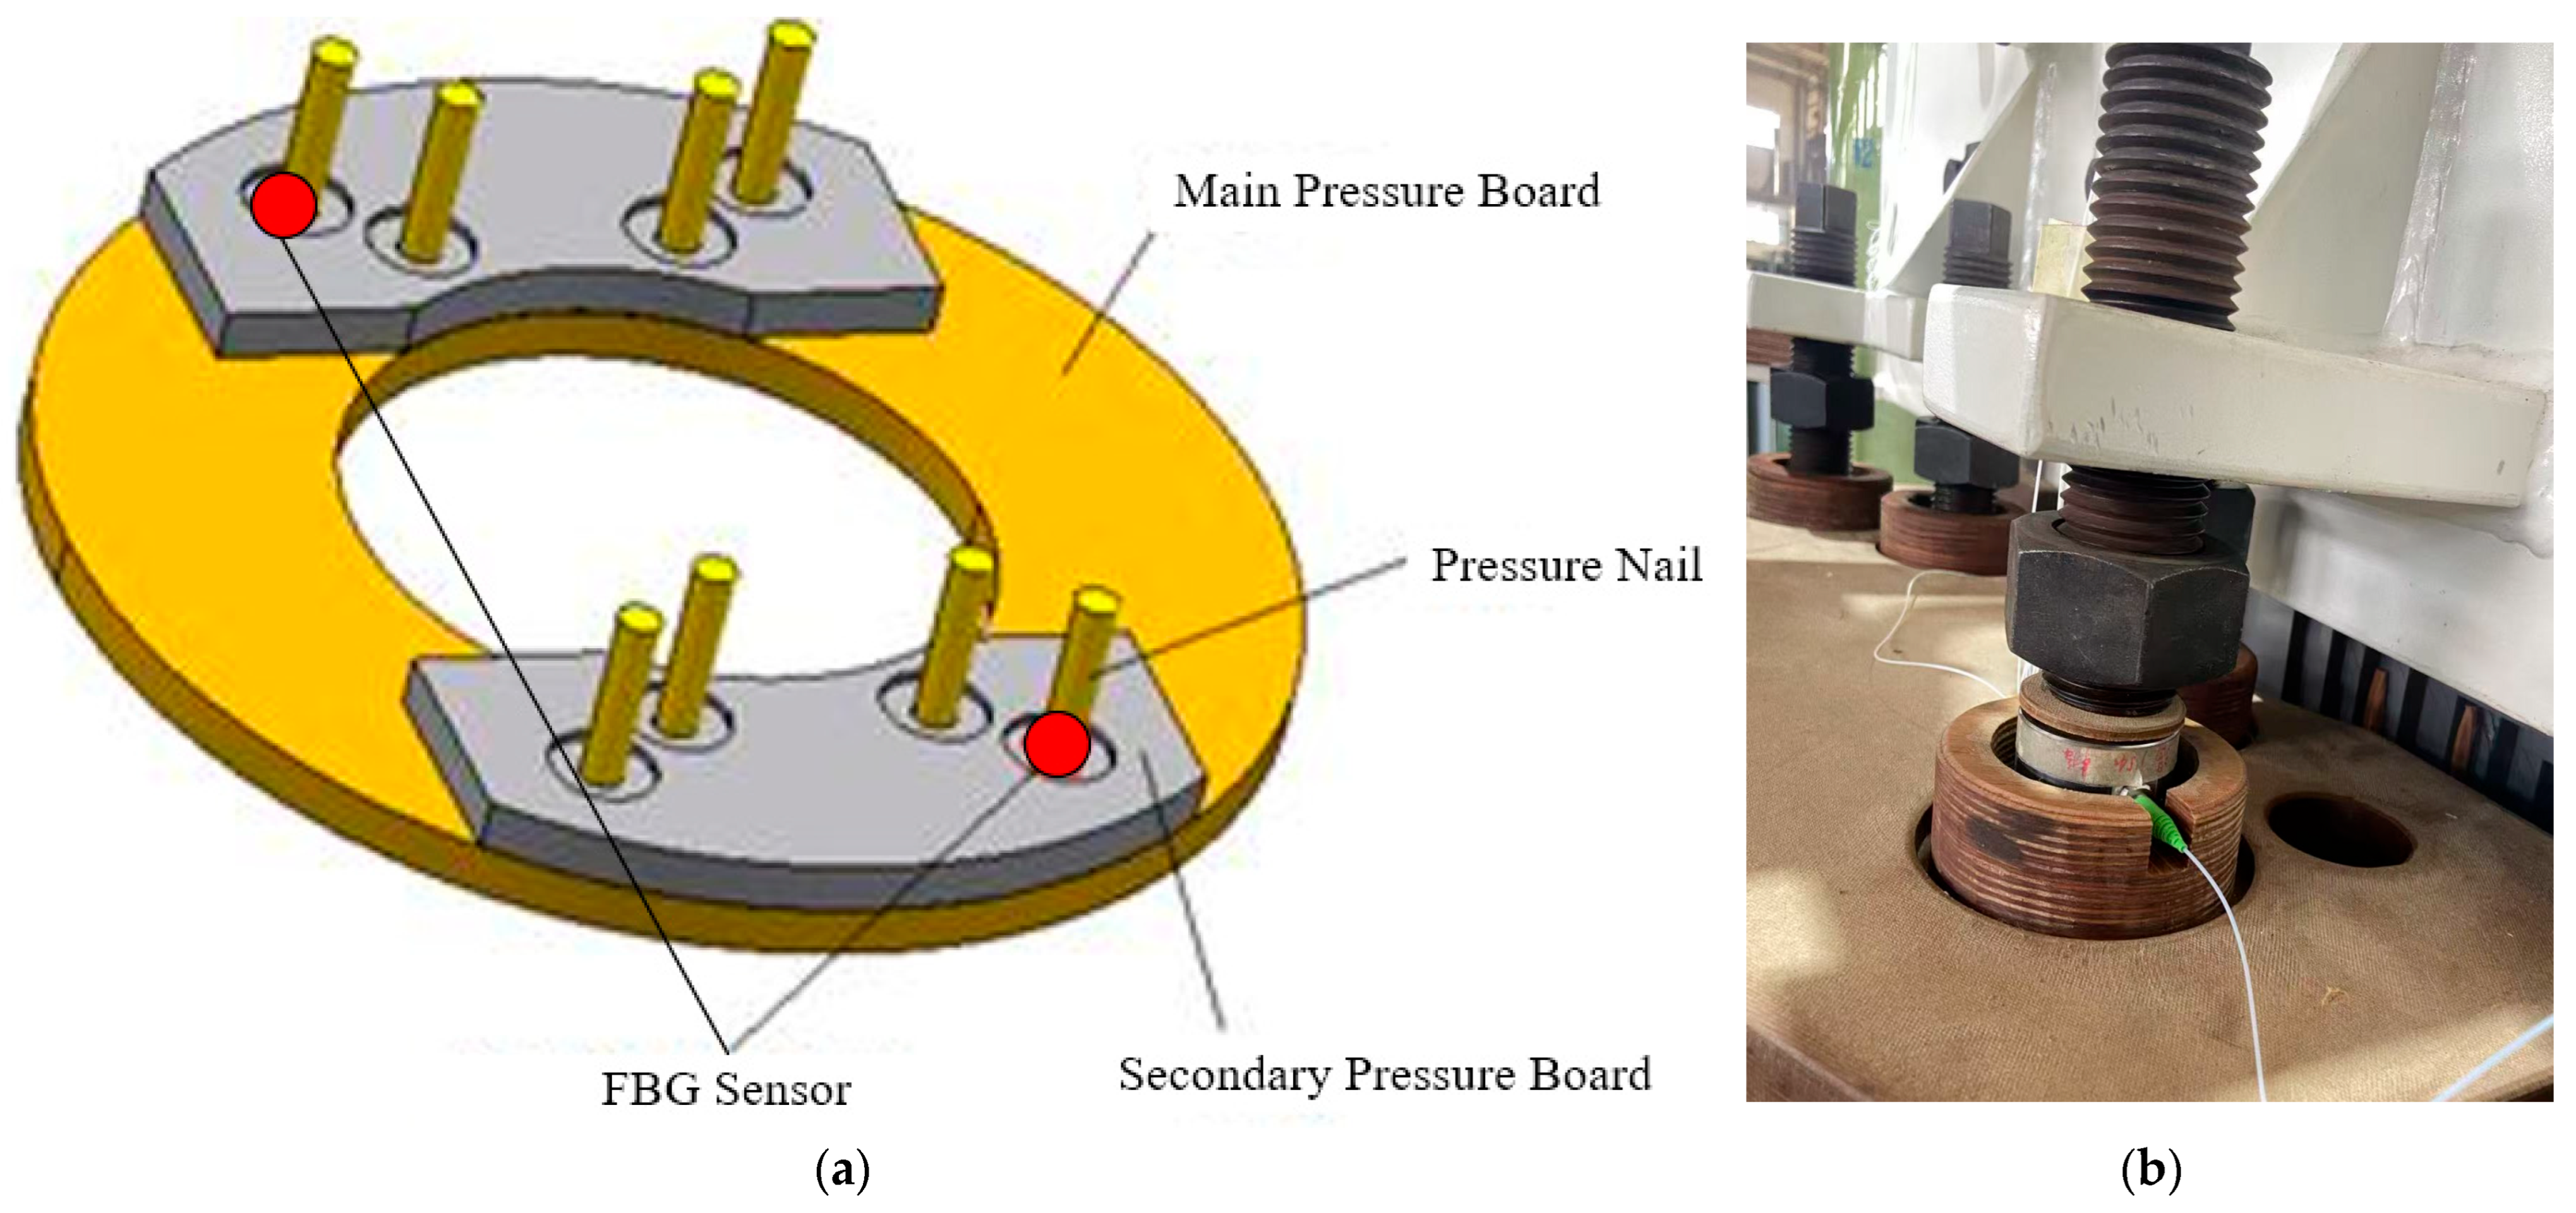
The fourth set of FBG sensors is arranged on the top of the pressure board. The pressure board of the SFZ-40000/110 power transformer studied in this paper features a three-layer structure comprising the main pressure board, secondary pressure board, and pressure nail. These three layers are stacked together to form the entire pressure board system. After careful consideration, the FBG sensors were placed between the pressure nail and the secondary pressure board, as shown in the installation diagram in
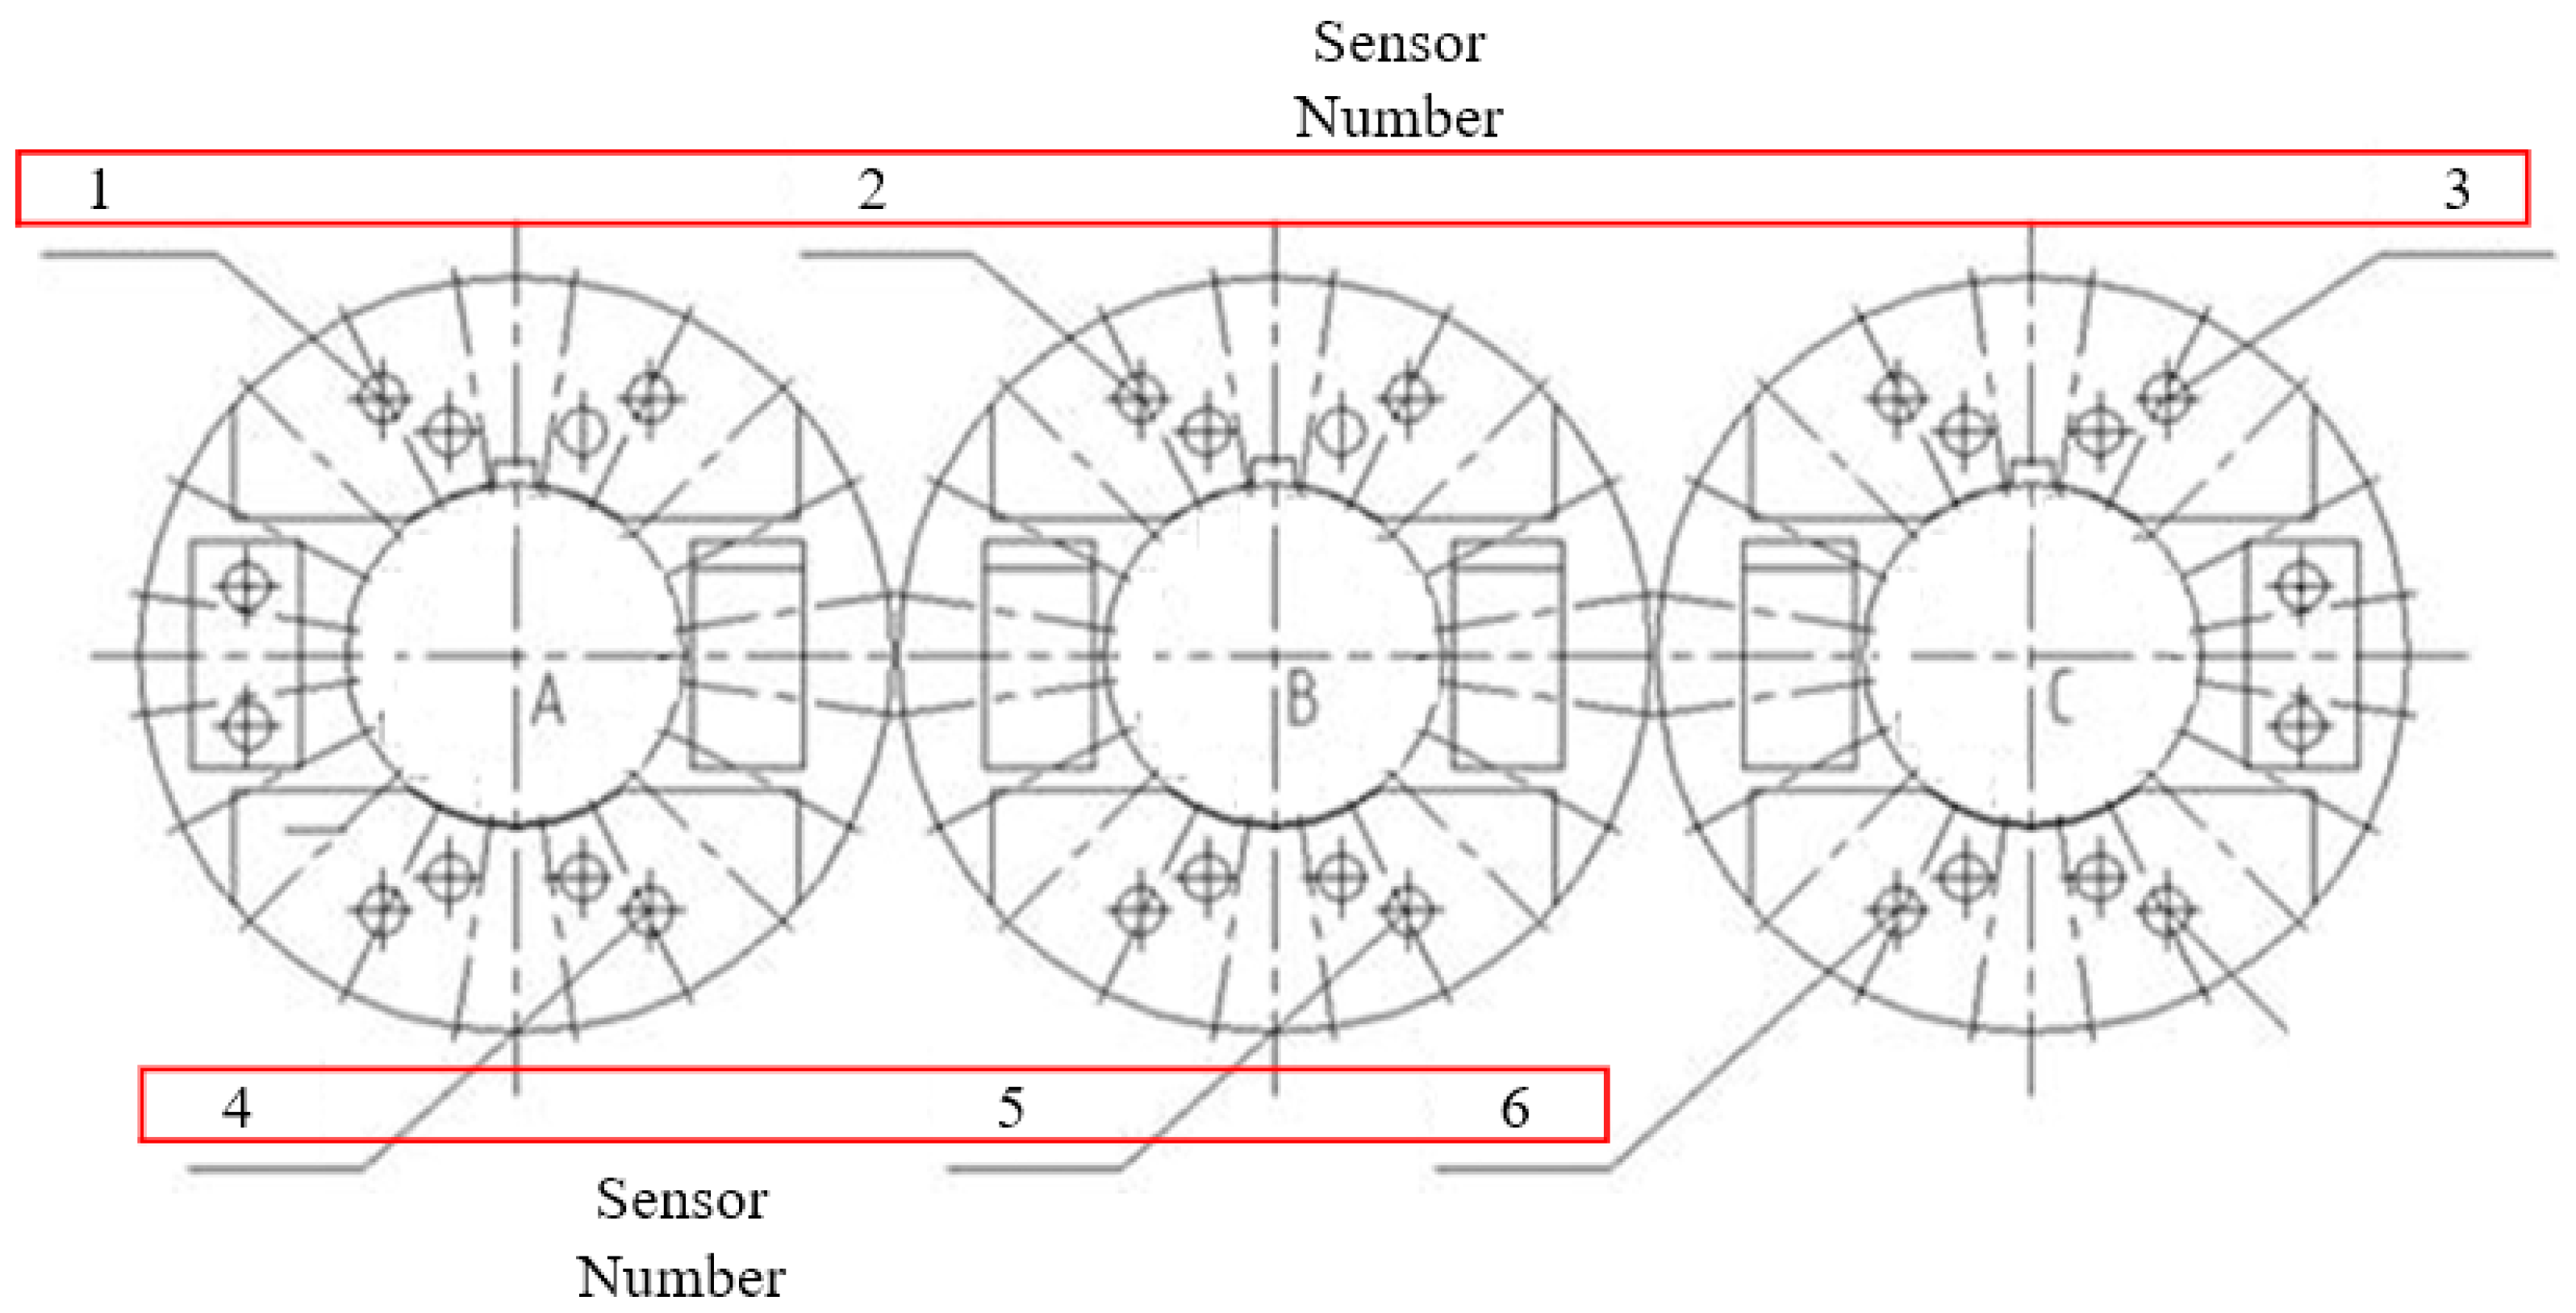
Figure 8. Two sensors per phase were installed on the top of each pressure board, totaling six sensors across all three phases, with the specific distribution illustrated in
Figure 9.
The selection of these four locations as experimental sensing points stems from their strong representativeness. Among them, the sensing point on the winding surface represents the overall deformation trend of the winding. The remaining three sets of sensing points cover the three primary structural components of the winding: the support bars, spacers, and pressure boards. As critical components of the winding’s short-circuit resistance, the stress-strain behavior of these structural components during short-circuit impacts effectively reflects the damage caused by such events. Additionally, when determining the first set of locations, the complexity of placing optical fiber sensors on the inner side of the winding was considered, leading to the selection of the outer surface for placement. For the second set, since the low-voltage winding was the target and its deformation direction was inward, placement was chosen inside the inner support bar. For the third set of sensor locations, considering that the entire winding must be disassembled before slot modification of the spacers—a task significantly more labor-intensive than modifying the support bars—sensors were placed only within the B-phase spacer. For the fourth set of sensor locations, recognizing that the winding is tightly pressed against the lower pressure board due to gravity, sensors were placed on the upper pressure board, which loosens as the winding height changes.
Through the four fiber optic placement schemes described above, this paper achieves FBG sensor coverage across the transformer windings and structural components, with a total of 72 FBG sensors installed. After installing all fibers and confirming proper operation, the SFZ-40000/110 power transformer under study was subjected to short circuit impacts. The wavelength changes at each fiber measurement point were recorded.
When an optical fiber undergoes severe deformation and breaks, it will lose the signal and its wavelength reading instantly drops from approximately 1500 nm to 0 nm. Furthermore, if the fiber becomes loose or detached during deformation, the amplitude of wavelength variation due to the short circuit will be abnormal or even disappears. Therefore, in the experiments described in this subsection, this paper determines whether the fiber has broken or experienced other abnormalities by analyzing the trend in its wavelength changes, thereby identifying the optimal placement scheme.
2.2. Validation Experiment on the Effectiveness of the Online Preload Detecting Method
Based on the experimental results from the previous subsection, this paper identifies optimal fiber optic sensor placement locations and proposes an online preload detecting method in power transformers using FBG technology. To validate the effectiveness of this method’s outputs, a series of short circuit impact tests with progressively increasing current levels were designed. During these tests, the accuracy of the finite element simulation model was first verified using magnetic flux leakage sensor readings. Subsequently, by comparing the online detecting method with simulation model results, the amplitude accuracy of the online detecting method was demonstrated. Finally, the power transformer was subjected to a cover removal procedure. The deformation distribution of the windings further demonstrated the effectiveness and significance of this method.
It should be noted that while this paper validates the effectiveness of the online detecting method using finite element simulation data, this does not imply that finite element simulation can replace this online detecting method. For power transformers with known internal structures and material parameters, finite element simulation combined with short circuit recording data can indeed directly calculate their preload decay curves. However, in engineering practice, the internal structures of most transformers are inconsistent, and material parameters vary with type and aging condition. Therefore, while the finite element method is applicable for preload calculations, it has limitations under specific conditions.
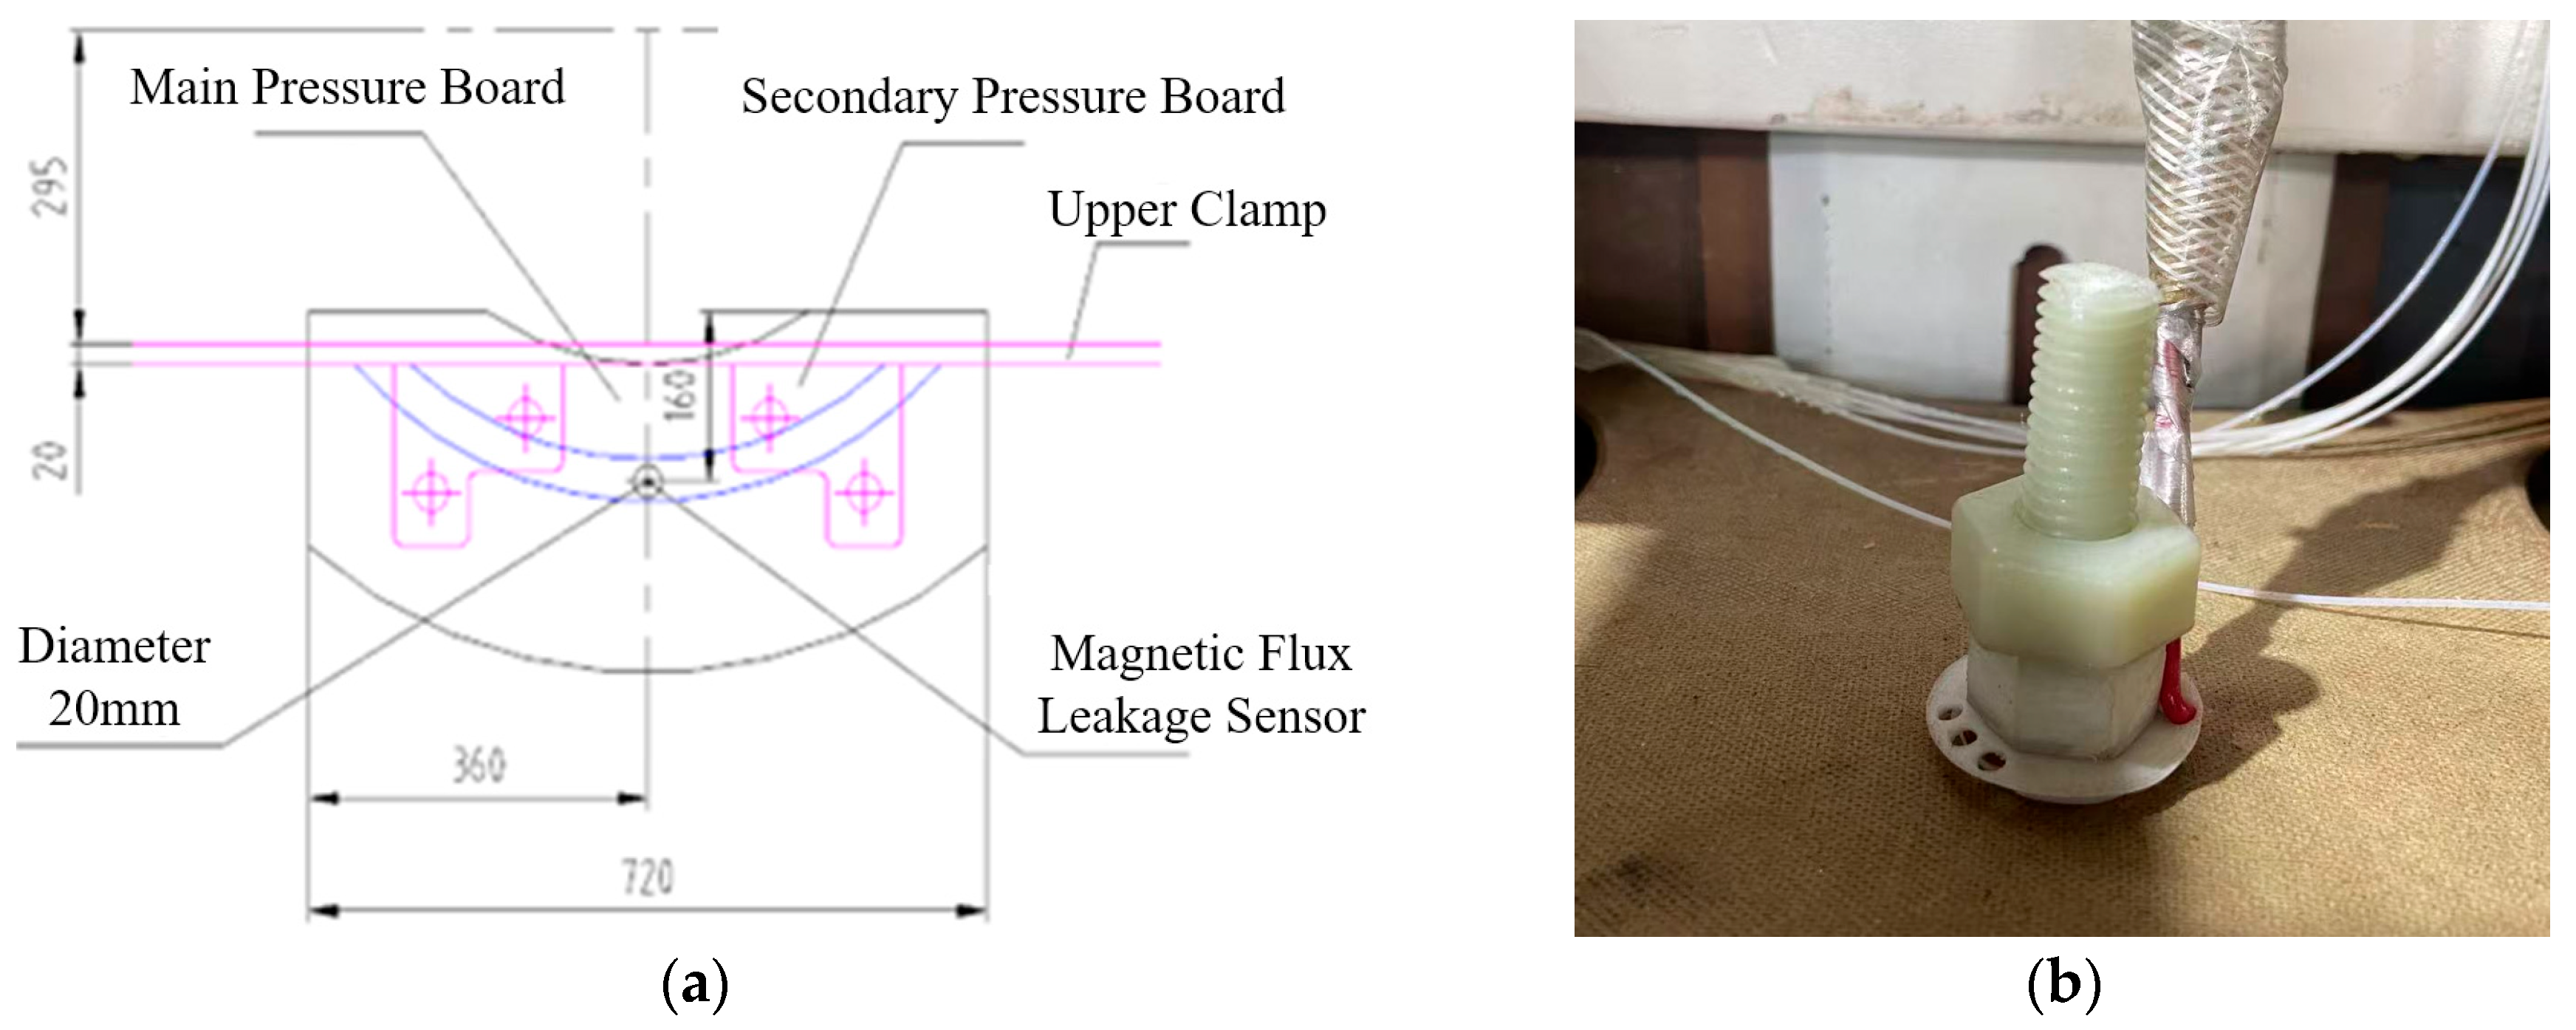
The physical diagram of the magnetic flux leakage sensor installation used to demonstrate the effectiveness of the online detecting method is shown in
Figure 10. During installation, a 20 mm diameter hole was drilled at the intersection of the main pressure board diameter and the main air gap. And then, the magnetic flux leakage sensor was embedded into this hole, then secure it using washers and bolts. When a short circuit occurs, the magnetic flux leakage field is converted into a measurable electrical signal within the sensor’s coil and transmitted via wires to the recorder. After the test concludes, analyzing the recorded electrical signals yields the magnitude of magnetic flux leakage field in the main air gap at each short circuit moment.
3. Experimental Results and Analysis of Short Circuit Impact Resistance Comparison for Fiber Optic Sensors
This paper installed four sets of fiber optic sensor measurement points inside an SFZ-40000/110 power transformer, positioned respectively on the winding surface, inside the support bars, inside the spacers, and on the top of the pressure board. To evaluate the short circuit impact resistance of fiber optic sensors at different locations under short circuit conditions, this study sequentially applied three-phase short circuit current to the three-phase windings. Specifically, the A-phase winding received 18 impacts, the C-phase winding received 12 impacts, and the B-phase winding received 12 impacts, following the application sequence A-C-B.
During a three-phase short circuit in the power transformer studied in this paper, the peak magnitude of the short circuit current flowing through the low-voltage winding reached 30,262 A. Considering that directly subjecting the transformer to a short circuit current of this magnitude could cause direct winding damage, the short circuit current was applied incrementally from low to high for each phase winding during the experiment. The short-circuit currents applied to the three phases are shown in the
Table 3 below.
It should be noted that temperature effects were not considered in either section of the experiments. Although 42 short-circuit events were performed in the first section of the experiments, in actual operation, the experiment was paused for over two hours after every 3 to 5 short-circuit impacts. While short circuits cause localized temperature rises, the temperature increase resulting from short circuits lasting less than 1 s is negligible and was therefore disregarded.
Besides, this paper employs different numbers of sensors at the four placement locations due to differing installation difficulties across positions. While the quasi-distributed method allows extensive sensor placement on the winding surface, the other three methods prove challenging to implement. Furthermore, slot modifications within the spacers necessitate winding disassembly, which is labor-intensive. Consequently, only the B-phase winding was modified. Although the four placement schemes feature varying sensor counts, representative sensors were selected for final data comparison. Thus, there is no inherent advantage in survivability or sensitivity for the scheme with more sensors.
3.1. Detection Principle of FBG Fiber Optic Sensors
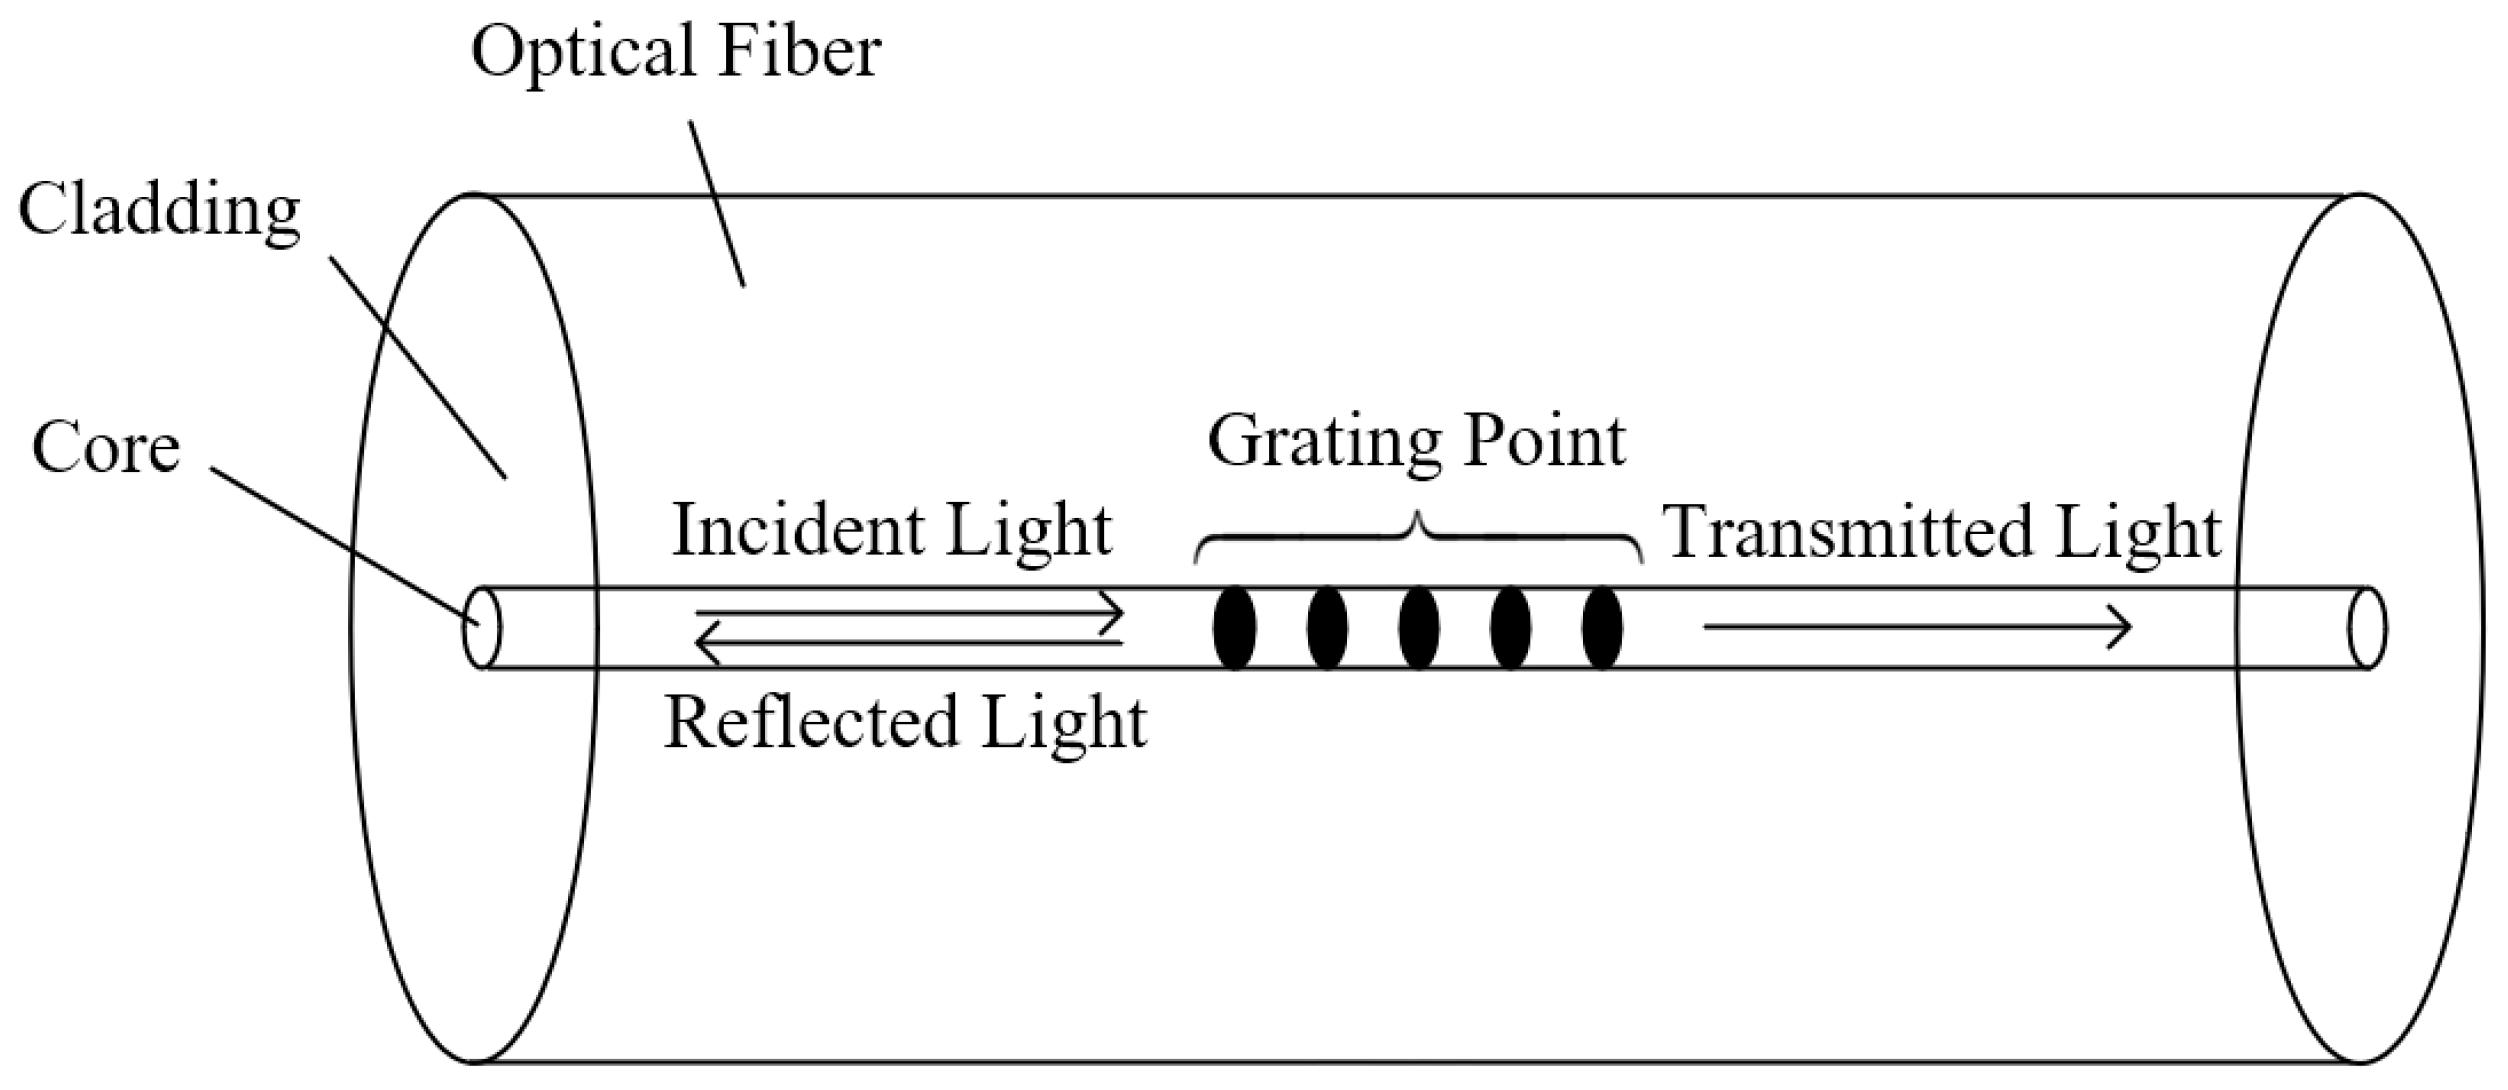
Fiber Bragg Grating (FBG) is one type among numerous fiber gratings, with its specific structure illustrated in the
Figure 11 below. The fiber core serves as the primary channel for optical signal transmission, composed of high-refractive-index material to ensure efficient propagation of light within it. The grating point is embedded within the core. Through precision techniques such as laser exposure, a series of parallel, equidistant refractive index-modulated microstructures are fabricated on the core surface. The cladding possesses a lower refractive index than the core. It serves to confine light within the core for total internal reflection propagation, minimizing energy loss while providing physical protection against external damage to the core.
When incident light from an external broadband source enters the grating through the fiber core, light satisfying the Bragg condition undergoes reflection while the remainder transmits. The center wavelength of the reflected light can be regarded as the center wavelength of the FBG, expressed as:
where
λ is the center wavelength of the FBG,
neff is the effective refractive index of the FBG, and Λ is the grating period.
Differentiating Equation (1) yields the relationship between the FBG center wavelength
λ and the grating period Λ and effective refractive index
neff.
where Δ
λ is the center wavelength variation of the FBG, Δ
neff is the effective refractive index variation of the FBG, and ΔΛ is the grating period variation.
It can thus be concluded that by quantifying the variation of the FBG center wavelength, combined with the design and application of specific packaging structures, it is possible to effectively sense and detect various physical parameters in the external environment, such as stress, strain, temperature, and flow velocity.
The FBG sensor used in this paper is the YOSC-FsFBG-15XX model manufactured by China Yangtze Optical Fibre and Cable Joint Stock Limited Company in Wuhan, China. Its specific parameters are listed in the
Table 4 below.
About the signal condition of optical fiber wavelength, this paper utilizes the YOSC data analysis system provided by Yangtze Optical Fibre and Cable Joint Stock Limited Company. It should be noted that the mathematical model used within this data analysis system to convert optical fiber wavelength into specific stress is proprietary information of the company and therefore cannot be disclosed in this paper.
3.2. Experimental Results and Analysis of Fiber Optic Sensors on Winding Surfaces
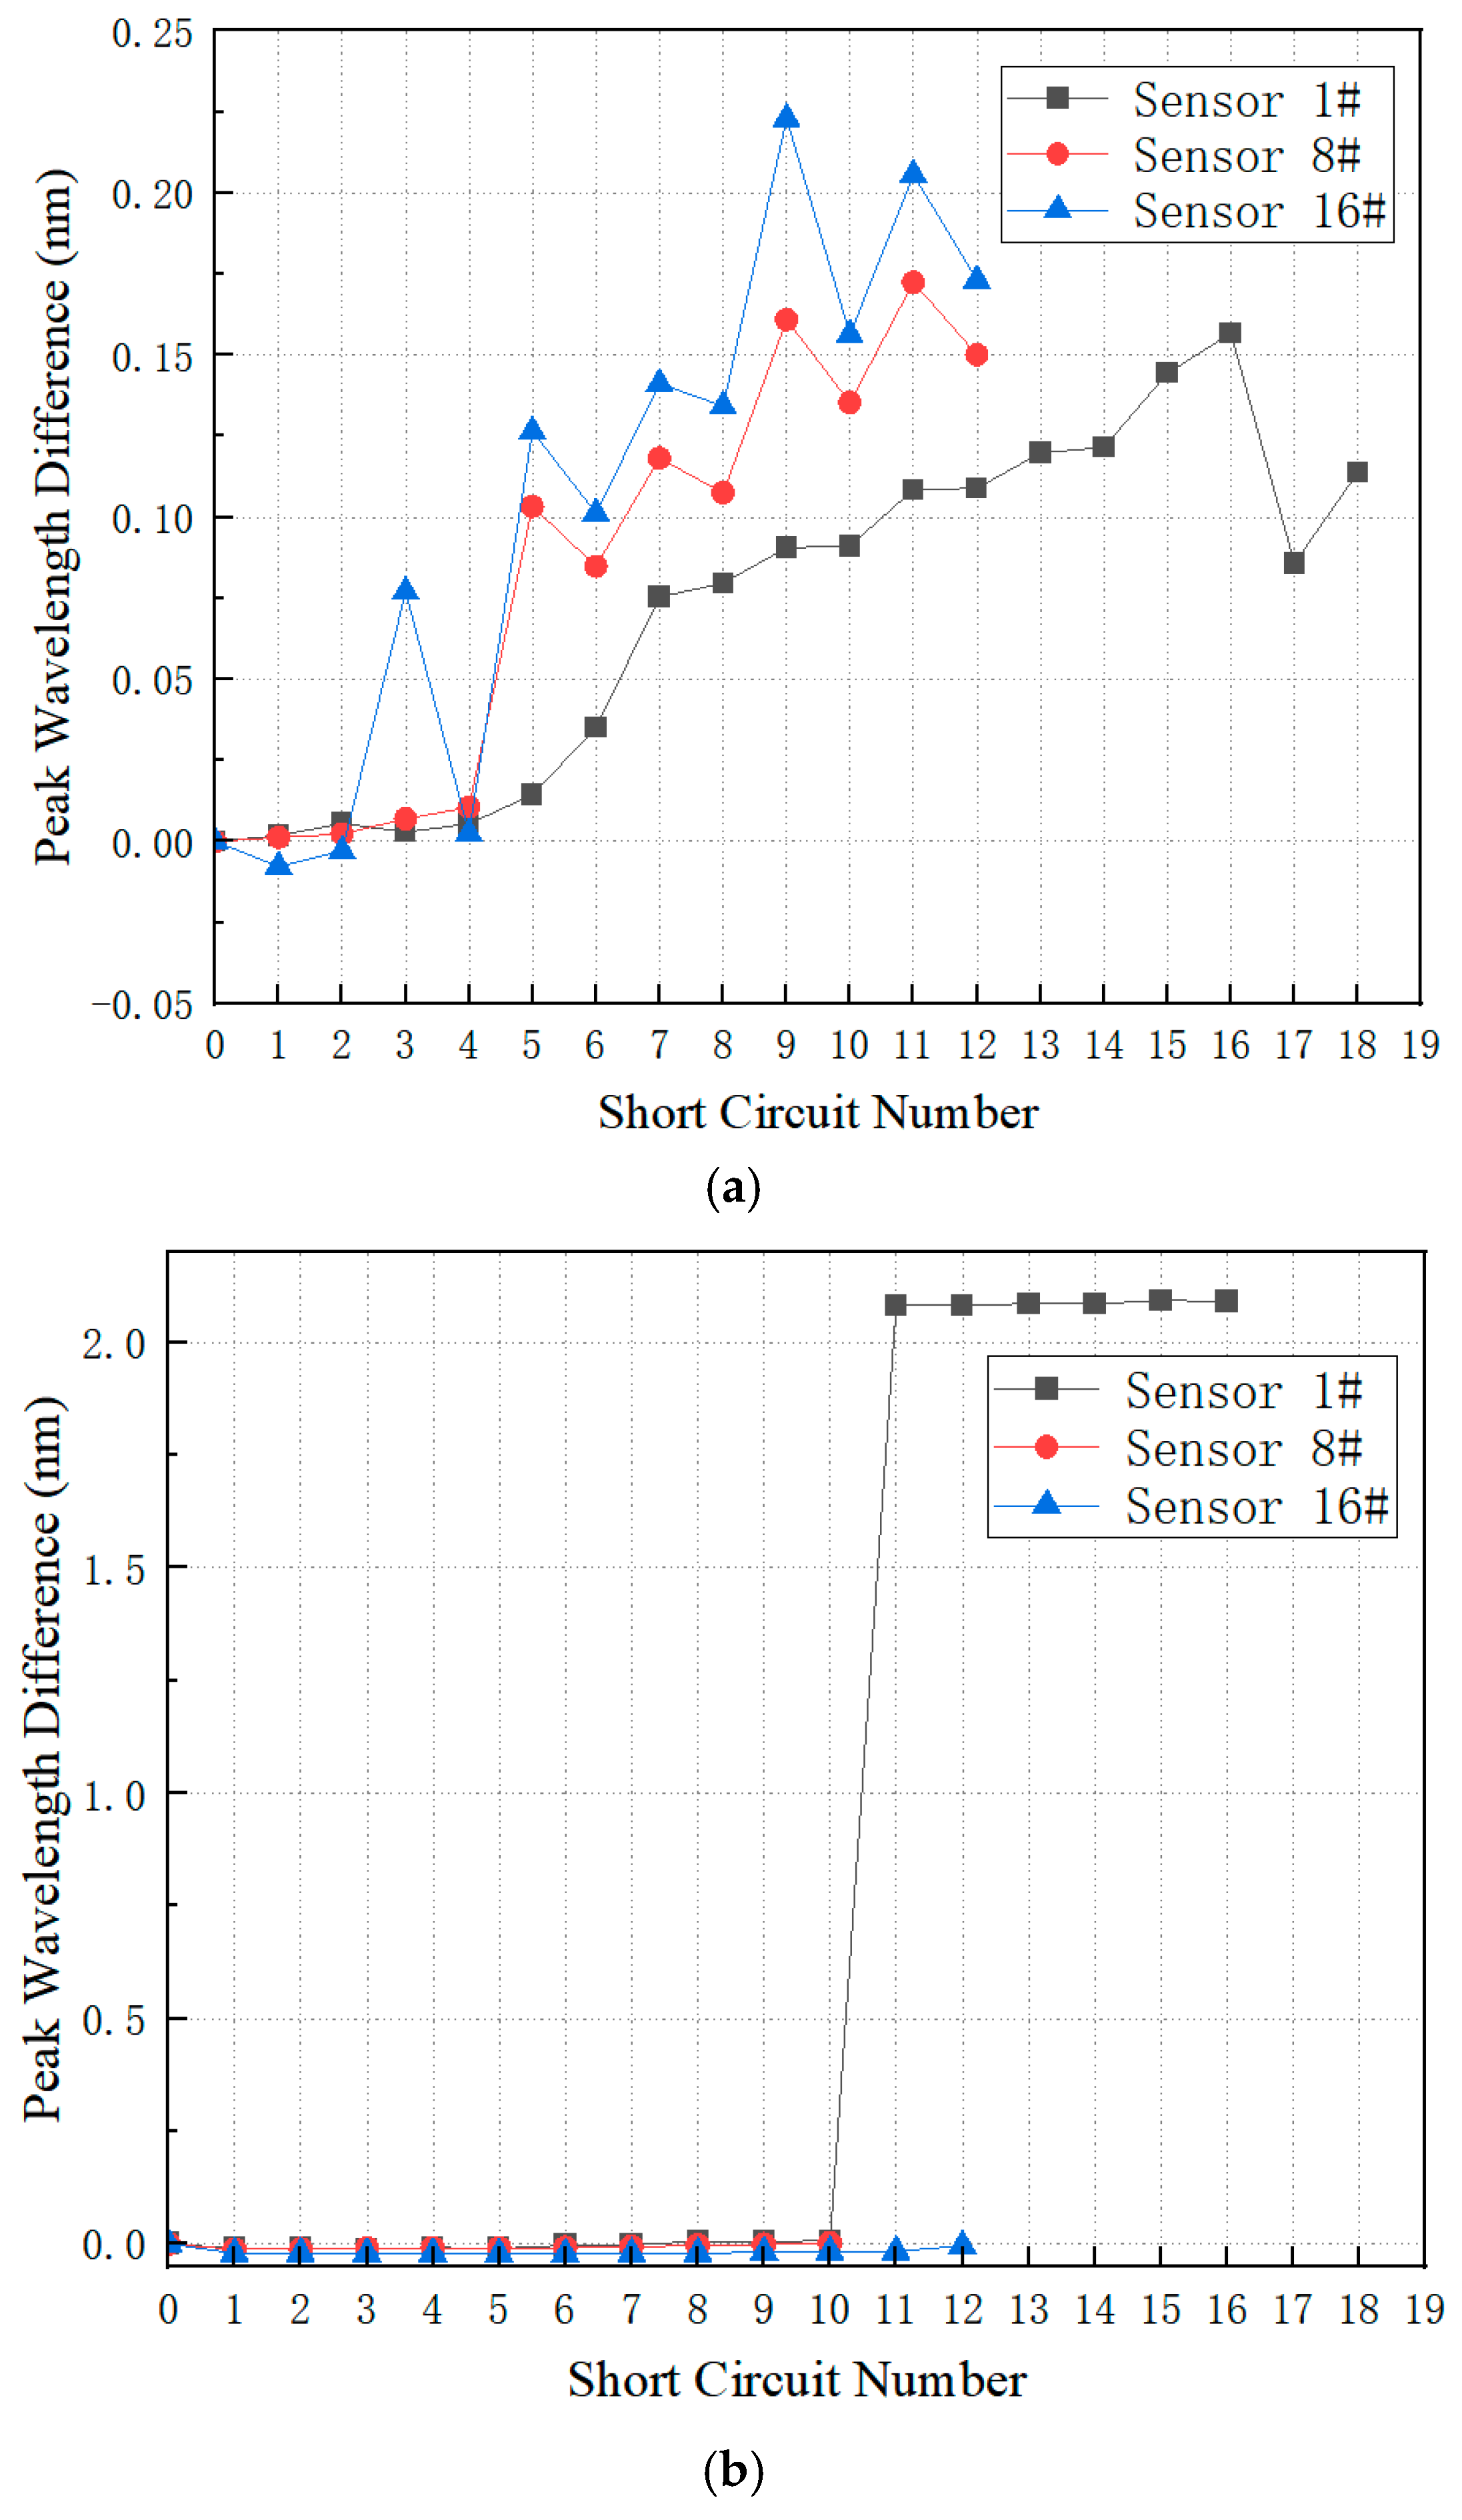
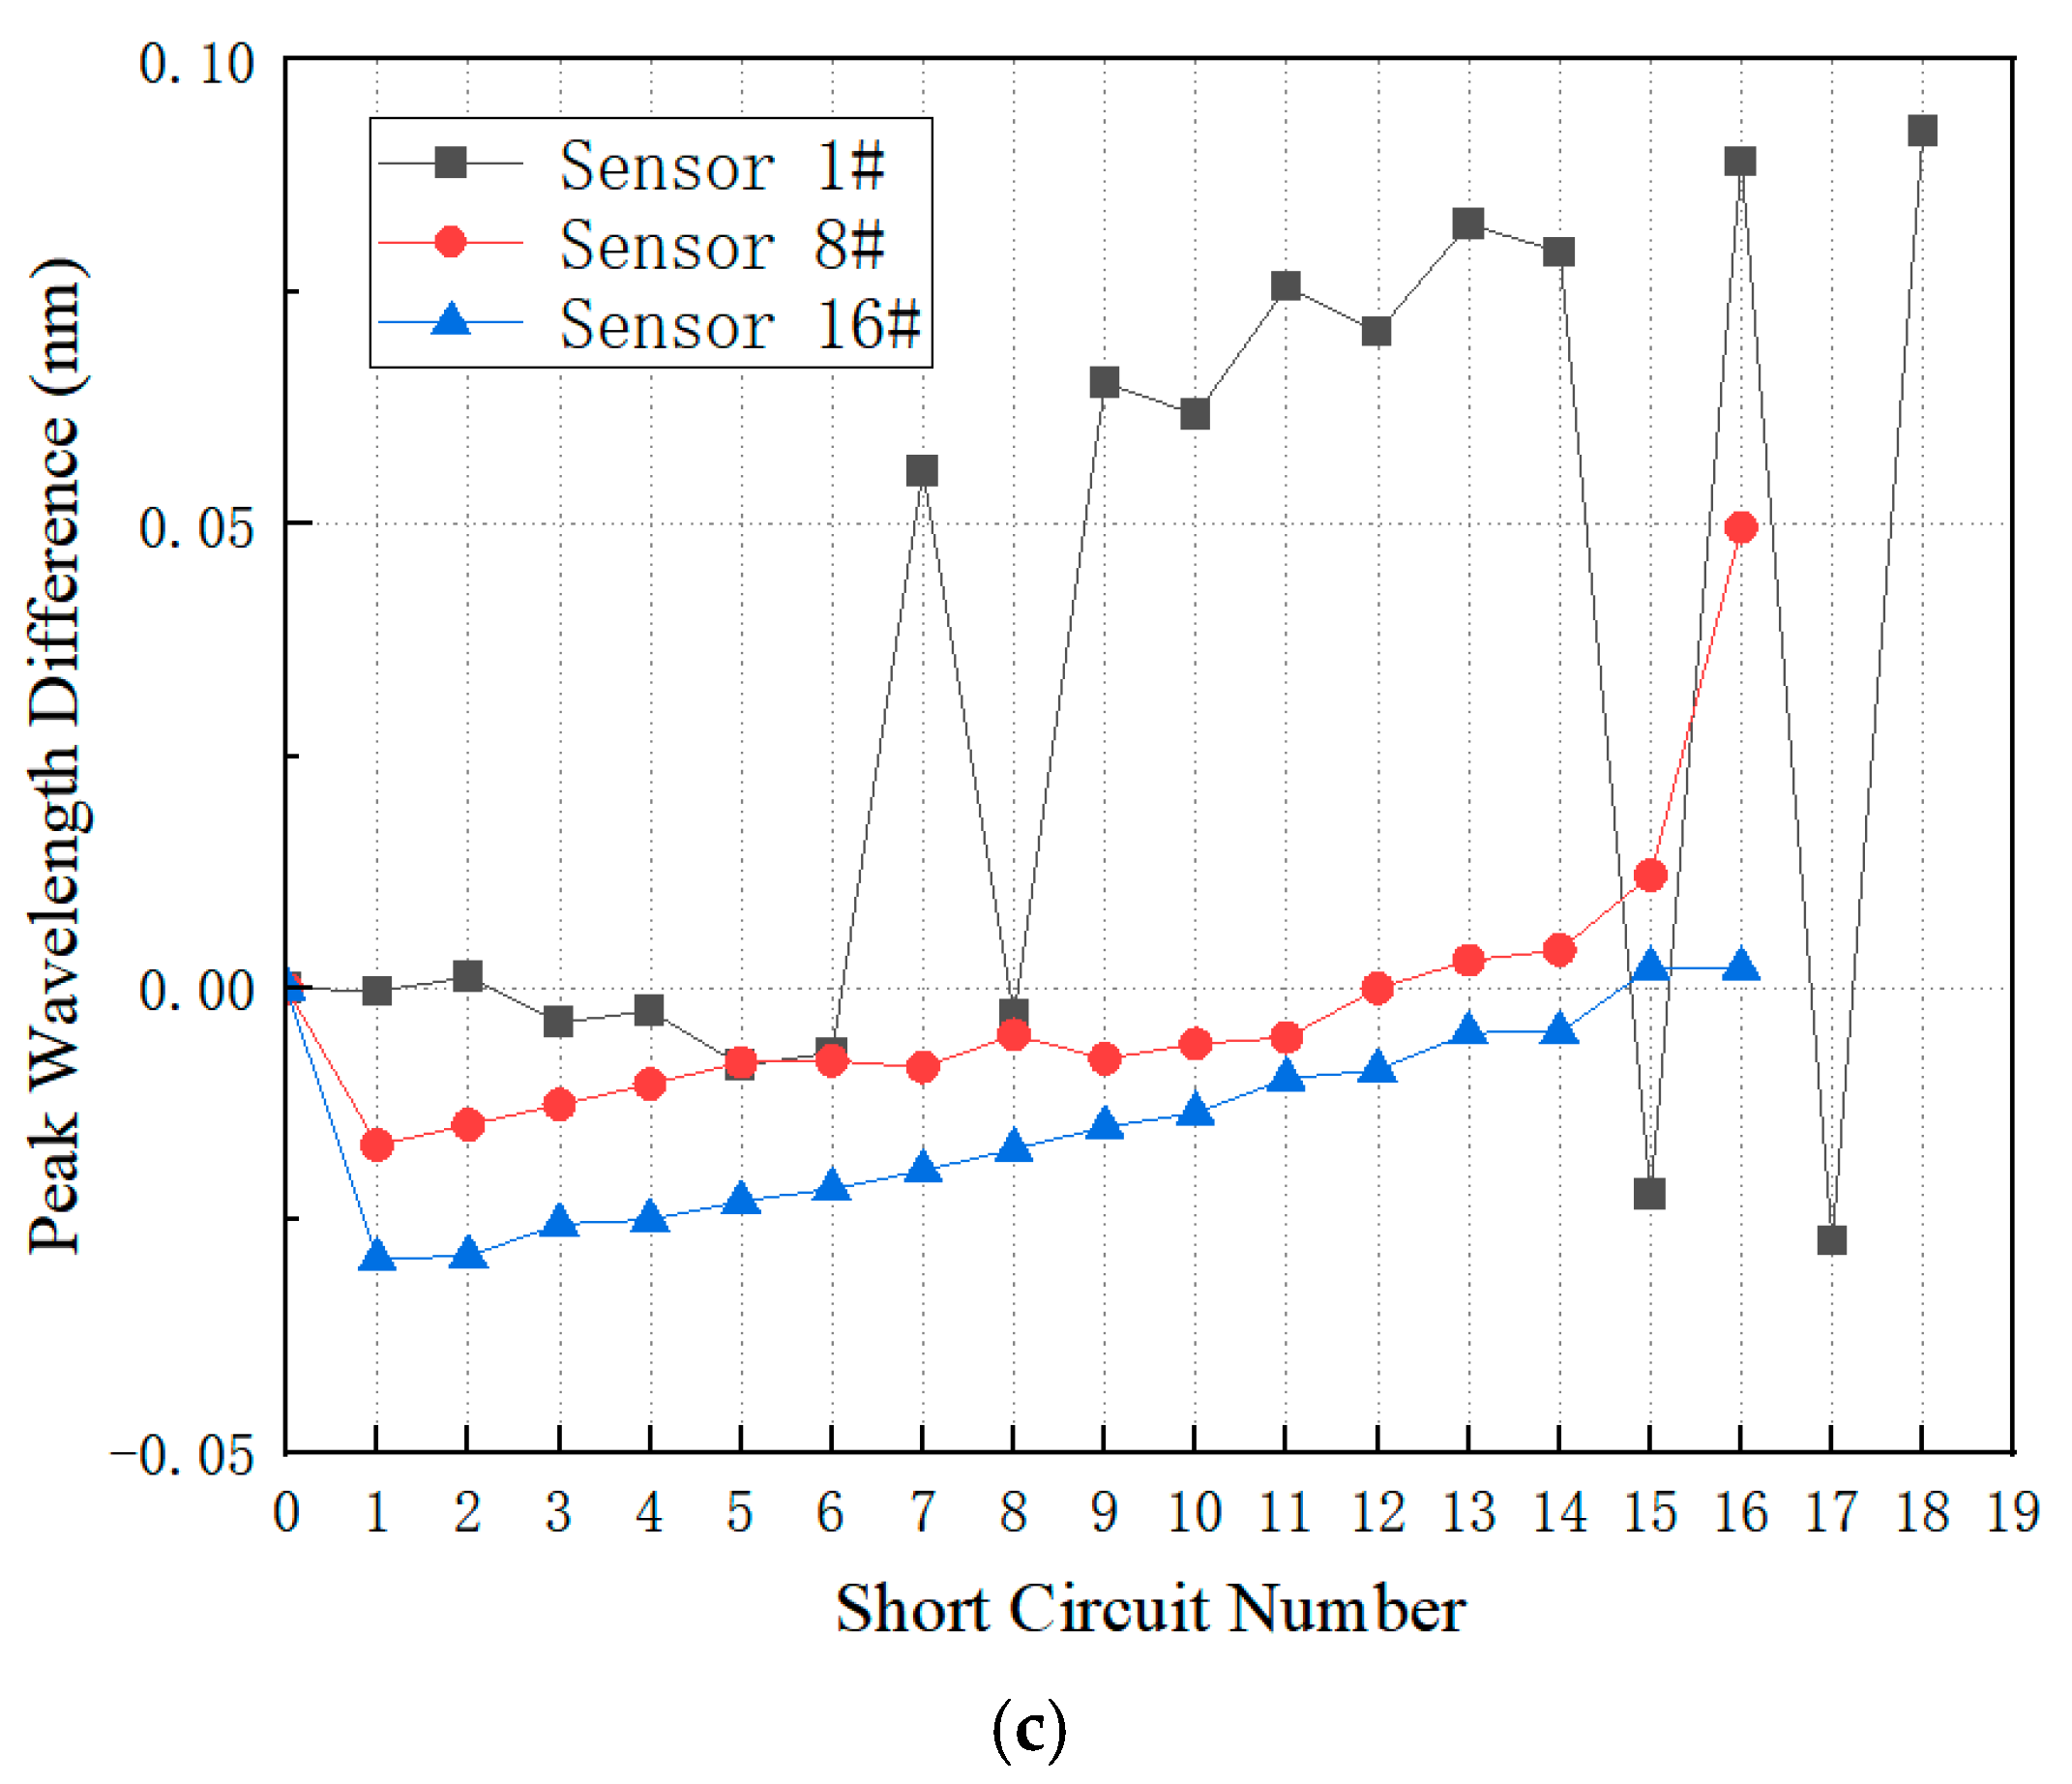
The first set of fiber optic sensors was arranged on the surface of the winding. Representative measurement points Sensor 1#, Sensor 8#, and Sensor 16# were selected for analysis. Considering the small amplitude of optical fiber wavelength λ variation, the measurement results of the optical fiber sensor are reflected by the change Δλ. The peak wavelength variation Δλ during the first 18 short circuit events was recorded, with the three-phase results shown in
Figure 12. As depicted in
Figure 12a, Sensor 1# at the top of the winding maintained stable measurements during the first 16 short circuit impacts but the value suddenly dropped from the 17th impact. Sensor 8#, positioned in the middle of the winding, and Sensor 16#, located at the bottom of the winding, both exhibited repeated data anomaly at the measurement points during the first 12 short circuit impacts, and their optical fibers lost signal during the 13th short circuit impact. As shown in
Figure 12b, Sensor 1# installed on the B-phase winding exhibited a sudden change in measurement values after the 10th short circuit impact, forming a new steady state. After monitoring this steady state for a period, the optical fiber lost signal during the 16th short circuit impact. Sensors 8# and 16# recorded normal readings during the first 9 short circuits. The former experienced fiber signal loss during the 10th short circuit, while the latter failed during the 12th. As shown in
Figure 12c, Phase C Sensor 1# exhibited abnormal measurement data from the outset. It can thus be seen that Sensors 8# and 16# experienced fiber breakage after the 16th short circuit impact.
The experimental results indicate that among the optical fiber sensors installed on the winding surface, those positioned at the top of the winding demonstrate significantly higher resistance to short circuit impacts. This is primarily because the SFZ-40000/110 power transformer winding is located relatively high within the overall oil tank, resulting in the winding top itself experiencing lower short circuit impacts compared to the middle and bottom sections. It is also observed that after multiple short circuits, the top sensors exhibit noticeable measurement shifts even without fiber breakage. This occurs because repeated short circuits reduce the preload, gradually causing the upper pressure board to fail. Without the constraint of the upper pressure board, the top of the winding begins to freely vibrate, significantly increasing deformation. This loosens the sensor measurement points, leading to abnormal readings. Overall, fiber optic placement on the surface of windings is prone to damage and is generally unsuitable for installing FBG sensors.
3.3. Experimental Results and Analysis of Fiber Optic Sensors Inside the Support Bars
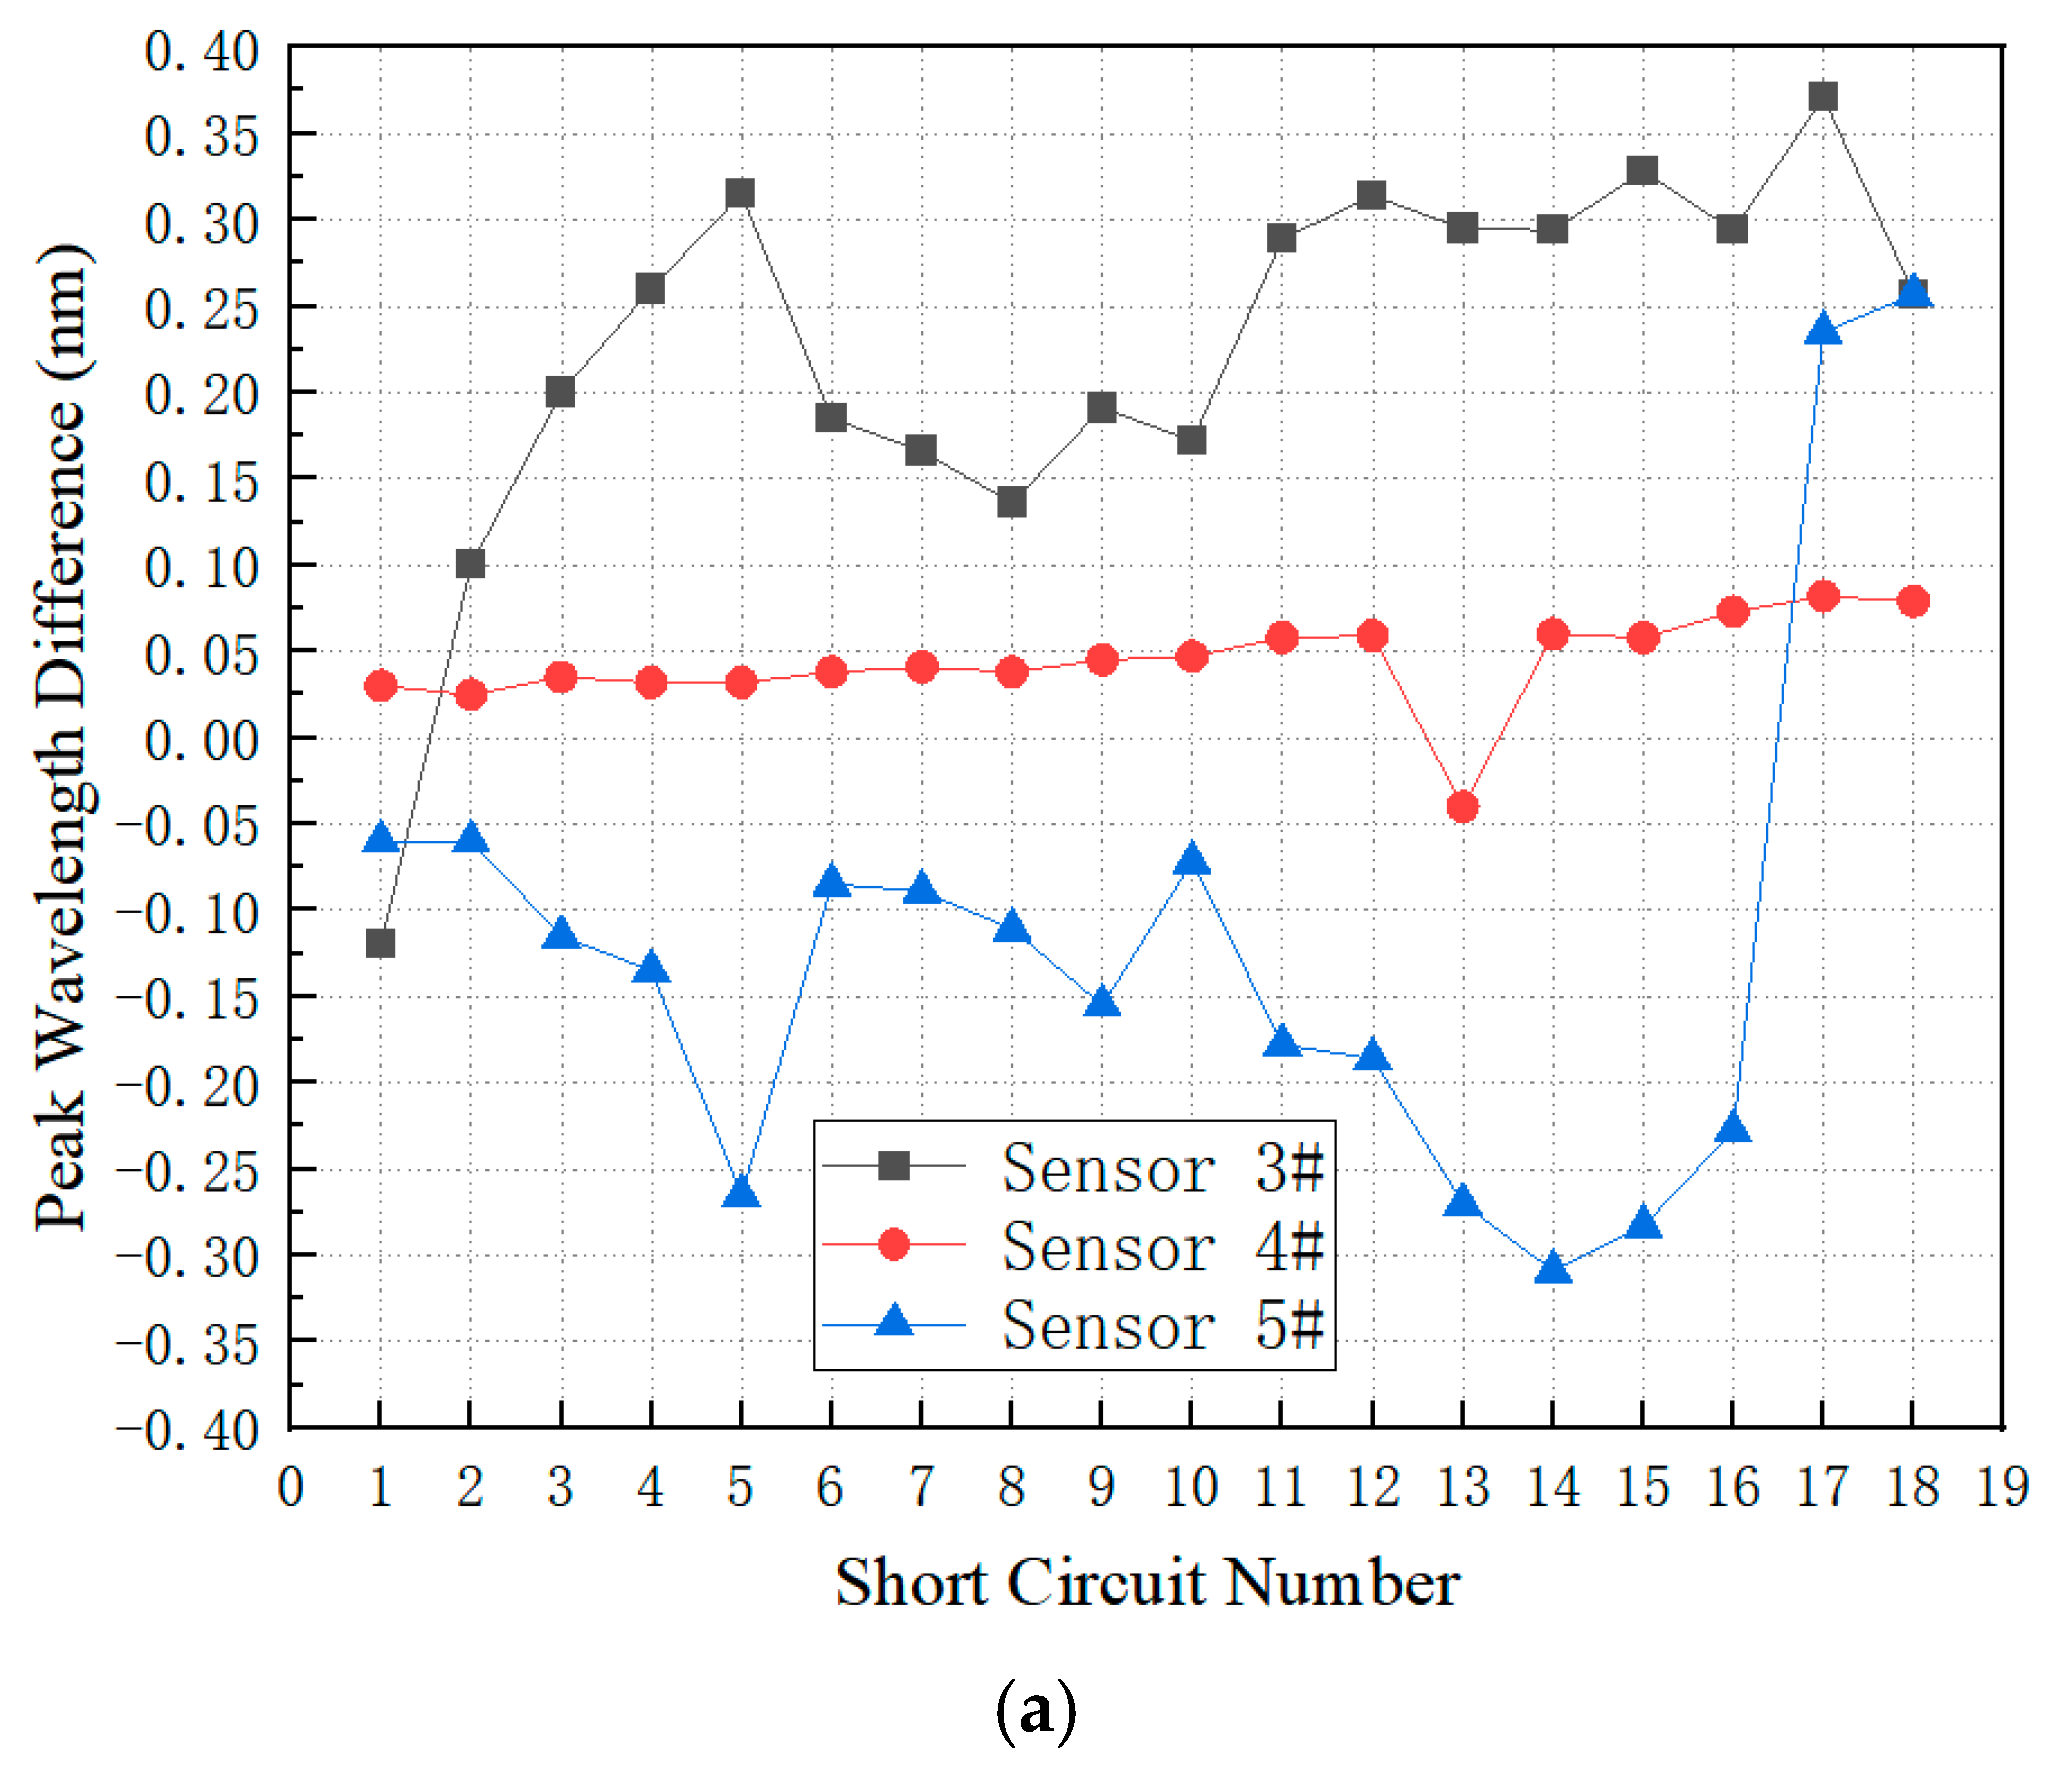
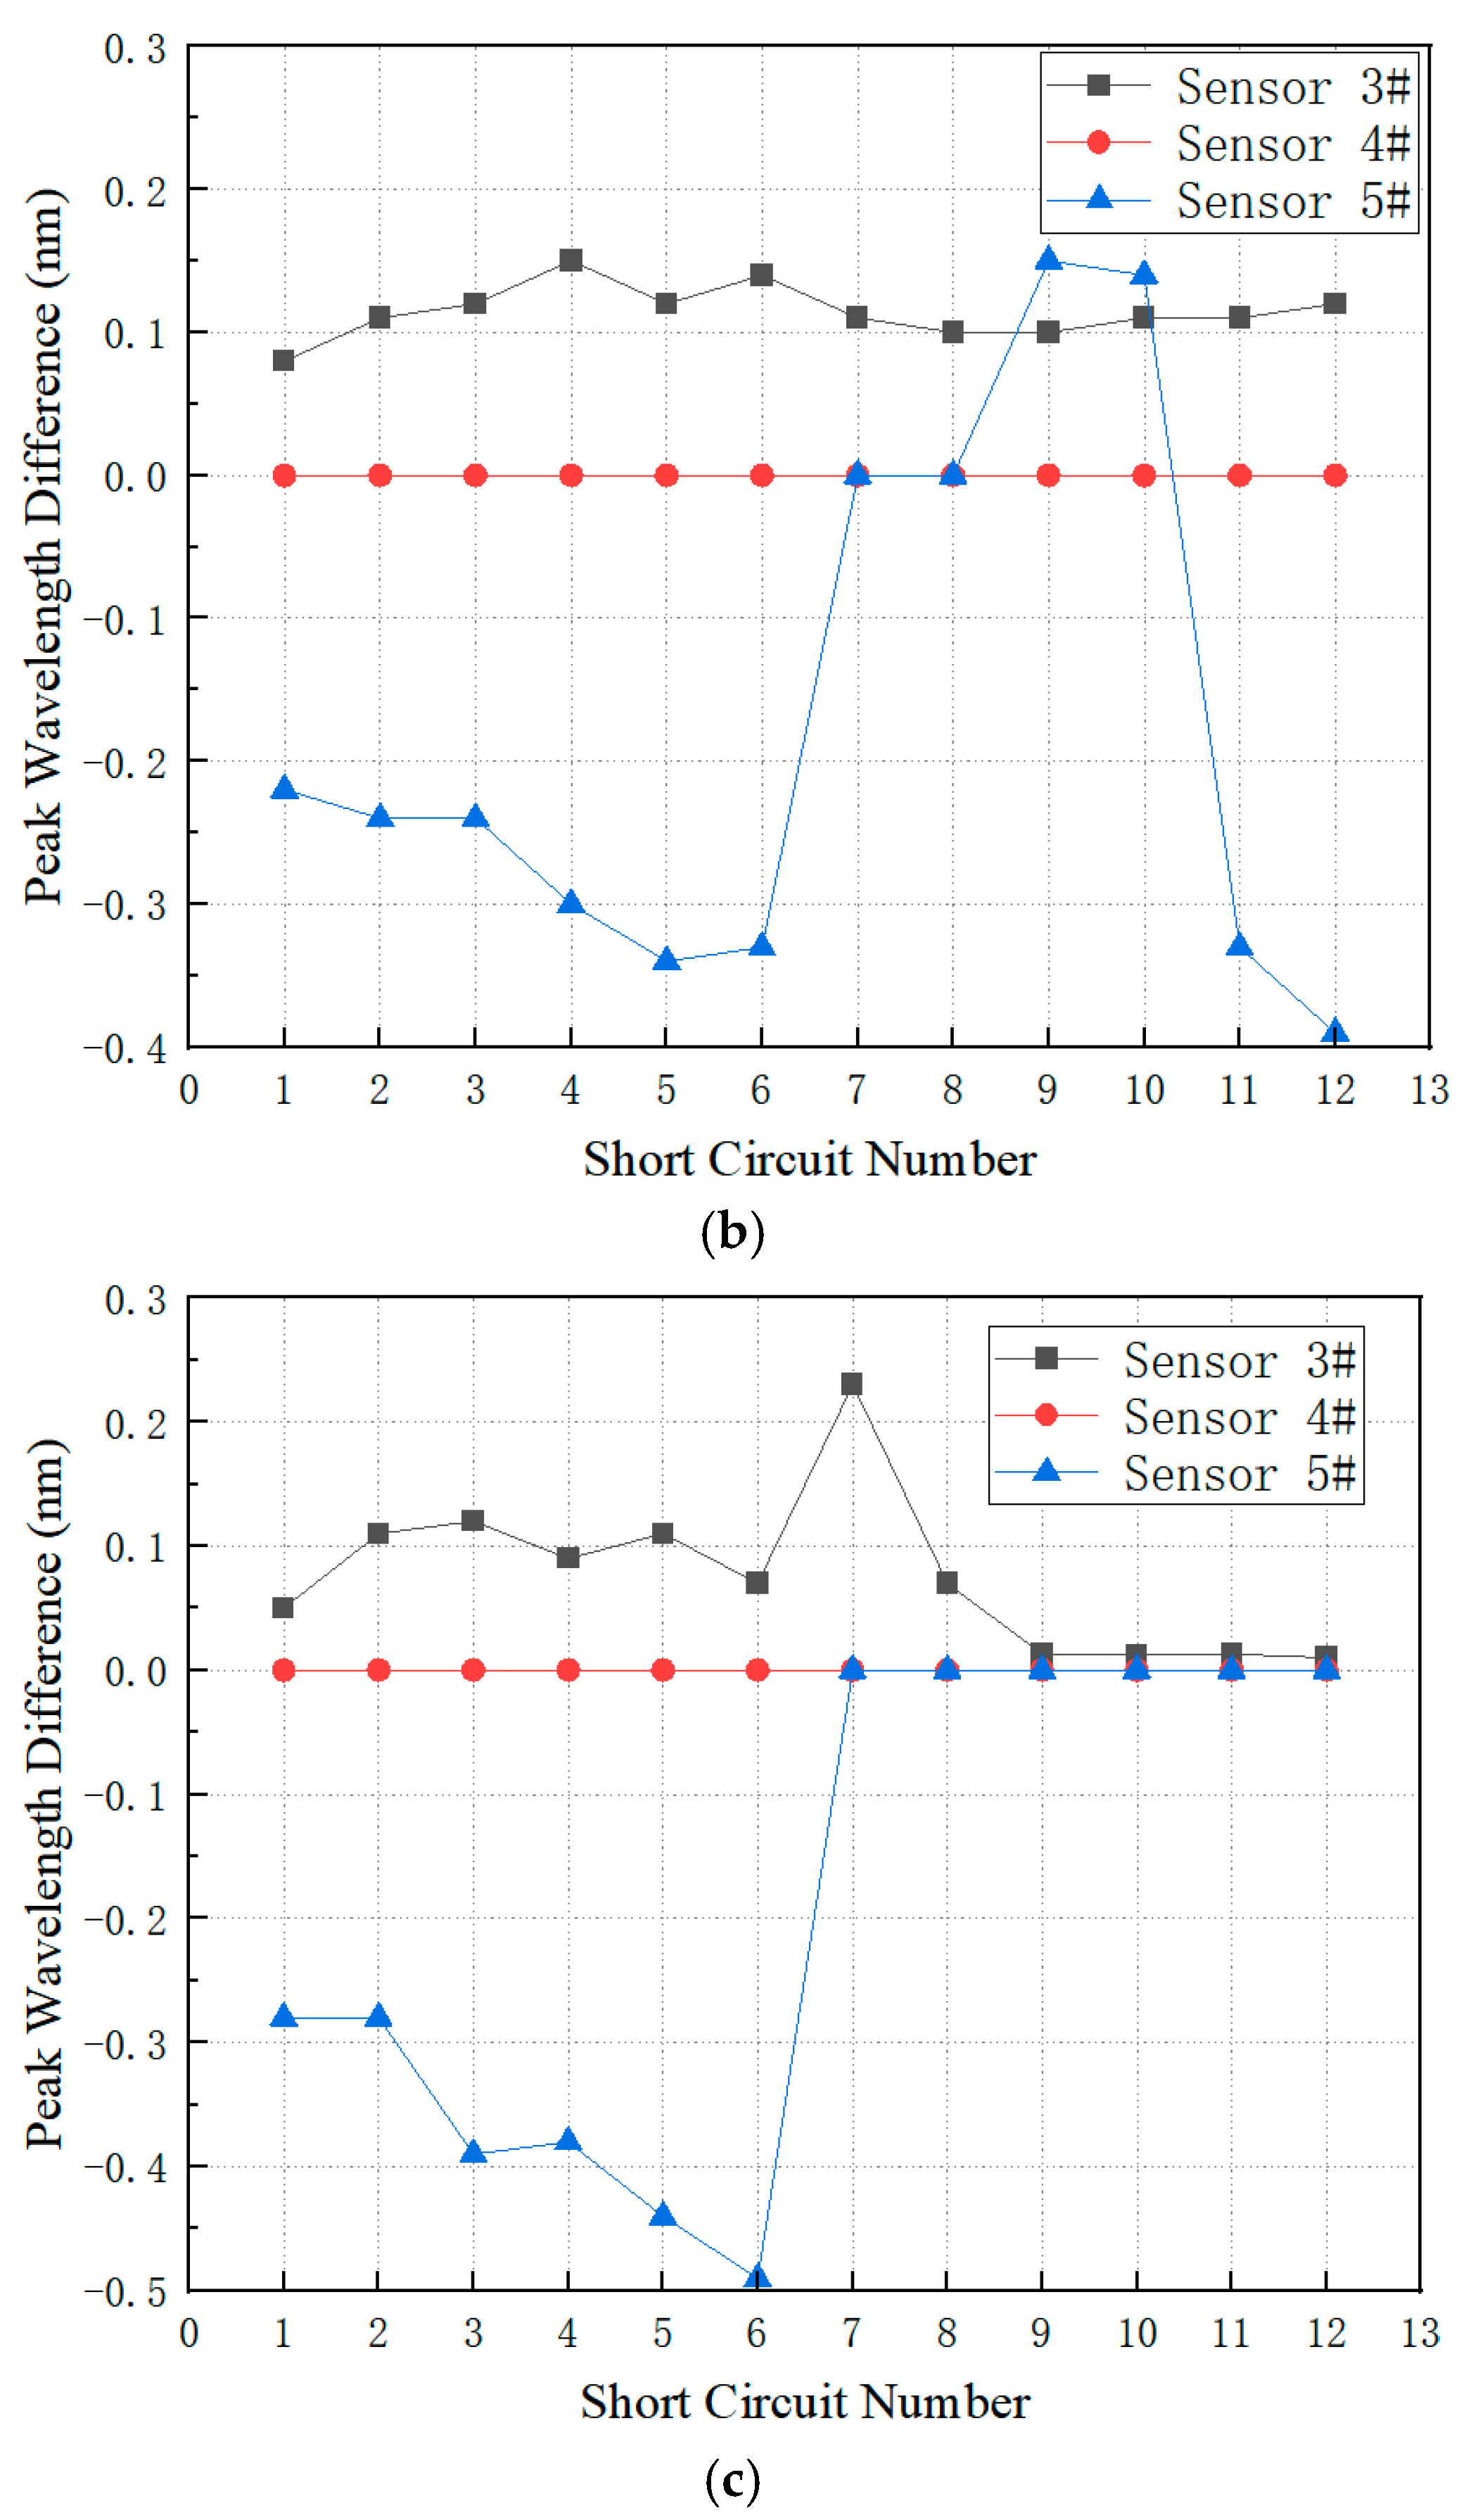
The second set of fiber optic sensors was installed inside the support bars. Sensors #3, #4, and #5 were selected for representative analysis. Sensor #3 is located at the top of each phase support bar, Sensor #4 at the middle, and Sensor #5 at the bottom. Measurement results from the three sensor groups are shown in
Figure 13:
Figure 13a displays readings from the A-phase sensor during an A-phase three-phase short circuit,
Figure 13b shows readings from the C-phase sensor during a C-phase three-phase short circuit, and
Figure 13c presents readings from the B-phase sensor during a B-phase three-phase short circuit. During a single-phase short circuit, the other two phases also experience short circuit impacts. Consequently, the Phase C sensor had already endured 16 minor short circuit impacts before the Phase C three-phase short circuit occurred, while the Phase B sensor had endured 28 minor short circuit impacts before the Phase B three-phase short circuit occurred.
As shown in
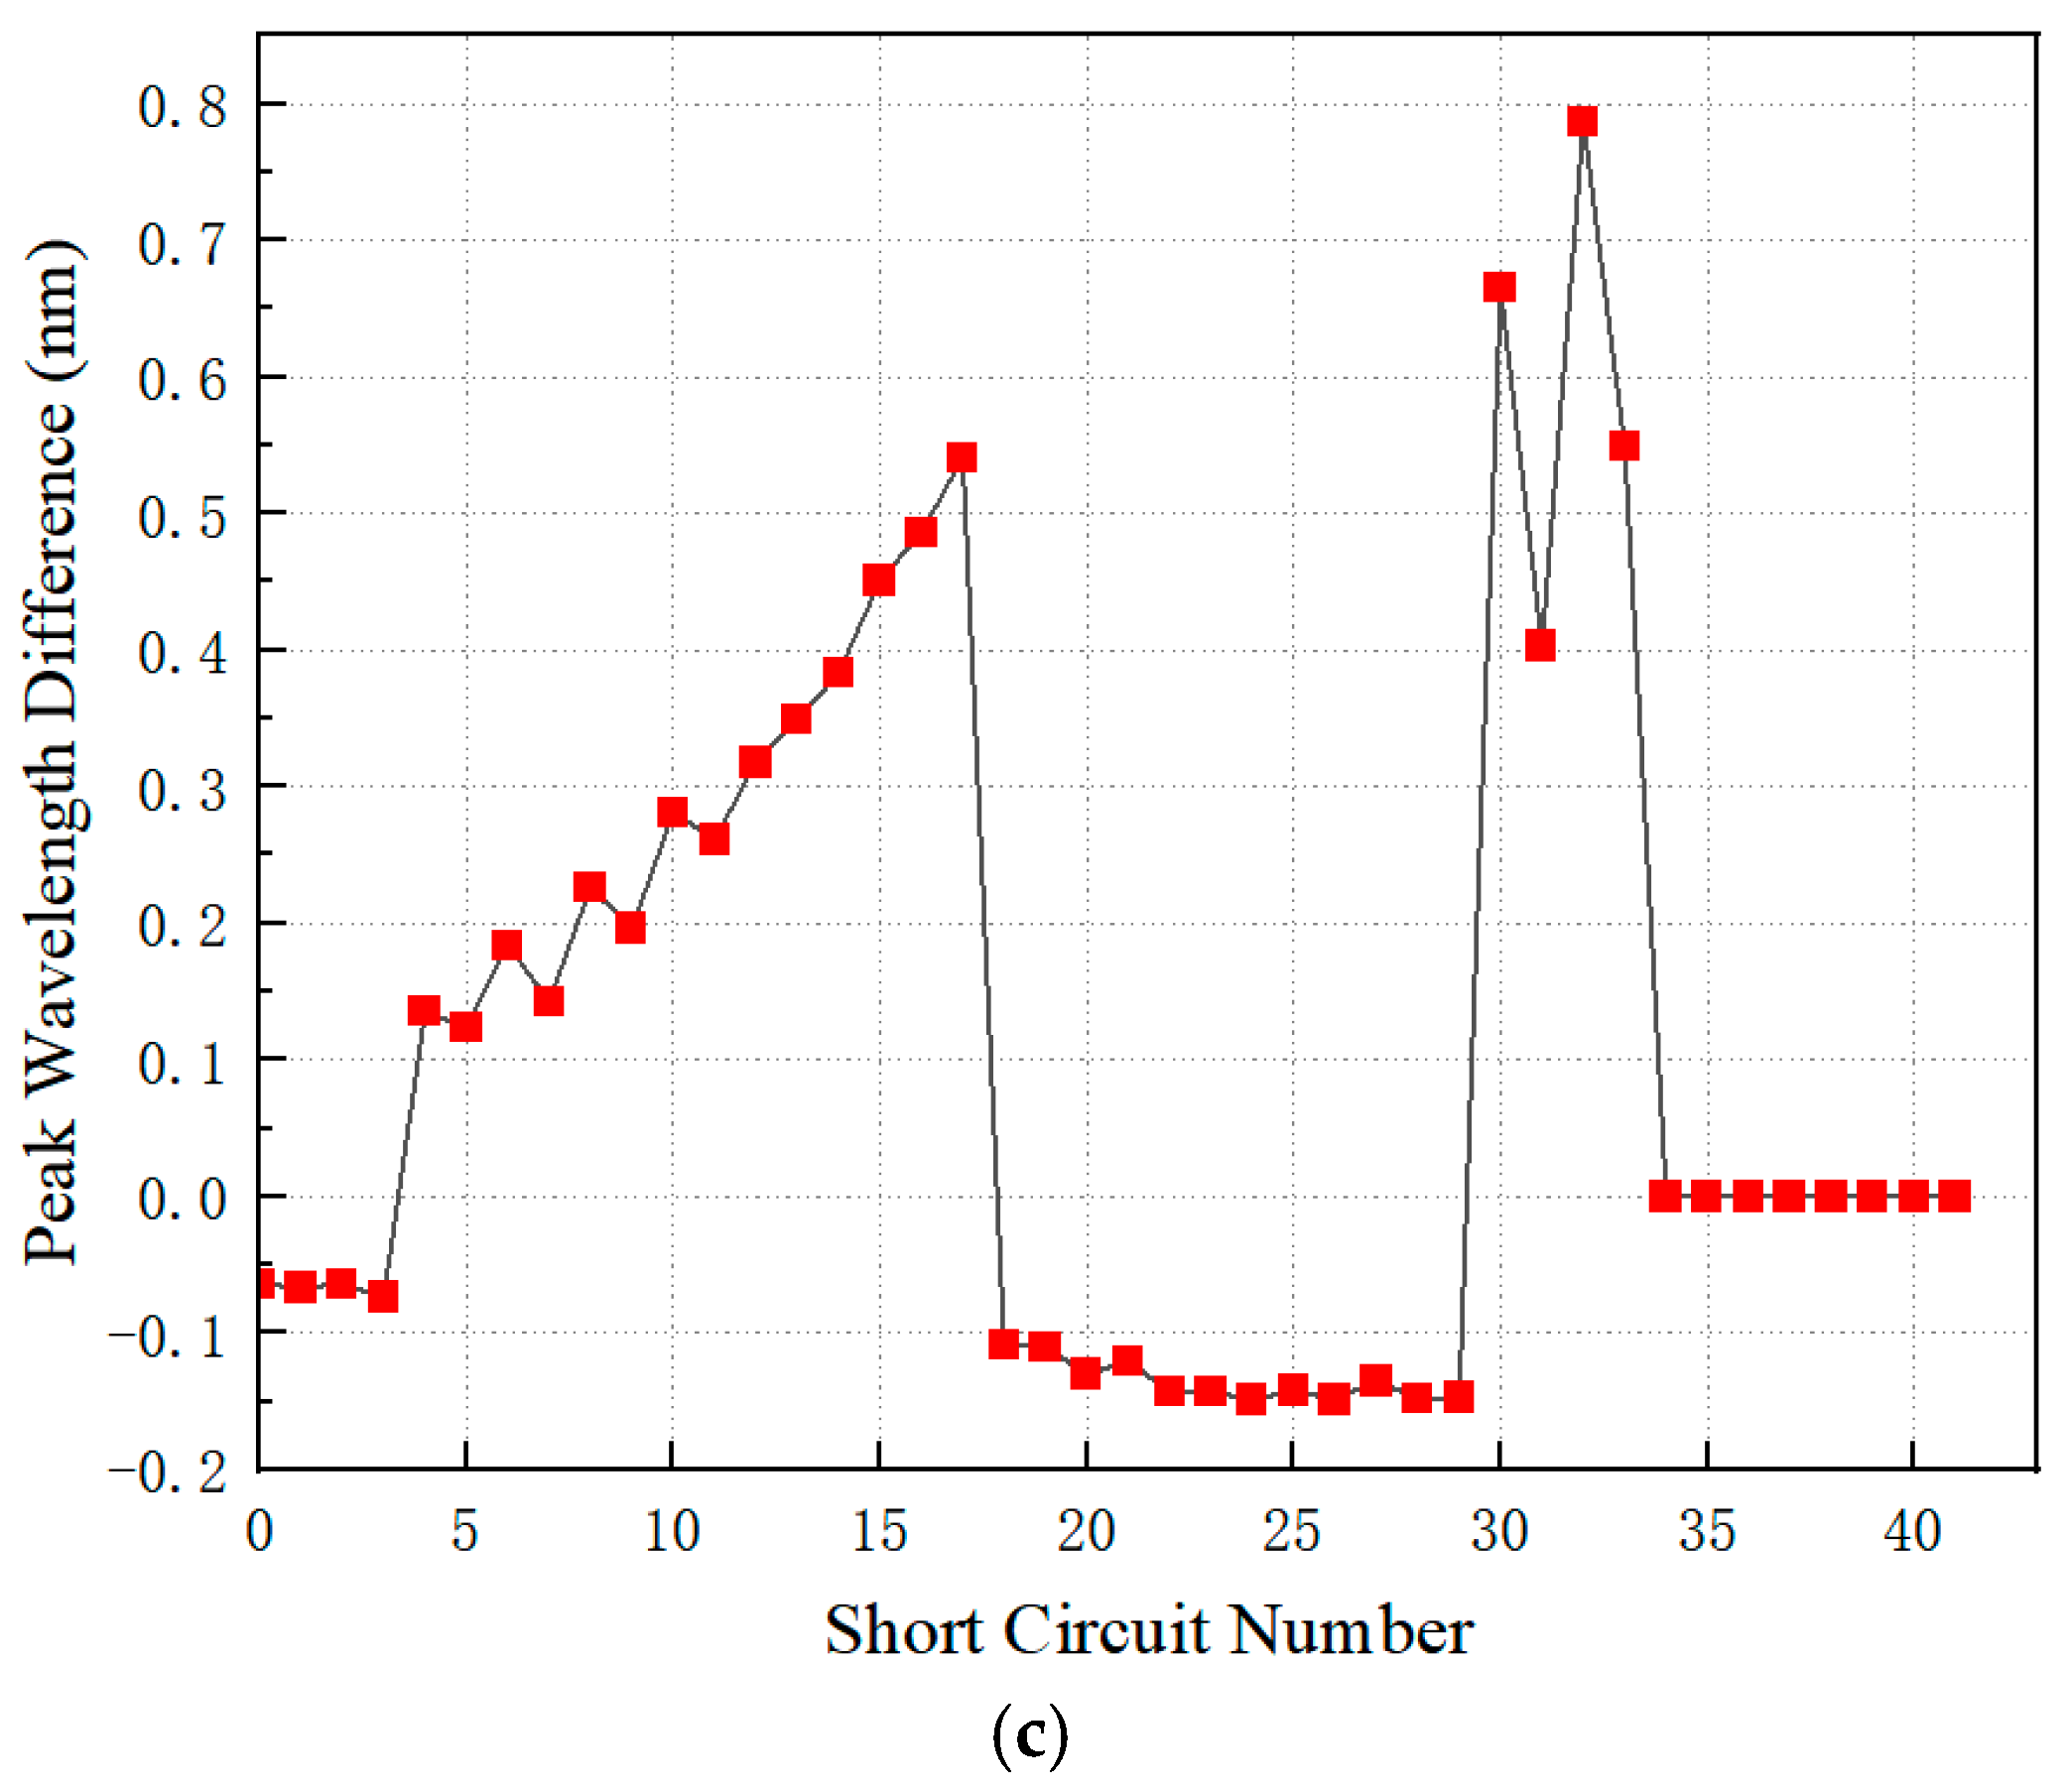
Figure 13, Sensor3# exhibits an overall upward trend in measurement results during the first 35 short circuit impacts, consistent with the experimental conditions where short circuit current gradually increases. However, the measurement results plunged sharply after the 36th short circuit, with fiber signal loss occurring during the 39th short circuit. Further examination of
Figure 13b,c reveals that Sensor4# for Phase B and Phase C completely lost signal, indicating fiber breakage likely occurred during the first 18 short circuits. Sensor5# exhibited significant detection errors from the outset, likely due to the oversized slots in the support bar causing measurement point loosening and abnormal readings. As shown in
Figure 13c, after enduring a total of 36 short circuit impacts, Sensor5# experienced fiber signal loss.
Overall, installing fiber optic sensors inside the support bars significantly enhances short circuit resistance compared to the control group with sensors installed on the surface of the windings. However, achieving the optimal slot size within the support bars is challenging. Excessively large slots may cause significant measurement errors in the optical fibers. Considering that slotting can be performed mechanically, future experimental research may enable the calculation and analysis of the ideal slot dimensions.
3.4. Experimental Results and Analysis of Fiber Optic Sensors Inside the Spacers
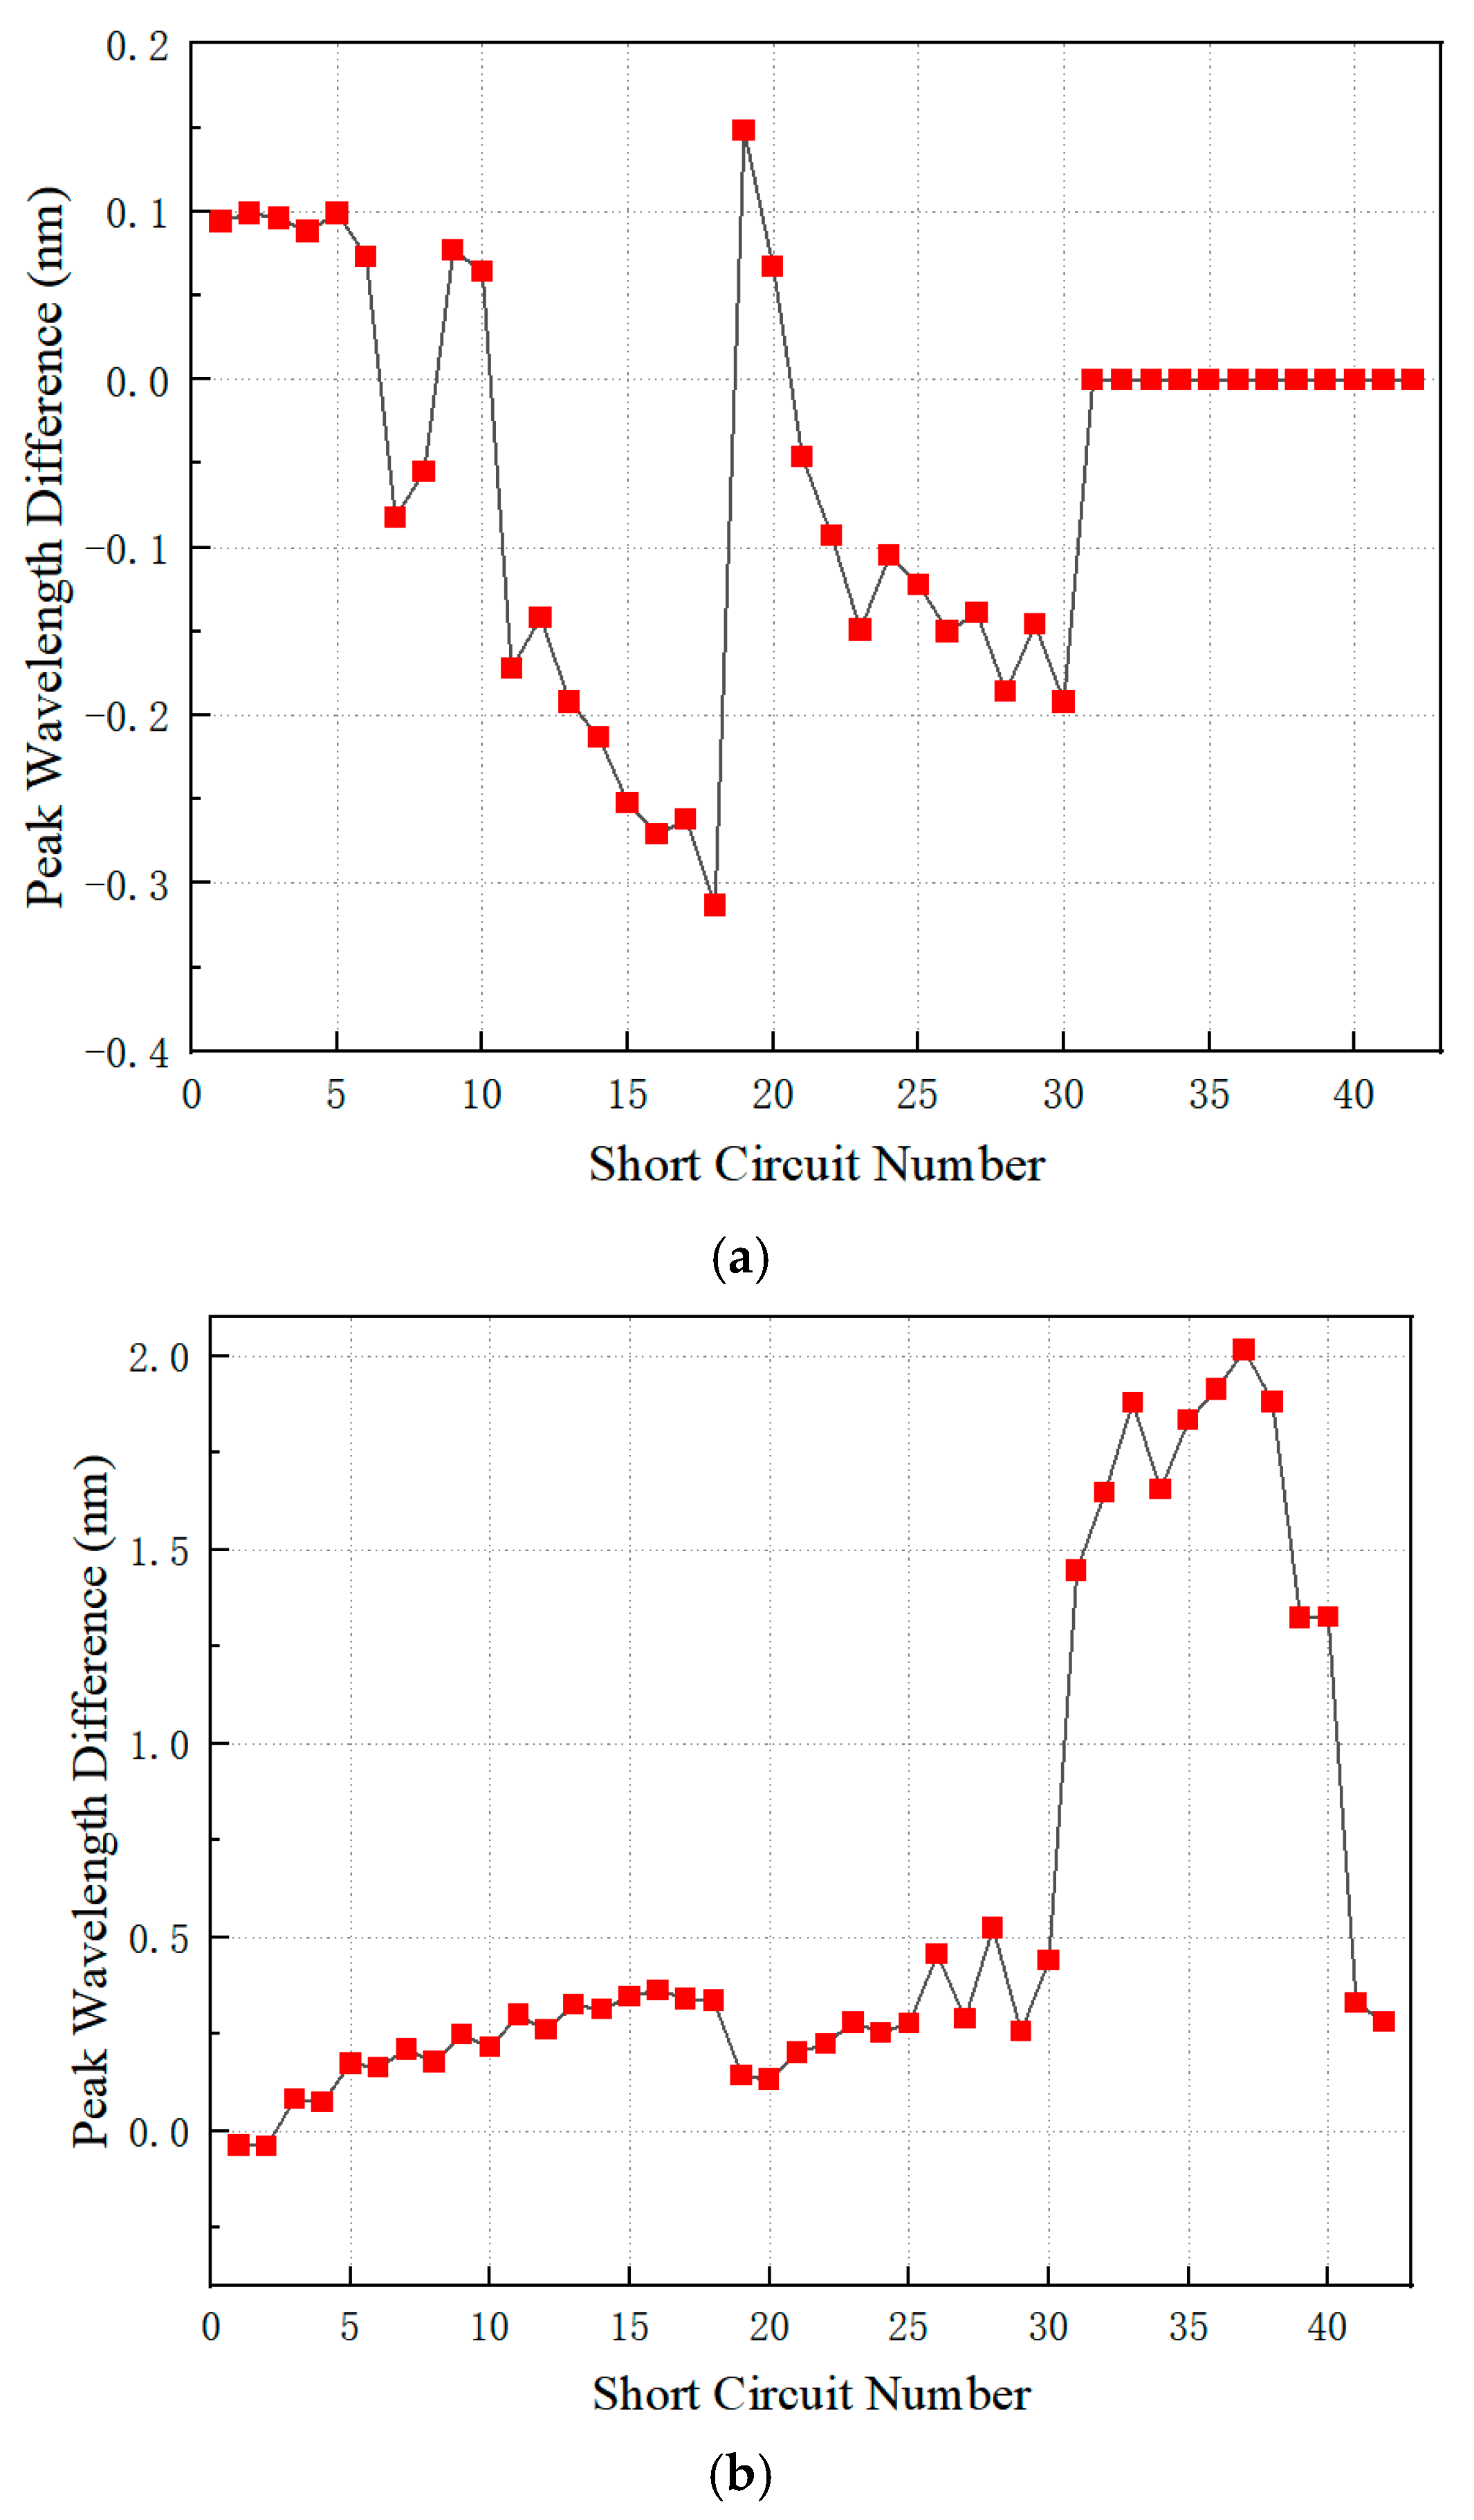
The third set of sensors is arranged inside the spacers. This paper only installed three sensors at the top, middle, and bottom spacers of the B-phase winding, with their fiber optic wavelength changes Δλ shown in
Figure 14. As seen in
Figure 14a, Sensor1# in the top spacer of the B-phase winding detected normally during the first six short circuit impacts, but then began exhibiting abrupt changes in detection results. Similar to the slotting error in the support bars discussed earlier, this is attributed to excessive slotting within the spacers causing sensor displacement after repeated deformation. After enduring the first 30 short circuit impacts, the optical fiber of Sensor1# lost signal during the 31st impact. Analyzing
Figure 14b further, its sensor fully withstood the short circuit impact during Phase B short circuits. The wavelength changes during the final 12 short circuit events largely followed the current variation patterns of the short circuit impacts. Finally, analyzing
Figure 14c reveals that the sensor installed in the bottom spacer of the winding experienced fiber signal loss after 33 short circuits, demonstrating superior short circuit resistance compared to the top winding.
Overall, fiber optic sensors installed within the spacers demonstrate superior short circuit resistance compared to those placed on the winding surface or inside the support bars. However, the challenge of controlling slot dimensions remains. The results also indicate that when installing fiber optic sensors within spacers, the mid-section spacers are the most suitable location.
3.5. Experimental Results and Analysis of Fiber Optic Sensors at the Top of the Pressure Board
The fourth set of fiber optic sensors was positioned on the top of the pressure board and fixed via pressure nails on the secondary pressure board. Sensors 3# (Phase A), 1# (Phase B), and 4# (Phase C) near the core window were selected for analysis.
The fiber optic sensor measurement results are shown in
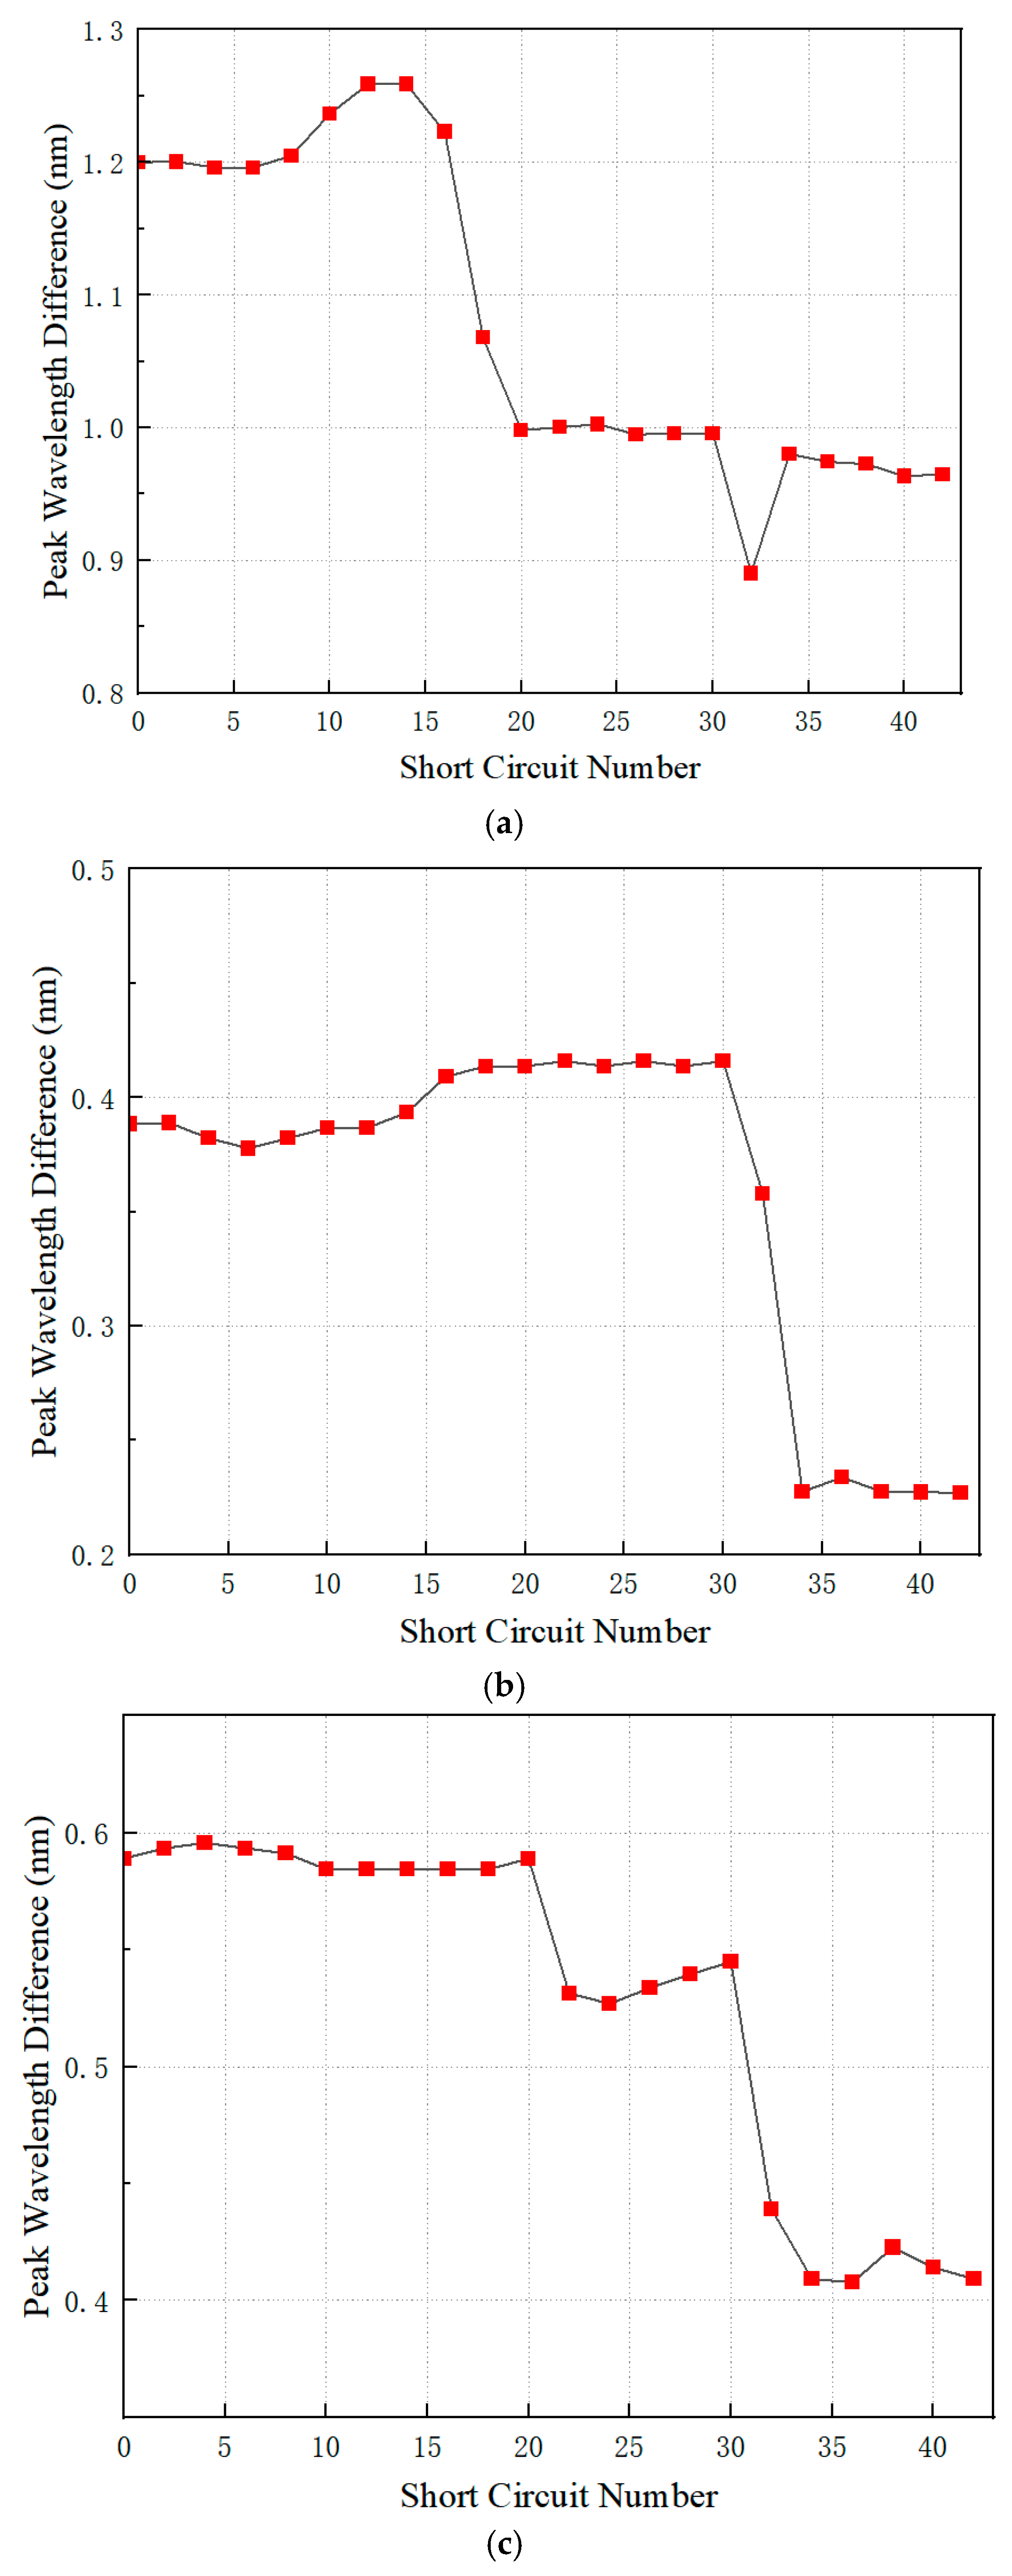
Figure 15. The peak wavelength difference in
Figure 15a remains largely stable, with a sharp drop occurring only during the 18th short circuit. This is because the 18th short circuit was a three-phase short circuit on the A-phase winding at 100% current, resulting in pressure loss significantly exceeding that of the previous 17 short circuits. The sharp drop in
Figure 15b occurs during the 32nd short circuit, when the B-phase winding was subjected to 80% of the short circuit current. This result aligns with theoretical expectations. Notably, although the B-phase winding endured multiple subsequent short circuit impacts with higher currents after the 32nd event, no further peak wavelength difference loss was detected. This occurs because repeated short circuits gradually disengage the upper pressure board from the windings, reducing the damage to the preload caused by short circuit impacts. The abrupt drop points in
Figure 15c occur during the 22nd and 32nd short circuits. The former corresponds to the moment when the C-phase winding was subjected to an 80% three-phase short circuit current impact, while the latter corresponds to the B-phase winding withstanding an 80% short circuit current impact.
It should be noted that while this paper analyzes the same position sensor across all three phases, the analysis focuses on whether the wavelength changes measured by the sensor align with theoretical predictions. Since the short-circuit currents experienced by the three phases are not identical, the sensor data from the three phases cannot be directly compared with one another.
It can be seen that the fiber optic sensors positioned on the top of the pressure board did not experience fiber breakage throughout the entire short circuit impact test. They effectively reflected changes in the preload as the number of short circuit impacts increased. Furthermore, since the fiber optic sensor on the top of the pressure board is fixed by compression, it avoids the issue of slotting dimensions of the spacers.
Finally, all experimental data were compiled. Taking Phase B as an example, the number of short-circuit impacts endured by each fiber optic sensor before fracture is recorded in
Table 5. Since a total of 42 short-circuit impacts were applied, the number of impacts endured by fibers that did not fracture is recorded as “>42”. As shown in the table, sensors positioned at the middle of the spacer and the top of the pressure board demonstrate a significant advantage in survivability. However, considering that the size of the internal slots in the spacers is difficult to control, it is still more advisable to place the sensor on top of the pressure board.
4. Validation of the Online Preload Detecting Device
Based on the conclusions above, this paper establishes an online preload detecting method utilizing FBG technology. Sensors were deployed on the top of the B-phase winding pressure board of the SFZ-40000/110 transformer, with the sensor location corresponding to Sensor 5# in
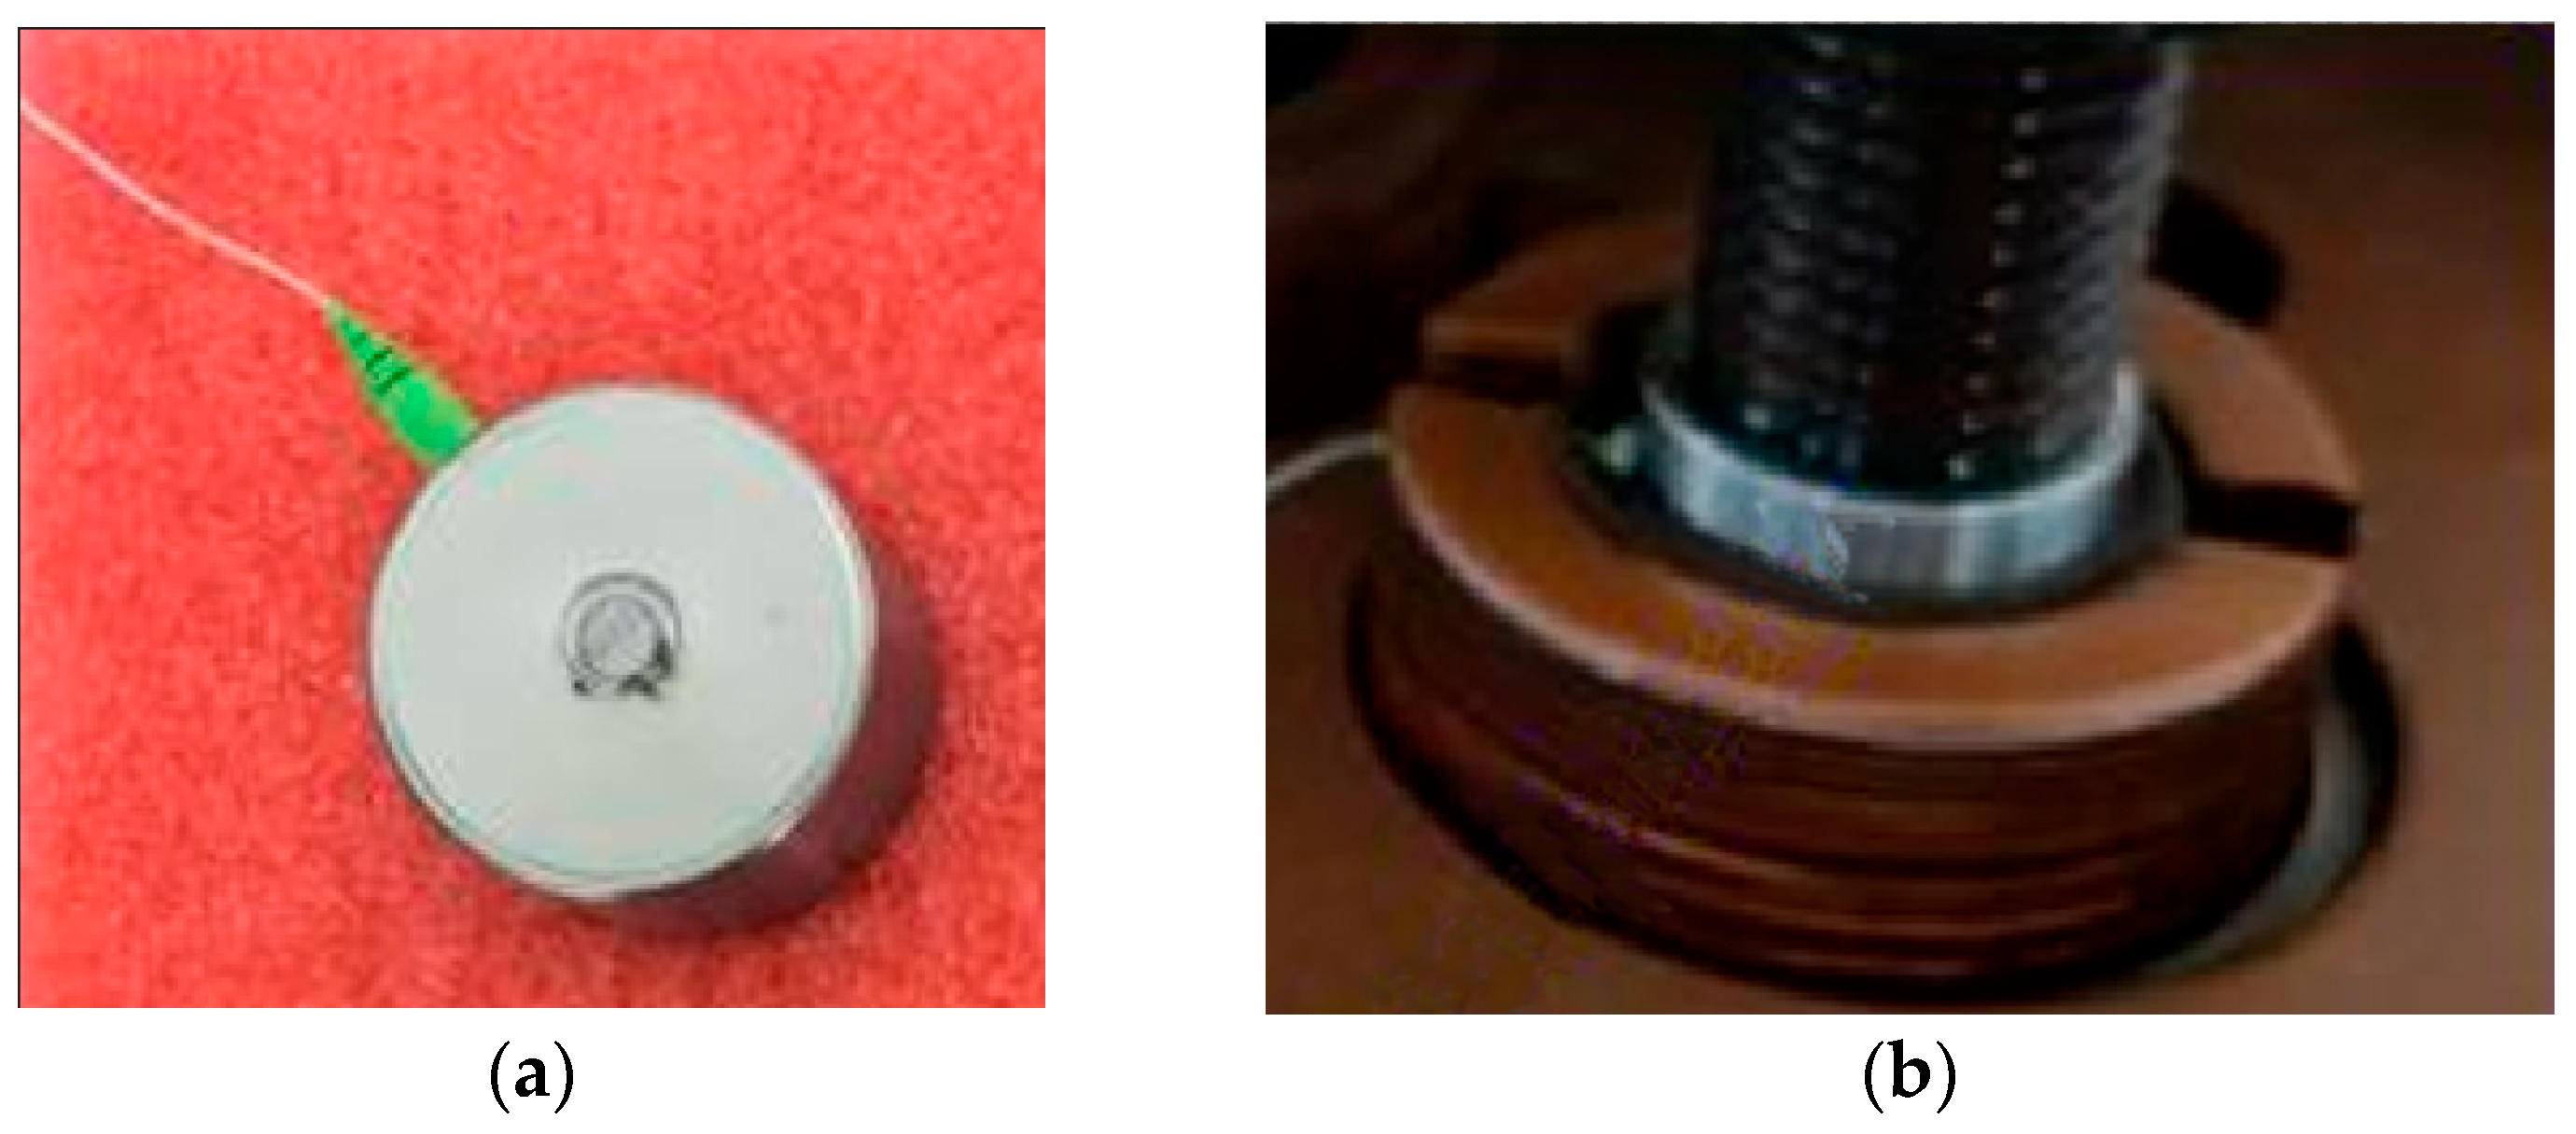
Figure 9. The appearance of the encapsulated FBG sensor is shown in
Figure 16a, while its installation on the board top is depicted in
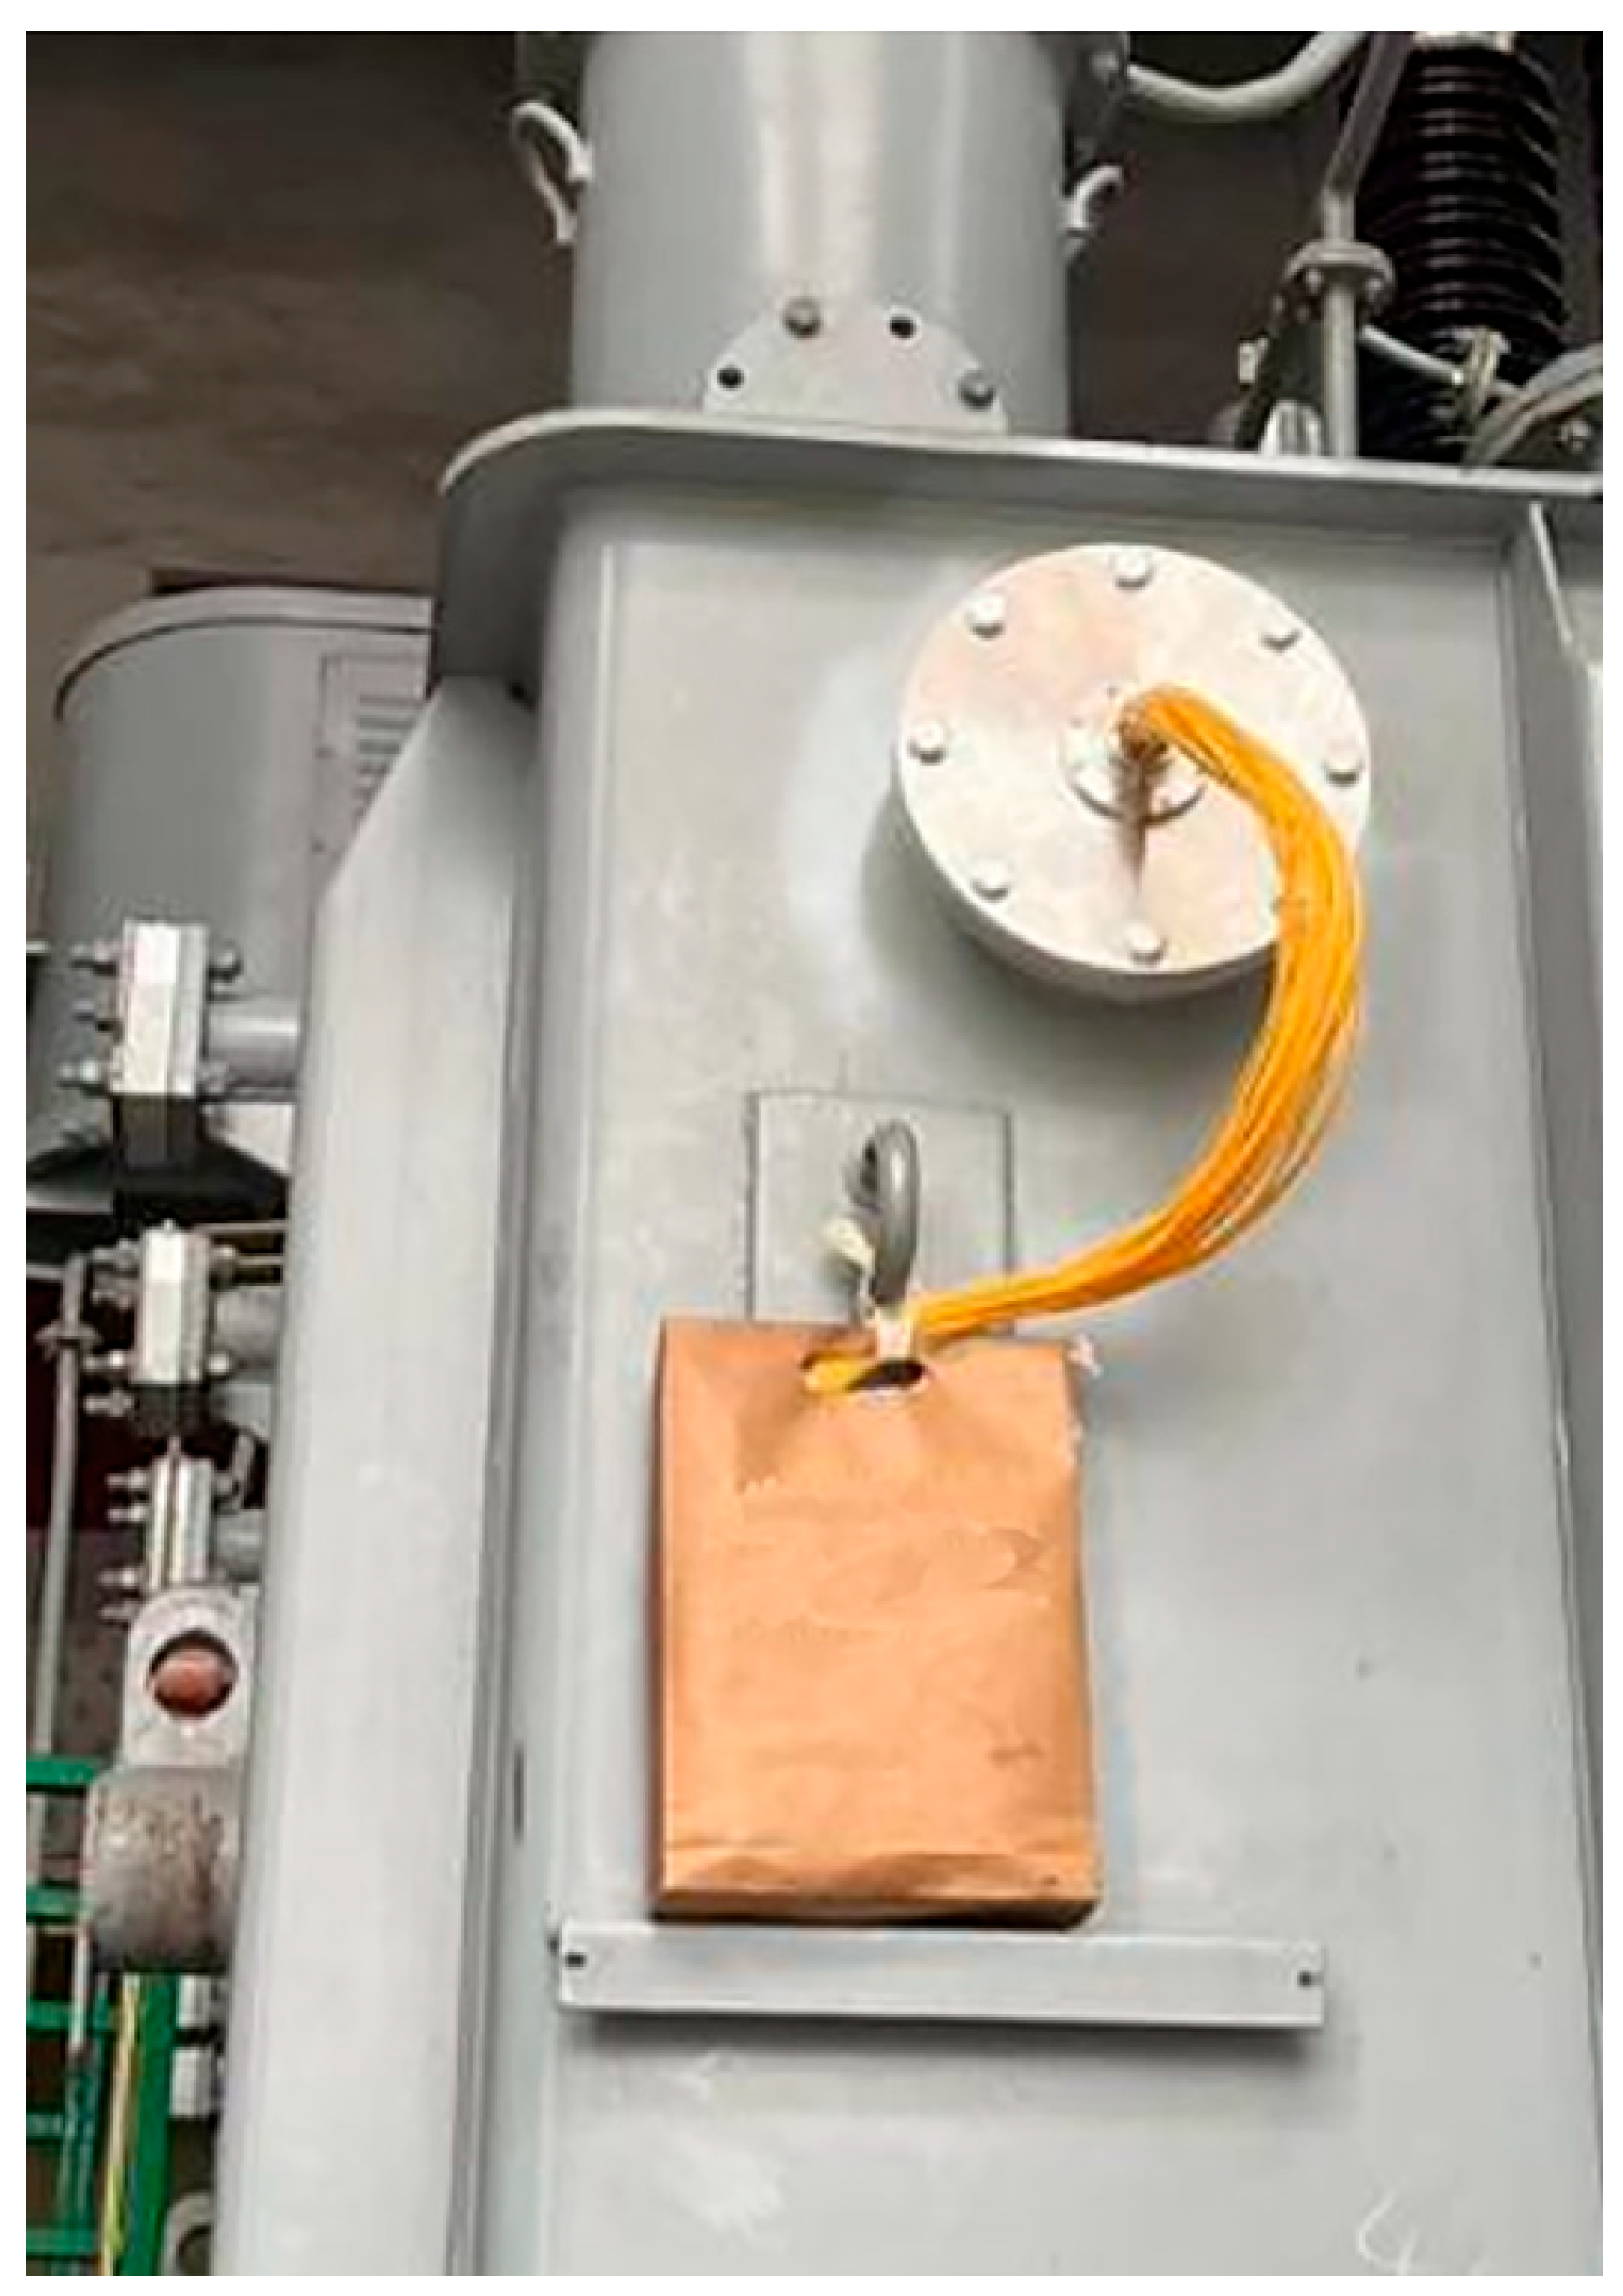
Figure 16b. After sensor installation, the other end of the optical fiber is threaded through a machined hole on the tank surface and sealed with a flange, as illustrated in
Figure 17.
It should be noted that although this paper selected only the B-phase winding for experiment due to the difficulty of drilling holes at the top of the pressure board, this does not affect the generalizability of the conclusions to the entire transformer. While the leakage magnetic field distribution in the A and C-phase windings may differ slightly from that of the B-phase, this has no impact on the results since this paper proposes a detection method rather than a computational model.
The modeling parameters for the windings are provided in
Table 2 of
Section 2. The modeling parameters for the core are presented in
Table 6. The core material used is 30SQG105 silicon steel sheet, whose B-H curve is shown in
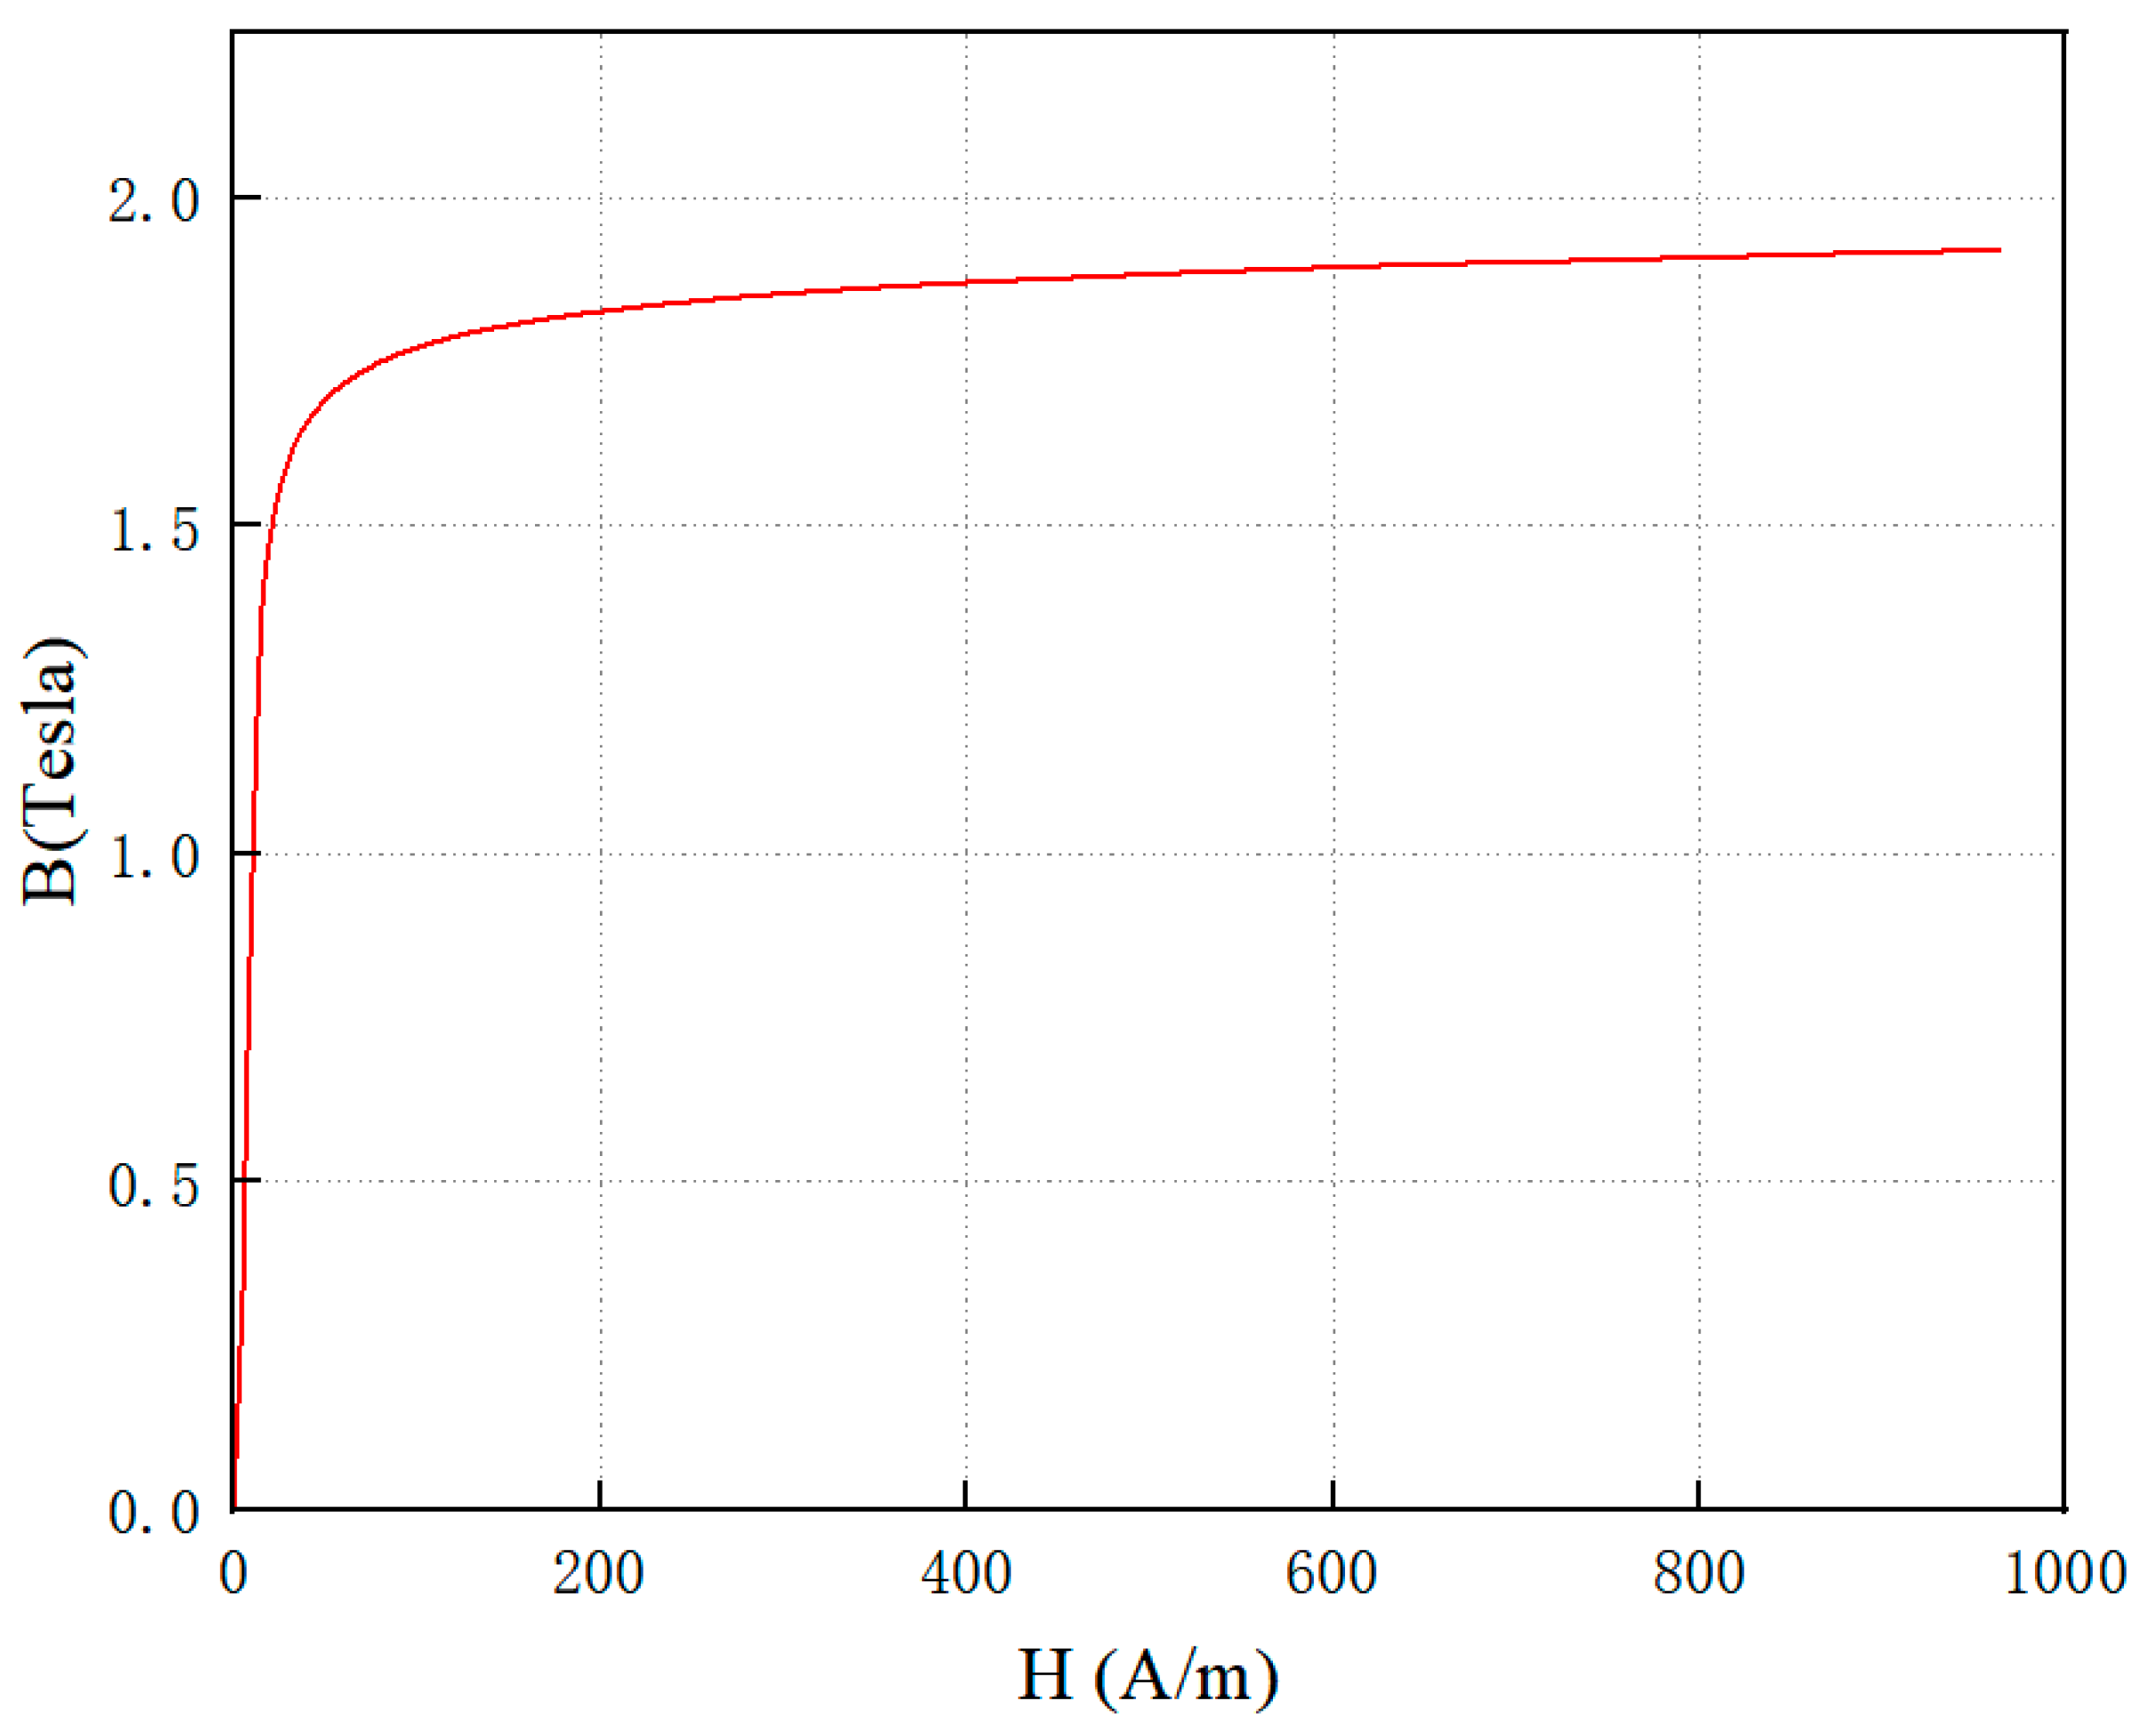
Figure 18 below. It should be noted that the B-H curve shown here does not include the hysteresis loop. However, since the simulation does not involve residual magnetism or demagnetization, this omission has negligible impact on the calculation results. Based on the above data, finite element simulation modeling is performed for the SFZ-40000/110 transformer.
Using the magnetic flux leakage sensor described in
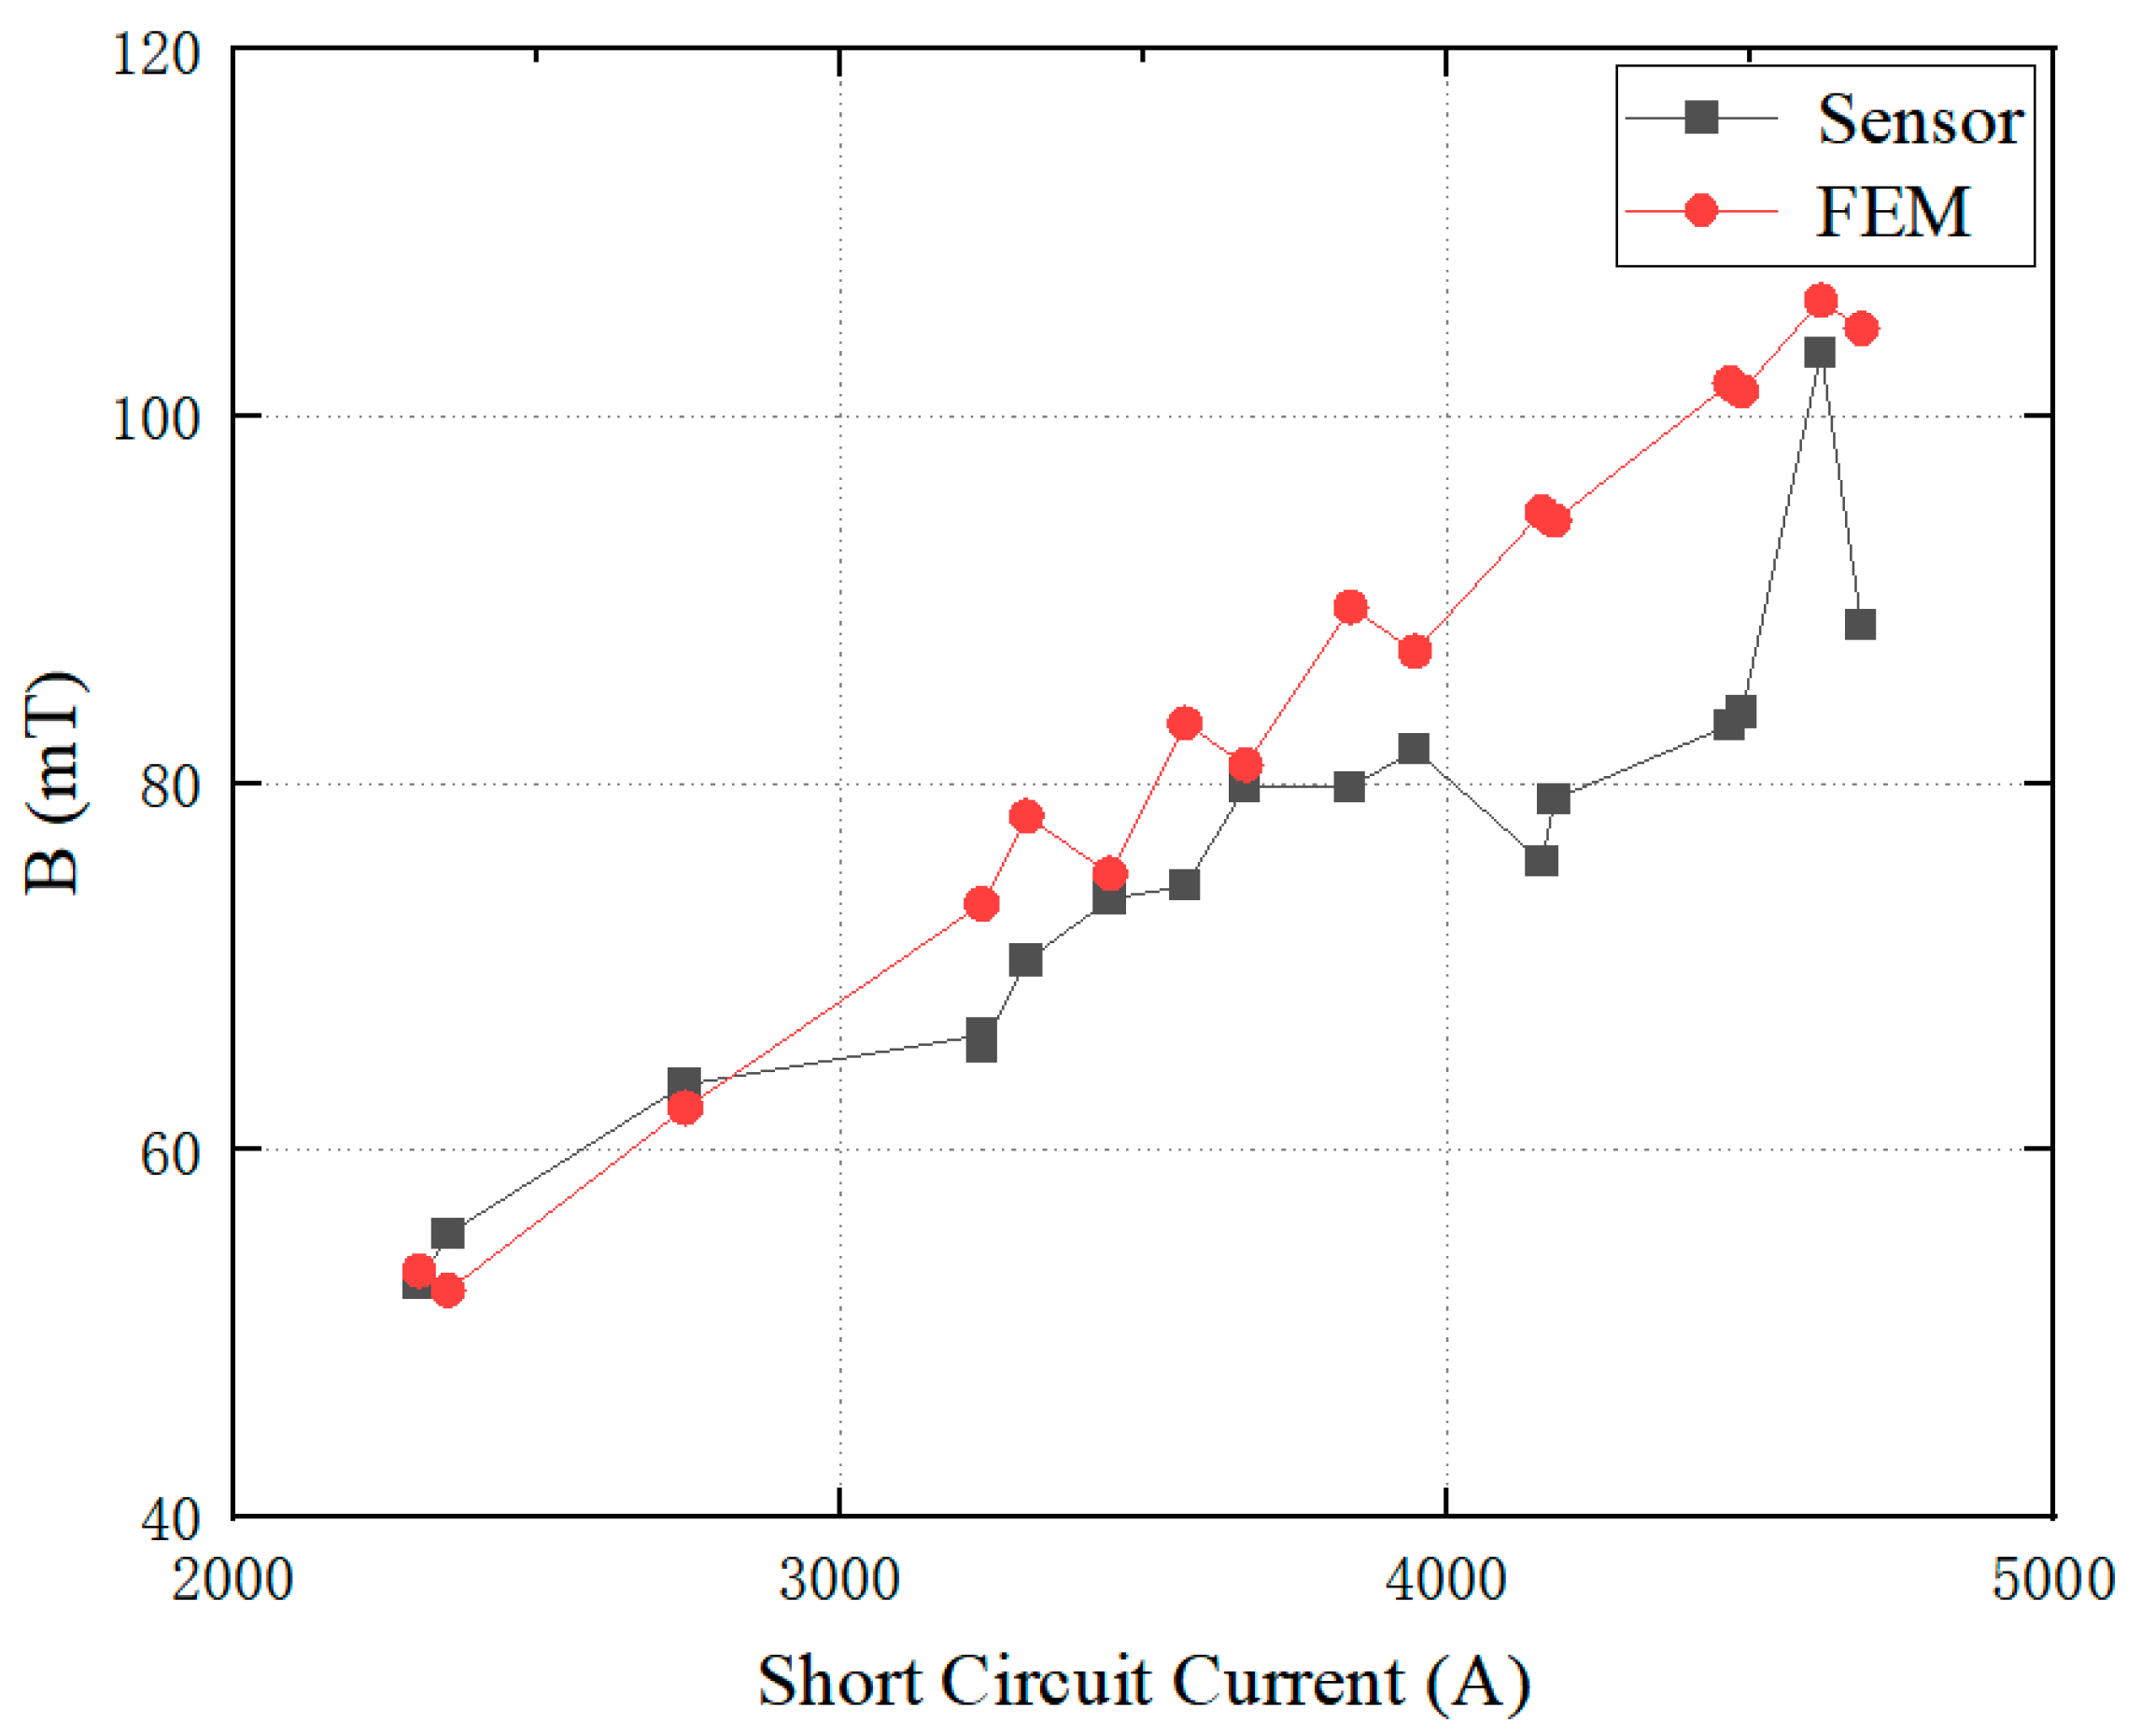
Section 2.2, this study measured the magnetic flux density above the main air gap of the winding at each peak moment during short circuit impacts. The comparison between the magnetic flux leakage sensor measurements and electromagnetic field calculation results in finite element method is illustrated in
Figure 19. An error analysis of the simulated electromagnetic field curve and the measured curve reveals that the maximum error across the entire curve was 22.41%. Among the 18 measured data points, 12 exhibit errors less than 10%, while the remaining 6 data points show errors around 20%. The six points with the greatest errors all occurred after the high voltage winding side short-circuit current exceeded 4000 A. This was due to repeated short-circuit impacts causing the leakage magnetic sensor to become loose, resulting in significant difference between the two curves. Before the high voltage winding short-circuit current exceeded 4000 A, the simulation results were largely consistent with the sensor measurements, validating the effectiveness of the simulation model.
The phase B low-voltage winding in the simulation model underwent 12 short circuit impacts. Based on a fundamental value of 30,262 A, the percentage of short-circuit current for each short-circuit number is shown in
Table 7. To obtain more experimental data, this experiment employs a gradually increasing current from low to high levels, which does not correspond to actual short-circuit conditions. During the initial low-current short-circuit impact, the yield strength and elastic modulus of the spacer slightly increase due to compression, making subsequent preload decay more challenging. To minimize the impact of this low-current phase on experimental results, the current was immediately increased to 100% once it reached 50%. This abrupt current increase better simulates real-world short-circuit conditions.
Since the windings had already sustained some damage in the experiments of the third subsection, to prevent winding instability during testing, this subsection primarily employed lower short circuit current values, with only three instances of high-current short circuit impacts. The selected FBG sensor and signal condition are as described in
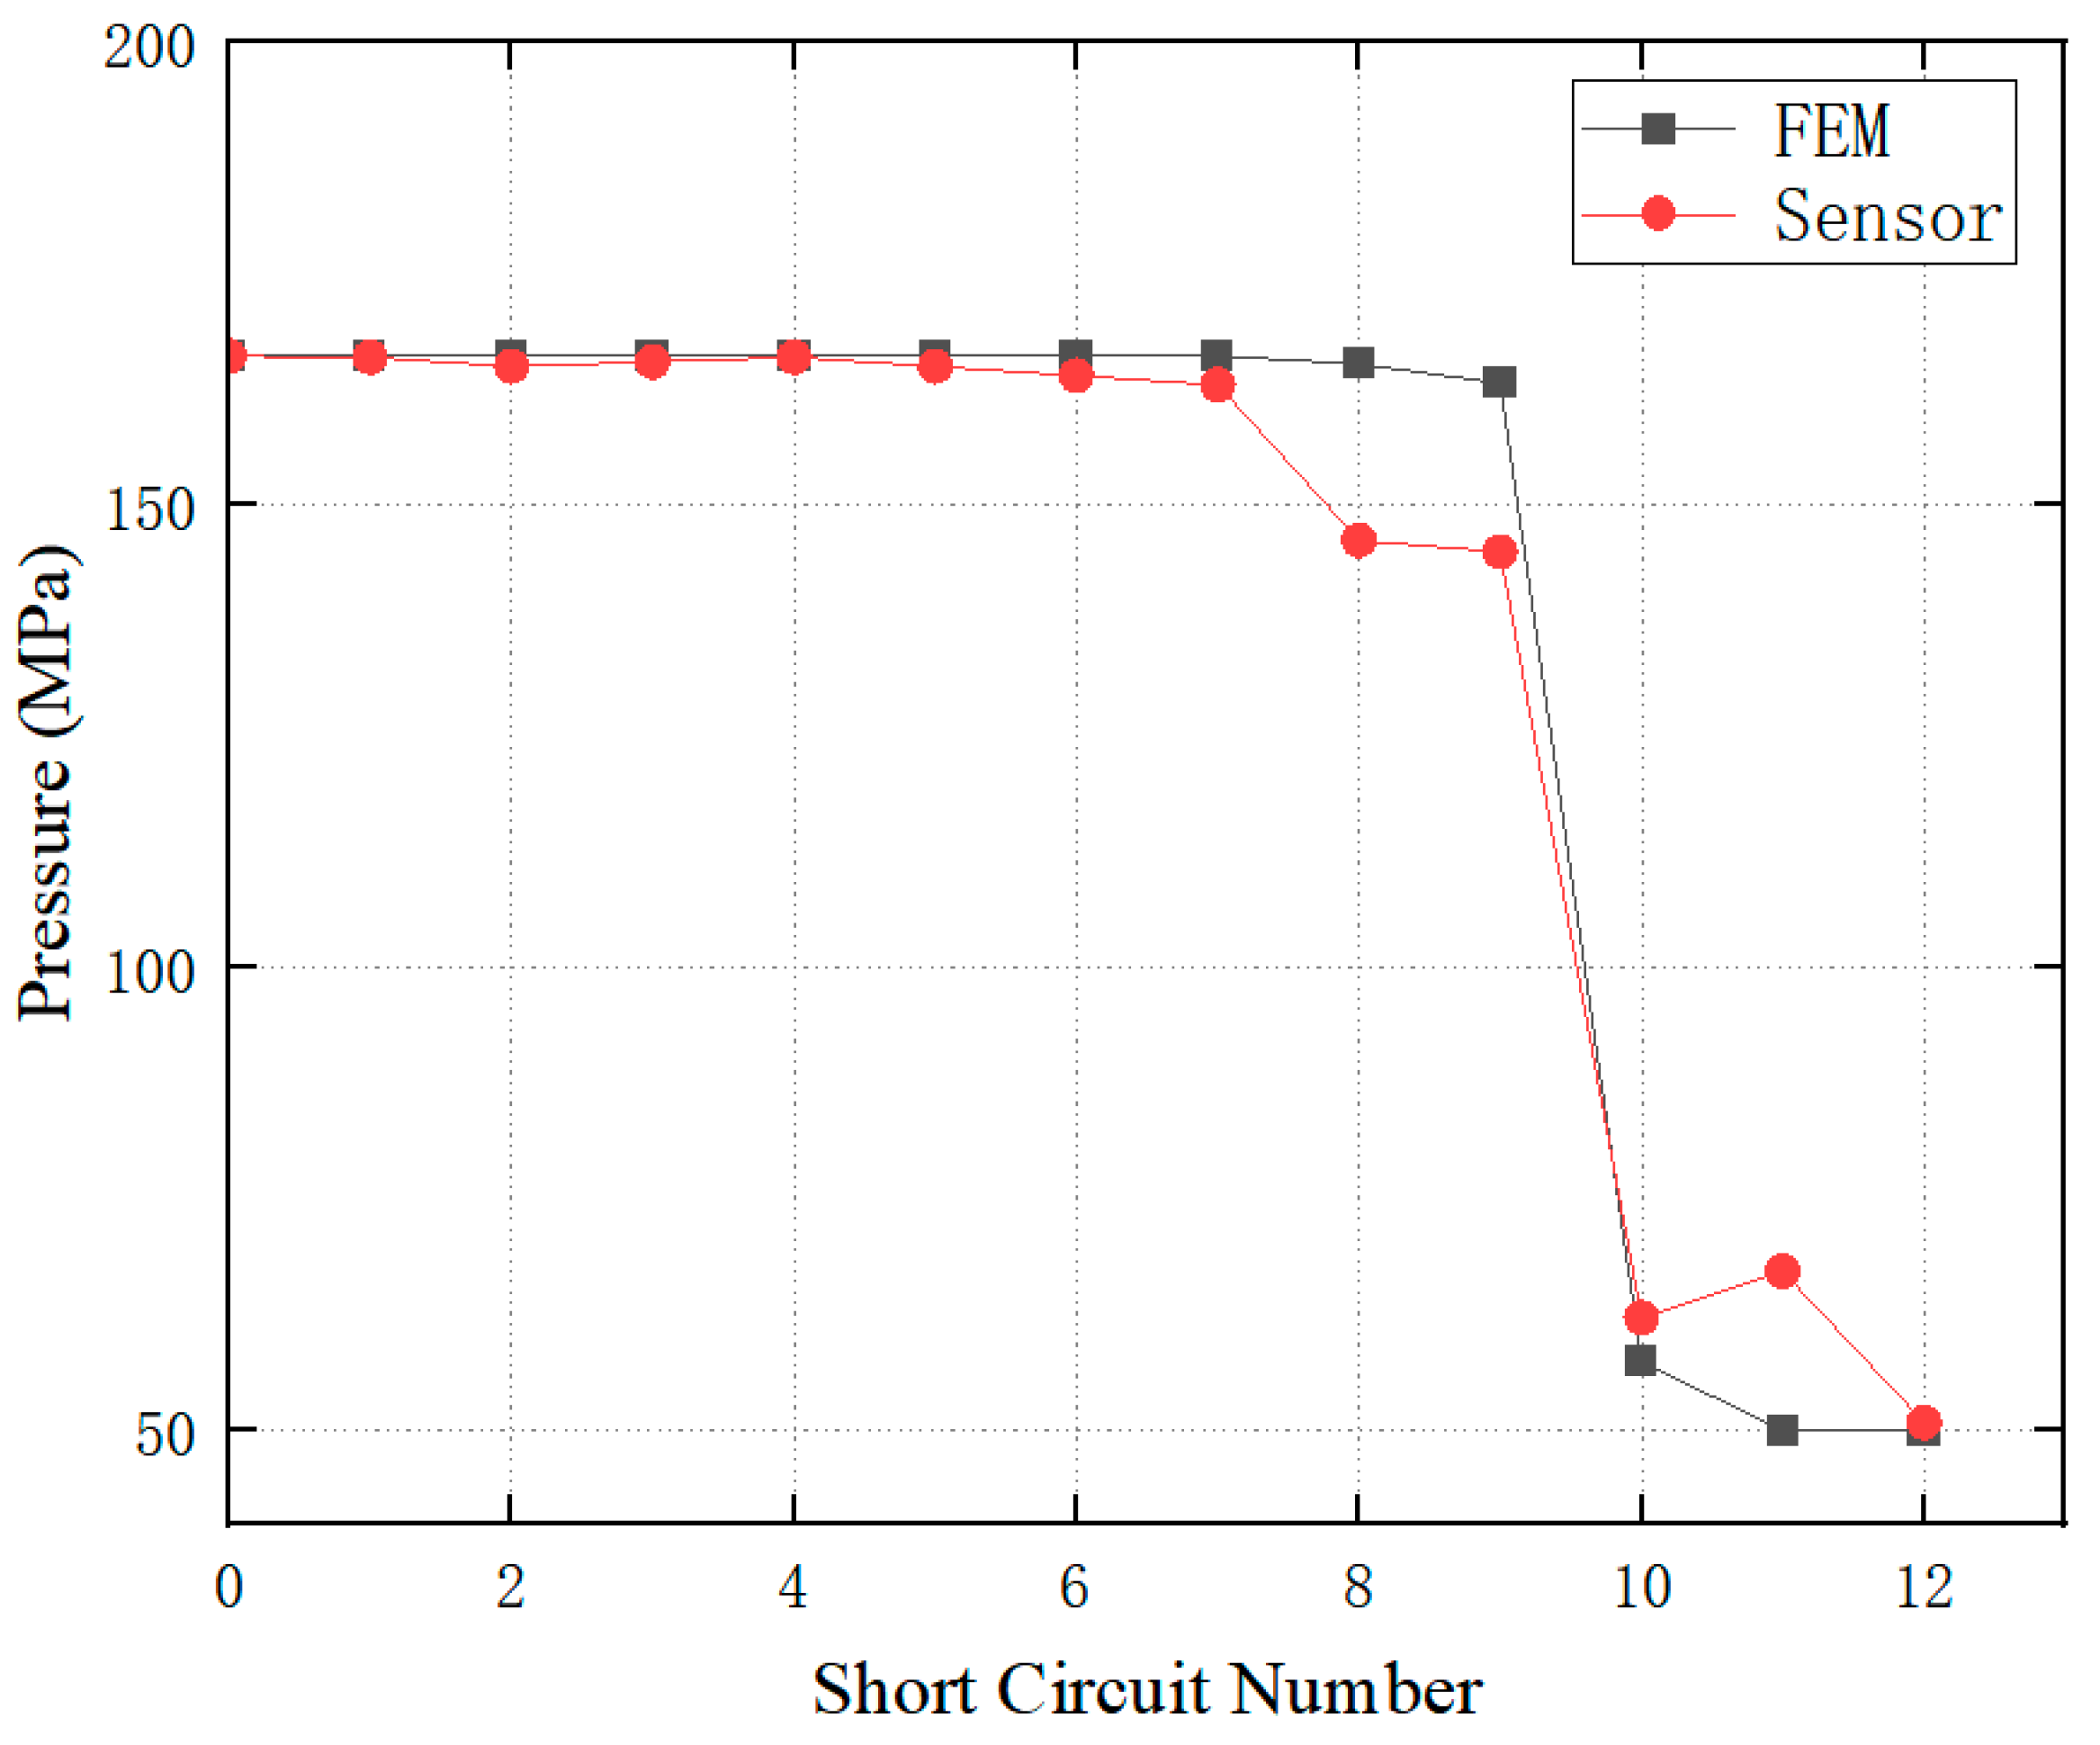
Section 3.1. Finite element analysis of the structural field for the simulation model was conducted. And the comparison between the online preload detection results and structural field calculation results is illustrated in
Figure 20. Error analysis reveals that among the 12 preload measurement results, 8 exhibited errors less than 2%, 3 showed errors around 10%, and the maximum error was 34.48% for the 11th measurement. The finite element simulation results are found to be consistent with the online preload detection results, demonstrating the validity of this detecting method to a certain extent.
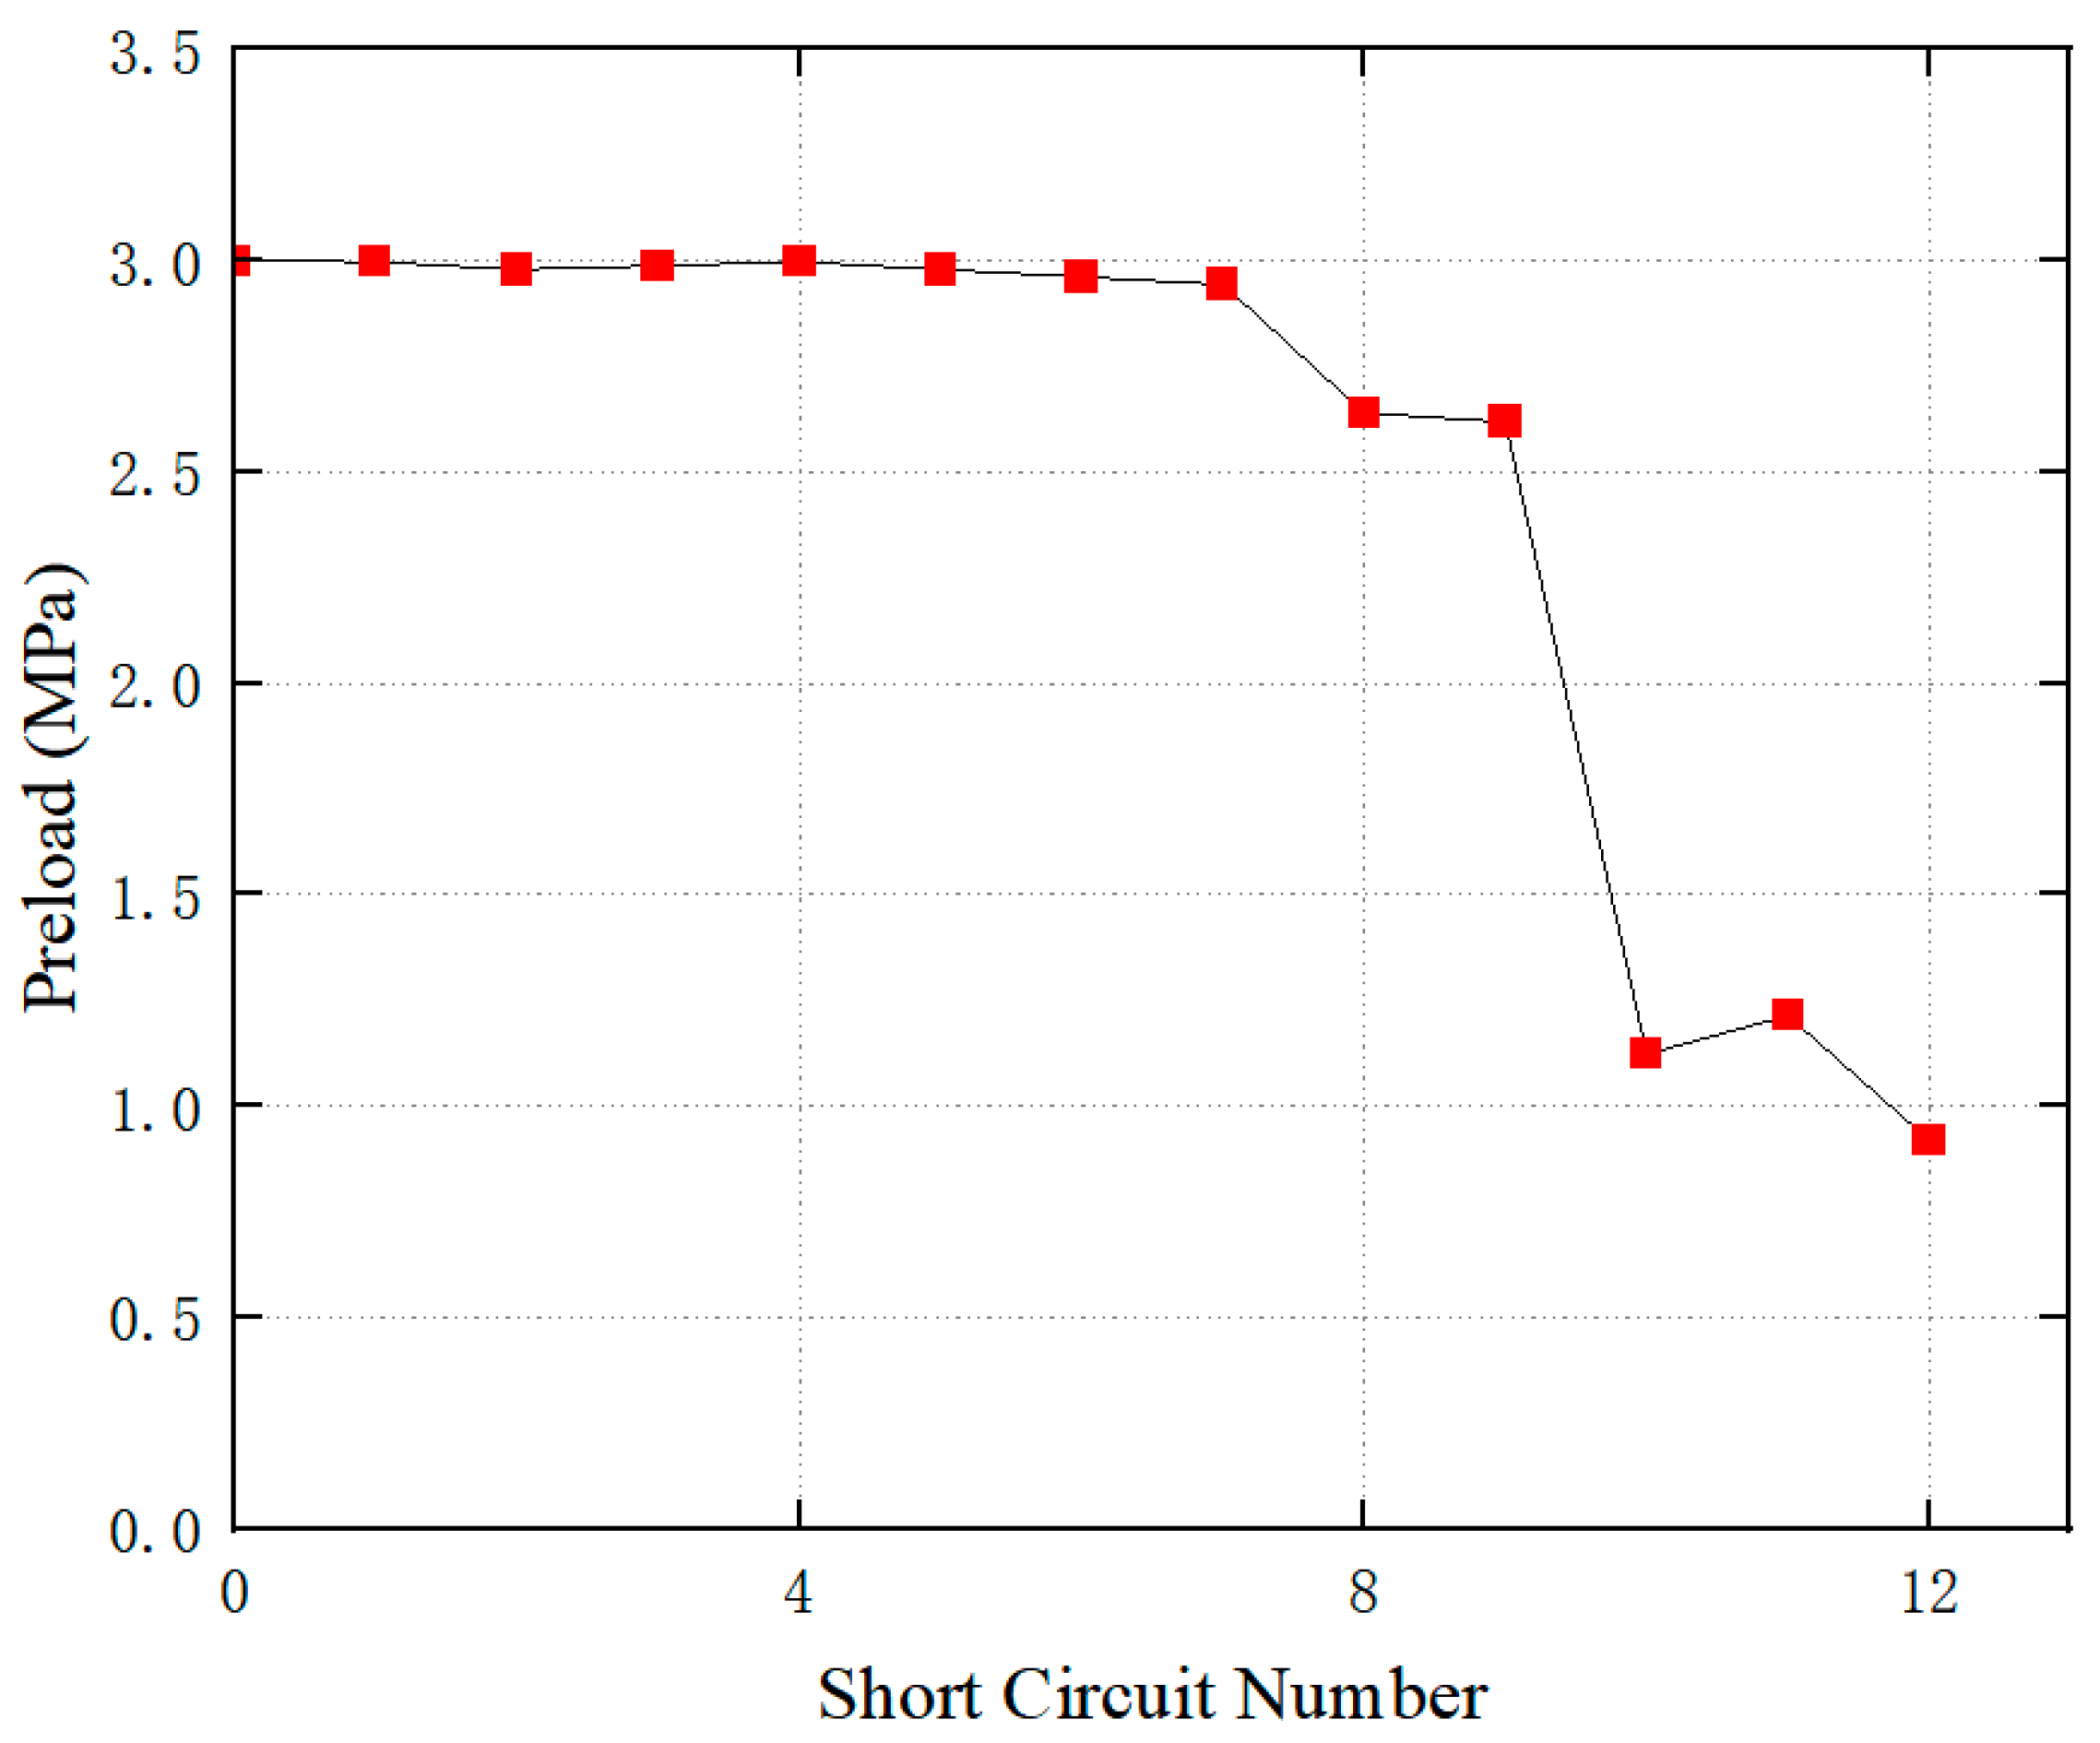
It should be noted that the pressure measured by this set of sensors represents the magnitude of pressure at the pressure nails location, not the preload itself. However, since the pressure nail pressure and preload represent the same force acting on different contact areas, the two exhibit a linear relationship. Furthermore, when the initial preload magnitude is known, this curve can be converted into the true preload curve through calculation. Additionally, the pressure measured in
Figure 20 represents the steady-state pressure, eliminating the issue of abnormal readings after the pressure board detaches from the top of winding. Consequently, the linear relationship with the preload remains consistent. For the transformer windings discussed in this paper, the preload was 3 MPa prior to the commencement of the experiment. It should be noted that any error in the initial preload measurement will result in a proportional error in the calculation model’s output. Therefore, it is imperative to verify the accuracy of the initial preload through offline inspection or other methods. The converted preload results are shown in
Figure 21.
After 12 short circuit impact tests, the transformer was subjected to a hoisting cover inspection, with results shown in
Figure 22. It can be observed that after multiple short circuit impacts, the top of the low-voltage winding’s support bars exhibited significant deformation, bending toward the left side of the image. The middle and bottom sections of the support bars showed minimal deformation and remained largely unaffected. Concurrently, large gaps appeared between the coil layers at the top of the winding, while the gaps in the middle and bottom sections remained within normal parameters.
If the pressure board becomes completely detached from the winding, fault detection can be achieved by leveraging the phenomenon that the optical fiber wavelength remains constant during transient processes. Therefore, this detection method remains effective even when the pressure board experiences partial loss of contact or advanced degradation.
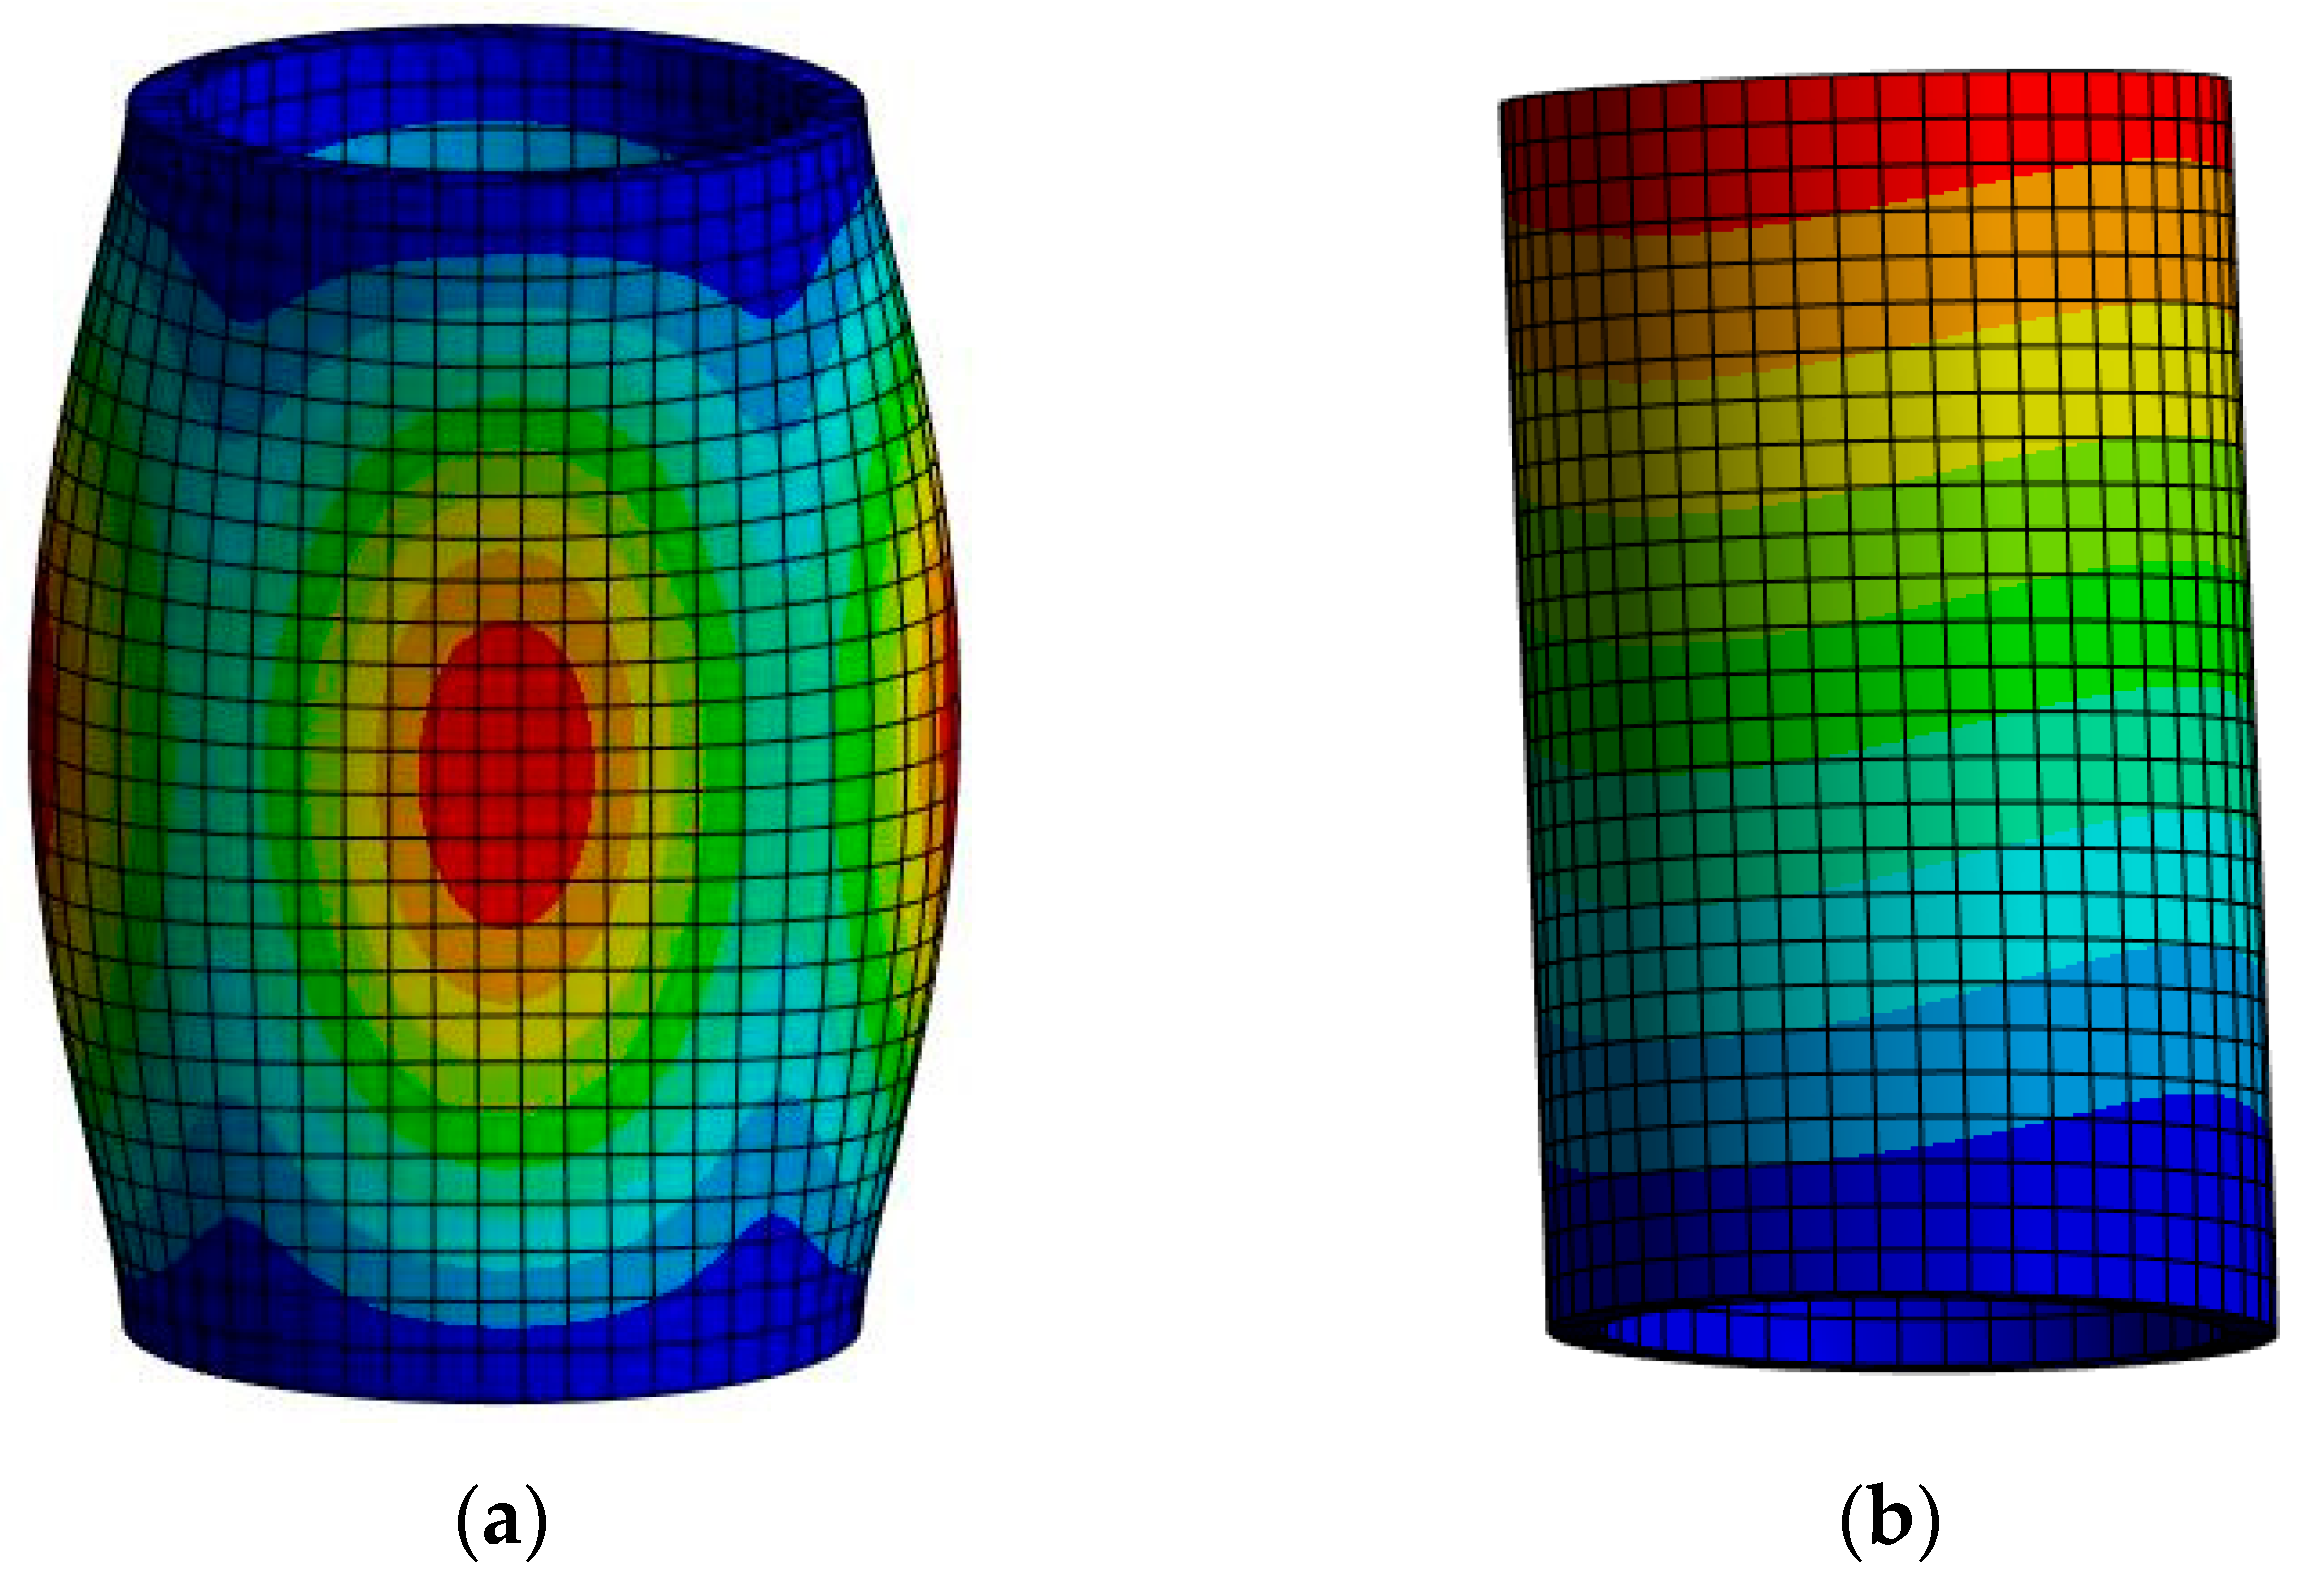
This phenomenon of winding damage concentrating at the top is not coincidental, but rather occurs because the windings lose their top constraints after the preload significantly decreases. Finite element analysis was conducted on windings with constraints at both top and bottom, as well as windings lacking top constraints. The results are shown in
Figure 23. Colors closer to red indicate greater deformation, while colors closer to blue indicate lesser deformation.
Figure 23a shows the first mode shape with fixed constraints applied to both the top and bottom. Here, the point of maximum winding deformation is located in the middle section.
Figure 23b presents the first mode shape with the top constraint removed, revealing that the maximum deformation occurs at the top of the winding.
This clearly demonstrates that the winding damage observed after the cover removal is concentrated at the top, confirming that the winding preload has significantly decreased after multiple short circuit impacts, leading to separation between the upper pressure board and the top of the windings. This result aligns with the findings from the online preload detecting method based on FBG shown in
Figure 20, further validating the effectiveness of this method.