Article

Natural Antifouling Potential of Fucus vesiculosus and Arthrospira platensis

Department of Natural Sciences, The University of Maryland Eastern Shore, Princess Anne, MD 21853, USA
*
Authors to whom correspondence should be addressed.
Appl. Sci. 2026, 16(2), 642; https://doi.org/10.3390/app16020642
Submission received: 2 December 2025 / Revised: 19 December 2025 / Accepted: 7 January 2026 / Published: 8 January 2026
(This article belongs to the Section Applied Biosciences and Bioengineering)

Abstract

Biofouling is the accumulation of marine organisms on submerged surfaces and has negatively impacted several industries while aiding in the spread of invasive species. Traditional antifouling paints, such as tributyltin and copper-based paints, have proven toxic to marine environments, necessitating the use of novel, less toxic alternatives. Previous research has shown that antifouling paints made from essential oil-rich superfruits and medicinal herbs have been effective in preventing precipitation accumulation, including bacterial and mineral accumulation. This study examined the antifouling potential of spirulina and fucus, two algae rich in antioxidants and essential oils. Extracts were analyzed for antioxidant and essential oil content before being subjected to a three-week-long antifouling test. A post-test surface analysis was then performed, and the precipitation count per mm of slide was calculated, followed by a comparison with previous extracts from superfruits and medicinal herbs. After testing, fucus has a minimum bacterial count of 41.4 ± 2.0 per mm in freshwater and 14.0 ± 0.7 per mm in saltwater. Spirulina had a minimum precipitation count of 13.9 ± 2.8 per mm for freshwater and 6.6 ± 1.3 per mm for saltwater. As such, spirulina performed better than fucus, superfruits, and medicinal herbs in both saltwater and freshwater, except for when compared to results from ginger extracts in saltwater.

1. Introduction

Biofouling is the attachment of marine organisms, such as bacteria, invertebrates, algae, and barnacles, to submerged surfaces through physical, chemical, and biological interactions [1,2,3]. Biofouling is initiated by the formation of a biofilm, an extracellular polymeric substance (EPS) composed of polysaccharides and proteins. This supports microbial communities by promoting nutrient availability and providing a protective barrier against the external environment [4,5].
The development of mature biofilm typically involves five successive stages. In stage 1, planktonic cells interact with the surface, leading to transient bacterial attachment via pili, flagella, and outer membrane proteins. In stage 2, bacteria irreversibly attach to the surface, forming a monolayer that produces an extracellular matrix. Stage 3 involves cell proliferation, microcolony formation, and the production of large amounts of EPS. In stage 4, the biofilm reaches maturity, leading to the secretion of DNA and proteins. In stage 5, planktonic cells are released due to nutrient depletion caused by an outgrown population. This allows for the biofilm to disperse, spread, and colonize new surfaces [6,7].
The impact of biofouling is wide-reaching, as most submerged objects in a shallow marine environment will be covered entirely by biofilm within a few months. This includes items such as piping and turbines, which cause degradation and impact industries such as aquaculture and water treatment [8,9,10,11,12]. However, the most affected industry is shipping. Biofouling causes hull friction on shipping vessels, reducing efficiency by up to 82% and increasing fuel consumption [1,10,13]. As such, the global maritime industry spends 5.7 billion annually on biofouling control measures [14]. Biofouling can also cause ecological damage by transporting invasive species attached to shipping vessels, costing the U.S. international fishing industry $80–85 billion alone [15,16]. The impact of biofouling on the shipping industry is particularly problematic due to its broad reach: it comprises 104,304 ships from over 150 nations [11,12] and accounts for approximately 90% of world trade [17,18].
Traditional antifouling paints have included toxic substances such as copper or tributyltin (TBT) [19]. Copper-based paints are widely used for their effectiveness but are now restricted due to their negative impact on marine ecosystems [20]. TBT-based paints were introduced in the 1960s but have since been shown to cause effects, such as sterility in mollusks and morphological abnormalities in oysters, including heavily impacted shell formation in farm-raised oysters in France [21,22]. This has led to bans on TBT use, including a worldwide ban by the International Maritime Organization in 2008. “Booster” biocides were another primary type of antifouling paint used. These biocides included chemicals found in herbicides and pesticides such as chlorothalonil, dichlofluanid, zinc and copper pyrithione, and zineb, which have since been banned due to their negative impact on photosynthetic organisms and plants [20].
However, recent studies have explored the use of nontoxic alternative antifouling agents. In particular, studies have shown that extracts made from plants rich in antioxidants and essential oils possess antifouling potential. Examples include previous research on the antifouling potential of three antioxidant- and essential-oil-rich plants: Aronia mitschurinii (Aronia), Zingiber officinale (Juvenile ginger), and Ocimum tenuiflorum (Tulsi). Results from short-term tests showed that use of aronia led to a decrease in bacterial counts of up to 3.0% in freshwater and 52.2% in saltwater [23]. Meanwhile, the use of juvenile ginger extracts led to a maximum decrease of 91.9% in freshwater and 93.8% in saltwater. In comparison, the use of tulsi extracts led to a maximum 12.6% reduction in freshwater and 93.9% in saltwater [24]. Given the success of these tests, this study will further examine the potential of two antioxidant-rich algae, Fucus vesiculosus (fucus) and Arthrospira platensis (spirulina).
Fucus is an abundant species found in shallow rocky marine waters throughout the northern hemisphere [25]. Fucus has been shown to include a wide range of phytochemicals, including various carotenoids and phenolic compounds, as well as anti-inflammatory and anticarcinogenic polysaccharides, such as fucoidans and laminarans [26,27,28,29,30,31]. Fucus also possesses strong antioxidant potential, primarily due to high concentrations of phenolic compounds, including flavonoids, phenolic acids, and phlorotannins [26,27,28,29,30,31,32]. As such, fucus has been used in medicine to treat obesity, blood clot formations, rheumatoid arthritis, asthma, diabetes, skin diseases, and cancer, among other illnesses [33,34,35,36,37,38].
The antifouling properties of fucus have been the subject of several scientific studies. These studies have shown that compounds present in fucus, such as fucoidan and fucophloroglucinols, possess antifouling activity against a variety of aquatic organisms [39,40,41,42]. In particular, studies have shown that extracts from fucus inhibit the attachment and growth of barnacles on submerged surfaces and prevent the settlement of several species of microalgae [41,42]. It is believed that the presence of polysaccharides, flavonoids, and phlorotannins is responsible for these antifouling properties [42].
Spirulina can be found in highly alkaline lakes in Africa, as well as in South and Central America, Asia, and Australia, due to its tolerance of a wide range of environmental conditions, including high temperatures, low pH, and high salt concentrations [43]. Spirulina is a rich source of phytochemicals, including antioxidants, vitamins, minerals, protein, and essential fatty acids [44,45,46]. These compounds have been shown to have a range of health benefits, including reducing oxidative stress, improving cardiovascular health, and boosting the immune system [46,47].
The antifouling properties of spirulina have received significant attention due to the increasing need for environmentally friendly antifouling solutions [48]. This property is due to the presence of polysaccharides, phycocyanin, and other bioactive compounds in the algae. These compounds have been shown to inhibit a range of fouling organisms, including barnacles, hydroids, and algae [49,50]. Spirulina also contains phycocyanobilin, a derivative of phycocyanin, and phenolic compounds, which have been shown to inhibit a range of microorganisms [51,52].
Previous research using medicinal herbs and superfruits as antifouling solutions has shown differences in antifouling efficiency between saltwater and freshwater [23,24]. These differences can be attributed to variations in salinity, microbial community composition, and other conditions that influence biofilm formation. The goals of this study are to compare two algae from different aquatic environments and assess their performance in non-similar and native environments. By comparing bacterial precipitation observed in short-term tests, the extent to which environmental adaptation influences antifouling effectiveness will be presented. Spirulina is commonly associated with high-salinity conditions, where it has evolved mechanisms to tolerate osmotic stress and produce secondary metabolites that inhibit microbial growth [43]. Therefore, it is hypothesized that spirulina will exhibit superior antifouling activity in saltwater systems compared to fucus. Fucus, which is predominantly found in freshwater environments, is expected to be better adapted to the microbial conditions found there [25]. Therefore, it is anticipated that fucus will demonstrate enhanced antifouling performance when submerged in freshwater relative to spirulina.
Here, the antioxidant and essential oil content of both fucus and spirulina extracts were measured to predict their effectiveness in preventing biofilm formation caused by precipitation, such as bacteria and mineral accumulation. Then, extracts from fucus and spirulina were combined with poly(methyl methacrylate) (PMMA) and subjected to short-term antifouling tests in both freshwater and saltwater. Afterward, the antifouling potential will be assessed by precipitation analysis via phase-contrast microscopy. The final objective of these experiments was to compare the antifouling potential of spirulina and fucus with that of previously published superfruits and medicinal herbs.

2. Materials and Methods

The chemical reagents used in this study, including anhydrous aluminum chloride granules (99% extra pure), quercetin hydrate (95%), and 190 proof ethyl alcohol (95.0% ACS grade), were sourced from Thermo Fisher Scientific (Waltham, MA, USA). Fisher Scientific (Pittsburgh, PA, USA) was the source of HPLC-grade anhydrous sodium carbonate, as well as ACS-certified potassium chloride and potassium acetate. Gallic acid monohydrate and Folin & Ciocalteu’s phenol reagent were obtained from MP Biomedicals (Santa Ana, CA, USA), while Sigma-Aldrich (Saint Louis, MO, USA) was the source of sodium acetate (minimum 99.0%) and silicon oil for heating. All experimental procedures utilized double-distilled water.
For analytical measurements, an Agilent Cary 60 UV-Vis spectrophotometer (USA) was employed to quantify antioxidants. Structural and morphological assessments were performed using a Nikon Eclipse E200 LED Binocular Microscope (#846347, Japan) for high-resolution imaging and a Laxco Seba P4BP Digital Phase Contrast Microscope (#C1422-8240-0039, USA) for improved specimen contrast. To ensure uniform thin-film applications on slides, a Chemat KW-4A Spin Coater (USA) was utilized with regulated rotation speeds.

2.1. Sample Collection, Extraction, and Dilution Creation

Fucus samples were collected manually by researchers from the University of Maryland Eastern Shore. Samples were collected in Harpswell, Maine, Potts Harbor (Coordinates: 43.743239, −70.037278). After collecting, samples were rinsed with distilled water, air-dried at room temperature, vacuum-packed, and stored in a deep freezer at −22 °C. Samples were freeze-dried and coarsely powdered before extraction. Spirulina was sourced from Kate Naturals organic spirulina powder (USA) and extracted in ethyl acetate.
For extraction, 10% w/v of freeze-dried fucus was added to a 70% acetone solution in a 250 mL round-bottom flask. A 70% acetone solution was used due to its effectiveness as a polar solvent, as shown in previous research [53]. The solution was then refluxed for 72 h at 50 °C. The polar extract was then filtered with a 50 µm filter paper to remove any solids and stored in a freezer at −22 °C until phytochemical screening. The same procedure was performed for spirulina extraction. After extraction, 2×, 4×, 8×, and 16× dilutions were prepared by serial dilution with ethyl acetate from the original (1×) extraction. 2× dilution means the concentration is twice as low as the original extract, 4×—four times lower, etc.

2.2. Phytochemical UV-Vis Characterization

To analyze the phytochemical extracts, an Ultraviolet–Visible Spectrophotometer (UV-Vis) was used to determine the concentrations of various phytochemical components, expressed as grams per milliliter. This method allows for the quantification of total polyphenols, flavonoids, tannins, chlorophyll A, chlorophyll B, and carotenoid content.

2.2.1. Total Polyphenol Determination

Total polyphenol content was measured using a modified version of a method published by Singleton et al. [54]. Absorbances were measured at 750 nm and compared to a calibration curve created using gallic acid standards. Final concentrations were expressed using mg gallic acid equivalents (GAE) mg−1 of the original sample. Each sample was assessed in triplicate.
Gallic acid stock solution in 20% ethanol was prepared in triplicate at a concentration of 1000 mg L−1, with a blank of distilled water. The stock solution was diluted by a factor of 2 until the absorbance at 765 nm plateaued, indicating that the limit of detection had been reached (Figure S1).

2.2.2. Total Flavonoid Determination

Total flavonoid content was measured based on methods created by Chang et al. [55]. Samples were analyzed at 415 nm and compared to a calibration curve created using quercetin standards. Flavonoid concentration was expressed as mg quercetin equivalents (QE) mg−1 of the original sample. Each sample was assessed in triplicate.
The limit of detection was measured using a 1.5 g L−1 quercetin stock solution in 95% ethanol. This stock solution was serially diluted until the absorbance at 415 nm remained constant, indicating that the limit of detection had been reached (Figure S2).

2.2.3. Total Tannin Determination

Tannins were determined by standard procedures for colorimetric analysis of plant material described by Amin and Antoine [56,57]. Absorbances were measured at 527 nm. Tannic acid standards were used to make a calibration curve for the determination of experimental concentrations. Total tannin content was expressed in mg tannic acid equivalents (TAE) mg−1 of original sample.
The limit of detection was found using a tannic acid stock solution in 20% ethanol with a concentration of 1.5 g L−1. This dilution was then serially diluted until the absorbance at 415 nm remained constant, indicating that the limit of detection had been reached (Figure S3).

2.2.4. Total Chlorophyll Determination

The methods to calculate total chlorophyll A, chlorophyll B, and carotenoids were devised using the techniques from Yang et al. and Porra et al. [58,59]. Extracts were centrifuged at 1500 rpm for 5 min, after which the absorbance of the supernatant was measured at 440.5 nm, 646.6 nm, and 636.6 nm using a spectrophotometer. Equations to calculate chlorophyll A, chlorophyll B, and carotenoids were provided by Porra et al. (1989) and were used [58,59]:
C h l o r o p h y l l   A = 12.21 × A 636.6 n m ( 2.81 × A 646.6 n m ) ,
C h l o r o p h y l l   B = 20.13 × A 646.6 n m ( 4.19 × A 636.6 n m ) ,
C h l o r o p h y l l   A + B = 17.76 × A 646.6 n m + 7.34 × A 636.6 n m ,
C a r o t e n o i d s = 4.69 × A 440.5 n m 0.267 × C h l o r o p h y l l   A + B ,
Final concentrations are expressed in μg mL−1 of extract.

2.3. Gas Chromatography Mass Spectrometry (GC-MS) Characterization

Helium was used as the carrier gas in this Shimadzu GC-MS system, combined with a VF-5 fused silica capillary column (dimensions: 30 m × 0.25 mm, film thickness: 0.25 μm), set to flow at 1 mL min−1 at 56.756 kPa. Chromatographs for extracts were generated using a 3 °C min−1 temperature ramp to 240 °C to detect terpenes and essential oils. Chromatograms were integrated so that the base area was at least 400,000, and the detected chemicals matched within more than 90% of cases based on m/z ratios.

2.4. Water Sample Sourcing

Samples were collected at GPS-controlled sites, such as the Pocomoke River for the freshwater aquarium and the Chincoteague Oceanside for the saltwater aquarium. The locations of these sites are shown in Figure 1, which was generated using Google Maps [60].
Various water parameters, such as pH, temperature, and salinity, were measured during the process and are shown in Table 1. An AZ Instruments water-quality meter (AZ-86031) was used to measure water parameters. To preserve the bacterial microbiological populations, the water samples were heated and aerated after collection.

2.5. Slide Preparation and Short-Term Testing

After the samples were extracted, the slides were prepared using the antifouling methods previously developed by Bratley et al. [23]. For this, 10 mL of extract was combined with 1 g of PMMA, which would serve as a biocompatible adhesive, heated to 50 °C, and stirred for 1 h. After that, 200 μL of the resulting solution was applied to a glass slide using a Chemat KW-4A Spin coater. This was done by securing the slide to the spin coater under vacuum, setting the spin coater to 2000 RPM for 10 s, and dispensing the solution using a pipette for 3–5 s. The slides were then inspected to ensure a homogeneous spread of the solution was achieved. Before testing, the slides were allowed to dry, then analyzed with a phase-contrast microscope for cracks and bubbles. Slides were prepared using 1×, 2×, 4×, 8×, and 16× extraction dilutions for both spirulina and fucus, with additional control slides prepared using only PMMA.
Short-term testing was performed to evaluate the efficiency of each sample (spirulina or fucus) and to compare the efficiency of each extract dilution. For this test, a special 3D-printed slide holder was created to hold six slides, which were used for five different extract dilutions and one control. Four Rubbermaid containers were used in this process to allow for different water types and staining to happen simultaneously. Two containers held freshwater or saltwater without additives, and a second set held water dyed with methylene blue. Slides were then removed after 3 weeks of exposure for analysis.

2.6. Bacterial Analysis

Bacterial analysis was performed using an Aquabiomics DNA testing kit, following the same methodology as Bratley et al. [23]. For this, slides were rinsed with deionized water, allowed to dry, and then were swabbed and sent to an Aquabiomics facility for bacterial analysis. Water sampling both before and after analysis ensures consistent bacteria content throughout the test.
All surface analyses using phase contrast were also performed using the methods described by Bratley et al. [23]. In these methods, a phase-contrast microscope was used for high-resolution imaging, enabling further analysis with ImageJ software. To calculate bacterial precipitation, ImageJ was used before and after each test to ensure there was no contamination or delamination due to human error.

2.7. Statistics

Experiments and measurements were conducted in triplicate and then analyzed using a one-way analysis of variance (ANOVA) with 95% confidence. A p-value of <0.5 indicated significance.

3. Results

3.1. Phytochemical Characterization of Fucus Extracts

Phytochemical analysis for FV is shown in Table 2. The different dilutions of each extract were characterized for antifouling testing purposes. A higher concentration of phytochemicals has been shown to provide improved antifouling protection when compared to a control [23,24]. Table 2 demonstrates the average concentration of polyphenols, flavonoids, and tannins extracted from freeze-dried FV using 70% acetone as the extraction solvent. The medicinal herbs ginger and basil show lower phytochemical concentrations at both 1× and 16× than fucus [24]. Aronia also has lower phytochemical concentrations than fucus, but it is known to contain anthocyanins that may contribute to its antifouling efficiency [23].
Table 3 presents the average concentrations of chlorophyll A, B, and carotenoids extracted from freeze-dried fucus using 70% acetone. The concentration of chlorophyll A decreased with increasing extract dilution, with an average of 2.20 μg mL−1 at 1× dilution. Chlorophyll B also showed a similar trend, with the highest average concentration of 4.12 μg mL−1 at 1× dilution. Carotenoids showed the highest concentration among all pigments, with an average of 25.29 μg mL−1 at 1× dilution.
Table 4 represents the GC-MS results for fucus. The presence of neophytadiene, palmitic acid, and oleic acid in the sample verified fucus’ potential for antifouling applications, as these chemicals are known to have antibacterial activities. The complete chromatogram is shown in Figure S4 of the Supplemental File.

3.2. Phytochemical Characterization of Spirulina Extracts

The average concentrations of polyphenols, flavonoids, and tannins extracted from freeze-dried spirulina using 70% acetone at various dilutions are shown in Table 5. The findings reveal that polyphenol, flavonoid, and tannin concentrations decrease with increasing extraction dilution; the highest average concentrations of 13.60 mg GAE g−1, 4.32 mg QE g−1, and 68.89 mg TAE g−1 were observed at the 1× dilution. Similarly to fucus, spirulina also shows higher phytochemical concentrations than aronia, ginger, and tulsi [23,24].
The average concentration of chlorophyll A, B, and carotenoids extracted from freeze-dried spirulina using 70% acetone is shown in Table 6. At an average concentration of 54.48 μg mL−1 for the 1× dilution, Chlorophyll A concentration decreased as the extract dilution increased. At the 1× dilution, chlorophyll B likewise showed the highest average concentration of 52.27 μg mL−1. Carotenoids, on the other hand, had the lowest average concentration of any pigment, averaging 0.42 μg mL−1 for the 1× dilution.
The GC-MS results for spirulina are shown in Table 7 below. Similarly to fucus, spirulina contains known compounds with potent antimicrobial properties that can assist with antifouling. The complete chromatogram is shown in Figure S5 of the Supplemental File.

3.3. Phase Contrast Microscopy Short-Term Antifouling Tests

Research has shown that Asparagopsis armata and Sargassum muticum can inhibit between 49–59% and 30–50% of biofilm formation, respectively [75]. This can be contrasted with a study that used Hempel’s A/f Economic SP-SEA 74030/50300, which contains tributylin methacrylate and tributyltin oxide, and showed 95% bacterial coverage after three months of immersion [76]. To compare the performance of algae adapted to different aquatic environments and their antifouling efficiency with that of previously studied superfruits and medicinal herbs, the precipitation-based results were interpreted in the context of existing antifouling literature.
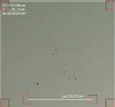
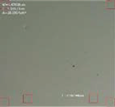
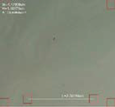
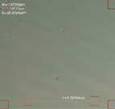
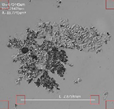
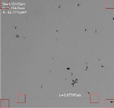
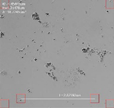
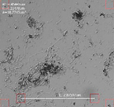
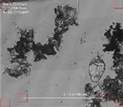
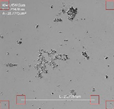
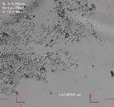
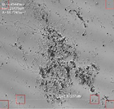
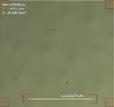
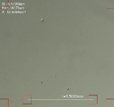
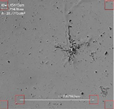
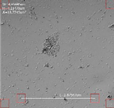
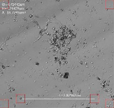
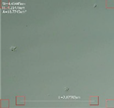
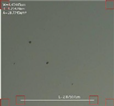
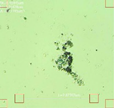
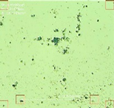
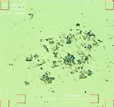
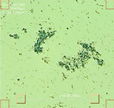
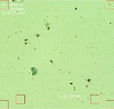
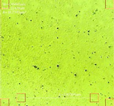
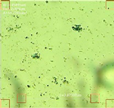
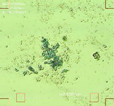
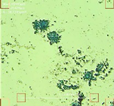
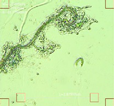
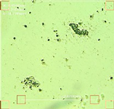
Table 8 shows phase-contrast microscopy images of slides submerged in freshwater and saltwater. Slides were coated with strictly PMMA as a control, allowing any interference of PMMA with precipitation potential to be assessed, or with fucus extract combined with PMMA, for which PMMA was used as a biocompatible adhesive. In both sets of water, as the dilution factor increased, the total precipitation also increased. When comparing freshwater and saltwater slides, darker patches appear on the freshwater slides. However, a larger area seems to be covered by saltwater slides than by freshwater slides. The most concentrated samples of protected slides show significant inhibition of biofilm growth. The impact weakens as the concentration of fucus extract in formulations diminishes.
The numeric comparison of the slides is presented in Table 9. Significantly higher precipitation levels are observed in saltwater, except in the 4× dilution, where saltwater shows a significant drop in precipitation. These results indicate that as the dilution factor increases, the overall slide protection decreases. When compared with aronia, juvenile ginger, and tulsi, fucus performs significantly better than aronia; however, it lags behind holy basil and ginger in freshwater. However, in saltwater, fucus performs better than the control up to a 16× dilution and outperforms ginger.
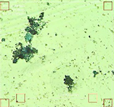
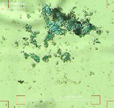
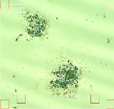
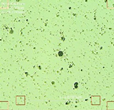
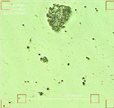
Spirulina and control slides immersed in freshwater and saltwater are displayed in Table 10. The green color on the slides is less noticeable as the slides get diluted, which is comparable to the chlorophyll results. The spirulina slides exhibit increased fouling as the dilution factor rises, much like fucus-covered slides. Additionally, compared to freshwater slides, a greater area is typically still covered by saltwater slides.
The precipitation calculations for spirulina in freshwater and saltwater are compared in Table 11. Spirulina has significantly more precipitation at the 1× value when compared to tulsi, juvenile ginger, and fucus. However, spirulina shows less precipitation at the 16× value than the control and freshwater fucus. This data also indicates that as the dilution factor increased, spirulina protection decreased.
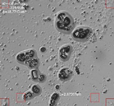
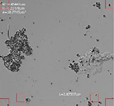
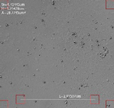
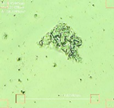
Table 12 shows the impact of methylene blue staining on fucus slides. Unlike previous slides, methylene blue-stained slides should show only bacteria. With only bacteria showing, salt and other minerals that may stick to the surface of fouling will not be included in the count.
Table 13 shows the calculated bacterial precipitation found on methylene blue-treated fucus slides. Unlike previous examples, freshwater slides start with a higher precipitation count and remain relatively consistent until 16×. A similar trend is observed in the saltwater slides; however, the jump in precipitation is much larger at the 16× dilution. Compared to the control, the extract is comparable up to 8× in both freshwater and saltwater. At the 1× dilution, fucus shows better freshwater protection than aronia and tulsi; however, it shows less protection in saltwater than basil and ginger.
Table 14 contrasts a control slide with spirulina-covered slides immersed in freshwater and saltwater dyed with methylene blue. Like before, as the dilution factor increases, so does visible precipitation on the slides.
Table 15 shows the calculation of bacteria precipitation from methylene blue spirulina slides. Overall, spirulina performs better in freshwater than fucus but performs worse in saltwater at the 8× dilution point and beyond. Compared to the control, spirulina performs better up to the 16× dilution in both freshwater and saltwater. Compared to aronia and tulsi, spirulina does much better in freshwater. In saltwater, all other crops show slightly less protection, with aronia showing significantly greater precipitation.

4. Conclusions

Spirulina and fucus both show promising levels of key phytochemicals, including polyphenols and flavonoids, known to prevent radical formation. GC-MS results indicate the presence of essential oils known to prevent bacterial growth and formation. Short-term antifouling tests suggest that spirulina is particularly effective in saltwater, with a bacterial count of 6.6 ± 1.3 per mm, compared with fucus, which showed a count of 14.0 ± 0.7 per mm. In freshwater, spirulina showed bacterial counts of 13.9 ± 2.8 per mm, and fucus showed 41.4 ± 2.0 per mm. Spirulina performs best among algae and in saltwater.
Compared with other medicinal herbs and superfruits, spirulina performs best in saltwater. For fucus, the algae performs better than tulsi, aronia, and the control, but not better than ginger and spirulina in freshwater. Phytochemical results show that these algae have lower phytochemical concentrations than the other previously mentioned crops [23,24]. However, these microorganisms still perform best in their native environment.
Based on this study’s findings, spirulina could be the best option for antifouling use in saltwater compared to fucus, tulsi, ginger, and aronia. This performance likely reflects spirulina’s adaptation to high-salinity environments and its production of secondary metabolites that inhibit microbial growth. To better understand the mechanisms of antifouling and the effects of natural compounds, future research will focus on individual compounds found in spirulina. Future research will also assess the toxicity of PMMA formulations using model organisms to ensure the proposed solution is non-toxic.

Supplementary Materials

The following supporting information can be downloaded at: https://www.mdpi.com/article/10.3390/app16020642/s1, Figure S1: Limit of Detection: Gallic Acid; Figure S2: Limit of Detection: Quercetin; Figure S3: Limit of Detection: Tannic Acid; Figure S4: GC-MS Results of Fucus; Figure S5: GC-MS Results of Spirulina; Figure S6: Average Polyphenol, Flavonoid, and Tannin Concentrations Extracted from Freeze Dried Fucus with Acetone.

Author Contributions

Conceptualization, V.V.V.; methodology, V.V.V.; software, E.E.C.; validation, V.V.V.; formal analysis, E.E.C., T.F.; investigation, V.V.V.; resources, V.V.V.; data curation, E.E.C.; writing—original draft preparation, E.E.C., T.F., S.L., P.S.; writing—review and editing, E.E.C., V.V.V.; visualization, V.V.V.; supervision, V.V.V.; project administration, V.V.V.; funding acquisition, V.V.V. All authors have read and agreed to the published version of the manuscript.

Funding

This research is supported by a DOD NAVY-MSI grant and distinguished faculty fellowship for PI, Dr. Victoria V. Volkis, N0014-21-1-2756, and postdoctoral training supplement N0014-21-1-2756.P1 for Dr. Travis Ford.

Institutional Review Board Statement

Not applicable.

Informed Consent Statement

Not applicable.

Data Availability Statement

The original contributions presented in this study are included in the article.

Acknowledgments

We want to thank Evgueni Nesterov from Northern Illinois University for his input on surface analysis and for allowing us to use the profilometer in his lab. We also thank Sexton from the University of Maryland Eastern Shore for her assistance with water and algae sampling, and the UMES research boat facility for providing boats for sampling. Additionally, we express our gratitude to William Weaver from the Department of Natural Sciences at UMES for his assistance with maintaining the aquariums.

Conflicts of Interest

The authors declare no conflict of interest.

Abbreviations

The following abbreviations are used in this manuscript:
UV-VisUV-Visible spectrophotometry
GC-MSGas Chromatography Mass Spectrometry
EPSExtracellular Polymeric Substrate
μLMicroliter
mLMilliliters
GAEGallic Acid Equivalents
QEQuercetin Equivalents
TAETannic Acid Equivalents
PMMAPoly-Methyl Methacrylate
FWFreshwater
SWSaltwater
Original non-diluted extract
Extract diluted twice,
Extract diluted four times.
Extract diluted 8 times.

References

  1. Callow, M.E.; Callow, J.E. Marine biofouling: A sticky problem. Biologist 2002, 49, 10–14. [Google Scholar]
  2. Wahl, M. Marine epibiosis. I. Fouling and antifouling: Some basic aspects. Mar. Ecol. Prog. Ser. 1989, 58, 175–189. [Google Scholar] [CrossRef]
  3. Kim, J.; Park, H.-D.; Chung, S. Microfluidic Approaches to Bacterial Biofilm Formation. Molecules 2012, 17, 9818–9834. [Google Scholar] [CrossRef]
  4. Vogeleer, P.; Tremblay, Y.D.; Mafu, A.A.; Jacques, M.; Harel, J. Life on the outside: Role of biofilms in environmental persistence of Shiga-toxin producing Escherichia coli. Front. Microbiol. 2014, 5, 317. [Google Scholar] [CrossRef]
  5. Herzberg, M.; Kang, S.; Elimelech, M. Role of extracellular polymeric substances (EPS) in biofouling of reverse osmosis membranes. Environ. Sci. Technol. 2009, 43, 4393–4398. [Google Scholar] [CrossRef]
  6. Vasudevan, R. Biofilms: Microbial cities of scientific significance. J. Microbiol. Exp. 2014, 1, 84–98. [Google Scholar] [CrossRef]
  7. Rabin, N.; Zheng, Y.; Opoku-Temeng, C.; Du, Y.; Bonsu, E.; Sintim, H.O. Biofilm formation mechanisms and targets for developing antibiofilm agents. Future Med. Chem. 2015, 7, 493–512. [Google Scholar] [CrossRef] [PubMed]
  8. Adams, C.M.; Shumway, S.E.; Whitlatch, R.B.; Getchis, T. Biofouling in Marine Molluscan Shellfish Aquaculture: A Survey Assessing the Business and Economic Implications of Mitigation. J. World Aquac. Soc. 2011, 42, 242–252. [Google Scholar] [CrossRef]
  9. Bannister, J.; Sievers, M.; Bush, F.; Bloecher, N. Biofouling in marine aquaculture: A review of recent research and developments. Biofouling 2019, 35, 631–648. [Google Scholar] [CrossRef] [PubMed]
  10. Kushkevych, I.; Abdulina, D.; Kováč, J.; Dordević, D.; Vítězová, M.; Iutynska, G.; Rittmann, S.K.M. Adeno-sine-5′-Phosphosulfate-and Sulfite Reductases Activities of Sulfate-Reducing Bacteria from Various Environments. Biomolecules 2020, 10, 921. [Google Scholar] [CrossRef]
  11. Richmond, M.D.; Seed, R. A review of marine macrofouling communities with special reference to animal fouling. Biofouling 1991, 3, 151–168. [Google Scholar] [CrossRef]
  12. Railkin, A.I. Marine Biofouling: Colonization Processes and Defenses, 1st ed.; CRC Press: Boca Raton, FL, USA, 2003. [Google Scholar] [CrossRef]
  13. Schultz, M.P. Effects of coating roughness and biofouling on ship resistance and powering. Biofouling 2007, 23, 331–341. [Google Scholar] [CrossRef]
  14. Rajitha, K.; Nancharaiah, Y.; Venugopalan, V. Insight into bacterial biofilm-barnacle larvae interactions for environmentally benign antifouling strategies. Int. Biodeterior. Biodegrad. 2020, 149, 104937. [Google Scholar] [CrossRef]
  15. Dyck, A.J.; Sumaila, U.R. Economic impact of ocean fish populations in the global fishery. J. Bioeconomics 2010, 12, 227–243. [Google Scholar] [CrossRef]
  16. Pérez, M.; García, M.; Sánchez, M.; Stupak, M.; Mazzuca, M.; Palermo, J.A.; Blustein, G. Effect of secochiliolide acid isolated from the Patagonian shrub Nardophyllum bryoides as active component in antifouling paints. Int. Biodeterior. Biodegrad. 2014, 89, 37–44. [Google Scholar] [CrossRef]
  17. Burande, B.P.; Dhakite, P.D.; Gogte, B.B. Development of Green Ecofriendly Products Based on Natural Vegetation. Int. J. Adv. Inn. Res. 1998, 4, 132–134. [Google Scholar]
  18. Acevedo, M.S.; Puentes, C.; Carreño, K.; León, J.G.; Stupak, M.; García, M.; Blustein, G. Antifouling paints based on marine natural products from Colombian Caribbean. Int. Biodeterior. Biodegrad. 2013, 83, 97–104. [Google Scholar] [CrossRef]
  19. Sánchez-Lozano, I.; Hernández-Guerrero, C.J.; Muñoz-Ochoa, M.; Hellio, C. Biomimetic Approaches for the Development of New Antifouling Solutions: Study of Incorporation of Macroalgae and Sponge Extracts for the Development of New Environmentally-Friendly Coatings. Int. J. Mol. Sci. 2019, 20, 4863. [Google Scholar] [CrossRef]
  20. Kaczerewska, O.; Sousa, I.; Martins, R.; Figueiredo, J.; Loureiro, S.; Tedim, J. Gemini surfactant as a template agent for the synthesis of more eco-friendly silica nanocapsules. Appl. Sci. 2020, 10, 8085. [Google Scholar] [CrossRef]
  21. Harrison, T.; Gilmour, G.; McNeill, M.; Armour, N.; McIlroy, L. Survey of imposex in Nucella lapillus as an indicator of tributyltin pollution in Northern Irish coastal waters, 2004 to 2017. Mar. Pollut. Bull. 2020, 159, 111474. [Google Scholar] [CrossRef]
  22. Alzieu, C. Impact of Tributyltin on Marine Invertebrates. Ecotoxicology 2000, 9, 71–76. [Google Scholar] [CrossRef]
  23. Bratley, K.; Cable, E.E.; Weaver, W.; Volkis, V.V. Aronia mitschurinii Encapsulated into a Biocompatible Polymer as an Effective Solution for Antifouling Protection. ACS Omega 2025, 10, 54098–54110. [Google Scholar] [CrossRef]
  24. Cable, E.E.; Bratley, K.; Buzzetto-More, R.; Sylla, B.; Lahoff, S.; Weaver, W.L.; Volkis, V.V. Natural Approach in Antifouling Protection: Comparison of Aronia mitschurinii, Holy Basil, and Juvenile Ginger in Short-Term Antifouling Tests. Preprints 2025, 2025091339. [Google Scholar] [CrossRef]
  25. Holdt, S.L.; Kraan, S. Bioactive compounds in seaweed: Functional food applications and legislation. J. Appl. Phycol. 2011, 23, 543–597. [Google Scholar] [CrossRef]
  26. Catarino, A.I.; Macchia, V.; Sanderson, W.G.; Thompson, R.C.; Henry, T.B. Low levels of microplastics (MP) in wild mussels indicate that MP ingestion by humans is minimal compared to exposure via household fibres fallout during a meal. Environ. Pollut. 2018, 237, 675–684. [Google Scholar] [CrossRef] [PubMed]
  27. Ayrapetyan, O.N.; Obluchinskaya, E.D.; Zhurishkina, E.V.; Skorik, Y.A.; Lebedev, D.V.; Kulminskaya, A.A.; Lapina, I.M. Antibacterial Properties of Fucoidans from the Brown Algae Fucus vesiculosus L. of the Barents Sea. Biology 2021, 10, 67. [Google Scholar] [CrossRef] [PubMed]
  28. Obluchinskaya, E.D.; Pozharitskaya, O.N.; Zakharov, D.V.; Flisyuk, E.V.; Terninko, I.I.; Generalova, Y.E.; Smekhova, I.E.; Shikov, A.N. The Biochemical Composition and Antioxidant Properties of Fucus vesiculosus from the Arctic Region. Mar. Drugs 2022, 20, 193. [Google Scholar] [CrossRef]
  29. Zayed, A.; Muffler, K.; Hahn, T.; Rupp, S.; Finkelmeier, D.; Burger-Kentischer, A.; Ulber, R. Physicochemical and Biological Characterization of Fucoidan from Fucus vesiculosus Purified by Dye Affinity Chromatography. Mar. Drugs 2016, 14, 79. [Google Scholar] [CrossRef]
  30. Ferreira, R.M.; Ramalho Ribeiro, A.; Patinha, C.; Silva, A.M.S.; Cardoso, S.M.; Costa, R. Water Extraction Kinetics of Bioactive Compounds of Fucus vesiculosus. Molecules 2019, 24, 3408. [Google Scholar] [CrossRef]
  31. Silva, M.M.C.L.; dos Santos Lisboa, L.; Paiva, W.S.; Batista, L.A.N.C.; Luchiari, A.C.; Rocha, H.A.O.; Camara, R.B.G. Comparison of in vitro and in vivo antioxidant activities of commercial fucoidans from Macrocystis pyrifera, Undaria pinnatifida, and Fucus vesiculosus. Int. J. Biol. Macromol. 2022, 216, 757–767. [Google Scholar] [CrossRef] [PubMed]
  32. Wang, T.; Jónsdóttir, R.; Liu, H.; Gu, L.; Kristinsson, H.G.; Raghavan, S.; Ólafsdóttir, G. Antioxidant capacities of phlorotannins extracted from the brown algae Fucus vesiculosus. J. Agric. Food Chem. 2012, 60, 5874–5883. [Google Scholar] [CrossRef]
  33. Küpper, F.C.; Feiters, M.C.; Olofsson, B.; Kaiho, T.; Yanagida, S.; Zimmermann, M.B.; Carpenter, L.J.; Luther, G.W., III; Lu, Z.; Jonsson, M.; et al. Commemorating Two Centuries of Iodine Research: An Interdisciplinary Overview of Current Research. Angew. Chem. Int. Ed. 2011, 50, 11598–11620. [Google Scholar] [CrossRef]
  34. Pereira, L. A review of the nutrient composition of selected edible seaweeds. In Seaweed: Ecology, Nutrient Composition and Medicinal Uses; Pomin, V.H., Ed.; Nova Science Publishers, Inc.: Hauppauge, NY, USA, 2011; pp. 15–47. [Google Scholar]
  35. Ale, M.T.; Mikkelsen, J.D.; Meyer, A.S. Important determinants for fucoidan bioactivity: A critical review of structure-function relations and extraction methods for fucose-containing sulfated polysaccharides from brown seaweeds. Mar. Drugs 2011, 9, 2106–2130. [Google Scholar] [CrossRef]
  36. Laekeman, G. Assessment Report on Fucus vesiculosus L., Thallus Herbal Preparations in Solid Dosage form for Oral Use; European Medicines Agency: London, UK, 2014. [Google Scholar]
  37. Min, S.K.; Han, S.M.; Kim, H.T.; Kwon, O.C.; Lee, S.; Kim, J.K. Algal fucoidan, unlike heparin, has thrombolytic activity in a murine arterial thrombosis model. BLFIE7 2012, 23, 359–366. [Google Scholar] [CrossRef]
  38. Liu, H.; Gu, L. Phlorotannins from brown algae (Fucus vesiculosus) inhibited the formation of advanced glycation endproducts by scavenging reactive carbonyls. J. Agric. Food Chem. 2012, 60, 1326–1334. [Google Scholar] [CrossRef]
  39. Brock, E.; Nylund, G.M.; Pavia, H. Chemical inhibition of barnacle larval settlement by the brown alga Fucus vesiculosus. Mar. Ecol. Prog. Ser. 2007, 337, 165–174. [Google Scholar] [CrossRef][Green Version]
  40. Rickert, E.; Karsten, U.; Pohnert, G.; Wahl, M. Seasonal fluctuations in chemical defenses against macro-fouling in Fucus vesiculosus and Fucus serratus from the Baltic Sea. Biofouling 2015, 31, 363–377. [Google Scholar] [CrossRef] [PubMed]
  41. Lachnit, T.; Blumel, M.; Imhoff, J.F.; Wahl, M. Specific epibacterial communities on macroalgae: Phylogeny matters more than habitat. Aquat. Biol. 2009, 5, 181–186. [Google Scholar] [CrossRef]
  42. Wahl, M.; Shahnaz, L.; Dobretsov, S.; Saha, M.; Symanowski, F.; David, K.; Lachnit, T.; Vasel, M.; Weinberger, F. Ecology of antifouling resistance in the bladder wrack Fucus vesiculosus: Patterns of microfouling and antimicrobial protection. Mar. Ecol. Prog. Ser. 2010, 411, 33–48. [Google Scholar] [CrossRef]
  43. Falkowski, P.G.; Katz, M.E.; Knoll, A.H.; Quigg, A.; Raven, J.A.; Schofield, O.; Taylor, F.J.R. The evolution of modern eukaryotic phytoplankton. Science 2004, 305, 354–360. [Google Scholar] [CrossRef]
  44. Ismail, M.M.; Noaman, N.H. Biochemical profile, nutritional value, and biological activities of Arthrospira platensis. Hydrobiol. J. 2022, 58, 56–80. [Google Scholar] [CrossRef]
  45. Khansole, G.; Gachande, B. Physiochemical Analysis of Aqueous Extract from Arthrospira platensis. IJCPS 2018, 7, 18–20. [Google Scholar]
  46. Han, P.; Li, J.; Zhong, H.; Xie, J.; Zhang, P.; Lu, Q.; Li, J.; Xu, P.; Chen, P.; Leng, L.; et al. Anti-oxidation properties and therapeutic potentials of spirulina. Algal Res. 2021, 55, 102240. [Google Scholar] [CrossRef]
  47. Wu, Q.; Liu, L.; Miron, A. The antioxidant, immunomodulatory, and anti-inflammatory activities of Spirulina: An overview. Arch. Toxicol. 2016, 90, 1817–1840. [Google Scholar] [CrossRef]
  48. Bhadury, P.; Wright, P.C. Exploitation of marine algae: Biogenic compounds for potential antifouling applications. Planta 2004, 219, 561–578. [Google Scholar] [CrossRef]
  49. Abdel-Moneim, A.-M.E.; El-Saadony, M.T.; Shehata, A.M.; Saad, A.M.; Aldhumri, S.A.; Ouda, S.M.; Mesalam, N.M. Antioxidant and antimicrobial activities of Spirulina platensis extracts and biogenic selenium nanoparticles against selected pathogenic bacteria and fungi. Saudi J. Biol. Sci. 2021, 29, 1197–1209. [Google Scholar] [CrossRef]
  50. Wajda, Ł.; Rękas, Z.; Tarko, T.; Duda-Chodak, A.; Liebersbach, A.; Makarewicz, M. Dried Biomass of Arthrospira platensis Inhibits Growth of Aureobasidium pullulans LW14 and Some Bacteria When Added to Unpasteurized Apple Juice. Indian J. Microbiol. 2020, 60, 346–352. [Google Scholar] [CrossRef]
  51. Mobin, S.; Alam, F. Some promising microalgal species for commercial applications: A review. Energy Procedia 2017, 110, 510–517. [Google Scholar] [CrossRef]
  52. Mobin, S.M.; Chowdhury, H.; Alam, F. Commercially important bioproducts from microalgae and their current applications–A review. Energy Procedia 2019, 160, 752–760. [Google Scholar] [CrossRef]
  53. Koivikko, R.; Loponen, J.; Honkanen, T.; Jormalainen, V. Contents of Soluble, Cell-Wall-Bound and Exuded Phlorotannins in The Brown Alga Fucus vesiculosus, with Implications on their Ecological Functions. J. Chem. Ecol. 2005, 31, 195–212. [Google Scholar] [CrossRef]
  54. Singleton, V.L.; Rossi, J.A. Colorimetry of Total Phenolics with Phosphomolybdic-Phosphotungstic Acid Reagents. Am. J. Enol. Vitic. 1965, 16, 144–158. [Google Scholar] [CrossRef]
  55. Chang, C.C.; Yang, M.H.; Wen, H.M.; Chern, J.-C. Estimation of Total Flavonoid Content in Propolis by Two Complementary Colometric Methods. J. Food Drug. Anal. 2002, 10, 3. [Google Scholar] [CrossRef]
  56. Amin, A.S. Utilization of Tetrazolium Blue for the Colorimetric Assay of Tannins in Tea. Microchim. Acta 1997, 126, 105–108. [Google Scholar] [CrossRef]
  57. Antoine, M.L.; Simon, C.; Pizzi, A. UV Spectrophotometric Method for Polyphenolic Tannin Analysis. J. Appl. Polym. Sci. 2003, 91, 2729–2732. [Google Scholar] [CrossRef]
  58. Yang, C.M.; Chang, K.W.; Yin, M.H.; Huang, H.M. Methods for the determination of chlorophylls and their derivatives. Taiwania 1998, 43, 116–122. [Google Scholar]
  59. Porra, R.J.; Thompson, W.A.; Kriedemann, P.E. Determination of accurate extinction coefficients and simultaneous equations for assaying chlorophylls a and b extracted with four different solvents: Verification of the concentration of chlorophyll standards by atomic absorption spectroscopy. Biochim. Biophys. Acta Bioenerg. 1989, 975, 384–394. [Google Scholar] [CrossRef]
  60. Google. Goole Maps. Available online: https://www.google.com/maps (accessed on 16 December 2025).
  61. Zhou, B.; Wang, L.; Yang, S.; Liang, Y.; Zhang, Y.; Liu, X.; Pan, X.; Li, J. Pyrogallol Protects against Influenza a Virus-Triggered Lethal Lung Injury by Activating the Nrf2–PPAR-γ–HO-1 Signaling Axis. MedComm 2024, 5, e531. [Google Scholar] [CrossRef] [PubMed]
  62. Castelo, J.; Araujo-Aris, S.; Barriales, D.; Pasco, S.T.; Seoane, I.; Peña-Cearra, A.; Palacios, A.; Simó, C.; Garcia-Cañas, V.; Khamwong, M.; et al. The Microbiota Metabolite, Phloroglucinol, Confers Long-Term Protection against Inflammation. Gut Microbes 2024, 16, 2438829. [Google Scholar] [CrossRef]
  63. Trivedi, V.; Bhomia, R.; Mitchell, J.C. Myristic Acid Coated Protein Immobilised Mesoporous Silica Particles as PH Induced Oral Delivery System for the Delivery of Biomolecules. Pharmaceuticals 2019, 12, 153. [Google Scholar] [CrossRef] [PubMed]
  64. Jin, X.; Zhou, J.; Richey, G.; Wang, M.; Hong, S.M.C.; Hong, S.H. Undecanoic Acid, Lauric Acid, and N-Tridecanoic Acid Inhibit Escherichia coli Persistence and Biofilm Formation. J. Microbiol. Biotechnol. 2021, 31, 130–136. [Google Scholar] [CrossRef]
  65. Gonzalez-Rivera, M.L.; Barragan-Galvez, J.C.; Gasca-Martínez, D.; Hidalgo-Figueroa, S.; Isiordia-Espinoza, M.; Alonso-Castro, A.J. In Vivo Neuropharmacological Effects of Neophytadiene. Molecules 2023, 28, 3457. [Google Scholar] [CrossRef] [PubMed]
  66. Casillas-Vargas, G.; Ocasio-Malavé, C.; Medina, S.; Morales-Guzmán, C.; Del Valle, R.G.; Carballeira, N.M.; Sanabria-Ríos, D.J. Antibacterial Fatty Acids: An Update of Possible Mechanisms of Action and Implications in the Development of the Next-Generation of Antibacterial Agents. Prog. Lipid Res. 2021, 82, 101093. [Google Scholar] [CrossRef] [PubMed]
  67. Santa-María, C.; López-Enríquez, S.; Montserrat-de la Paz, S.; Geniz, I.; Reyes-Quiroz, M.E.; Moreno, M.; Palomares, F.; Sobrino, F.; Alba, G. Update on Anti-Inflammatory Molecular Mechanisms Induced by Oleic Acid. Nutrients 2023, 15, 224. [Google Scholar] [CrossRef] [PubMed]
  68. Meinita, M.D.N.; Harwanto, D.; Tirtawijaya, G.; Negara, B.F.S.P.; Sohn, J.-H.; Kim, J.-S.; Choi, J.-S. Fucosterol of Marine Macroalgae: Bioactivity, Safety and Toxicity on Organism. Mar. Drugs 2021, 19, 545. [Google Scholar] [CrossRef]
  69. Muzahid, A.A.; Sharmin, S.; Hossain, S.; Ahamed, K.U.; Ahmed, N.; Yeasmin, M.S.; Ahmed, N.U.; Saha, B.K.; Rana, G.M.M.; Maitra, B.; et al. Analysis of Bioactive Compounds Present in Different Crude Extracts of Benincasa Hispida and Cucurbita Moschata Seeds by Gas Chromatography-Mass Spectrometry. Heliyon 2022, 9, e12702. [Google Scholar] [CrossRef]
  70. Pathak, M.; Sarma, H.K.; Bhattacharyya, K.G.; Subudhi, S.; Bisht, V.; Lal, B.; Devi, A. Characterization of a Novel Polymeric Bioflocculant Produced from Bacterial Utilization of N-Hexadecane and Its Application in Removal of Heavy Metals. Front. Microbiol. 2017, 8, 170. [Google Scholar] [CrossRef]
  71. Gibbons, J.; Gu, L.; Zhu, H.; Gibbons, W.; Zhou, R. Identification of Two Genes Required for Heptadecane Production in a N2-Fixing Cyanobacterium Anabaena Sp. Strain PCC 7120. AMB Express 2018, 8, 167. [Google Scholar] [CrossRef]
  72. Romer, J.; Gutbrod, K.; Schuppener, A.; Melzer, M.; Müller-Schüssele, S.J.; Meyer, A.J.; Dörmann, P. Tocopherol and Phylloquinone Biosynthesis in Chloroplasts Requires the Phytol Kinase VITAMIN E PATHWAY GENE5 (VTE5) and the Farnesol Kinase (FOLK). Plant Cell 2023, 36, 1140–1158. [Google Scholar] [CrossRef]
  73. Kapoor, R.; Huang, Y.-S. Gamma Linolenic Acid: An Antiinflammatory Omega-6 Fatty Acid. Curr. Pharm. Biotechnol. 2006, 7, 531–534. [Google Scholar] [CrossRef]
  74. Schade, D.S.; Shey, L.; Eaton, R.P. Cholesterol Review: A Metabolically Important Molecule. Endocr. Pract. 2020, 26, 1514–1523. [Google Scholar] [CrossRef]
  75. Pinteus, S.; Lemos, M.F.L.; Alves, C.; Silva, J.; Pedrosa, R. The Marine Invasive Seaweeds Asparagopsis Armata and Sargassum Muticum as Targets for Greener Antifouling Solutions. Sci. Total Environ. 2021, 750, 141372. [Google Scholar] [CrossRef] [PubMed]
  76. Jelic-Mrcelic, G.; Sliskovic, M.; Antolic, B. Biofouling Communities on Test Panels Coated with TBT and TBT-Free Copper Based Antifouling Paints. Biofouling 2006, 22, 293–302. [Google Scholar] [CrossRef] [PubMed]
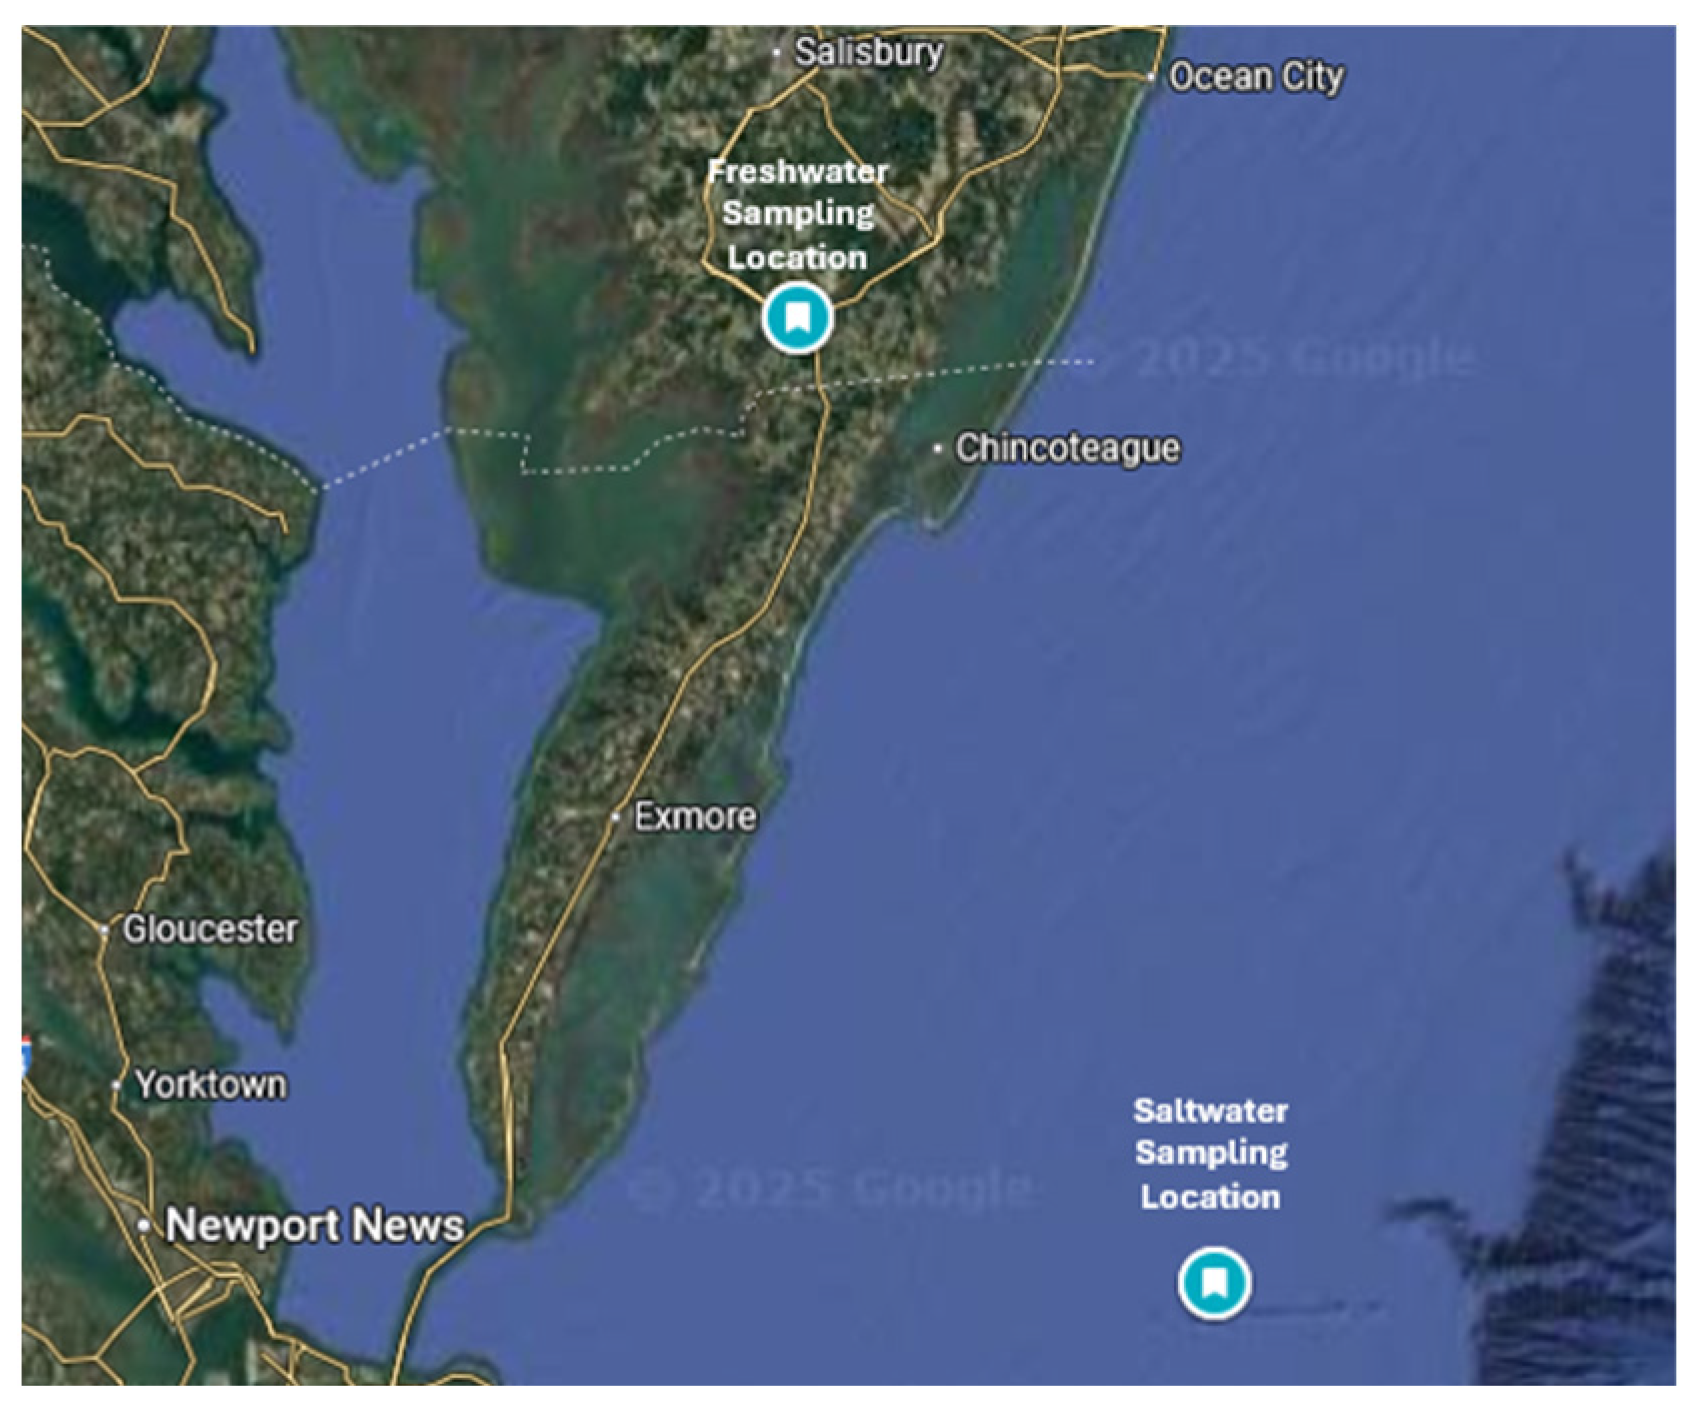
Figure 1. Map of Water Sampling Locations.
Applsci 16 00642 g001
Table 1. Characteristics and locations of water samples.
LocationCoordinatespHTemperature (°C)Salinity
(ppt)
Dissolved Oxygen (mg L−1)
Chincoteague Oceanside37.023800,
−74.998900
8.1217.926.811.76
Pocomoke River38.076500,
−75.570600
7.6215.50.0811.94
Table 2. Average Phytochemical Concentration per Dilution Factor in Fucus at the Lowest and Highest Dilutions.
DilutionPolyphenols
(mg GAE g−1)
Flavonoids
(mg QE g−1)
Tannins
(mg TAE g−1)
AverageStandard
Error
AverageStandard
Error
AverageStandard
Error
43.772.3217.792.1836.071.77
16×2.930.411.080.112.370.55
Table 3. Average Chlorophyll and Carotenoid Concentration per Dilution in Fucus at the Lowest and Highest Dilutions.
DilutionChlorophyll A
(μg mL−1)
Chlorophyll B
(μg mL−1)
Carotenoids
(μg mL−1)
2.204.1225.29
16×0.1720.3151.76
Table 4. GC-MS Results for Fucus.
PeakGeneric NameIUPAC NameFormulaFunction
1PyrogallolBenzene-1,2,3-triolC6H6O3Oxygen Scavenger, anti-inflammatory properties [61]
2PhloroglucinolBenzene-1,3,5-triolC6H6O3Secondary metabolite, anti-inflammatory [62]
3Myristic AcidTetradecanoic acidC14H28O2Emulsifier, protein stabilizer [63]
4Tridecyclic acidTridecanoic acidC13H26O2Fatty acid, antimicrobial properties [64]
5Neophytadiene7,11,15-trimethyl-3-methylidenehexadec-1-eneC20H38Anti-inflammatory, antimicrobial, and antioxidant properties [65]
6Palmitic acidHexadecanoic acidC16H32O2Antimicrobial activity, emollient [66]
7Oleic Acid(9Z)-Octadec-9-enoic acidC18H34O2Surfactant, anti-inflammatory effects [67]
8Fucosterol(3β,24E)-stigmasta-5,24(28)-dien-3-olC29H48OMarine sterol, antioxidant, antifouling activity [68]
913-OctadecenalE-13-OctadecenalC18H34OAntimicrobial properties [69]
Table 5. Average Phytochemical Concentration Extracted from Spirulina with Acetone at the Lowest and Highest Extract Dilutions.
DilutionPolyphenol
(mg GAE g−1)
Flavonoid
(mg QE g−1)
Tannin
(mg TAE g−1)
AverageStandard
Error
AverageStandard
Error
AverageStandard
Error
13.601.404.320.29268.891.73
16×0.630.090.050.01244.540.80
Table 6. Average Chlorophyll A, B, and Carotenoid Concentrations (μg mL−1) Extracted from Freeze-Dried Spirulina with 70% Acetone at the Lowest and Highest Extract Dilutions.
DilutionChlorophyll AChlorophyll BCarotenoids
54.4852.270.42
16×0.940.121.23
Table 7. GC-MS results for Spirulina.
PeakGeneric NameIUPAC NameFormulaFunction
1HexadecaneHexadecaneC16H34Energy source in microbes [70]
2HeptadecaneHeptadecaneC17H36Component of plant waxes [71]
3Myristic AcidTetradecanoic acidC14H28O2Emulsifier, protein stabilizer [63]
4Neophytadiene7,11,15-trimethyl-3-methylidenehexadec-1-eneC20H38Antioxidant, antimicrobial properties [65]
5Palmitic acidHexadecanoic acidC16H32O2Emulsifier, structural fatty acid [66]
6Phytol(2E,7R,11R)-3,7,11,15-tetramethylhexadec-2-en-1-olC20H40OSynthesis of Vitamins E and K, components of chlorophyll [72]
7Oleic Acid(9Z)-octadec-9-enoic acidC18H34O2Fatty acid, anti-inflammatory [67]
8Gamma-linolenic acid (6Z,9Z,12Z)-octadeca-6,9,12-trienoic acidC18H30O2Anti-inflammatory, precursor to eicosanoids [73]
9CholesterolCholest-5-en-3-ol, C27H46OSteroid precursor, cell membrane stabilizer [74]
Table 8. Unstained Fucus Slides Submerged in Freshwater and Saltwater.
TreatmentControl16×
Dry slidesApplsci 16 00642 i001Applsci 16 00642 i002Applsci 16 00642 i003Applsci 16 00642 i004Applsci 16 00642 i005Applsci 16 00642 i006
FreshwaterApplsci 16 00642 i007Applsci 16 00642 i008Applsci 16 00642 i009Applsci 16 00642 i010Applsci 16 00642 i011Applsci 16 00642 i012
SaltwaterApplsci 16 00642 i013Applsci 16 00642 i014Applsci 16 00642 i015Applsci 16 00642 i016Applsci 16 00642 i017Applsci 16 00642 i018
Table 9. Precipitation Count Produced by ImageJ Analysis for Unstained Fucus Slides: Freshwater versus Saltwater (count mm−1).
Sample 16×ControlTulsi 1× [24]Juvenile Ginger 1× [24]Aronia 1× [23]
Freshwater6.5 ± 1.1 27.1 ± 4.6 61.4 ± 6.6 69.4 ± 2.490.2 ± 9.7 68.8 ± 2.63.40 ± 0.43.9 ± 0.844.6 ± 6.6
Saltwater 29.8 ± 3.230.2 ± 8.1 38.7 ± 5.8 109.3 ± 5.6 125.6 ± 29.5275.8 ± 108.822.4 ± 6.087.1 ± 17.341.4 ± 6.6
Table 10. Unstained Spirulina Slides Submerged into Water Samples.
TreatmentControl16×
Dry slidesApplsci 16 00642 i019Applsci 16 00642 i020Applsci 16 00642 i021Applsci 16 00642 i022Applsci 16 00642 i023Applsci 16 00642 i024
FreshwaterApplsci 16 00642 i025Applsci 16 00642 i026Applsci 16 00642 i027Applsci 16 00642 i028Applsci 16 00642 i029Applsci 16 00642 i030
SaltwaterApplsci 16 00642 i031Applsci 16 00642 i032Applsci 16 00642 i033Applsci 16 00642 i034Applsci 16 00642 i035Applsci 16 00642 i036
Table 11. Precipitation Count Produced by ImageJ Analysis for Unstained Spirulina Slides: Freshwater vs. Saltwater (count mm−1).
Sample16×ControlTulsi 1× [24]Juvenile Ginger 1× [24]Aronia 1× [23]
Freshwater21.6 ± 6.832.5 ± 7.942.7 ± 7.247.8 ± 0.753.8 ± 7.668.8 ± 2.63.9 ± 0.83.40 ± 0.444.6 ± 6.6
Saltwater53.1 ±11.267.7 ± 7.476.6 ± 15.8132.0 ± 1.5204.2 ± 26.9275.8 ± 108.887.1 ± 17.322.4 ± 6.041.4 ± 6.6
Table 12. Methylene Blue Fucus Submerged into Water Samples.
TreatmentControl16×
Dry slidesApplsci 16 00642 i037Applsci 16 00642 i038Applsci 16 00642 i039Applsci 16 00642 i040Applsci 16 00642 i041Applsci 16 00642 i042
FreshwaterApplsci 16 00642 i043Applsci 16 00642 i044Applsci 16 00642 i045Applsci 16 00642 i046Applsci 16 00642 i047Applsci 16 00642 i048
SaltwaterApplsci 16 00642 i049Applsci 16 00642 i050Applsci 16 00642 i051Applsci 16 00642 i052Applsci 16 00642 i053Applsci 16 00642 i054
Table 13. Precipitation Count Produced by ImageJ Analysis for Methylene Blue Stained Fucus Slides: Freshwater vs. Saltwater (count mm−1).
Sample16×ControlTulsi 1× [24]Juvenile Ginger 1× [24]Aronia 1× [23]
Freshwater 41.4 ± 2.0 41.8 ± 0.4 43.8 ± 6.0 50.6 ± 2.3 77.9 ± 14.6 66.7 ± 12.258.3 ± 7.35.4 ± 1.864.7 ± 4.7
Saltwater 14.0 ± 0.715.3 ± 3.9 17.7 ± 3.1 32.3 ± 4.3 107.9 ± 22.0152.4 ± 34.79.3 ± 1.09.5 ± 0.372.9 ± 3.6
Table 14. Methylene Blue Spirulina Submerged into Water Samples.
TreatmentControl16×
Dry slidesApplsci 16 00642 i055Applsci 16 00642 i056Applsci 16 00642 i057Applsci 16 00642 i058Applsci 16 00642 i059Applsci 16 00642 i060
FreshwaterApplsci 16 00642 i061Applsci 16 00642 i062Applsci 16 00642 i063Applsci 16 00642 i064Applsci 16 00642 i065Applsci 16 00642 i066
SaltwaterApplsci 16 00642 i067Applsci 16 00642 i068Applsci 16 00642 i069Applsci 16 00642 i070Applsci 16 00642 i071Applsci 16 00642 i072
Table 15. Precipitation Count Produced by ImageJ Analysis for Methylene Blue Stained Spirulina Slides: Freshwater vs. Saltwater (count mm−1).
Sample16×ControlTulsi 1× [24]Juvenile Ginger 1× [24]Aronia 1× [23]
Freshwater13.9 ± 2.818.9 ± 9.139.9 ± 6.355.1 ± 5.070.8 ± 2.466.7 ± 12.258.3 ± 7.35.4 ± 1.864.7 ± 4.7
Saltwater6.6 ± 1.313.3 ± 2.715.8 ± 3.677.9 ± 19.3110.1 ± 16.7152.4 ± 34.79.3 ± 1.09.5 ± 0.372.9 ± 3.6
Disclaimer/Publisher’s Note: The statements, opinions and data contained in all publications are solely those of the individual author(s) and contributor(s) and not of MDPI and/or the editor(s). MDPI and/or the editor(s) disclaim responsibility for any injury to people or property resulting from any ideas, methods, instructions or products referred to in the content.