Article

Test–Retest Reliability and Agreement of Postural Control Variables Within and Between Single-Leg Squat Variations

by
Vasileios Chatziilias
,
Ioannis Kafetzakis
and
Dimitris Mandalidis
*
Sports Physical Therapy Laboratory, Department of Physical Education and Sports Science, School of Physical Education and Sports Science, National and Kapodistrian University of Athens, 172 37 Athens, Greece
*
Author to whom correspondence should be addressed.
Appl. Sci. 2026, 16(2), 1147; https://doi.org/10.3390/app16021147
Submission received: 16 December 2025 / Revised: 12 January 2026 / Accepted: 19 January 2026 / Published: 22 January 2026

Abstract

Single-leg squats are commonly used to assess lower-limb strength and alignment; however, their application for evaluating postural control remains underexplored. This study assessed the reliability and agreement of postural control measures within and between unipedal squat variations. Twenty-eight physically active adults performed a conventional single-leg squat (CSLSQ), the anterior excursion of the Y-Balance Test (ANYBT), and a forward step-down (FRSTD) with both limbs on two occasions, 5–7 days apart. The mean values of five trials were analyzed for center-of-pressure (COP) 95% confidence ellipse area (95%CEA), path length (PL), velocity (VL), and mediolateral and anteroposterior variability (RMS-X and RMS-Y). Most COP variables demonstrated good-to-excellent reliability (ICC = 0.780–0.948), whereas RMS-X showed lower reliability (ICC = 0.367–0.803) and higher measurement error across limbs. The FRSTD demonstrated high ICCs (0.780–0.948) and low measurement error, comparable to the CSLSQ (0.794–0.940) and generally higher than the ANYBT (0.790–0.895), regardless of limb. Overall, the dominant limb exhibited higher ICCs and lower measurement error than the non-dominant limb. Inter-task agreement was greatest between the CSLSQ and FRSTD, primarily on the dominant limb, indicating greater potential interchangeability for selected COP metrics (95% CEA, VL, and RMS-Y). These findings may assist clinicians and sports scientists in selecting appropriate single-leg squat tasks and COP measures for assessment.

1. Introduction

Single-leg squat is a frequently used training exercise and a valuable functional assessment tool, particularly within muscle training and rehabilitation programs [1,2]. It is a closed kinetic chain movement that involves the joints of the lower extremity, the pelvis, and the trunk [3,4,5] while effectively engaging the quadriceps, hamstrings, glutes, and core muscles [5,6,7,8]. As an exercise, it is frequently employed to enhance muscle strength, proprioception, and coordination, which are essential for activities that demand dynamic balance and agility [9]. As an assessment tool, it is frequently used to evaluate bilateral lower-limb muscle imbalances due to its strong emphasis on unilateral force production [10]. Unipedal squat tasks have also been utilized in addressing alignment and detecting dysfunctional movement patterns involving the lower extremities, pelvis, and trunk [11,12,13,14,15,16,17]. The rationale behind their clinical use lies in the way these tests are performed, as different execution techniques can modify trunk and lower-limb kinematics as well as the activation of the corresponding muscles, thereby placing varying stresses on the joints and surrounding soft tissue structures under evaluation. In this context, various forms of single-leg squats have been implemented in the assessment of various patient groups, including those with osteoarthritis [18], non-arthritic hip pain [19], patellofemoral knee pain [13,20,21], anterior cruciate ligament (ACL) injuries [22,23], and ankle instability [24].
Among the one-leg squatting tasks described in the literature, three variations have been most extensively investigated, likely due to their relative simplicity of execution, dynamic characteristics, and/or functional relevance in clinical and sports settings. These include the conventional (standard) single-leg squat (CSLSQ), the anterior excursion in the Y-Balance Test (ANYBT), and the forward step-down (FRSTD). These variations are associated with distinct, although not profoundly different, biomechanical and neuromuscular demands. Consequently, each task may be optimally suited to specific assessment strategies and different stages of rehabilitation, ranging from controlled unilateral loading to dynamic balance readiness and functional descent control.
The CSLSQ is primarily a sagittal-plane task requiring substantial hip and knee flexion, during which the center of mass remains close to the stance foot [4,25,26]. Although dominated by sagittal-plane motion, hip adduction and internal rotation of the supporting limb [25], in conjunction with proximal muscular control [27,28], directly affect knee alignment, rendering the CSLSQ a useful assessment tool for quantifying dynamic knee valgus [14,16]. For this reason, it has been incorporated into standard lower-limb musculoskeletal assessments in both healthy and clinical populations, as well as in preparticipation sports physical examinations, to evaluate lower-extremity injury risk [29,30,31]. Despite its apparent simplicity, the CSLSQ can be performed using different execution strategies, including squatting to maximal depth [5,32,33,34] or to predefined knee flexion angles typically ranging from 30° to 90°, before returning to the initial position [13,14,16,18,21,33,35,36,37]. The variability between tests may be further influenced by the velocity of the movement, as faster execution may alter the measured outcome [26,38]. Furthermore, the position of the non-standing leg during single-leg squat execution, whether extended forward, extended backward with the trunk leaning forward, aligned with the stance-leg and ankle, or with 90° of knee flexion and the thigh in a vertical position, has been shown to further contribute to performance variability by altering joint kinematics and muscle activation [4,8,33,39,40].
Unipedal squatting is also incorporated into the Y-Balance Test (YBT), which represents a modified and instrumented version of the Star Excursion Balance Test (SEBT). This test requires the hip and knee of the stance leg to flex as the non-stance leg extends as far as possible along arms arranged in an inverted “Y” shape, with the toes moving footplates positioned at the ends of the arms. Despite requiring sagittal- and frontal-plane hip and knee joint moments comparable to the CSLSQ, the YBT is distinguished by its dynamic nature, characterized by intentional center-of-mass displacement beyond the base of support and increased demands on anticipatory postural adjustments and lower-limb muscle coordination [41,42,43,44]. Accordingly, the YBT is routinely incorporated into later stages of rehabilitation programs, with the anterior excursion (ANYBT) identified as the most sensitive reach direction for predicting lower extremity injury risk in athletic and clinical populations [41,44].
The FRSTD is a commonly used task in clinical settings that involves controlled knee flexion (descent) from an elevated surface on one leg with the contralateral (non-stance) limb extended forward and downward. The kinematics of the task involve pronounced sagittal- and frontal-plane movements, with hip and knee flexion comparable to that of the CSLSQ, but greater pelvic and trunk excursions, the magnitude of which is influenced by step height [25,45]. The presence of kinematic patterns that differ from those observed during in-place single-leg squatting, together with the task’s replication of functional descent activities, makes the FRSTD a commonly selected assessment task for lower-limb pathologies and injuries [19,20,46].
In addition to kinematic and muscular outcomes, variations in unipedal squatting tasks also may influence postural control, which is directly related to the underlying task-specific demands. Postural control refers to the complex interaction of musculoskeletal and neural systems involved in achieving, maintaining, and regulating body balance during static postures or dynamic activities, ensuring appropriate stability and orientation [47]. It is commonly quantified by using center-of-pressure (COP) measurements derived from force platforms, which represent the net result of neuromuscular responses aimed at maintaining balance [48]. COP-derived metrics provide objective indices of postural stability, capturing both the magnitude and temporal characteristics of postural adjustments in response to task-specific kinematic and muscular demands [48]. However, while these metrics are widely used as operational proxies of postural control, they represent indirect indicators of balance regulation, and their relationship with functional performance or injury-related outcomes is task- and context-dependent. Nevertheless, little is known about whether the kinematic and muscle-activity variations identified during these tasks are consistently accompanied by measurable differences in postural control [39,49]. Previous studies have shown that anteroposterior displacement of the COP measured with a force plate increased during a single-leg forward-leaning squat compared to a traditional split squat [39]. Postural control is also altered while performing single-leg squats during the SEBT, with anteroposterior displacement of the COP being decreased during all excursions in the posterior and lateral directions and increased during excursions in the anterior and medial directions [49]. These findings indicated that anterior excursions presented more challenges than posterior excursions, which may be more effective at detecting deficiencies in postural control [49].
Given that single-leg squat variations impose distinct neuromechanical demands and are applied at different stages of rehabilitation and performance monitoring, equivalence in postural control outcomes or their reliability, among tasks, cannot be assumed. Addressing this gap is essential for informing the health status of non-pathological and clinical populations, particularly athletes with lower-limb injuries or pathologies (e.g., ACL injury, patellofemoral pain syndrome). These individuals perform activities requiring brief periods of unilateral support with a flexed knee (e.g., jumping, pivoting, and cutting), and the identification of subtle musculoskeletal deficits or improvements is critical for task selection, progression strategies, longitudinal monitoring, and return-to-performance decisions [15,50]. Considering the limited evidence on intra- and inter-task variability, reliability, and agreement [51,52], this study aimed to examine task-related differences in COP-derived variables, assess their reliability, as well as the interchangeability between single-leg squat variations for postural control assessment.

2. Materials and Methods

2.1. Experimental Approach

This study employed a test–retest design to examine the reliability and agreement of COP–derived postural control variables associated with the execution of CSLSQ, ANYBT, and FRSTD. Participants attended two identical testing sessions separated by an interval of 5–7 days. During each session, all tasks were performed on both the dominant and non-dominant limbs, with task and limb order counterbalanced across participants. Limb dominance was determined using the Greek-translated and cross-culturally validated Waterloo Footedness Questionnaire–Revised (WFQ-R), which assesses footedness based on functional tasks [53]. The primary outcome variables consisted of COP measures reflecting postural control during the descending phase of each task, including the mean 95% confidence ellipse area (95%CEA), path length (PL), velocity (VL), and anteroposterior and mediolateral sway variability (RMS-X and RMS-Y) of the COP.

2.2. Sample

The study involved a sample of 28 participants (13 males and 15 females), as three of the 31 initially selected individuals did not attend the second session. The mean (±SD) age of the sample was 23.5 ± 4.1 years; mean body mass was 70.9 ± 15.0 kg, height was 1.70 ± 0.10 m, and body mass index was 23.6 ± 3.8 kg·m−2. Participants were undergraduate physical education students recruited from the local university who engaged in regular physical activity as part of their weekly academic program. Further assessment of their physical activity level using the Greek-translated and cross-culturally validated version of Baecke’s Physical Activity Questionnaire [54] revealed a mean score of 8.3 ± 1.3 points, corresponding to approximately 55.3 ± 8.7% of the maximum achievable score (15 points). This level is generally interpreted as indicative of moderate habitual physical activity in healthy adult populations. All participants were required to be free from lower-limb injury or pain within the preceding year and not undergoing any form of rehabilitation or pharmacological treatment that could influence motor performance. Exclusion criteria included any history of neurological or vestibular disorders, as well as the use of medication that could affect balance or postural control. Furthermore, none of the participants presented major skeletal asymmetries (e.g., scoliosis), as determined through a standard musculoskeletal assessment.

2.3. Testing Procedure

Center-of-pressure data were acquired using a plantar foot pressure platform (FDM-S Measuring System for Force Distribution; Zebris Medical GmbH, Isny im Allgäu, Germany), which is based on a high-resolution matrix of 1792 capacitive sensors measuring plantar pressure at a sampling frequency of 120 Hz. The platform was factory calibrated to convert raw sensor capacitance values into pressure (kPa) and force (N). Prior to each measurement session, a system zeroing procedure was performed to minimize baseline offset. No additional temporal low-pass filtering (e.g., filter type, order, or cut-off frequency) was applied to the exported COP time series. Raw sensor signals were digitized by the manufacturer’s data acquisition system and exported in ASCII/CSV format from the Zebris software (WinFDMS v.2.0.4 for Windows, Zebris Medical GmbH, Isny im Allgäu, Germany) for subsequent analyses.
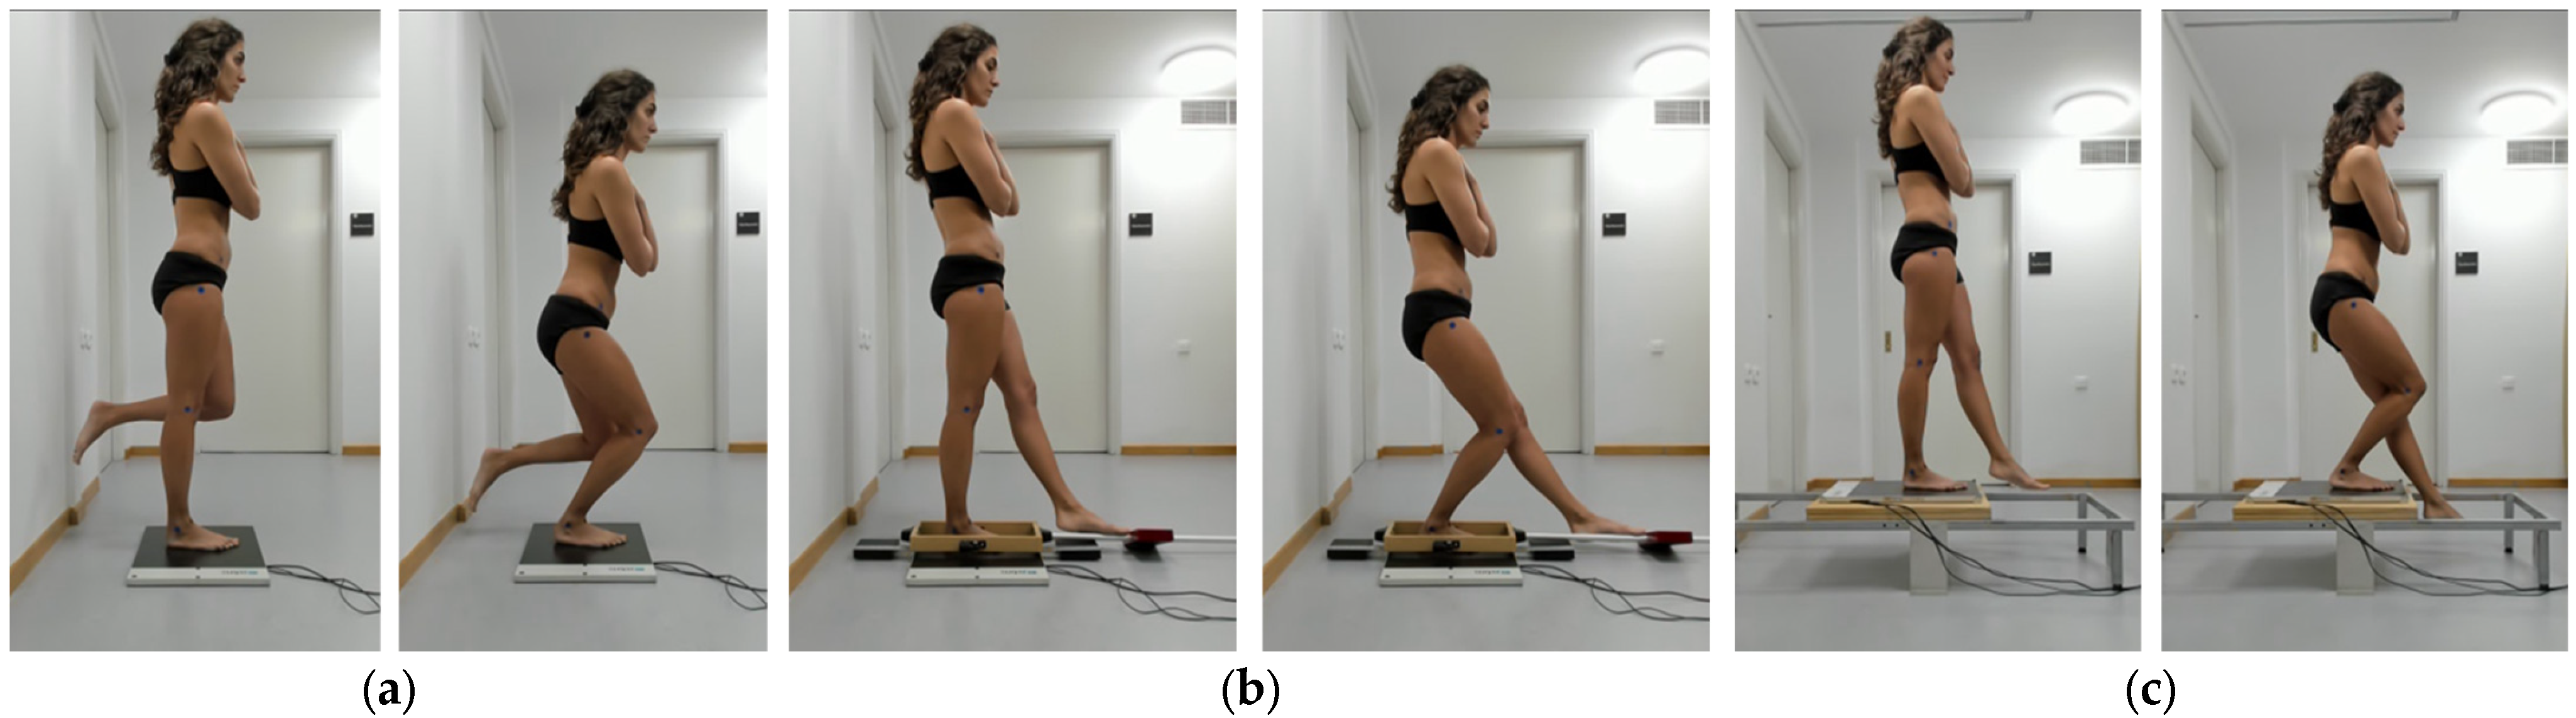
Each participant was required to stand barefoot on the platform in an upright position, facing forward, and to flex the knee of the standing leg to a self-selected maximal depth established during familiarization trials. Participants were subsequently instructed to reproduce this depth as consistently as possible across all repetitions and sessions. Squat depth was not externally constrained or controlled between different tasks (e.g., knee translation of knee beyond the toy line). Squat velocity was regulated by a metronome set at 60 beats·min−1, such that the eccentric (descent) and concentric (ascent) phases each lasted 3 s. The CSLSQ task was performed by flexing the knee of the stance limb while maintaining the thigh of the non-supporting limb in a vertical position (Figure 1).
During the ANYBT task, participants reproduced the established maximal knee flexion while reaching forward as far as possible with the non-supporting limb by moving a footplate with their toes along a tube attached to a wooden frame. The frame was positioned above, but not attached to, the plantar pressure distribution platform, allowing participants to perform the task while COP-based postural control parameters were recorded simultaneously [55]. Maximum knee flexion during the FRSTD task was achieved by instructing participants to stand on a platform positioned 28.5 cm above the ground, on which the plantar pressure distribution platform was placed. Subsequently, they were instructed to lower the free limb as far as possible with the ankle maintained in a neutral position before returning to the initial stance position (Figure 1).
A counterbalanced design was used to control order and laterality effects. The first six participants were assigned to each of the six possible combinations of the test conditions, and the same sequence was repeated for subsequent participants. Limb order was alternated between consecutive tests, such that if one test began with the right limb, the next began with the left.
Participants were instructed to perform three practice trials followed by five recorded attempts, with a 30 s rest period between repetitions and a 2 min rest period between tasks. No direct measures of fatigue were collected during or between task executions. They were also instructed to cross their arms over their chest, maintain an upright trunk posture, and return to the starting position after reaching full knee flexion in each trial. A trial was considered unsuccessful if the participants touched the ground with the untested limb, lost their balance, or used their hands to maintain balance. In cases where an attempt was deemed unsuccessful, an additional trial was administered to ensure completion of the required number of valid trials. The average of five successful attempts was used for statistical analysis.

2.4. Data Analysis

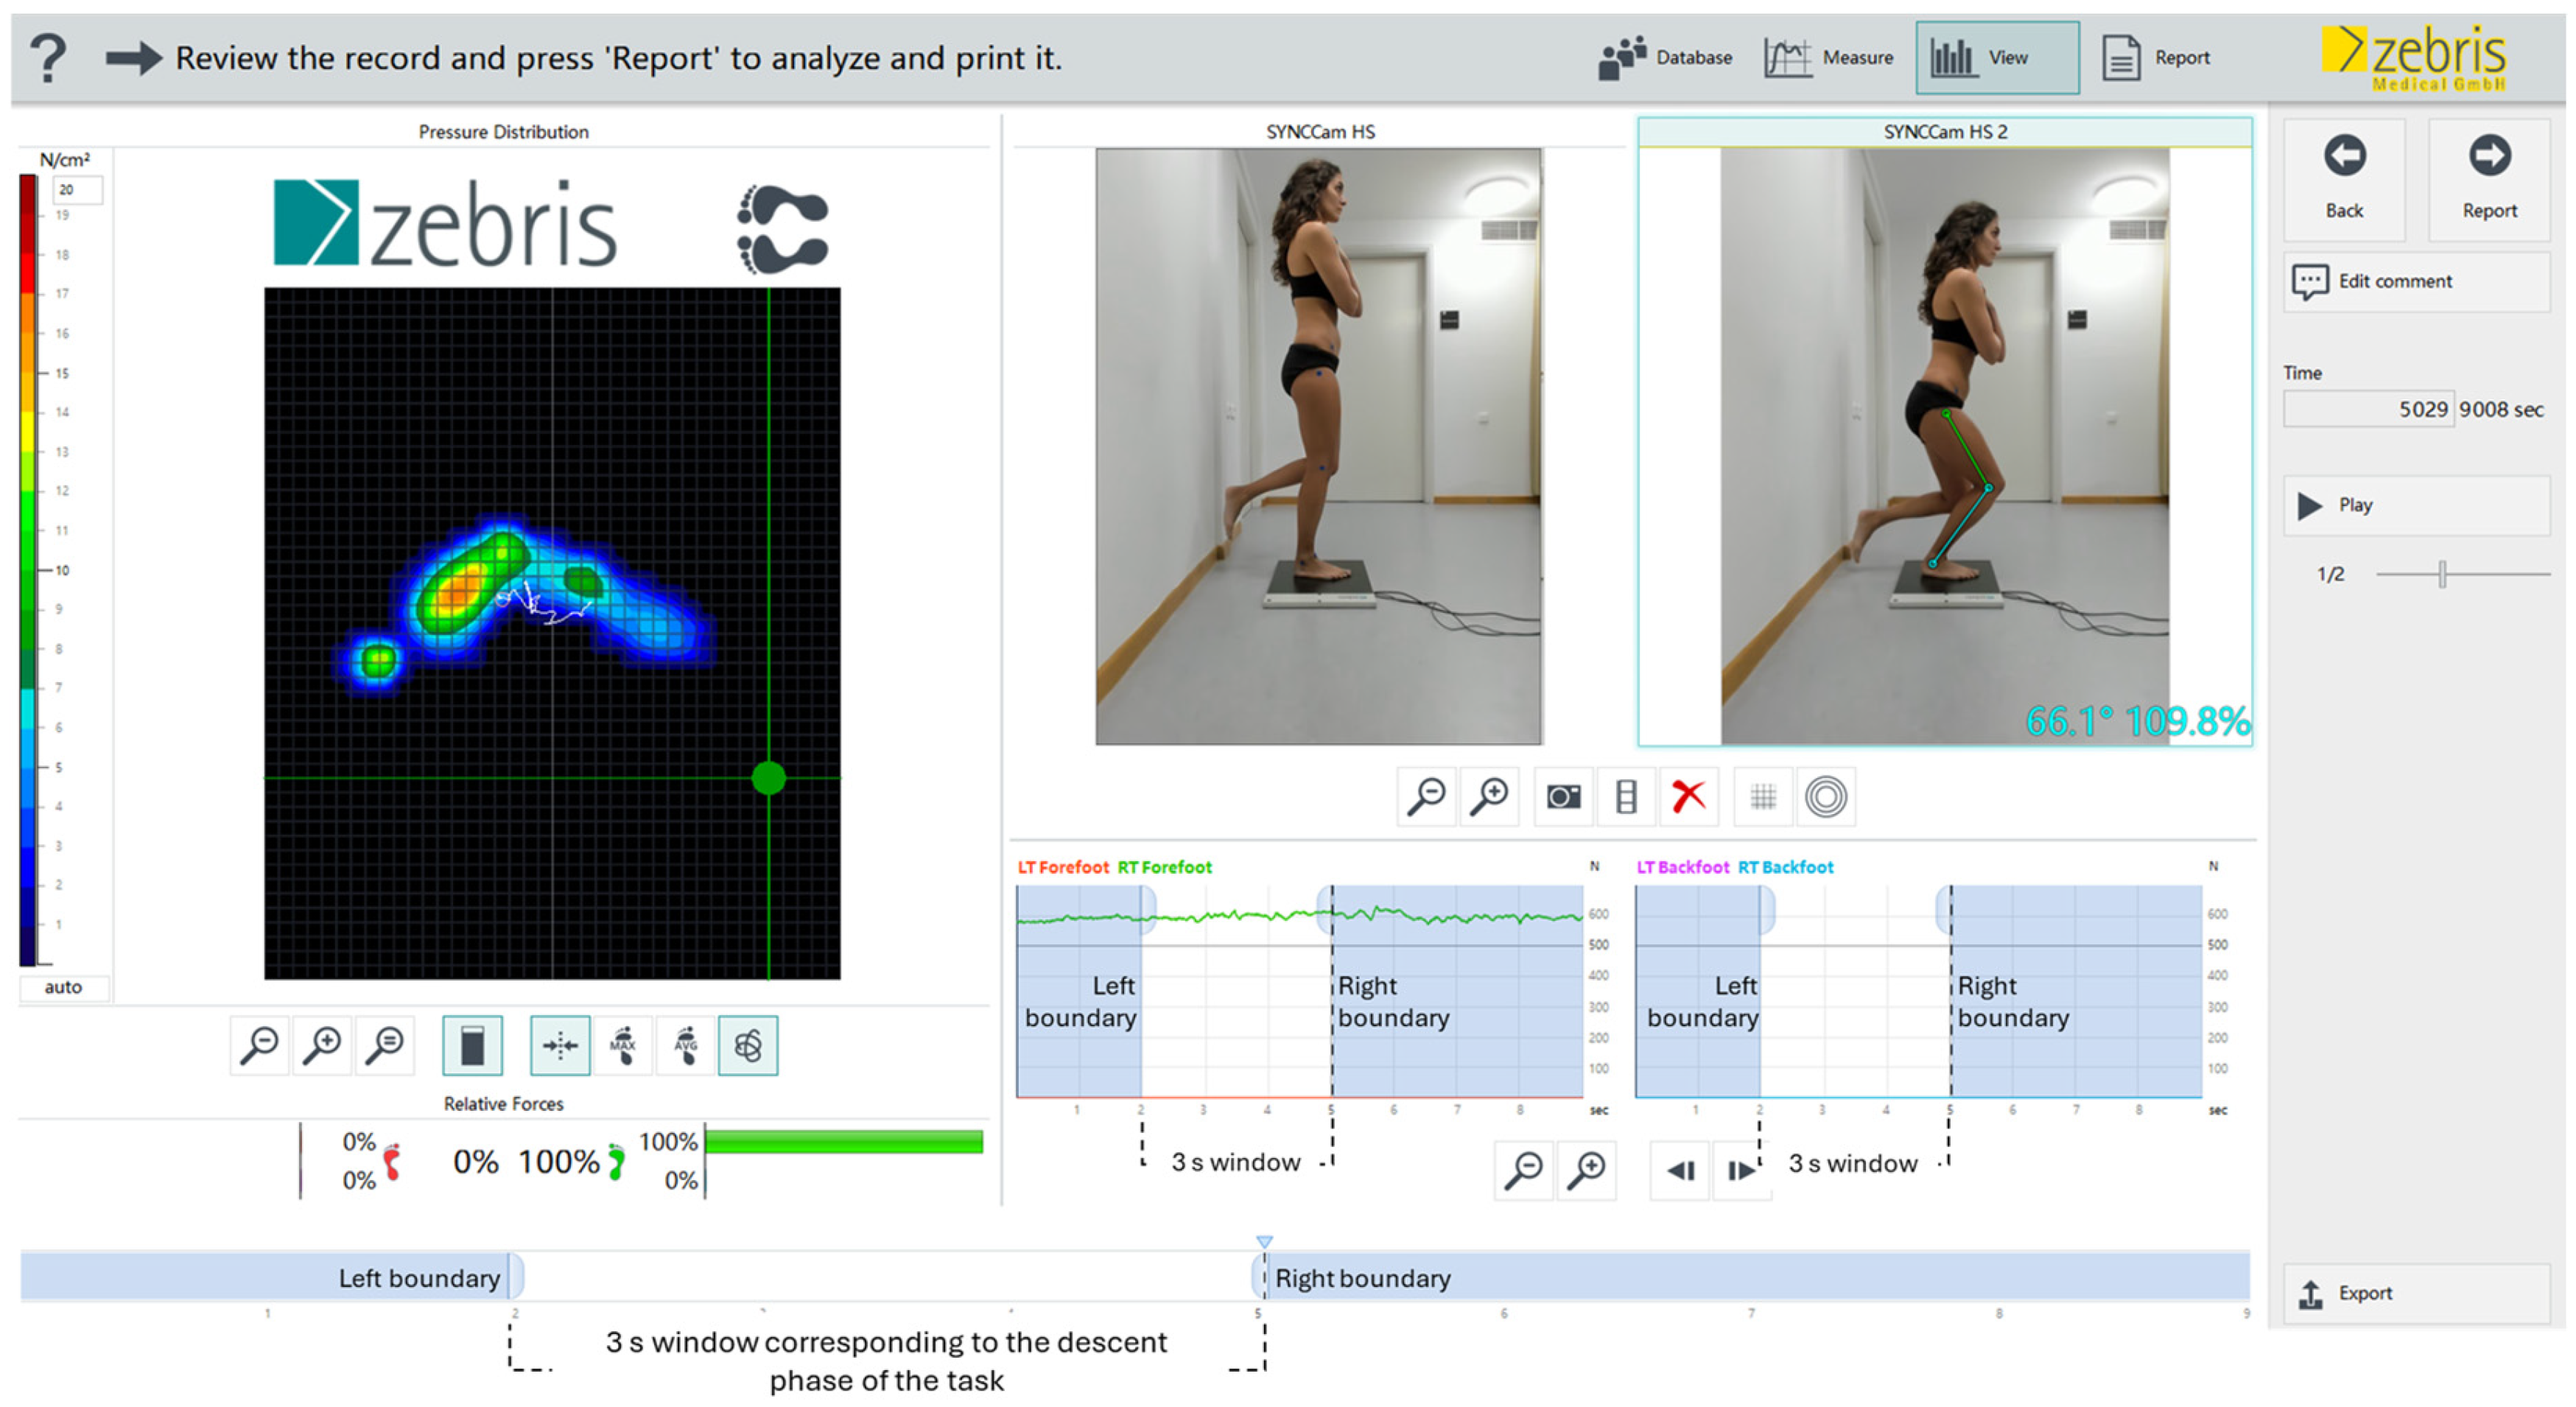
The 95%CEA, PL, VL, and RMS-X and RMS-Y of the center of pressure during the descending phase of each single-leg squat task were analyzed, with phase identification performed using synchronized video recordings across all trials. The descent phase of each squat attempt was identified using video recordings acquired with a Zebris SYNCCamHS 90 camera system (Zebris Medical GmbH, Isny im Allgäu, Germany) operating at 120 frames·s−1 (640 × 480 pixels) and synchronized with pressure platform data sampled at 120 Hz. The camera was mounted on a tripod and positioned 2 m from the stance foot at a height of 0.60 m. Video and COP data were analyzed using the Zebris software environment (Figure 2).
The onset of the descent phase was defined as the first video frame showing a clear downward displacement of the body’s center of mass, characterized by the initiation of hip and knee flexion from an upright position. The end of the descent phase corresponded to maximum squat depth, operationally defined as the point of greatest knee flexion immediately prior to ascent. Using the boundary-adjustment tools integrated within the Zebris software, temporal markers (“left” and “right” boundaries) were manually set to correspond to these two events. This procedure defined a discrete time window corresponding exclusively to the descent phase of the squat. The selected time window was then automatically mapped onto the synchronized COP data, enabling the extraction of COP trajectories and their temporal derivatives specific to the descent phase (Figure 2).
Descent phase identification was performed independently by two trained raters with prior experience in biomechanical analysis of squat techniques using the same instrumentation. Raters were not blinded to task conditions, as phase identification relied exclusively on observable kinematic events rather than outcome-dependent variables. Inter-rater reliability for descent phase identification, as defined by the attainment of maximum knee flexion angle, was excellent across all tasks and limbs [ICC(2,5) range: 0.935–0.991; 95% CI lowest bound: 0.860; highest bound: 0.996; CI width (range): narrowest 0.016, widest: 0.090].
Knee flexion, as indicated by maximum squat depth, and the duration of each attempt, determined by the time points corresponding to the start and end of the attempt, were used to calculate squat execution average velocity, based on the equation: ω = Δθ/Δt, where ω is the average angular velocity (in degrees per second, °·s−1), Δθ is the angular displacement (in degrees), Δt is the time interval (in seconds).

2.5. Statistical Analysis

The normality of the data distribution was assessed using the Shapiro–Wilk test and by visually inspecting Q-Q and box plot graphs. To examine differences in task characteristics (e.g., range, duration, and velocity of knee flexion) and outcome characteristics across tasks and sides, a series of two-way repeated-measures ANOVAs was conducted with test (e.g., CSLSQ, ANYBT, FRSTD) and side (dominant vs. non-dominant) as within-subject factors. Sphericity was assessed using Mauchly’s test, and when violated, Greenhouse–Geisser corrections were applied, and pairwise comparisons were performed using the Bonferroni adjustment. Sessions (1 and 2) were analyzed separately by design, as the primary aim of the study was to evaluate task-specific agreement and measurement error between sessions using minimal detectable change and limits of agreement. The study was not intended to test session-related learning or fatigue effects inferentially. Any systematic between-session differences, including potential learning or fatigue effects, would be reflected in the agreement analysis as bias or increased measurement error.
The statistical analysis of the data was performed with SPSS 30.0 (IBM Corp, Armonk, NY, USA), while the significance level was set at the level of p ≤ 0.05.

2.5.1. Reliability and Agreement Analysis

To assess the reliability of temporal marking of the descent phase, inter-rater reliability was quantified using a two-way random effects intraclass correlation coefficient for average measures, ICC(2,k), with k = 5, reflecting the mean of five repetitions used in the analysis.
A two-way mixed-effects model was used to calculate ICC(3,5) for COP variables, assessing both consistency (ICCCO) and absolute agreement (ICCAA) across sessions, for each limb and task [56]. The ICCCO assessed consistency of relative rankings across sessions, while the ICCAA quantified relative agreement, including systematic and random variance components. Intraclass correlation coefficients less than 0.5 indicated poor reliability, values between 0.5 and 0.75 suggested moderate reliability, values from 0.75 to 0.9 represented good reliability, and values more than 0.9 reflected excellent reliability [56].
To estimate absolute reliability, the Standard Error of Measurement (SEM) was calculated using the formula SEM = SD × (1 − ICC)1/2, where SD represents the pooled standard deviation of the two sessions and the ICC denotes the ICCAA. From the SEM, the Minimal Detectable Change at the 95% confidence level (95%MDC) was derived as 95%MDC = SEM × 1.96 × 21/2, reflecting the smallest change considered beyond measurement error. Finally, Bland–Altman plots were constructed to examine Limits of Agreement (LOA), providing both visual and statistical assessments of agreement by plotting the mean difference between sessions along with 95% confidence intervals (±1.96 × SD of the differences).

2.5.2. Sample Size Calculation

An a priori sample size calculation was conducted for this two-session test–retest reliability study (k = 2) using a precision-based approach for intraclass correlation coefficient (ICC) estimation, following the framework proposed by Bonett [57]. Based on this approach, the magnitude of reliability and its associated uncertainty is quantified by controlling the expected width of the 95% confidence interval (95% CI) for the ICC rather than relying solely on hypothesis-testing power [56,57,58,59,60]. Accordingly, Bonett’s sample size (n) formula for ICC precision was applied:
n = 8 z 0.975 2 ( 1 ρ ) 2 [ 1 + ( k 1 ) ρ ] 2 k ( k 1 ) W 2 + 1
where ρ is the expected ICC, k is the number of repeated measurements, W is the target total 95% CI width, and z 0.975 = 1.96 .
An expected reliability (ρ) of ICC = 0.85 was specified in relation to a target total 95% CI width (W) of 0.20 (half-width 0.10) to ensure adequate estimation precision while maintaining the lower confidence limit above the predefined minimum acceptable reliability threshold of ≥0.70 [58]. This joint specification is consistent with recommendations for precision-based planning in reliability studies, as it provides sufficient precision to support stable interpretation relative to established ICC benchmarks, to maintain the lower confidence limit above minimum acceptable thresholds, and to align with confidence interval widths commonly reported in reliability studies [56,57,58,61,62]. Ultimately, by substituting k = 2 , ρ = 0.85 , W = 0.20 , and z 0.975 = 1.96 into Bonett’s equation, it yielded a required sample size of approximately n 31 participants.
To account for the tendency of asymptotic variance approximations to slightly overestimate precision in two-measurement designs (k = 2) when reliability is high (ρ ≥ 0.70), Bonett [57] recommended a conservative small-sample adjustment. This adjustment is defined as n * = n + 5 ρ , where ρ denotes the expected ICC. Assuming an expected ICC of 0.85, the unadjusted sample size requirement of approximately n ≈ 31 participants was inflated by 5ρ = 4.25, yielding a conservative target sample size of n ≈ 35 after rounding. This adjustment increases the variance term in the confidence-interval width approximation, thereby better reflecting finite-sample behavior.
However, given practical recruitment constraints, the achieved sample size of 28 participants was expected to yield a modestly wider 95% confidence interval (approximately 0.224 instead of the planned 0.20; half-width ≈ 0.112). This is justified by Bonett’s approximation, according to which the 95% CI width of the ICC scales with 1 / n 1 ; therefore, reducing the sample size from 35 to 28 participants increases the expected interval width by a factor of 34 / 27 1.12 , corresponding to an approximate 12% loss of precision relative to the planned design. Assuming an expected ICC of 0.85, this corresponds to a lower 95% confidence limit of approximately 0.738, which remains above the predefined minimum acceptable reliability threshold (≥0.70). This level of precision is therefore sufficient to distinguish good-to-excellent reliability and is consistent with commonly accepted precision targets in biomechanical reliability studies [56,62]. Accordingly, the final sample size was considered adequate to support the intended reliability inferences, with ICC estimates interpreted alongside their 95% CI.

3. Results

3.1. Test Characteristics

Analysis of knee-flexion ROM revealed task-related differences across both testing sessions. A significant main effect of task was observed during the first session (F = 3.950, p < 0.05, η2 = 0.128) and the second session (F = 6.929, p < 0.01, η2 = 0.204), with knee-flexion ROM generally greatest during the FRSTD, followed by the ANYBT and the CSLSQ. These differences were more evident on the non-dominant limb only during the second session, as demonstrated by a significant task × dominance interaction (F = 4.372, p < 0.05, η2 = 0.139) (see Table 1 for pairwise comparisons). Internal consistency for knee flexion ROM, assessed using the coefficient of variation (%CV) across the five repetitions, ranged from 4.0 ± 2.6% to 5.5 ± 2.6% across tasks.
Knee-flexion duration demonstrated limited task-related differences across testing sessions, with a significant main effect evident only during the first session (F = 3.703, p < 0.05, η2 = 0.121), during which the FRSTD was performed slightly more slowly than the ANYBT and the CSLSQ. Limb dominance did not influence knee-flexion duration in either the first or the second session, as indicated by the absence of significant main effects of limb dominance or task × dominance interactions.
For knee-flexion velocity, no significant main effects of task or limb dominance, nor any task × dominance interactions, were observed during either the first or the second testing session.

3.2. Center of Pressure Parameters Across Tasks

Significant main effects of task were observed for the 95%CEA in both the first (F = 14.156, p < 0.001, η2 = 0.344) and second sessions (F = 9.974, p < 0.001, η2 = 0.270), with values generally greater during the ANYBT compared with the CSLSQ and FRSTD. No significant main effects of task or limb dominance, nor any task × dominance interactions, were identified for PL or VL in either session.
For RMS-X, a significant main effect of task was found during the first session (F = 5.682, p < 0.01, η2 = 0.174). During the second session, significant main effects were observed for both task (F = 5.783, p < 0.01, η2 = 0.176) and dominance (F = 6.334, p < 0.05, η2 = 0.072), with values generally greater during the CSLSQ compared with the ANYBT and FRSTD, and on the dominant compared with the non-dominant side.
For RMS-Y, significant main effects of task were identified during both the first (F = 36.516, p < 0.001, η2 = 0.575) and the second sessions (F = 20.837, p < 0.001, η2 = 0.436), with values generally greater during the ANYBT compared with the CSLSQ and FRSTD. In addition, a significant task × dominance interaction was observed during the first session (F = 4.505, p < 0.05, η2 = 0.143), indicating limb-dependent differences across tasks (see Table 2 for pairwise comparisons).

3.3. Intersession Reliability of COP Variables Across Tasks

Intraclass correlation coefficients point estimates for consistency (ICCCO) and agreement (ICCAA) for most COP variables (95%CEA, PL, VL and RMS-Y) examined across the single-leg squat conditions ranged from 0.780 to 0.948, indicating moderate to excellent reliability for both the dominant and non-dominant sides. RMS-X exhibited the lowest reliability, with ICC values ranging from 0.367 to 0.803 irrespective of limb (Table 3 and Table 4).
Reliability was generally higher for all COP-derived parameters during CSLSQ and FRSTD on the dominant side compared with the non-dominant side. In contrast, 95% CEA, PL, and VL demonstrated higher ICC point estimates during the ANYBT condition on the non-dominant side than on the dominant side, with comparable measurement error between sides. However, the dominant side consistently exhibited lower measurement error for most COP parameters compared with the non-dominant side [see Table 3 and Table 4, and Bland and Altman’s plots (Figure S1) in the Supplementary Material].

3.4. Agreement Between Single-Leg Squat Pairs for COP Variables

Intraclass correlation coefficient point estimates for consistency (ICCco) and agreement (ICCAA) across single-leg squat pairs ranged from 0.380 to 0.914 for all COP variables, irrespective of limb. Higher ICCs values and lower measurement error were observed on the dominant side for the CSLSQ–FRSTD pair for 95%CEA, VL, and RMS-Y, whereas the CSLSQ–ANYBT pair demonstrated higher ICCs for PL and comparable ICCs for VL. In contrast, the ANYBT–FRSTD pair generally demonstrated the least favorable reliability profile, characterized by lower ICCs and greater measurement error, compared with the other condition pairs. In general, measurement error for most COP parameters was lower on the dominant side than on the non-dominant side [see Table 5 and Table 6, and Bland and Altman’s plots (Figure S2) in the Supplementary Material].

4. Discussion

Our findings regarding knee-flexion range of motion and duration revealed small but statistically significant differences between tasks; however, these differences should be interpreted cautiously when considering task selection within rehabilitation progression and return-to-sport frameworks. Although statistically significant differences were detected between single-leg squat variations, their small magnitude and inconsistent expression across sessions and limbs suggest limited clinical relevance. Notably, knee-flexion velocity did not differ across tasks or testing sessions, indicating that all tasks were executed under comparable temporal constraints. This consistency in movement speed implies that neuromechanical demands related to movement timing and their potential influence on postural control were largely equivalent across tasks. Consequently, minor differences in knee-flexion kinematics are unlikely to meaningfully influence postural control outcomes or justify preferential task selection during return-to-sport decision-making. Instead, progression across CSLSQ, ANYBT, and FRSTD should be guided primarily by the increasing balance, eccentric control, and functional complexity demands of each task, rather than by small kinematic differences. In this context, CSLSQ may be more appropriate during early rehabilitation phases to assess controlled unilateral loading, whereas ANYBT and FRSTD may be better suited for later-stage rehabilitation and return-to-sport readiness, where dynamic balance and functional descent control are emphasized.
The observed task-related differences in COP-derived variables indicate that single-leg squat variations impose distinct postural control demands; however, their clinical relevance should be interpreted with caution. The consistently larger 95%CEA and RMS-Y observed during ANYBT reflect greater COP dispersion, likely attributable to the intentional center-of-mass displacement and increased anticipatory control demands inherent to this task rather than clinically meaningful balance deficits. Similarly, the greater RMS-X values observed during the CSLSQ appear to be intrinsic to the in-place nature of the task and its associated mediolateral control requirements. In contrast, the absence of task or limb effects for PL and VL suggests that overall COP excursion and the temporal regulation of postural adjustments were largely comparable across tasks, highlighting that not all COP metrics are equally sensitive to task-specific demands.

4.1. Reliability of Single-Leg Squat Tasks

Overall, the ICC point estimates calculated in the present study for both consistency and agreement, with relatively narrow 95% CI for RMS-Y and VL, followed by 95%CEA and, PL during the CSLSQ and FRSTD, indicated good to excellent reliability primarily on the dominant side. Comparable ICC point estimates for most variables were observed on the non-dominant side irrespective of task; however, these estimates were generally accompanied by wider 95% CI, and greater absolute error, indicating greater uncertainty in reliability. In contrast, RMS-X consistently demonstrated the lowest ICC point estimates among the COP variables, together with wide 95% CIs, and great measurement error regardless of task or limb dominance.
These findings are consistent with previous work from studies investigating bipedal and unipedal stance, showing that velocity- and distance-based COP metrics exhibit particularly high reliability during static postural tasks [63,64]. The strong reliability of RMS-Y and the low reliability of RMS-X aligns with the well-established notion that anterior–posterior sway is governed by more stable and predictable biomechanical control strategies compared with medio-lateral sway [65]. In agreement with our findings, high ICC values have been found for ellipse-based COP indices during the unipedal stance [66,67]; however, these indices appear to decline markedly during single-leg squat tasks, where poor reliability has been observed [52].
In general, ICC point estimates were higher on the dominant side and accompanied by narrower 95% confidence intervals and lower absolute error compared with the non-dominant side. An exception was RMS-Y, which demonstrated comparably high reliability and low measurement error between limbs during both CSLSQ and FRSTD. This tendency aligns with evidence showing that limb dominance is associated with neuromechanical asymmetries, including differences in motor control specialization [68], and superior proprioceptive sensitivity and sensorimotor consistency on the dominant limb [69]. Recent research indicates that the dominant limb often shows superior postural stability and more consistent motor control, with lower sway and better COP metrics compared with the non-dominant limb, which tends to exhibit greater variability and reactive postural adjustments. This lateralized difference in control strategies reflects asymmetries in neural and motor coordination between limbs [70,71,72]. These neuromechanical advantages may have contributed to reducing trial-to-trial variability and enhancing the repeatability of postural sway patterns, resulting in more consistent COP outputs on the dominant side compared to the non-dominant side. However, exceptions, such as the higher or comparable ICC point estimates for almost all COP variables on the non-dominant compared to the dominant side during ANYBT, highlight that dominance effects are task-dependent and influenced by specific movement constraints. This aligns with previous findings showing that COP-based parameters obtained during ANYBT can be relatively more reliable on the non-dominant, often left, limb compared to the dominant, typically right, side, indicating that dominance does not guarantee greater postural stability [52]. Absolute reliability indices calculated for the ANYBT were also comparable between limbs, suggesting that stabilization strategy variability on the non-dominant limb was similar to that of the dominant limb. This contrasts with the greater absolute error and the more pronounced non-dominant side variability observed in the other tasks.
Regardless of limb dominance, the FRSTD generally demonstrated higher relative reliability indices and lower measurement error across most COP variables. Comparable ICC point estimates, width of 95% CI, and absolute reliability values to those of the FRSTD were observed for most COP variables during the CSLSQ. In contrast, although ANYBT demonstrated similarly high ICC point estimates for most COP variables, its absolute reliability values classified this task as the least reliable among those examined.
Given the comparable knee flexion angles and flexion velocities achieved across all tests, factors known to influence postural control [20,38], and the similarities in the underlying biomechanical constraints, neuromuscular demands, and general movement patterns that the single-leg squats under investigation demonstrate, the higher absolute and lower relative reliability observed in the FRSTD may be attributed to task-level constraints, including perceptual–cognitive factors, environmental elements, and task familiarity. Perceptual factors, such as the clear visibility of the step edge, are likely to enhance movement consistency because visual information has been shown to reduce sway variability and stabilize postural responses [73]. Environmental and task constraints, including the fixed height of the step and the predictable spatial endpoint of the descent, may also reduce the range of available movement solutions and promote repeatable motor strategies, consistent with principles of motor learning, indicating that structured tasks show lower performance variability [74,75]. Additionally, attentional and cognitive factors may also play a role, as externally focused, goal-directed movements, such as stepping down toward a defined surface, are known to yield more automatic and stable postural control than internally focused or exploratory tasks [74,75]. Finally, a step-down is a functional, commonly practiced movement, and the familiarity participants have with an existing everyday task may promote more consistent motor execution, improving the reliability of COP measurements. Together, these perceptual–cognitive and environmental factors are likely to reduce movement variability by providing clear visual cues, predictable spatial goals, and familiar action patterns promoting a more consistent motor pattern and reducing extraneous movement, increasing reliability of the FRSTD compared with the other tasks.

Clinical Implications Related to the Reliability of Single-Leg Squats

From a clinical perspective, therapists and sport scientists should exercise caution when selecting and implementing single-leg squat tasks, as high ICC point estimates alone do not necessarily indicate that these tasks are suitable for assessment or longitudinal monitoring in the context of injury prevention, rehabilitation, or return-to-sport decision-making. The good to excellent ICC point estimates indicates that several variables are suitable for ranking individuals or identifying between-subject differences at a given time point. However, absolute reliability indices, including the SEM, 95% MDC, and 95% LOA, suggest that changes observed in several COP measures may largely reflect measurement noise rather than true physiological adaptation.
In this context, the dominant limb showed more consistent performance, indicating that side-to-side comparisons should be interpreted using limb-specific reference values when progressing rehabilitation or task difficulty. Conversely, the reduced reliability observed during non-dominant single-leg squat assessments suggests that greater caution is required when interpreting asymmetries derived from these tasks, as apparent side-to-side differences may partly reflect measurement variability rather than true neuromuscular deficits. Furthermore, the FRSTD and CSLSQ demonstrated a more favorable balance between high relative reliability and lower absolute error for most COP measures, except for RMS-X, suggesting greater utility for monitoring individual changes over time and for informing progression or return-to-sport decisions. In contrast, tasks such as ANYBT, despite demonstrating high relative reliability indices (ICC point estimated and wide 95% CI), exhibited greater absolute error, potentially limiting their sensitivity for detecting small but clinically meaningful improvements during rehabilitation.
In line with these considerations, evidence from the literature suggests that the clinical interpretability of COP-derived measures during unipedal squat tasks depends on whether observed between-group differences exceed absolute reliability thresholds. For example, COP velocity–based measures appear to show greater sensitivity to pathological alterations under certain conditions. In a previous study, Culvenor et al. [50] reported differences in COP path velocity between patients following ACL reconstruction and healthy individuals that were slightly higher (≈1.30 cm·s−1) than the 95% minimal detectable change (MDC) calculated for COP velocity in the present study during the CSLSQ (1.14 cm·s−1), although these differences remained below the upper limit of the 95% LOA (1.42 cm·s−1). Similarly, sway velocity in female patients with patellofemoral pain following pain exacerbation was reported to be 1.54 cm·s−1 [76], which substantially exceeded the between-session measurement error observed in the present study. Collectively, these findings suggest that COP velocity measures may, in some clinical populations and symptom-provoked states, be sufficiently sensitive to discriminate pathological alterations in postural control.
In contrast, COP displacement–based measures, including the standard deviation of anteroposterior COP displacement, appear more susceptible to measurement variability. A difference of 0.23 cm in this measure has been reported between ACL-reconstructed patients and healthy controls [50], which was lower than both the 95% MDC (0.45 cm) and the upper limit of the 95% LOA (0.58 cm) calculated for the equivalent RMS-Y in the present study. Likewise, the standard deviation of anteroposterior COP displacement during the single-leg squat has been reported to be increased in patients with hip chondropathy [77] and in healthy young adults following acute experimentally induced hip muscle pain [78]; however, the observed differences were small (<0.36 cm) and substantially lower than the measurement error calculated for this variable (RMS-Y) in our study. These findings indicate that displacement-based COP measures frequently fall within the limits of measurement variability and may therefore be less suitable for detecting subtle between-group differences or for monitoring individual change over time.
Collectively, these results indicate that COP velocity measures may offer greater clinical utility than displacement-based measures for detecting meaningful impairments or adaptations during single-leg squat tasks, particularly in symptomatic or injured populations. Conversely, displacement-related COP variables should be interpreted with caution in rehabilitation and return-to-sport contexts, as observed differences may not exceed absolute reliability thresholds required to support individual-level clinical decision-making.

4.2. Agreement Between Pairs of Single-Leg Squat Tasks

The findings of the present study generally indicate that the CSLSQ–FRSTD pairing demonstrated good-to-excellent ICC point estimates and lower measurement error for 95% CEA, VL, and RMS-Y, whereas the CSLSQ–ANYBT pairing demonstrated higher ICC point estimates for PL and comparable ICCs for RMS-Y on the dominant side. The ANYBT–FRSTD pairing showed the lowest relative and absolute agreement for most COP measures. Across all task combinations, the RMS-X variable on the dominant side and all measures derived from the non-dominant side consistently showed reduced agreement, indicating lower reliability for these outcomes.
The existing literature on COP-based comparisons among single-leg squat test variations is limited, and the few available studies are not sufficiently relevant to the present investigation to allow direct comparison [39,52]. Indirect evidence related to the kinematics and muscle activation patterns observed during the single-leg squat tasks examined in this study may help explain the comparable inter-task kinematic behavior and, to some extent, the agreement observed between the paired tests. The relatively high agreement observed between unipedal squat task pairs, based on ICCs point estimates for both consistency and absolute agreement, is supported by previous biomechanical findings demonstrating similar sagittal-plane hip, knee, and ankle kinematics by both CSLSQ and FRSTD, despite some differences in trunk and pelvic motion [25]. These findings are confirmed by Bellizzi et al. [79], who demonstrated that single-leg squat tasks, such as the CSLSQ and FRSTD, share similar lower-limb mechanics. Both tasks require coordinated hip flexion, knee flexion, and ankle dorsiflexion during vertical descent, along with frontal-plane stabilization at the hip and knee to control valgus–varus motion. Others have also shown that during the anterior reach in YBT, the key kinematic determinants of performance include increased hip and knee flexion angles and greater ankle dorsiflexion [80,81], which is comparable to the sagittal-plane hip and knee mechanics demonstrated during the CSLSQ and FRSTD [25,79].
Kinetically, all tasks also produce comparable sagittal-plane knee joint moments, reflecting similar extensor demands despite task-specific differences in knee flexion range of motion [79,80]. In addition, EMG studies have demonstrated a broadly similar neuromuscular profile and comparable activation patterns across tasks, particularly in the hip abductors, knee extensors, ankle stabilizers, and trunk extensors [82,83,84,85,86]. These findings support the notion that, despite technique-related differences mainly driven by squat depth, movement velocity, or step height, all tasks show reasonably good agreement in terms of neuromuscular control metrics.
However, the absolute agreement values revealed a clear distinction between task pairs, with the CSLSQ–FRSTD pairing demonstrating the lower or comparable SEM and 95%MDC values, as well as narrower 95%LOA, particularly in 95%CEA, VL, and RMS-Y values compared to CSLSQ-ANYBT pair. One factor contributing to this distinction between task pairs is the inflation of measurement error driven by the higher COP-derived values recorded during ANYBT relative to the other tasks. The ANYBT requires the participant to displace the center of mass markedly forward while maintaining single-leg support, a strategy that depends on substantial hip and knee flexion, and ankle dorsiflexion [80,81]. This exaggerated anterior shift of the body’s mass increases the mechanical challenge to postural control and necessitates larger, more frequent adjustments in ground-reaction forces, which directly elevate the COP excursion. Previous force-plate investigations of YBT and SEBT tasks confirm that the anterior reach consistently elicits the highest COP displacements compared with other reach directions or less demanding balance tasks [55,87,88]. These increased dynamic-stability demands likely increased measurement variability in the present study, thereby reducing absolute agreement between ANYBT and the other squat-based tasks despite similarities in certain kinematic features.

Clinical Implications for Agreement Between Pairs of Single-Leg Squat Tasks

From a clinical perspective, the present findings suggest that certain single-leg squat tasks may be used interchangeably; however, this is restricted to selected COP metrics. The relatively high agreement observed for the CSLSQ–FRSTD pairing for 95% CEA, VL, and RMS-Y, as well as for the CSLSQ–ANYBT pairing for PL and VL on the dominant side, indicates that these tasks may provide comparable information regarding postural control, thereby supporting their interchangeable use when monitoring neuromuscular performance over time. This interchangeability may be particularly advantageous when consistent assessment of controlled movement patterns is required across different phases of rehabilitation, as clinicians make decisions regarding an individual’s readiness for progression and reactivation.
In contrast, the lower agreement and greater measurement variability that is generally observed for task pairings involving ANYBT suggest limited interchangeability with unipedal squat-based tasks, particularly for absolute change detection. While ANYBT may be appropriate for assessing dynamic balance and functional reach capacity in later-stage rehabilitation or return-to-sport contexts, its higher COP excursion and inflated measurement error indicate that outcomes derived from this task should not be directly substituted for those obtained particularly from FRSTD. Accordingly, clinicians should avoid interpreting changes across these tasks as equivalent and should consider task-specific reliability thresholds when using them to inform progression or return-to-sport decisions.
Collectively, these observations emphasize that interchangeability among single-leg squat assessments is task- and variable-specific, and consistent use of the same assessment is preferable when tracking individual change over time. This conclusion is further supported by findings from systematic reviews and meta-analyses demonstrating that balance performance is largely task-specific and that balance training in healthy populations improves performance predominantly in the trained task, with only minor or no transfer to non-trained tasks [89,90].

4.3. Limitations

Several limitations should be acknowledged when interpreting the present findings. The study was conducted in a healthy population, which may limit generalizability to injured or clinical cohorts. Reliability was evaluated for a specific set of dynamic single-leg tasks under controlled laboratory conditions, and the results may not extend to other task variations or clinical environments. Only short-term reliability was assessed, and the observed variability may partly reflect limited task familiarization prior to testing, particularly for the ANYBT task, mediolateral stability (RMS-X), and the non-dominant limb, which typically exhibits reduced motor control specialization and lower sensorimotor consistency [70,71,72]. A further limitation of the present study is that fatigue was not formally monitored or controlled across testing sessions or task repetitions. However, the short and submaximal task duration, standardized rest intervals, randomized task order, and low variability in knee flexion ROM (%CV) suggest that fatigue effects, if present, were likely minimal. Nevertheless, perceptual or physiological indices of fatigue were not collected, and future studies should incorporate explicit fatigue measures to enhance methodological transparency and internal validity.

5. Conclusions

Overall, our findings revealed that most COP variables, particularly 95%CEA, PL, VL, and RMS-Y, demonstrated good-to-excellent reliability, with the FRSTD showing the most favorable balance between measurement consistency and error. Reliability was generally higher on the dominant limb, whereas greater variability was observed for RMS-X and on the non-dominant side. Agreement analysis indicated that the CSLSQ-FRSTD task pair can be used interchangeably for certain COP-derived parameters (e.g., 95%CEA, VL, and RMS-Y), especially on the dominant limb, while caution is warranted when interpreting results from the ANYBT due to higher absolute error. The findings support the selective application of dynamic single-leg tasks and COP parameters for assessment and monitoring in the contexts of injury prevention, rehabilitation, and return-to-sport decision-making.

Supplementary Materials

The following supporting information can be downloaded at: https://www.mdpi.com/article/10.3390/app16021147/s1, Figure S1: Between-sessions Bland–Altman plots for the dominant and non-dominant sides of the 95% confidence ellipse area (95% CEA; a–c), path length (PL; d–f), velocity (VL; g–i), root mean square in the mediolateral axis (RMS-X; j–l), and root mean square in the anteroposterior axis (RMS-Y; m–o); Figure S2: Between-task Bland–Altman plots for the dominant and non-dominant sides of the 95% confidence ellipse area (95% CEA; a–c), path length (PL; d–f), velocity (VL; g–i), root mean square in the mediolateral axis (RMS-X; j–l), and root mean square in the anteroposterior axis (RMS-Y; m–o).

Author Contributions

Conceptualization, V.C., I.K. and D.M.; methodology, V.C., I.K. and D.M.; validation, D.M.; formal analysis, V.C. and I.K.; investigation, V.C. and I.K.; resources, D.M.; data curation, V.C. and I.K.; writing—original draft preparation, V.C., I.K. and D.M.; writing—review and editing, D.M.; visualization, D.M.; supervision, D.M.; project administration, V.C. and I.K. All authors have read and agreed to the published version of the manuscript.

Funding

This research received no external funding.

Institutional Review Board Statement

The study was conducted in accordance with the Declaration of Helsinki and approved by the Internal Research Ethics and Bioethics Committee of the School of Physical Education and Sport Science, of the National and Kapodistrian University of Athens (1664/12 September 2024).

Informed Consent Statement

Informed consent was obtained from all subjects involved in the study.

Data Availability Statement

The data presented in this study are available upon request from the corresponding author.

Conflicts of Interest

The authors declare no conflicts of interest.

References

  1. Bailey, R.; Selfe, J.; Richards, J. The Single Leg Squat Test in the Assessment of Musculoskeletal Function: A Review. Physiother. Pract. Res. 2011, 32, 18–23. [Google Scholar] [CrossRef]
  2. Bishop, C.; Brierley, S.; Read, P.; Turner, A. Professional Strength & Conditioning; UKSCA: Lytham St. Annes, UK, 2016; pp. 17–26. [Google Scholar]
  3. Horan, S.A.; Watson, S.L.; Carty, C.P.; Sartori, M.; Weeks, B.K. Lower-Limb Kinematics of Single-Leg Squat Performance in Young Adults. Physiother. Can. 2014, 66, 228–233. [Google Scholar] [CrossRef]
  4. Khuu, A.; Foch, E.; Lewis, C.L. Not All Single Leg Squats Are Equal: A Biomechanical Comparison of Three Variations. Int. J. Sports Phys. Ther. 2016, 11, 201–211. [Google Scholar]
  5. Zeller, B.L.; McCrory, J.L.; Ben Kibler, W.; Uhl, T.L. Differences in Kinematics and Electromyographic Activity between Men and Women during the Single-Legged Squat. Am. J. Sports Med. 2003, 31, 449–456. [Google Scholar] [CrossRef] [PubMed]
  6. DeForest, B.A.; Cantrell, G.S.; Schilling, B.K. Muscle Activity in Single- vs. Double-Leg Squats. Int. J. Exerc. Sci. 2014, 7, 302–310. [Google Scholar] [CrossRef] [PubMed]
  7. Boudreau, S.N.; Dwyer, M.K.; Mattacola, C.G.; Lattermann, C.; Uhl, T.L.; McKeon, J.M. Hip-Muscle Activation during the Lunge, Single-Leg Squat, and Step-Up-and-Over Exercises. J. Sport Rehabil. 2009, 18, 91–103. [Google Scholar] [CrossRef]
  8. Khuu, A.; Loverro, K.L.; Lewis, C.L. Muscle Activation During Single-Legged Squat Is Affected by Position of the Nonstance Limb. J. Athl. Train. 2022, 57, 170–176. [Google Scholar] [CrossRef]
  9. Secomb, J.L.; Tran, T.T.; Lundgren, L.; Farley, O.R.L.; Sheppard, J.M. Single-Leg Squat Progressions. Strength Cond. J. 2014, 36, 68–71. [Google Scholar] [CrossRef]
  10. Mattacola, C.G.; Livengood, A.L.; DiMattia, M.A.; Uhl, T.L. “Dynamic Trendelenburg”: Single-Leg-Squat Test for Gluteus Medius Strength. Athl. Ther. Today 2004, 9, 24–25. [Google Scholar] [CrossRef]
  11. Räisänen, A.; Pasanen, K.; Krosshaug, T.; Avela, J.; Perttunen, J.; Parkkari, J. Single-Leg Squat as a Tool to Evaluate Young Athletes’ Frontal Plane Knee Control. Clin. J. Sport Med. 2016, 26, 478–482. [Google Scholar] [CrossRef]
  12. Carroll, L.A.; Kivlan, B.R.; Martin, R.L.; Phelps, A.L.; Carcia, C.R. The Single Leg Squat Test: A “Top-down” or “Bottom-up” Functional Performance Test? Int. J. Sports Phys. Ther. 2021, 16, 360–370. [Google Scholar] [CrossRef] [PubMed]
  13. Herrington, L. Knee Valgus Angle during Single Leg Squat and Landing in Patellofemoral Pain Patients and Controls. Knee 2014, 21, 514–517. [Google Scholar] [CrossRef]
  14. Jamaludin, N.I.; Sahabuddin, F.N.A.; Rasudin, N.S.; Shaharudin, S. The Concurrent Validity and Reliability of Single Leg Squat Among Physically Active Females with and without Dynamic Knee Valgus. Int. J. Sports Phys. Ther. 2022, 17, 574–584. [Google Scholar] [CrossRef]
  15. Karimi, K.; Seidi, F.; Mousavi, S.H.; Alghosi, M.; Morad, N.H. Comparison of Postural Sway in Individuals with and without Dynamic Knee Valgus. BMC Sports Sci. Med. Rehabil. 2023, 15, 75. [Google Scholar] [CrossRef]
  16. Wilczyński, B.; Radzimiński, Ł.; Sobierajska-Rek, A.; Zorena, K. Association between Selected Screening Tests and Knee Alignment in Single-Leg Tasks among Young Football Players. Int. J. Environ. Res. Public Health 2022, 19, 6719. [Google Scholar] [CrossRef]
  17. Ugalde, V.; Brockman, C.; Bailowitz, Z.; Pollard, C.D. Single Leg Squat Test and Its Relationship to Dynamic Knee Valgus and Injury Risk Screening. PM R 2015, 7, 229–235. [Google Scholar] [CrossRef]
  18. Carvalho, C.; Serrão, F.V.; Pisani, G.K.; Martinez, A.F.; Serrão, P.R.M.d.S. Frontal Plane Biomechanics during Single-Leg Squat and Hip Strength in Patients with Isolated Patellofemoral Osteoarthritis Compared to Matched Controls: A Cross-Sectional Study. PLoS ONE 2022, 17, e0267446. [Google Scholar] [CrossRef]
  19. McGovern, R.P.; Martin, R.L.; Christoforetti, J.J.; Kivlan, B.R. Evidence-Based Procedures for Performing the Single Leg Squat and Step-Down Tests in Evaluation of Non-Arthritic Hip Pain: A Literature Review. Int. J. Sports Phys. Ther. 2018, 13, 526–536. [Google Scholar] [CrossRef]
  20. Ferreira, C.L.; Barton, G.; Borges, L.D.; dos Anjos Rabelo, N.D.; Politti, F.; Lucareli, P.R.G. Step down Tests Are the Tasks That Most Differentiate the Kinematics of Women with Patellofemoral Pain Compared to Asymptomatic Controls. Gait Posture 2019, 72, 129–134. [Google Scholar] [CrossRef]
  21. Nakagawa, T.H.; Moriya, E.T.U.; MacIel, C.D.; Serrão, F.V. Trunk, Pelvis, Hip, and Knee Kinematics, Hip Strength, and Gluteal Muscle Activation during a Single-Leg Squat in Males and Females with and without Patellofemoral Pain Syndrome. J. Orthop. Sports Phys. Ther. 2012, 42, 491–501. [Google Scholar] [CrossRef] [PubMed]
  22. Yamazaki, J.; Muneta, T.; Ju, Y.J.; Sekiya, I. Differences in Kinematics of Single Leg Squatting between Anterior Cruciate Ligament-injured Patients and Healthy Controls. Knee Surg. Sports Traumatol. Arthrosc. 2010, 18, 56–63. [Google Scholar] [CrossRef]
  23. Yokoyama, S.; Fukuda, W.; Ikeno, Y.; Kataoka, Y.; Horan, S.A. Lower Limb Kinematics of Single-Leg Squat Performance in Patients with Anterior Cruciate Ligament Deficiency. J. Phys. Ther. Sci. 2021, 33, 429–433. [Google Scholar] [CrossRef]
  24. Werner, D.; Casey, L.; Myers, E.; Barrios, J.A. Lower Limb Squat Biomechanics and Select Clinical Measures in Chronic Ankle Instability. Clin. Biomech. 2024, 113, 106211. [Google Scholar] [CrossRef]
  25. Lewis, C.L.; Foch, E.; Luko, M.M.; Loverro, K.L.; Khuu, A. Differences in Lower Extremity and Trunk Kinematics between Single Leg Squat and Step down Tasks. PLoS ONE 2015, 10, e0126258. [Google Scholar] [CrossRef]
  26. Rabello, R.; Bertozzi, F.; Brunetti, C.; Silva Zandonato, L.; Bonotti, A.; Rodrigues, R.; Sforza, C. The Influence of Task Type and Movement Speed on Lower Limb Kinematics during Single-Leg Tasks. Gait Posture 2022, 96, 109–116. [Google Scholar] [CrossRef] [PubMed]
  27. Khou, S.B.; Saki, F.; Tahayori, B. Muscle Activation in the Lower Limb Muscles in Individuals with Dynamic Knee Valgus during Single-Leg and Overhead Squats: A Meta-Analysis Study. BMC Musculoskelet. Disord. 2024, 25, 652. [Google Scholar] [CrossRef]
  28. Lehecka, B.; Black, J.; Jindra, J.; McCloud, C.; Pummell, C. The Single-Leg Wall Squat Test: An Assessment of Functional Lower Extremity Endurance in University Students. Int. J. Sports Phys. Ther. 2025, 20, 1198–1202. [Google Scholar] [CrossRef]
  29. Avcı, E.E.; Kartal, G.; Çakır, F.; Polat, M.G.; Demirbüken, İ. Squat Task as an Assessment Tool for Detecting Injury Risk: A Systematic Review. J. Bodyw. Mov. Ther. 2026, 46, 476–482. [Google Scholar] [CrossRef]
  30. Kawasaki, T.; Ohji, S.; Hirohata, K.; Aizawa, J.; Ohmi, T.; Okamoto, S.; Terada, H.; Mitomo, S.; Koga, H.; Yagishita, K. Patients Who Do Not Achieve 90% of the Nonoperative Side on the Anterior Reach Y-Balance Test at 3 Months After ACL Reconstruction Are More Likely to Have Persistent Knee Extension Strength Asymmetry at 6 Months Postoperatively. Int. J. Sports Phys. Ther. 2025, 20, 1448–1456. [Google Scholar] [CrossRef]
  31. Powers, C.M. The Influence of Abnormal Hip Mechanics on Knee Injury: A Biomechanical Perspective. J. Orthop. Sports Phys. Ther. 2010, 40, 42–51. [Google Scholar] [CrossRef]
  32. Dwyer, M.K.; Boudreau, S.N.; Mattacola, C.G.; Uhl, T.L.; Lattermann, C. Comparison of Lower Extremity Kinematics and Hip Muscle Activation During Rehabilitation Tasks Between Sexes. J. Athl. Train. 2010, 45, 181–190. [Google Scholar] [CrossRef]
  33. Khuu, A.; Lewis, C.L. Position of the Non-Stance Leg during the Single Leg Squat Affects Females and Males Differently. Hum. Mov. Sci. 2019, 67, 102506. [Google Scholar] [CrossRef]
  34. Gianola, S.; Castellini, G.; Stucovitz, E.; Nardo, A.; Banfi, G. Single Leg Squat Performance in Physically and Non-Physically Active Individuals: A Cross-Sectional Study. BMC Musculoskelet. Disord. 2017, 18, 299. [Google Scholar] [CrossRef] [PubMed]
  35. Munro, A.; Herrington, L.; Comfort, P. The Relationship Between 2-Dimensional Knee-Valgus Angles During Single-Leg Squat, Single-Leg-Land, and Drop-Jump Screening Tests. J. Sport Rehabil. 2017, 26, 72–77. [Google Scholar] [CrossRef]
  36. Purushothaman, V.K.; Ahmed Ibrahim Didi, N.U.; Subramaniam, A.; Subbarayalu, A.V.; Prabaharan, S.; Ameer, M.; Sheriff, A.; Prathap, A.; Rubavathi Marimuthu, P. Association between Foot Morphology and Dynamic Knee Valgus during Single Leg Squats in Recreational Male Football Players: A Cross-Sectional Study. Human Mov. 2025, 26, 142–151. [Google Scholar] [CrossRef]
  37. Bazett-Jones, D.M.; Waiteman, M.C.; Glaviano, N.R. Depth of Single-Leg Squat Influences the Two-Dimensional Analysis of Knee, Hip, and Pelvis Frontal Plane Motion in Pain-Free Women. Gait Posture 2022, 98, 279–282. [Google Scholar] [CrossRef]
  38. Talarico, M.K.; Lynall, R.C.; Mauntel, T.C.; Wasserman, E.B.; Padua, D.A.; Mihalik, J.P. Effect of Single-Leg Squat Speed and Depth on Dynamic Postural Control under Single-Task and Dual-Task Paradigms. J. Appl. Biomech. 2019, 35, 272–279. [Google Scholar] [CrossRef]
  39. Knoll, M.G.; Davidge, M.; Wraspir, C.; Korak, J.A. Comparisons of Single Leg Squat Variations on Lower Limb Muscle Activation and Center of Pressure Alterations. Int. J. Exerc. Sci. 2019, 12, 950–959. [Google Scholar] [CrossRef]
  40. Eliassen, W.; Saeterbakken, A.H.; van den Tillaar, R. Comparison of Bilateral and Unilateral Squat Exercises on Barbell Kinematics and Muscle Activation. Int. J. Sports Phys. Ther. 2018, 13, 871–881. [Google Scholar] [CrossRef]
  41. Plisky, P.; Schwartkopf-Phifer, K.; Huebner, B.; Garner, M.B.; Bullock, G. Systematic Review and Meta-Analysis of the Y-Balance Test Lower Quarter: Reliability, Discriminant Validity, and Predictive Validity. Int. J. Sports Phys. Ther. 2021, 16, 1190–1209. [Google Scholar] [CrossRef]
  42. Kaur, N.; Bhanot, K.; Ferreira, G. Lower Extremity and Trunk Electromyographic Muscle Activity During Performance of the Y-Balance Test on Stable and Unstable Surfaces. Int. J. Sports Phys. Ther. 2022, 17, 483–492. [Google Scholar] [CrossRef] [PubMed]
  43. Robinson, R.; Gribble, P. Kinematic Predictors of Performance on the Star Excursion Balance Test. J. Sport. Rehabil. 2008, 17, 347–357. [Google Scholar] [CrossRef]
  44. Gribble, P.A.; Hertel, J.; Plisky, P. Using the Star Excursion Balance Test to Assess Dynamic Postural-Control Deficits and Outcomes in Lower Extremity Injury: A Literature and Systematic Review. J. Athl. Train. 2012, 47, 339–357. [Google Scholar] [CrossRef] [PubMed]
  45. Peleg, S.; Pelleg-Kallevag, R.; Almog, Y.; Herman, G.; Nakdimon, O.; Arnon, M.; Dar, G. Forward Step down Test—Clinical Rating Is Correlated with Joint Angles of the Pelvis and Hip: An Observational Study. BMC Musculoskelet. Disord. 2023, 24, 807. [Google Scholar] [CrossRef]
  46. Kim, H.; Yoo, H.; Hwang, U.; Kwon, O. Comparison of Dynamic Knee Valgus During Single-Leg Step Down Between People With and Without Pronated Foot Using Two-Dimensional Video Analysis. Phys. Ther. Korea 2021, 28, 266–272. [Google Scholar] [CrossRef]
  47. Pollock, A.S.; Durward, B.R.; Rowe, P.J.; Paul, J.P. What Is Balance? Clin. Rehabil. 2000, 14, 402–406. [Google Scholar] [CrossRef] [PubMed]
  48. Paillard, T.; Noé, F. Techniques and Methods for Testing the Postural Function in Healthy and Pathological Subjects. Biomed. Res. Int. 2015, 2015, 891390. [Google Scholar] [CrossRef]
  49. Karagiannakis, D.N.; Iatridou, K.I.; Mandalidis, D.G. Ankle Muscles Activation and Postural Stability with Star Excursion Balance Test in Healthy Individuals. Hum. Mov. Sci. 2020, 69, 102563. [Google Scholar] [CrossRef]
  50. Culvenor, A.G.; Alexander, B.C.; Clark, R.A.; Collins, N.J.; Ageberg, E.; Morris, H.G.; Whitehead, T.S.; Crossley, K.M. Dynamic Single-Leg Postural Control Is Impaired Bilaterally Following Anterior Cruciate Ligament Reconstruction: Implications for Reinjury Risk. J. Orthop. Sports Phys. Ther. 2016, 46, 357–364. [Google Scholar] [CrossRef]
  51. Kwok, B.C.; Kong, P.W. Single-Leg Squat Postural Sway Reliability: How Many Trials to Analyze for Chronic Low Back Pain? J. Mech. Med. Biol. 2024, 25, 2450026. [Google Scholar] [CrossRef]
  52. Steingräber, T.; von Grönheim, L.; Wienecke, J.; Regel, R.; Schütz, C.; Schack, T.; Veldema, J. Test–Retest Reliability, Parallel Test Reliability, and Internal Consistency of Balance Assessments in Young Healthy Adults. J. Funct. Morphol. Kinesiol. 2025, 10, 455. [Google Scholar] [CrossRef] [PubMed]
  53. Kapreli, E.; Athanasopoulos, S.; Stavridis, I.; Billis, E.; Strimpakos, N. Waterloo Footedness Questionnaire (WFQ-R): Cross-Cultural Adaptation and Psychometric Properties of Greek Version. Physiotherapy 2015, 101, e721. [Google Scholar] [CrossRef][Green Version]
  54. Stefanouli, V.; Kapreli, E.; Anastasiadi, E.; Nakastsis, A.; Strimpakos, N. Validity and Reliability of the Greek Version of Modified Baecke Questionnaire. Public Health 2022, 203, 58–64. [Google Scholar] [CrossRef]
  55. Mandalidis, D.G.; Karagiannakis, D.N. A Comprehensive Method for Assessing Postural Control during Dynamic Balance Testing. MethodsX 2020, 7, 100964. [Google Scholar] [CrossRef]
  56. Koo, T.K.; Li, M.Y. A Guideline of Selecting and Reporting Intraclass Correlation Coefficients for Reliability Research. J. Chiropr. Med. 2016, 15, 155–163. [Google Scholar] [CrossRef] [PubMed]
  57. Bonett, D.G. Sample Size Requirements for Estimating Intraclass Correlations with Desired Precision. Stat. Med. 2002, 21, 1331–1335. [Google Scholar] [CrossRef] [PubMed]
  58. Walter, S.D.; Eliasziw, M.; Donner, A. Sample Size and Optimal Designs for Reliability Studies. Stat. Med. 1998, 17, 101–110. [Google Scholar] [CrossRef]
  59. de Vet, H.C.W.; Terwee, C.B.; Mokkink, L.B.; Knol, D.L. Measurement in Medicine; Cambridge University Press: Cambridge, UK, 2011; ISBN 9780521133852. [Google Scholar]
  60. Mondal, D.; Candel, M.J.J.M.; Cassese, A.; Vanbelle, S. Confidence Intervals and Sample Size for the ICC in Two-Way ANOVA Models. Stat. Med. 2025, 44, e70106. [Google Scholar] [CrossRef]
  61. Hopkins, W.G. Measures of Reliability in Sports Medicine and Science. Sports Med. 2000, 30, 1–15. [Google Scholar] [CrossRef]
  62. Portney, L.G. Foundations of Clinical Research: Applications to Evidence-Based Practice; F.A. Davis: Philadelphia, PA, USA, 2020; ISBN 9780803661134. [Google Scholar]
  63. Lin, D.; Seol, H.; Nussbaum, M.A.; Madigan, M.L. Reliability of COP-Based Postural Sway Measures and Age-Related Differences. Gait Posture 2008, 28, 337–342. [Google Scholar] [CrossRef]
  64. Ruhe, A.; Fejer, R.; Walker, B. The Test-Retest Reliability of Centre of Pressure Measures in Bipedal Static Task Conditions—A Systematic Review of the Literature. Gait Posture 2010, 32, 436–445. [Google Scholar] [CrossRef]
  65. Pinsault, N.; Vuillerme, N. Test-Retest Reliability of Centre of Foot Pressure Measures to Assess Postural Control during Unperturbed Stance. Med. Eng. Phys. 2009, 31, 276–286. [Google Scholar] [CrossRef]
  66. Kozinc, Ž.; Kuliqi, A.; Obal, I. Reliability of Postural Sway Measures during Single-Leg Stance: Analysis Using Conventional and Complementary Error Metrics. Sport. Sci. Health 2025, 21, 3173–3179. [Google Scholar] [CrossRef]
  67. Baltich, J.; von Tscharner, V.; Zandiyeh, P.; Nigg, B.M. Quantification and Reliability of Center of Pressure Movement during Balance Tasks of Varying Difficulty. Gait Posture 2014, 40, 327–332. [Google Scholar] [CrossRef] [PubMed]
  68. Sadeghi, H.; Allard, P.; Prince, F.; Labelle, H. Symmetry and Limb Dominance in Able-Bodied Gait: A Review. Gait Posture 2000, 12, 34–45. [Google Scholar] [CrossRef] [PubMed]
  69. Han, J.; Anson, J.; Waddington, G.; Adams, R. Proprioceptive Performance of Bilateral Upper and Lower Limb Joints: Side-General and Site-Specific Effects. Exp. Brain Res. 2013, 226, 313–323. [Google Scholar] [CrossRef] [PubMed]
  70. Paillard, T.; Noé, F. Does Monopedal Postural Balance Differ between the Dominant Leg and the Non-Dominant Leg? A Review. Hum. Mov. Sci. 2020, 74, 102686. [Google Scholar] [CrossRef]
  71. Négyesi, J.; Petró, B.; Salman, D.N.; Khandoker, A.; Katona, P.; Wang, Z.; Almaazmi, A.I.S.Q.; Hortobágyi, T.; Váczi, M.; Rácz, K.; et al. Biosignal Processing Methods to Explore the Effects of Side-Dominance on Patterns of Bi- and Unilateral Standing Stability in Healthy Young Adults. Front. Physiol. 2022, 13, 965702. [Google Scholar] [CrossRef]
  72. Sun, Y.; Wu, H.; Zhang, X.; Liu, J.; Wang, G.; Duan, L.; Gao, Y. Sex and Limb Dominance Differences in Postural Control Performance of Young Adults: A Third-Order Polynomial Decay Approach. Symmetry 2025, 17, 1734. [Google Scholar] [CrossRef]
  73. Sung, P.S.; Lee, D. Effects of Visual Input on Postural Stability and Compensatory Strategies in Adults with Chronic Low Back Pain. Vision 2025, 9, 14. [Google Scholar] [CrossRef]
  74. Gokeler, A.; Neuhaus, D.; Benjaminse, A.; Grooms, D.R.; Baumeister, J. Principles of Motor Learning to Support Neuroplasticity After ACL Injury: Implications for Optimizing Performance and Reducing Risk of Second ACL Injury. Sports Med. 2019, 49, 853–865. [Google Scholar] [CrossRef]
  75. Muratori, L.M.; Lamberg, E.M.; Quinn, L.; Duff, S.V. Applying Principles of Motor Learning and Control to Upper Extremity Rehabilitation. J. Hand Ther. 2013, 26, 94–103. [Google Scholar] [CrossRef]
  76. Yalfani, A.; Ahadi, F.; Ahmadi, M. Effects of Pain Exacerbation on Postural Control in Women with Patellofemoral Pain during Single Leg Squat: A Cross-Sectional Study. J. Orthop. Surg. Res. 2024, 19, 462. [Google Scholar] [CrossRef]
  77. Hatton, A.L.; Kemp, J.L.; Brauer, S.G.; Clark, R.A.; Crossley, K.M. Impairment of Dynamic Single-Leg Balance Performance in Individuals with Hip Chondropathy. Arthritis Care Res. 2014, 66, 709–716. [Google Scholar] [CrossRef] [PubMed]
  78. Hatton, A.L.; Crossley, K.M.; Hug, F.; Bouma, J.; Ha, B.; Spaulding, K.L.; Tucker, K. Acute Experimental Hip Muscle Pain Alters Single-Leg Squat Balance in Healthy Young Adults. Gait Posture 2015, 41, 871–876. [Google Scholar] [CrossRef]
  79. Bellizzi, G.L.; Will-Lemos, T.; Resende, R.A.; Cervi, A.C.C.; Santiago, P.R.P.; Fernández-de-las-Peñas, C.; Bevilaqua-Grossi, D.; Florencio, L.L. Knee Kinetics and Kinematics of Young Asymptomatic Participants during Single-Leg Weight-Bearing Tasks: Task and Sex Comparison of a Cross-Sectional Study. Int. J. Environ. Res. Public Health 2022, 19, 5590. [Google Scholar] [CrossRef]
  80. Nelson, S.; Wilson, C.S.; Becker, J. Kinematic and Kinetic Predictors of Y-Balance Test Performance. Int. J. Sports Phys. Ther. 2021, 16, 371–380. [Google Scholar] [CrossRef]
  81. Kang, M.H.; Kim, G.M.; Kwon, O.Y.; Weon, J.H.; Oh, J.S.; An, D.H. Relationship Between the Kinematics of the Trunk and Lower Extremity and Performance on the Y-Balance Test. PM R 2015, 7, 1152–1158. [Google Scholar] [CrossRef] [PubMed]
  82. Glaviano, N.R.; Saliba, S. Differences in Gluteal and Quadriceps Muscle Activation During Weight-Bearing Exercises Between Female Subjects With and Without Patellofemoral Pain. J. Strength Cond. Res. 2022, 36, 55–62. [Google Scholar] [CrossRef] [PubMed]
  83. Mauntel, T.C.; Begalle, R.L.; Cram, T.R.; Frank, B.S.; Hirth, C.J.; Blackburn, T.; Padua, D.A. The Effects of Lower Extremity Muscle Activation and Passive Range of Motion on Single Leg Squat Performance. J. Strength Cond. Res. 2013, 27, 1813–1823. [Google Scholar] [CrossRef]
  84. Han, H.R.; Yi, C.H.; You, S.H.; Cynn, H.S.; Lim, O.B.; Son, J.I. Comparative Effects of 4 Single-Leg Squat Exercises in Subjects with Gluteus Medius Weakness. J. Sport Rehabil. 2018, 27, 513–519. [Google Scholar] [CrossRef]
  85. Bolgla, L.; Cook, N.; Hogarth, K.; Scott, J.; West, C. Trunk and Hip Electromyographic Activity during Single Leg Squat Exercises Do Sex Differences Exist? Int. J. Sports Phys. Ther. 2014, 9, 756–764. [Google Scholar] [PubMed]
  86. Wilson, B.R.; Robertson, K.E.; Burnham, J.M.; Yonz, M.C.; Ireland, M.L.; Noehren, B. The Relationship between Hip Strength and the Y Balance Test. J. Sport Rehabil. 2018, 27, 445–450. [Google Scholar] [CrossRef]
  87. Keith, T.R.; Condon, T.A.; Phillips, A.; McKeon, P.O.; King, D.L. Postural Control Strategies Are Dependent on Reach Direction in the Star Excursion Balance Test. Int. J. Athl. Ther. Train. 2016, 21, 33–39. [Google Scholar] [CrossRef]
  88. Jagger, K.L.; Harper, B. Center of Pressure Velocity and Dynamic Postural Control Strategies Vary During Y-Balance and Star Excursion Balance Testing. Int. J. Sports Phys. Ther. 2024, 19, 849–855. [Google Scholar] [CrossRef]
  89. Kümmel, J.; Kramer, A.; Giboin, L.-S.; Gruber, M. Specificity of Balance Training in Healthy Individuals: A Systematic Review and Meta-Analysis. Sports Med. 2016, 46, 1261–1271. [Google Scholar] [CrossRef]
  90. Lesinski, M.; Hortobágyi, T.; Muehlbauer, T.; Gollhofer, A.; Granacher, U. Dose-Response Relationships of Balance Training in Healthy Young Adults: A Systematic Review and Meta-Analysis. Sports Med. 2015, 45, 557–576. [Google Scholar] [CrossRef]
Figure 1. Starting and ending positions of (a) CSLSQ, (b) ANYBT, and (c) FRSTD executions.
Applsci 16 01147 g001
Figure 2. Sample software display showing the functions used to identify the descent phase of the conventional single-leg squat and the corresponding segment used for COP-based value extraction.
Applsci 16 01147 g002
Table 1. Means ± standard deviations of knee flexion range of motion (ROM), duration, and average velocity achieved across the single leg squat tests examined.
Test CharacteristicSessionCSLSQANYBTFRSTD
DNDDNDDND
Knee flexion ROM (°)1st58.7 ± 10.659.0 ± 8.060.5 ± 10.260.1 ± 11.261.6 ± 10.062.2 ± 7.5
2nd60.4 ± 11.659.1 ± 9.962.6 ± 10.761.4 ± 9.5 *62.1 ± 10.362.7 ± 9.7 **
Knee flexion duration (s)1st3.2 ± 0.33.2 ± 0.23.2 ± 0.23.3 ± 0.43.3 ± 0.33.2 ± 0.3
2nd3.2 ± 0.23.2 ± 0.23.3 ± 0.33.3 ± 0.43.3 ± 0.33.3 ± 0.3
Knee flexion velocity (°/s)1st18.7 ± 4.318.8 ± 3.119.1 ± 3.518.6 ± 4.118.8 ± 3.419.3 ± 2.7
2nd18.9 ± 4.218.5 ± 3.719.4 ± 4.119.0 ± 3.719.3 ± 3.919.4 ± 3.6
Note: CSLSQ = Conventional single-leg squat test; ANYBT = Anterior excursion of Y-Balance Test; FRSTD = Forward step down; D = Dominant; ND = Non-dominant; * p < 0.05 and ** p < 0.001 compared to CSLSQ on the non-dominant side.
Table 2. Mean ± standard deviation values of the center of pressure (COP) variables recorded during the sessions and across the single-leg squat tasks.
COP VariableSessionCSLSQANYBTFRSTD
DNDDNDDND
95%CEA (mm2)1st1581.6 ± 539.21496.8 ± 564.81870.2 ± 522.01969.3 ± 716.31434.6 ± 511.41467.1 ± 530.9
2nd1529.8 ± 636.01446.3 ± 506.81751.1 ± 649.41799.0 ± 650.21430.4 ± 542.31437.9 ± 596.7
PL (mm)1st204.1 ± 34.3202.2 ± 31.8205.7 ± 37.6214.4 ± 45.3212.8 ± 34.3206.2 ± 40.9
2nd202.0 ± 32.9193.2 ± 30.6202.1 ± 37.0203.3 ± 32.5206.2 ± 39.9202.6 ± 39.3
VL (mm·s−1)1st64.7 ± 11.464.4 ± 10.164.8 ± 11.666.6 ± 16.164.8 ± 12.064.3 ± 14.7
2nd63.1 ± 11.960.2 ± 10.562.2 ± 12.262.9 ± 12.064.1 ± 14.962.9 ± 15.9
RMS-X (mm)1st6.2 ± 0.86.2 ± 1.15.7 ± 1.15.7 ± 1.25.8 ± 0.96.0 ± 1.1
2nd6.3 ± 1.15.7 ± 0.85.6 ± 0.95.5 ± 0.96.0 ± 0.95.8 ± 0.8
RMS-Y (mm)1st14.7 ± 4.913.0 ± 5.0 *18.9 ± 4.9 †19.2 ± 5.9 †13.6 ± 5.014.0 ± 4.6
2nd13.9 ± 5.714.2 ± 5.217.9 ± 6.218.2 ± 5.713.8 ± 5.113.9 ± 4.7
Note: CSLSQ = Conventional single-leg squat test; ANYBT = Anterior excursion of Y-Balance Test; FRSTD = Forward step down; 95%CEA = 95% confidence ellipse area; PL = Path length; VL = Velocity; RMS-X = Root mean square in x-axis; RMS-Y = Root mean square in y-axis; * p < 0.01 compared to the dominant side; † p < 0.001 compared to CSLSQ and FRSTD for both dominant and non-dominant side.
Table 3. Relative and absolute reliability indices of the center of pressure (COP) for the dominant side across single-leg squat tasks.
COP VariablesStatisticCSLSQANYBTFRSTD
95%CEA (mm2)ICCCO (95% CI)0.890 (0.762, 0.949)0.801 (0.569, 0.908)0.878 (0.737, 0.944)
ICCAA (95% CI)0.891 (0.767, 0.950)0.796 (0.567, 0.905)0.882 (0.744, 0.946)
SEM (95% MDC)231.8 (642.6)314.0 (870.4)219.6 (608.7)
d ¯  (±95% LoA)51.8 (−676.3, 779.9)119.1 (−822.6, 1060.8)4.2 (−675.9, 684.4)
PL (mm)ICCCO (95% CI)0.814 (0.597, 0.914)0.790 (0.545, 0.903)0.886 (0.754, 0.947)
ICCAA (95% CI)0.818 (0.606, 0.916)0.793 (0.553, 0.904)0.882 (0.747, 0.945)
SEM (95% MDC)17.7 (49.1)20.8 (57.8)15.2 (42.3)
d ¯  (±95% LoA)2.1 (−50.2, 54.4)3.7 (−57.2, 64.6)6.6 (−39.9, 53.2)
VL (mm·s−1)ICCCO (95% CI)0.918 (0.822, 0.962)0.796 (0.559, 0.906)0.924 (0.836, 0.965)
ICCAA (95% CI)0.916 (0.820, 0.961)0.790 (0.554, 0.902)0.926 (0.840, 0.966)
SEM (95% MDC)4.1 (11.4)6.6 (18.4)4.4 (12.1)
d ¯  (±95% LoA)1.6 (−11.1, 14.2)2.6 (−16.6, 21.9)0.8 (−13.3, 14.9)
RMS-X (mm)ICCCO (95% CI)0.585 (0.102, 0.808)0.798 (0.564, 0.907)0.789 (0.544, 0.902)
ICCAA (95% CI)0.593 (0.106, 0.813)0.803 (0.573, 0.909)0.786 (0.544, 0.900)
SEM (95% MDC)0.7 (2.0)0.6 (1.6)0.5 (1.4)
d ¯  (±95% LoA)0.0 (−2.1, 2.1)0.1 (−1.6, 1.7)−0.2 (−1.6, 1.3)
RMS-Y (mm)ICCCO (95% CI)0.940 (0.871, 0.972)0.895 (0.774, 0.952)0.946 (0.884, 0.975)
ICCAA (95% CI)0.936 (0.860, 0.971)0.891 (0.765, 0.949)0.948 (0.888, 0.976)
SEM (95% MDC)1.6 (4.5)2.2 (6.0)1.4 (3.9)
d ¯  (±95% LoA)0.8 (−4.1, 5.8)1.0 (−5.7, 7.7)−0.2 (−4.7, 4.3)
Table 4. Relative and absolute reliability indices of the center of pressure (COP) for the non-dominant side across single-leg squat tasks.
COP VariablesStatisticCSLSQANYBTFRSTD
95%CEA (mm2)ICCCO (95% CI)0.837 (0.647, 0.924)0.868 (0.714, 0.939)0.780 (0.525, 0.898)
ICCAA (95% CI)0.839 (0.654, 0.926)0.857 (0.686, 0.934)0.786 (0.534, 0.901)
SEM (95% MDC)268.4 (743.9)321.9 (892.2)313.7 (869.5)
d ¯  (±95% LoA)50.4 (−737.6, 838.5)170.4 (−746.8, 1087.5)29.2 (−910.2, 968.7)
PL (mm)ICCCO (95% CI)0.809 (0.586, 0.911)0.858 (0.694, 0.934)0.856 (0.689, 0.933)
ICCAA (95% CI)0.794 (0.557, 0.905)0.843 (0.652, 0.928)0.858 (0.695, 0.934)
SEM (95% MDC)17.4 (48.3)20.1 (55.8)18.6 (51.6)
d ¯  (±95% LoA)9.0 (−40.0, 58.0)11.1 * (−43.3, 65.6)3.6 (−52.1, 59.4)
VL (mm·s−1)ICCCO (95% CI)0.840 (0.655, 0.926)0.874 (0.728, 0.942)0.927 (0.842, 0.966)
ICCAA (95% CI)0.808 (0.533, 0.916)0.862 (0.695, 0.937)0.928 (0.845, 0.966)
SEM (95% MDC)5.5 (15.2)6.8 (18.7)5.0 (13.8)
d ¯  (±95% LoA)4.1 ** (−10.9, 19.1)3.6 (−14.9, 22.2)1.4 (−14.3, 17.0)
RMS-X (mm)ICCCO (95% CI)0.408 (−0.280, 0.726)0.620 (0.179, 0.824)0.734 (0.425, 0.877)
ICCAA (95% CI)0.367 (−0.229, 0.691)0.625 (0.186, 0.827)0.732 (0.429, 0.875)
SEM (95% MDC)1.0 (2.7)0.9 (2.4)0.6 (1.8)
d ¯  (±95% LoA)0.6 * (−1.7, 2.8)0.1 (−2.1, 2.4)0.2 (−1.5, 1.9)
RMS-Y (mm)ICCCO (95% CI)0.908 (0.801, 0.957)0.886 (0.753, 0.947)0.780 (0.525, 0.898)
ICCAA (95% CI)0.896 (0.759, 0.953)0.882 (0.747, 0.945)0.786 (0.534, 0.901)
SEM (95% MDC)2.0 (5.5)2.5 (6.8)2.6 (7.3)
d ¯  (±95% LoA)−1.3 * (−7.1, 4.5)1.0 (−6.3, 8.3)0.1 (−7.6, 7.8)
Note: CSLSQ = Conventional single-leg squat test; ANYBT = Anterior excursion of Y-Balance Test; FRSTD = Forward step down; 95%CEA = 95% confidence ellipse area; PL = Path length; VL = Velocity; RMS-X = Root mean square in x-axis; RMS-Y = Root mean square in y-axis; ICCCO and ICCAA = Intraclass correlation coefficient for consistency and agreement, respectively; SEM = Standard error of measurement (calculated based on ICCAA); 95%MDC = Minimal detectable change with 95% confidence; d ¯ = Mean between sessions difference; 95%LoA = 95% Limits of Agreement; * p < 0.05; ** p < 0.01.
Table 5. Relative and absolute reliability indices of center of pressure parameters between single-leg squat task pairs for the dominant side.
COP VariablesStatisticCSLSQ vs. ANYBTANYBT vs. FRSTDCSLSQ vs. FRSTD
95%CEA (mm2)ICCCO (95% CI)0.601 (0.139, 0.816)0.653 (0.249, 0.839)0.884 (0.662, 0.928)
ICCAA (95% CI)0.552 (0.075, 0.788)0.532 (−0.064, 0.792)0.829 (0.627, 0.922)
SEM (95% MDC)437.4 (1212.4)434.4 (1204.2)268.5 (744.2)
d ¯  (±95% LoA)−288.6 * (−1399.2, 822.0)435.6 *** (−592.9, 1464.1)147.0 (−610.7, 904.7)
PL (mm)ICCCO (95% CI)0.906 (0.796, 0.956)0.846 (0.667, 0.929)0.807 (0.582, 0.911)
ICCAA (95% CI)0.908 (0.801, 0.958)0.841 (0.661, 0.926)0.797 (0.566, 0.906)
SEM (95% MDC)13.2 (36.5)17.8 (49.4)18.9 (52.5)
d ¯  (±95% LoA)−1.6 (−43.0, 39.8)−7.0 (−58.5, 44.5)−8.7 (−62.8, 45.4)
VL (mm·s−1)ICCCO (95% CI)0.912 (0.809, 0.959)0.814 (0.599, 0.914)0.907 (0.798, 0.957)
ICCAA (95% CI)0.914 (0.815, 0.960)0.820 (0.608, 0.917)0.910 (0.804, 0.958)
SEM (95% MDC)4.1 (11.4)6.1 (16.9)4.3 (11.8)
d ¯  (±95% LoA)−0.2 (−13.0, 12.7)0.0 (−18.3, 18.3)−0.2 (−13.6, 13.3)
RMS-X (mm)ICCCO (95% CI)0.665 (0.277, 0.845)0.474 (−0.136, 0.757)0.571 (0.073, 0.802)
ICCAA (95% CI)0.611 (0.164, 0.820)0.480 (−0.137, 0.761)0.533 (0.046, 0.778)
SEM (95% MDC)0.7 (1.9)0.9 (2.6)0.7 (1.9)
d ¯  (±95% LoA)0.5 ** (−1.4, 2.4)−0.1 (−2.4, 2.2)0.4 * (−1.3, 2.1)
RMS-Y (mm)ICCCO (95% CI)0.813 (0.597, 0.914)0.734 (0.426, 0.877)0.907 (0.799, 0.957)
ICCAA (95% CI)0.677 (−0.079, 0.882)0.546 (−0.195, 0.820)0.897 (0.769, 0.953)
SEM (95% MDC)3.4 (9.5)4.1 (11.3)1.9 (5.4)
d ¯  (±95% LoA)−4.1 *** (−11.8, 3.6)5.3 *** (−3.6, 14.2)1.1 * (−4.6, 6.8)
Note: * p < 0.05; ** p < 0.01; *** p < 0.001.
Table 6. Relative and absolute reliability indices of center of pressure (COP) parameters between single-leg squat task pairs for the non-dominant side.
COP VariablesStatisticCSLSQ vs. ANYBTANYBT vs. FRSTDCSLSQ vs. FRSTD
95%CEA (mm2)ICCCO (95% CI)0.448 (−0.193, 0.745)0.650 (0.244, 0.838)0.665 (0.277, 0.845)
ICCAA (95% CI)0.377 (−0.180, 0.692)0.541 (−0.033, 0.794)0.673 (0.284, 0.849)
SEM (95% MDC)598.8 (1659.8)547.9 (1518.7)387.8 (1074.9)
d ¯  (±95% LoA)−472.5 ** (−1980.5, 1035.5)502.2 *** (−756.0, 1760.4)29.7 (−1046.2, 1105.6)
PL (mm)ICCCO (95% CI)0.711 (0.376, 0.866)0.680 (0.308, 0.852)0.786 (0.537, 0.901)
ICCAA (95% CI)0.696 (0.359, 0.858)0.680 (0.314, 0.851)0.789 (0.545, 0.902)
SEM (95% MDC)24.9 (68.9)30.4 (84.2)19.7 (54.7)
d ¯  (±95% LoA)−12.2 (−84.8, 60.4)8.2 (−75.0, 91.4)−4.0 (−64.3,56.3)
VL (mm·s−1)ICCCO (95% CI)0.815 (0.601, 0.915)0.841 (0.657, 0.926)0.822 (0.614, 0.917)
ICCAA (95% CI)0.814 (0.604, 0.914)0.841 (0.659, 0.926)0.827 (0.623, 0.920)
SEM (95% MDC)6.6 (18.2)7.6 (21.2)6.0 (16.7)
d ¯  (±95% LoA)−2.2 (−23.0, 18.6)2.3 (−20.1, 24.6)0.1 (−19.2, 19.3)
RMS-X (mm)ICCCO (95% CI)0.664 (0.273, 0.844)0.615 (0.167, 0.822)0.757 (0.474, 0.887)
ICCAA (95% CI)0.625 (0.208, 0.825)0.609 (0.172, 0.817)0.752 (0.472, 0.884)
SEM (95% MDC)0.9 (2.4)0.9 (2.6)0.7 (1.8)
d ¯  (±95% LoA)0.5 * (−1.8, 2.8)−0.3 (−2.8, 2.2)0.2 (−1.7, 2.2)
RMS-Y (mm)ICCCO (95% CI)0.613 (0.163, 0.821)0.827 (0.627, 0.920)0.774 (0.512, 0.895)
ICCAA (95% CI)0.427 (−0.201, 0.740)0.646 (−0.202, 0.878)0.770 (0.511, 0.893)
SEM (95% MDC)4.9 (13.7)4.0 (11.1)2.9 (7.9)
d ¯  (±95% LoA)−6.2 *** (−17.5, 5.1)5.2 *** (−2.7, 13.1)−1.0 (−9.0, 7.0)
Note: CSLSQ = Conventional single-leg squat test; ANYBT = Anterior excursion of Y-Balance Test; FRSTD = Forward step down; 95%CEA = 95% confidence ellipse area; PL = Path length; VL = Velocity; RMS-X = Root mean square in x-axis; RMS-Y = Root mean square in y-axis; ICCCO and ICCAA = Intraclass correlation coefficient for consistency and agreement, respectively; SEM = Standard error of measurement (calculated based on ICCAA); 95%MDC = Minimal detectable change with 95% confidence; d ¯ = Mean between sessions difference; 95%LoA = 95% Limits of Agreement; * p < 0.05; ** p < 0.01; *** p < 0.001.
Disclaimer/Publisher’s Note: The statements, opinions and data contained in all publications are solely those of the individual author(s) and contributor(s) and not of MDPI and/or the editor(s). MDPI and/or the editor(s) disclaim responsibility for any injury to people or property resulting from any ideas, methods, instructions or products referred to in the content.