1. Introduction
Sport performance is shaped by a complex interaction of physical, psychological and social factors that jointly influence both individual and collective outcomes [
1,
2]. In youth sport contexts, these interactions are further influenced by developmental processes, such as differences in biological and psychological maturation between athletes of similar chronological age. Although phenomena such as the relative age effect (RAE) illustrate how these differences can influence performance and participation [
3,
4,
5], they are not the primary focus of the present study.
In recent decades, increasing attention has been paid to the role of emotional and socio-affective processes in sport performance [
6,
7,
8,
9,
10]. Beyond physical and cognitive abilities, variables such as motivation, perceived competence, emotional regulation and social interaction have been shown to play a key role in both high-performance and educational sport settings [
11,
12,
13,
14,
15]. These factors are particularly salient in team sports, where performance emerges not only from individual abilities, but also from the quality of interaction among teammates.
From an integrative perspective, decision-making and performance regulation in sport are influenced by emotional states and group dynamics, as well as by rational information processing [
16,
17]. Athletes experience not only individual emotions, such as stress, enjoyment and anxiety, but also emotions arising from social interaction, including cooperation, competition, acceptance and rejection within the group. These socio-affective processes should be considered in training design to optimise performance in collective contexts [
15,
18].
Within team settings, collective performance cannot be fully understood without considering social interaction processes that emerge as group size increases. The Ringelmann effect describes a reduction in individual contribution as group size grows, a phenomenon traditionally attributed to social loafing and coordination losses [
19,
20]. As group size increases, individual effort becomes less identifiable to others and perceived responsibility may diminish, potentially leading to reduced individual engagement. Strategies such as public evaluation, performance feedback and clear role definition have been proposed as means to counteract these effects and sustain group motivation [
21,
22,
23].
Conversely, the concept of social indispensability highlights situations in which individuals increase their effort when they perceive their contribution as essential to collective success [
24,
25]. In joint tasks, relatively weaker group members may exert greater effort when they believe that underperformance could jeopardise the group outcome, particularly when working alongside more capable teammates [
25,
26]. This phenomenon has been conceptualised as the Köhler effect, which describes motivational gains driven by perceived indispensability and upward social comparison within group contexts [
27].
These social and motivational processes are especially relevant in rowing, a sport characterised by high physical and technical demands and a strong reliance on coordinated collective effort [
28,
29]. Competitive rowing includes boats of varying crew sizes, ranging from individual sculls to larger crews such as fours and eights, where synchronisation and shared pacing are critical determinants of performance. Analyses of competitive rowing have shown that increases in crew size do not necessarily translate into proportional gains in performance, suggesting that coordination and effort regulation may constrain collective output as crew size increases [
30,
31].
Although rowing is performed on water, a substantial portion of training, testing and performance monitoring is conducted using rowing ergometers [
32,
33,
34]. These devices provide reliable and valid measures of individual performance, including power output, stroke rate and endurance capacity, and are widely used to guide training decisions, crew selection and athlete development [
29,
35,
36].
In the present study, crew size was systematically manipulated in an experimental protocol conducted on a rowing ergometer, using four maximal-effort conditions: individual trials, two-person crews, four-person crews and eight-person crews. In collective conditions, individual ergometer displays were covered and the feedback focused exclusively on the overall crew outcome, reducing the identifiability of individual contributions and replicating the conditions that are typically associated with social loafing and the Ringelmann effect. At the same time, smaller crew configurations were expected to increase the visibility of individual effort and the perception of indispensability, particularly among relatively weaker rowers, thereby creating conditions in which motivational gains consistent with the Köhler effect might emerge [
20,
25].
Therefore, the aim of the present study was to examine whether variation in crew size influences individual performance, physiological responses and perceived exertion in adolescent rowers aged 14–17 years, and to determine whether the observed patterns are consistent with the Ringelmann and Köhler effects. Given the limited and inconsistent evidence regarding the expression of these effects in youth sport, an exploratory approach was adopted, with particular attention given to potential differences between age categories (14–15 and 16–17 years). Hypothetically, we believe that younger rowers will be more easily influenced and have a higher perception of effort than older rowers. At the same time, we believe that the Ringelmann effect will apply to them, as an increase in crew size will decrease their individual performance.
2. Materials and Methods
2.1. Participants
The sample consisted of 136 rowers with a mean age of 15.79 years (SD = 1.14). All participants were competitive rowers (76 cadets aged 14–15 years and 60 juniors aged 16–17 years), with a mean rowing experience of 4.21 years (SD = 2.02), who belonged to the two largest and most successful rowing clubs in Spain, according to their results in national championships. All participants competed at national championship level. This sample represented approximately 75% of all nationally competitive rowers in these age groups.
Inclusion in the sample required attendance for at least 90% of weekly training sessions (four sessions per week); participants who did not meet this criterion were excluded.
To conduct the study, the clubs were contacted and a series of meetings were arranged with the coaches of the participating rowers in order to standardise training loads and crew formation. This process was facilitated by scheduling data collection in the weeks leading up to the Spanish Autonomous Community Championships, during which rowers do not compete for their clubs but instead represent the regional federation as a single team.
2.2. Ethical Approval
This study was approved by the Ethics Committee of the University of Pablo de Olavide (24/8-31) and was conducted in accordance with the ethical considerations for Sport and Exercise Science Research [
37] and the principles of the Declaration of Helsinki [
38], which define the ethical guidelines for research on human subjects. Prior to conducting the study, the athletes and their parents/guardians were informed of the objectives of the research and were asked to provide written informed consent for participation and for the publication of the results.
2.3. Materials and Instruments
In this study, eight identical indoor rowing machines were used. Specifically, Concept2 Model D rowing ergometers were used (drag factor 90), which replicate on-water training with high efficiency and transferability. Each of these machines has a display that records and stores data in real time, including total test time, split time every 500 metres, distance covered, stroke rate and power output.
Additional data collected from each athlete included age category, perceived exertion (Borg scale) [
39] and heart rate, which was recorded at the end of each test using a heart rate band (Polar H-9). One band was provided to each rower, who sent the information to a Polar app that was previously installed on a tablet.
2.4. Experimental Design
The participants were assessed using a repeated-measures experimental design in four conditions (individual trials, two-person crews, four-person crews and eight-person crews). The experimental design followed a repeated-measures approach. The independent variables were condition (crew size: individual, two-, four- and eight-person crews) and age category (14–15 vs. 16–17 years). The dependent variables included performance indicators (distance covered, stroke rate and mean power output), physiological responses (heart rate at the end of the test and three minutes post-exercise) and perceived exertion, and they were assessed using the modified Borg scale.
Several measurements were used to assess the DV, including the distance covered by each rower in a three-minute trial, stroke rate and mean power output (W) achieved during the same trial.
The sample was divided into two age groups (14–15 and 16–17 years) because in rowing, athletes aged 14–15 belong to the cadet category, while those aged 16–17 belong to the junior category.
2.5. Procedure
Following the protocol, the tests were conducted at the training facilities where the rowers normally trained, with an interval of 48 h between each trial [
40].
All test instructions were provided by the coaches and were identical for all participants.
Each session began with the usual warm-up, followed by an explanation of the test procedures by the coaches.
On the first day (individual trials: C1), the instructions were as follows: “You are going to perform a three-minute test. You must give your maximum effort, rowing as hard and as fast as you can.” A three-minute test was selected because it corresponds to the time that rowers of this age typically require to complete a 1000-metre race (which is the official distance for these athletes). A distance-based test was not used in order to prevent participants from estimating the distance covered based on their strokes and because it was necessary for the rowing ergometer display to be covered.
Crews for the following experimental conditions (C2: two-person crews; C3: four-person crews and C4: eight-person crews) were formed based on the results obtained by each rower in the individual trials (C1), with each crew composed of rowers who achieved similar performance outcomes in C1.
Each test (C2, C3 and C4) was held after a 48 h rest period. To avoid a possible order or learning effect, the order of the experimental conditions was randomised so that not all rowers completed the tests in the same order. In all cases, coaches emphasised the importance of these tests in determining crew selection for official competitions, instructing athletes to perform at maximum intensity.
To randomise the order, an Excel sheet was used to identify each rower with a number and the rowers were asked to organise those with similar performance (metres, watts and strokes) and form groups of 2, 4 and 8 people. The computer programme was then asked to assign an order to three tests (a, b, c) with the condition that everyone always rowed, that is, if there were 40 rowers in a group, all of them would row in some event, whether it was a double, quartet or group of eight.
Participants were informed that only the crew performance, that is, the total distance covered by all rowers combined, would be considered.
During the experiment, the display screens of all ergometers were covered. In the crew trials (two-person crews, four-person crews and eight-person crews), the ergometers were arranged in a straight line, one behind the other, to simulate the configuration of rowers in an actual boat.
2.6. Data Analysis
Repeated-measures ANOVA with a between-subjects factor was employed to investigate whether individual athlete effort varied depending on the number of crew members. The variables treated as within-subject factors were the measurements taken during the various tests (performance, heart rate and perceived effort), while age category (14–15 years and 16–17 years) was considered a between-subjects factor. p values less than 0.05 were considered statistically significant. Ninety-five percent confidence intervals were calculated for differences in performance, in terms of stroke rate, distance covered (metres) and power output (W); heart rate measurements were recorded at the end of the tests (end-test bpm) and three minutes after exercise completion (3 min bpm); and perceived exertion was assessed by the Borg scale. Student–Newman–Keuls post hoc tests and Bonferroni tests (for pairwise comparisons) were applied in all cases.
Analysis of all study variables was conducted using the SPSS version 25 statistical package (IBM Corp., Armonk, NY, USA) Unless otherwise indicated, data are presented as mean ± SEM (standard error of the mean).
3. Results
The main results obtained are summarized in
Table 1. A repeated-measures ANOVA with a within-subject factor of condition (C1–C4) revealed that, with the exception of heart rate measured three minutes post exercise, the analysis did not meet Mauchly’s sphericity assumption (
p < 0.05) (
Table 2 (part A), and because the Greenhouse–Geisser epsilon (GG) value exceeded 0.75, the Huynh–Feldt correction was applied. Significant effects were observed for performance (stroke rate, metres per minute and power output), final heart rate (bpm) and Borg scale (all
p < 0.01). Heart rate measured three minutes post-exercise was not significantly affected (
p = 0.196). The effect size (ɳ
2) was highly variable, reaching very high values for performance measures, while it was medium-to-low for heart rate and perceived exertion measures, according to Cohen’s criteria. Except for heart rate measured three minutes post-exercise, all analyses achieved very high statistical power values (1 − β), indicating that the probability of detecting a true effect was very high.
When the within-subject variable (condition) was analysed in terms of its interaction with the between-subject variable (age category), the repeated-measures ANOVA again showed that the analysis did not meet Mauchly’s sphericity assumption (
p < 0.05) for all variables (
Table 2 (part B)), except for heart rate measured three minutes after exercise; therefore, the Huynh–Feldt correction was applied. In this case, significant effects were found for performance (metres per minute and power output:
p < 0.01) and for the Borg scale (
p = 0.019). Heart rate measured three minutes after exercise did not show a significant effect (
p = 0.196). The effect size (ɳ
2) values were very low in all cases, while the statistical power values (1 − β) were variable, ranging from very high for the performance analysis (metres per minute and power output) to very low for the remaining variables.
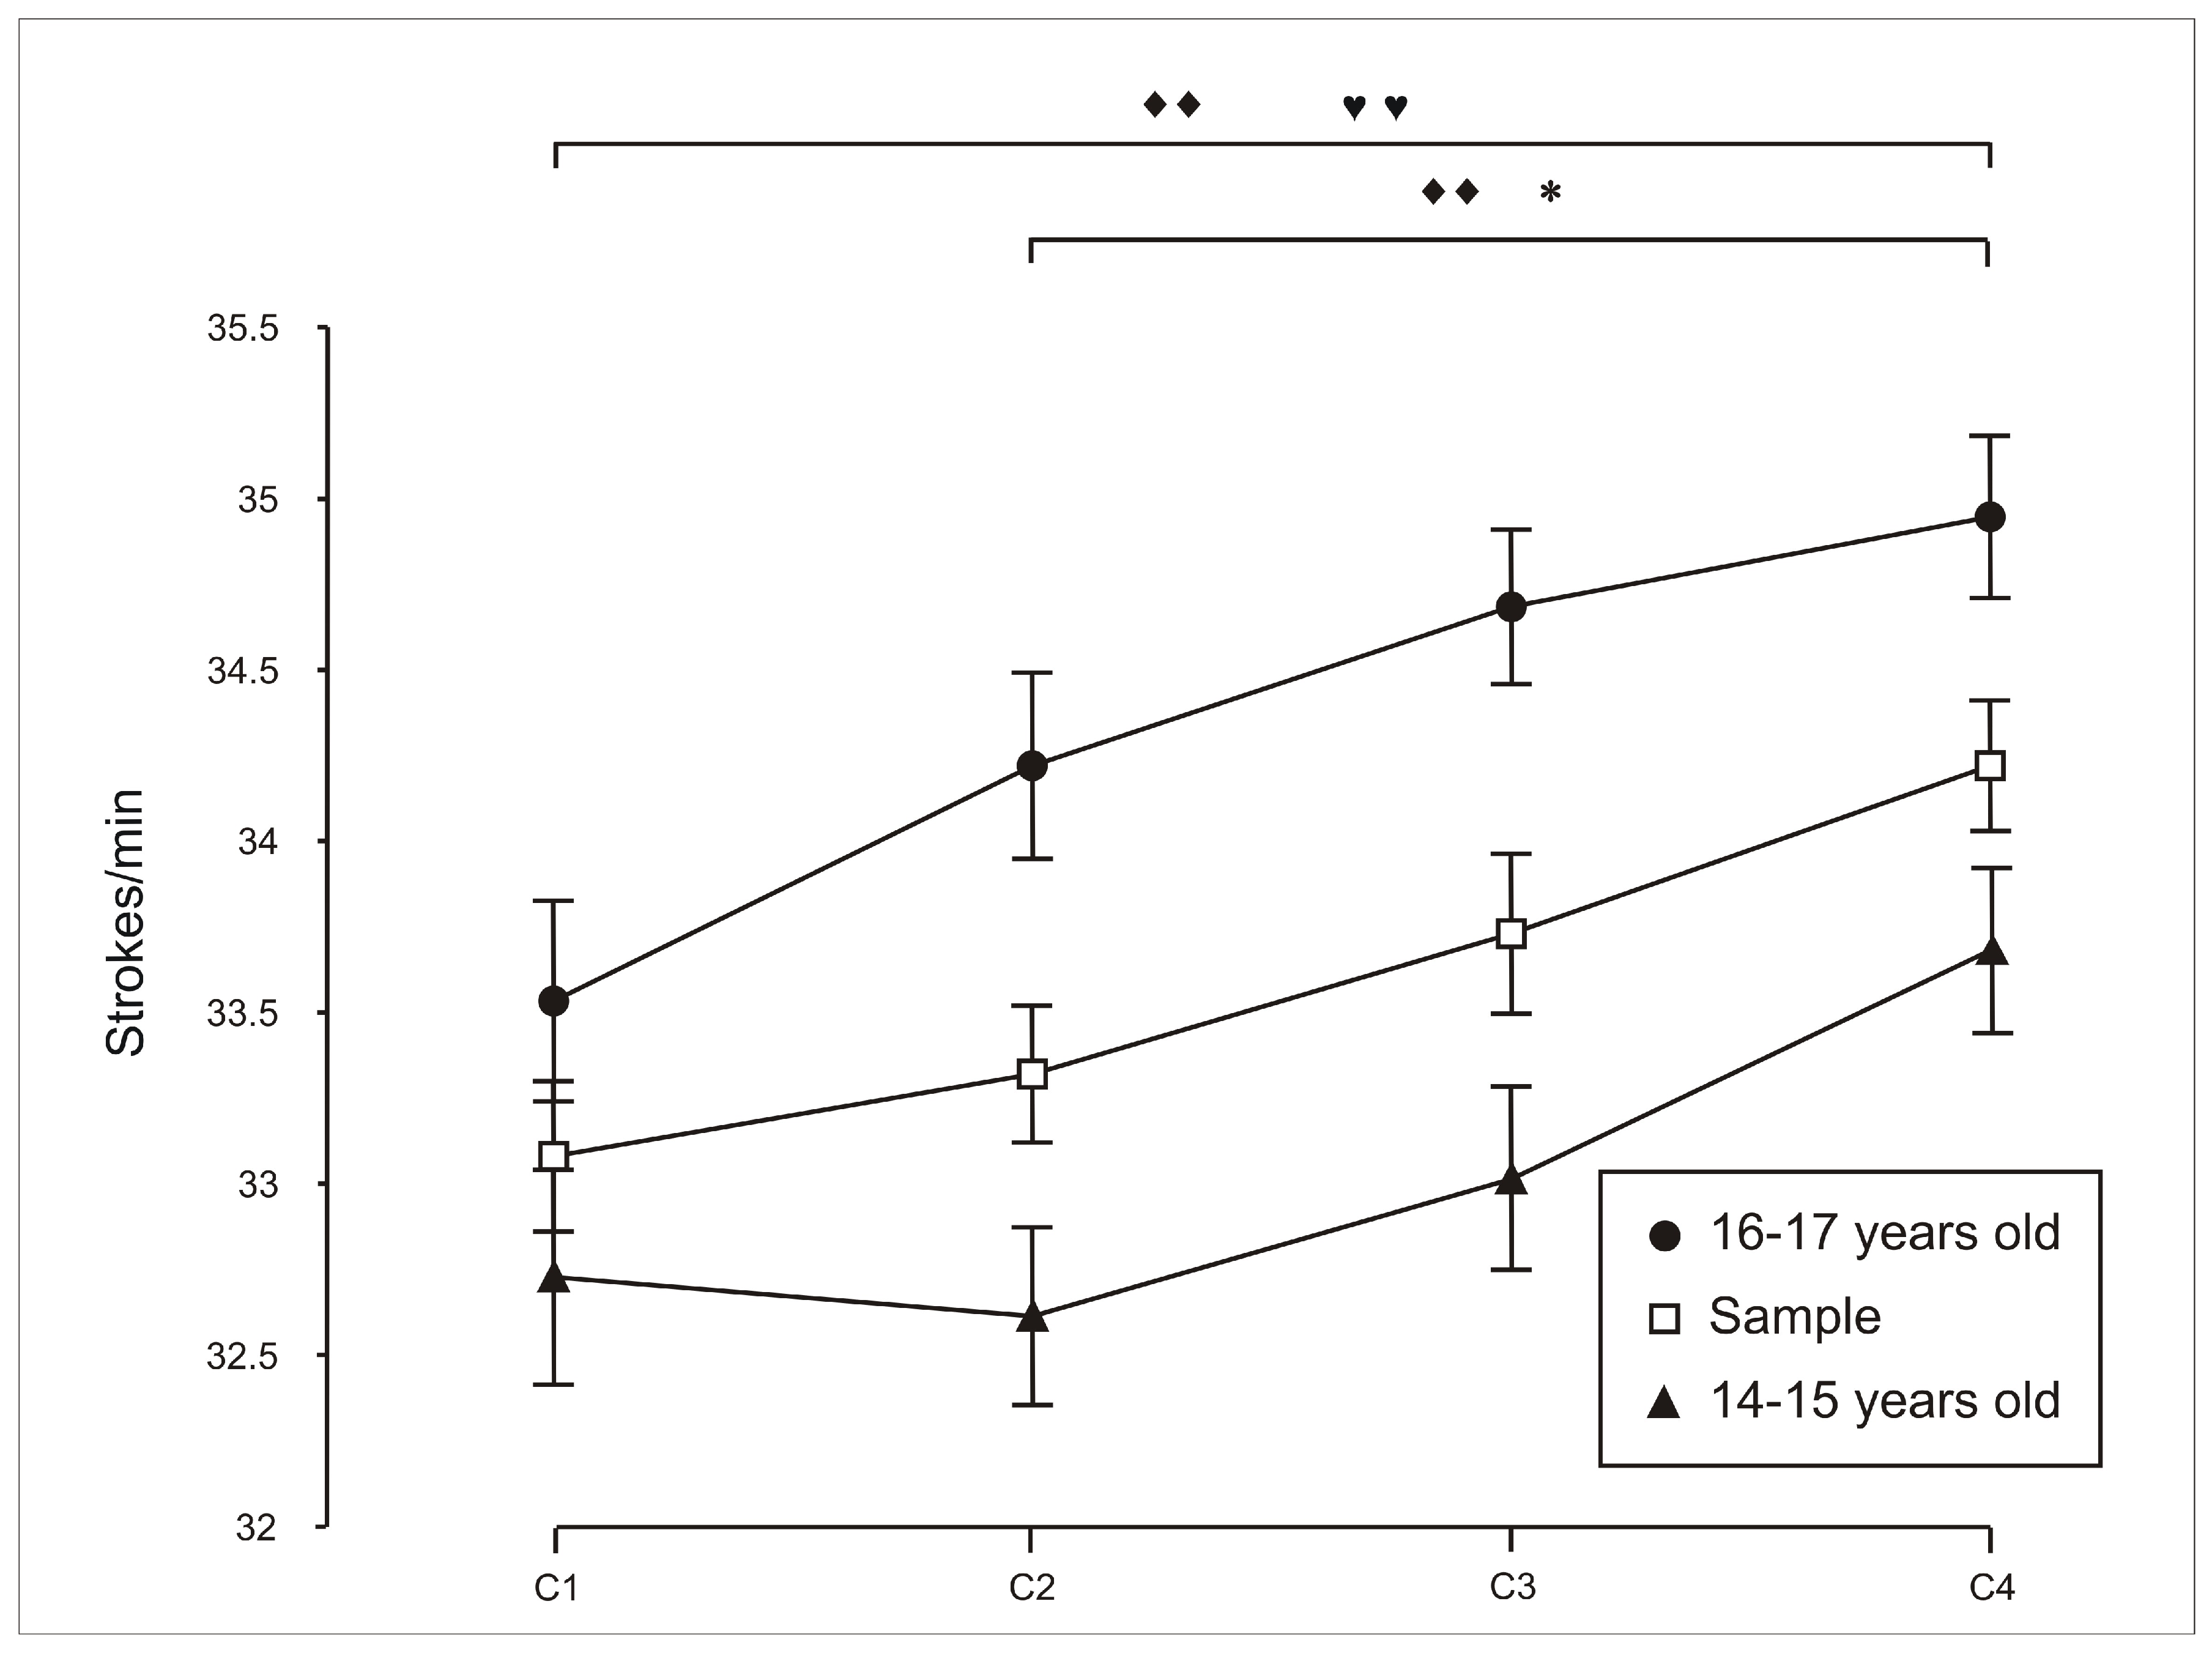
Statistically significant differences were found when analysing performance based on stroke rate (
Figure 1) in the 14–15 years age category (C2 vs. C4,
p = 0.022); in the 16–17 years age category (C1 vs. C4,
p = 0.005) and in the whole sample (C1 vs. C4,
p = 0.001; and C2 vs. C4,
p = 0.003).
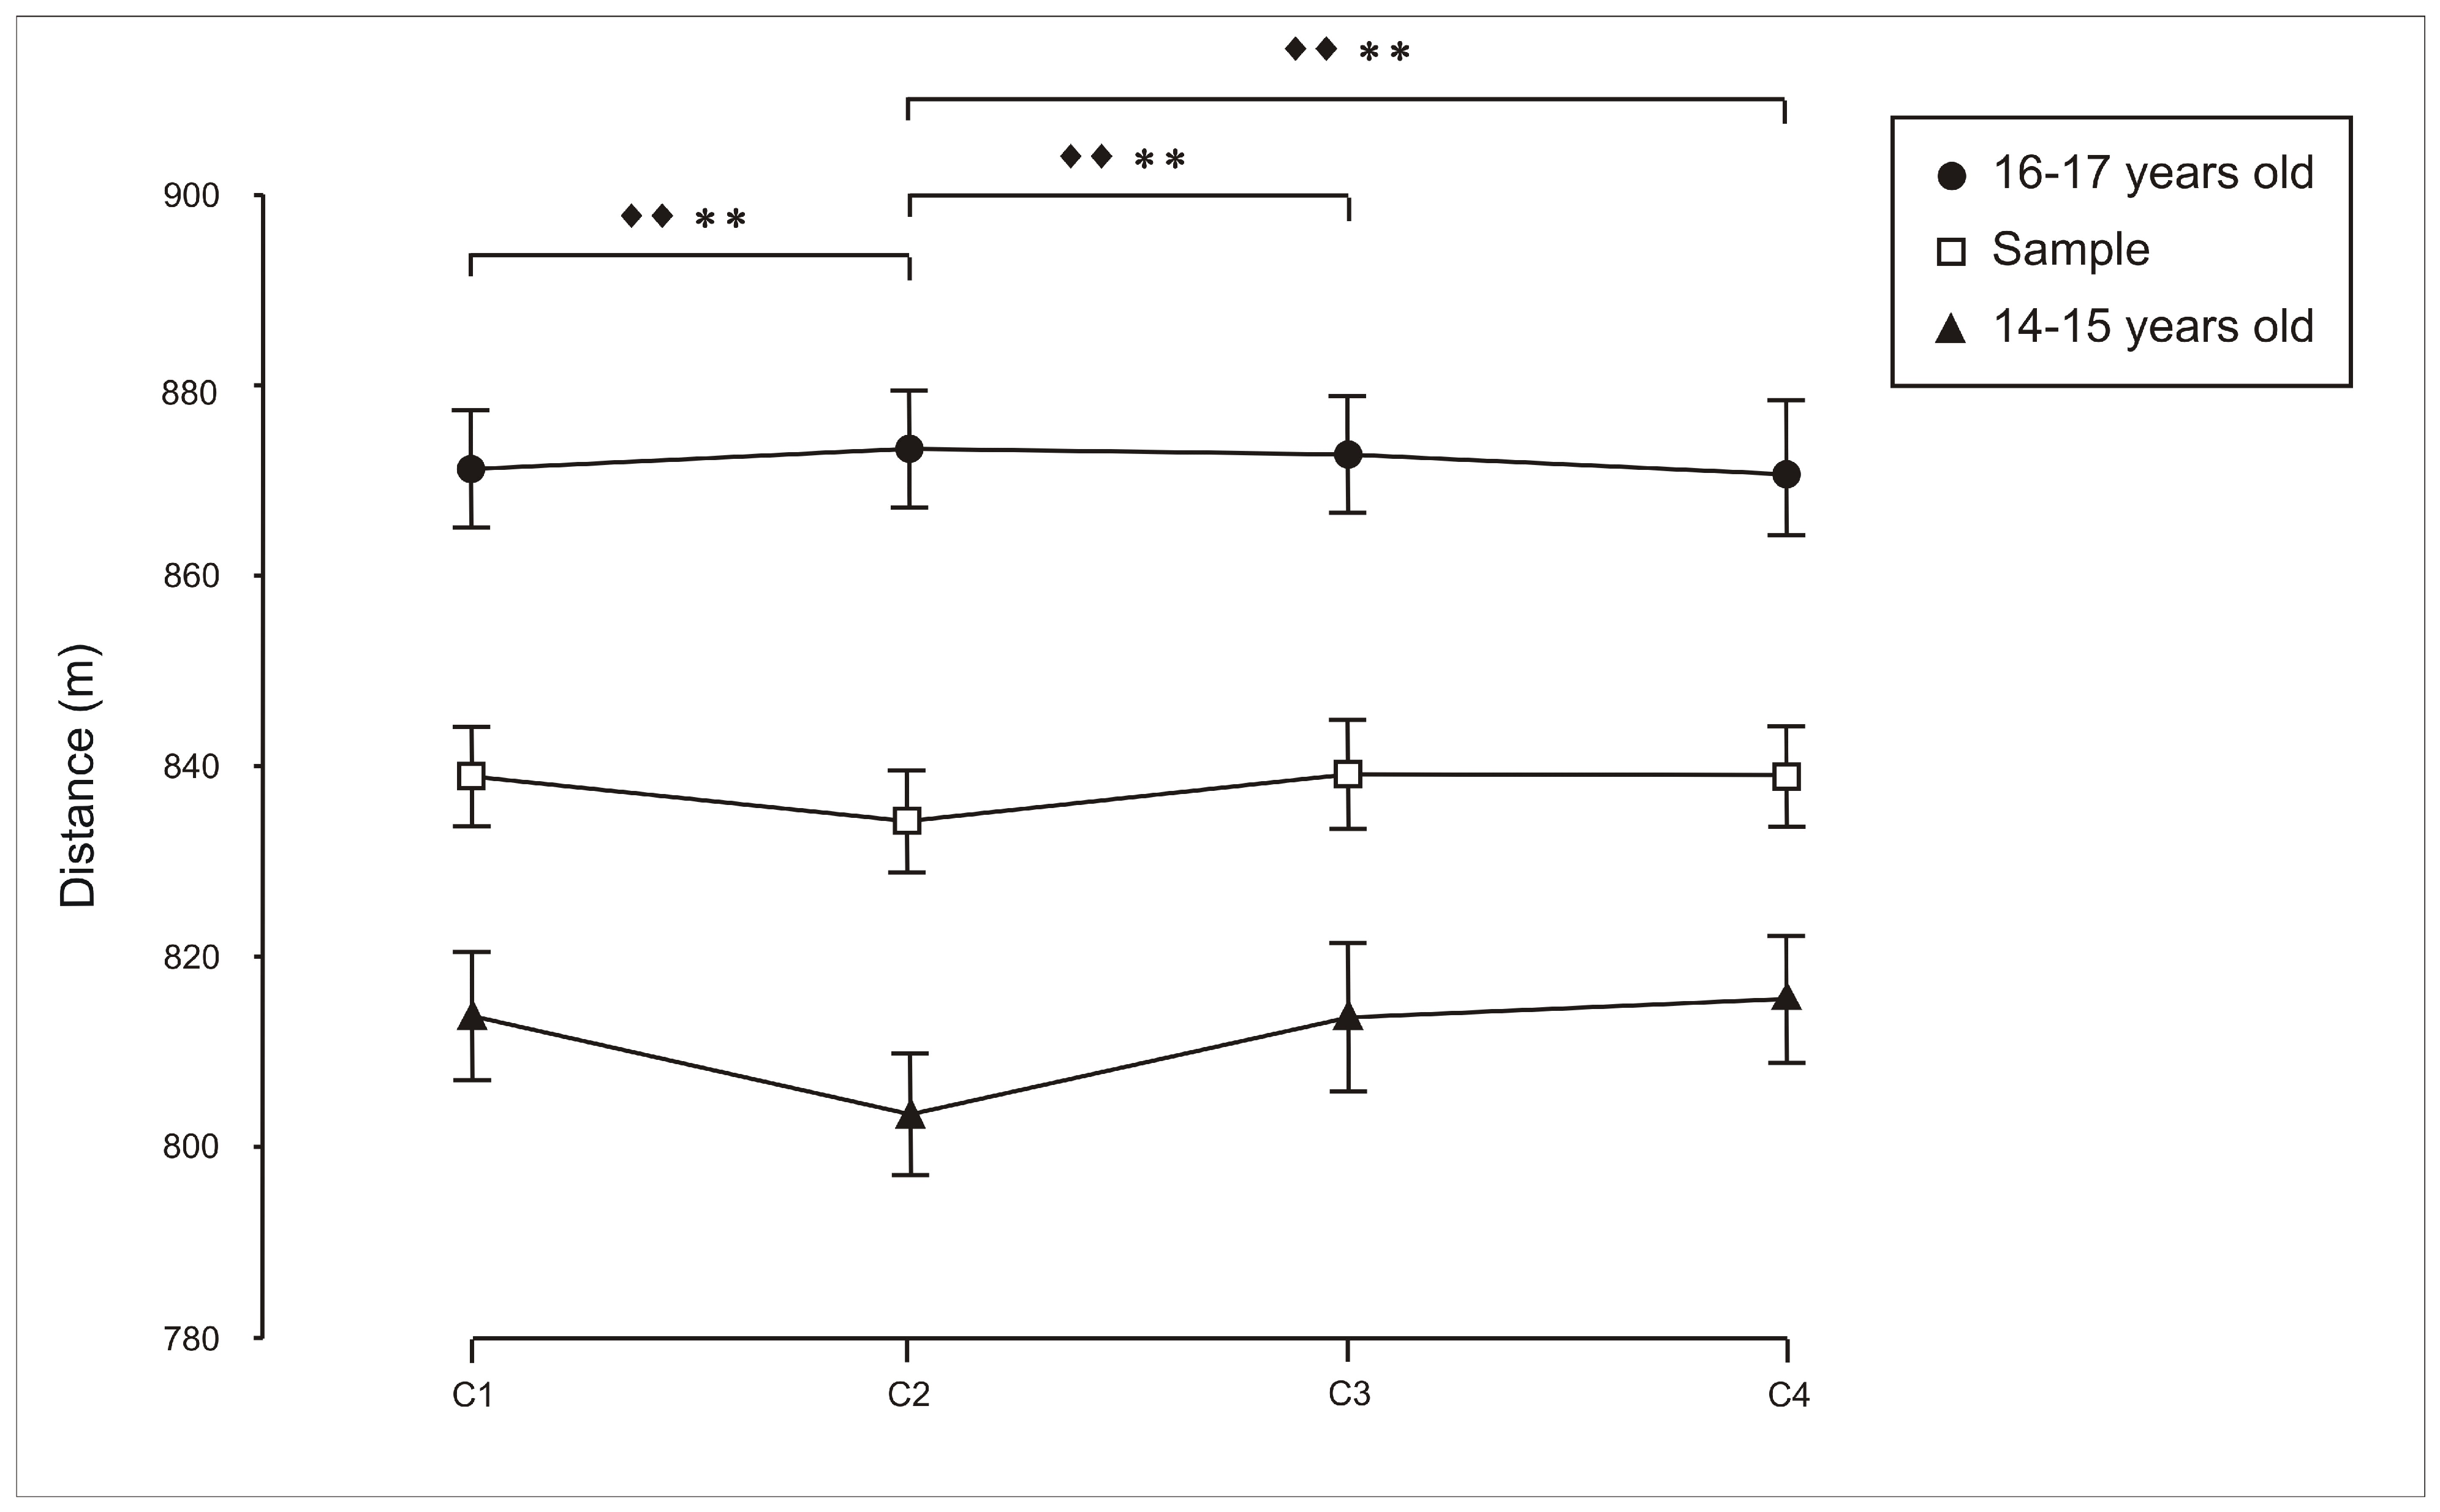
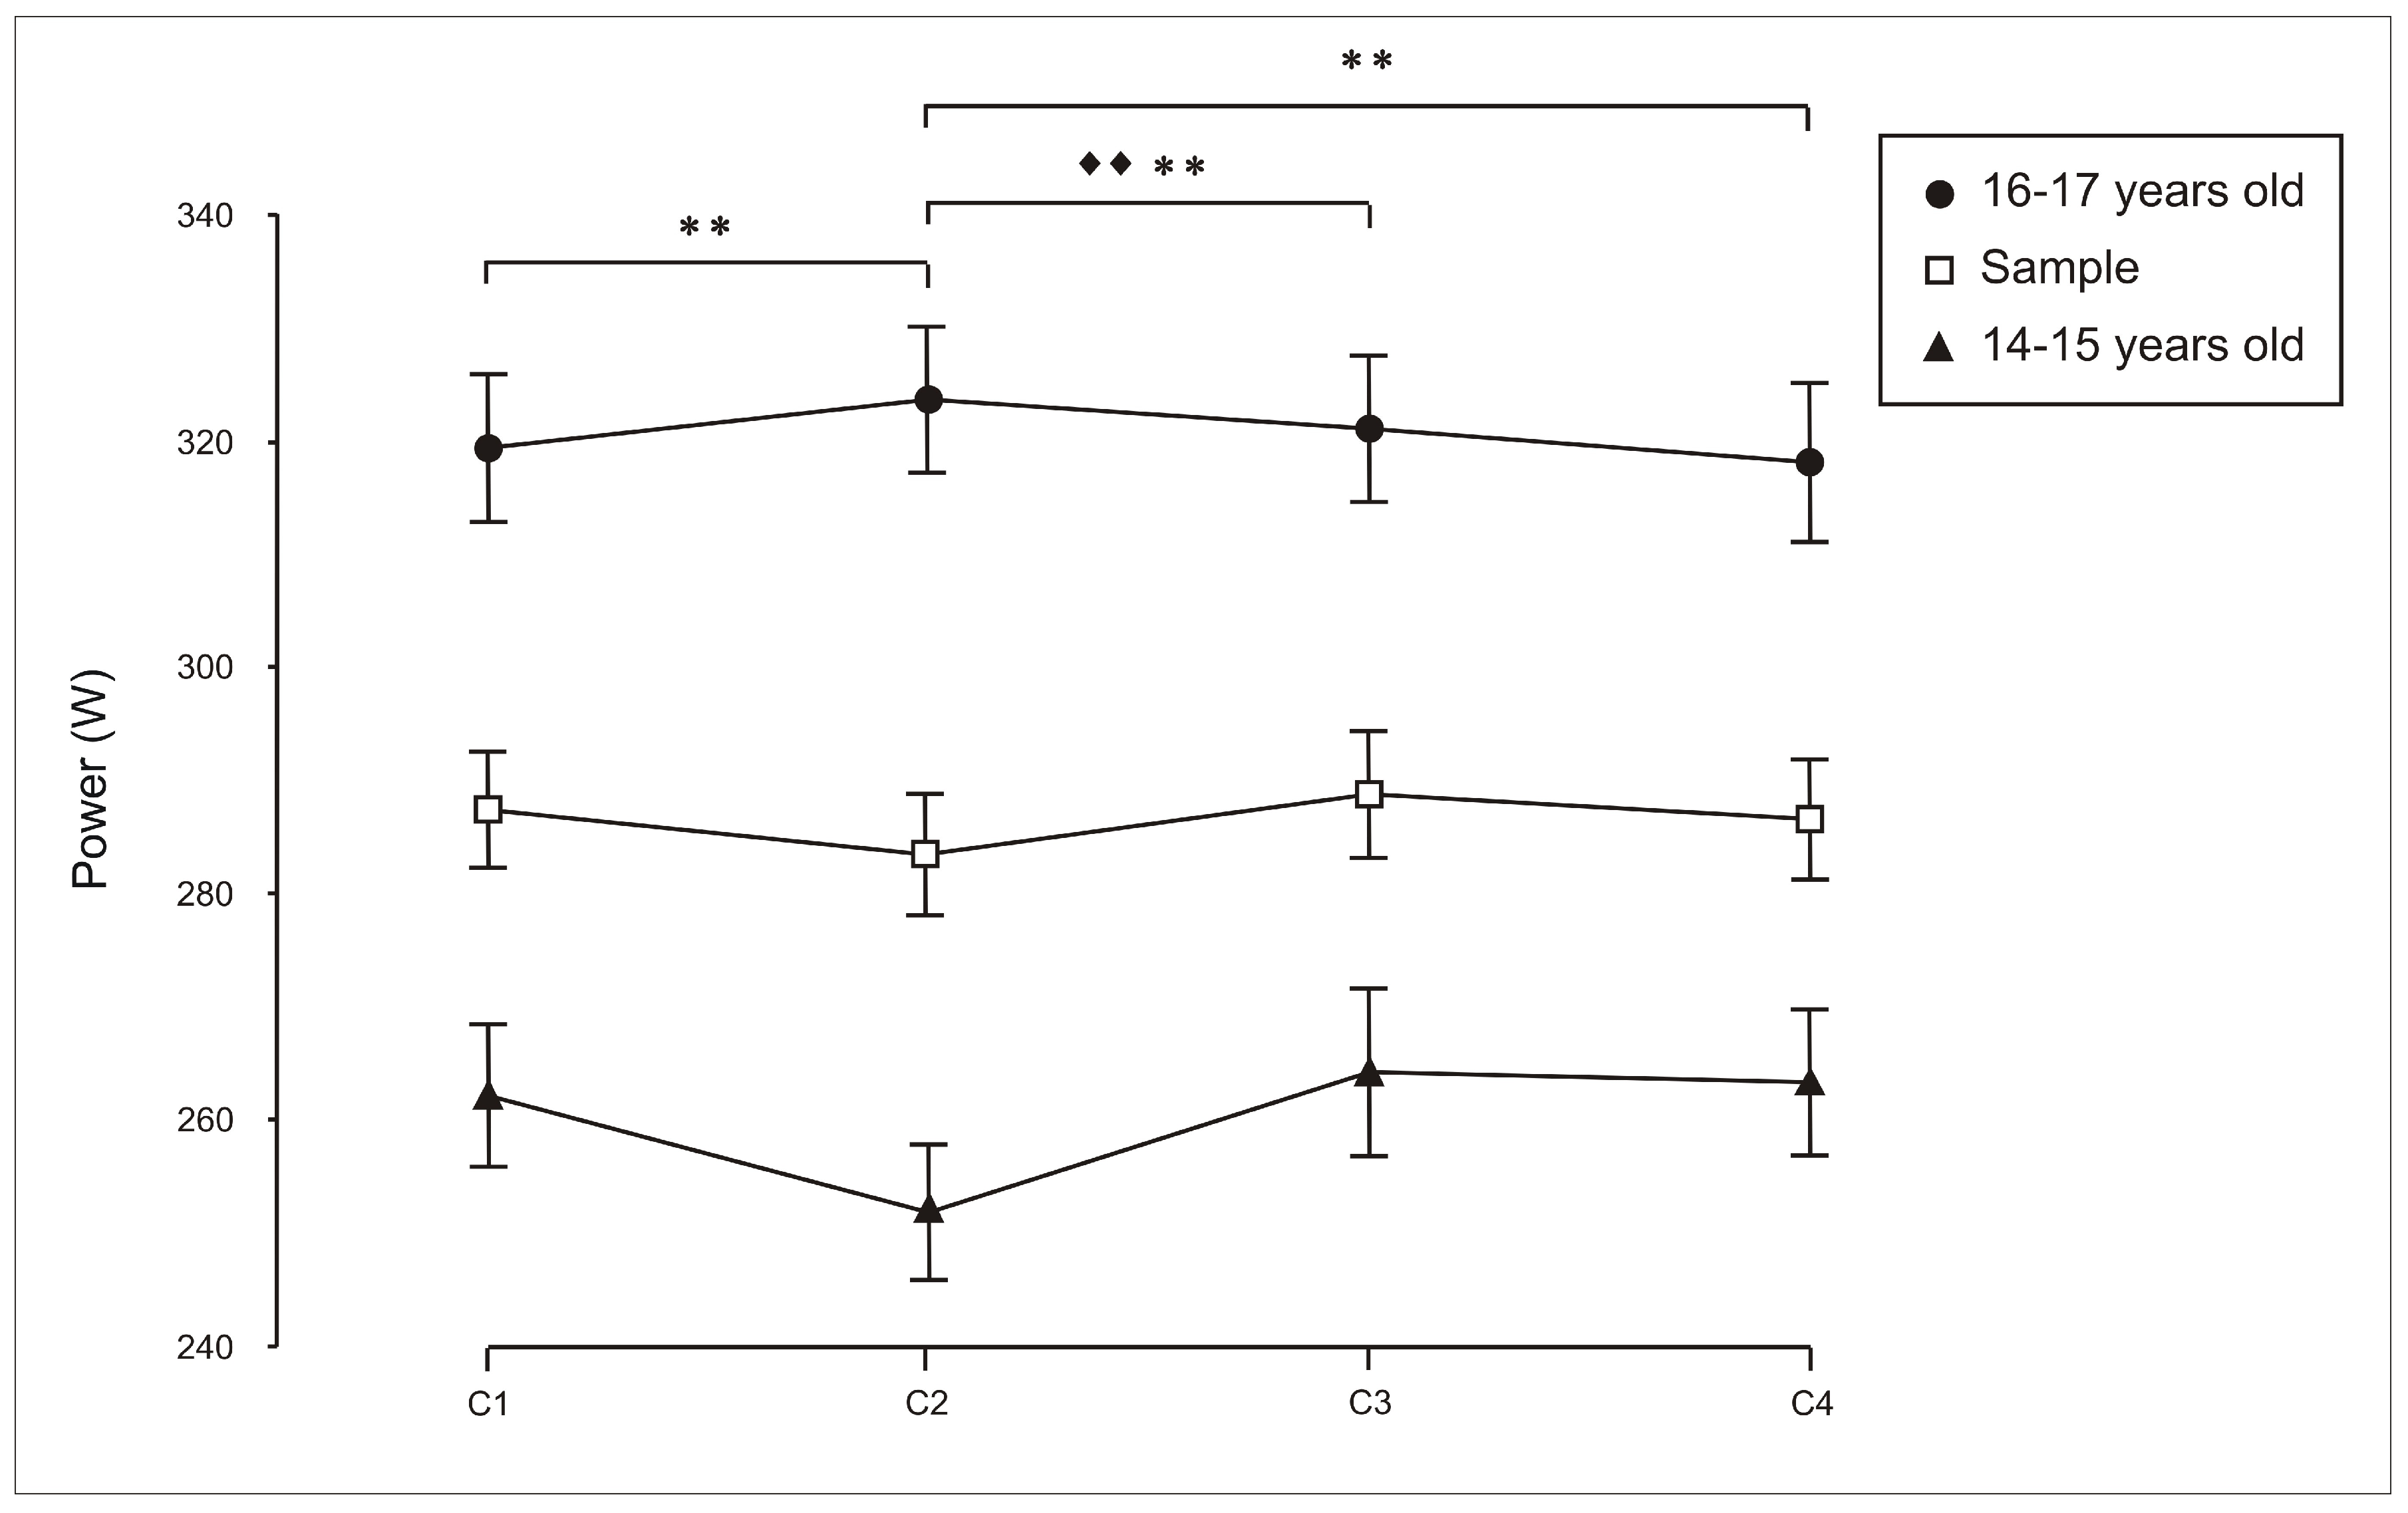
However, when analysing performance in terms of distance covered (metres,
Figure 2) and power output (W,
Figure 3), similar patterns were observed across the experimental conditions, namely individual trials (C1), two-person crews (C2), four-person crews (C3) and eight-person crews (C4). Statistically significant differences (C1 vs. C2, C2 vs. C3 and C2 vs. C4) were observed in the 14–15 years age category and in the whole sample, but not in the 16–17 years age category (for distance: [C1 vs. C2: (14–15 years age category,
p < 0.001); (whole sample:
p = 0.001); C2 vs. C3: (14–15 years age category,
p < 0.001); (whole sample:
p < 0.001); C2 vs. C4: (14–15 years age category,
p < 0.001); (whole sample:
p < 0.001)]; for power output: [C1 vs. C2: (14–15 years age category,
p < 0.001); C2 vs. C3: (14–15 years age category,
p < 0.001); (whole sample:
p < 0.001); C2 vs. C4: (14–15 years age category,
p < 0.001)].
When analysing the results obtained from the comparison of heart rate measured three minutes post-exercise, no significant differences were found, either in the whole sample or within the two age categories (
Supplementary Figure S1).
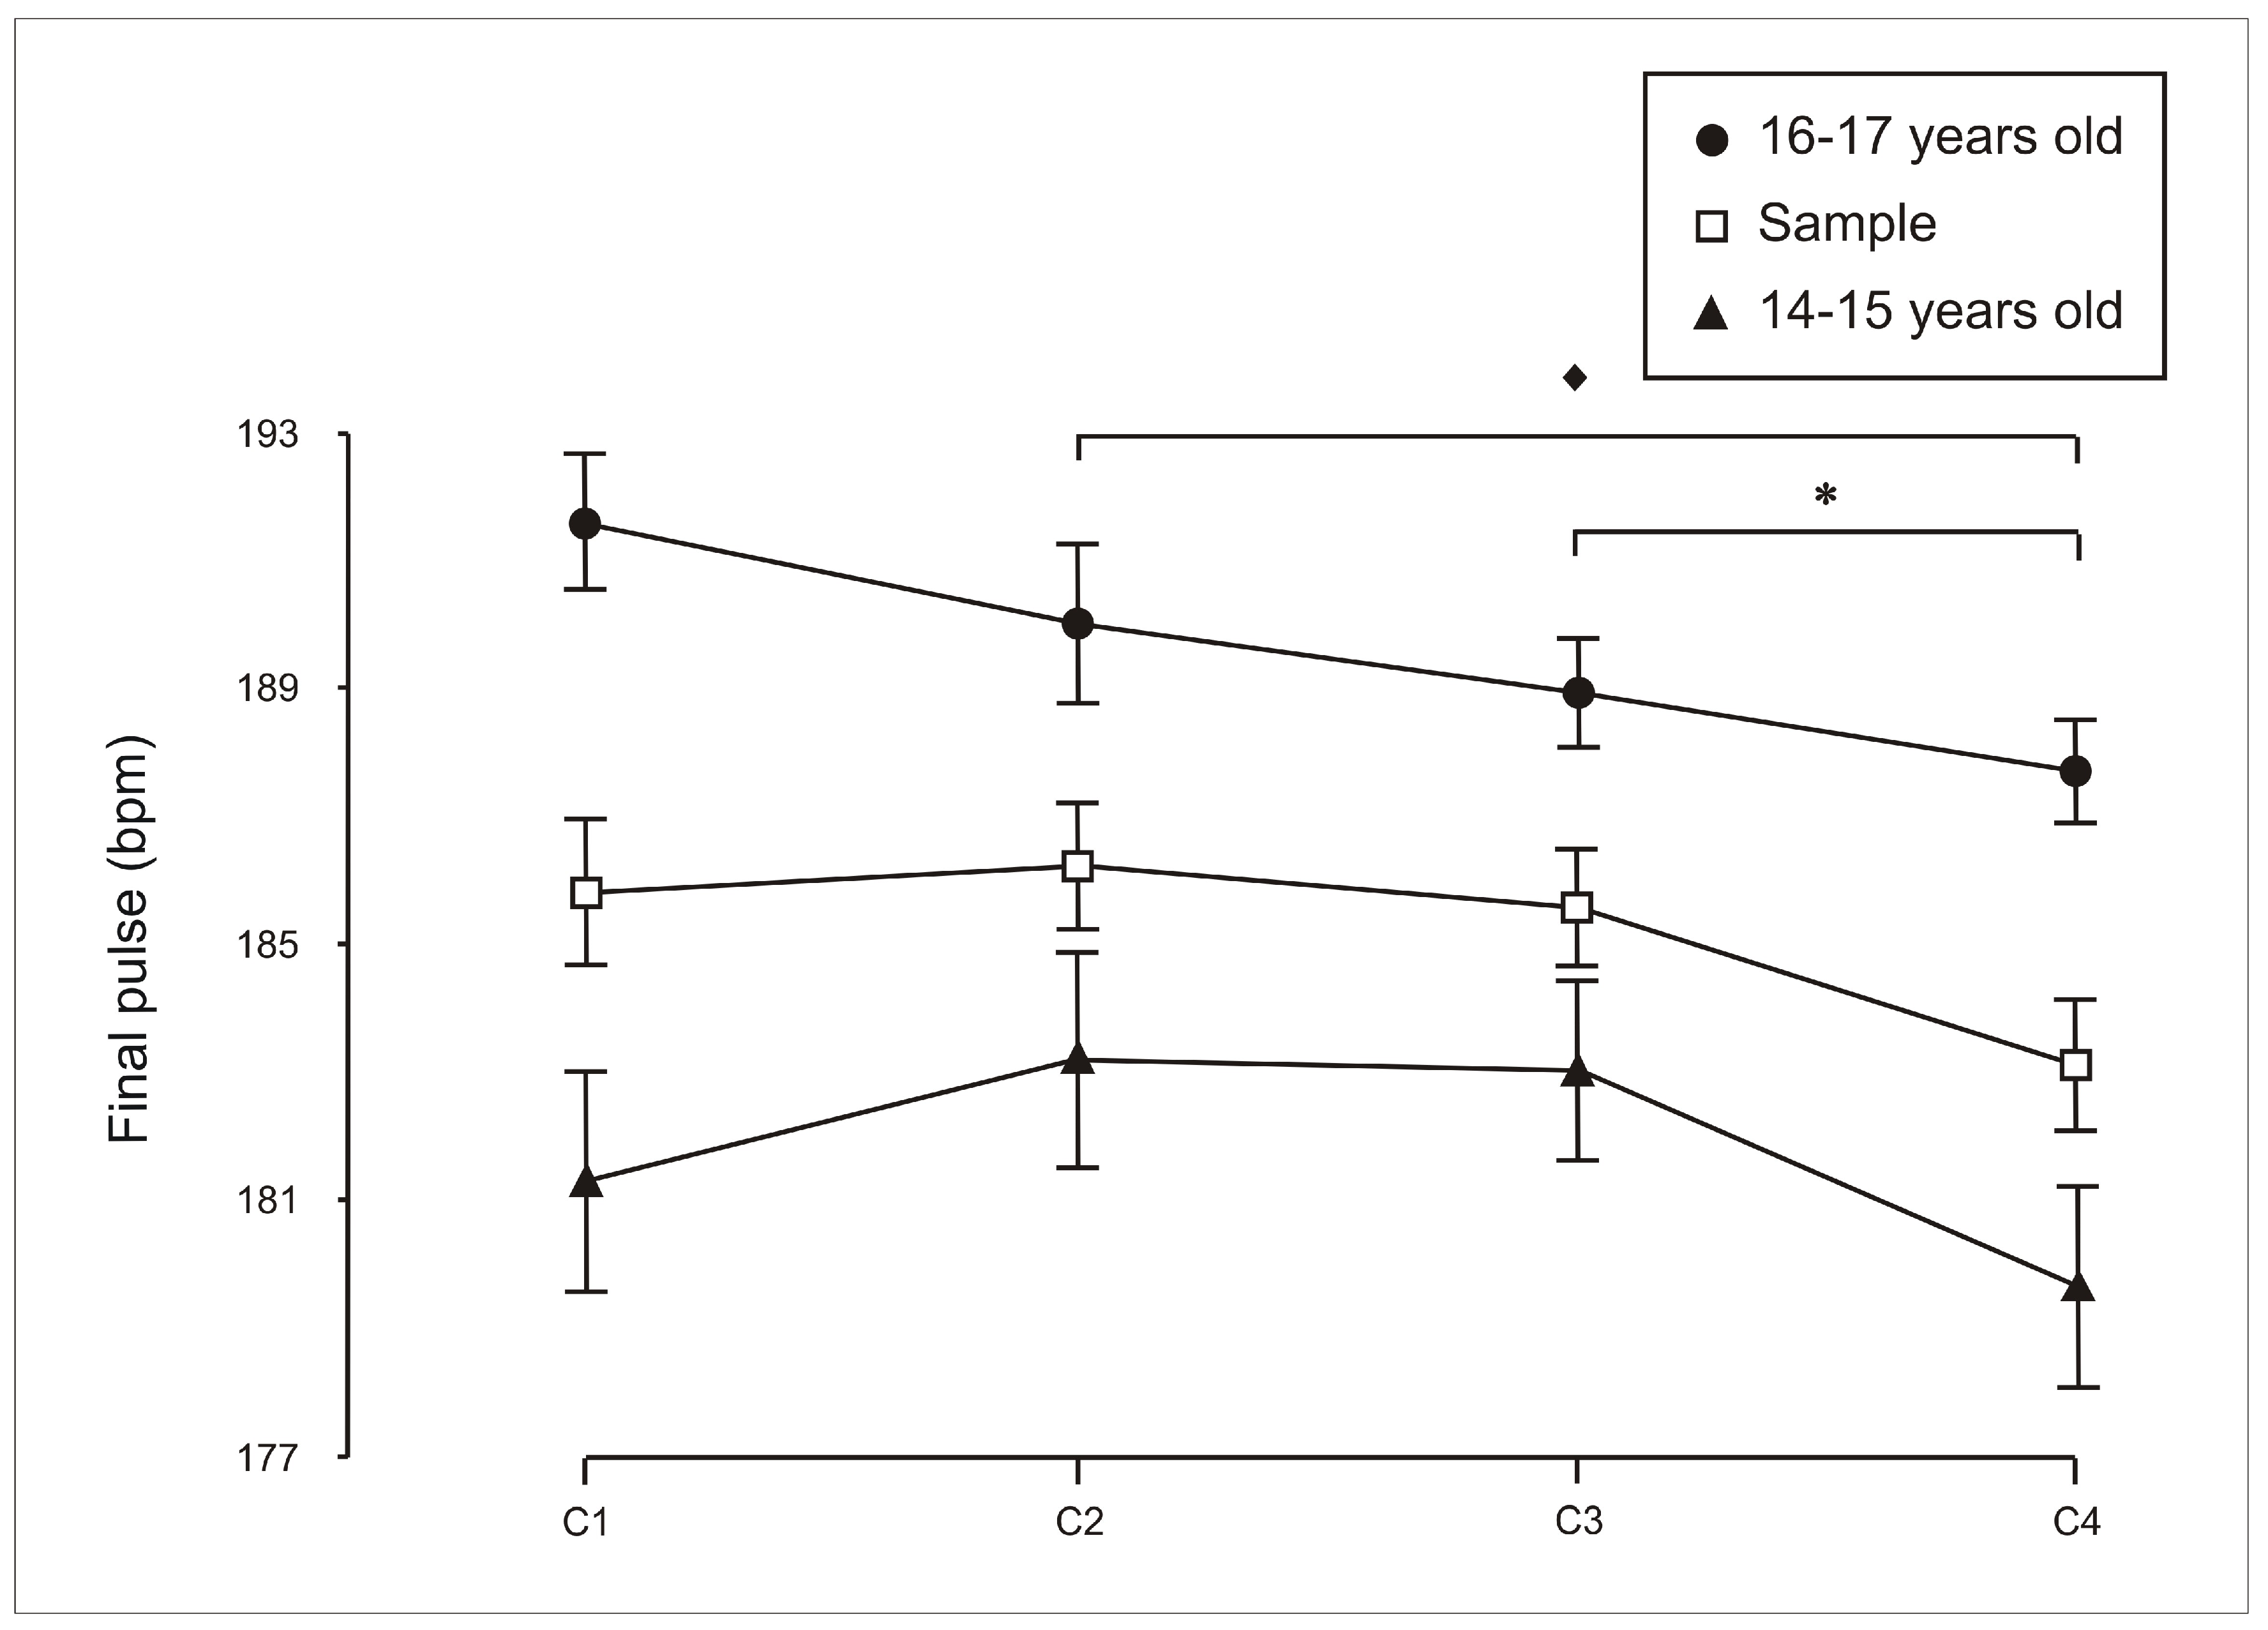
However, there were differences in the 14–15 years age category (C3 vs. C4:
p = 0.08) and in the whole sample (C2 vs. C4:
p = 0.032) when analysing the final heart rate (
Figure 4).
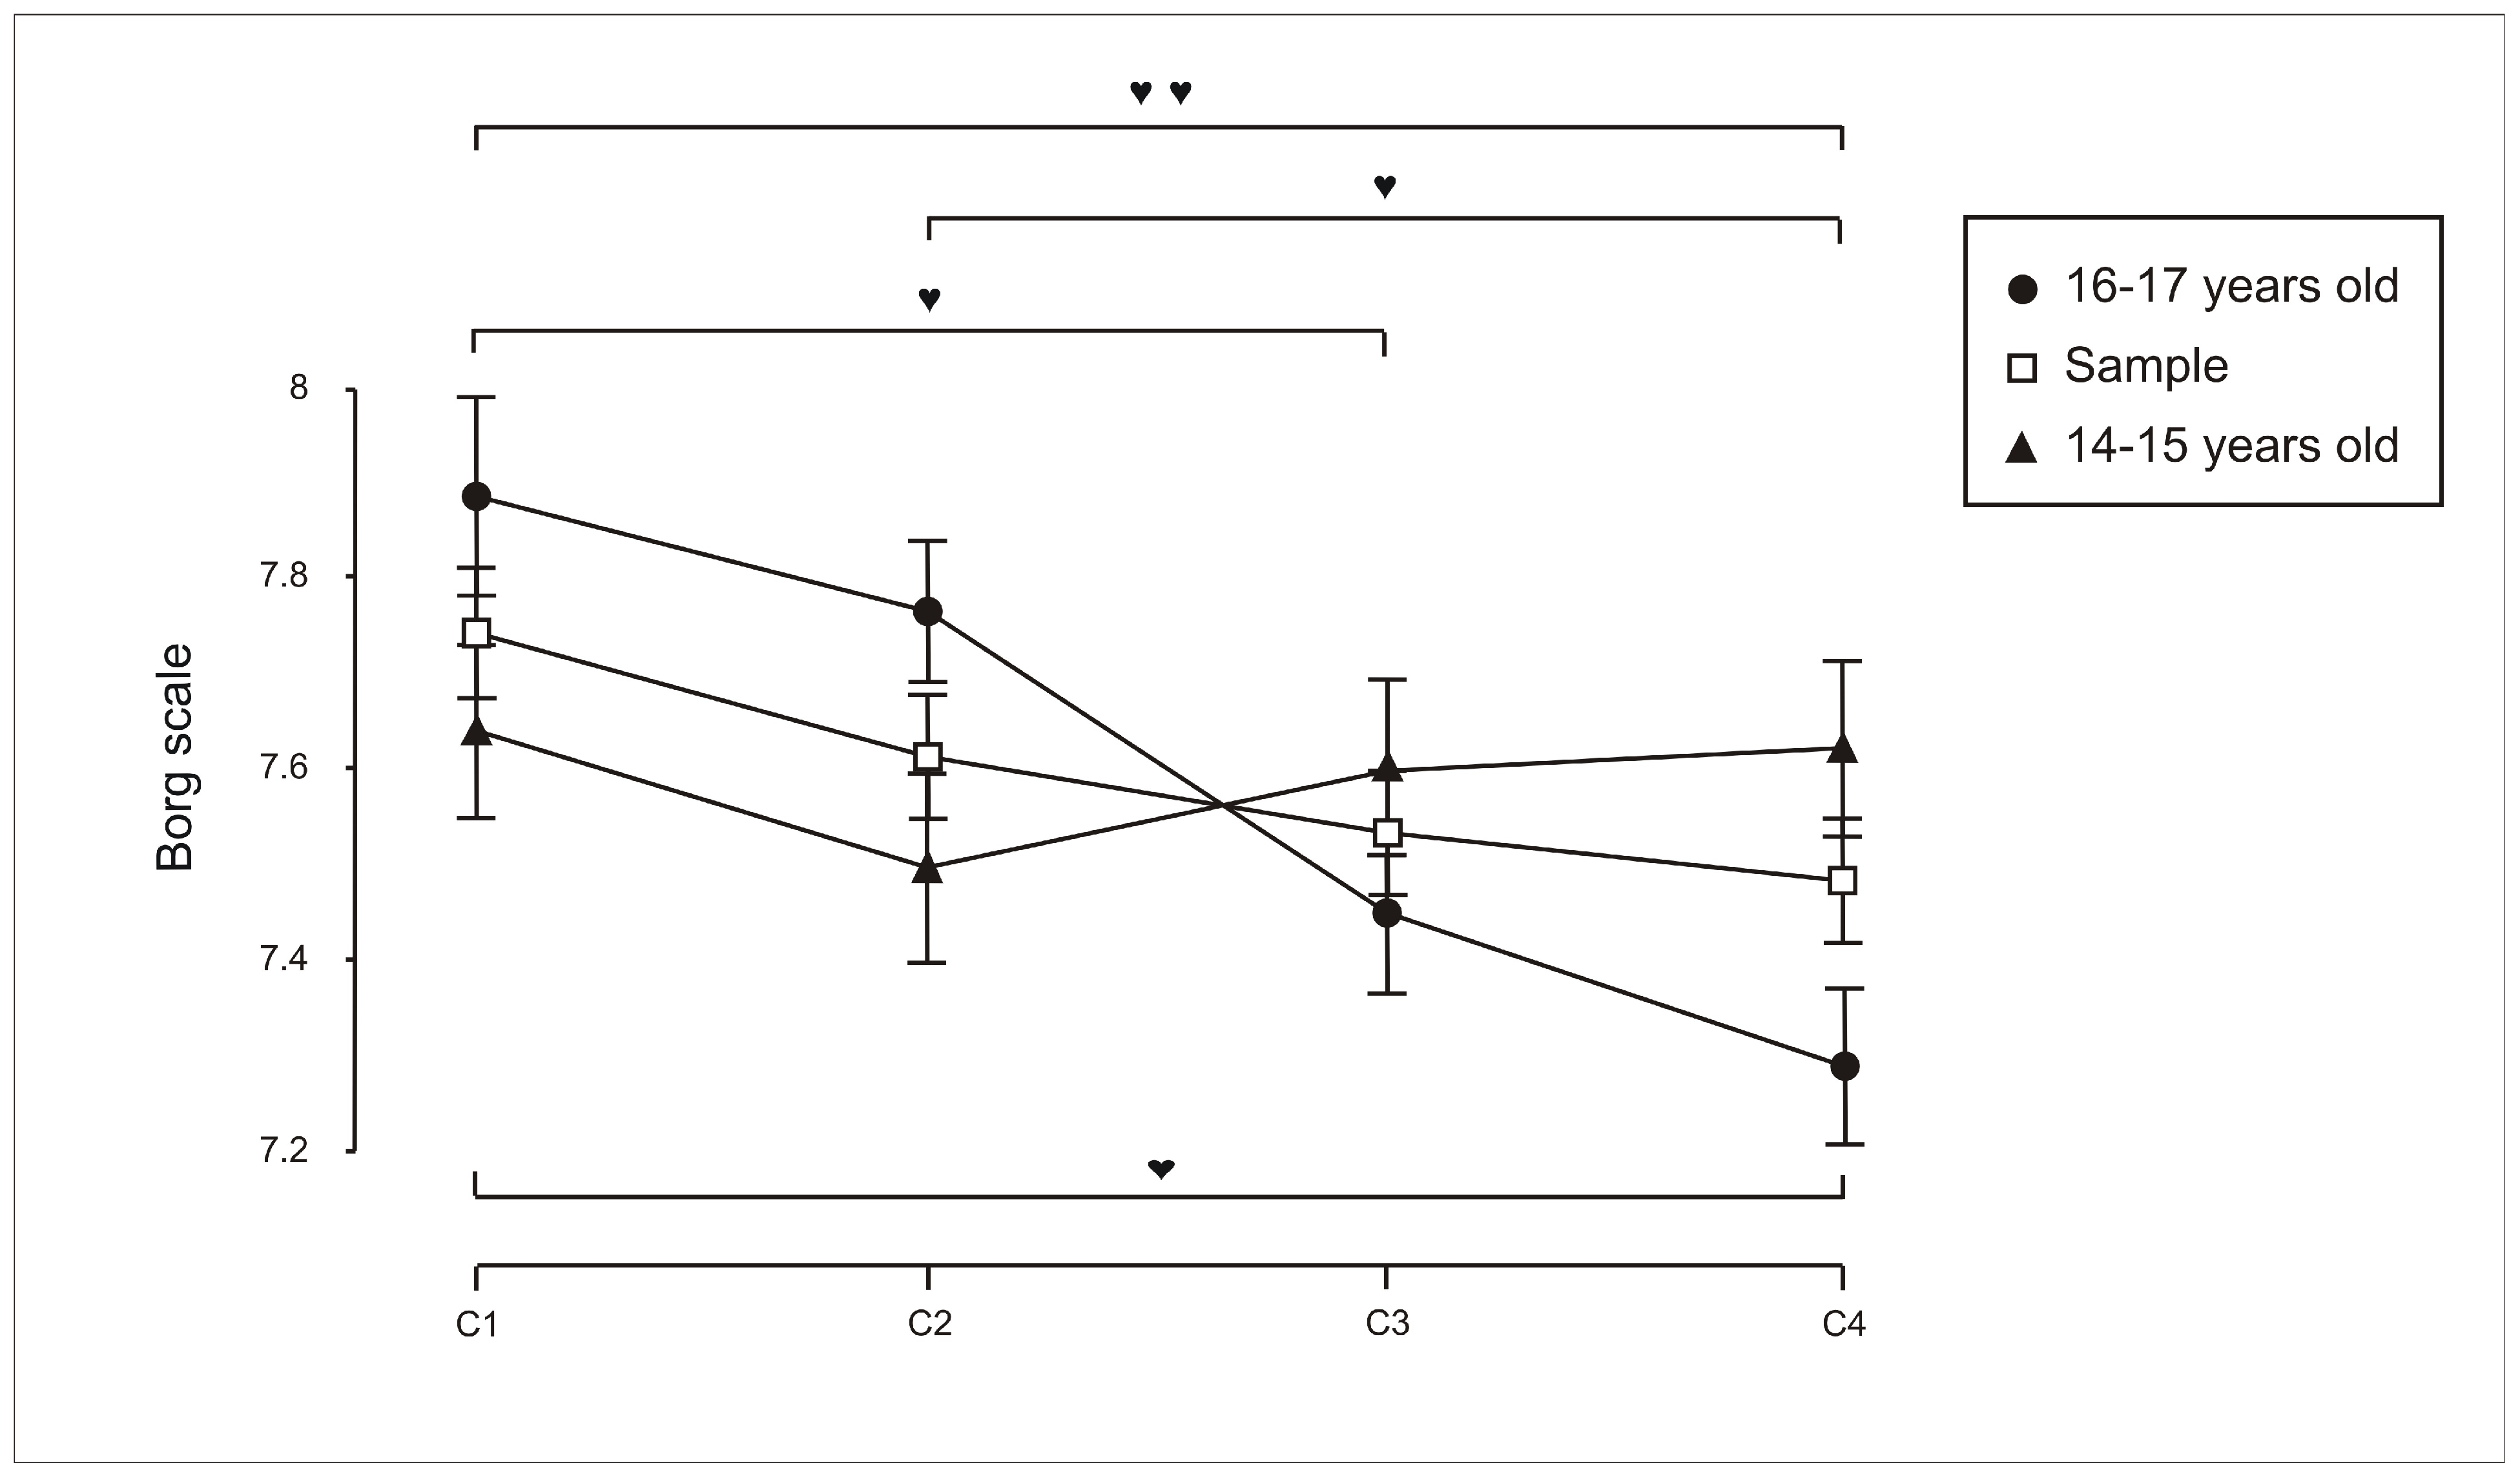
Regarding perceived exertion, as measured by the Borg scale (
Figure 5), the results indicate that older rowers (16–17 years) reported higher levels of perceived effort when performing individually (C1) compared with when rowing in eight-person crews (C4) (
p = 0.0001). In other words, for this age group, the perception of effort was greater during individual trials than during crew conditions (C2, C3, C4), even though performance (measured in metres or watts) did not significantly increase, while stroke rate did increase significantly.
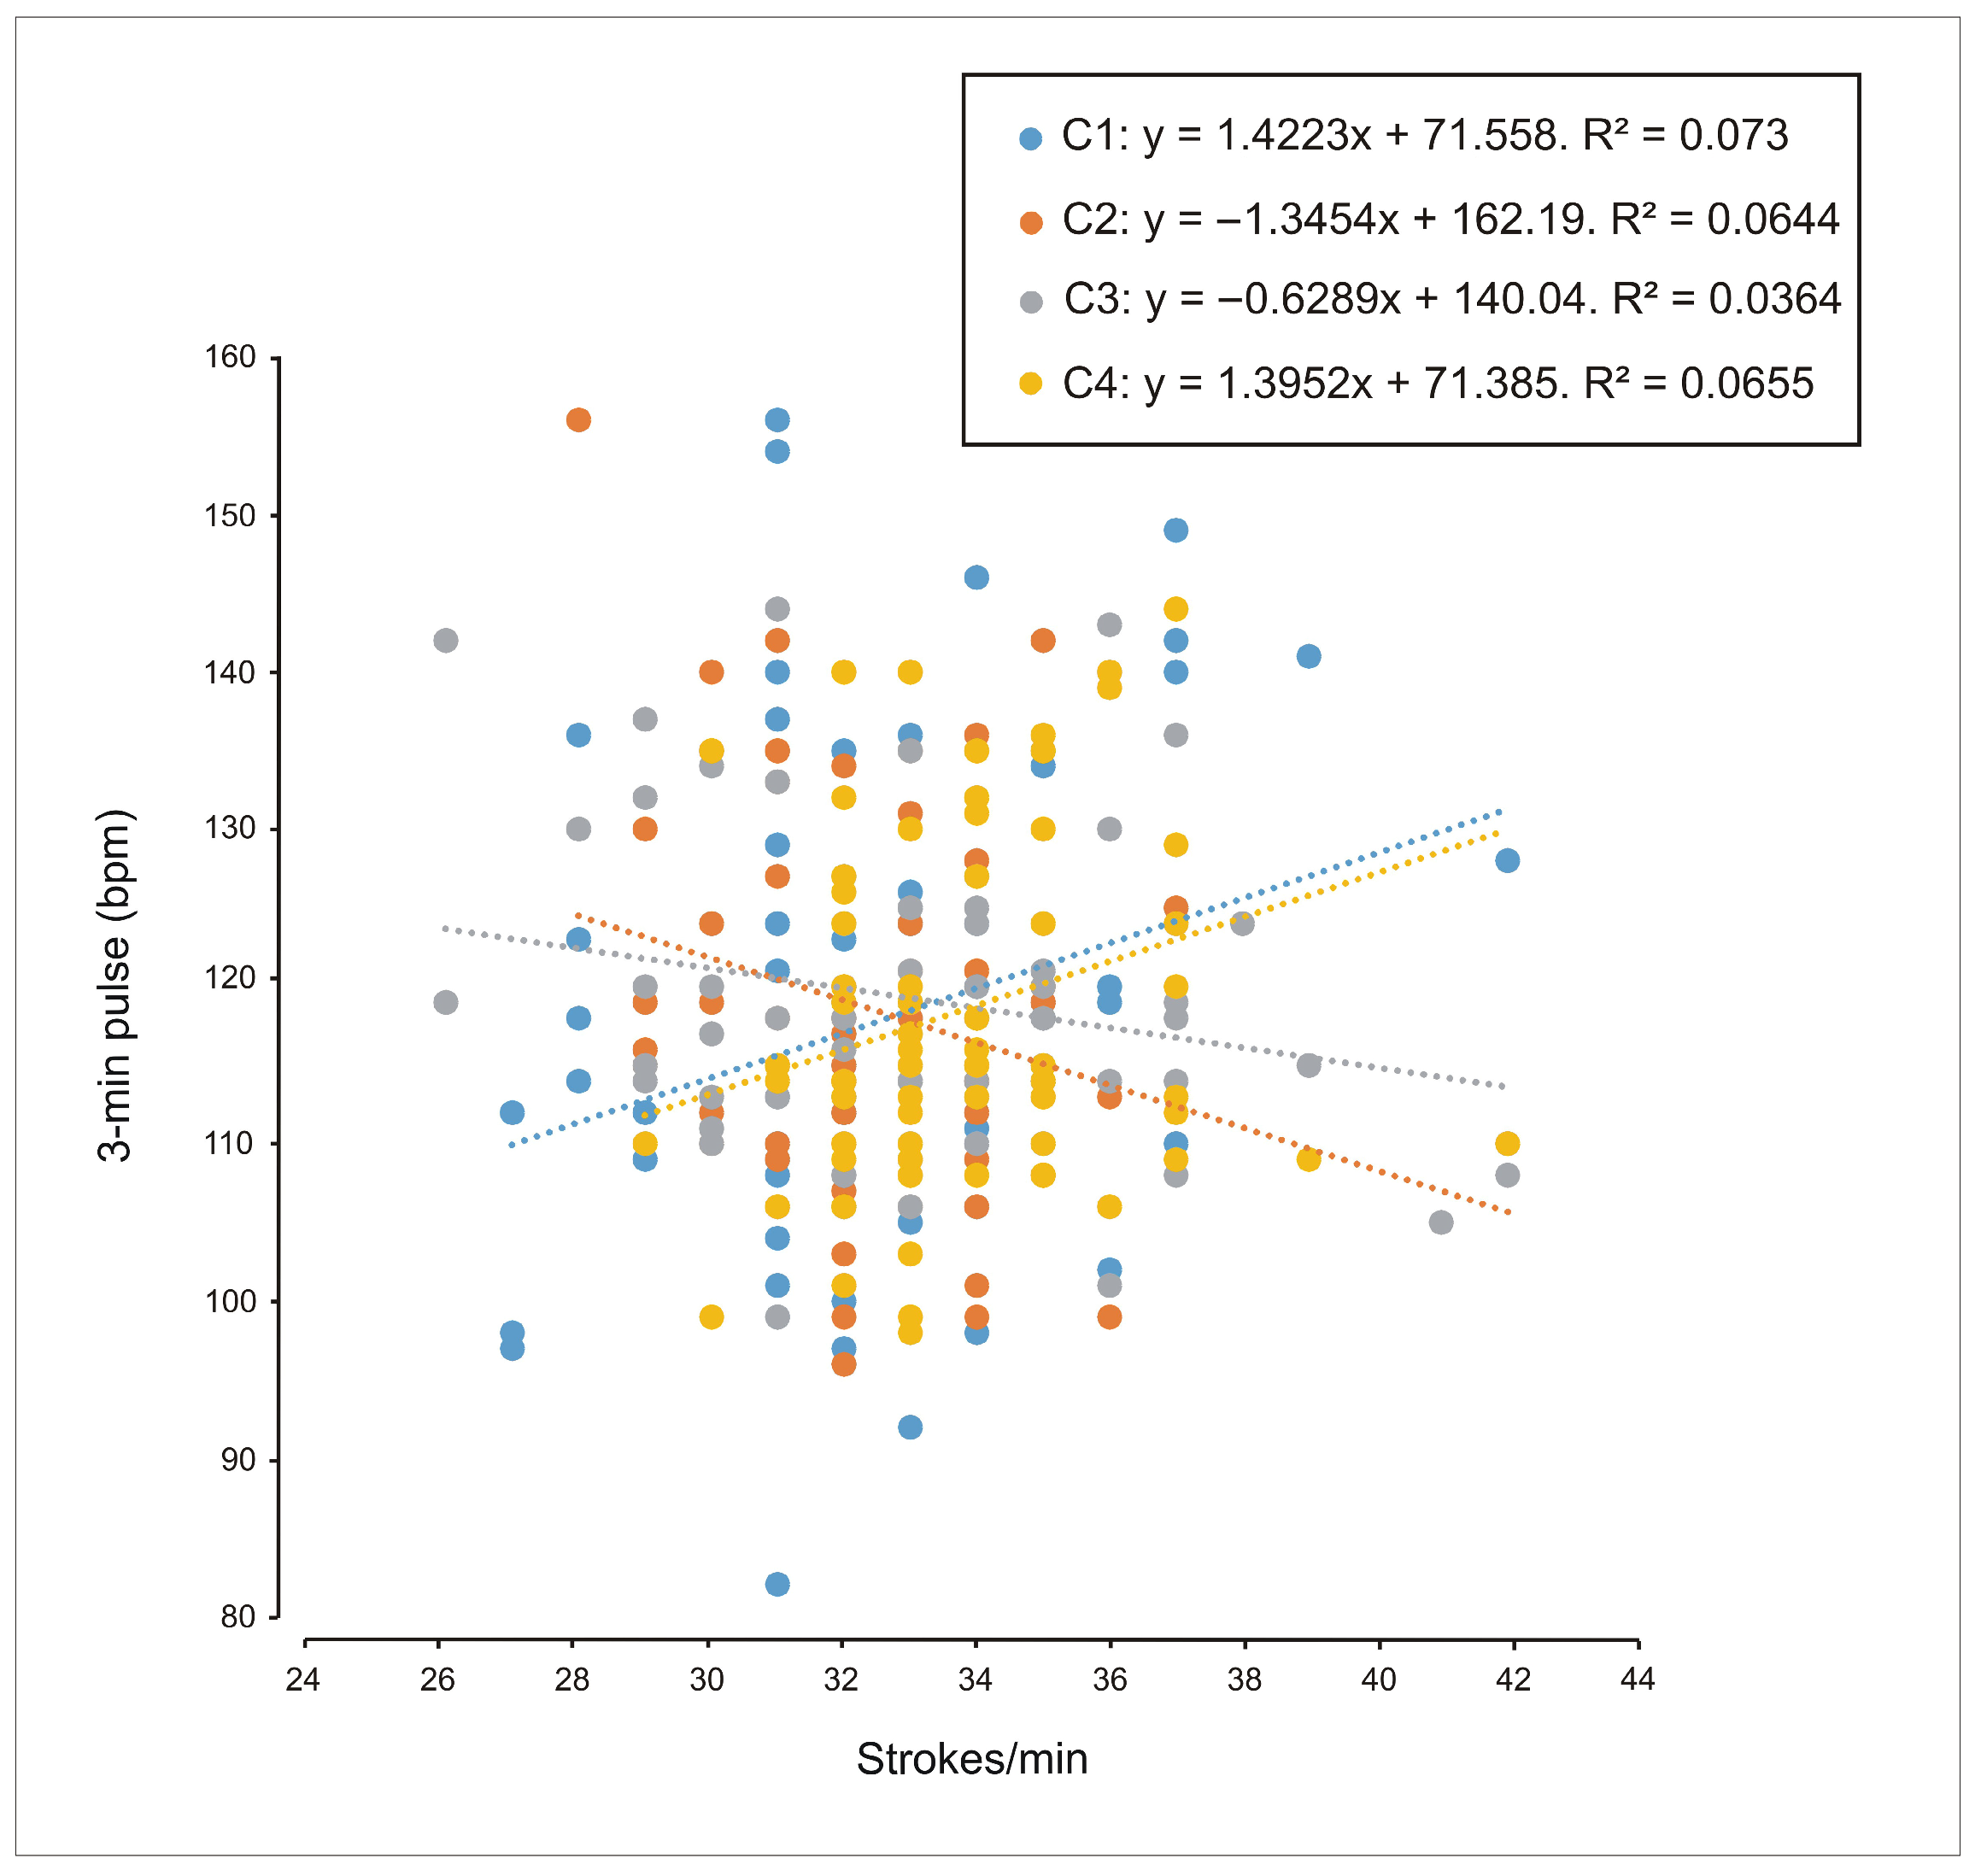
Subsequently, performances variables (measured in terms of stroke count) were correlated across the different test conditions (C1: individual trials; C2: two-person crews; C3: four-person crews and C4: eight-person crews) with other physiological and perceptual variables, namely final heart rate, heart rate three minutes after exercise and perceived exertion (Borg scale), within the two age categories, 14–15 years and 16–17 years.
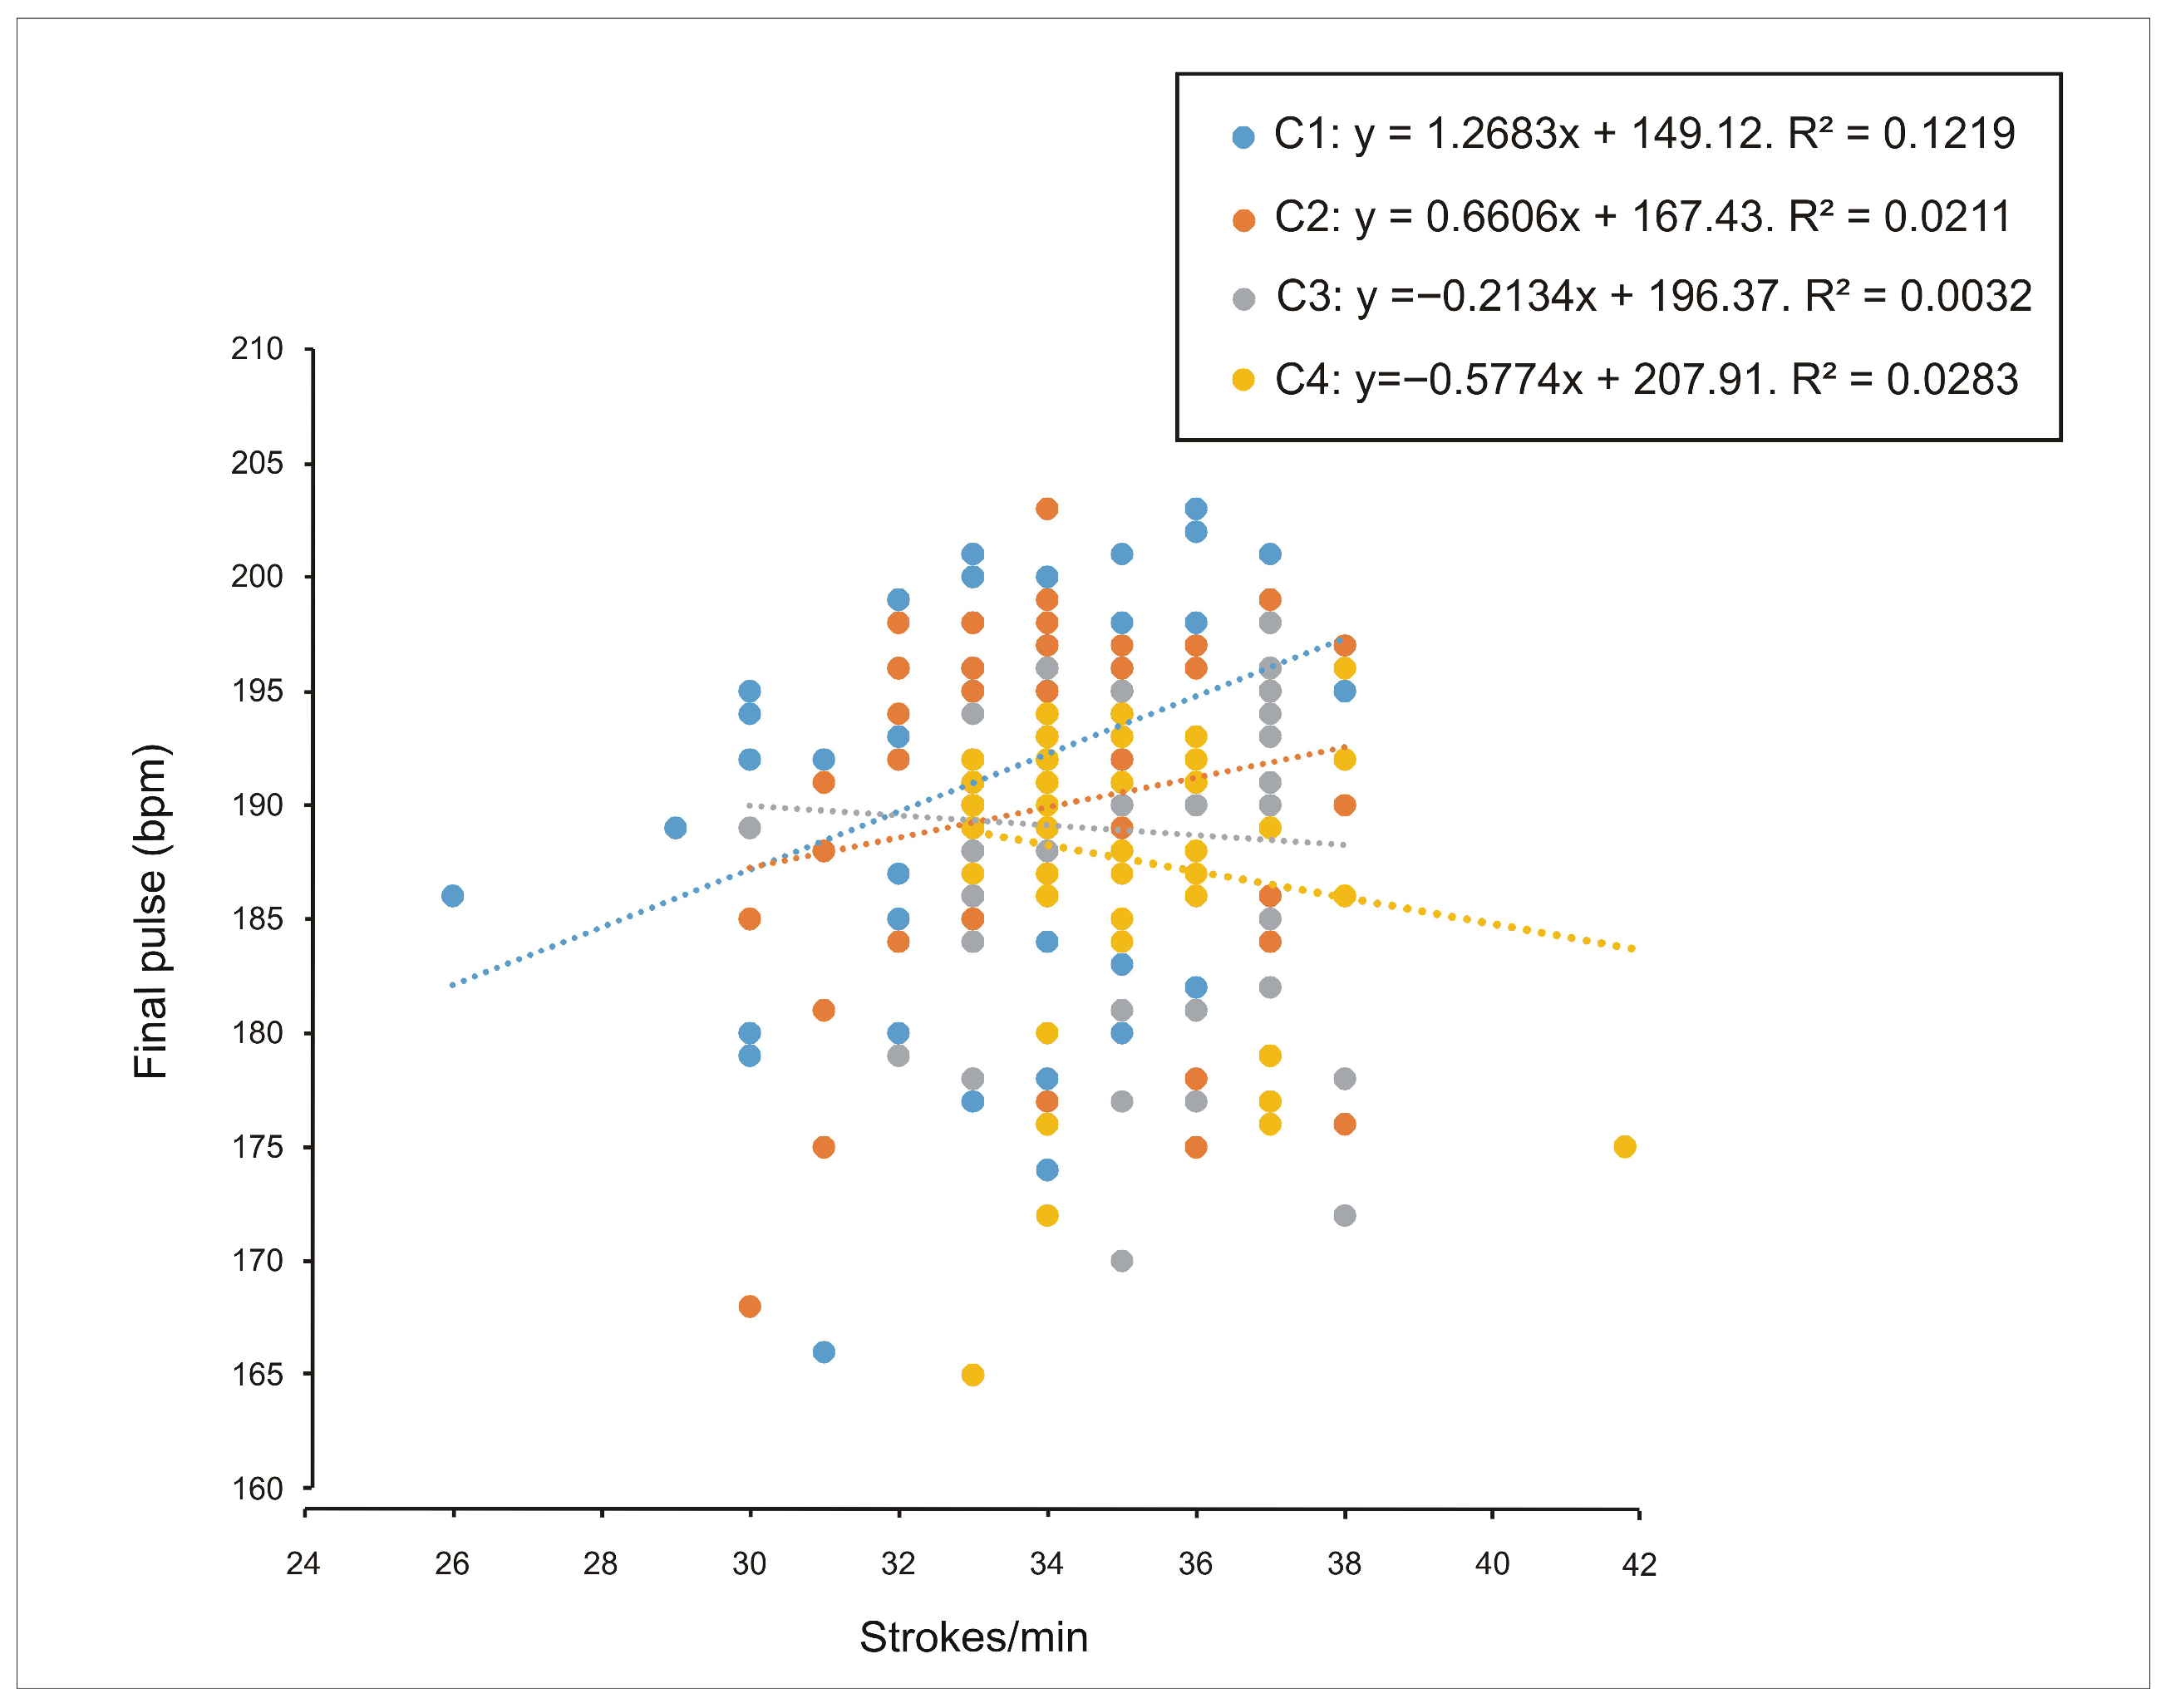
In the 16–17 years group, a weak correlation was observed between the number of strokes and final heart rate (R
2 = 0.12;
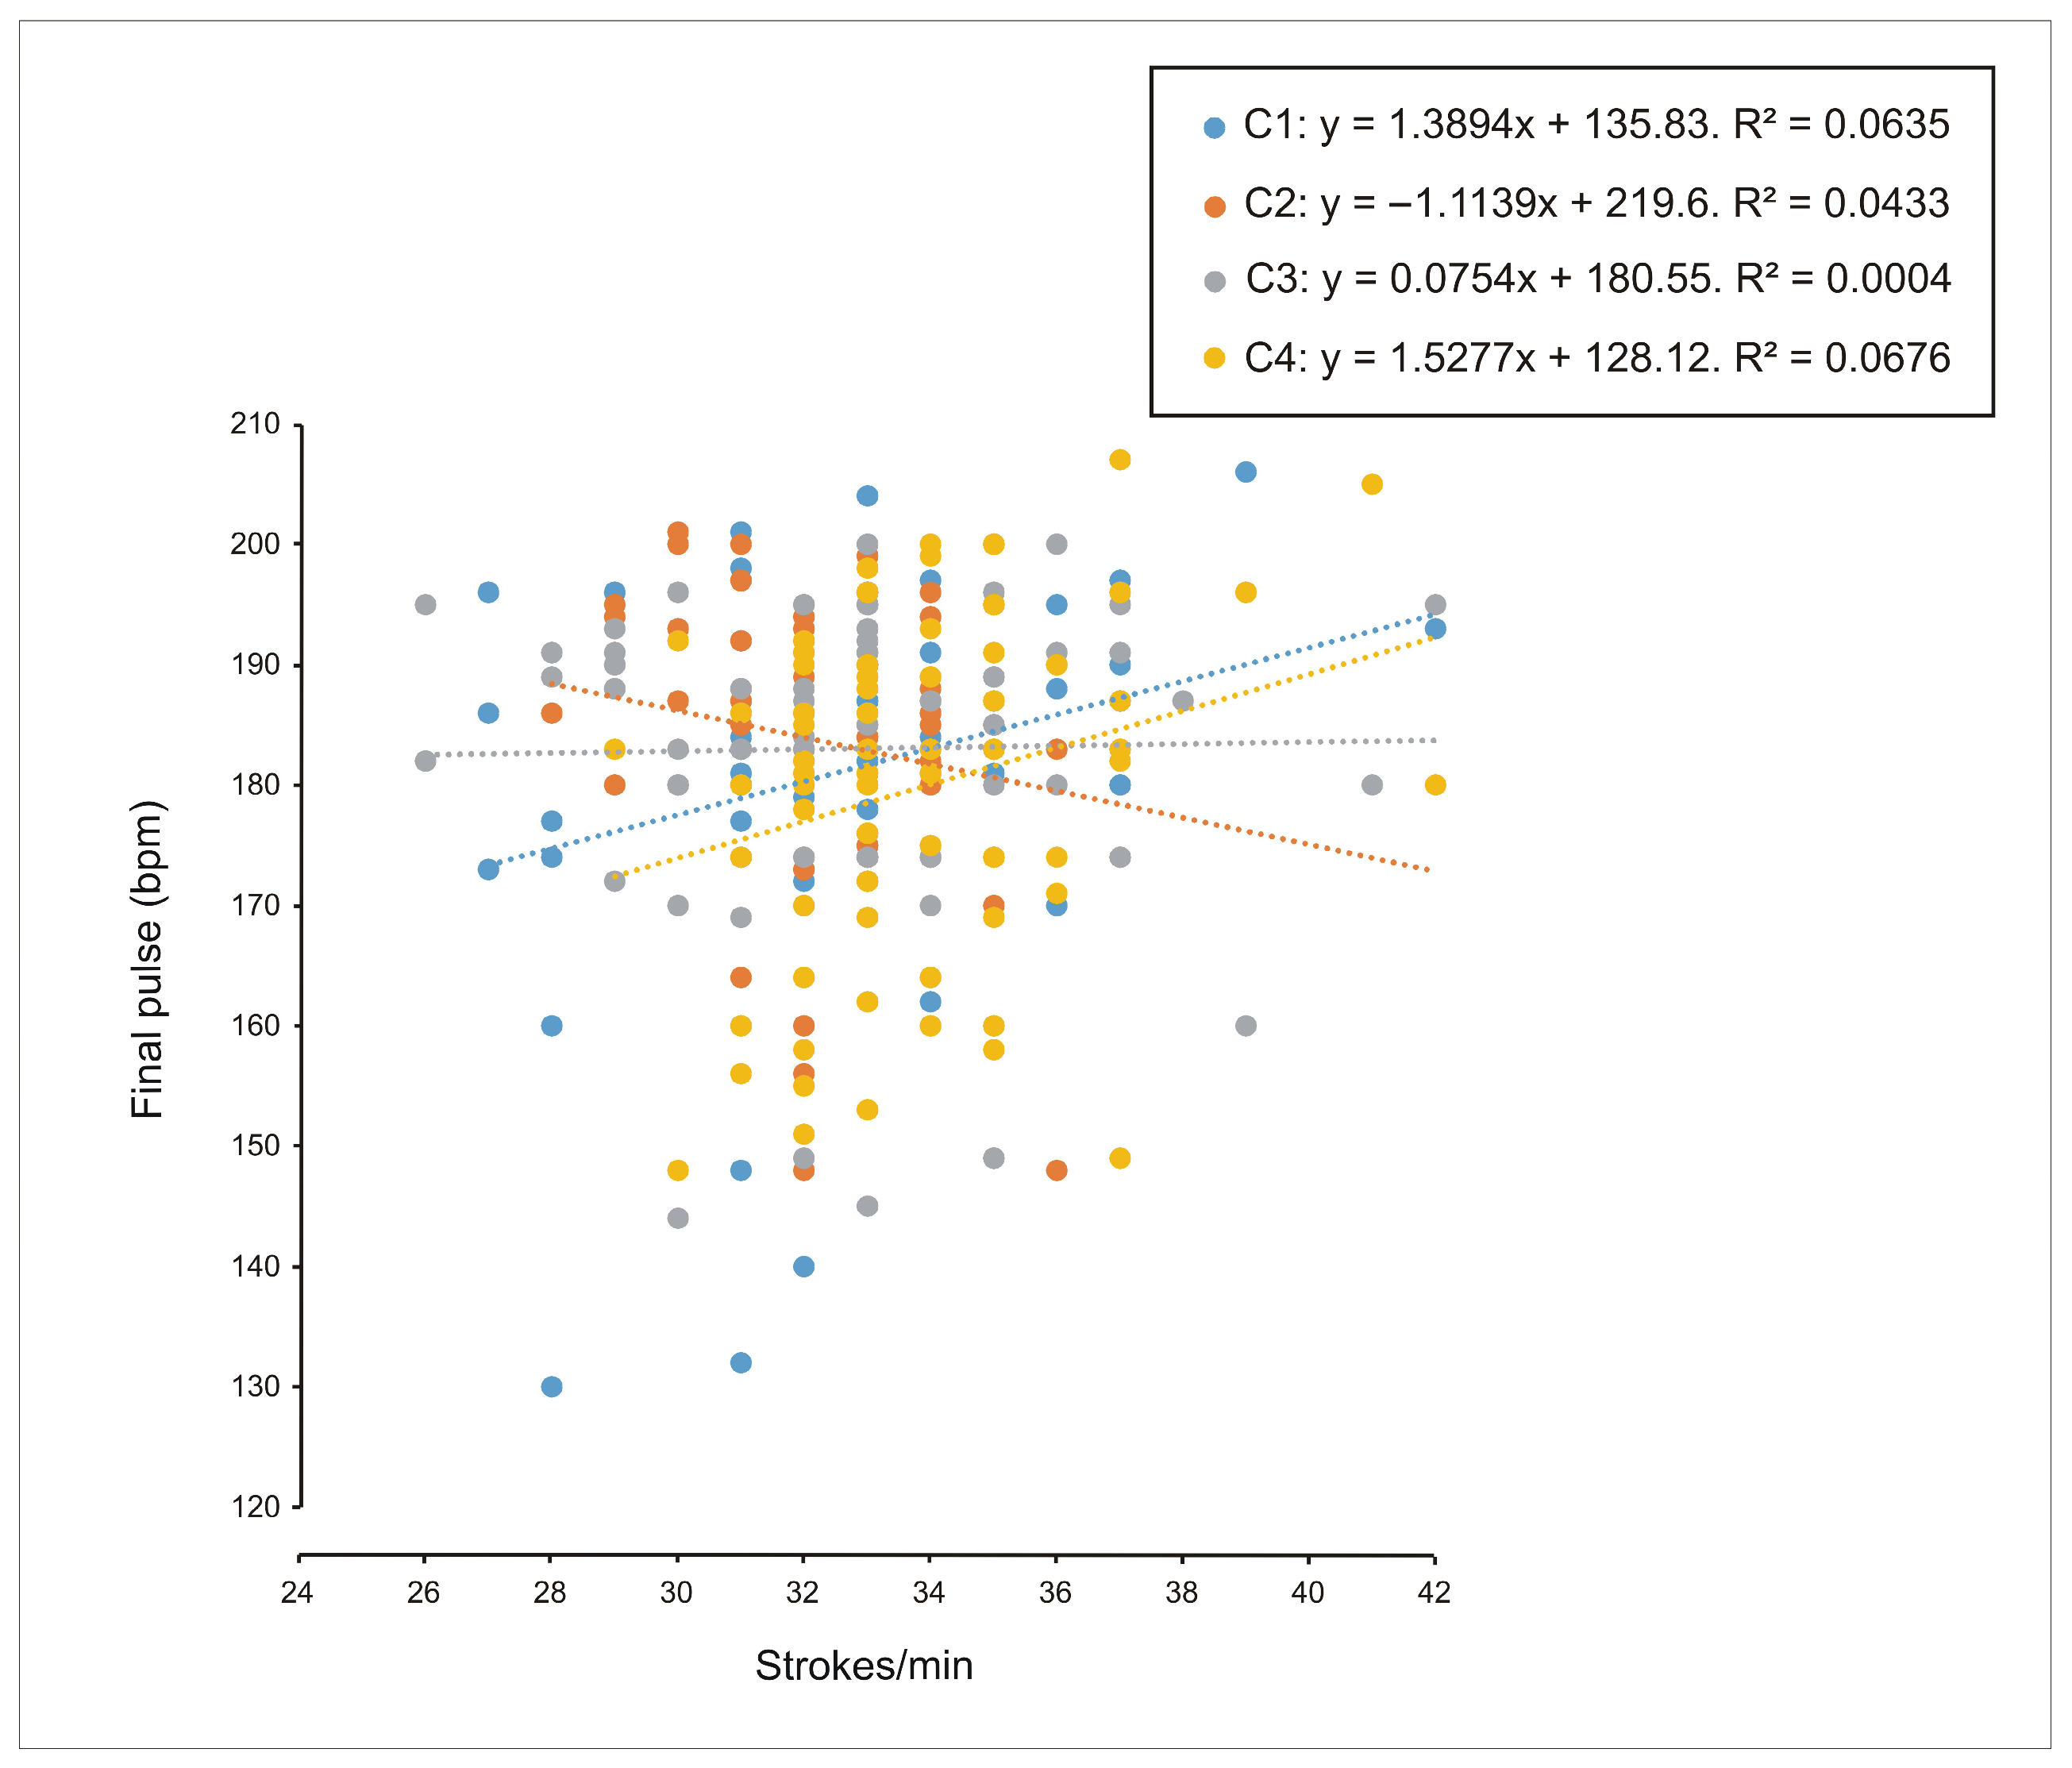
Figure 6) when the test was performed individually (C1) but not during crew trials. However, this significant relationship between stroke count and final heart rate was not present in the 14–15 years group (
Figure 7).
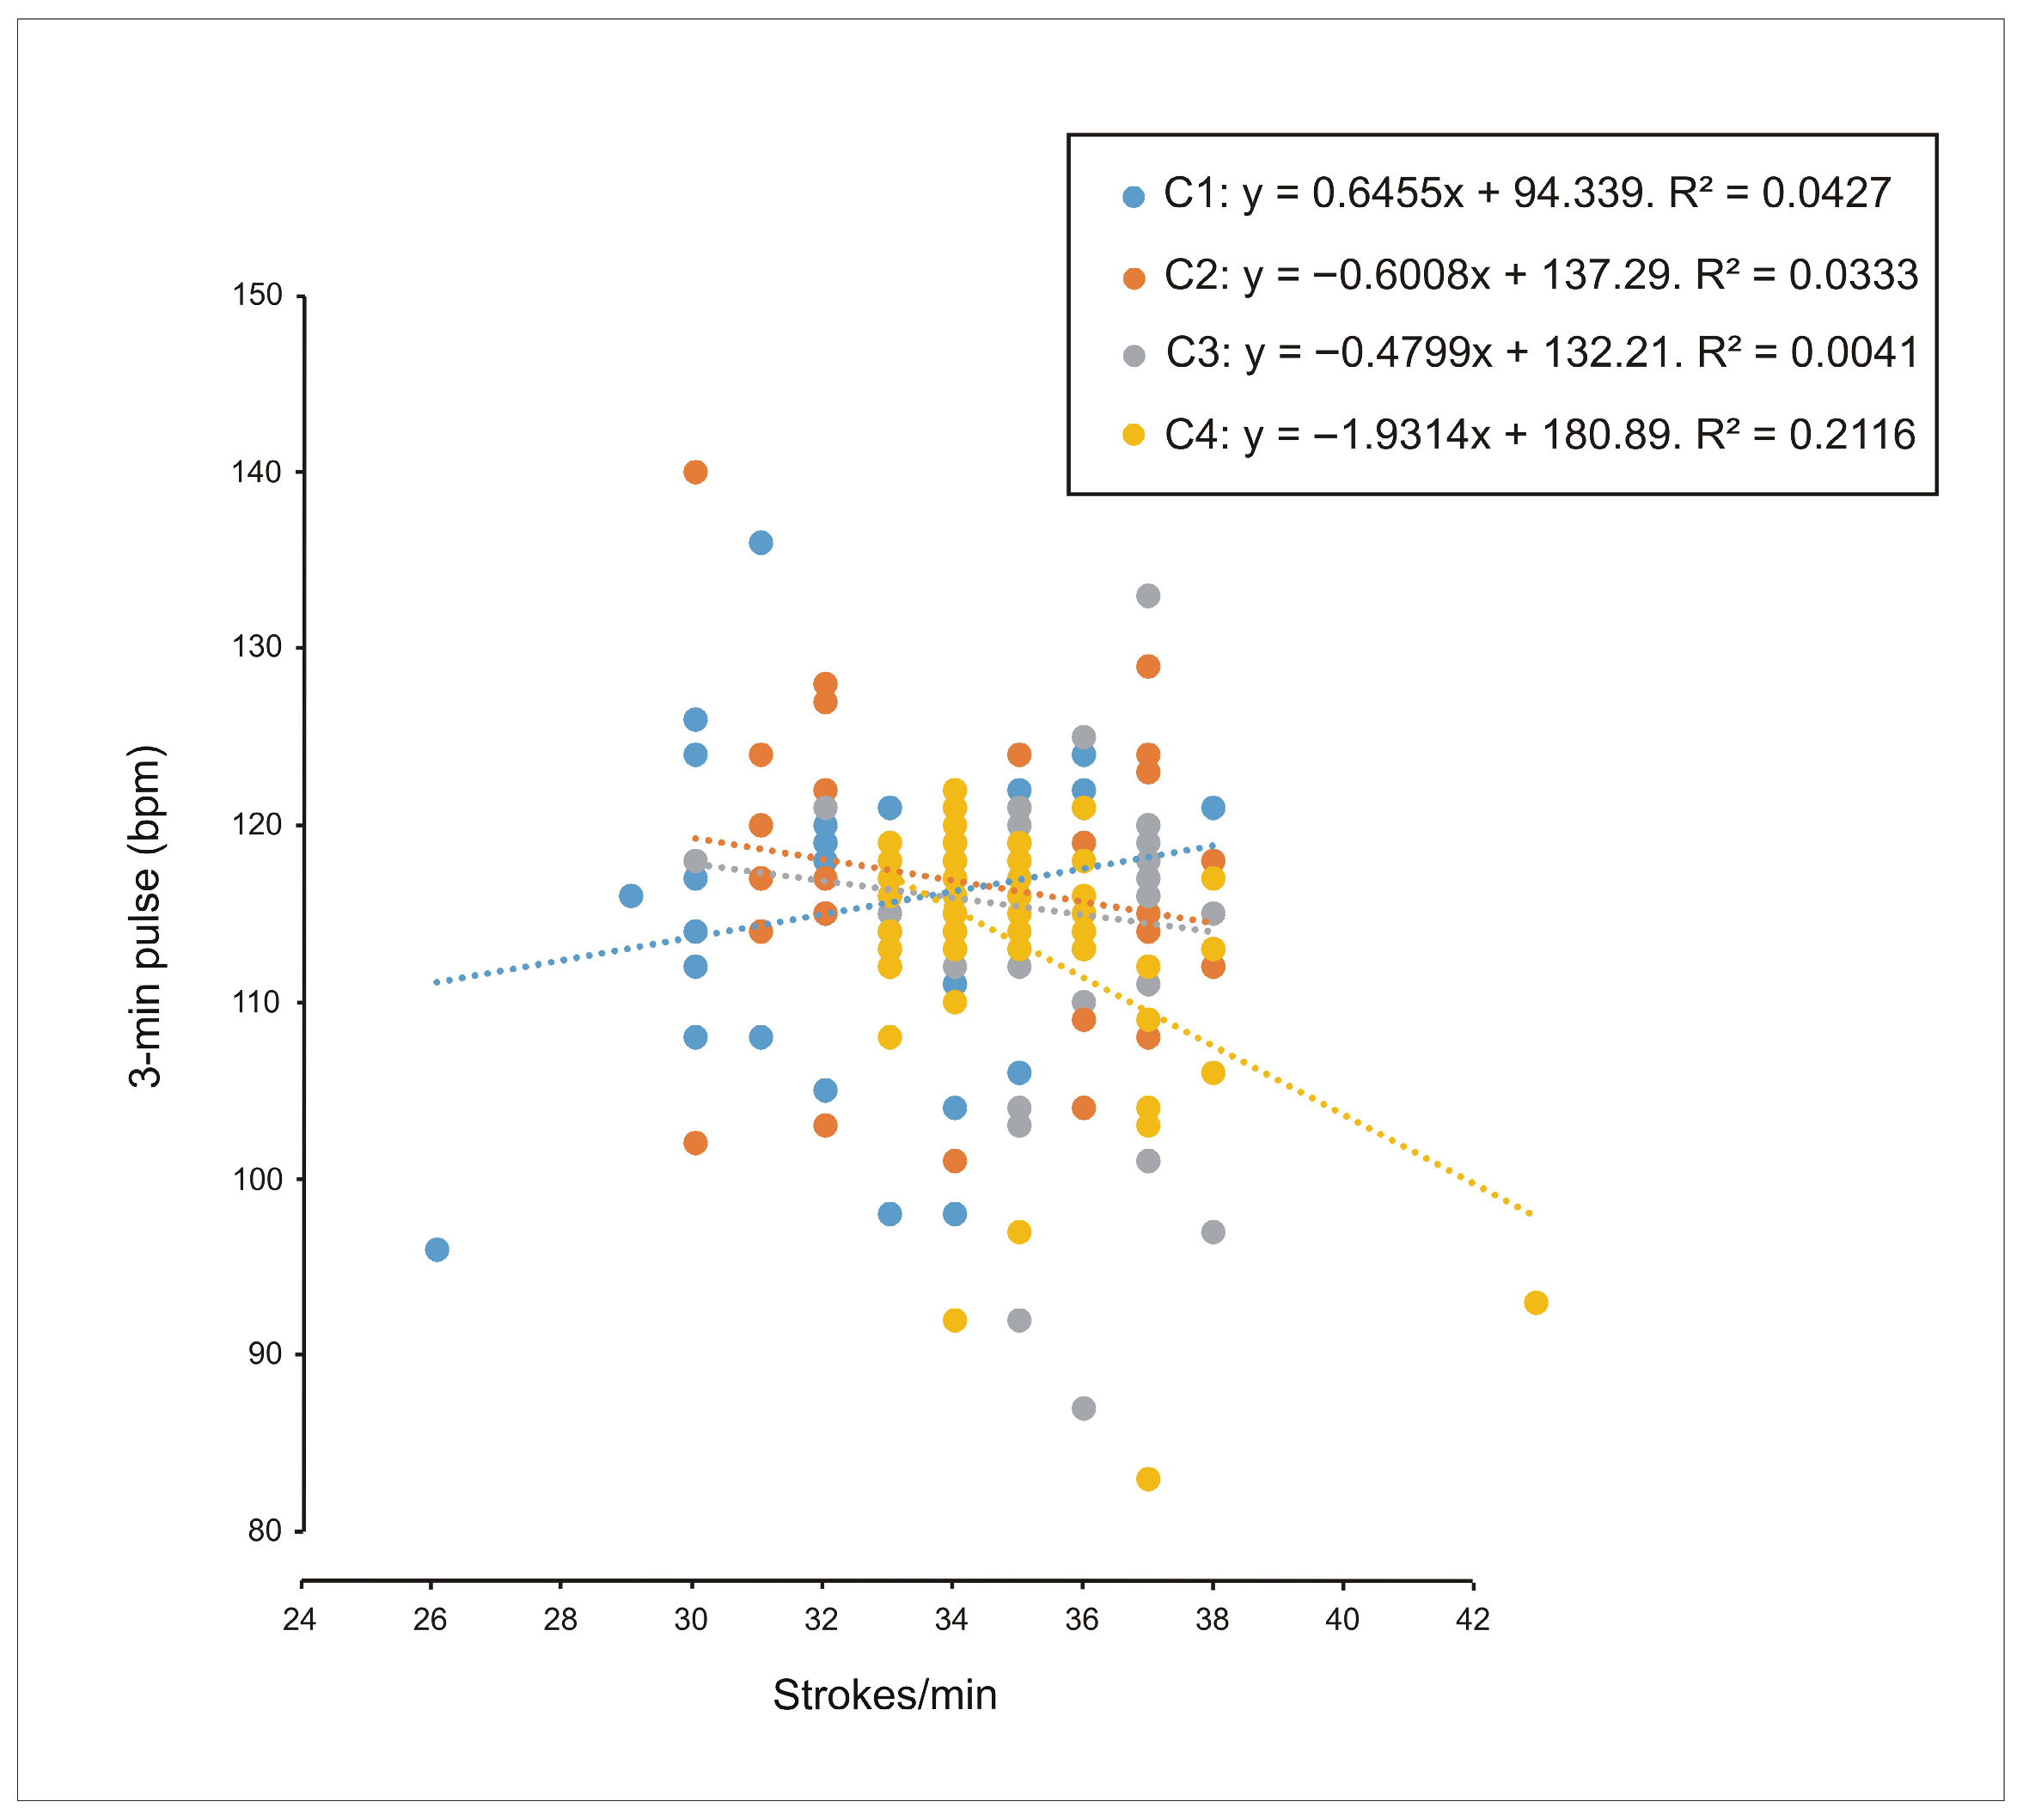
In the 16–17 years group, a weak correlation was observed between the number of strokes performed and the heart rate recorded three minutes after the completion of the test (R
2 = 0.21;
Figure 8). However, no such relationship was found in the 14–15 years category (
Figure 9).
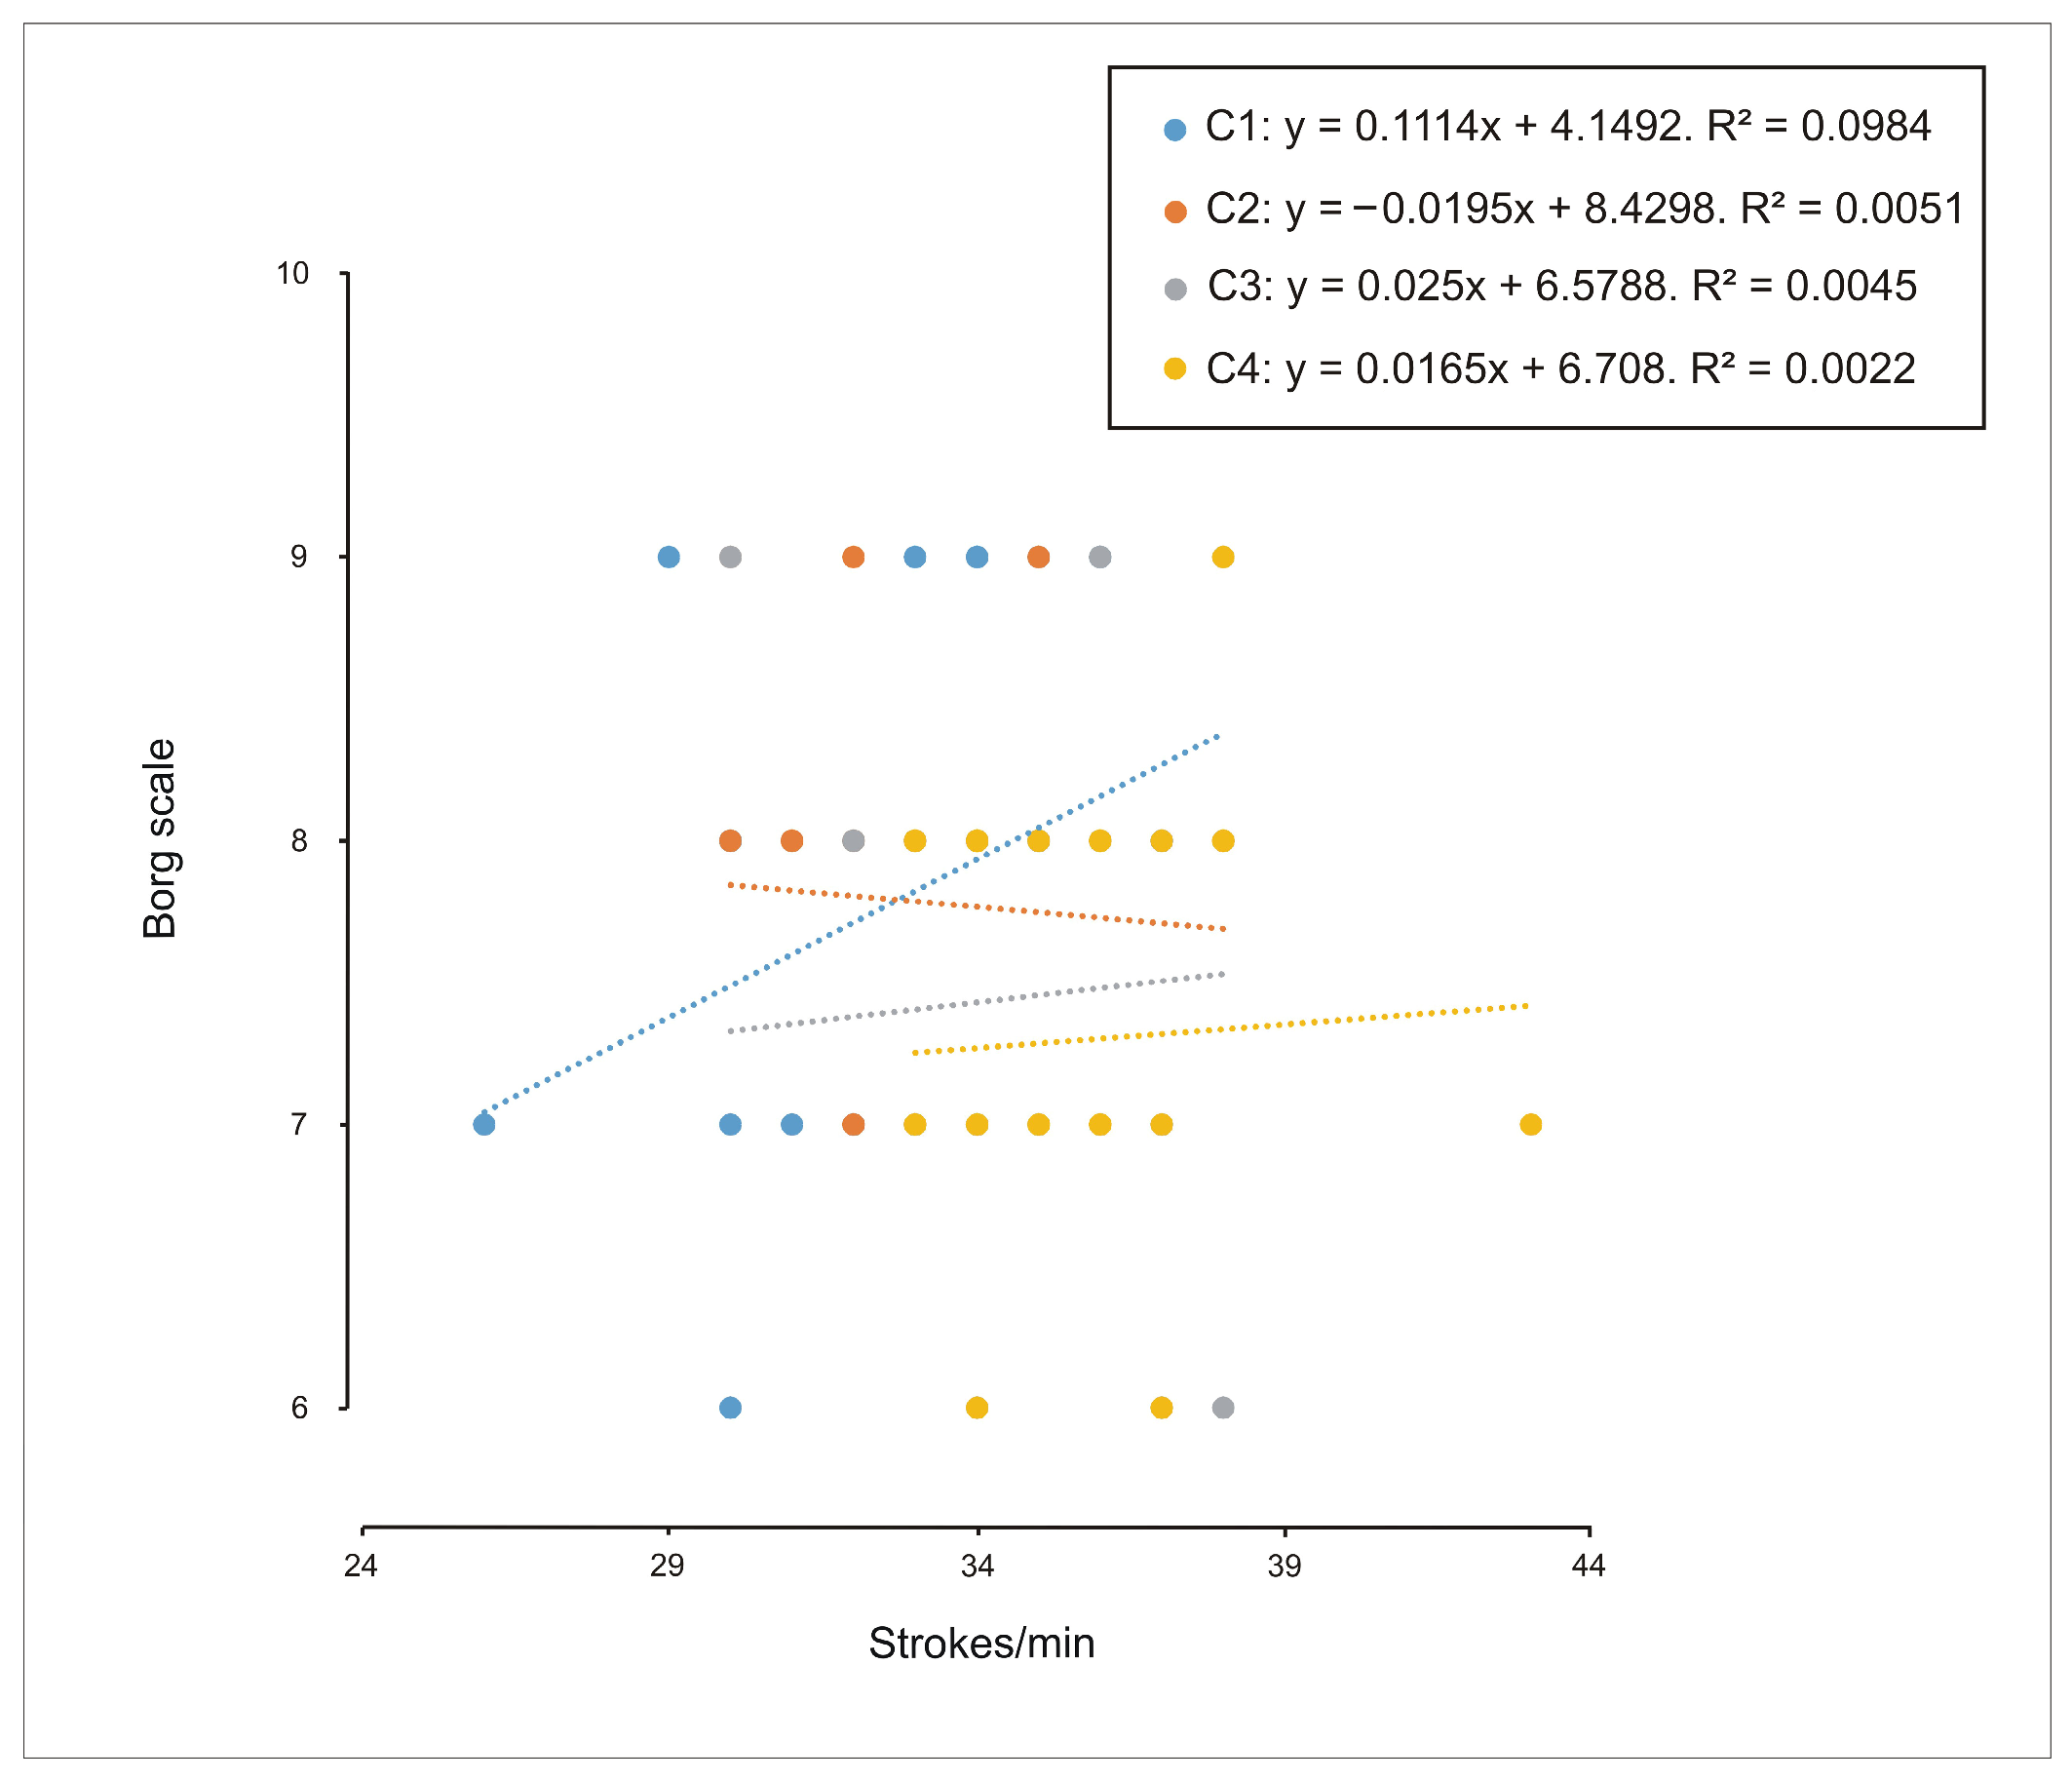
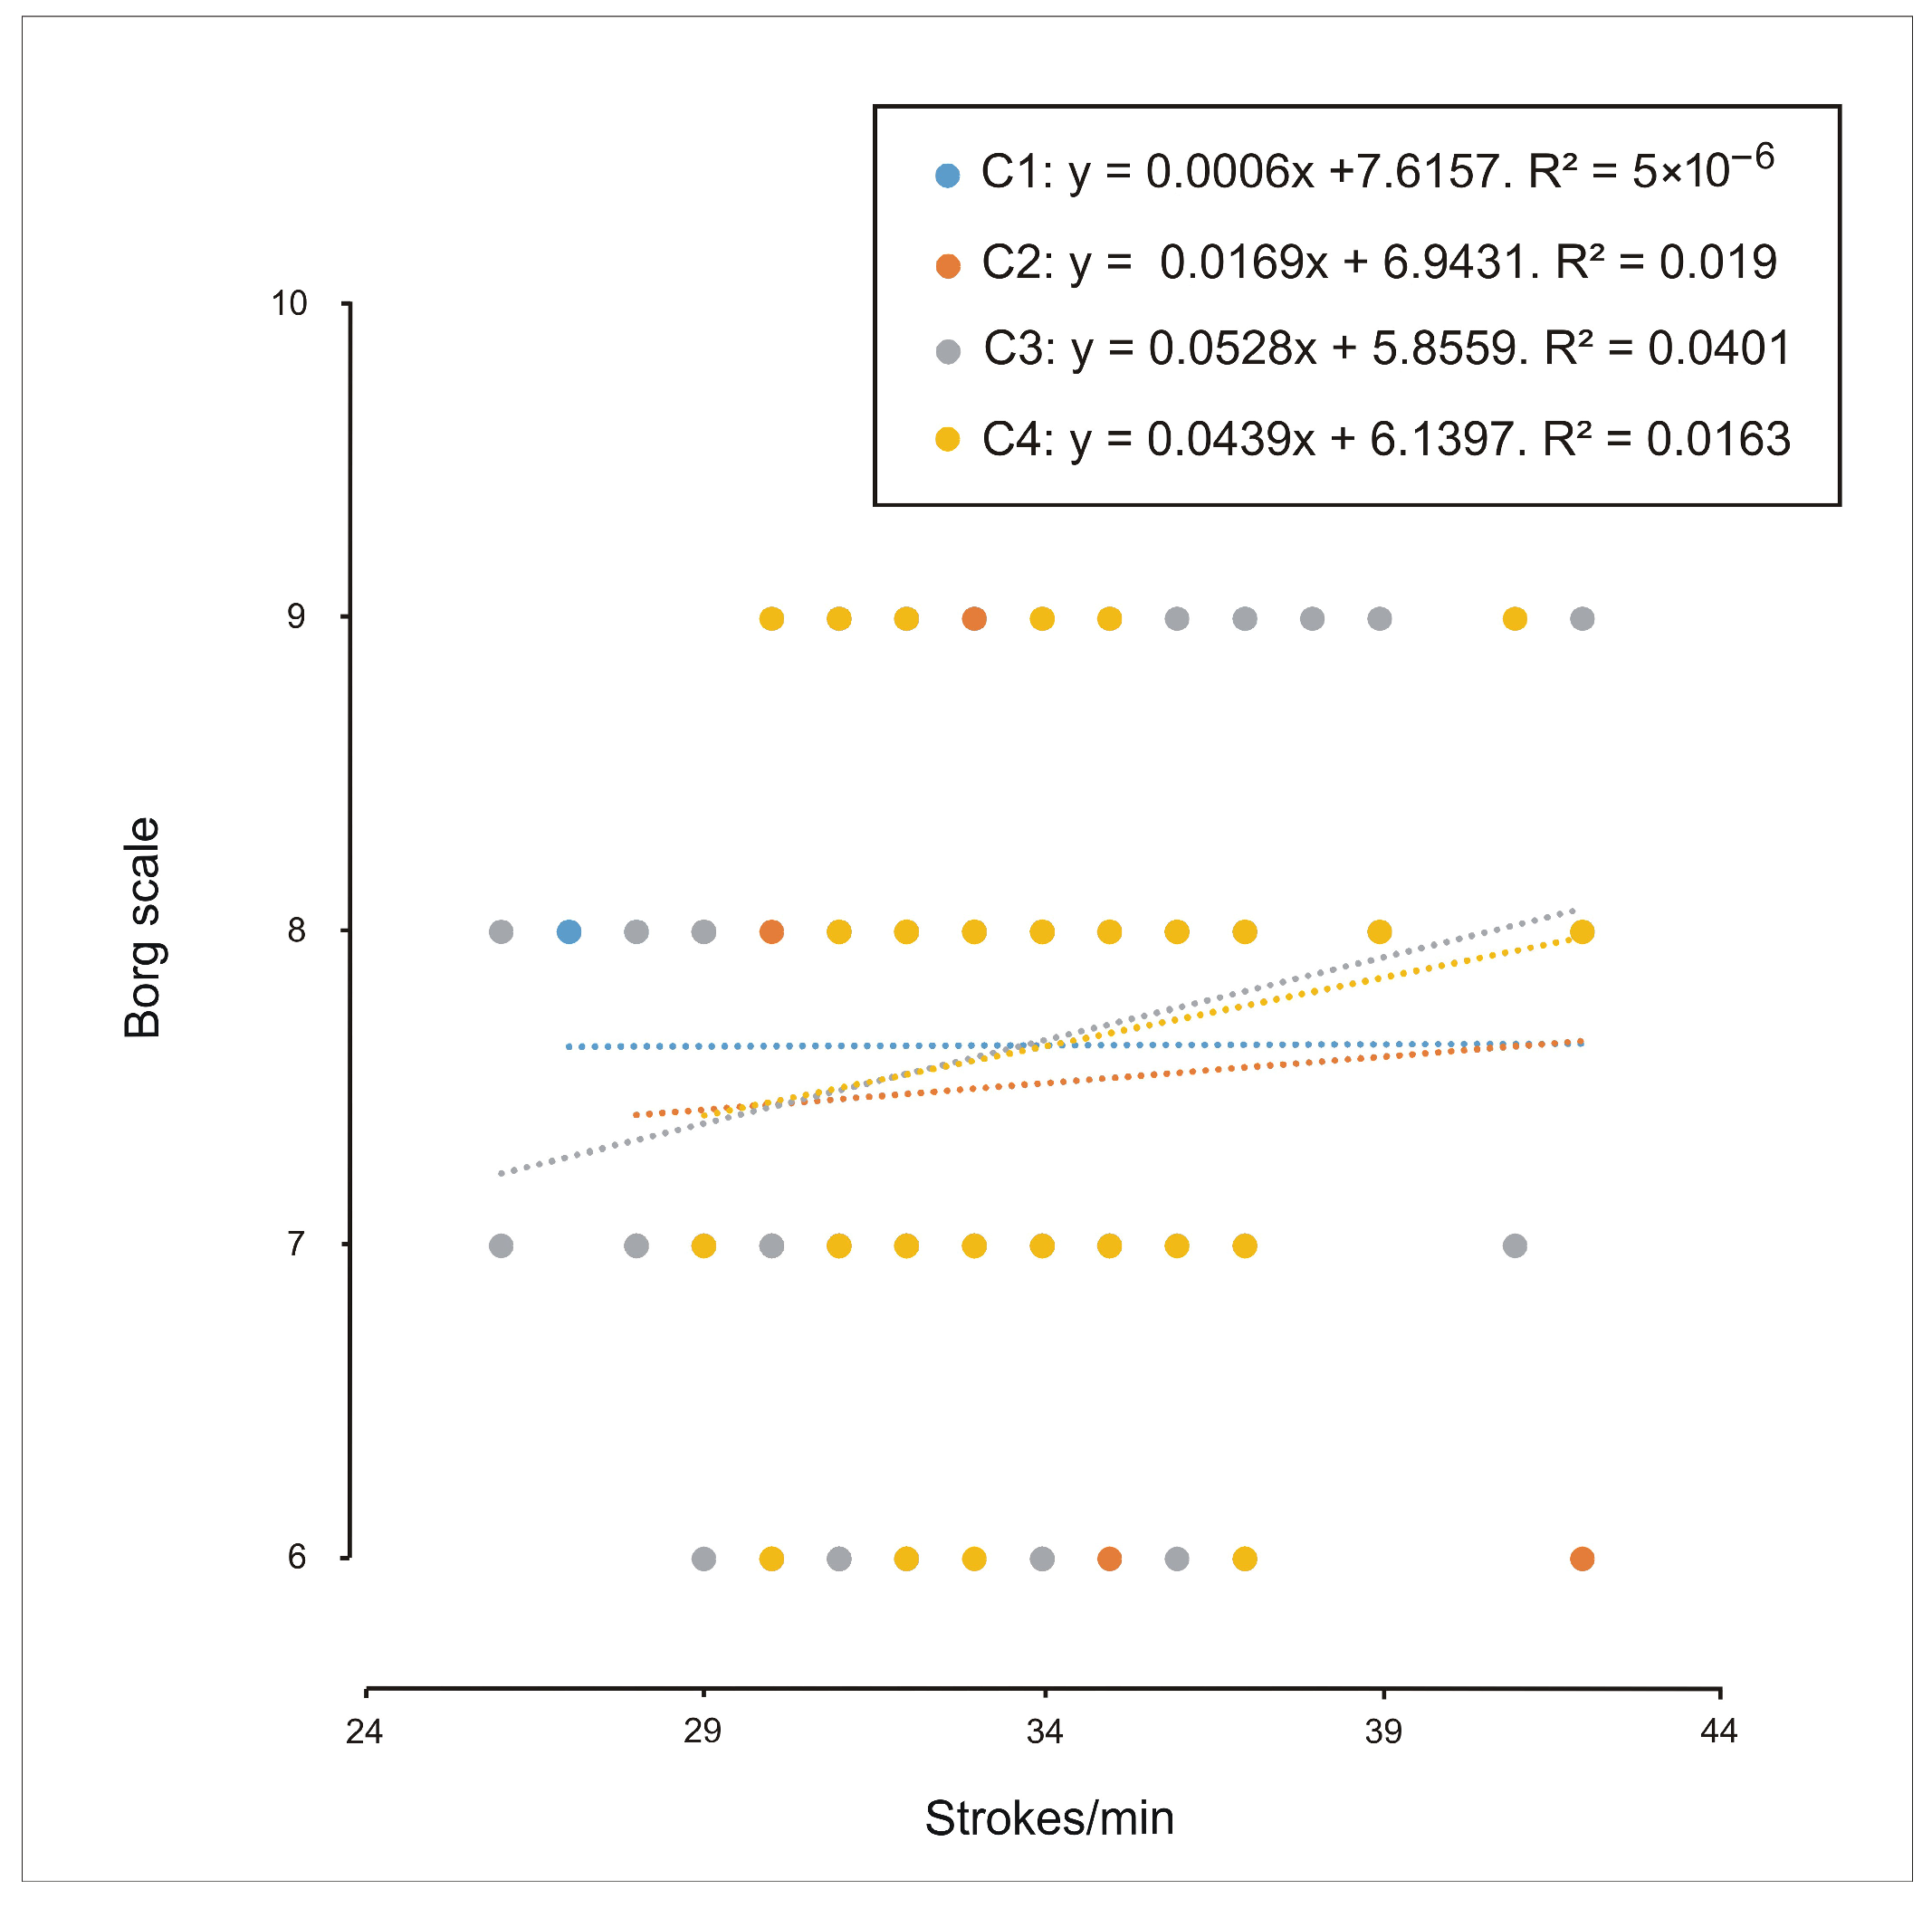
Regarding the relationship between test performance (strokes per minute) and perceived exertion (Borg scale), a weak correlation was observed in individual trials among rowers aged 16–17 years (C1, R
2 = 0.10;
Figure 10), whereas no such correlation was found among rowers aged 14–15 years (
Figure 11).
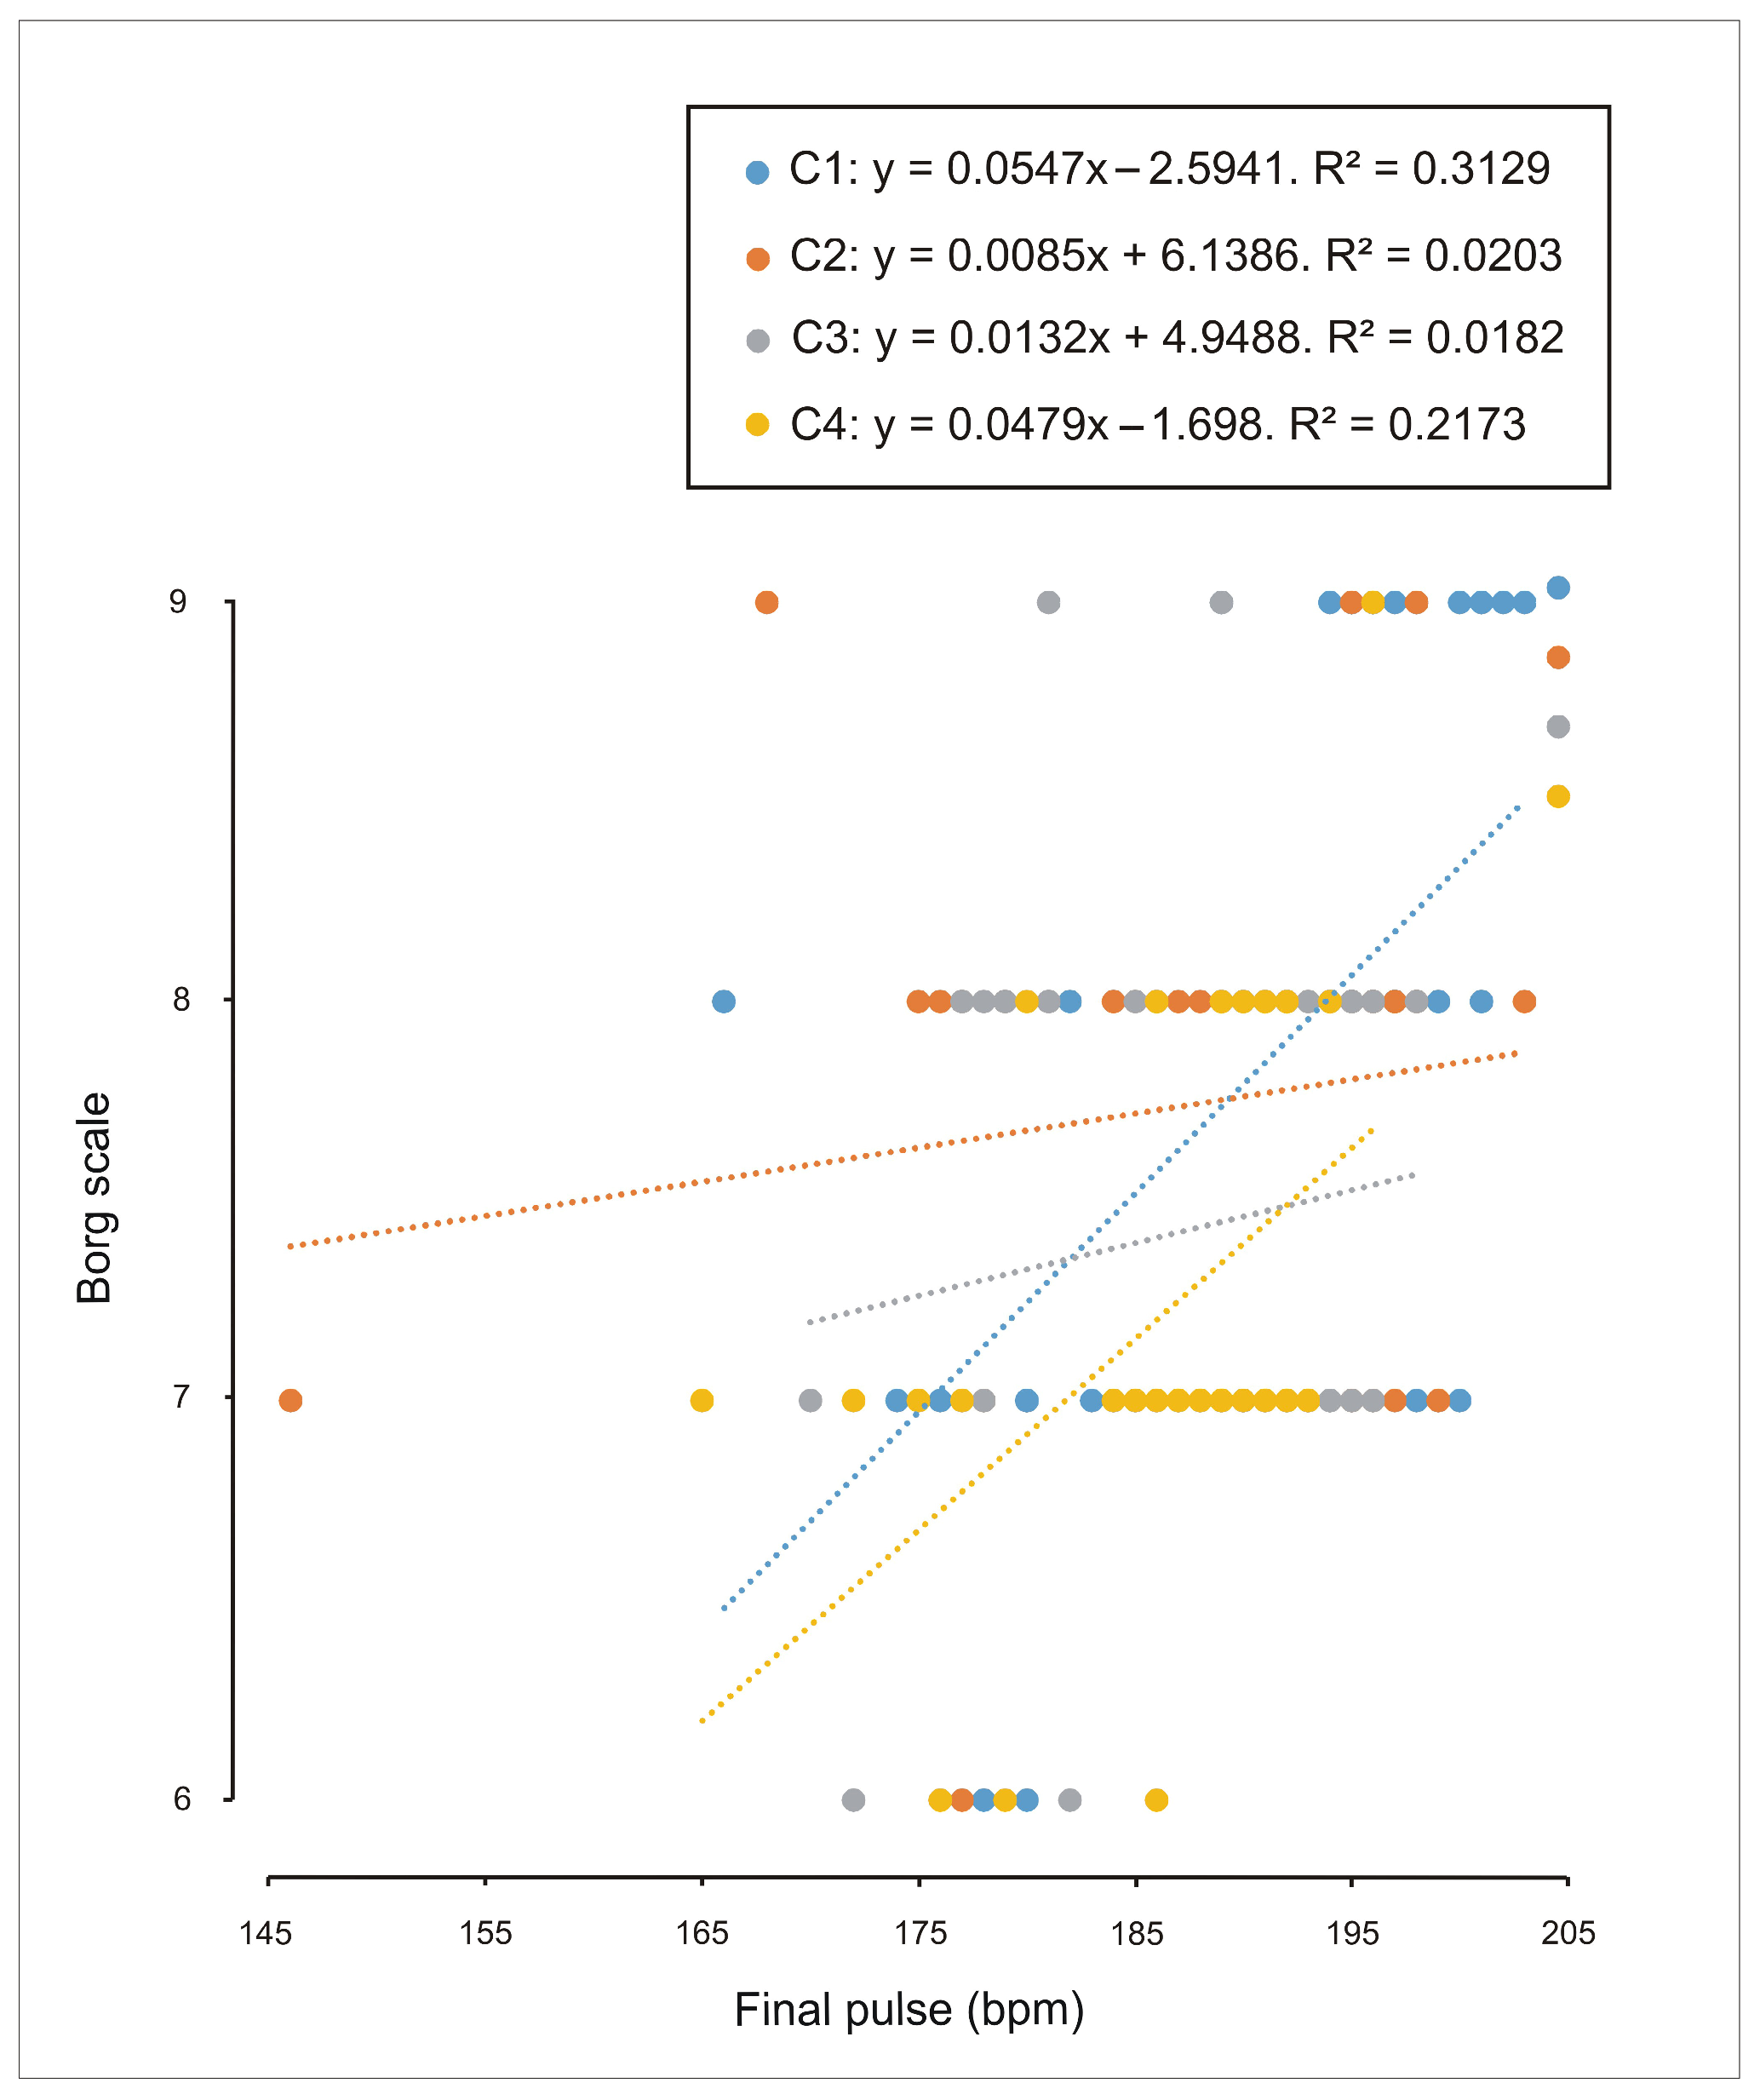
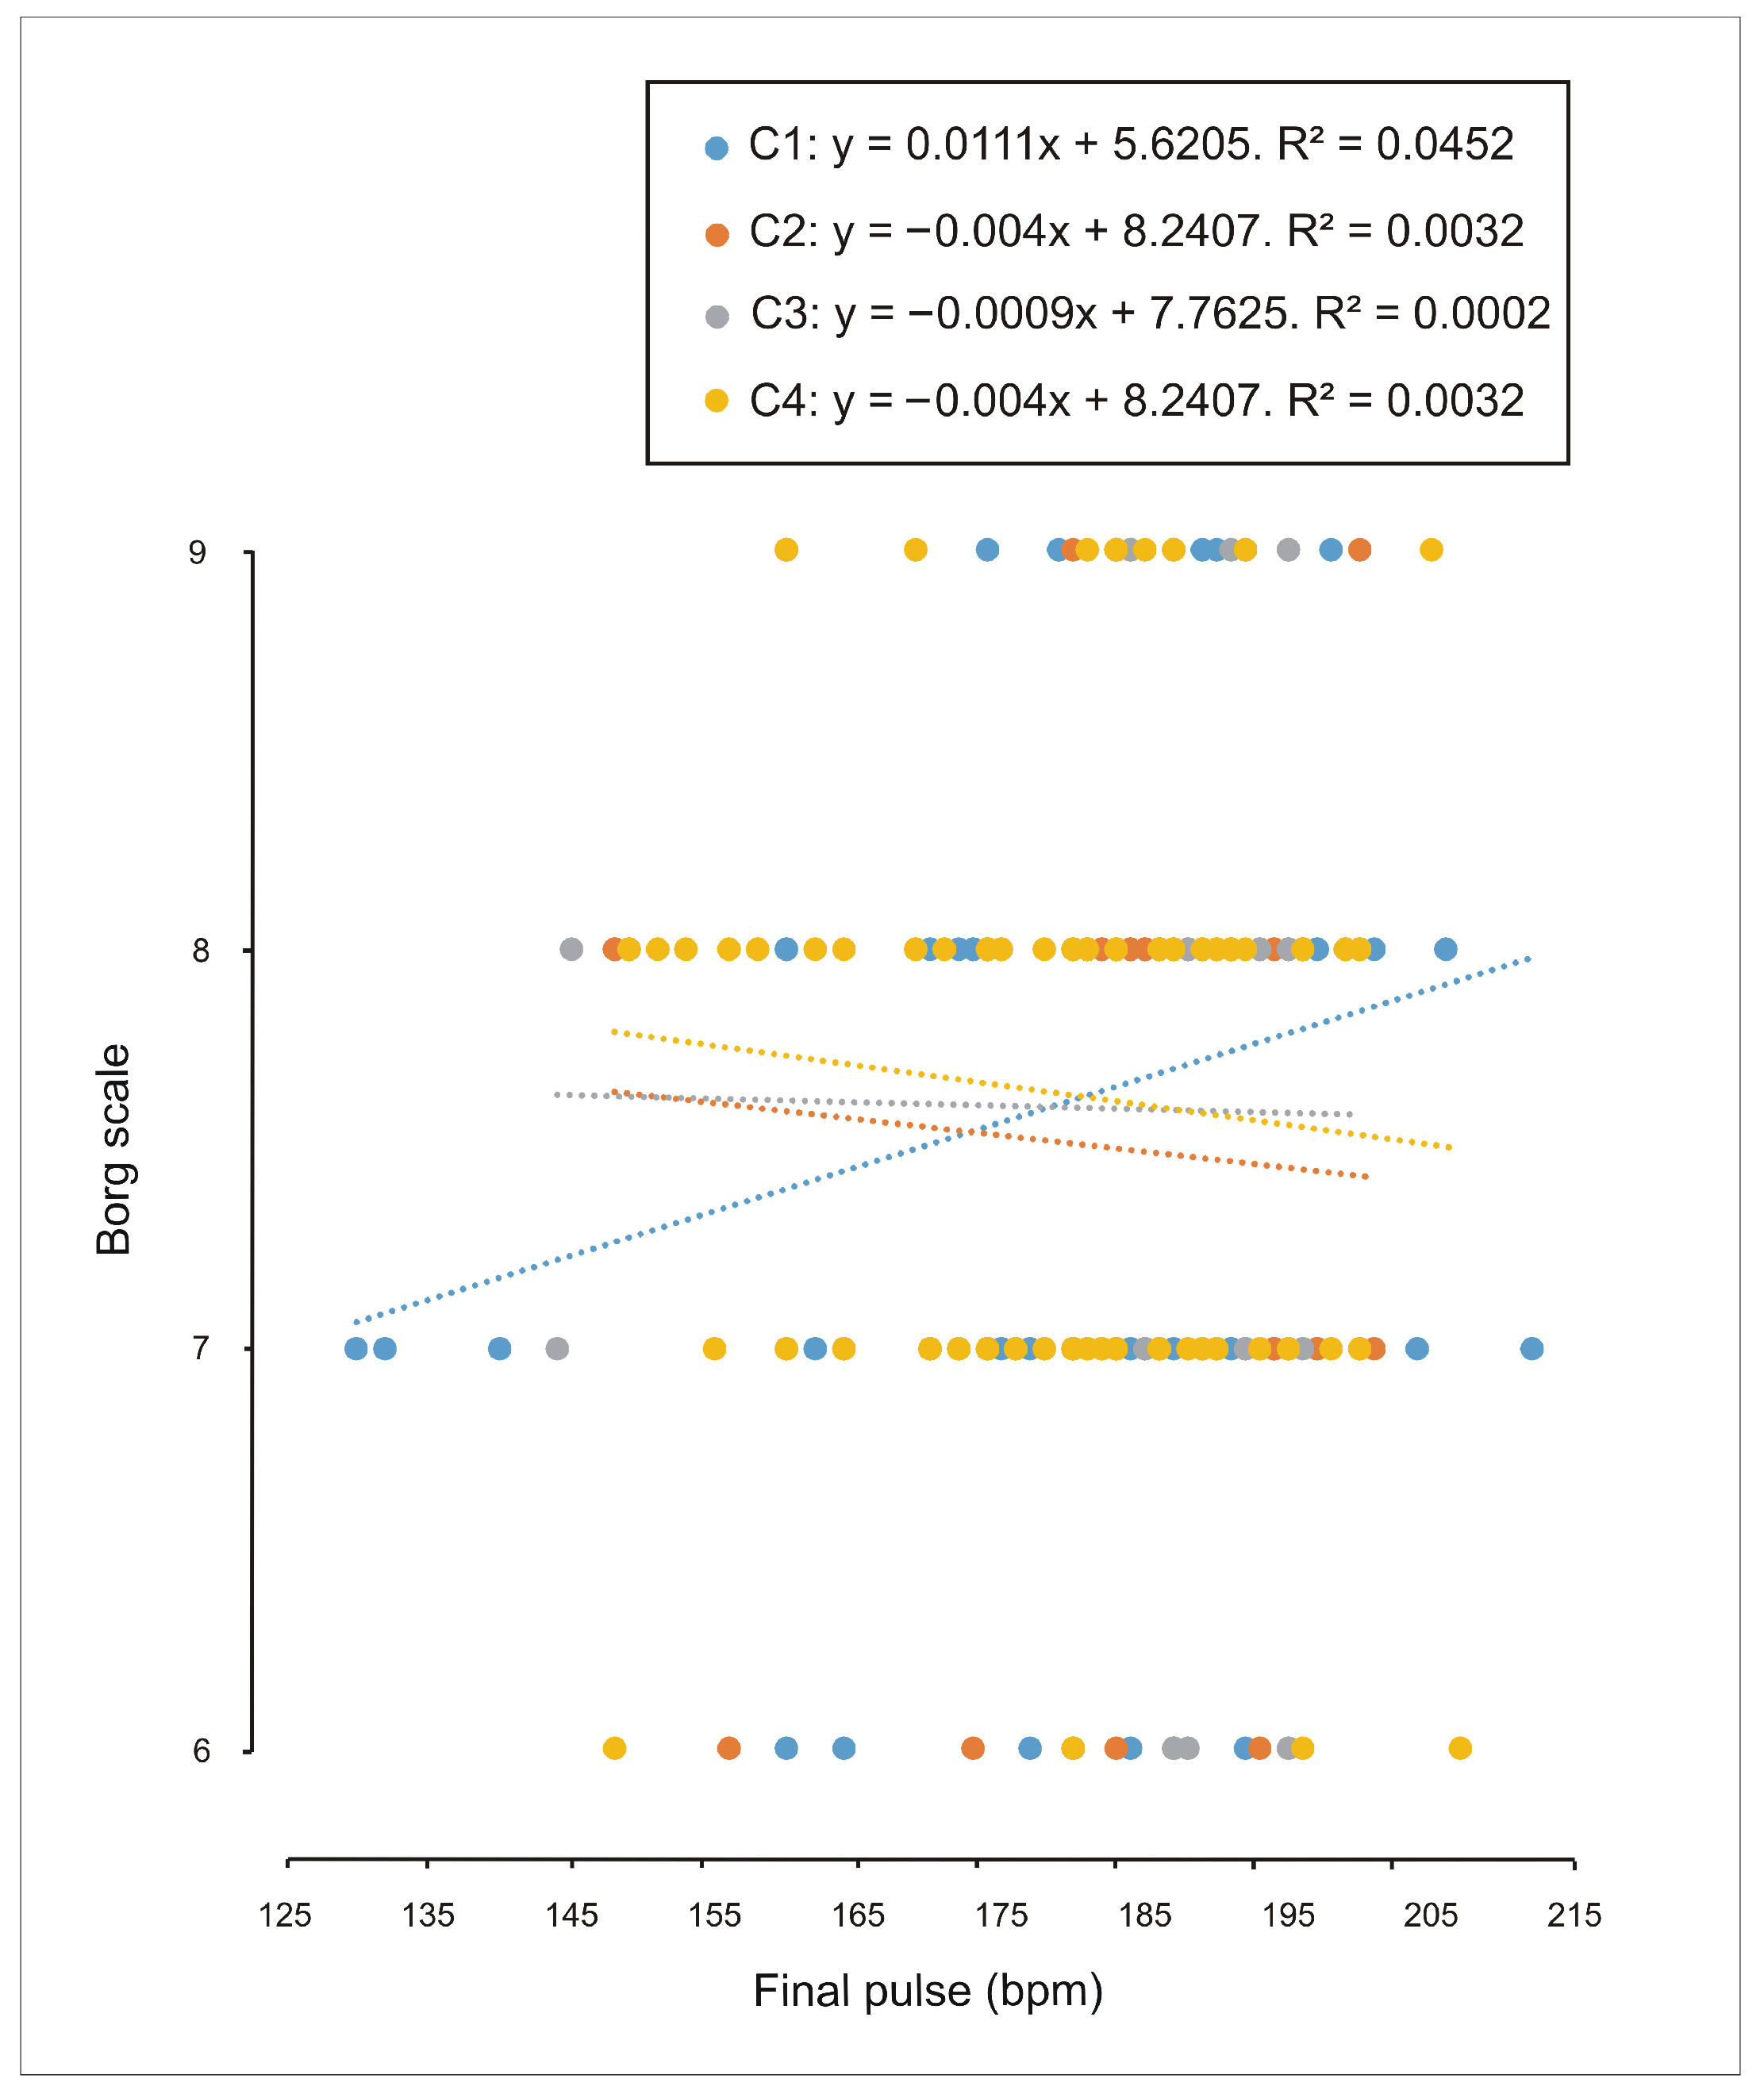
Finally, in the 16–17 years category, a moderate correlation was observed between final heart rate and perceived exertion in the individual trial (C1; R
2 = 0.32), alongside a weak correlation in the eight-person crew trial (C4; R
2 = 0.22) (
Figure 12). However, no significant correlations were found in the 14–15 years group (
Figure 13).
4. Discussion
The following section discusses the findings in relation to the Ringelmann and Köhler effects, while also considering their practical implications for training and crew management in rowing crews aged 14–15 and 16–17 years.
The results indicate that performance responses to different crew size conditions are not entirely uniform across age categories or performance variables. While older rowers (16–17 years) showed stable performance in terms of distance covered and power output across all conditions, some significant pairwise differences emerged in the younger group (14–15 years) and in the whole sample, particularly involving the two-person crew condition (C2). However, these effects were not systematic across all comparisons and were characterised by relatively small inter-subject effect sizes, suggesting that crew configuration may influence performance expression in younger athletes without constituting a consistent performance gain or loss attributable to social effects. In contrast, the intra-subject effect size was very high.
In contrast, stroke rate consistently differed across conditions in both age categories, with higher values generally observed in the eight-person crew condition. This pattern suggests that young rowers adapt their pacing strategy and technical execution according to task structure, likely as a compensatory mechanism to sustain perceived crew performance [
41,
42]. However, as previously noted in the literature, stroke rate primarily reflects individual rowing style and tactical adjustments rather than performance efficiency per se [
33,
34]. Importantly, increases in stroke frequency were not systematically accompanied by proportional gains in distance or power, reinforcing the notion that higher stroke rates may represent an attempt to regulate effort rather than an effective strategy to enhance performance output.
Cardiovascular responses were largely uniform across conditions, especially when heart rate was measured three minutes after exercise. Although small differences in final heart rate were observed in the whole sample and as a non-significant trend in the 14–15 years group, these effects were modest and did not persist beyond the immediate post-exercise phase, thereby limiting their physiological relevance.
Perceived exertion emerged as one of the most consistently affected variables. Rowers aged 16–17 years consistently reported higher perceived effort during individual trials compared with crew-based conditions, particularly when compared with the eight-person crew configuration. This effect aligns with the idea that individual trials heighten perceived responsibility and evaluative pressure, whereas collective contexts may diffuse subjective workload through shared effort and social support [
43]. However, despite this clear perceptual difference, objective performance did not show a systematic decline in larger crews, indicating that this pattern does not correspond to a classical Ringelmann effect, which would predict reduced individual contribution with increasing crew size [
44].
Correlation analyses further contribute to the interpretation of these findings. In the 16–17 years group, weak-to-moderate associations were observed between stroke rate, heart rate and perceived exertion in specific conditions, particularly during individual trials and eight-person crew tasks. These relationships suggest that subjective effort is meaningfully linked to physiological strain in more mature adolescents, supporting the validity of perceived exertion as an indicator of internal load in this age group. In contrast, the absence of significant correlations among rowers aged 14–15 years suggests that younger athletes may still be developing the capacity to accurately interpret and integrate physiological signals with performance output.
Taken together, the findings suggest that crew size primarily influences how effort is regulated and perceived rather than leading to systematic changes in objective performance. Changes in stroke rate and perceived exertion appear to reflect adaptive self-regulation strategies rather than clear motivational losses or gains, supporting the conclusion that neither the Ringelmann nor the Köhler effect is consistently expressed within the present experimental conditions.
From a developmental perspective, these age-related differences may be interpreted in light of the ongoing maturation of executive and self-regulatory functions during adolescence [
45,
46]. Older rowers may be better equipped to differentiate between physical strain and contextual influences such as social support or shared responsibility, which could explain their more consistent perceptual–physiological coupling. Nonetheless, this interpretation remains tentative, as cognitive and emotional processes were not directly assessed in the present study.
5. Conclusions
The results of this study provide valuable insights into the performance of young rowers in both the 14–15 and 16–17 years age categories. Overall, performance outcomes, in terms of distance covered and power output, were relatively stable across age groups, although some significant pairwise differences emerged in the younger group (14–15 years) and in the whole sample, particularly involving specific crew size conditions. These findings suggest that, while training background and physical characteristics may be broadly comparable, younger athletes may be more sensitive to task structure when expressing performance.
An especially noteworthy aspect is the difference observed in stroke rate across the various testing conditions. Clear variations were identified, suggesting that rowers are capable of adjusting their technique and pacing according to the type of trial performed. However, it is also possible that some rowers assume that rowing faster or increasing stroke frequency always leads to better performance, when in reality, this may reduce efficiency and increase fatigue. This ability to modulate effort reflects a degree of tactical maturity relative to their age, yet it also highlights the importance of teaching young athletes how to economise movement and identify the optimal effort level required to perform at their best without wasting energy.
Regarding cardiovascular effort, responses were largely comparable between age categories, particularly when heart rate was assessed several minutes after exercise. Although small differences in final heart rate were observed in some conditions, these effects were modest and transient, suggesting comparable levels of physiological adaptation in both age groups in terms of endurance capacity.
However, when analysing perceived exertion, some interesting nuances emerge. Rowers aged 16–17 years reported higher levels of perceived effort in individual trials compared with crew-based settings, suggesting that older athletes may experience individual efforts as more demanding due to the greater salience of their personal responsibility and the absence of shared workload or social support. Conversely, in collective boat configurations, the workload is distributed among teammates, which may reduce the subjective sensation of intense effort, even when objective performance remains stable.
Weak correlations were also observed between stroke rate and heart rate in some trials, suggesting that not all aspects of exertion can be explained by physiological factors alone; psychological factors and effort regulation play a crucial role. In this regard, perceived exertion emerges as a useful tool for interpreting an athlete’s post-exercise condition, particularly in individual trial contexts.
Among younger athletes (14–15 years), the lack of clear correlations between variables suggests that they are still developing their ability to interpret effort and relate this to performance outcomes. This reinforces the idea that psychological training at this stage should not be considered an optional component, but rather an essential part of the developmental process.
A particularly relevant finding is the absence of consistent evidence supporting either the Ringelmann or Köhler effects. Although crew size influenced how effort was regulated and perceived, young rowers were generally able to maintain stable levels of objective performance across individual and collective conditions, indicating a high degree of commitment and consistency in their performance behaviour.
Looking ahead, it would be valuable to further explore the role of perceived exertion, motivation and other psychological factors in this athlete population. Incorporating emotional assessment tools and strategies to enhance performance self-awareness could substantially influence how young rowers are trained and develop. Moreover, integrating physical and psychological variables within a unified evaluation model would provide a more comprehensive understanding of the athlete, enabling more precise and personalised interventions. In this sense, tailoring training approaches according to age and maturity level could facilitate a smoother transition from youth categories to high-performance stages, promoting balanced and sustainable development.
Additionally, lower-body power constitutes a key determinant of performance in cyclical and explosive disciplines such as rowing. The vertical jump (CMJ) has been widely used as an indirect indicator of the ability to generate force and power in the lower limbs [
47]. Its inclusion in future physical assessment protocols, alongside psycho-physiological indicators, could broaden the understanding of overall performance and may help explain inter-individual differences in rowing power or techniques among young athletes.
6. Limitations
The exclusive use of rowing ergometers and the absence of direct psychological measures (e.g., motivation, cohesion or perceived responsibility) limit the generalisability of the present findings to on-water rowing performance and constrain the interpretation of the underlying socio-motivational mechanisms.
Furthermore, changes in performance observed across the four testing sessions may be partly attributable to progressive familiarisation with the protocol, fluctuations in motivation, cumulative fatigue between testing days or strategic adjustments, rather than to the specific effects of crew configuration. Although the individual trial was necessarily conducted first, as its results were used to match rowers of similar performance and to form balanced crews in the subsequent collective conditions, potential order effects cannot be completely ruled out.
Although the ANOVA revealed high levels of statistical power (1 − β > 0.996 for performance variables such as distance and power), the sample size (N = 136) and the within-subject design limited the detection of small effects (d < 0.2), which are common in social phenomena such as the Ringelmann and Köhler effects in youth sport contexts.
The minimum detectable effect size, estimated at approximately d ≈ 0.25–0.30 on the basis of the observed ɳ2 values (0.039–0.056), precludes drawing conclusions about the true absence of these small-magnitude effects, as the study design may have reduced sensitivity to subtle variations in group motivation.
Therefore, these considerations reinforce the need for future studies with greater power to detect smaller effects and with additional controls for test order, in order to avoid definitively ruling out the presence of Ringelmann and Köhler effects in youth rowing.
Supplementary Materials
The following supporting information can be downloaded at
https://www.mdpi.com/article/10.3390/app16021066/s1, Figure S1: Analysis of heart rate recorded 3 min after the start of each test (3-min pulse) when performed individually (C1), in pairs (C2), in teams of four (C3) and in teams of eight (C4). Paired-wise comparison using Bonferroni correction indicates there were not statistically differences.
Author Contributions
Conceptualization, J.G.-G., J.G.G., J.C.F.-G. and E.P.-G.; Methodology, J.G.-G., J.G.G., J.C.F.-G. and E.P.-G.; Validation, J.G.-G.; Formal analysis, J.G.G. and E.P.-G.; Investigation, J.G.-G., J.G.G., J.C.F.-G. and E.P.-G.; Data curation, J.G.-G., J.C.F.-G. and E.P.-G.; Writing—original draft, J.G.-G., J.G.G., J.C.F.-G. and E.P.-G.; Writing—review & editing, J.G.-G., J.G.G., J.C.F.-G. and E.P.-G.; Visualization, J.C.F.-G.; Supervision, J.G.-G., J.C.F.-G. and E.P.-G.; Funding acquisition, E.P.-G. All authors have read and agreed to the published version of the manuscript.
Funding
This research received no external funding.
Institutional Review Board Statement
This study was approved by the Ethics Committee of the University of Pablo de Olavide (24/8-31) and was conducted in accordance with the ethical considerations for Sport and Exercise Science Research [
37] and the principles of the Declaration of Helsinki [
38], which define the ethical guidelines for research on human subjects.
Informed Consent Statement
Prior to conducting the study, the athletes and their parents/guardians were informed of the objectives of the research and were asked to provide written informed consent for participation and for the publication of the results.
Data Availability Statement
The data presented in this study are available on request from the corresponding author. The data are not publicly available due to the participants are minor involved.
Conflicts of Interest
The authors declare no conflict of interest.
References
- Lidor, R.; Arnon, M.; Maayan, Z.; Shagur, N.; Côté, J. Relative age effect in 14–18-year-old athletes and how they perceive its influence. Front. Sports Act. Living 2021, 3, 622120. [Google Scholar] [CrossRef] [Scilit]
- Wenger, M.; Csapo, R. The relative age effect and the relationship between biological maturity and athletic performance in Austrian elite youth soccer players. Front. Sports Act. Living 2025, 7, 1583880. [Google Scholar] [CrossRef] [Scilit] [PubMed]
- Vaeyens, R.; Philippaerts, R.M.; Malina, R.M. The relative age effect in soccer: A match-related perspective. J. Sports Sci. 2005, 23, 747–756. [Google Scholar] [CrossRef] [Scilit] [PubMed]
- Difernand, A.; De Larochelambert, Q.; Homo, S.; Rousseau, F.; Antero, J.; Toussaint, J.F.; Sedeaud, A. Relative age effects in track-and-field: Identification and performance rebalancing. Front. Physiol. 2023, 13, 1082174. [Google Scholar] [CrossRef] [Scilit]
- Bonito, F.; Viães, J.; Teles, J.; Flores, L.A.; Iglesias, X.; Fragoso, M.I. Relative age effect in the 2022–2023 World Fencing Championships. Front. Sports Act. Living 2025, 7, 1588316. [Google Scholar] [CrossRef] [Scilit]
- Laborde, S.; Brüll, A.; Weber, J.; Anders, L.S. Trait emotional intelligence in sports: A protective role against stress through heart rate variability? Personal. Individ. Differ. 2011, 51, 23–27. [Google Scholar] [CrossRef] [Scilit]
- Ros, A.; Moya-Faz, F.; Garcés de los Fayos, E. Inteligencia emocional y deporte: Situación actual del estado de la investigación. Cuad. Psicol. Deporte 2013, 13, 105–112. [Google Scholar]
- Latinjak, A.T.; López-Ros, V.; Font-Lladó, R. Las emociones en el deporte: Conceptos empleados en un modelo tridimensional. Rev. Psicol. Deporte 2014, 23, 267–274. [Google Scholar]
- Gershgoren, L.; Lebeau, J.-C.; Liu, S.; Tenenbaum, G. Emotions and sport performance. Front. Psychol. 2023, 14, 1207623. [Google Scholar] [CrossRef] [Scilit]
- Robazza, C.; Forzini, F.; di Fronso, S.; Bortoli, L.; Bertollo, M. Athletes’ basic psychological needs and emotions: The role of emotion regulation strategies. Front. Psychol. 2023, 14, 1205102. [Google Scholar] [CrossRef] [Scilit] [PubMed]
- Gutiérrez, D. Coaching Deportivo: Juega y Gana el Partido de tu Vida Dentro y Fuera de la Cancha; FDL: Barcelona, Spain, 2013. [Google Scholar]
- Carron, A.V.; Brawley, L.R. Cohesion: Conceptual and measurement issues. Small Group Res. 2000, 31, 89–106. [Google Scholar] [CrossRef] [Scilit]
- García-Mas, A.; Olmedilla, A.; Morilla, M.; Rivas, C.; García, E.; Ortega, E. Un nuevo modelo de cooperación deportiva y su evaluación meannte un cuestionario. Psicothema 2006, 18, 425–432. [Google Scholar]
- Lochbaum, M.; Sherburn, M.; Sisneros, C.; Cooper, S.; Lane, A.M.; Terry, P.C. Revisiting the self-confidence and sport performance relationship: A systematic review with meta-analysis. Int. J. Environ. Res. Public Health 2022, 19, 6381. [Google Scholar] [CrossRef] [Scilit] [PubMed]
- Kwon, S.H.; Lim, Y.; Park, J. Analyzing the impact of team-building interventions on cohesion in sports teams: A meta-analysis. Front. Psychol. 2024, 15, 1353944. [Google Scholar] [CrossRef] [Scilit]
- Rolls, E.T. Emotion, motivation, decision-making, the orbitofrontal cortex and the amygdala. Brain Struct. Funct. 2023, 228, 2089–2126. [Google Scholar] [CrossRef] [Scilit] [PubMed]
- Voigt, L.; Friedrich, J.C.; Grove, P.; Heinrich, N.W.; Ittlinger, S.; Iskra, M.; Koop, L.; Michirev, A.; Sparascio, S.; Raab, M. Advancing judgment and decision-making research in sport psychology by using the body as an informant in embodied choices. Asian J. Sport Exerc. Psychol. 2023, 3, 47–56. [Google Scholar] [CrossRef] [Scilit]
- Yearby, T.; Myszka, S.; Roberts, W.M.; Woods, C.T.; Davids, K. Applying an ecological approach to practice design in American football: Some case examples on best practice. Sports Coach. Rev. 2022, 13, 362–385. [Google Scholar] [CrossRef] [Scilit]
- Ingham, A.G.; Levinger, G.; Graves, J.; Peckham, V. The Ringelmann effect: Studies of group size and group performance. J. Exp. Soc. Psychol. 1974, 10, 371–384. [Google Scholar] [CrossRef] [Scilit]
- Hüffmeier, J.; Hertel, G.; Torka, A.-K.; Nohe, C.; Krumm, S. In field settings group members (often) show effort gains instead of social loafing. Eur. Rev. Soc. Psychol. 2022, 33, 131–170. [Google Scholar] [CrossRef] [Scilit]
- Gavala-González, J. Motivaciones de los jóvenes sevillanos para abandonar la práctica de actividad físico-deportiva. Rev. Iberoam. Cienc. Act Fís. Deporte 2012, 1, 15–23. [Google Scholar] [CrossRef] [Scilit]
- Hagen, M.H. Combating Social Loafing Performance Reductions in Virtual Groups with Increased Cohesion, Reduced Deindividuation, and Heightened Evaluation Potential Through Self-Disclosure. Master’s Thesis, Harvard University, Cambridge, UK, 2015. [Google Scholar]
- Stewart, V.R.; Snyder, D.G.; Kou, C.-Y. We hold ourselves accountable: A relational view of team accountability. J. Bus. Ethics 2023, 183, 691–712. [Google Scholar] [CrossRef] [Scilit]
- Hertel, G.; Konradt, U.; Orlikowski, B. Effort gains in occupational teams: The effects of social competition and social indispensability. Front. Psychol. 2018, 9, 769. [Google Scholar] [CrossRef] [Scilit]
- Samendinger, S.; Hill, C.R.; Ahn, S.; Feltz, D.L. The Köhler motivation-gain effect with exercise tasks: A meta-analysis. Kinesiol. Rev. 2023, 12, 187–200. [Google Scholar] [CrossRef] [Scilit]
- Hill, C.R.; Samendinger, S.; Rymal, A.M. P-curve analysis of the Köhler motivation gain effect in exercise settings. Ann. Behav. Med. 2021, 55, 543–556. [Google Scholar] [CrossRef] [Scilit]
- Guerra, J.M.; Elgorriaga, E. Acercamiento al Trabajo en Grupo: Conceptos, Procesos y Experiencias; Ediciones Pirámide: Madrid, Spain, 2023. [Google Scholar]
- Zhu, J.; Wang, X.; He, J.; Gao, P. Coach leadership, athlete satisfaction, and group cohesion: A systematic review and meta-analysis. Front. Psychol. 2024, 15, 1385178. [Google Scholar] [CrossRef] [Scilit]
- Volianitis, S.; Yoshiga, C.C.; Secher, N.H. The physiology of rowing with perspective on training and health. Eur. J. Appl. Physiol. 2020, 120, 1943–1963. [Google Scholar] [CrossRef] [Scilit]
- Pelz, P.F.; Vergé, A. Validated biomechanical model for efficiency and speed of rowing. J. Biomech. 2014, 47, 3415–3422. [Google Scholar] [CrossRef] [Scilit] [PubMed]
- Kleshnev, V. Biomechanics of Rowing: A Unique Insight into the Technical and Tactical Aspects of Elite Rowing, 2nd ed; The Crowood Press: Ramsbury, UK, 2020. [Google Scholar]
- Cardoso, R.; Rios, M.; Fonseca, P.; Leão, J.; Cardoso, F.; Abraldes, J.A.A.; Gomes, B.B.; Vilas-Boas, J.P.; Fernandes, R.J. Assessment of angular and straight linear rowing ergometers at different intensities of exercise. Sensors 2024, 24, 5686. [Google Scholar] [CrossRef] [Scilit] [PubMed]
- Binnie, M.J.; Astridge, D.; Watts, S.P.; Goods, P.S.R.; Rice, A.J.; Peeling, P. Quantifying on-water performance in rowing: Current challenges and future directions. Sports Med. Open 2023, 9, 41. [Google Scholar] [CrossRef] [Scilit] [PubMed]
- Watts, S.P.; Astridge, D.; Rice, A.J.; Goods, P.S.R.; Peeling, P.; Binnie, M.J. Exploring the depths of on-water training in highly-trained rowing athletes. Physiol. Rep. 2024, 12, e16034. [Google Scholar] [CrossRef] [Scilit]
- Secher, N.H. Rowing. In Endurance in Sport, 2nd ed; Shephard, R.J., Åstrand, P.-O., Eds.; Blackwell Science: Oxford, UK, 2000; pp. 836–843. [Google Scholar]
- Legge, N.; Watsford, M.; Sharp, P.; O’Meara, D.; Slattery, K. Physical and technical attributes associated with on-water performance in junior and elite rowers. J. Sports Sci. 2024, 42, 1716–1726. [Google Scholar] [CrossRef] [Scilit]
- Harriss, D.J.; MacSween, A.; Atkinson, G. Standards for Ethics in Sport and Exercise Science Research: 2018 Update. Int. J. Sports Med. 2017, 38, 1126–1131. [Google Scholar] [CrossRef] [Scilit]
- World Medical Association. World Medical Association Declaration of Helsinki: Ethical principles for medical research involving human subjects. JAMA 2013, 310, 2191–2194. [Google Scholar] [CrossRef] [Scilit] [PubMed]
- Borg, G.A. Psychophysical bases of perceived exertion. Med. Sci. Sports Exerc. 1982, 14, 377–381. [Google Scholar] [CrossRef] [Scilit] [PubMed]
- Gavala-González, J.; Martins, B.; Ponseti, F.J.; Garcia-Mas, A. Studying well and performing well: A Bayesian analysis on team and individual rowing performance in dual career athletes. Front. Psychol. 2020, 11, 583409. [Google Scholar] [CrossRef] [Scilit]
- Menting, S.G.P.; Edwards, A.M.; Hettinga, F.J.; Elferink-Gemser, M.T. Pacing behaviour development and acquisition: A systematic review. Sports Med. Open 2022, 8, 143. [Google Scholar] [CrossRef] [Scilit]
- Edmonds, R.; Sinclair, W.H.; Leicht, A.S.; McKean, M.R.; Burkett, B. Heart rate variability responses across a training cycle in high-performing youth female rowers. Int. J. Environ. Res. Public Health 2020, 17, 8391. [Google Scholar] [CrossRef] [Scilit]
- Almeida-Neto, P.F.d.; de Morais Ferreira, A.B.; Baxter-Jones, A.; de Medeiros, J.A.; Felipe da Silva, L.; Silva Dantas, P.M.; de Araújo Tinôco Cabral, B.G. Physiological mechanisms of muscle strength and power are dependent on the years post obtaining peak height velocity in elite juniors rowers: A cross-sectional study. PLoS ONE 2023, 18, e0286687. [Google Scholar] [CrossRef] [Scilit] [PubMed]
- Caracuel Tubío, J.C.; Jaenes Sánchez, J.C.; de Marco Pérez, J.M. El rendimiento deportivo en equipos de remo: El efecto Ringelmann. Rev. Andal. Med. Deporte 2011, 4, 52–57. [Google Scholar]
- De Wachter, J.; Lenoir, M.; De Cuyper, K.; Barbier, J. Prefrontal cortex oxygenation during endurance performance: A systematic review of fNIRS studies. Front. Physiol. 2021, 12, 761232. [Google Scholar] [CrossRef] [Scilit]
- Ren, S.; Li, J.; Li, H.; Li, Y. Executive function strengths in athletes: A systematic review. Sports Med. Open 2024, 10, 107. [Google Scholar] [CrossRef] [Scilit]
- Jaramillo, C.; Montealegre Mesa, L.M. Efectos de un programa de entrenamiento de fuerza en máquinas inerciales sobre Squat Jump, Countermovement Jump y Abalakov en jugadoras juveniles de voleibol. Rev. Iberoam. Cienc. Act. Fis. Deporte 2023, 12, 1–14. [Google Scholar] [CrossRef] [Scilit]
Figure 1.
Analysis of exercise performance (strokes per minute) during individual trials (C1), two-person crews (C2), four-person crews (C3) and eight-person crews (C4). Pairwise comparisons using the Bonferroni correction indicate the following: ♦♦, significant differences for the whole sample (p < 0.001); *, significant differences for the 14–15 years age category (p < 0.05); ♥♥, significant differences for the 16–17 years age category (p < 0.001).
Figure 1.
Analysis of exercise performance (strokes per minute) during individual trials (C1), two-person crews (C2), four-person crews (C3) and eight-person crews (C4). Pairwise comparisons using the Bonferroni correction indicate the following: ♦♦, significant differences for the whole sample (p < 0.001); *, significant differences for the 14–15 years age category (p < 0.05); ♥♥, significant differences for the 16–17 years age category (p < 0.001).
Figure 2.
Analysis of exercise performance (metres) for individual trials (C1), two-person crews (C2), four-person crews (C3) and eight-person crews (C4). Pairwise comparisons using the Bonferroni correction indicate the following: ♦♦, significant differences for the whole sample (p < 0.001); **, significant differences for the 14–15 years age category (p < 0.001).
Figure 2.
Analysis of exercise performance (metres) for individual trials (C1), two-person crews (C2), four-person crews (C3) and eight-person crews (C4). Pairwise comparisons using the Bonferroni correction indicate the following: ♦♦, significant differences for the whole sample (p < 0.001); **, significant differences for the 14–15 years age category (p < 0.001).
Figure 3.
Analysis of exercise performance (W) for individual trials (C1), two-person crews (C2), four-person crews (C3) and eight-person crews (C4). Pairwise comparisons using the Bonferroni correction indicate the following: ♦♦, significant differences for the whole sample (p < 0.001); **, significant differences for the 14–15 years age category (p < 0.001).
Figure 3.
Analysis of exercise performance (W) for individual trials (C1), two-person crews (C2), four-person crews (C3) and eight-person crews (C4). Pairwise comparisons using the Bonferroni correction indicate the following: ♦♦, significant differences for the whole sample (p < 0.001); **, significant differences for the 14–15 years age category (p < 0.001).
Figure 4.
Analysis of heart rate recorded at the end of the tests (final bpm) for individual trials (C1), two-person crews (C2), four-person crews (C3) and eight-person crews (C4). Pairwise comparisons using the Bonferroni correction indicate the following: ♦, significant differences for the whole sample (♦, p < 0.05); *, significant differences for the 14–15 years age category (*, p < 0.05).
Figure 4.
Analysis of heart rate recorded at the end of the tests (final bpm) for individual trials (C1), two-person crews (C2), four-person crews (C3) and eight-person crews (C4). Pairwise comparisons using the Bonferroni correction indicate the following: ♦, significant differences for the whole sample (♦, p < 0.05); *, significant differences for the 14–15 years age category (*, p < 0.05).
Figure 5.
Analysis of perceived exertion (Borg scale) during individual trials (C1), two-person crews (C2), four-person crews (C3) and eight-person crews (C4). Pairwise comparisons using the Bonferroni correction indicate the following: ♥, significant differences for the 16–17 years age category (♥, p < 0.05; ♥♥, p < 0.001).
Figure 5.
Analysis of perceived exertion (Borg scale) during individual trials (C1), two-person crews (C2), four-person crews (C3) and eight-person crews (C4). Pairwise comparisons using the Bonferroni correction indicate the following: ♥, significant differences for the 16–17 years age category (♥, p < 0.05; ♥♥, p < 0.001).
Figure 6.
Correlation between final heart rate (beats per minute) and performance (strokes per minute) in the 16–17 years age category during individual trials (C1), two-person crews (C2), four-person crews (C3) and eight-person crews (C4). A weak correlation was observed in C1 (R2 = 0.12). bpm = beats per minute.
Figure 6.
Correlation between final heart rate (beats per minute) and performance (strokes per minute) in the 16–17 years age category during individual trials (C1), two-person crews (C2), four-person crews (C3) and eight-person crews (C4). A weak correlation was observed in C1 (R2 = 0.12). bpm = beats per minute.
Figure 7.
Correlation between final heart rate (beats per minute) and performance (strokes per minute) in the 14–15 years age category during individual trials (C1), two-person crews (C2), four-person crews (C3) and eight-person crews (C4). No correlations were observed between the variables. bpm = beats per minute.
Figure 7.
Correlation between final heart rate (beats per minute) and performance (strokes per minute) in the 14–15 years age category during individual trials (C1), two-person crews (C2), four-person crews (C3) and eight-person crews (C4). No correlations were observed between the variables. bpm = beats per minute.
Figure 8.
Correlation between heart rate measured three minutes after exercise completion (beats per minute) and performance (strokes per minute) in the 16–17 years age category for individual trials (C1), two-person crews (C2), four-person crews (C3) and eight-person crews (C4). A weak correlation was observed in C4 (R2 = 0.21). bpm = beats per minute.
Figure 8.
Correlation between heart rate measured three minutes after exercise completion (beats per minute) and performance (strokes per minute) in the 16–17 years age category for individual trials (C1), two-person crews (C2), four-person crews (C3) and eight-person crews (C4). A weak correlation was observed in C4 (R2 = 0.21). bpm = beats per minute.
Figure 9.
Correlation between heart rate measured three minutes after exercise completion (beats per minute) and performance (strokes per minute) in the 14–15 years age category for individual trials (C1), two-person crews (C2), four-person crews (C3) and eight-person crews (C4). No correlations were observed between the variables. bpm = beats per minute.
Figure 9.
Correlation between heart rate measured three minutes after exercise completion (beats per minute) and performance (strokes per minute) in the 14–15 years age category for individual trials (C1), two-person crews (C2), four-person crews (C3) and eight-person crews (C4). No correlations were observed between the variables. bpm = beats per minute.
Figure 10.
Correlation between perceived exertion (Borg scale) and performance (strokes per minute) in the 16–17 years age category for individual trials (C1), two-person crews (C2), four-person crews (C3) and eight-person crews (C4). A weak correlation was observed in C1 (R2 = 0.10).
Figure 10.
Correlation between perceived exertion (Borg scale) and performance (strokes per minute) in the 16–17 years age category for individual trials (C1), two-person crews (C2), four-person crews (C3) and eight-person crews (C4). A weak correlation was observed in C1 (R2 = 0.10).
Figure 11.
Correlation between perceived exertion (Borg scale) and performance (strokes per minute) in the 14–15-years age category for individual trials (C1), two-person crews (C2), four-person crews (C3) and eight-person crews (C4). No correlations were observed between the variables.
Figure 11.
Correlation between perceived exertion (Borg scale) and performance (strokes per minute) in the 14–15-years age category for individual trials (C1), two-person crews (C2), four-person crews (C3) and eight-person crews (C4). No correlations were observed between the variables.
Figure 12.
Correlation between perceived exertion (Borg scale) and final heart rate (beats per minute) in the 16–17 years age category for individual trials (C1), two-person crews (C2), four-person crews (C3) and eight-person crews (C4). A moderate correlation was observed in C1 (R2 = 0.32) and a weak correlation in C4 (R2 = 0.22). bpm = beats per minute.
Figure 12.
Correlation between perceived exertion (Borg scale) and final heart rate (beats per minute) in the 16–17 years age category for individual trials (C1), two-person crews (C2), four-person crews (C3) and eight-person crews (C4). A moderate correlation was observed in C1 (R2 = 0.32) and a weak correlation in C4 (R2 = 0.22). bpm = beats per minute.
Figure 13.
Correlation between perceived exertion (Borg scale) and final heart rate (beats per minute) in the 14–15 years age category for individual trials (C1), two-person crews (C2), four-person crews (C3) and eight-person crews (C4). No correlations were observed between the variables. bpm = beats per minute.
Figure 13.
Correlation between perceived exertion (Borg scale) and final heart rate (beats per minute) in the 14–15 years age category for individual trials (C1), two-person crews (C2), four-person crews (C3) and eight-person crews (C4). No correlations were observed between the variables. bpm = beats per minute.
Table 1.
Mean scores and their dimensions for all outcomes. SD = standard deviation.
Table 1.
Mean scores and their dimensions for all outcomes. SD = standard deviation.
| Value | Category | | C1 | C2 | C3 | C4 |
|---|
| Performance (strokes/min) | 14–15 years | mean | 32.850 | 32.660 | 33.100 | 33.600 |
| SD | 2.727 | 2.256 | 3.047 | 2.326 |
| n | 73 | 73 | 73 | 73 |
| 16–17 years | mean | 33.580 | 34.240 | 34.640 | 34.960 |
| SD | 2.225 | 1.990 | 1.704 | 1.784 |
| n | 55 | 55 | 55 | 55 |
| Sample | mean | 33.160 | 33.340 | 33.760 | 34.190 |
| SD | 2.540 | 2.277 | 2.661 | 2.209 |
| n | 128 | 128 | 128 | 128 |
| Performance (m/min) | 14–15 years | mean | 816.510 | 804.790 | 817.030 | 816.990 |
| SD | 56.979 | 53.154 | 65.088 | 57.932 |
| n | 73 | 73 | 73 | 73 |
| 16–17 years | mean | 871.110 | 873.490 | 873.330 | 871.490 |
| SD | 48.392 | 47.008 | 46.900 | 47.824 |
| n | 55 | 55 | 55 | 55 |
| Sample | mean | 839.970 | 834.310 | 841.240 | 840.410 |
| SD | 59.772 | 60.885 | 64.198 | 60.074 |
| n | 128 | 128 | 128 | 128 |
| Performance (W/min) | 14–15 years | mean | 264.778 | 253.330 | 267.570 | 265.030 |
| SD | 53.643 | 50.838 | 62.866 | 56.505 |
| n | 72 | 72 | 72 | 72 |
| 16–17 years | mean | 319.264 | 323.950 | 321.870 | 319.020 |
| SD | 51.008 | 48.848 | 49.600 | 52.800 |
| n | 55 | 55 | 55 | 55 |
| Sample | mean | 288.374 | 283.910 | 291.090 | 288.410 |
| SD | 58.917 | 60.933 | 63.333 | 60.953 |
| n | 127 | 127 | 127 | 127 |
| Final pulse (bpm) | 14–15 years | mean | 180.080 | 182.790 | 183.370 | 179.110 |
| SD | 14.851 | 12.115 | 11.597 | 13.428 |
| n | 71 | 71 | 71 | 71 |
| 16–17 years | mean | 192.040 | 190.730 | 188.930 | 187.760 |
| SD | 8.419 | 8.962 | 6.480 | 6.131 |
| n | 55 | 55 | 55 | 55 |
| Sample | mean | 185.300 | 186.250 | 185.790 | 182.890 |
| SD | 13.768 | 11.511 | 10.056 | 11.652 |
| n | 126 | 126 | 126 | 126 |
| 3 min pulse (bpm) | 14–15 years | mean | 117.100 | 118.080 | 118.890 | 117.610 |
| SD | 13.879 | 12.059 | 9.770 | 12.300 |
| n | 71 | 71 | 71 | 71 |
| 16–17 years | mean | 115.400 | 115.760 | 115.150 | 113.350 |
| SD | 6.707 | 5.815 | 12.745 | 7.504 |
| n | 55 | 55 | 55 | 55 |
| Sample | mean | 116.360 | 117.070 | 117.250 | 115.750 |
| SD | 11.315 | 9.848 | 11.273 | 10.656 |
| n | 126 | 126 | 126 | 126 |
| Börg scale | 14–15 years | mean | 7.640 | 7.480 | 7.600 | 7.630 |
| SD | 0.806 | 0.852 | 0.812 | 0.791 |
| n | 73 | 73 | 73 | 73 |
| 16–17 years | mean | 7.890 | 7.740 | 7.430 | 7.300 |
| SD | 0.793 | 0.483 | 0.633 | 0.633 |
| n | 54 | 54 | 54 | 54 |
| Sample | mean | 7.750 | 7.590 | 7.530 | 7.490 |
| SD | 0.806 | 0.728 | 0.744 | 0.744 |
| n | 127 | 127 | 127 | 127 |
Table 2.
Within-subject effects from repeated-measures ANOVA with sphericity corrections. GG ε = Greenhouse-Geisser epsilon; bpm = beats per minute; ɳ2 = effect size; 1 − β = statistical power.
Table 2.
Within-subject effects from repeated-measures ANOVA with sphericity corrections. GG ε = Greenhouse-Geisser epsilon; bpm = beats per minute; ɳ2 = effect size; 1 − β = statistical power.
| | Sphericity Test | Huynh–Feldt Correction |
|---|
| Dependent Variable | p Mauchly | ε GG | F | p | ɳ2 | 1 − β |
|---|
| A. Intra-subject variable: condition (C1, C2, C3, C4) | Performance (strokes/min) | p < 0.001 | 0.915 | F(2.799) = 11.188 | p < 0.01 | 0.42 | 0.999 |
| Performance (m/min) | p < 0.001 | 0.898 | F(2.747) = 15.109 | p < 0.001 | 0.56 | 1 |
| Performance (W/min) | p < 0.001 | 0.836 | F(2.557) = 10.124 | p < 0.001 | 0.039 | 0.996 |
| Final heart rate (bpm) | p = 0.021 | 0.968 | F(2.966) = 5.200 | p = 0.002 | 0.2 | 0.924 |
| Heart rate 3 min post (bpm) | p = 0.369 | 0.987 | F(3.000) = 1.565 | p = 0.196 | 0.006 | 0.414 |
| Borg scale | p = 0.012 | 0.962 | F(2.947) = 6.584 | p < 0.001 | 0.026 | 0.971 |
| B. Intra-subject variable: condition (C1, C2, C3, C4) x Inter-subject variable: category (14–15 years, 16–17 years, whole sample) | Dependent variable | p Mauchly | ε GG | F | p | ɳ2 | 1−β |
| Performance (strokes/min) | p < 0.001 | 0.915 | F(5.597) = 0.546 | p = 0.761 | 0.004 | 0.214 |
| Performance (m/min) | p < 0.001 | 0.898 | F(5.494) = 5.982 | p < 0.001 | 0.045 | 0.997 |
| Performance (W/min) | p < 0.001 | 0.836 | F(5.114) = 6.679 | p < 0.001 | 0.051 | 0.998 |
| Final heart rate (bpm) | p = 0.021 | 0.968 | F(5.932) = 1.143 | p = 0.335 | 0.009 | 0.452 |
| Heart rate 3 min post (bpm) | p = 0.369 | 0.987 | F(6.000) = 0.311 | p = 0.931 | 0.002 | 0.4138 |
| Borg scale | p = 0.012 | 0.962 | F(5.894) = 2.556 | p = 0.019 | 0.02 | 0.844 |
| Disclaimer/Publisher’s Note: The statements, opinions and data contained in all publications are solely those of the individual author(s) and contributor(s) and not of MDPI and/or the editor(s). MDPI and/or the editor(s) disclaim responsibility for any injury to people or property resulting from any ideas, methods, instructions or products referred to in the content. |





 ,
,