Abstract
During coal mining, detecting subsurface structures (such as faults, voids, collapse columns, etc.) using radio waves in existing mines is hindered by the absence of effective three-dimensional coal seam medium models and simulation methods, adversely affecting the forward modeling of data analysis. This study establishes a Three-Dimensional Finite-Difference Time-Domain (3D-FDTD) radio wave penetration medium model based on coal seam tunnel penetration working conditions to simulate the electric field intensity characteristics of longitudinal and transverse waves in various coal rock mediums. Firstly, a higher-order finite difference method based on Maxwell’s equations is employed to analyze the electric field characteristics of gas-enriched areas under various geological conditions, enabling the exploration of the relationship between the position and size of the electromagnetic wave field strength in different areas. The electromagnetic wave field strength response data are then analyzed during the actual detection process to determine the specific location, shape, and size of the abnormal area. Finally, by comparing the simulation results with an actual engineering project, electromagnetic wave field strength attenuation data were collected from 158 measuring points at a working face of a coal mine in Anhui. The detection results clearly illustrate the changes in electric field intensity (with attenuation coefficients ranging from 0.41 to 0.77 dB/m) in anomalous areas, enabling the forward simulation to accurately determine the position and size of faults. The novelty of this study lies in the establishment of a conductivity-weighted 3D-FDTD model specifically calibrated for complex coal seam environments, which significantly improves the accuracy of fault boundary detection compared to traditional linear inversion methods.
1. Introduction
In China’s coal mining industry, gas accidents pose a pervasive risk, causing many of the most severe casualties and economic losses. Gas disasters remain a leading hazard to coal mine safety. Coal and gas outbursts primarily result from geological structures, coal seam conditions, gas-enriched zones, and areas of stress concentration [1]. Therefore, identifying the size and location of gas-enriched zones early is crucial to preventing gas disasters. In a broader context, electromagnetic technologies—ranging from geological forward prospecting to post-collapse rescue using ultra-wideband radar. Ref. [2]—constitute the technological backbone of modern coal mine safety systems.
Currently, China’s coal mining industry uses pit penetration detection technology, followed by drilling to verify anomalies identified through geophysical exploration [3]. Tang et al. have explored prerequisites for internal gas outburst detection, while Xu studied electromagnetic wave field characteristics relevant to coal and gas outburst potential [4,5,6]. These studies demonstrate that radio wave penetration technology effectively predicts anomalies in coal mines, and recent engineering investigations further confirm its applicability in complex coal seam environments [7]. The 3D-FDTD method has been extensively applied to simulate electromagnetic propagation in various non-homogeneous media. For instance, Fan et al. utilized multiphase heterogeneous models to detect internal cracks in asphalt pavement, while Choroszucho et al. analyzed wave propagation in complex brick structures. However, compared to these shallow or ground-surface applications, coal seam environments present unique challenges, including higher conductivity contrast, significant signal attenuation, and complex waveguide effects within mining tunnels. Recent investigations into electromagnetic wave attenuation in stratified coal-rock media have further quantified these complex propagation mechanisms [8], underscoring the necessity for specialized modeling approaches. Therefore, the original contribution of this study is the specific adaptation of the 3D-FDTD model to the high-attenuation geological conditions of deep coal mines, utilizing conductivity-weighted parameters to accurately characterize subsurface anomalies. This paper uses forward simulation to study electromagnetic wave field strengths in anomalous coal mine regions [9]. The goal is to enhance precision in identifying geological defects—such as gas-enriched zones, karst collapse columns, and watery zones—to improve coal mine safety [10,11]. This research adapts the established Three-Dimensional Finite-Difference Time-Domain (3D-FDTD) method specifically for the forward simulation of mine radio wave penetration, incorporating conductivity-weighted parameters to address the complex heterogeneity of coal seams.
Accurate field data acquisition is critical for evaluating electromagnetic wave behavior in geotechnical environments. Related studies on shock wave energy distribution [12] highlight the importance of instrumentation configuration and wave propagation characteristics under high-stress conditions.
2. Methodology
The principle of radio wave penetration quantifies electromagnetic interactions in coal seams via attenuation equations. Field data acquisition is conducted using the WKT-E instrument, whose multi-frequency operation is validated in mining environments. Finally, the 3D-FDTD method simulates wave propagation via Yee-grid discretization, connecting theoretical predictions with empirical measurements to reliably identify anomalies.
2.1. Radio Wave Penetration Principle
Radio wave penetration identifies geological anomalies among coal seams, coal tunnels, and drilling holes [13,14]. The absorption of electromagnetic wave energy in underground coal mines varies significantly due to differences in the electrical parameters of the ore. Refraction and reflection of electromagnetic waves in faults and karst collapse columns lead to significant energy loss at the reception point [15,16]. Consequently, electromagnetic wave energy is absorbed or shielded within watery zones, karst collapse columns, or faults in the mining area [17]. Penetration is conducted between two tunnels or two drilling holes along the coal seam. In an approximately uniform and isotropic coal mine, the distance from the observation point to the midpoint of the radiation source is denoted as r. The electric field strength at the point is given by
where is the absorption coefficient of electromagnetic waves in coal seams, and is the directional factor, representing the angle between the dipole axis and the direction of the observation point. The formula is
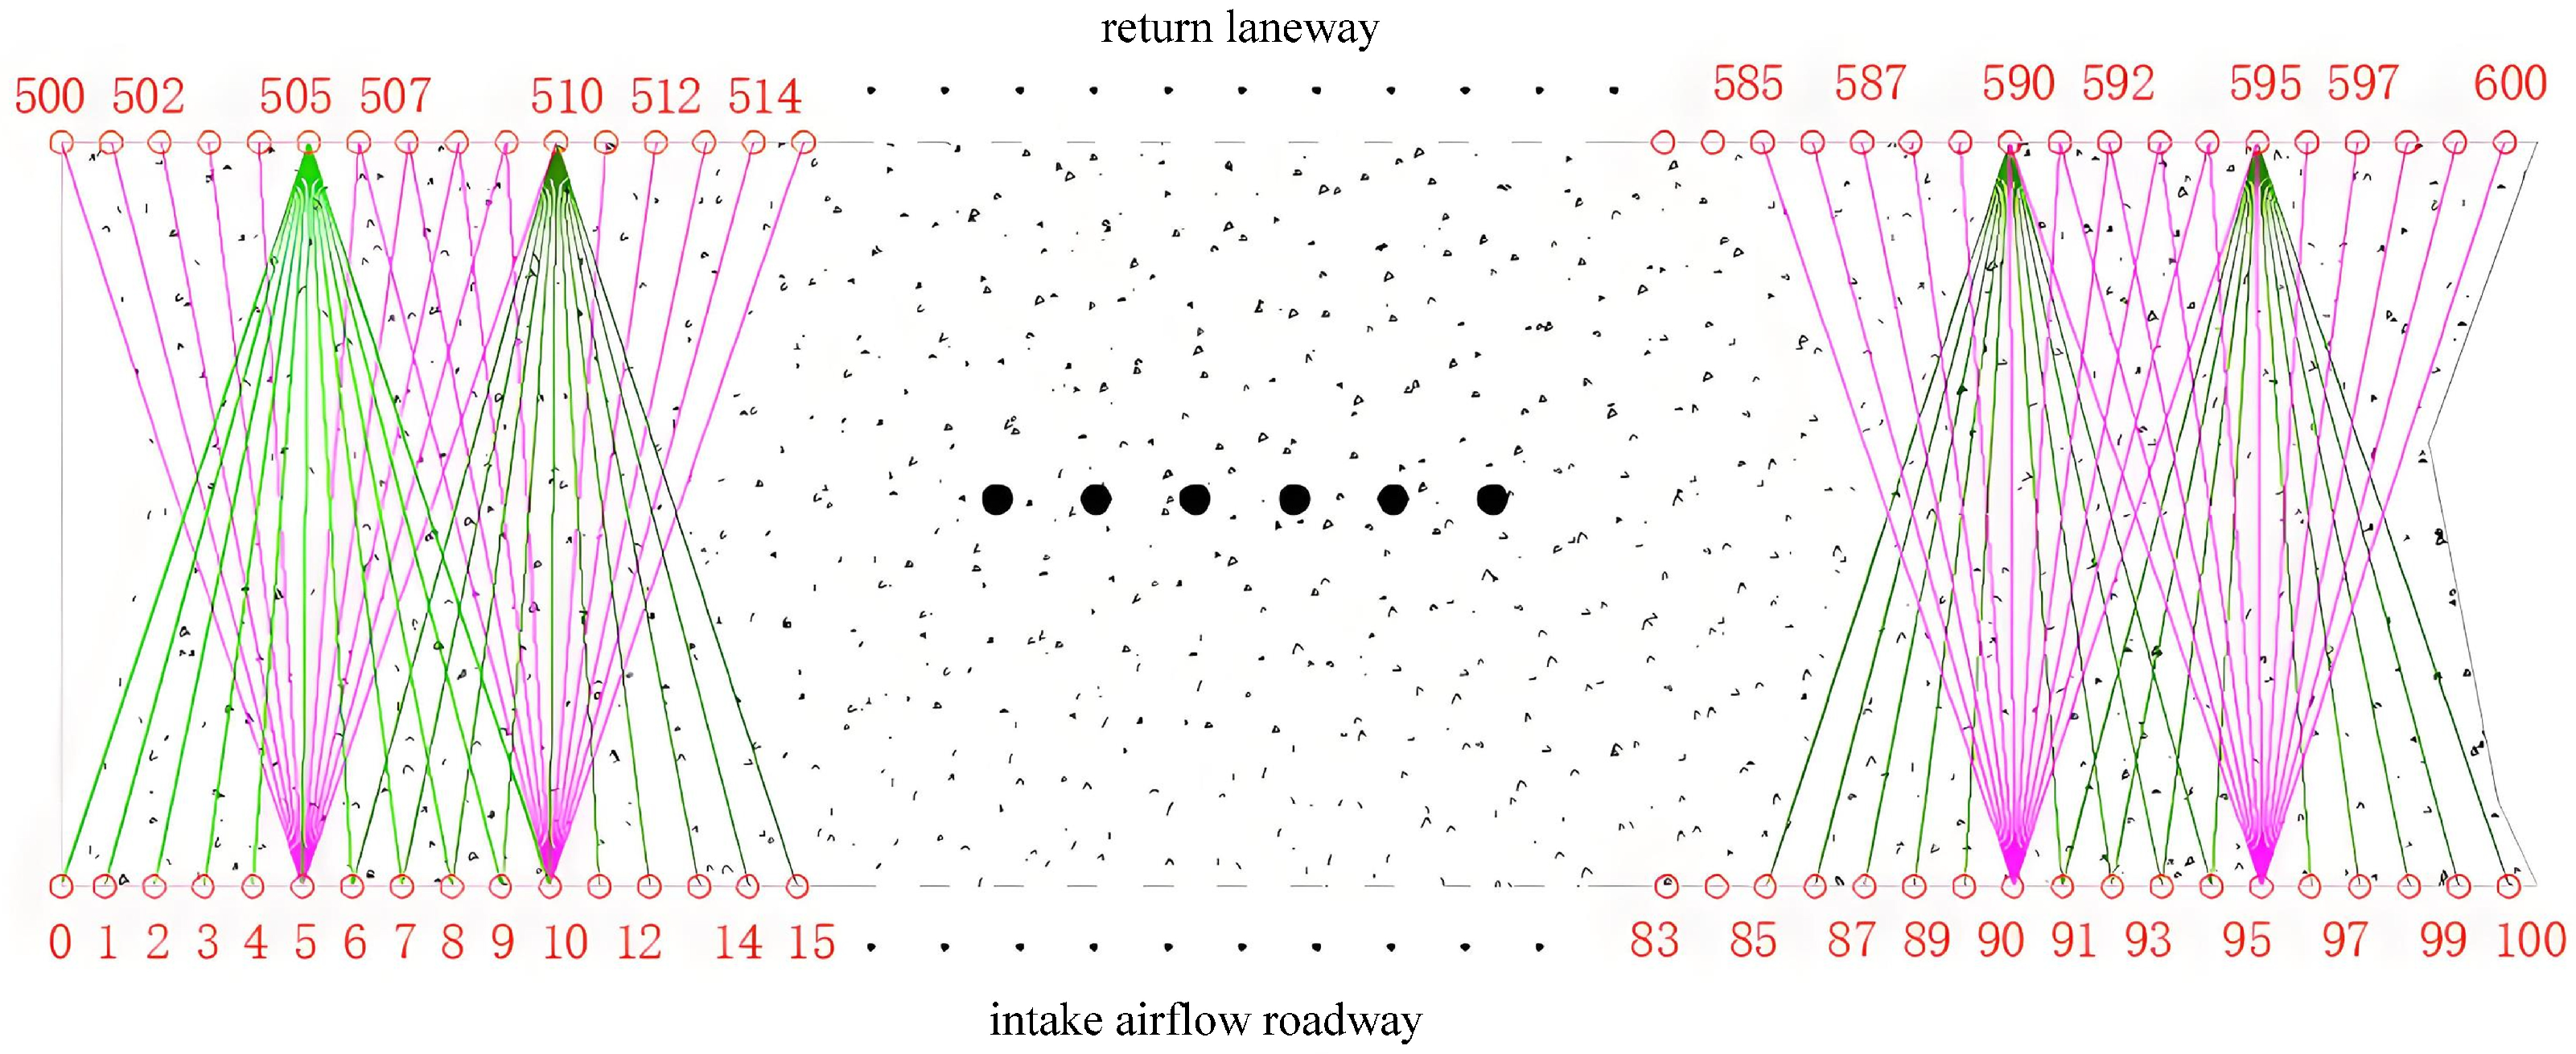
The resistivity of the coal seam directly influences the absorption coefficient, electromagnetic wave frequency, and other electronic parameters. In a uniform coal seam, increasing the electromagnetic wave frequency leads to a higher absorption coefficient and a shorter penetration distance. Conversely, decreasing resistivity results in a higher absorption coefficient and greater penetration distance [18,19]. In practice, the pit-through instrument’s observation methods are classified into two main categories: synchronous and fixed-point. The synchronous method (one-to-one) involves simultaneous movement of both transmitter and receiver, recording field strength values at each measurement point. In the fixed-point method (one-to-many), the transmitter remains fixed while the receiver measures field strength point by point within a certain range (see Figure 1) [20].
Figure 1.
Schematic diagram of fixed point method observation.
While the initial wave propagation analysis (Equations (1) and (2)) assumes a uniform and isotropic medium, actual coal measures often exhibit layered heterogeneities, especially with mudstone or shale interbeds [21]. These structures introduce electrical conductivity anisotropy, particularly in the vertical direction. To better capture such anisotropic behaviors, we recommend adopting transverse isotropic (TI) parameterization where conductivity is direction-dependent:
where is conductivity in the direction parallel to the bedding, and is conductivity in the direction perpendicular to the bedding [22].
This distinction is critical for accurate modeling of electromagnetic attenuation and wavefront distortion in coal seams with interlayered mudstone, as supported by studies. In future work, we aim to incorporate anisotropic electrical parameters derived from borehole resistivity logs to enhance model fidelity in layered coal geology [23].
2.2. Comparative Evaluation Against Other Geophysical Methods
To contextualize the advantages of 3D-FDTD modeling in coal seam detection, Table 1 benchmarks key performance metrics against mainstream subsurface imaging technologies.
Table 1.
Comparative Evaluation of Geophysical Methods for Coal Seam Applications.
This comparative analysis reveals the distinct niche advantage of 3D-FDTD modeling for tunnel-proximate geological detection. By leveraging unique waveguide effects in confined mining spaces, 3D-FDTD achieves decimeter-scale resolution near tunnel boundaries—exemplified by its successful identification of a 0.8 m fault in the 1034 working face. Surface-based methods like TEM/ERT fundamentally cannot replicate this capability, as they fail to capture the electromagnetic wave confinement phenomenon intrinsic to tunnel geometries. This wavefield confinement mechanism enables precise imaging within 1 m of excavations.
Tradeoffs in field deployment further contextualize its applicability. While GPR outperforms in shallow-resolution scenarios (<30 m depth), its utility diminishes severely in conductive environments like wet coal seams, where signal attenuation exceeds 100 dB/m. Conversely, 3D-FDTD maintains robust performance (<15% error) in such challenging strata through conductivity-weighted modeling (Equation (7)), effectively compensating for formation-induced signal loss. This adaptive capability positions 3D-FDTD as the optimal solution for deep, complex coal seam exploration where conventional methods encounter physical limitations.
2.3. Radio Wave Penetration Instrument
This study employs the intrinsically safe WKT-E radio wave penetration instrument, developed by CCTEG Chongqing Research Institute. The device is designed for underground coal mine exploration and meets the safety and functional requirements of field deployment. It offers long-range signal transmission, stable multi-frequency operation, and enhanced receiver sensitivity, making it one of the most advanced geophysical instruments currently available for detecting subsurface anomalies in complex mining environments [29,30].
The WKT-E system comprises an antenna, transmitter, receiver, data processor, and integrated software platform. Its second-generation model improves upon earlier designs by incorporating a digital display, extended battery life, and stronger resistance to electromagnetic interference. The main technical specifications are summarized in Table 2 [31], including detection ranges of 100–500 m, operating frequencies of 0.30 MHz, 0.50 MHz, and 1.50 MHz, and a receiving sensitivity below 0.05 μV/m.
Table 2.
The main technical parameters of the WKT-E radio wave penetration Instrument.
To evaluate frequency selection and instrument robustness, we conducted a series of controlled tests using the WKT-E instrument at 0.3 MHz, 0.5 MHz, and 1.5 MHz. The 0.3 MHz configuration was selected as optimal, balancing penetration depth (>6 m) and resolution (0.3–0.5 m). Lower frequencies showed excessive attenuation, while higher frequencies exhibited reduced signal-to-noise ratios. Additional experiments exposed the receiver to varying levels of industrial electromagnetic noise (0.1–5 mV/m). The results revealed a nonlinear signal degradation, with losses exceeding 20% when EMI levels surpassed 2 mV/m in the 0.5 MHz band. These findings contribute to future calibration curve development and adaptive noise filtering strategies.
Despite its performance advantages, the WKT-E faces challenges in high-noise, structurally complex environments. Electromagnetic interference from equipment such as conveyor motors and high-voltage lines degrades signal clarity. Geological features—such as mudstone interlayers and high-angle faults—further introduce attenuation and scattering effects. Moreover, field constraints including antenna misalignment and power fluctuations can reduce positioning accuracy.
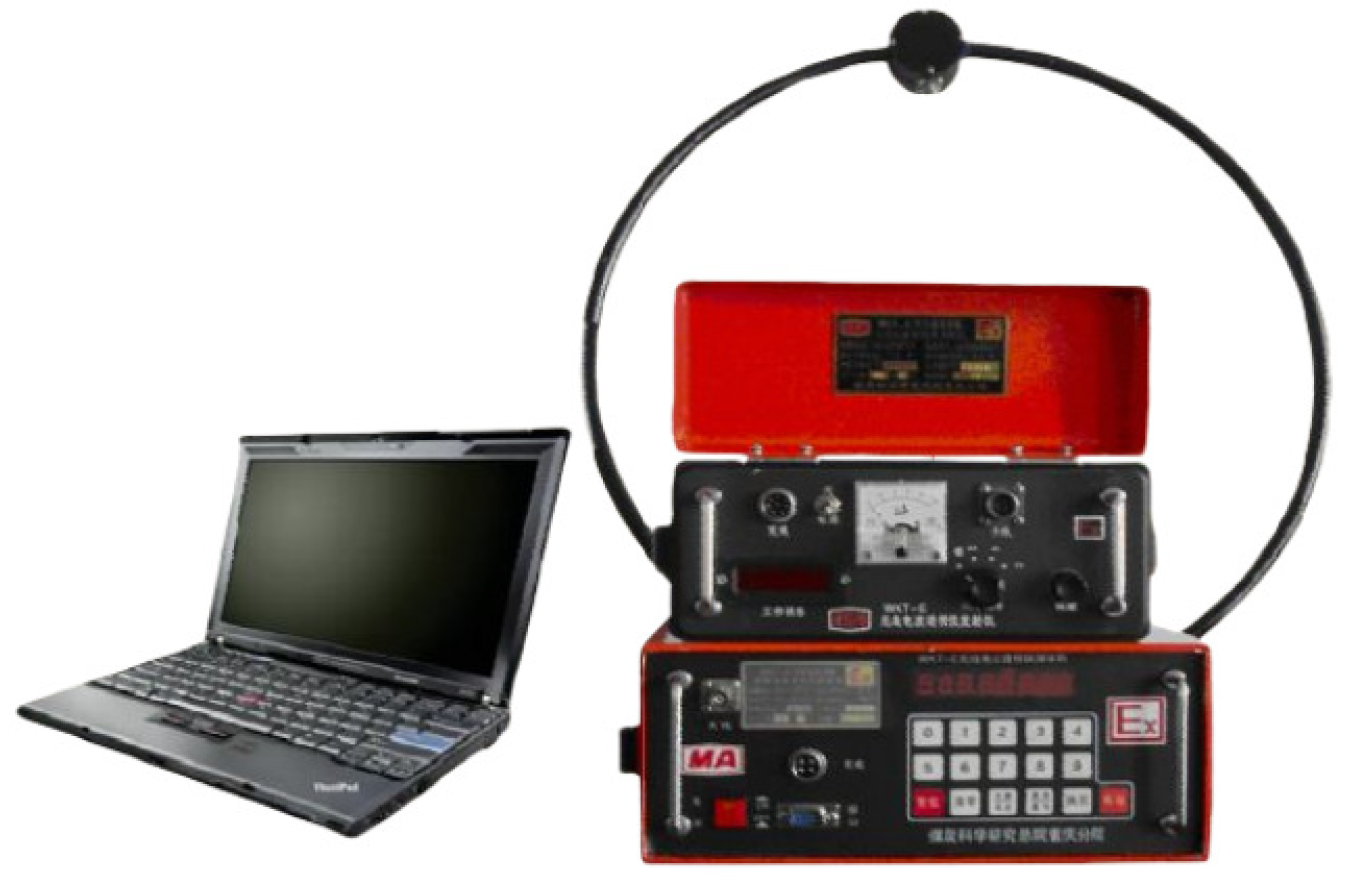
Figure 2.
WKT-E radio wave penetration instrument (first-generation).
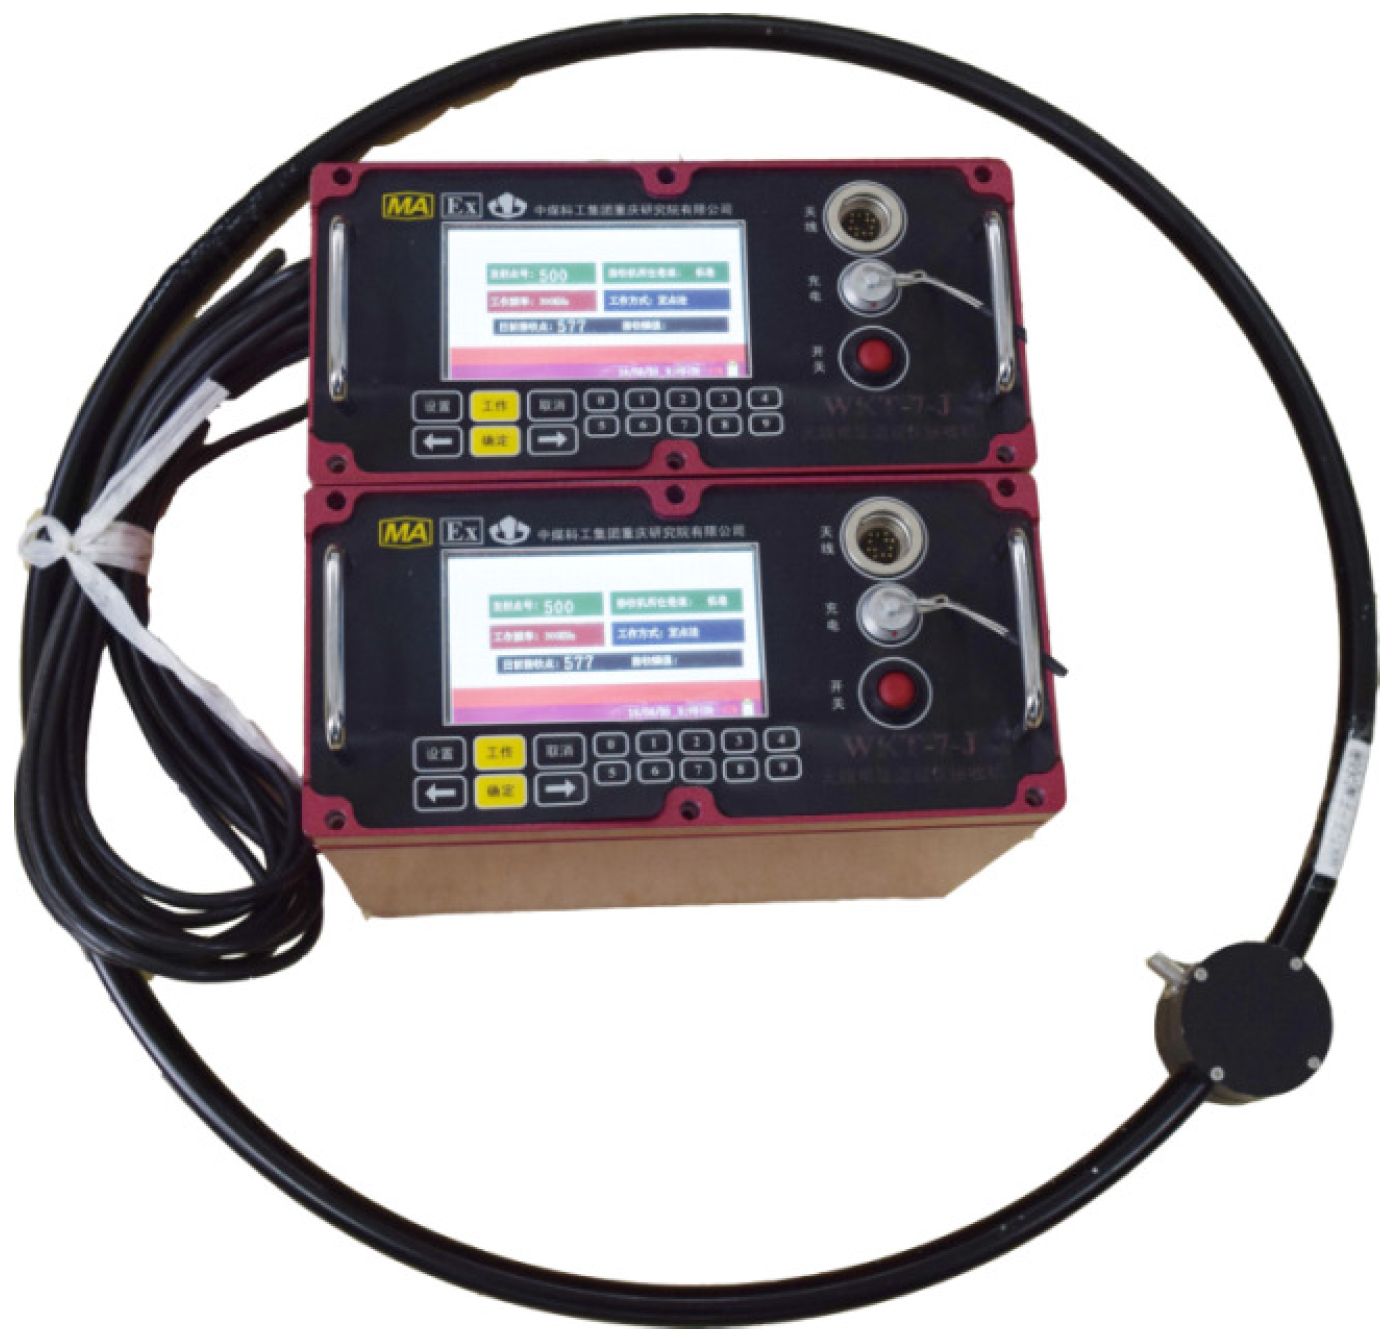
Figure 3.
WKT-E radio wave penetration instrument (second-generation).
Field Measurement and Data Processing
The field measurement was conducted on the 1034 working face using a WKT-E receiver and a low-frequency electromagnetic transmitter. A total of 158 measurement points were arranged in a regular grid pattern with 5 m spacing, covering the entire propagation area. The same calibrated WKT-E device was used throughout all measurement campaigns to ensure consistency. The signal was sampled at 2 MHz and preprocessed using a 4th-order Butterworth low-pass filter with a cutoff frequency of 300 kHz to suppress high-frequency noise. Signal amplitudes were extracted based on peak-to-peak voltage and converted to dB field strength using the instrument’s built-in calibration curve.
To ensure the reproducibility and transparency of field validation, a standardized data processing pipeline was applied to raw measurement data collected by the WKT-E device at 158 locations on the 1034 working face. The procedure includes the following steps (see Figure 4):
Figure 4.
Data processing workflow for field measurements.
3. Case Study Overview and Geological Settings
To validate the effectiveness of the proposed 3D-FDTD simulation method in realistic mining environments, field experiments were conducted at two distinct coal mine working faces with differing geological characteristics: the 1034 working face in Anhui Province and the 182,406 working face in Hebei Province.
3.1. The 1034 Working Face (Anhui Province)
The 1034 working face is located in the deeper part of the No. 3 mining area of a coal mine in Anhui Province. Based on 3D seismic data from nearby roadway surveys, numerous large and medium-sized normal faults surround the working face. These faults may lead to the development of secondary structures within the construction section, resulting in fractured lithology and variations in coal seam thickness and structure.
Geologically, the working face consists of coal-bearing strata from the Shanxi Formation of the Lower Permian (). The upper boundary is an aluminous rock floor, and the lower boundary is the top of the Taiyuan Formation limestone. The stratum thickness ranges from 70.54 to 105.82 m, with an average thickness of 90.15 m. The lithology consists of interbedded sandstone, sandy mudstone, siltstone, mudstone, and coal, specifically including two coal seams, No. 10 and No. 11, with coal seam No. 10 serving as the primary mining seam. The geological structure of the working face dips toward the northeast, with a dip angle ranging from 5° to 18°.
3.2. The 182,406 Working Face (Hebei Province)
The 182,406 working face is located on the second level of the northern fourth mining area of a coal mine in Hebei Province. It is characterized by a north-south strike and an eastward-dipping monocline structure, presenting stable coal seams and a relatively simple geological configuration.
The coal seam thickness is relatively uniform, averaging 4.0 m, with a steep dip angle of approximately 29°. The coal is anthracite with high hardness. Four faults with small separations have developed in the area, with displacements ranging from 0.5 to 1 m, predominantly following a north-south trend. The roof and floor are primarily composed of fine sandstone and siltstone, with the main roof measuring 12 m thick and featuring well-developed joints and fractures. The false roof consists of a 0.3-m-thick carbonaceous shale. Hydrogeological analysis indicates that the working face is largely unaffected by borehole water, surface water, or fault water during extraction; however, as the roof collapses, water inflow from the sandstone roof is expected, with a normal rate of and a maximum rate of .
4. Three-Dimensional Finite-Difference Time-Domain Method
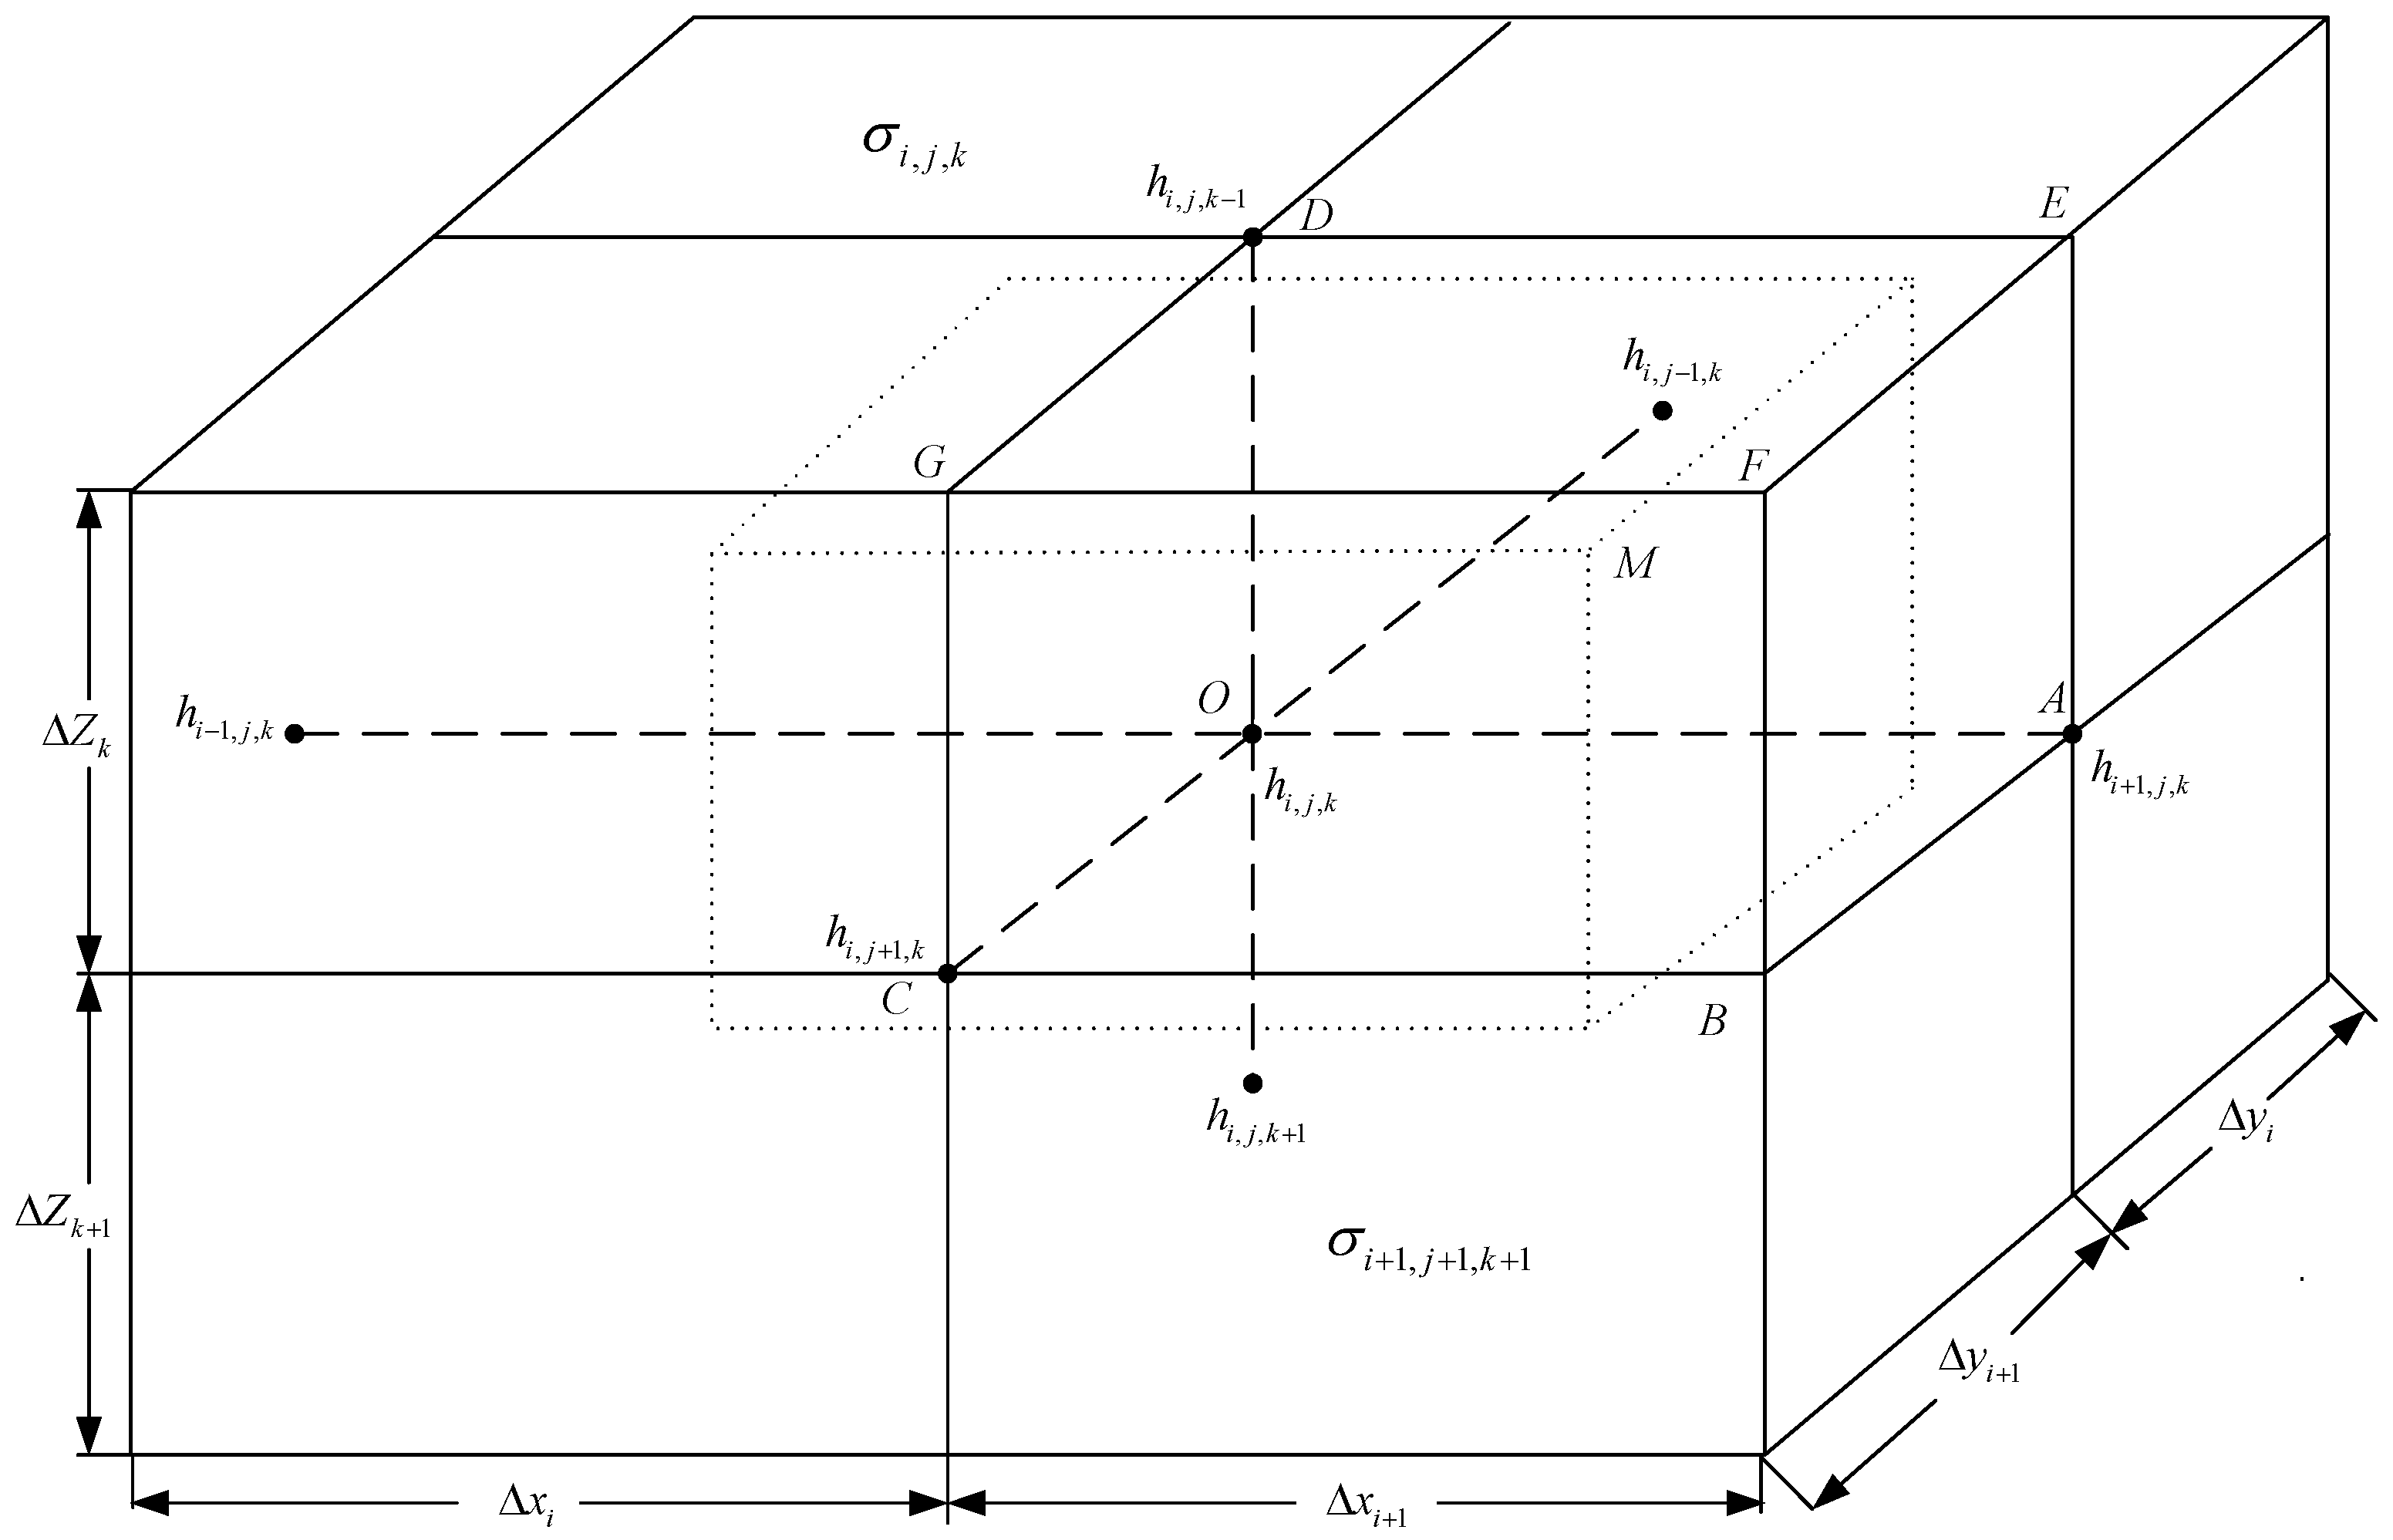
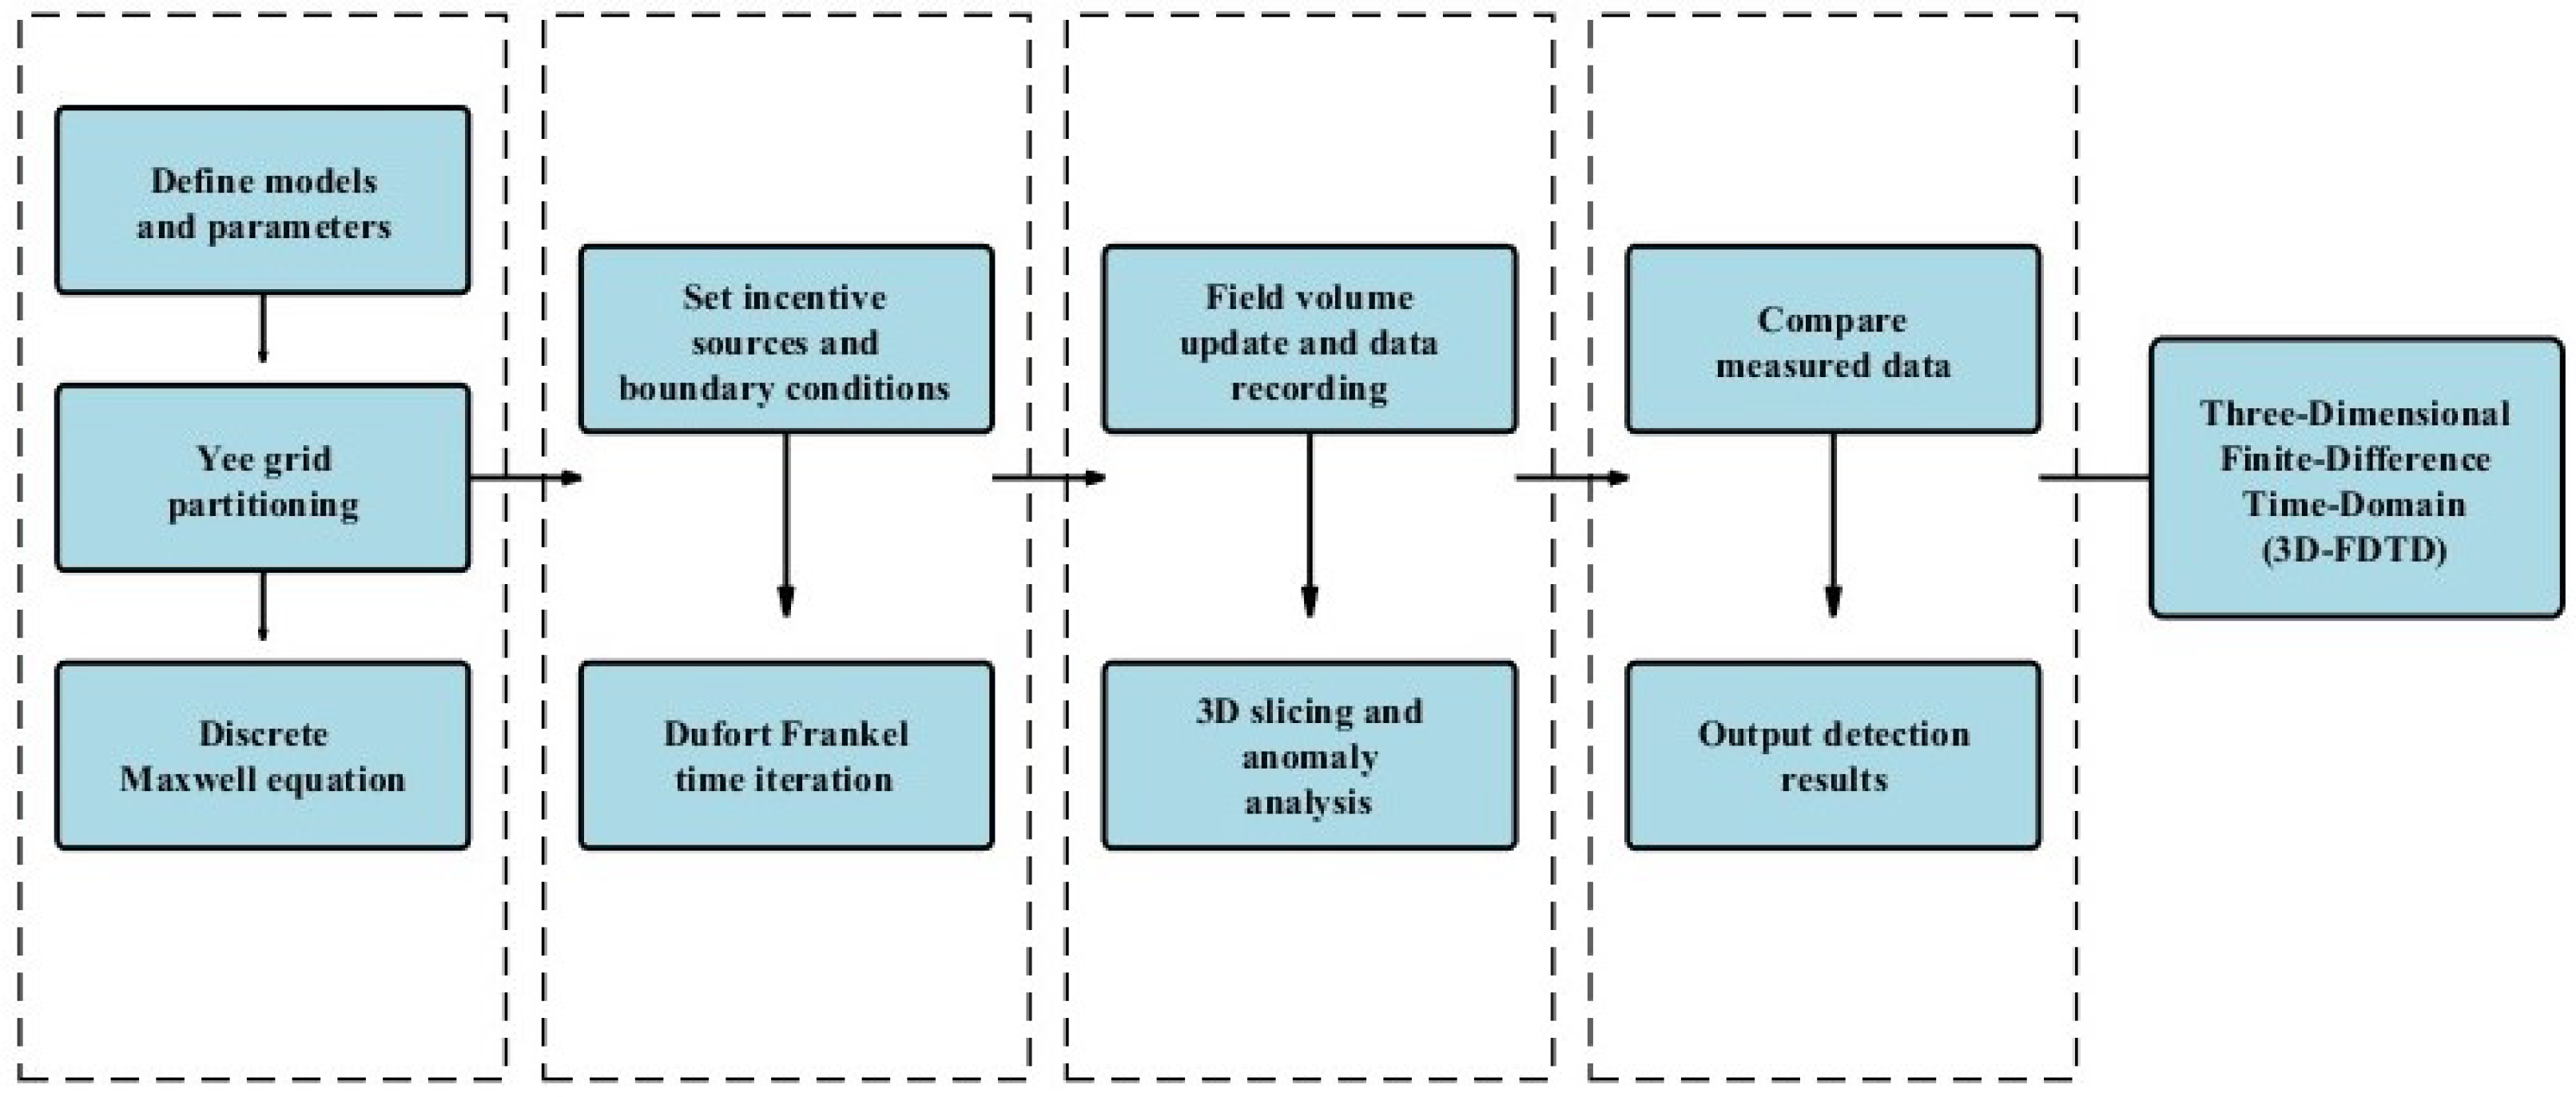
In 1966, Kane Yee proposed the finite-difference time-domain (FDTD) method to solve electromagnetic wave conduction problems [32]. Recent studies in underground coal mine exploration have demonstrated that combining electromagnetic detection techniques with numerical modeling significantly improves the interpretation of complex geological anomalies, especially for directional detection and fault characterization [7,33]. The fundamental principle of the method involves discretizing Maxwell’s equations and applying the central difference scheme with third-order accuracy to approximate the curl differential operators in difference form. The Yee grid divides discrete units, enabling integration and calculation of continuous electromagnetic fields over small volumes and time intervals, thus facilitating the numerical simulation of electromagnetic field problems [34,35]. The node model of the FDTD mesh is shown in Figure 5 [36], and the operational flow of the 3D-FDTD method is illustrated in Figure 6.
Figure 5.
Typical node model diagram of FDTD mesh.
Figure 6.
3D-FDTD principle flow chart.
To suppress artificial boundary reflections, a perfectly matched layer (PML) was implemented on all six boundaries of the computational domain. The PML region consisted of 10 grid layers with a second-order polynomial grading profile applied to the electrical conductivity to ensure smooth attenuation. Verification tests demonstrated that the PML effectively reduced boundary reflections below 40 dB, confirming its suitability for electromagnetic wave absorption in this setting. The spatial grid resolution was set as △x = △y = △z = 0.05 m, and the time step was chosen as △t = 0.09 ns. These values satisfy the Courant–Friedrichs–Lewy (CFL) stability condition for 3D FDTD schemes. The simulation employs an explicit central difference scheme with second-order accuracy in both space and time. The computational domain is discretized using a Yee grid with a uniform spatial step size of m. The time step is set to ns, strictly satisfying the Courant–Friedrichs–Lewy (CFL) stability condition.
where c is the speed of light in vacuum. With the above settings, the calculated Courant number is approximately 0.54, ensuring numerical stability throughout the simulation.
The following presents the calculation formulas for the central field strength and the field strength at each node, using the Dufort–Frankel [37] time-stepping method after discretizing the nodes [38,39]. The finite-difference calculation equation is
Integrating both sides of the finite-difference equation within yields the following result:
Calculate the above formula based on Gaussian formula:
where , and are the front faces of the curved surface where is secant to each direction axis, respectively; , and are the opposite faces of the curved surface where is secant to each direction axis, respectively; represents the conductivity of the medium; is the conductivity of the anomalous body; is the magnetic flux density vector; , are the magnetic field strength [40,41]. Once the integration results for each integral have been obtained, an area-weighted average calculation should be performed in order to obtain the following result:
is the node Area weighted average of surrounding conductivity [42,43,44]:
where denote the coordinates in the x, y and z directions respectively; is the area weighted value of the conductivity around node . Similarly, by changing the subscript, the area weighted values of different nodes can be obtained; is the grid distance on the x-axis, is the grid distance on the y-axis, is the grid distance on the z-axis [45].
Finally, the time linear interpolation algorithm was employed to derive the calculation formulas for the centre field strength and the field strength of each node, utilising the Dufort Frankel time step method after the nodes were discretised [46,47,48,49]. The derived formulas are as follows:
where n represents the current time, n + 1 represents the next time step, i + 1 represents node one unit further along the positive x-axis mathematically, i − 1 represents node one unit back along the negative x-axis, j + 1 represents node one unit further along the positive y-axis, j − 1 represents node one unit back along the negative y-axis, k + 1 represents node one unit further along the positive z-axis, k − 1 represents nodeone unit back along the negative z-axis. is the diffusion equation of the field strength of the central node in the magnetic field at time of the total detectable area [50]. The grid average degree formula in the x, y, z directions is as follows.
where is the grid degree in the x-axis direction; is the grid degree in the y-axis direction; is the grid degree in the z-axis direction; represents the area-weighted average conductivity of the surroundings of node ; represents the turn-off current function; S is the area of the bilateral closed curved surface at the node; and represents the magnetic permeability of the medium. The above-discretized formulas can be analyzed and discussed node by node using the fixed point method after grid discretization.
The idea of local subdivision grid is used to find the relationship between time step and grid to obtain the time region of stable monitoring [51]. The time interpolation formula is expressed as
where , ; h is the internal strength of the local grid that does not coincide with the grid in the whole region; H is the strength in the grid that coincides with the local grid and in the whole region grid; v is the time step; and m is the number of subdivided grids. This can be represented using spatial interpolation:
Using Euler’s method, calculate the difference equation after Euler transformation:
where , let
The time derivative can be approximated using central differencing as follows:
After the difference approximation, the new difference equation is obtained as follows:
where , r is the differential grid degree; is the area-weighted average conductivity of the surroundings of node ; represents the conductivity of the medium, is the magnetic permeability of the medium; n represents the current time, and represents the next time step.
Because the stability condition of Euler method is , is always satisfied in the above difference equation, so the first half is satisfied and is obtained, where is the maximum grid degree.
Based on the Laplace equation satisfied within the roadway, the volume integral for the entire mine roadway space is calculated integral of the whole mine roadway space, the use of time linear interpolation for the final finishing, that is, you can get the corresponding required equations of the controllable boundaries in the mine roadway. According to the Laplace equation for integration [52], the Laplace equation satisfied in the mine roadway is , using the finite difference method, the integral in shown in the interior of the cavity roadway is solved, and the, obtained as follows:
Using the time linear interpolation and the Eulerian algorithm to validate the above improved algorithm, it can be seen that the difference equation at the current moment after the Eulerian transformation is
The corresponding required equations when applying the finite difference equations in the mine tunnel are then obtained as
Model Adaptations for Coal Seam Environments
To address the unique electromagnetic challenges in coal seams, this study implements critical refinements to the classical FDTD framework. The conductivity-weighted Dufort–Frankel time-stepping scheme dynamically averages adjacent node conductivities using the volume-based approach detailed in Equation (7), effectively stabilizing simulations across abrupt coal-rock interfaces where significant property transitions occur. Mine-specific boundary conditions derived through Laplace-integrated constraints (Equation (20)) accurately capture waveguide effects in confined tunnel geometries, enabling precise modeling of wave diffraction patterns validated through comprehensive field measurements. Complementing this, multi-planar 3D slice visualization quantifies anomaly geometry and depth distributions, resolving critical structural features as demonstrated in comparative studies. Furthermore, stratified coal-rock parameterization incorporates anisotropic dielectric properties based on geological logging data from the 1034 (Anhui) and 182,406 (Hebei) working faces, dynamically adjusting electromagnetic responses at heterogeneous interfaces to reflect realistic layer transitions, which significantly enhances the clarity of boundary imaging for geological anomalies such as faults and collapse columns [21,53]. These adaptations collectively enhance simulation fidelity for coal seam penetration scenarios, with validation cases confirming substantial improvements in resolving geological anomalies compared to conventional approaches. Computational Efficiency: All simulations were performed on a workstation equipped with an [Intel Core i7-12700K CPU and 64 GB RAM]. The average computation time for a single 3D model (grid size ) was approximately [4.5 h]. Due to the high computational demand, the current implementation is designed for offline post-processing and analysis rather than real-time monitoring.
5. Simulation
5.1. Simulation Model Parameters
The resistivity of the surrounding rock in the tunnel is set to , and the electromagnetic wave frequency for penetration analysis is established. The conductivity of the coal seam ranges from , and the relevant dielectric parameters are listed in Table 3 [54].
Table 3.
Coal seam situation of the working face.
To verify the robustness of the simulation, a sensitivity analysis was conducted. Quantitative sensitivity analysis revealed that varying the coal conductivity by resulted in a maximum field strength deviation of only 1.2 dB, while mesh density variations ( from 0.05 m to 0.025 m) altered peak amplitudes by less than 0.5%. These results confirm the model’s robustness against moderate parameter perturbations.
In terms of computational efficiency, all simulations were performed on a workstation equipped with an Intel Core i7-12700K CPU and 64 GB RAM. The average computation time for a single 3D model (grid size ) was approximately 4.5 h. Due to the high computational demand, the current implementation is designed for offline post-processing and analysis rather than real-time monitoring.
5.2. Analysis of Different Size Fault Model
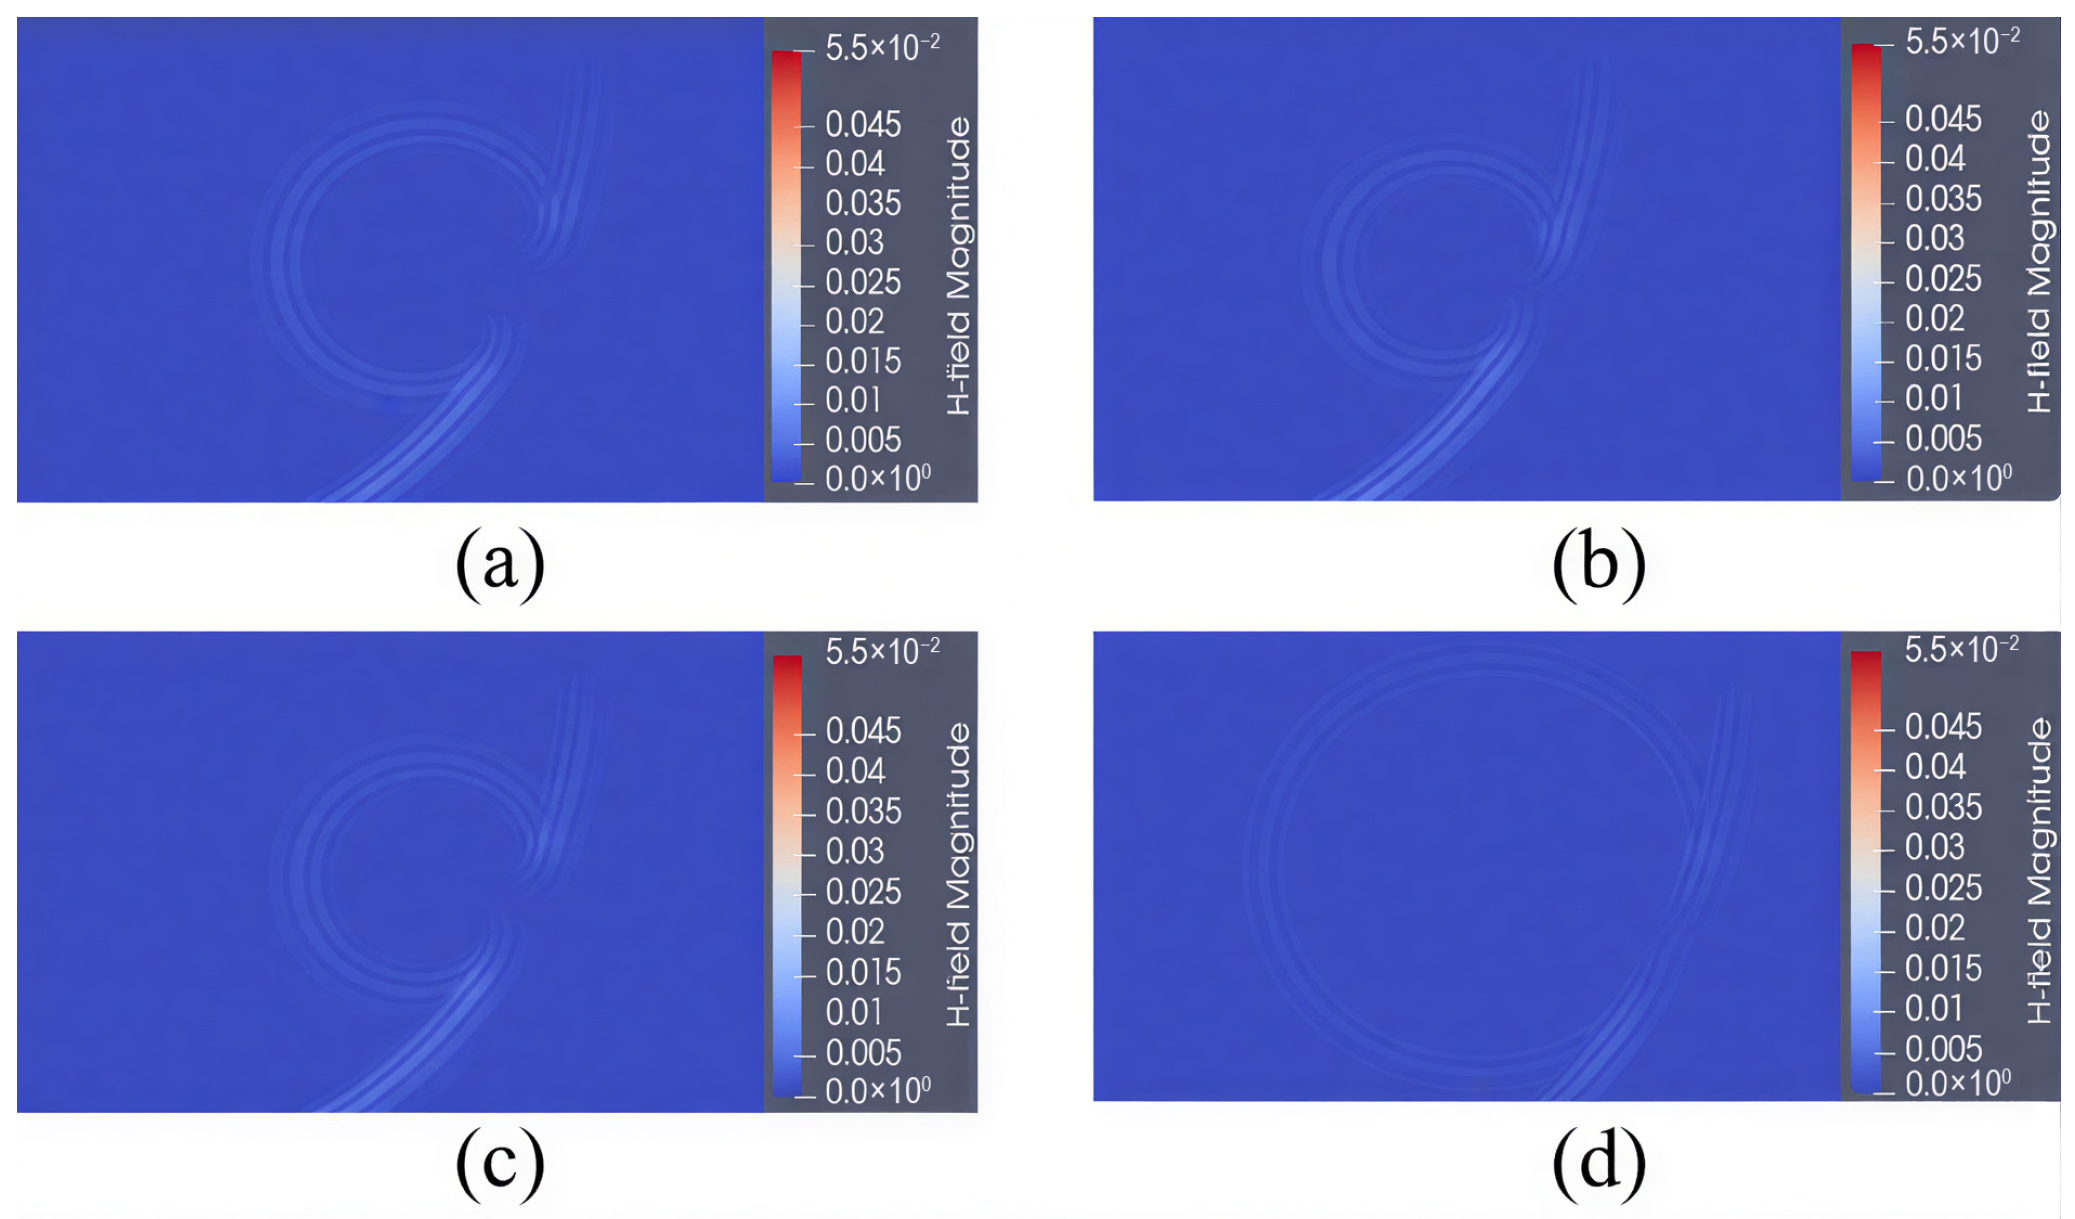
The simulation environment measures 1.6 m in length and 1.2 m in width, constructed from soil with a dielectric constant of 6 and a conductivity of 0.01 S/m. The charged rectangular fault measures 0.3 m in length and 0.2 m in width, with a dielectric constant of 1 and a conductivity of 0 S/m. It is modeled as free_space in gprMax. The grid step size is x = y = 0.01 m, with a time window of 34 ns. A Ricker wave source is selected, with the antenna center frequency set at 400 MHz [55]. The initial position of the transmitting antenna is (0.2, 1.0), and that of the receiving antenna is (0.3, 1.0). The antenna spacing is 0.1 m, with a step size of 0.01 m. Two models, designated as Model A and Model B, are configured with fault shapes approximated as small cylindrical bodies, having radii of 0.12 m, 0.15 m, 0.18 m, and 0.2 m, respectively. Figure 7 displays the electric field intensity visualizations for different fault radii.
Figure 7.
Visualization of wave field intensity of faults of different sizes at 6 s, with radii of 0.2 m (a), 0.12 m (b), 0.15 m (c), and 0.18 m (d).
According to the Huygens–Fresnel principle [38], when electromagnetic waves propagate through space, each point upon contacting an object can be considered a secondary wave source. The waves emitted by these secondary sources interfere with one another, forming the final electric field distribution. A larger target produces more secondary wave sources. The interference among secondary sources causes the resulting electric field to occupy a wider spatial area. A larger scattering cross section offsets the influence of the distance between wave sources, resulting in a relatively strong electric field intensity distribution [56]. The field strength corresponding to objects of different radii is analyzed. As the fault radius increases, its boundary becomes clearer in the transmission field imaging. During actual exploration, the larger the area of the fault or goaf, the clearer the detected geological anomaly. One of the current challenges in geological anomaly identification is distinguishing small anomalous structures.
5.3. Analysis of Fault Models with Different Inclination Angles
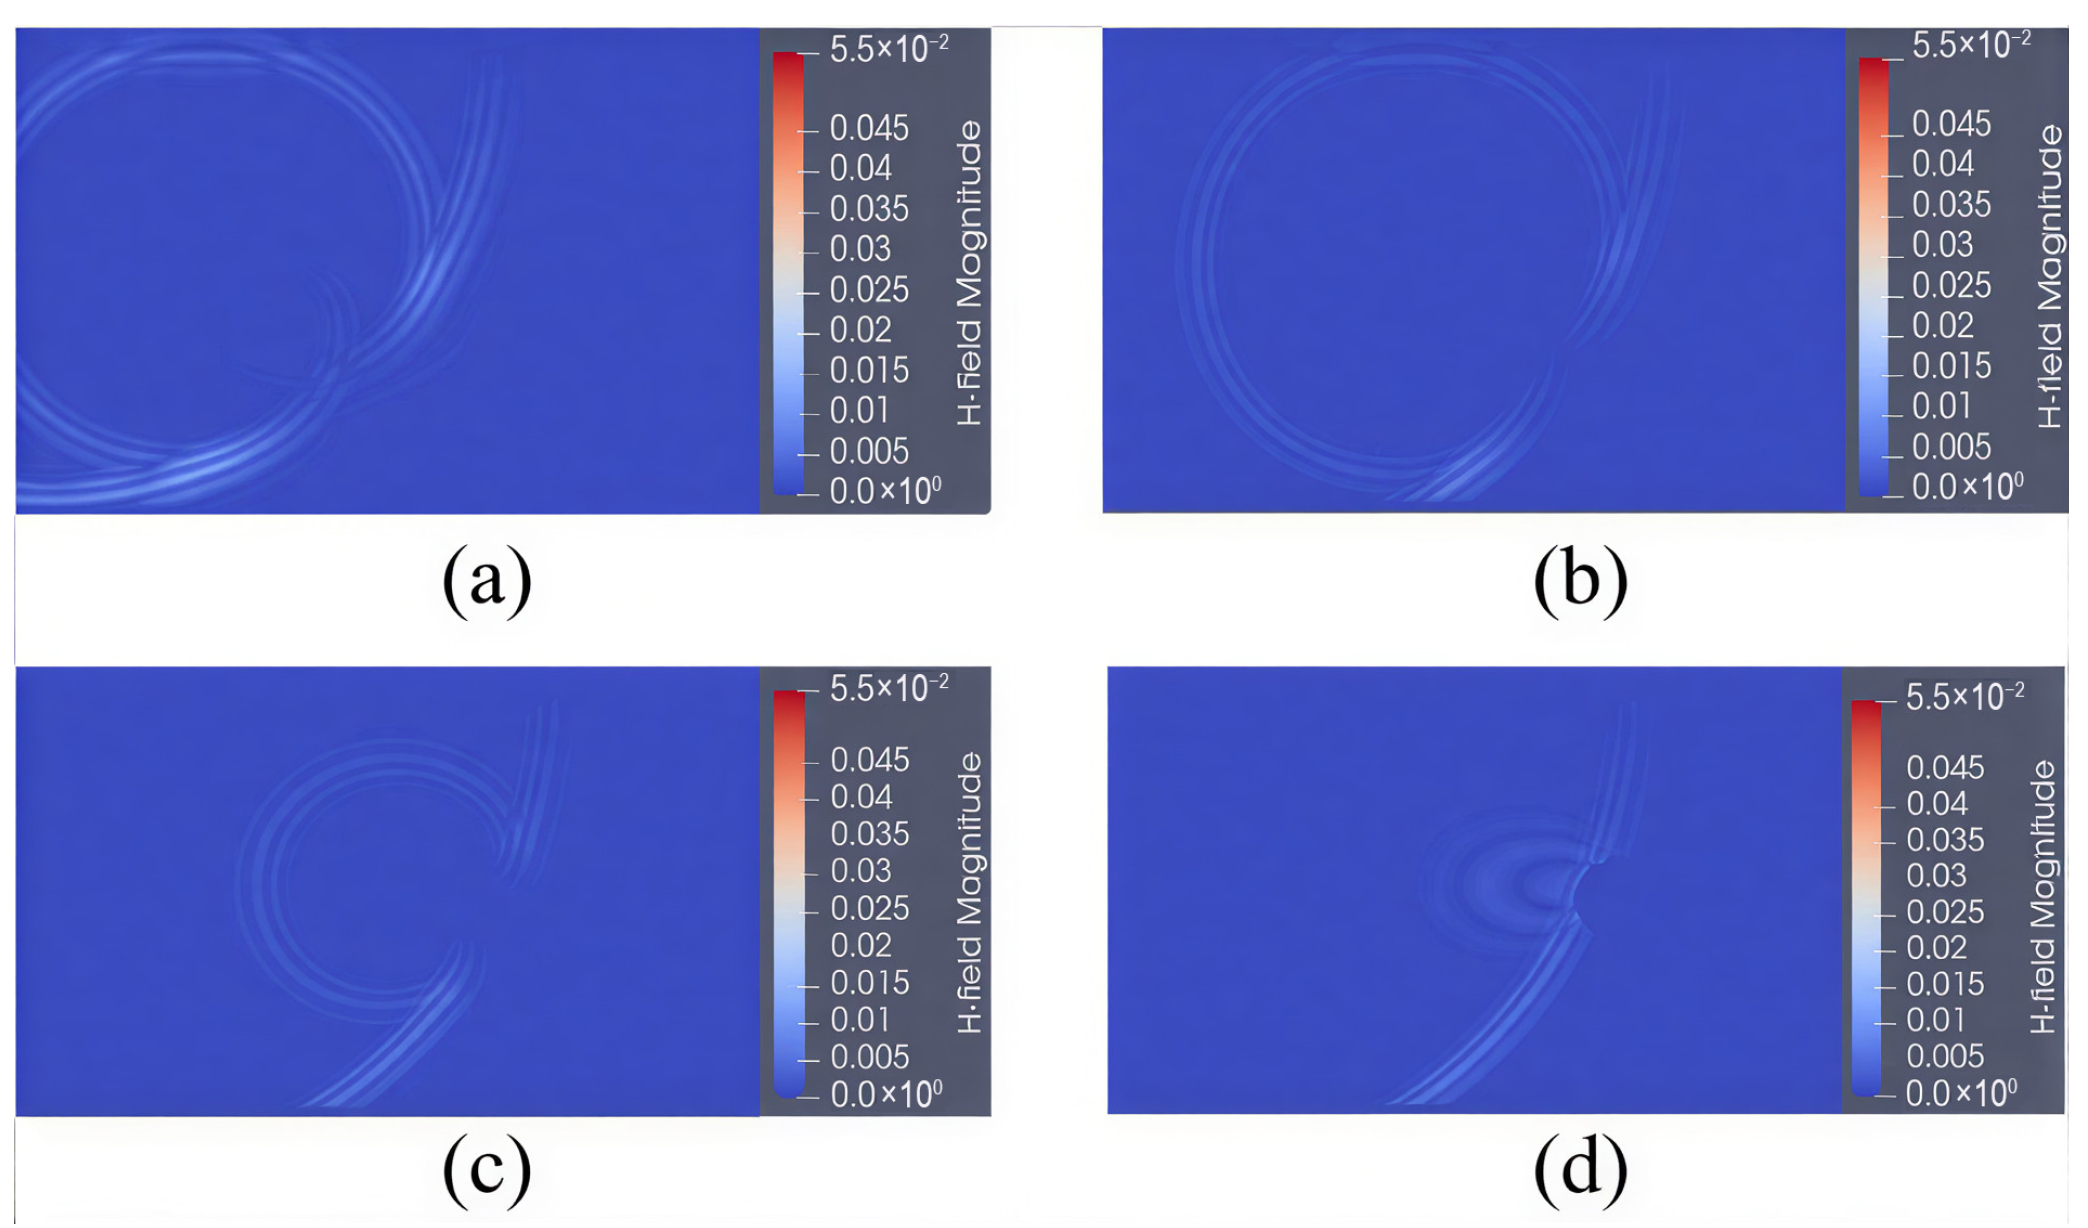
The grid settings and other parameters remain identical to those previously described. All faults are modeled as cylinders, with target body tilt angles of 15°, 30°, 45°, and 60°, respectively. The electric field strengths detected at different tilt angles are illustrated in Figure 8.
Figure 8.
Visualization of wave field intensity in faults with different tilt degrees at 6 s, with tilt degrees of 15° (a), 30° (b), 45° (c), and 60° (d).
It can be observed that, with the dimensions and depth of the fault remaining constant, an increase in the inclination angle results in greater deformation of the fault shape and a reduction in the detected field strength. This effect is influenced by the geometric shape, electromagnetic properties, scattering behavior, and other attributes of the anomalous body [57]. In practice, multi-point detection is necessary to obtain the requisite data, which are then processed by algorithms to generate an accurate image of the anomalous area. This image can then be analyzed in terms of its size, position, inclination angle, and other features.
6. Results and Validation
6.1. Geological Overview
The working face consists of coal-bearing strata from the Shanxi Formation of the Lower Permian (P1s). The upper boundary is an aluminous rock floor, and the lower boundary is the top of the Taiyuan Formation limestone. The stratum thickness ranges from 70.54 to 105.82 m, with an average thickness of 90.15 m (borehole 28-9 did not penetrate the Taiyuan Formation limestone) [58]. The lithology consists of interbedded sandstone, sandy mudstone, siltstone, mudstone, and coal, including two coal seams, No. 10 and No. 11, with coal seam No. 10 serving as the mining seam of this working face. The geological structure of the working face dips toward the northeast, with a dip angle ranging from 5° to 18°.
6.2. Simulation Results
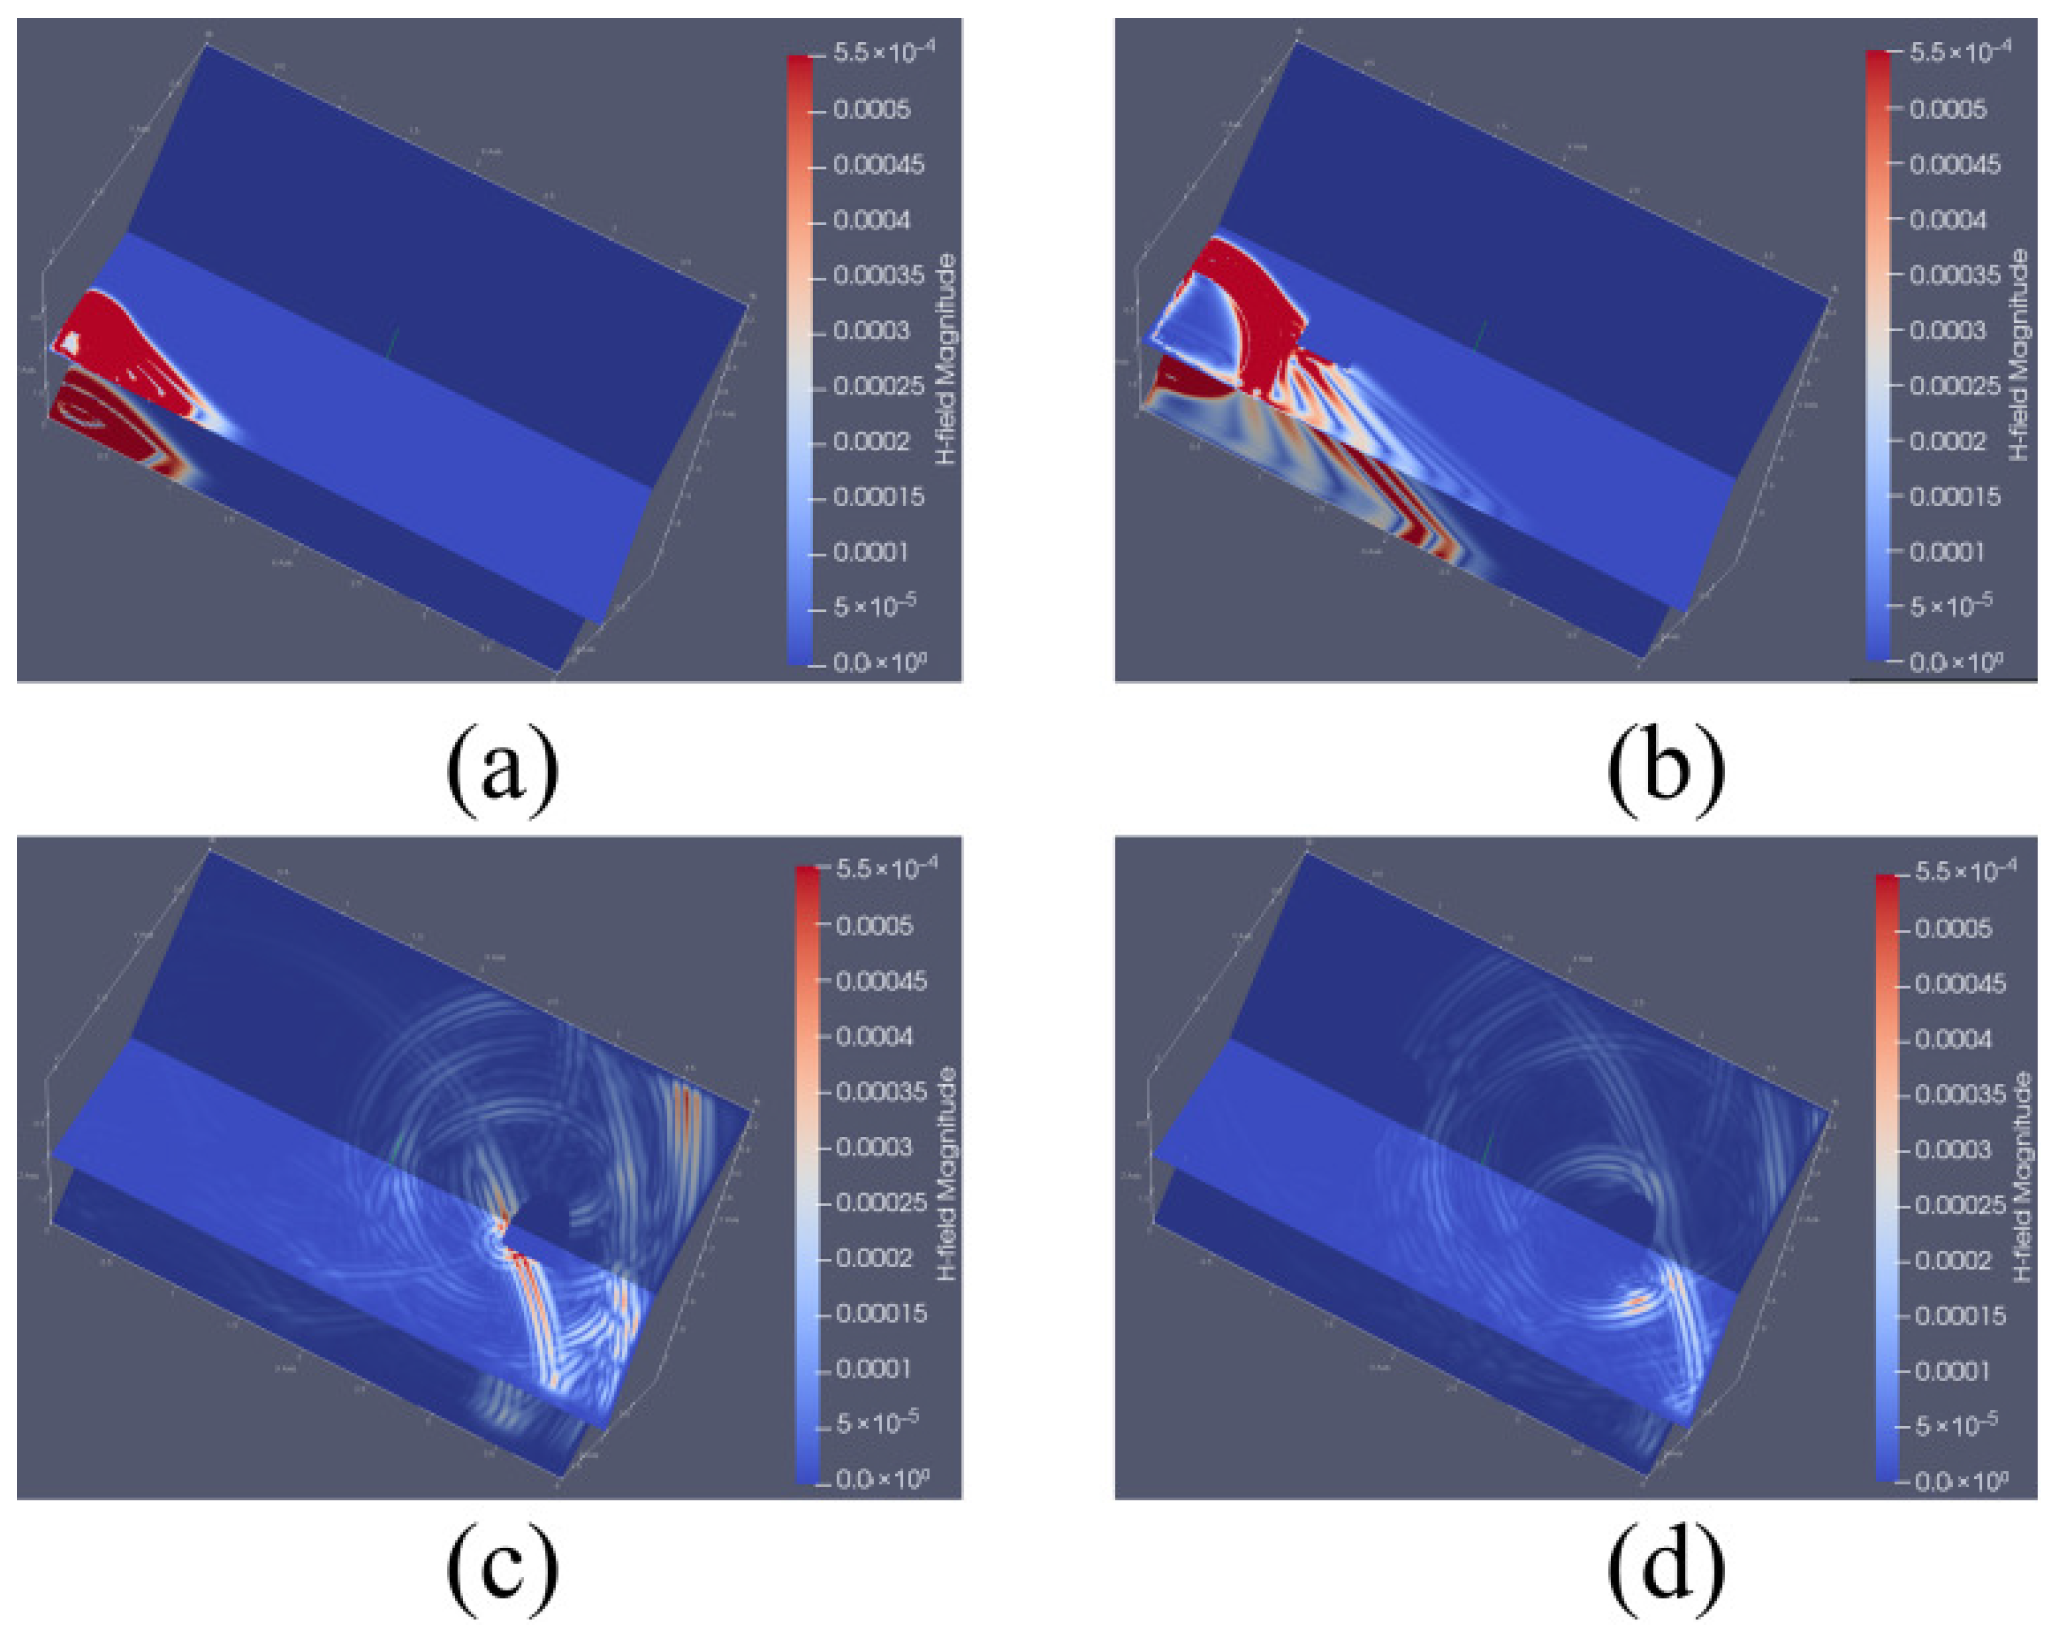
To validate the case, environmental parameters and electromagnetic wave frequencies reflecting coal mine geological conditions were set in the simulation. Forward simulation was conducted to obtain the variation in electric field strength at different times. In this case, the electric field strength within the anomaly area remains constant over time. The simulation results at 7 s, 8 s, 9 s, and 10 s are illustrated in Figure 9. A noticeable difference in wavefield strength variation is observed between the initial and final stages. Due to the 400-m thickness of the coal seam within the borehole test range, the field strength attenuates rapidly; thus, the simulation concludes at 12 s. The simulation results at 1 s, 2 s, 11 s, and 12 s are illustrated in Figure 10.
Figure 9.
Wave field intensity diagrams at different times, 7 s (a), 8 s (b), 9 s (c), 10 s (d).
Figure 10.
Wave field intensity diagrams at different times, 1 s (a), 2 s (b), 11 s (c), 12 s (d).
The simulation results clearly delineate the boundary of the electric field anomaly area, simulating the electromagnetic response of geological anomalies. As shown in Figure 10d, the signal is weak at 12 s, consistent with the observed attenuation during the simulation process.
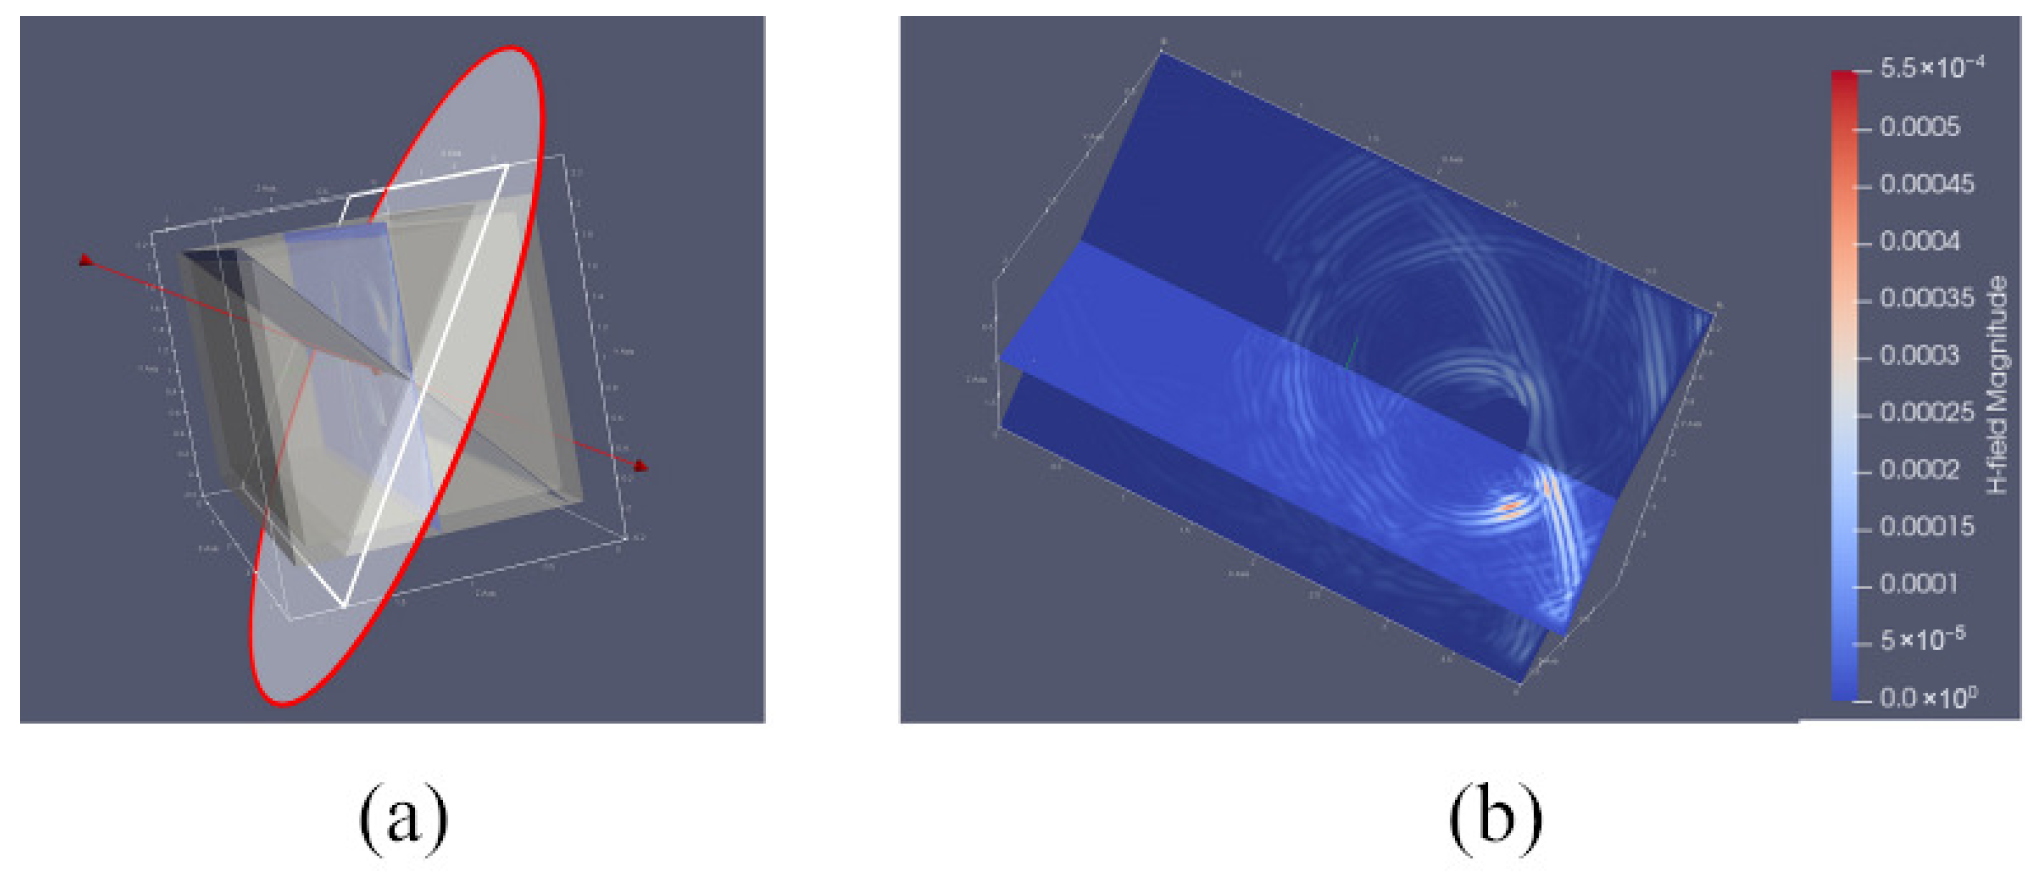
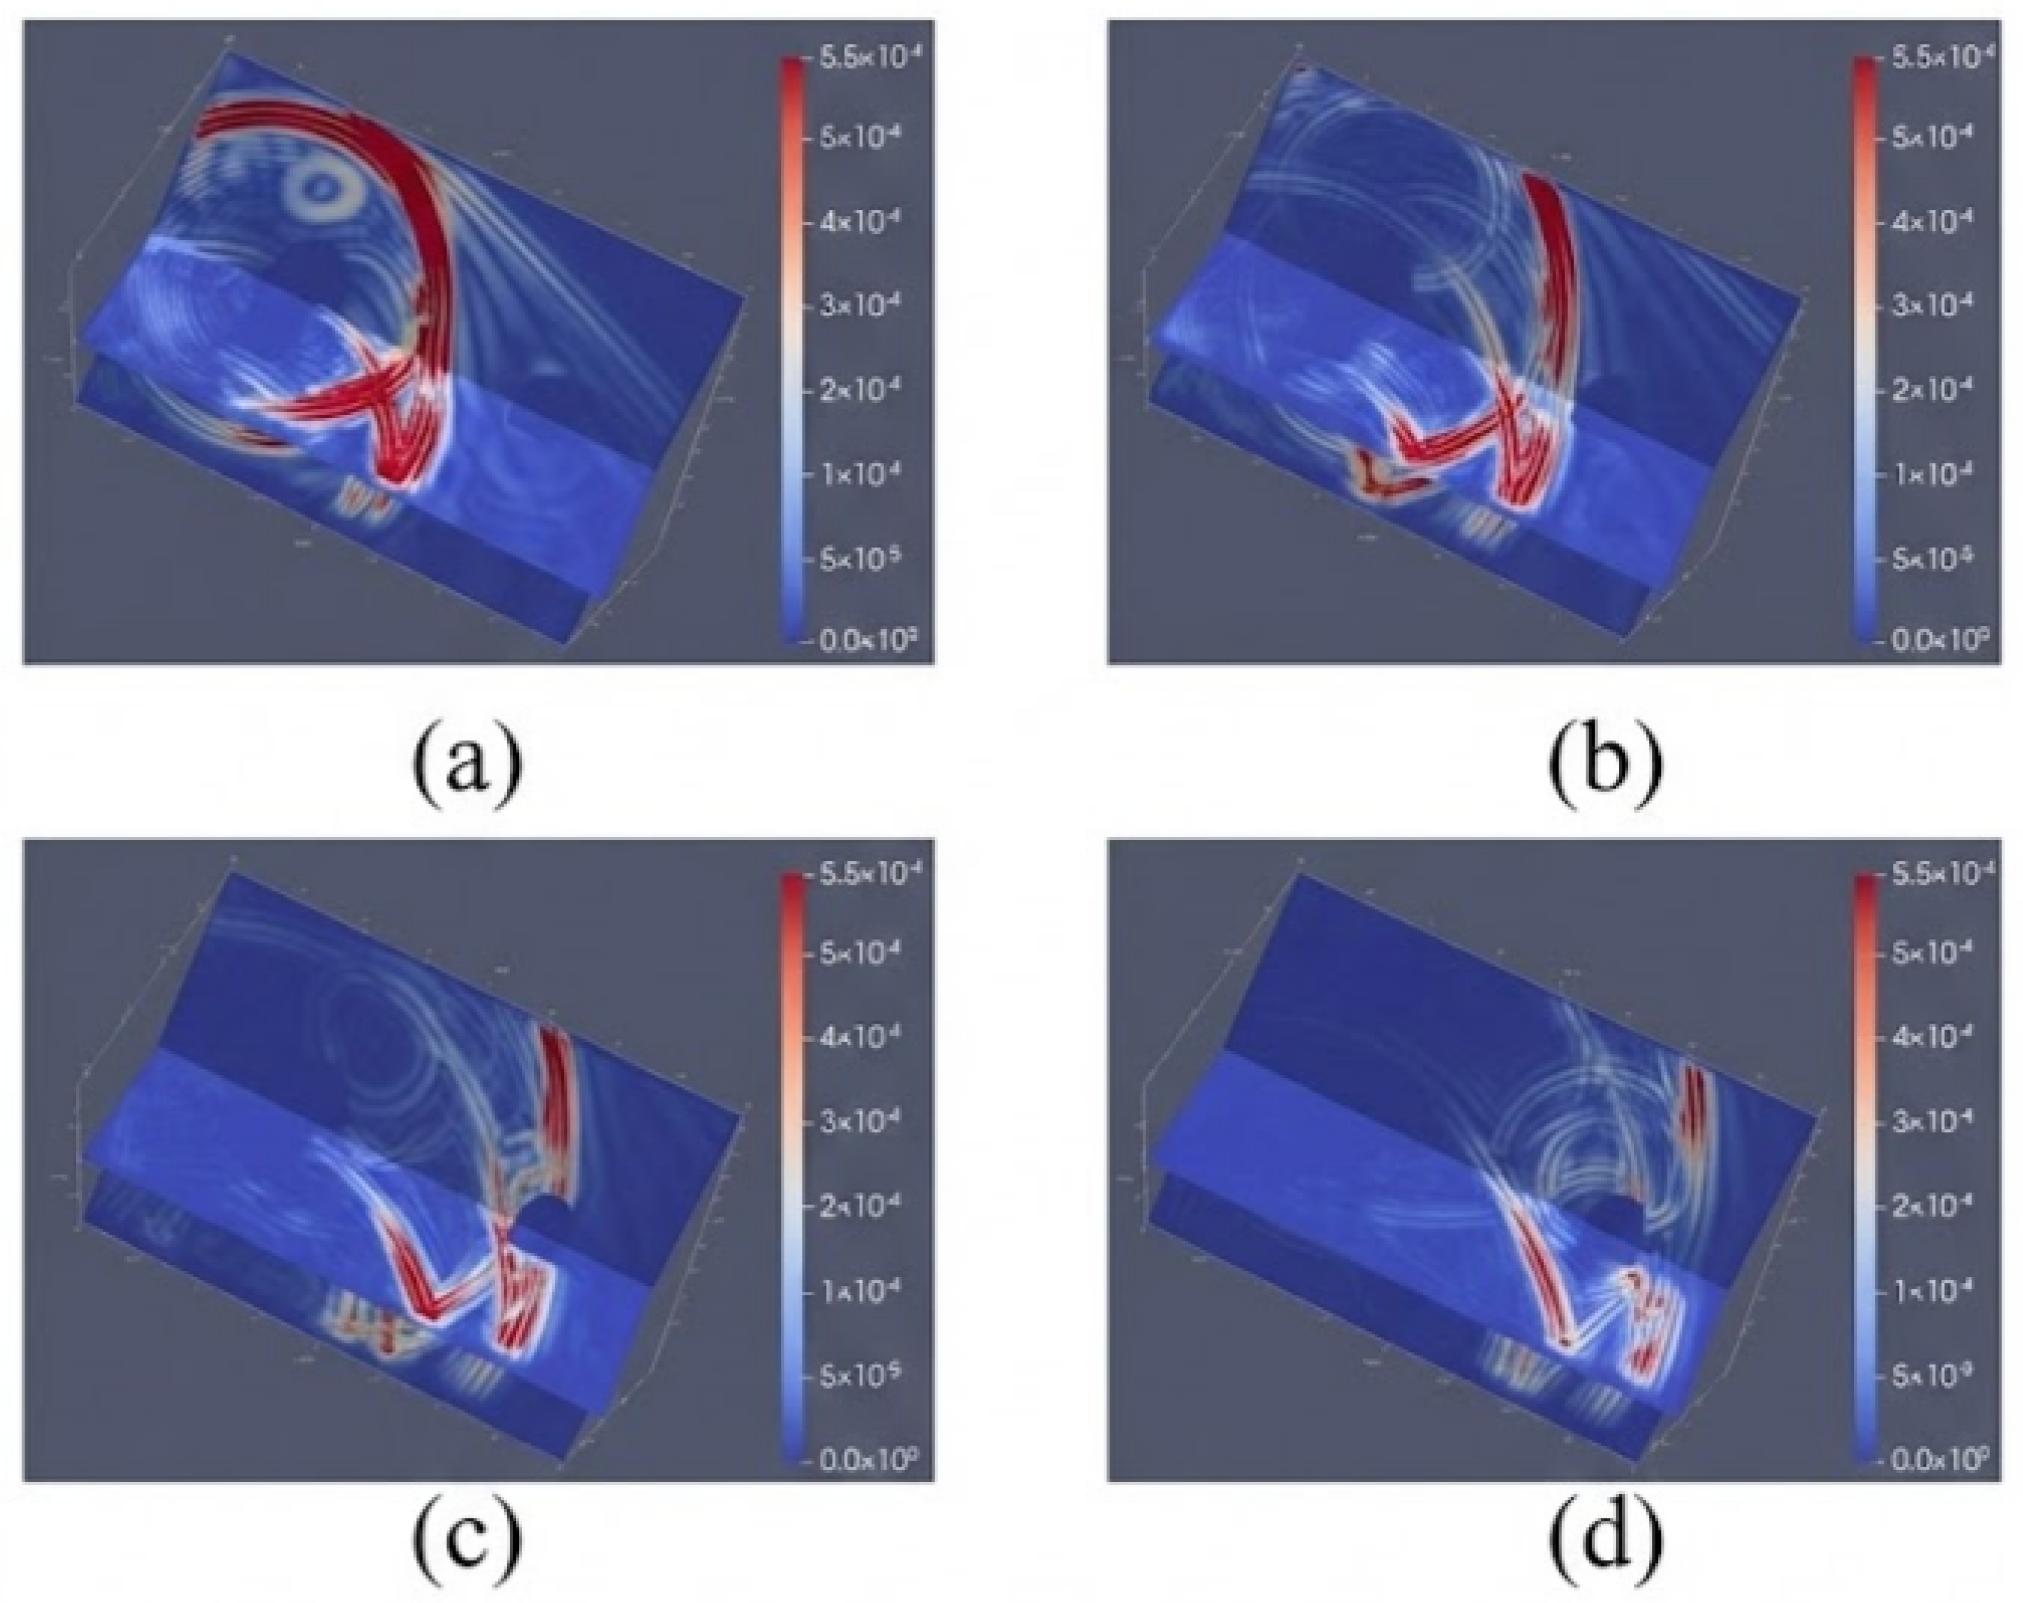
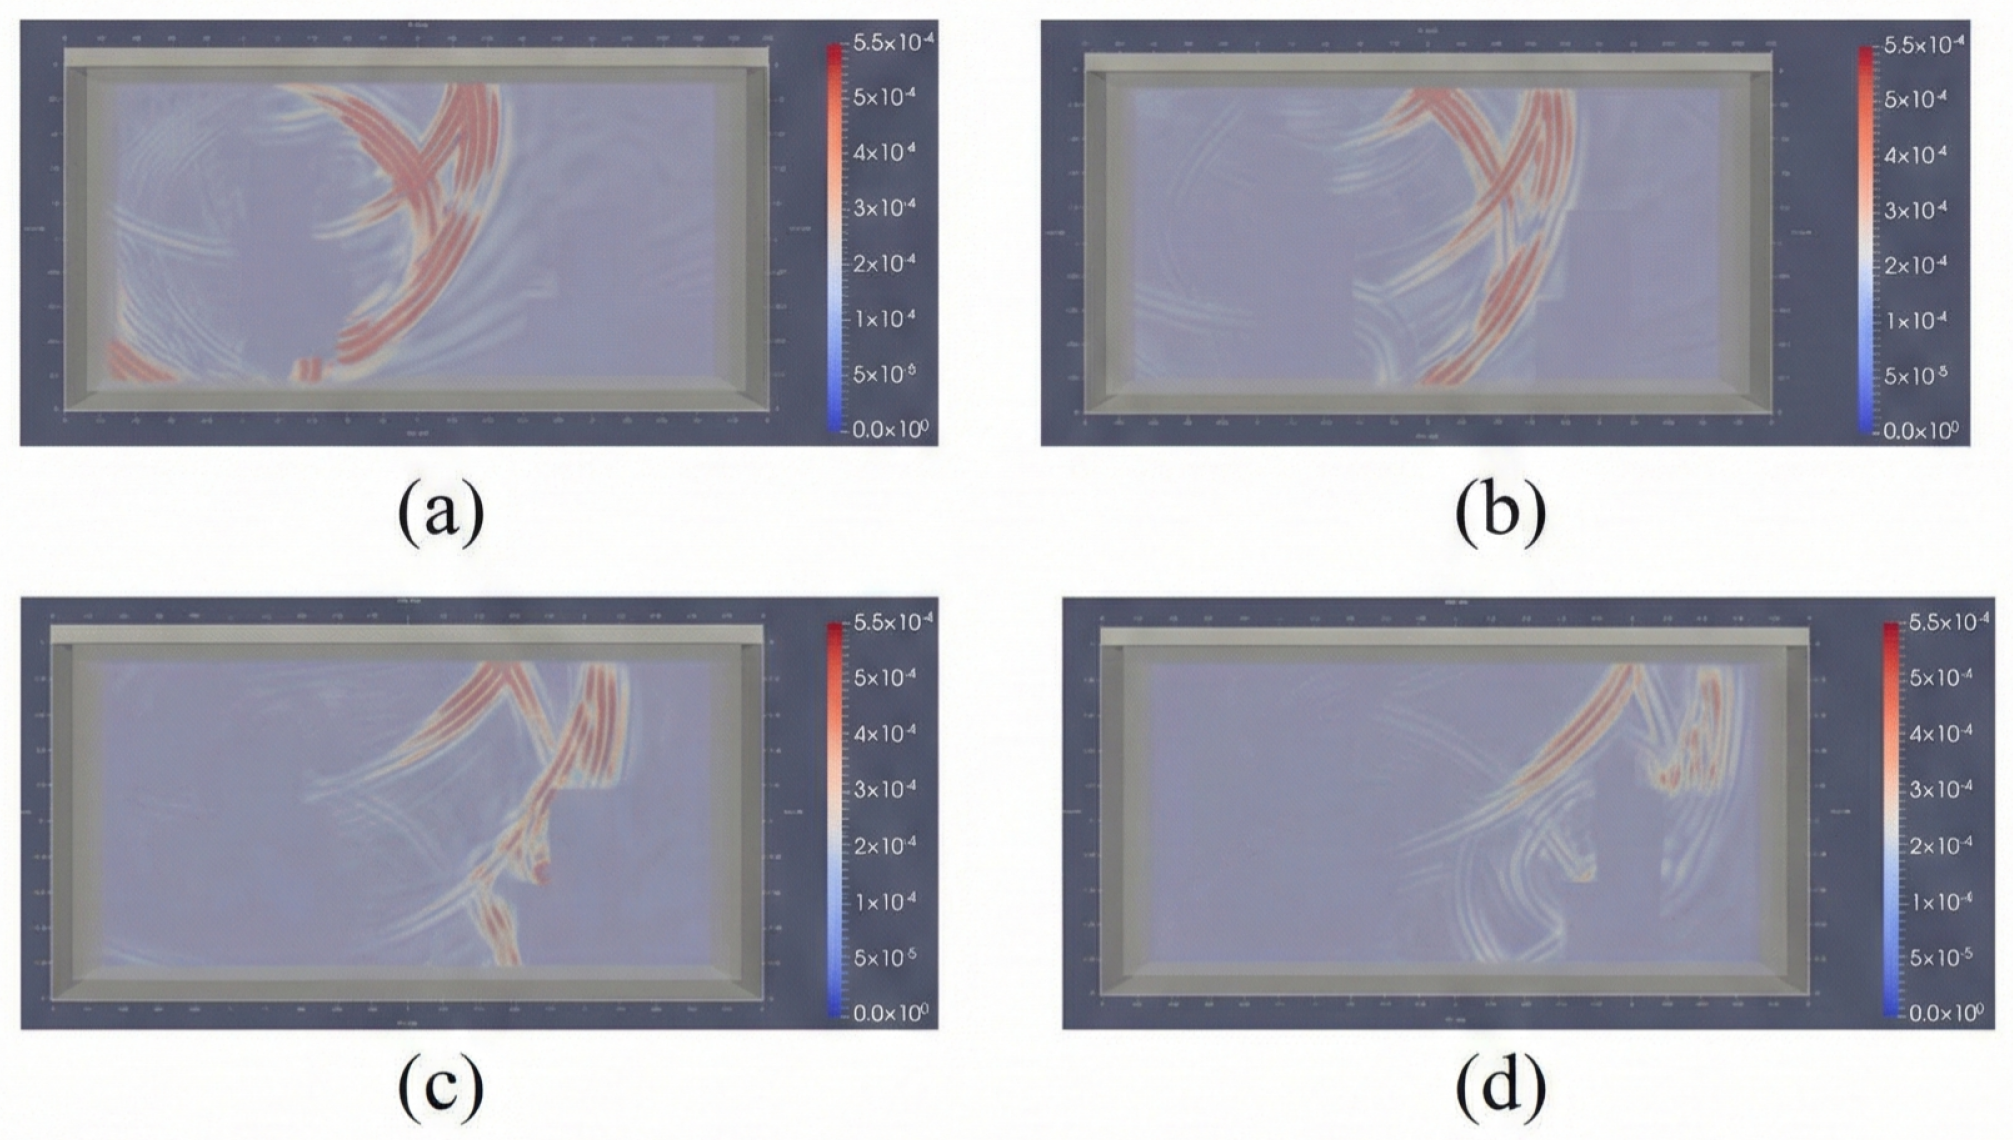
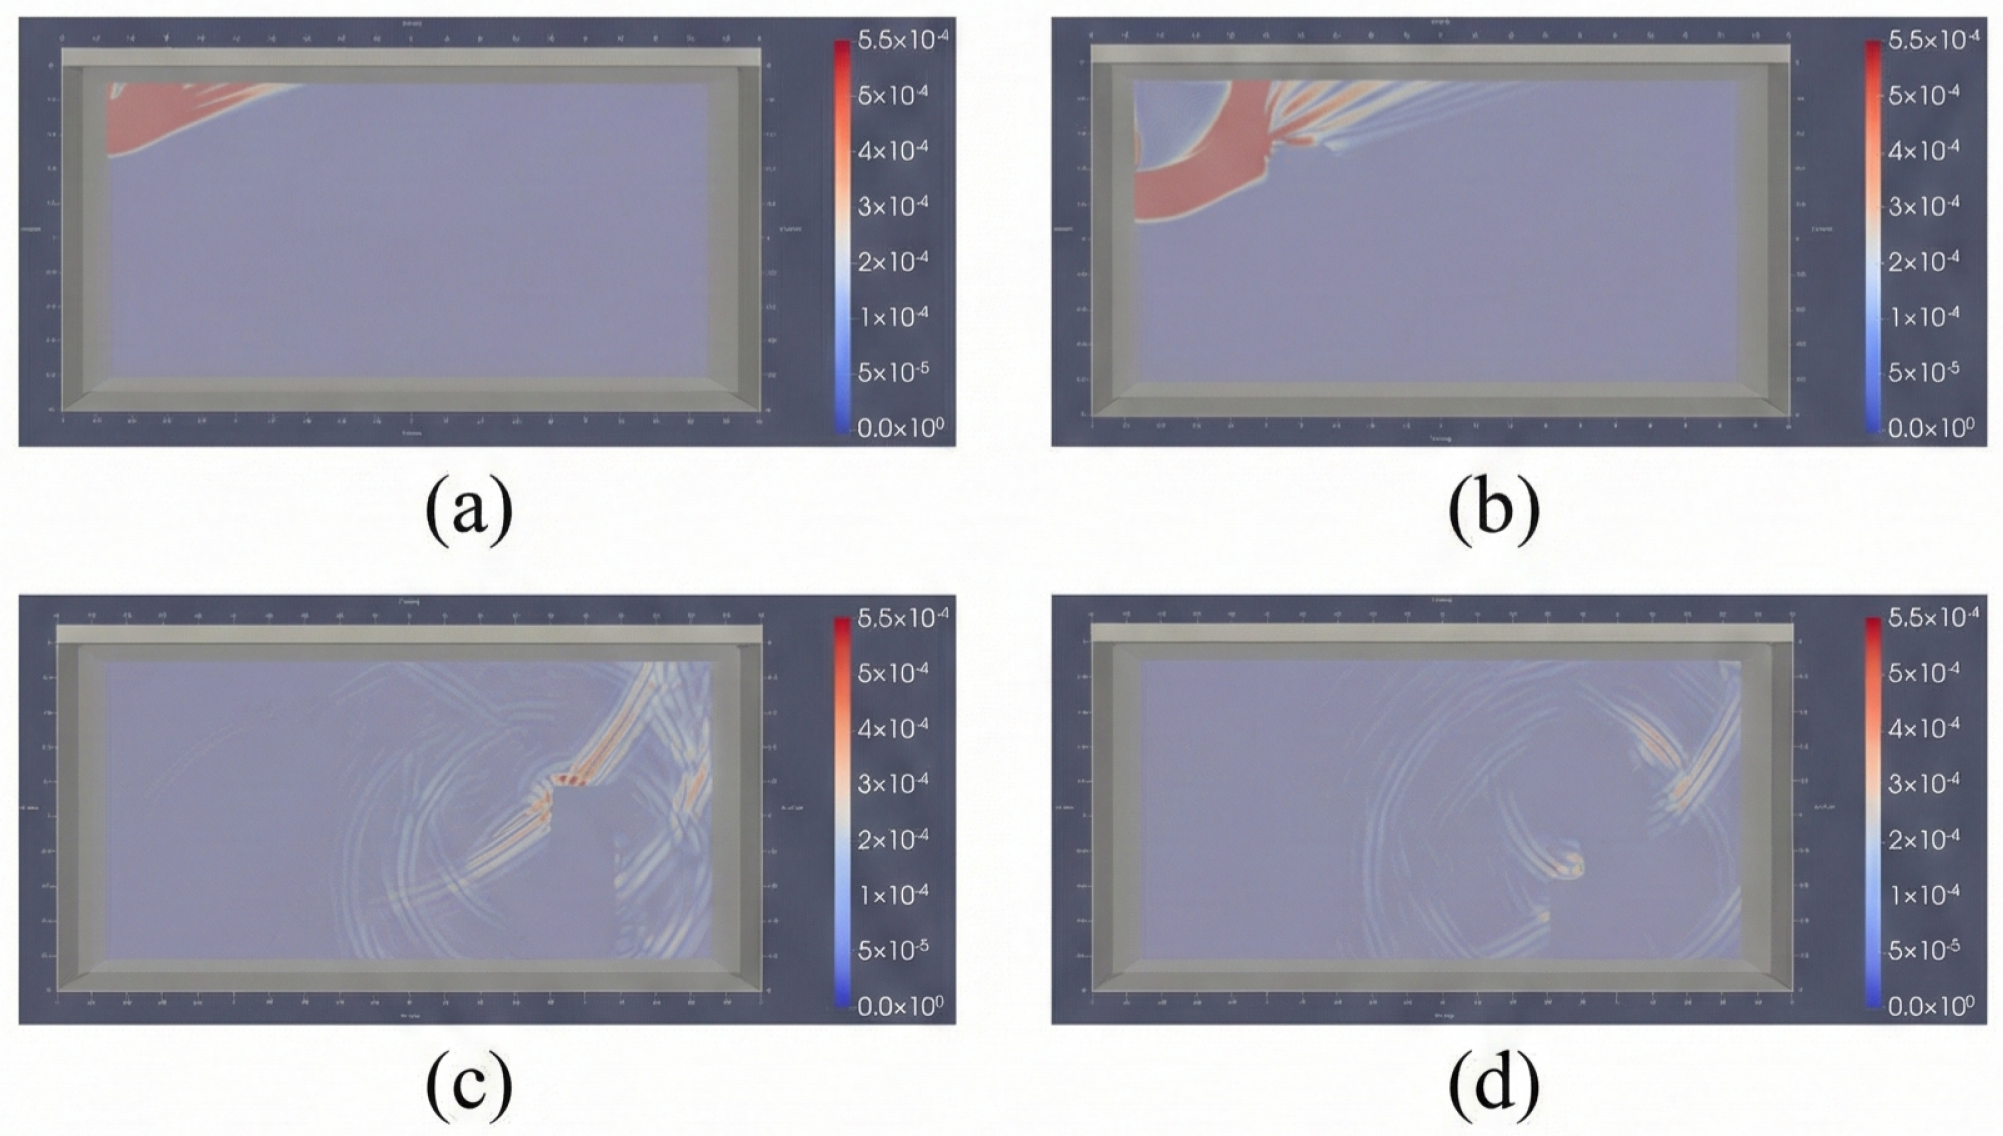
To observe field strength changes at different times and directions, a three-dimensional slicing method was employed. Using two slices, the variation in wavefield strength is comprehensively and three-dimensionally illustrated. The overlay of two slices provides a three-dimensional visualization of the electric field inside the model, aiding in determining the inclination angle of the anomaly zone. The variation in wavefield strength over time across different directions is illustrated in Figure 11, and the slice simulation results at 7 s, 8 s, 9 s, and 10 s are depicted in Figure 12. The simulation results at 1 s, 2 s, 11 s, and 12 s are illustrated in Figure 13.
Figure 11.
Slice and intensity diagram, slice three-dimensional display diagram (a), slice field intensity diagram (b).
Figure 12.
Slice wave field strength chart at different times, 7 s (a), 8 s (b), 9 s (c), 10 s (d).
Figure 13.
Slice wave field strength chart at different times, 1 s (a), 2 s (b), 11 s (c), 12 s (d).
The slicing principle illustrated in Figure 12, Figure 13 and Figure 14 displays the electromagnetic field strength transmitted through faults, revealing clear outlines at the edges of the fault structures. This phenomenon occurs because the refractive index of air is lower than that of the coal seam, causing electromagnetic waves to undergo diffuse reflection within the fault. This diffuse reflection results in a lower field strength detected at the receiving point, manifested as a rapid decrease in electromagnetic wave amplitude. The magnitude of the decrease is related to the fault size, and the relationship between decreases at different emission points can be used to deduce the inclination angle of the fault. The absolute amplitude reflects the depth of the anomaly zone [59]. The analysis based on three-dimensional slicing of fault zones aligns with the electromagnetic wave characteristics observed in the anomaly detection results presented in the experimental report. Moreover, the forward simulation method proposed in this study provides a useful reference for anomaly determination in radio wave penetration detection. This approach also holds practical significance for studying internal coal mine structures, detecting heterogeneities, and evaluating mine integrity.
Figure 14.
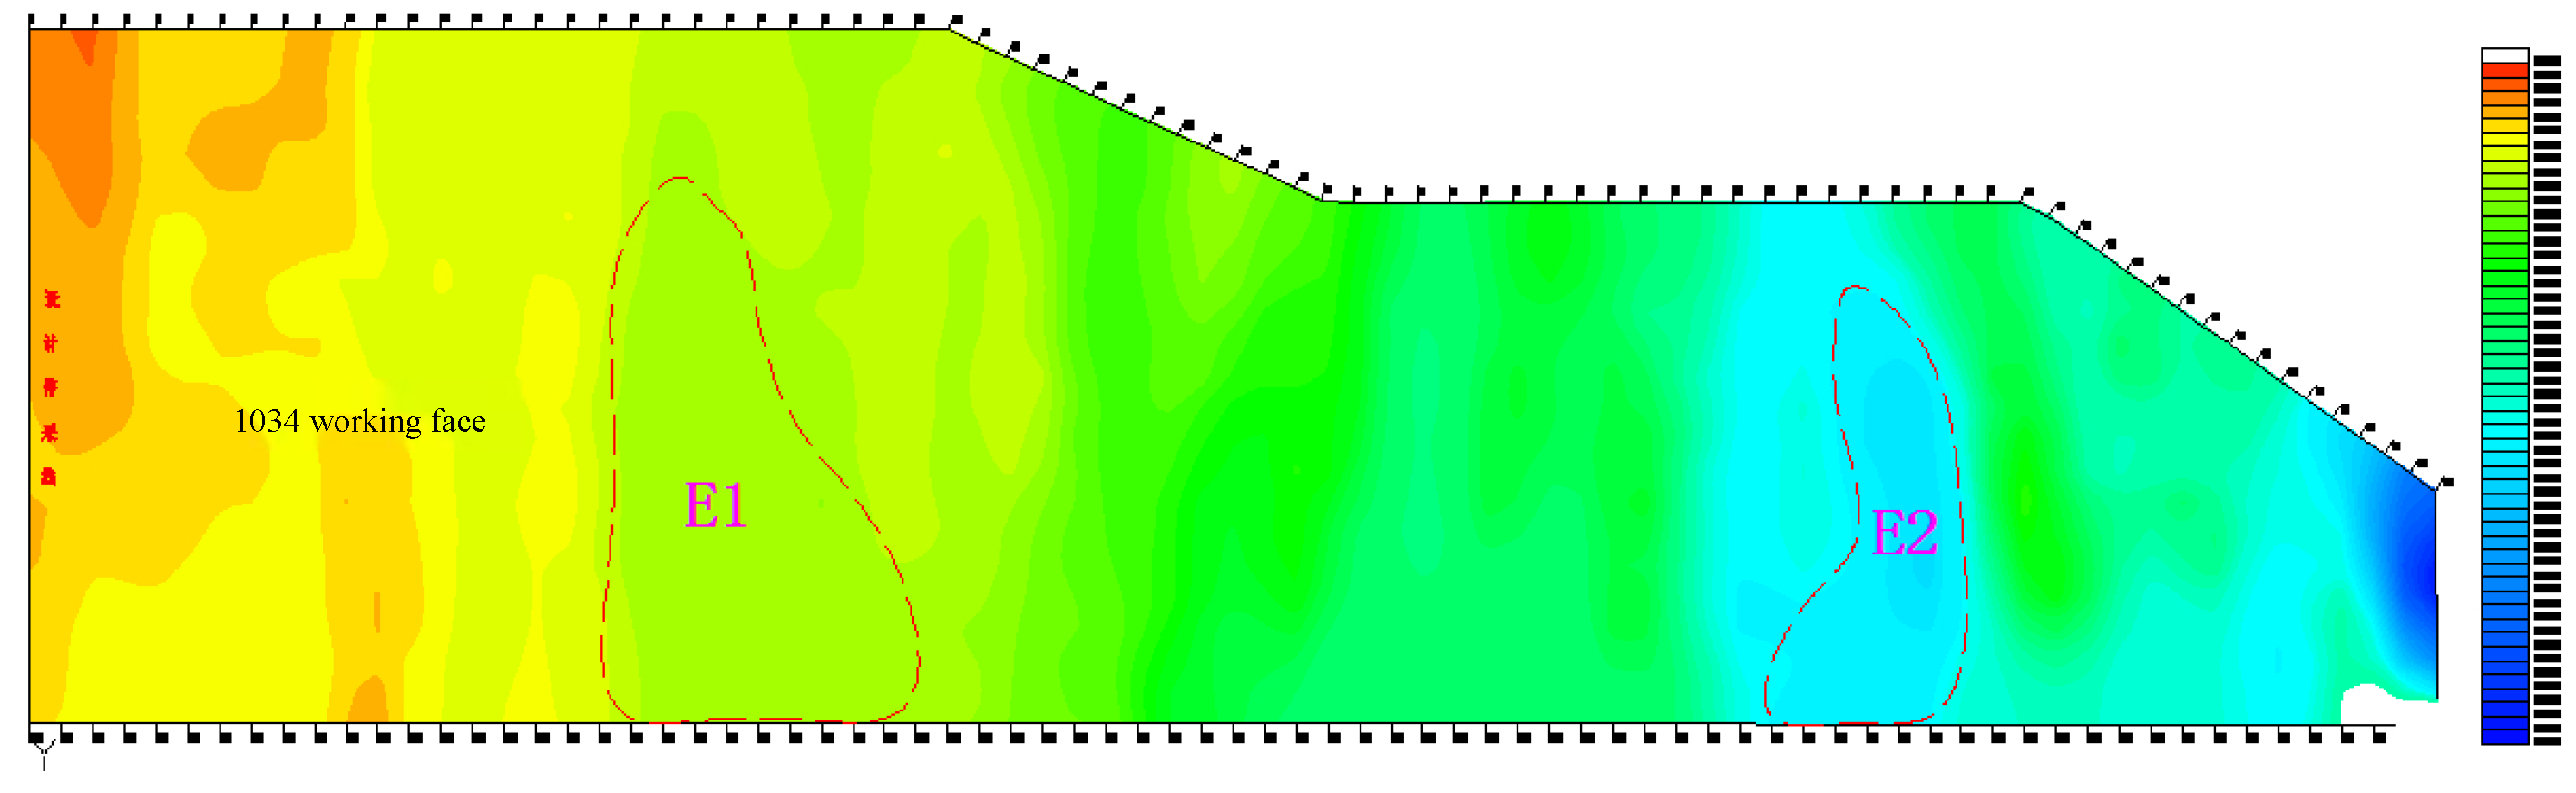
Radio wave penetration results chart.
6.2.1. Comparison of Detection Results
Figure 14 illustrates the radio wave penetration results of the mining face, where the electromagnetic wave attenuation coefficient ranges from 0.41 to 0.77. The color gradient from blue to red represents a decrease in the intensity of electromagnetic wave attenuation. Blue areas indicate the strongest attenuation and poorest penetration, suggesting lower coal integrity, whereas red areas indicate the weakest attenuation and best penetration, implying better coal integrity. Due to variations in the width of the mining face, the electromagnetic wave attenuation coefficient gradually increases from smaller to larger measurement points.
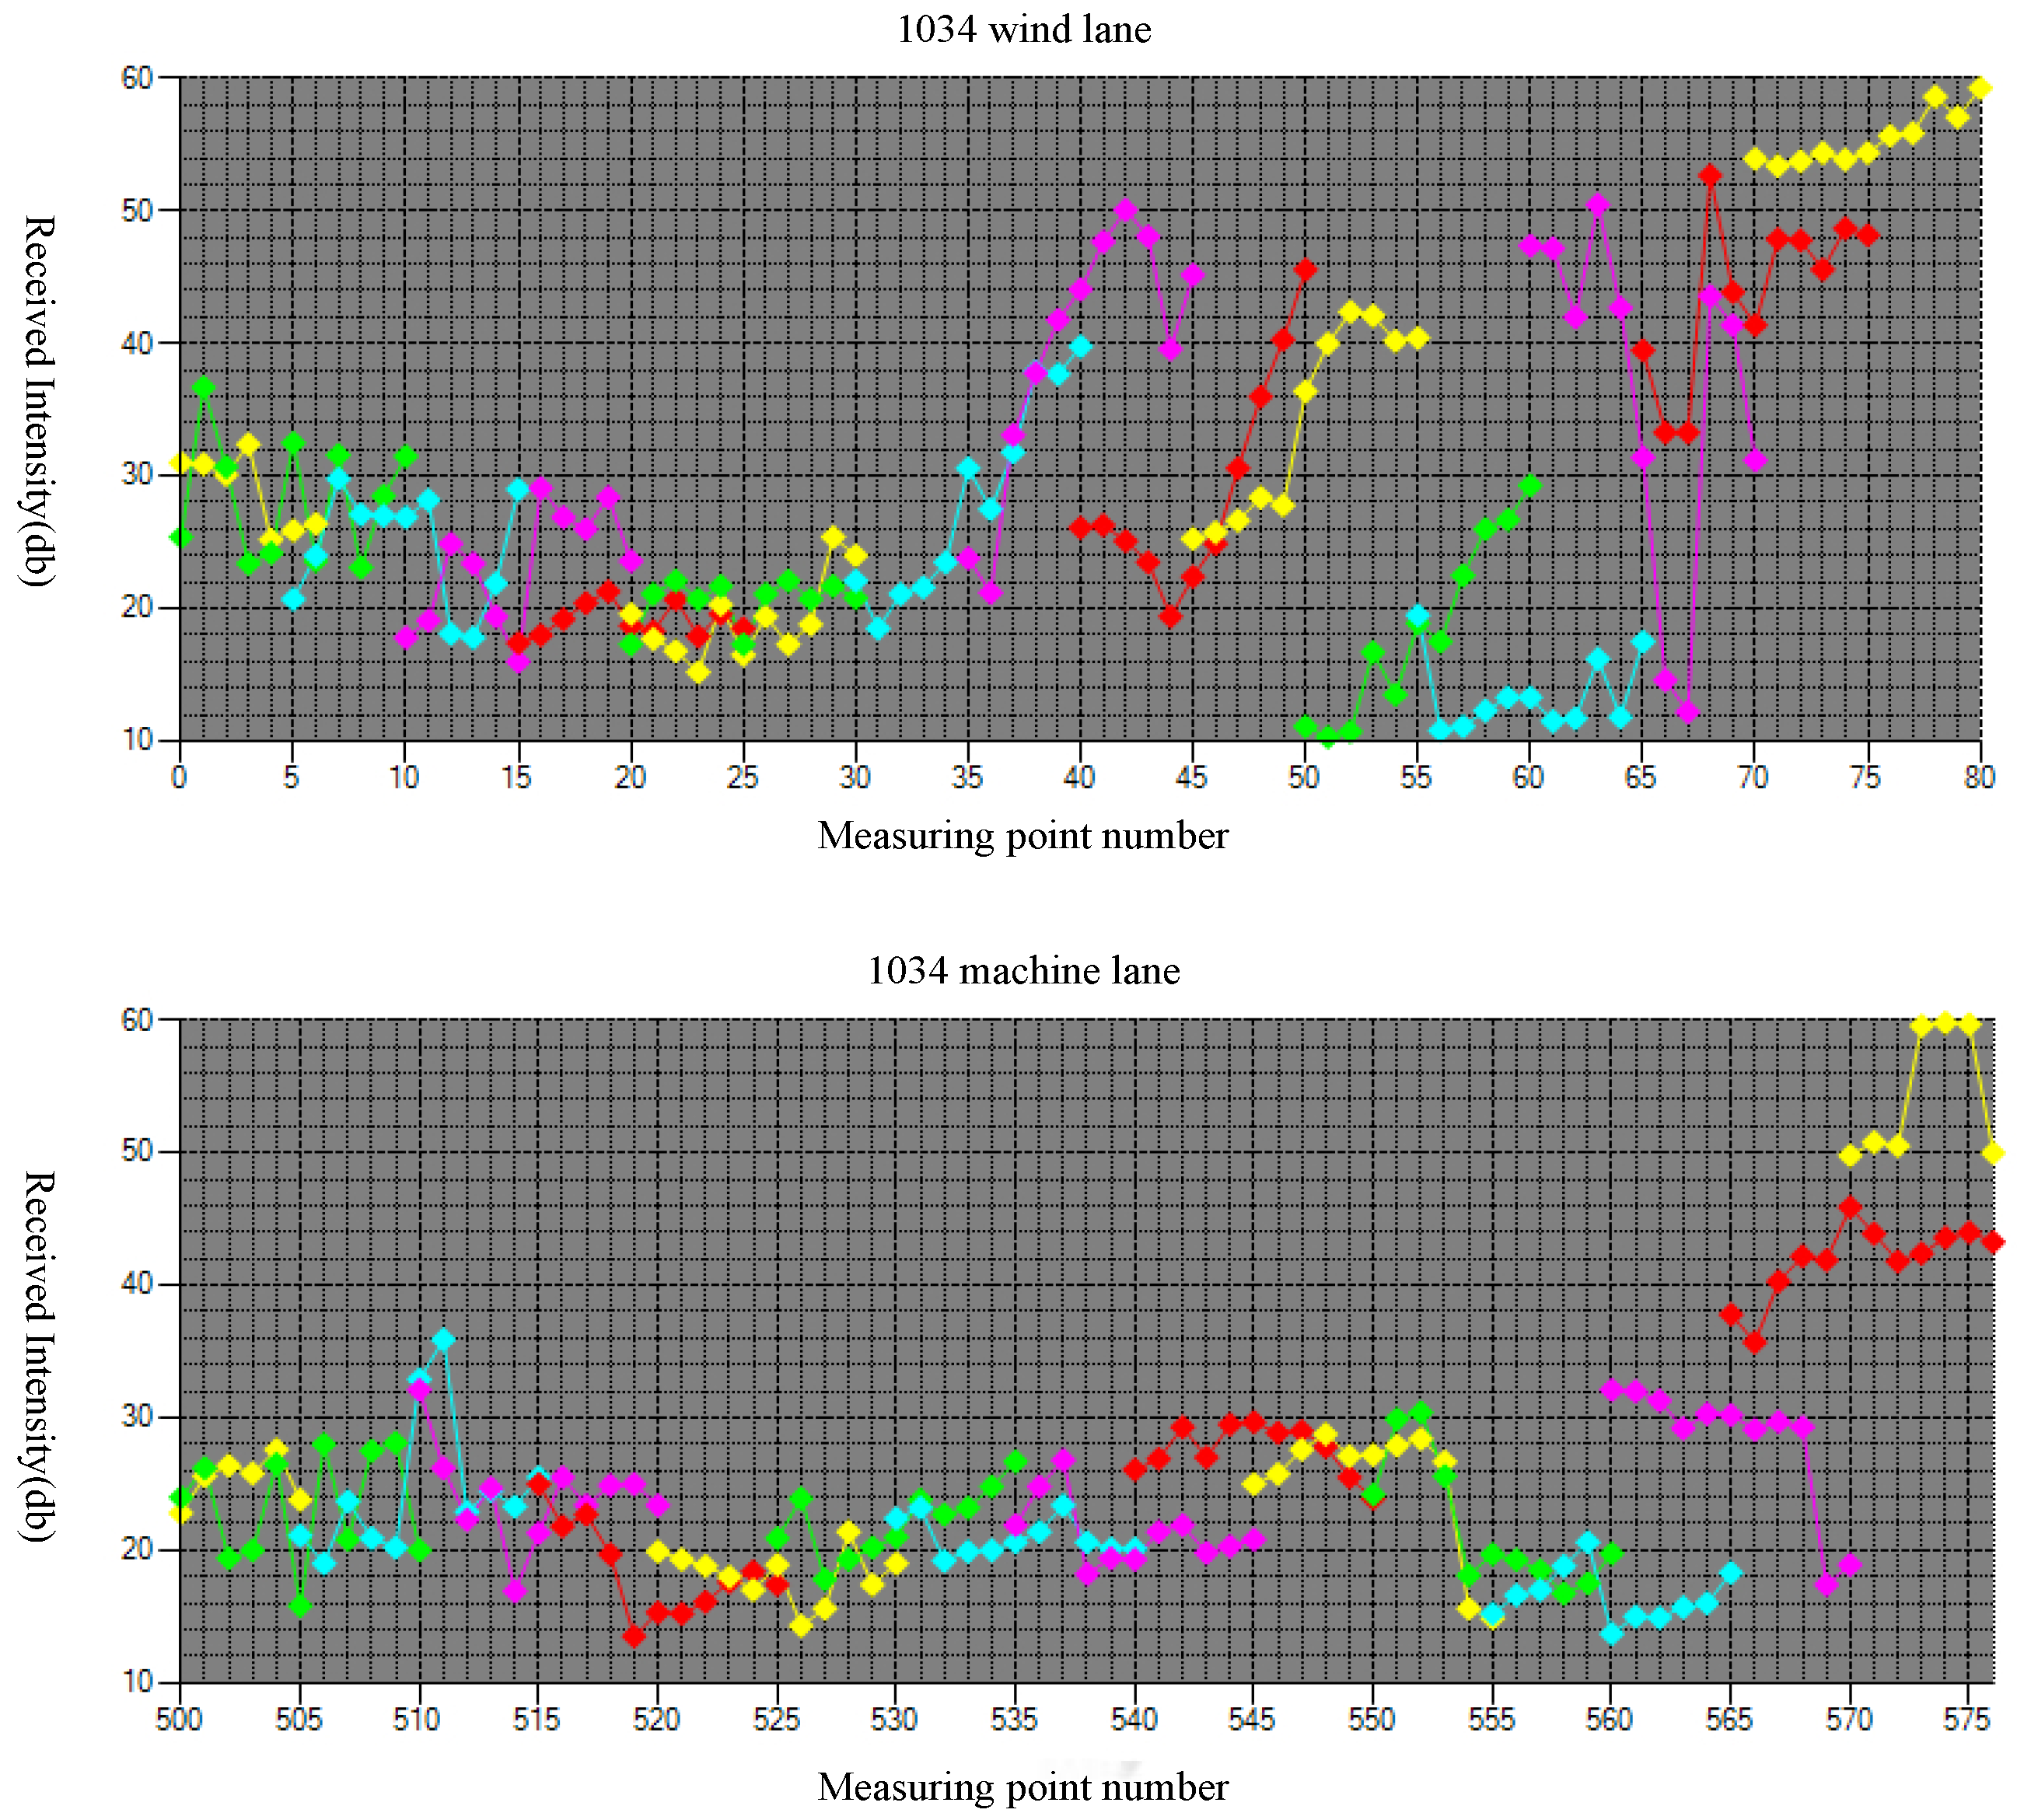
Figure 15 presents the comprehensive curve of received intensity values at different reception points during the detection process. In Figure 15, the GetData Graph Digitizer software was used to extract data from the comprehensive curve graph, resulting in the data table for the anomaly zone shown in Table 4. The software GetData Graph Digitizer (Version 2.26) was used for digitizing plotted data. The official website is https://getdata-graph-digitizer.com (accessed on 13 January 2026).
Figure 15.
Radio wave penetration comprehensive graph.
Table 4.
Abnormal area reception intensity table.
In this detection result, two areas with high electromagnetic wave attenuation coefficients are identified as Anomaly Area E1 and Anomaly Area E2. Based on the spatial model analysis of wireless radio wave penetration proposed in this study, the boundaries of these anomaly areas are clear, and the electromagnetic wave attenuation exhibits a rapid decrease. Considering that these areas are neither karst collapse columns nor watery zones, it is speculated that these are fracture zones formed by faults of varying sizes at the same depth. The received magnetic field characteristics align with those observed in the model’s fault zones. Hasty mining in these areas may pose significant safety hazards.
Near the cut-hole, small-scale anomalous responses are also observed, consistent with actual results in coal mines. These anomalies are attributed to the combined effects of faults such as F1033-2, F1033-4, F1034-7, and F1034-8, along with their extensions within the working face, consistent with the model simulation results. The accurate delineation of these anomalous zones validates the reliability and accuracy of the method employed in this study, providing a solid basis for guiding safe and efficient mining operations.
6.2.2. Quantitative Validation Metrics
Table 5 summarizes key accuracy indicators between simulated and measured field strengths.
Table 5.
Quantitative Validation Metrics for 1034 Working Face.
6.3. The 182,406 Working Face
The 182,406 working face of a coal mine in Hebei is located on the second level of the northern fourth mining area, characterized by a north-south strike and an eastward-dipping monocline structure, with stable coal seams and a relatively simple geological configuration.
Detection Results
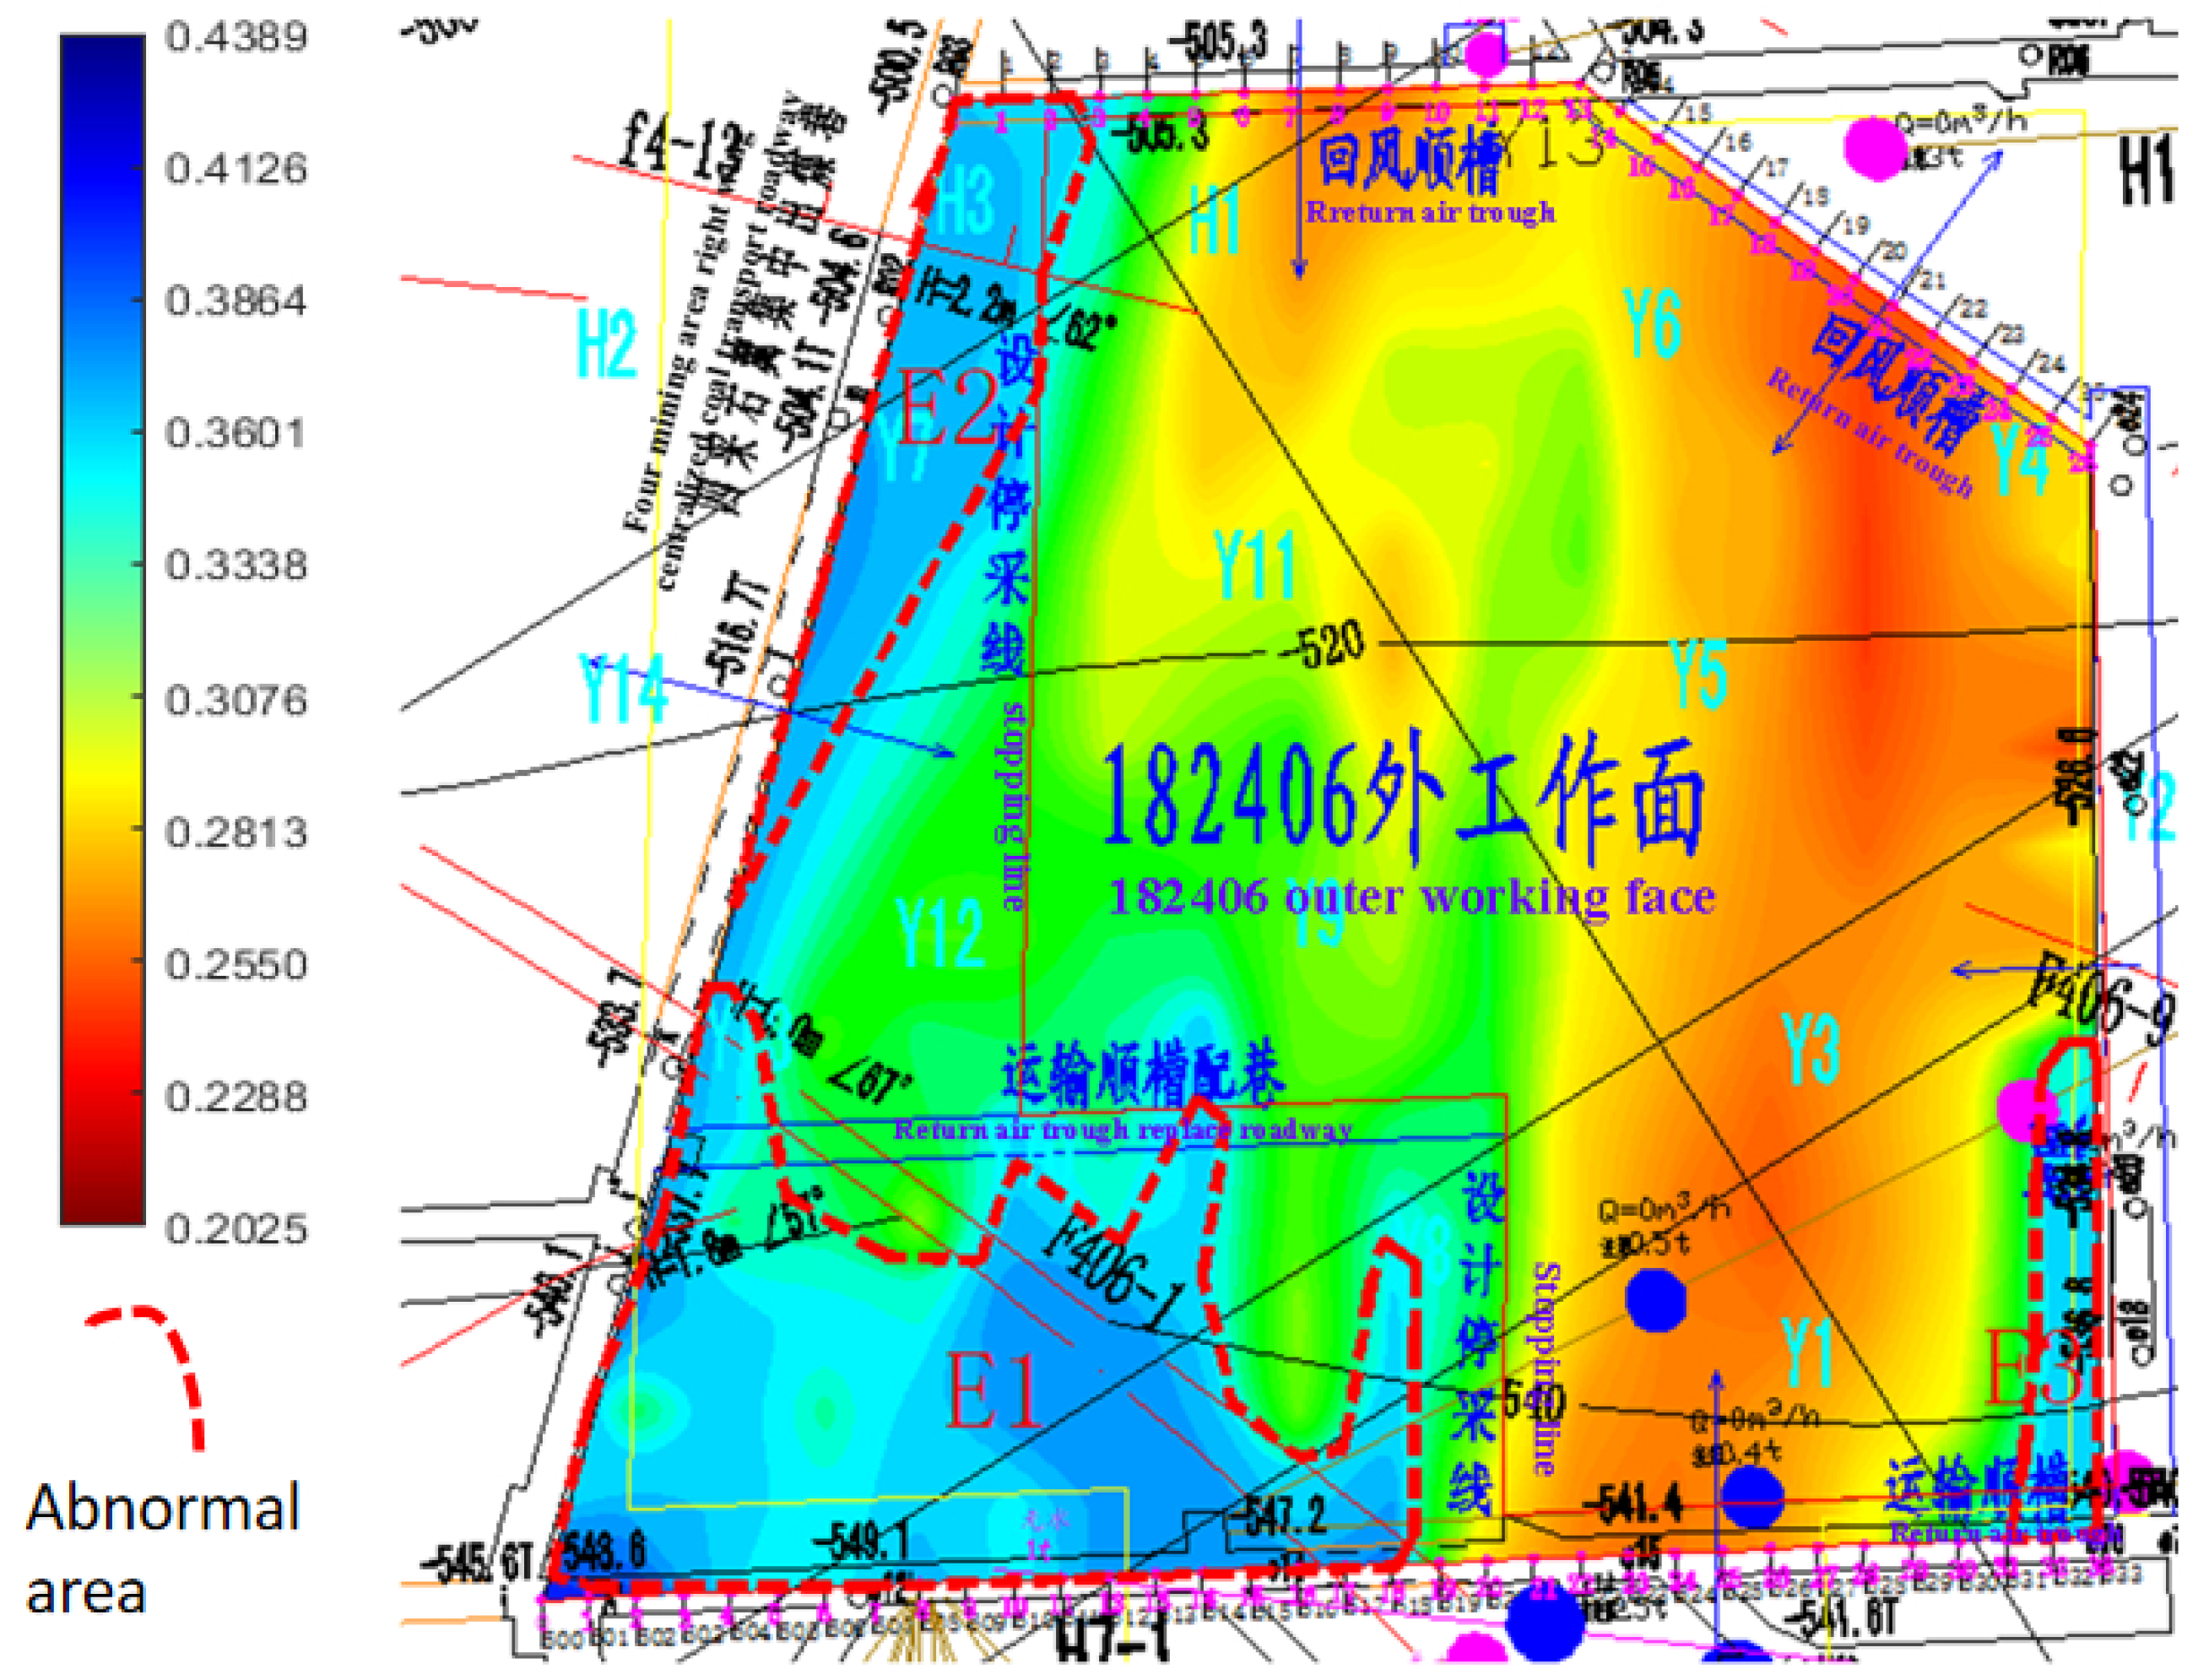
The radio wave penetration method provided a clear reflection of the anomalous areas in the 182,406 working face. After indoor data processing, the overall attenuation coefficient was determined to range between 0.21 and 0.45 (0.21 < < 0.45). Three areas of strong attenuation were identified and delineated (marked in red) and labeled as anomalies E1 to E3. The top boundary of the exploration area corresponds to the transport roadway of the 182,406 working face, featuring a relatively short extension, whereas the bottom boundary does not extend to the central part of the working face. The resulting image is shown in Figure 16.
Figure 16.
182,406 outer working face radio wave penetration CT resulting image.
In this exploration, the yellow areas were not specifically delineated as anomalies due to the relatively low electromagnetic wave attenuation. The anomalous regions identified were primarily in the blue areas (where the attenuation coefficient > 0.40), suggesting that these anomalies may be the result of structural development.
Anomaly E1 is located in the transport roadway between 0 and 90 m and extends into the auxiliary roadway of the transport roadway. The attenuation coefficient for this anomaly ranges from 0.40 < < 0.45, indicating a relatively strong attenuation zone, which is likely caused by the combined effects of fault F406-1 and the empty roadway.
Anomaly E2 is found between 0 and 15 m in the return air roadway and extends into the working face, gradually pinching out near the right-wing concentrated coal extraction roadway. The attenuation coefficient also falls within the range of 0.40 < < 0.45. This anomaly is likely influenced by fault F4-13, with additional effects from fault F406-1 and the empty roadway.
Anomaly E3 is located in the transport roadway between 155 and 165 m and extends into the working face. The attenuation coefficient here ranges from 0.39 < < 0.44, suggesting a relatively strong attenuation zone, with a concealed fault likely being the primary cause of the anomaly.
The exploration results clearly indicate the presence of three anomalous areas (E1, E2, and E3), characterized by relatively strong attenuation (0.39 < < 0.45). These anomalies are predominantly located in regions where significant geological structures, such as faults and empty roadways, are present. Anomaly E1 is influenced by fault F406-1 and the empty roadway, while anomaly E2 is primarily impacted by fault F4-3, and anomaly E3 is likely caused by a concealed fault. The identification of these anomalies through electromagnetic wave attenuation demonstrates the method’s effectiveness in detecting subsurface geological features.
Field measurement uncertainties were further quantified: electromagnetic interference from mining equipment introduced a noise floor of approximately 2 μV/m, while instrument calibration drift was measured at <0.3 dB over a 4-h operation window. These errors are significantly below the anomaly signal threshold (>5 dB attenuation), ensuring reliable detection.
7. Conclusions
This study presents an application-oriented advancement in geophysical detection by adapting the Three-Dimensional Finite-Difference Time-Domain (3D-FDTD) method specifically for the complex, high-attenuation environment of deep coal seams. Unlike general FDTD applications, the proposed conductivity-weighted model successfully resolves geological faults with sub-meter accuracy (<1 m) and quantifies attenuation characteristics (with coefficients ranging from 0.41 to 0.77) in heterogeneous mining environments. By validating these simulation results against field data from the 1034 working face, this research demonstrates that the specific adaptation of numerical parameters to coal geology significantly improves the interpretation of subsurface anomalies compared to conventional linear inversion methods.
- Simulation results indicate that, under consistent coal thickness, a larger fault volume leads to a steeper increase in electromagnetic wave attenuation, resulting in more pronounced anomaly characteristics and reduced penetration efficiency. This impact on field strength characteristics can aid on-site exploration of gas accumulation areas.
- Electromagnetic wave penetration simulations effectively discriminate abnormal areas with varying inclination characteristics. The responses of abnormal coal zones to electromagnetic wave absorption coefficients vary significantly. Electric field profiles at varying angles are formed at different test points along the intake airflow roadway and return airway, enabling the localization of anomalies in three-dimensional space [60].
- The three-dimensional slicing method is employed to analyze the field strength values of the received electric field and imaging position, enabling comprehensive consideration of the size, depth, and specific location of anomalies in the coal seam, thereby visualizing the imaging results.
- By analyzing field strength attenuation data from electromagnetic wave penetration at 158 measurement points in a specific working face of Wugou Coal Mine, Anhui Province, and comparing the results, the numerical forward simulation proposed in this study delineates hidden geological structures. In the anomalous area of the working face, the electric field intensity exhibits significant attenuation. The forward simulation results clearly delineate the boundary of the anomalous area, revealing a cliff-like decrease in surrounding electromagnetic wave field strength. This area is inferred to be a large fissure zone formed by faults and potentially containing gas, consistent with actual exploration results.
- The 3D-FDTD method for spatial modeling of coal seam radio wave penetration proposed in this study can simplify, to some extent, the identification of anomalous areas following electromagnetic wave penetration, providing a reference simulation and analysis method for mine radio wave penetration based on Three-Dimensional Finite-Difference Time-Domain (3D-FDTD) modeling. Future work will focus on investigating various geological heterogeneity models to adapt to different types of hidden geological structure detection and inversion interpretation.
These results confirm the model’s predictive ability. It should be noted that the current implementation is intended for offline use due to computational demands. Future work may focus on accelerating the model for real-time deployment. The novelty of this study lies in the establishment of a conductivity-weighted 3D-FDTD model specifically calibrated for complex coal seam environments, which significantly improves the accuracy of fault boundary detection compared to traditional linear inversion methods.
Author Contributions
Conceptualization, K.Y. and W.Z.; Methodology, K.Y. and W.Z.; Software, K.Y.; Validation, Y.W., J.D., X.L. and Y.K.; Formal analysis, K.Y., W.Z., Z.J. and Z.B.; Investigation, K.Y., Y.W., J.D., X.L., Y.K., Z.J. and Z.B.; Resources, W.Z.; Data curation, K.Y., Y.W. and J.D.; Writing—original draft preparation, K.Y. and J.D.; Writing—review and editing, W.Z., Y.W., X.L., Y.K., Z.J. and Z.B.; Visualization, K.Y.; Supervision, W.Z.; Project administration, W.Z.; Funding acquisition, W.Z. All authors have read and agreed to the published version of the manuscript.
Funding
This research was funded by the Yunnan Fundamental Research Projects (Grant Nos. 202501AS070170 and 202404CC110017), the National Natural Science Foundation of China (Grant No. 62162036), and the Yunnan Revitalization Talent Support Program (Grant No. YNQR-QNRC-2019-085).
Institutional Review Board Statement
Not applicable.
Informed Consent Statement
Not applicable.
Data Availability Statement
The data supporting the findings of this study are available from the corresponding author upon reasonable request. Restrictions apply due to confidentiality and mine safety considerations.
Conflicts of Interest
The authors declare no conflict of interest. The funders had no role in the design of the study; in the collection, analyses, or interpretation of data; in the writing of the manuscript; or in the decision to publish the results.
Abbreviations
The following abbreviations are used in this manuscript:
| 3D-FDTD | Three-Dimensional Finite-Difference Time-Domain |
| FDTD | Finite-Difference Time-Domain |
| WKT-E | Intrinsically Safe Radio Wave Prospecting Instrument (Model WKT-E) |
| PML | Perfectly Matched Layer |
| CFL | Courant–Friedrichs–Lewy (Stability Condition) |
| TI | Transversely Isotropic |
| RMSE | Root Mean Square Error |
| SNR | Signal-to-Noise Ratio |
| EMI | Electromagnetic Interference |
| PDA | Personal Digital Assistant |
| F.S. | Full Scale |
| APC | Article Processing Charge |
| CT | Computed Tomography |
| P1s | Lower Permian Shanxi Formation |
References
- Qiu, Z.; Liu, Q.; Li, X.; Zhang, J.; Zhang, Y. Construction and analysis of a coal mine accident causation network based on text mining. Process Saf. Environ. Prot. 2021, 153, 320–328. [Google Scholar] [CrossRef] [Scilit]
- Zheng, X.; Ding, W.; Huang, Y.; Cai, G.; Ma, Y.; Liu, S.; Zhou, B. A Review of Ultra-Wideband Radar Detection of Respiratory and Heartbeat Signals in Different Application Fields. J. Radars 2025, 14, 204. [Google Scholar] [CrossRef]
- Fu, G.; Xie, X.; Jia, Q.; Tong, W.; Ge, Y. Accidents analysis and prevention of coal and gas outburst: Understanding human errors in accidents. Process Saf. Environ. Prot. 2020, 134, 1–23. [Google Scholar] [CrossRef] [Scilit]
- Guo, Z.; Xue, G.; Liu, J.; Wu, X. Electromagnetic methods for mineral exploration in China: A review. Ore Geol. Rev. 2020, 118, 103357. [Google Scholar] [CrossRef] [Scilit]
- Tang, Y.; Chen, J.; Peng, L. Study of tectonic coal by radio-wave pit perspective. J. China Coal Soc. 2002, 27, 254–258. (In Chinese) [Google Scholar]
- Zhang, H.; Wang, G.; Shi, Z.; Zhang, P. Advances in estimation of aquifer hydrogeological parameters based on microfluctuations of groundwater level. Bull. Geol. Sci. Technol. 2023, 42, 138–146. [Google Scholar]
- Hou, Y.; Zhang, H.; Mao, S.; Sun, Z.; Li, M.; Chen, H. Adaptive intelligent cutting technology of coal shearers based on a high-precision three-dimensional dynamic geological model. J. Min. Sci. Technol. 2023, 8, 26–38. [Google Scholar] [CrossRef]
- Zheng, X.; Huang, Y.; Sun, Z.; Guo, J.; Guo, H.; Ding, W. Post-Collapse Mine Rescue Using Ultra-Wideband Radar: Electromagnetic-Wave Attenuation Mechanisms and Key Influencing Factors in Coal, Rock, and Stratified Composite Media. Process Saf. Environ. Prot. 2025, 198, 107114. [Google Scholar] [CrossRef] [Scilit]
- Fadden, C.; Kothapalli, S.-R. A Single Simulation Platform for Hybrid Photoacoustic and RF-Acoustic Computed Tomography. Appl. Sci. 2018, 8, 1568. [Google Scholar] [CrossRef] [Scilit]
- Miao, D.; Lv, Y.; Yu, K.; Liu, L.; Jiang, J. Research on coal mine hidden danger analysis and risk early warning technology based on data mining in China. Process Saf. Environ. Prot. 2023, 171, 1–17. [Google Scholar] [CrossRef] [Scilit]
- Gong, Y.; Xie, X. Research on coal mine underground image recognition technology based on homomorphic filtering method. Coal Sci. Technol. 2023, 51, 241–250. [Google Scholar]
- Zhang, Z.; Nie, B.; Ma, C.; Liu, X.; Li, Y.; Li, C. A study of high-intensity high voltage electric pulse fracturing—A perspective on the energy distribution of shock waves. Geoenergy Sci. Eng. 2025, 249, 213791. [Google Scholar] [CrossRef] [Scilit]
- Tong, X.; Jiang, Z.; Xing, T.; Li, M.; Liu, S.; Niu, Y. Transient electromagnetic perspective technology in the ultra-long coal mining face. J. Appl. Geophys. 2024, 223, 105353. [Google Scholar] [CrossRef] [Scilit]
- Xu, P.; Lu, J.; Zhang, Z. Optimization design and research on observing system for radio wave penetration method explore coal mine working-face. In Proceedings of the 7th Academic Conference of Geology Resource Management and Sustainable Development, Beijing, China, 29 December 2019; pp. 246–252. [Google Scholar]
- Wu, Y.; Wang, W.; Zhu, G.; Wang, P. Application of seismic multiattribute machine learning to determine coal strata thickness. J. Geophys. Eng. 2021, 18, 834–844. [Google Scholar] [CrossRef] [Scilit]
- Gomez-Perez, P.; Cuinas, I. Degradation of ground-based radar performance due to vegetation cover. Measurement 2016, 92, 230–235. [Google Scholar] [CrossRef] [Scilit]
- Xu, Z.; Sun, Y.; Gao, S.; Chen, H.; Yao, M.; Li, X. Comprehensive exploration, safety evaluation and grouting of karst collapse columns in the Yangjian coalmine of the Shanxi Province, China. Carbonates Evaporites 2021, 36, 16. [Google Scholar] [CrossRef] [Scilit]
- Qu, X.; Qiu, N. Application of multi-frequency radio wave penetration technology in the Yanmazhuang coal mine. West-China Explor. Eng. 2019, 31, 107–109. (In Chinese) [Google Scholar]
- Feng, G.; Xie, H.; Meng, Q.; Wu, F.; Li, G. Advanced coal, petroleum, and natural gas exploration technology. Energies 2022, 15, 8976. [Google Scholar] [CrossRef] [Scilit]
- Li, H. Geological survey on breakthrough section of the large-section karst tunnel by radio wave penetration method. Mod. Tunn. Technol. 2019, 56, 38–42. [Google Scholar]
- Zhang, M.; Fan, X.; Zhang, Q.; Yang, B.; Zhao, P.; Yao, B.; Ran, J. Parametric sensitivity study of wellbore stability in transversely isotropic medium based on polyaxial strength criteria. J. Pet. Sci. Eng. 2021, 197, 108078. [Google Scholar] [CrossRef] [Scilit]
- Gao, R.; Bai, D.; Yu, B.; Tai, Y.; Meng, X.; Zhang, W. Ground fracturing of multi-strata for strong ground pressure control in extra-thick coal seams with hard roofs: Numerical simulation and case study. Eng. Fract. Mech. 2024, 303, 110129. [Google Scholar] [CrossRef] [Scilit]
- Fan, Z.; Song, X.; Wang, D.; Ayasrah, M.T.; Li, S. Poroelastic solutions of a semipermeable borehole under nonhydrostatic in situ stresses within transversely isotropic media. Int. J. Geomech. 2025, 25, 4024342. [Google Scholar] [CrossRef] [Scilit]
- Wagner, S.; Griepentrog, H.W.; Ramos, A.; Zhou, J.; Slob, E. System-based specifications for better design of ground-penetrating radar antennas. IET Microwaves Antennas Propag. 2023, 17, 478–493. [Google Scholar] [CrossRef] [Scilit]
- Eide, S.; Hamran, S.-E.; Dypvik, H.; Amundsen, H.E.F. Ground-penetrating radar modeling across the Jezero crater floor. IEEE J. Sel. Top. Appl. Earth Obs. Remote Sens. 2021, 14, 2484–2493. [Google Scholar] [CrossRef] [Scilit]
- Qiao, B.; Lu, Y.; Li, Q.; Huang, Y.; Liang, S. Data-driven reflection imaging based on seismic interferometry. Geophysics 2022, 87, Q15–Q29. [Google Scholar] [CrossRef] [Scilit]
- Xue, J.; Fan, K.; Wu, X.; Li, W.; Guo, Q. Progress of the pseudoseismic imaging technology for transient electromagnetic method. J. Appl. Geophys. 2025, 233, 105600. [Google Scholar] [CrossRef] [Scilit]
- Kang, Y.; Xu, Y.; Wang, Y.; Wu, Y.; Tan, Q. Underground transient electromagnetic real-time imaging system for coal mine water disasters. Measurement 2022, 203, 111709. [Google Scholar] [CrossRef] [Scilit]
- Wu, Y.; Jiang, C.; Huang, X.; Xu, H.; Jiang, Q.; Jiang, G.; Li, C. Development and application of calibration amplitude radio wave perspective system with communication function. Coal Eng. 1998, 3, 5–6, 39. (In Chinese) [Google Scholar]
- Sun, W. Application of WKT-E wireless electromagnetic wave perspective in detecting mine collapse column. Energy Energy Conserv. 2018, 3, 164–166. (In Chinese) [Google Scholar]
- Yu, X. Research and Application of Radio Wave Large Perspective Distance Detection Technology for Geological Disaster-Causing Bodies in Mine Working Face. Master’s Thesis, Chongqing University, Chongqing, China, 2023. [Google Scholar]
- Dong, S.; Huang, Y.; Jin, Y.; Yang, G.; Nie, A.; Qi, X.; Cheng, Y.; Wu, H. Development status and trend of high-density 3D seismic exploration technology for coal fields. Coal Geol. Explor. 2023, 51, 22. [Google Scholar]
- Xu, X.; Zhu, X.; Li, T.; Liu, F.; Liang, P. Research on directional borehole radar detection technology in coal mines. J. Min. Sci. Technol. 2025, 10, 14–23. [Google Scholar] [CrossRef]
- Kuzenov, V.V.; Ryzhkov, S.V.; Varaksin, A.Y. Development of a Method for Solving Elliptic Differential Equations Based on a Nonlinear Compact-Polynomial Scheme. J. Comput. Appl. Math. 2024, 451, 116098. [Google Scholar] [CrossRef] [Scilit]
- Li, S.; Wang, X.; Lin, T. Numerical simulation of 3D ground penetrating radar based on gprMax for the road cavity. Chin. J. Geol. Hazard Control 2020, 31, 132–138. [Google Scholar]
- Li, F.; Wen, L.; Zheng, G. Half-space TEM 3D FDTD forward modeling based on whole-space initial field. Prog. Geophys. 2022, 37, 2147–2155. (In Chinese) [Google Scholar]
- Commer, M.; Hoversten, G.M.; Um, E.S. Transient-electromagnetic finite-difference time-domain earth modeling over steel infrastructure. Geophysics 2015, 80, E147–E162. [Google Scholar] [CrossRef] [Scilit]
- Han, J.; Gu, B.; Zhu, G.; Liu, Z. High-precision depth domain migration method in imaging of 3D seismic data in coalfield. Remote Sens. 2022, 14, 2850. [Google Scholar] [CrossRef] [Scilit]
- Li, J.; Cai, Y.; Zhao, L. Advances in exploration, development and utilization of coal and coal-related resources: An overview. Energies 2022, 15, 9304. [Google Scholar] [CrossRef] [Scilit]
- Pei, X. Signal acquisition method for 3D seismic exploration in high density coal mining area. Arab. J. Geosci. 2020, 13, 712. [Google Scholar] [CrossRef] [Scilit]
- Wang, T.; Han, X.; Deng, J.; Sun, Y.; Li, Z.; Tang, S.; Mao, S.; Lin, Z.; Li, C.; Zhao, X.; et al. Orientation and major research problems of coal geological exploration in China under new conditions. Coal Geol. Explor. 2023, 51, 3. [Google Scholar]
- Yang, H. Hydrogeological exploration technology for the Longdong coal mine goaf based on the transient electromagnetic method. Geol. Explor. 2023, 59, 883–890. (In Chinese) [Google Scholar]
- Yang, Y.; Liu, S.; Chen, F.; Chen, H.; Zhang, T.; Han, Y.; Jia, M. Exploring multiple electrical layers overlying coal seams using the transient electromagnetic method. PLoS ONE 2022, 17, e0273423. [Google Scholar] [CrossRef] [Scilit]
- Yang, Y.; Xiong, B.; Peng, S.; Liu, S.; Chen, H.; Zhang, T. Exploring weathered and oxidized zones of coal seams using the transient electromagnetic method. Energy Explor. Exploit. 2022, 40, 1634–1648. [Google Scholar] [CrossRef] [Scilit]
- Wang, T.; Sun, J.; Lin, Z.; Fang, H.; Wang, Y.; Liu, Y. Coordinated exploration model and its application to coal and coal-associated deposits in coal basins of China. Acta Geol. Sin.-Engl. Ed. 2021, 95, 1346–1356. [Google Scholar] [CrossRef] [Scilit]
- Wu, R.; Pang, Y.; Hu, Z. Research progress of radio wave detection technology in coal face. Prog. Geophys. 2022, 37, 2196–2204. (In Chinese) [Google Scholar]
- Zhang, L.; Xu, L.; Xiao, Y.; Zhang, N. Application of comprehensive geophysical prospecting method in water accumulation exploration of multilayer goaf in integrated mine. Adv. Civ. Eng. 2021, 2021, 1434893. [Google Scholar] [CrossRef] [Scilit]
- Guo, C.; Tan, T.; Wu, X.; Zhang, H.; Chen, Y.; Ma, L. An immune genetic algorithm for electromagnetic wave computerized tomography in underground mining in order to promote accurate exploration and environmentally friendly development. Fresenius Environ. Bull. 2022, 31, 3300–3308. [Google Scholar]
- Luo, X.; Gong, S.; Huo, Z.; Li, H.; Ding, X. Application of comprehensive geophysical prospecting method in the exploration of coal mined-out areas. Adv. Civ. Eng. 2019, 2019, 2368402. [Google Scholar] [CrossRef] [Scilit]
- Su, B.; Yu, J.; Sheng, C. Borehole electromagnetic method for exploration of coal mining goaf. Elektron. Ir Elektrotechnika 2016, 22, 37–40. [Google Scholar] [CrossRef] [Scilit]
- Xu, P.; Liu, J. Iteration-based temporal subgridding method for the finite-difference time-domain algorithm. Mathematics 2024, 12, 302. [Google Scholar] [CrossRef] [Scilit]
- Chen, D. Research on Reverse Time Migration Based on High-Order FDTD. Master’s Thesis, East China Normal University, Shanghai, China, 2023. [Google Scholar]
- Ma, W.; Zou, W.; Zhang, J.; Li, G. Prediction of shear strength in anisotropic structural planes considering size effects. Designs 2025, 9, 17. [Google Scholar] [CrossRef] [Scilit]
- Fan, J.; Ma, T.; Zhu, Y.; Zhang, Y. Ground penetrating radar detection of buried depth of pavement internal crack in asphalt surface: A study based on multiphase heterogeneous model. Measurement 2023, 221, 113531. [Google Scholar] [CrossRef] [Scilit]
- Gao, C.; Wu, Y. Research on three-dimensional forward modeling of underground radio wave perspective and electromagnetic wave propagation characteristics. Saf. Coal Mines 2024, 55, 191–197. (In Chinese) [Google Scholar]
- Choroszucho, A.; Szczegielniak, T.; Kusiak, D. Application of the FDTD method to analyze the influence of brick complexity on electromagnetic wave propagation. Energies 2024, 17, 5168. [Google Scholar] [CrossRef] [Scilit]
- Yang, S.; Wu, Y.; Lu, P.; Liu, Z. Forward modeling for the fine detection of geological abnormal area in coal seams using high-frequency radio imaging method. IEEE J. Sel. Top. Appl. Earth Obs. Remote Sens. 2024, 17, 817–828. [Google Scholar] [CrossRef] [Scilit]
- Zhang, M.; Fan, X.; Zhang, Q.; Yang, B.; Zhao, P.; Yao, B.; He, L. Influence of multi-planes of weakness on unstable zones near wellbore wall in a fractured formation. J. Nat. Gas Sci. Eng. 2021, 93, 104026. [Google Scholar] [CrossRef] [Scilit]
- Zheglova, P.; Cvetkovic, F.; Ajo-Franklin, M. Full waveform inversion of cross-hole radio frequency electromagnetic data. Geophys. J. Int. 2024, 239, ggae247. [Google Scholar] [CrossRef] [Scilit]
- Wu, R.; Jiang, Z.; Guo, L.; Ou, Y. Combined imaging and analysis of electromagnetic wave CT in shallow underground space. J. Anhui Univ. Sci. Technol. Natural Sci. 2022, 42, 9–13. [Google Scholar]
Disclaimer/Publisher’s Note: The statements, opinions and data contained in all publications are solely those of the individual author(s) and contributor(s) and not of MDPI and/or the editor(s). MDPI and/or the editor(s) disclaim responsibility for any injury to people or property resulting from any ideas, methods, instructions or products referred to in the content. |
© 2026 by the authors. Licensee MDPI, Basel, Switzerland. This article is an open access article distributed under the terms and conditions of the Creative Commons Attribution (CC BY) license.