Article

Natural Biopreservation of Sea Bream Fillets Using Bioactive Fractions Extracted from Echinoderms


by
Valentina Lazzara
1,2,*,†,
Fortunato Cirlincione
3,*,†,
Gaetano Cammilleri
4,
Luca Settanni
5,
Vincenzo Arizza
1,
Antonello Cicero
4,
Vincenzo Ferrantelli
4,
Rosalia Nicolosi
1 and
Mirella Vazzana
1
1
Department of Biological, Chemical and Pharmaceutical Sciences and Technologies (STEBICEF), University of Palermo, 90128 Palermo, Italy
2
Department of Economics, Business and Statistics (dSEAS), University of Palermo, 90128 Palermo, Italy
3
Department of Soil, Plant and Food Sciences (DiSSPA), University of Bari Aldo Moro, Via Amendola 165/A, 70126 Bari, Italy
4
Istituto Zooprofilattico Sperimentale Della Sicilia “A. Mirri”, Via Gino Marinuzzi 3, 90129 Palermo, Italy
5
Department of Agricultural, Food and Forest Sciences, University of Palermo, Viale delle Scienze 4, 90128 Palermo, Italy
*
Authors to whom correspondence should be addressed.
†
These authors contributed equally to this work.
Appl. Sci. 2026, 16(19), 9931; https://doi.org/10.3390/app16199931 (registering DOI)
Submission received: 8 July 2026 / Revised: 29 September 2026 / Accepted: 4 October 2026 / Published: 8 October 2026
(This article belongs to the Special Issue Advances in Food Safety and Microbial Control, 2nd Edition)

Featured Application

This study explores the use of sea cucumber extract (Holothuria tubulosa) as a natural food biopreservative. Since the extract inhibits bacterial growth in vitro, particularly that of Gram-positive bacteria, applying the extract to fresh fish (sea bream fillets) may help slow the spoilage process and support shelf life. Potential applications include supporting the shelf life and freshness of commercial seafood products using a “clean label” marine-derived alternative to synthetic chemical preservatives.

Abstract

In the last decade, researchers’ attention has focused on the study of antimicrobial peptides (AMPs), small protein molecules that constitute the first line of defence of organisms against a great variety of external agents, and they have been isolated from several prokaryotic and eukaryotic organisms, such as echinoderms. In this study, the extracts of Arbacia lixula (sea urchin) and Holothuria tubulosa (sea cucumber) coelomocytes were tested to evaluate their antimicrobial activity. The results highlighted the greater antibacterial efficacy of sea cucumber compared to sea urchin. For this reason, to evaluate the efficacy as natural preservatives, sea cucumber extract was dispensed on pieces of sea bream fillets (Sparus aurata). The results obtained showed that the H. tubulosa extract exerted a selective inhibitory effect on specific bacterial groups (staphylococci and presumptive E. coli) and contributed to better-preserved freshness of the product, as indicated by the assessment performed with the modified Quality Index Method (QIM).

1. Introduction

The characteristics of fish, such as a greater amount of water in the tissues, different protein structure, presence of non-protein nitrogenous compounds in the muscles, and a very low percentage of carbohydrates, make it more perishable compared to the meat of slaughter animals [1]. In fact, after capture, fish can easily deteriorate due to the presence of endogenous enzymes and the rapid growth of the microorganisms naturally present in fish or derived from them, causing protein degradation and lipid oxidation, thus altering fish odour, flavour, and texture [2]. In addition to the evaluation of the bacterial load, among the various quality indices used to evaluate the degree of freshness of fish, there are physical and biochemical indices. The accumulation of hypoxanthine in fish tissue determines the initial phases of autolytic enzymatic deterioration, responsible for bacterial spoilage during storage, and thus its measurement is used in fish quality assessments. Another important parameter to evaluate in fish and fishery products is the content of biogenic amines and, more specifically, histamine. The increase in histamine levels in fish can be very rapid due to the intensive growth of microorganisms. Moreover, the degree of fish lipid oxidation is directly related to malondialdehyde. In fact, secondary oxidation products are the source of characteristic rancid off-odours and flavours of oxidised lipids [3].
The sensory and physical properties of fish are evaluated using an objective quality assessment method, known as the Quality Index Method (QIM), which involves, for example, the evaluation of skin, texture, and odour [4]. Food additives of chemical synthesis are widely applied to prolong the conservation of food products because they prevent the deterioration caused by microorganisms and chemical reactions responsible for the alteration of fats and colour variations [5]. However, these compounds are potentially toxic; thus, their concentrations must be strictly regulated [6]. In view of replacing substances of synthetic origin with natural molecules which are safer for consumers, several studies provided strong evidence that the shelf life of packed products can be extended through the application of modified atmospheres or preservatives of natural origin [7,8,9,10,11]. Natural preservatives derive from a variety of sources, including plants, animals, and bacteria. The study of Maghami and colleagues [12] showed how coating of fish fillets with chitosan nanoparticles and fennel essential oil, known for its antimicrobial and antioxidant activities, contributed in a significant way to enhancing the shelf life of Huso huso fillets during storage. Recent comparative surveys by Solinho et al. [13] compared different packaging solutions to improve the Atlantic bonito fillets’ shelf life during refrigeration. Among marine animals, echinoderms represent an important source of bioactive substances [14,15,16]. The biological potential of echinoderm extracts and their value are demonstrated, for example, by the consistent marketing of dietary supplements based on sea cucumber extracts. Their tissues are rich in proteins, minerals, vitamins, and essential fatty acids, have immune-stimulating properties, and contain molecules, such as chondroitin sulphate and triterpenoids, capable of bringing general benefit to human health [17]. In a recent review, the authors Saeid, Dave, and Shahidi [18] highlighted the potential of polysaccharides extracted from echinoderms as new nutrients that could be used to prevent diet-related diseases.
In particular, natural extracts from sea cucumber have been widely shown to have beneficial effects, including anti-inflammatory and anti-tumour effects [19,20,21]. Among the molecules present in these animals, antimicrobial peptides (AMPs) have been identified. These are a class of small, evolutionarily conserved molecules and represent the first line of defence of all organisms, from simple prokaryotes to humans [22].
The AMPs isolated from echinoderm coelomocytes showed interesting antimicrobial activity [23], such as being used in a food biopreservation strategy [24]. In particular, our group highlighted the presence of two new antimicrobial peptides, Holothuroidin 1 and Holothuroidin 2, extracted from coelomocytes of Holothuria tubulosa, that showed broad antimicrobial activity against many Gram-positive and Gram-negative pathogens tested [25]. A more recent proteomic characterisation of the H. tubulosa coelomic fluid further expanded this picture, identifying 174 unique proteins across its humoral and cellular components and computationally ranking 40 candidate peptides with antioxidant and anti-inflammatory potential [26].
Although several beneficial biological activities of AMPs are known, and some of them are currently in clinical use or under human clinical trials [27], Guryanova and Ovchinnikova [28] have recently reported that antimicrobial peptides, particularly from plants, could also show some allergenic properties [28].
Following the results of our previous studies, in this work we evaluated the antimicrobial activity of crude coelomocyte extracts (CsE) derived from two species of echinoderms, Arbacia lixula and Holothuria tubulosa, in order to assess their potential as biopreservatives for seafood products. The extracts were tested against bacterial species causing the most common food-borne diseases through fish and seafood. Furthermore, an in situ evaluation of the antimicrobial effect of the H. tubulosa CsE was carried out on packed sea bream (Sparus aurata) fillets by performing microbiological analysis. Moreover, the amounts of three substances, such as histamine, xanthine, and malondialdehyde, were quantified in the samples by performing biochemical analysis in order to evaluate the level of freshness and the quality of the stored product. Unlike our previous work, in which Holothuroidin 1 and 2 were isolated and characterised as purified peptides [25], the present study did not isolate these peptides but tested the crude extract directly on a real food matrix under refrigerated storage.

2. Materials and Methods

2.1. Invertebrates Used for the Preparation of the Extracts

The animals, A. lixula and H. tubulosa, were collected by diving in the Gulf of Palermo (Mongerbino: 38°06.00′ N; 13°30.00′ E), at a depth of 10 m, close to a Posidonia oceanica meadow, and kept until use in 360 L aquaria filled with artificial seawater (0.425 M NaCl; 9 mM KCl; 9.3 mM CaCl2·2H2O; 0.0255 M MgSO4·7H2O; 0.023 MgCl2·6H2O; 2 mM NaHCO3 pH 8.0). The aquaria were fitted with a sand filter and sand bed on the bottom and maintained at 15 ± 2 °C. The animals were kept in aquaria for a week for acclimation before beginning assays and were fed regularly with commercial invertebrate food (Alga-Mac 3000, BioMarine, Hawthorne, CA, USA).

2.2. Collection of Coelomic Fluid and Coelomocytes

The coelomic fluid (CF) was collected in separate beakers containing 5 mL of ISO-EDTA (0.5 M NaCl, 20 mM Tris-HCl, 30 mM EDTA; pH 8.0) by cutting into the peristomial membrane in A. lixula and by an incision with a scalpel along the anterior–dorsal side, taking care not to injure the internal organs in H. tubulosa. According to a previously described method [25] with some slight modifications, after collection, centrifugation at 2930 rpm for 10 min at 4 °C, cell pellets were obtained, and the supernatant was discarded.

2.3. Cellular Lysate Preparation

Pellets were added to 10% acetic acid in a 3:1 ratio together with antiproteases (1:200). Samples were then sonicated on ice (Vibracell, Sonics & Materials Inc., Newtown, CT, USA) for 2 min and homogenised in a glass potter for 1 min to ensure complete cell rupture. The tubes were centrifuged at 15,500 rpm for 20 min at 4 °C, and the cell lysates were collected. Half the volume of each cell lysate was ultrafiltered to isolate peptides from larger proteins by using tubes with membrane filters in polyethersulfone with a 10 kDa cut-off (spin-X® UF concentrators 10 kDa, CORNING®, Corning, NY, USA) performing centrifugation at 4000 rpm at 4 °C for 3–4 h. The total and the filtered samples were then freeze-dried, and the lyophilizates obtained were resuspended in distilled water. The protein concentrations were measured for each sample using an INVITROGEN Qubit 3.0 fluorometer (Thermo Fisher Scientific, Waltham, MA, USA).

2.4. Microbial Strains

The bacterial strains used as indicators for the inhibition assays of A. lixula and H. tubulosa coelomocyte extracts belong to the culture collection of the Department of Agricultural, Food and Forest Sciences (University of Palermo, Italy) and represent some of the species causing food-borne diseases transferred by fish and seafood. Enterobacter spp. 17UTIN, Enterobacter amnigenus 60A2, Enterobacter cloacae 62A, Listeria monocytogenes 130, 15BO and ATCC 19114, Salmonella enterica serovar Infantis 50270, Salmonella enterica serovar Enteritidis 50431, Salmonella enterica serovar Typhimurium 50432, Staphylococcus aureus 4ADI, C38249.1 and C15634, Staphylococcus haemolyticus ICE182 and Stenotrophomonas maltophilia ICE272 strains were subcultured in Brain Heart Infusion (BHI) broth (Oxoid, Milan, Italy) while Escherichia coli PSS52 in Nutrient broth (Oxoid, Basingstoke, UK). All strains were incubated overnight at 37 °C before antibacterial activity was determined.

2.5. Determination of Antibacterial Activity

The CsE of A. lixula and H. tubulosa were tested against the indicator strains at a concentration of approximately 107 CFU/mL applying the paper disc diffusion method reported by Militello et al. [29]. Briefly, each bacterium was inoculated in BHI or NB soft agar (0.7% w/v), which was overlaid with water agar (2% w/v), and the double-layer agar support was used to test the CsE. Then, 6 mm diameter filter paper discs (Whatman No. 1) were soaked with 10 μL of the extracts and placed on the agar surface. Streptomycin (10% w/v) and sterile water were used as positive and negative controls, respectively. Petri dishes were incubated at 37 °C for 24 h, and the inhibition activity was scored positive only when a clear halo, measured in mm in diameter, was detected around the paper disc. The disc diffusion assay was performed in duplicate (technical repeats) for two independent experiments repeated after one week.

2.6. Experimental Design for Preserving Sea Bream Fillets

The experimental project consists of the following four established time points, starting from the day of the treatment (T0), 3 d after treatment (T3), 7 d after treatment (T7), and 10 d after treatment (T10). The species Sparus aurata (sea bream) was chosen for the tests. Twelve specimens of farmed S. aurata of the same weight and size were purchased.
From each fish, two fillets were obtained, and from them, four pieces of 10 g with approximately the same thickness were cut. From each fish, two fillets were obtained, and each fillet was cut into four pieces of approximately 10 g and similar thickness. For each fillet, one piece was left untreated (control), while the other three pieces were treated with 60 μL of unfiltered H. tubulosa CsE (386 μg/mL), distributed on the surface under sterile conditions. This volume was defined in preliminary trials as the smallest amount that consistently covered the entire surface of each fillet piece. All fillet pieces (controls and treatments) were packed in PA/PE (polyamide/polyethylene) smooth vacuum bags (Table 1) using a vacuum chamber machine and stored under refrigeration (4 °C); separate packs were prepared for microbiological and biochemical analyses. At each storage time, the corresponding packs were opened and analysed destructively. Triplicate samples (technical repeats) were produced for each trial and storage time, and the entire experiment was repeated after two weeks (independent replicates).

2.6.1. Quality Index Method

The freshness of seabream fillets treated with H. tubulosa CsE and control samples was evaluated by a QIM modified from the protocol of Pennisi et al. [30]. The parameters selected for QIM evaluation were appearance of skin, elasticity of flesh, and odour of the fish. QIM evaluation was carried out using the values shown in Table 2.
QIM values were calculated from the scores assigned by seven panellists (adult volunteers, 4 females and 3 males, with ages ranging from 26 to 55) for the selected freshness parameters of treated and untreated samples stored at 4 ± 1 °C at T0, T3, T7, and T10. The assessment was strictly non-ingestive and was limited to visual, olfactory, and texture-related attributes. All panellists were adult volunteers who provided informed consent prior to participation, and no personal, health-related, or other sensitive data were collected. The upper limit of acceptability for sea bream fillet freshness was 6.

2.6.2. Antimicrobial In Situ Efficacy of H. tubulosa CsE

The antimicrobial activity of sea cucumber CsE was evaluated on fresh sea bream fillet pieces by the plate count technique to estimate the numbers of viable cells of different microbial groups. Microbiological enumeration was performed following the scheme reported by Alfonzo et al. [31]. To this purpose, the entire content (10 g) of each vacuum pack was transferred into stomacher sterile bags and suspended in 90 mL Ringer’s (Sigma-Aldrich, Milan, Italy) solution. The homogenization of the fish samples was performed using the BagMixer®400 stomacher (Interscience, Saint Nom, France) for 2 min at the highest speed. The cell suspensions were then subjected to the decimal serial dilution, plated and incubated as follows: total mesophilic count (TMC) on plate count agar (PCA), incubated aerobically at 30 °C for 72 h; pseudomonads on Pseudomonas agar base (PAB), incubated aerobically at 25 °C for 48 h; members of Listeria genus on Fraser agar incubated aerobically at 37 °C for 24 h; coagulase-positive and coagulase-negative staphylococci on Baird–Parker (BP) agar, incubated aerobically at 37 °C for 24 h; Gram-negative enteric pathogens on Hektoen Enteric Agar (HEA), incubated aerobically at 37 °C for 24 h; enterococci on kanamycin aesculin azide (KAA) agar base, incubated aerobically at 37 °C for 24 h; total coliforms on violet red bile agar (VRBA), incubated aerobically at 37 °C for 24 h; members of Enterobacteriaceae family on violet red bile glucose agar (VRBGA), incubated aerobically at 37 °C for 24 h; and yeasts on yeast extract peptone dextrose (YPD) nutrient agar incubated at 25 °C for 48 h. To inhibit bacterial growth, chloramphenicol (0.05 mg/mL) was added to YPD. Counts obtained on HEA are referred to as presumptive E. coli in this study. Microbiological counts were performed in triplicate.

2.6.3. Xanthine/Hypoxanthine Colorimetric/Fluorometric Assay

The amount of xanthine present in the samples was evaluated using a colorimetric assay kit (Xanthine/Hypoxanthine Colorimetric/Fluorometric Assay Kit, BioVision, Milpitas, CA, USA). Each sample was prepared, and the assay was executed according to the instructions of the protocol provided by the manufacturer.

2.6.4. Histamine Determination

The histamine concentrations of the fish samples were evaluated by Ultra High-Performance Liquid Chromatography (UHPLC) with a diode array detector (DAD) according to the protocol of Cicero et al. [32]. Briefly, 10 g of sample was homogenised using a B-400 mixer (Büchi, Flawil, Switzerland), put into a 50 mL centrifuge test tube, and fortified by adding a 1000 mg/L histamine standard solution. Then, 10 mL of perchloric acid aqueous solution (6%) was added to the weighed sample, and the mixture was vortexed for 1 min. Subsequently, 30 mL of deionized water was added to the same centrifuge test tube, and the sample was vortexed again for 1 min. The mixture was centrifuged for 10 min at 3000 rpm (SL 16 Centrifuge, Thermo Fisher Scientific, Waltham, MA, USA). The supernatant was filtered (0.45 μm) and put into vials for the UHPLC analysis. Analyses were carried out with an Agilent 1290 UHPLC with a DAD (Agilent Technologies, Santa Clara, CA, USA) equipped with a Supelcosil LC-ABZ column (15 cm, 4.6 mm; inside diameter, 5 mm) (Supelco Inc., Bellefonte, PA, USA) with instrument conditions reported before [32]. A certified blank sample spiked with 200 mg/kg of histamine was added and examined every analytical session as a positive control. The method was validated for linearity, Limit of Detection (LoD), Limit of Quantification (LoQ), recovery, and expanded uncertainty parameters by an in-house validation protocol [32], following the ISO/IEC 17025 [33].

2.6.5. ELISA for Malondialdehyde Determination

The amount of malondialdehyde present in fish samples was evaluated using the Enzyme-linked Immunosorbent Assay Kit for Malondialdehyde (MDA) (Cloud-Clone Corp., Katy, TX, USA), and the assay was performed according to the protocol provided by the manufacturer.

2.7. Statistical Analysis

For histamine analysis, all results under the LoD of the method were considered for mean evaluation and statistical analysis as half the LoD value. The data obtained were grouped by condition (control vs. treatment) and time (T0, T3, T7, T10) for the statistical analysis.
QIM scores and histamine, malondialdehyde, and xanthine concentrations were analysed separately using a two-factor design, with experimental group (control and treatment) and storage time as fixed factors. Model assumptions were assessed using the Shapiro–Wilk test on model residuals and Levene’s test for homogeneity of variances. Because the residual normality assumption was not satisfied for histamine, QIM, and malondialdehyde, an aligned rank transform (ART) factorial ANOVA test was used to assess the main effects of experimental group and time and their interaction. For xanthine, residual normality and homogeneity of variances were not rejected; therefore, xanthine concentrations were analysed using a two-way analysis of variance (ANOVA) with experimental group, time, and their interaction as fixed effects. Pairwise comparisons among time points were performed using estimated marginal means, with Tukey adjustment for multiple comparisons. For ART models, pairwise comparisons were performed on the responses aligned and ranked for the effect of storage time. In addition, two sets of simple-effect comparisons were performed for each variable: (i) differences among storage times within each experimental group, with Tukey adjustment, and (ii) differences between control and treated samples at each storage time, with Bonferroni adjustment for the four storage times. For the ART models, these comparisons were performed on the responses aligned and ranked for the experimental group × storage time combinations (ART-C procedure [34]); for xanthine, they were performed on the estimated marginal means of the two-way ANOVA model. The aligned rank transform was implemented with the ARTool package following Wobbrock et al. [35]: for each model term, the response was aligned by removing all effects other than the one of interest and then ranked, and a Type III factorial ANOVA was fitted to the aligned ranks; correct alignment was verified using the diagnostics provided by the package. Effect sizes were expressed as partial eta squared (η2p), computed from the F statistic and the degrees of freedom of each model term, with two-sided 95% confidence intervals derived from the noncentral F distribution. For the ART models, these values refer to the aligned ranks and therefore quantify the proportion of rank variance explained and are not directly comparable with partial eta squared obtained from a parametric ANOVA on the original measurements. For this reason, the treatment effect was additionally quantified on the original observations by Cliff’s delta, with 95% confidence intervals obtained by bootstrap stratified by storage time (20,000 resamples) and by the corresponding probability of superiority. Sample sizes were n = 3 per experimental group and storage time for QIM and xanthine, and n = 6 for histamine and malondialdehyde. Because each fillet piece was analysed destructively at a single storage time, samples collected at different storage times were treated as independent observations. Pieces from the same fish and fillet were allocated to both experimental groups and to different storage times, and the experiment was carried out in two runs. Microbiological counts were compared between control and treated samples at each storage time using Student’s t-test (p ≤ 0.05); these comparisons were not adjusted for multiplicity and are therefore interpreted as exploratory. The statistical analyses were performed in R 4.4.2 software using the R Commander interface and the ARTool, car, emmeans, and effectsize packages.

3. Results

3.1. Antibacterial Activity of A. lixula and H. tubulosa CsE

The results of the inhibitory tests of the echinoderm CsE are reported in Table 3. The inhibitory spectra were evaluated against Gram-negative (enterobacteria and Stenotrophomonas) and Gram-positive (staphylococci and L. monocytogenes) bacteria. Regarding Holothuria CsE, a clear reduction in activity due to filtration was noticed, since all 15 bacteria used as indicators were inhibited by the unfiltered extract, while E. coli PSS52, Salm. Infantis 50270, Salm. Typhimurium 50432, Salm. Enteritidis 50431, Enterobacter spp. 17UTIN, Ent. amnigenus 60A2 and Sn. maltophilia ICE272 were not affected by filtered extracts. Furthermore, when positive, the activity of filtered Holothuria CsE was lower than that estimated in the presence of the unfiltered extract for several strains (L. monocytogenes 15BO and 130, Ent. cloacae 62A, S. haemolyticus ICE182 and S. aureus 4ADI).
A very limited inhibitory activity was registered in the presence of both filtered and unfiltered Arbacia CsE. Regarding the last species, the filtration step did not cause a clear reduction in activity because E. coli PSS52 was only inhibited by the unfiltered extract, while S. aureus C15634 did not grow in the presence of the filtered one.
Overall, the disc diffusion assay showed a markedly broader and stronger inhibitory spectrum for H. tubulosa CsE than for A. lixula CsE (Table 3), including consistent activity against Gram-positive pathogens. On this basis, H. tubulosa CsE alone was carried forward, in its unfiltered form, to the in situ preservation trial on sea bream fillets described in the following sections.

3.2. Quality Index Method

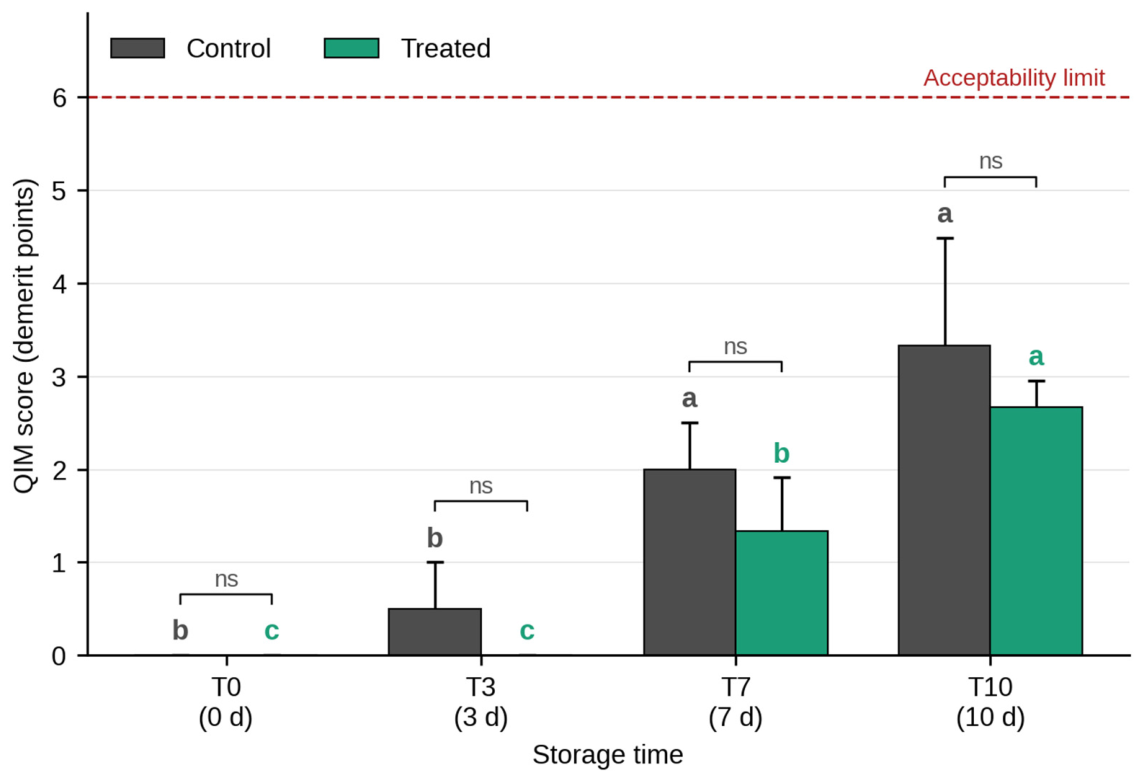
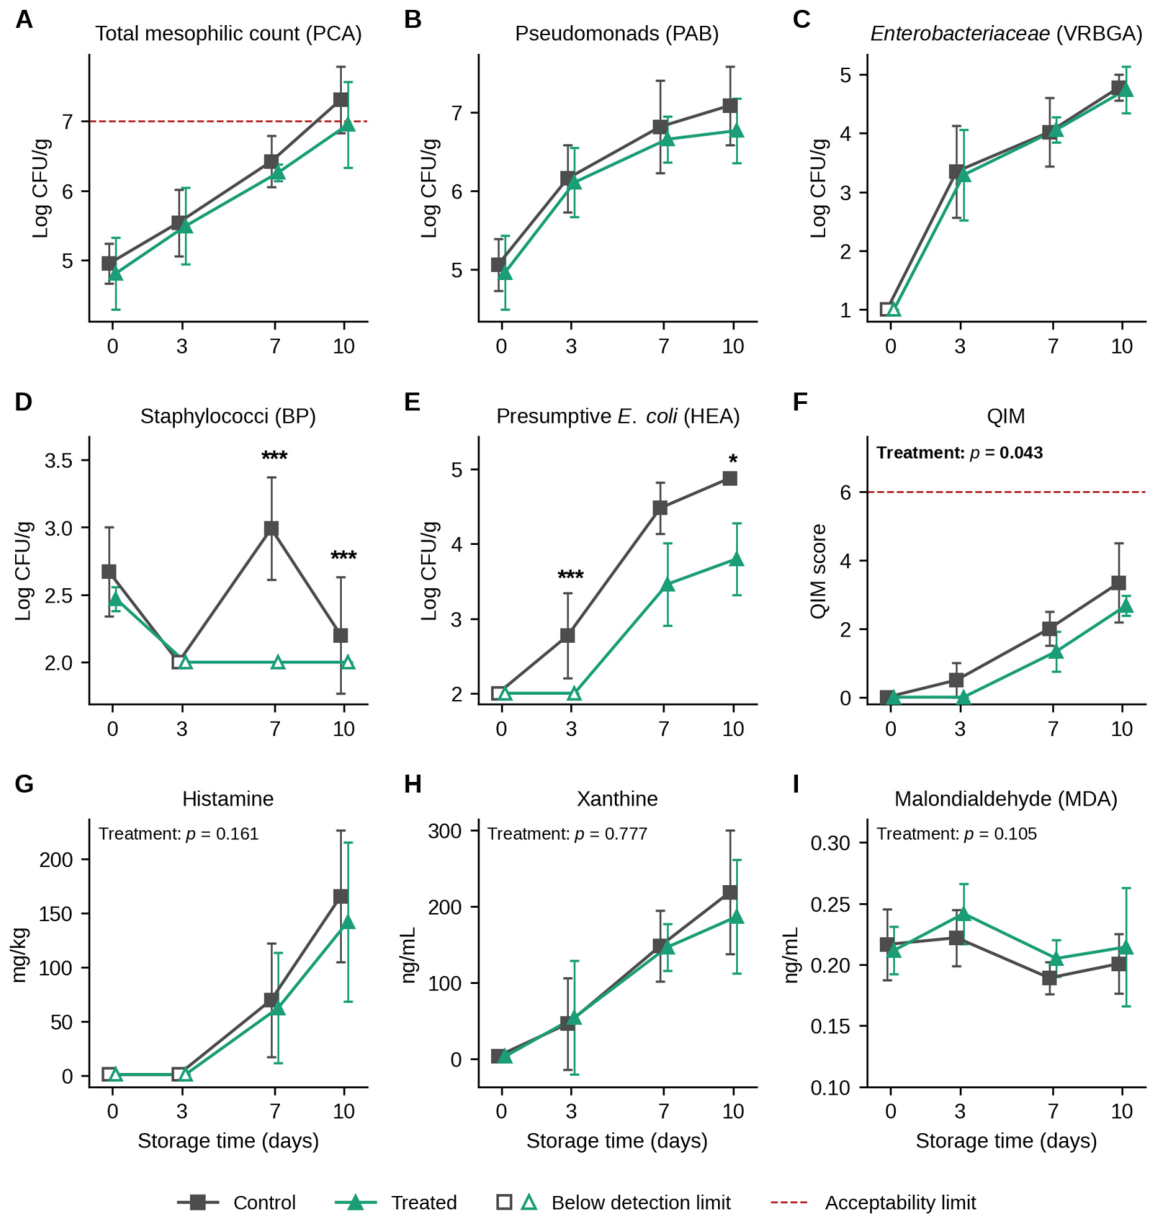
QIM comprises precise quality descriptors and can be used to quickly and easily predict the remaining shelf life of fish [36,37]. This method has been developed for different fish species, considering the intactness of the fish (whole, gutted, or fillets) and the technological treatment used [38]. The results of the QIM evaluation sorted by storage time are shown in Figure 1. None of the samples analysed reached the predetermined limit of acceptability. In fact, the maximum mean score, equal to 3.33 ± 1.15, was achieved by the control samples at T10.
The ART factorial ANOVA revealed a significant effect of both experimental group (F = 4.84, p = 0.043) and storage time (F = 39.58, p < 0.001), whereas the interaction between experimental group and storage time was not significant (F = 1.24, p = 0.328). Overall, the treated samples showed significantly lower QIM scores than controls, indicating better preservation of sensory freshness during refrigerated storage.
Tukey-adjusted pairwise comparisons showed no significant difference between T0 and T3 (p = 0.117), whereas QIM scores significantly increased between T0 and T7 (p < 0.001), T0 and T10 (p < 0.001), T3 and T7 (p = 0.002), T3 and T10 (p < 0.001), and T7 and T10 (p = 0.038). When each group was analysed separately, QIM scores increased significantly during storage in both control and treated samples (Figure 1); however, the difference between control and treated samples did not reach statistical significance at any single storage time (Bonferroni-adjusted p ≥ 0.138), indicating that the overall treatment effect reflects a small but consistent difference across the storage period rather than a marked difference at a specific time point.

3.3. Effect of H. tubulosa CsE on Fish Microbial Populations

The H. tubulosa CsE, which showed interesting in vitro antibacterial activity, was tested on the surface of sea bream fillets in its unfiltered form to evaluate its in situ effect. For this purpose, nine microbial groups naturally contaminating fish fillets [31,39] were monitored during refrigerated storage (Table 4).
The initial level of TMC on sea bream fillets was 4.95 Log CFU/g, slightly lower than that reported by Ntzimani et al. [40] for gutted gilthead sea bream at the beginning of storage. At the end of storage, TMC values reached 7.31 and 6.95 Log CFU/g in control and treated samples, respectively. Although the treated fillets exhibited numerically lower counts, the differences were not statistically significant. Considering that microbial loads around 7 Log CFU/g are frequently regarded as indicative of the end of acceptable microbiological quality in fresh fish products [41], both treatments approached this threshold by day 10. Therefore, the microbiological results do not provide unequivocal evidence of a substantial extension of microbiological shelf life following treatment with H. tubulosa CsE.
Overall, TMC, pseudomonads, members of the Enterobacteriaceae family (including coliforms), and presumptive E. coli increased during storage. However, few significant differences were observed between fillets treated with H. tubulosa CsE and the control samples. The most evident effect was observed for presumptive E. coli, whose counts were significantly lower in treated samples at days 3 and 10. Likewise, coagulase-negative staphylococci decreased below the detection limit after 3 days in both groups but reappeared during storage only in the control samples. Yeasts remained relatively stable during the first 7 days of storage and increased by about 1 Log cycle at day 10, with no significant effect of the treatment. Similarly, no significant differences were detected for total mesophilic bacteria, pseudomonads, enterococci, coliforms, or Enterobacteriaceae.
Taken together, these results suggest that H. tubulosa CsE may exert a selective inhibitory effect against specific bacterial groups rather than a broad-spectrum antimicrobial activity under the conditions tested. Therefore, the extract should be regarded as a promising biopreservative candidate whose effectiveness requires further investigation, including studies evaluating dose–response relationships and its impact under different storage and processing conditions.

3.4. Evaluation of Malondialdehyde Concentration

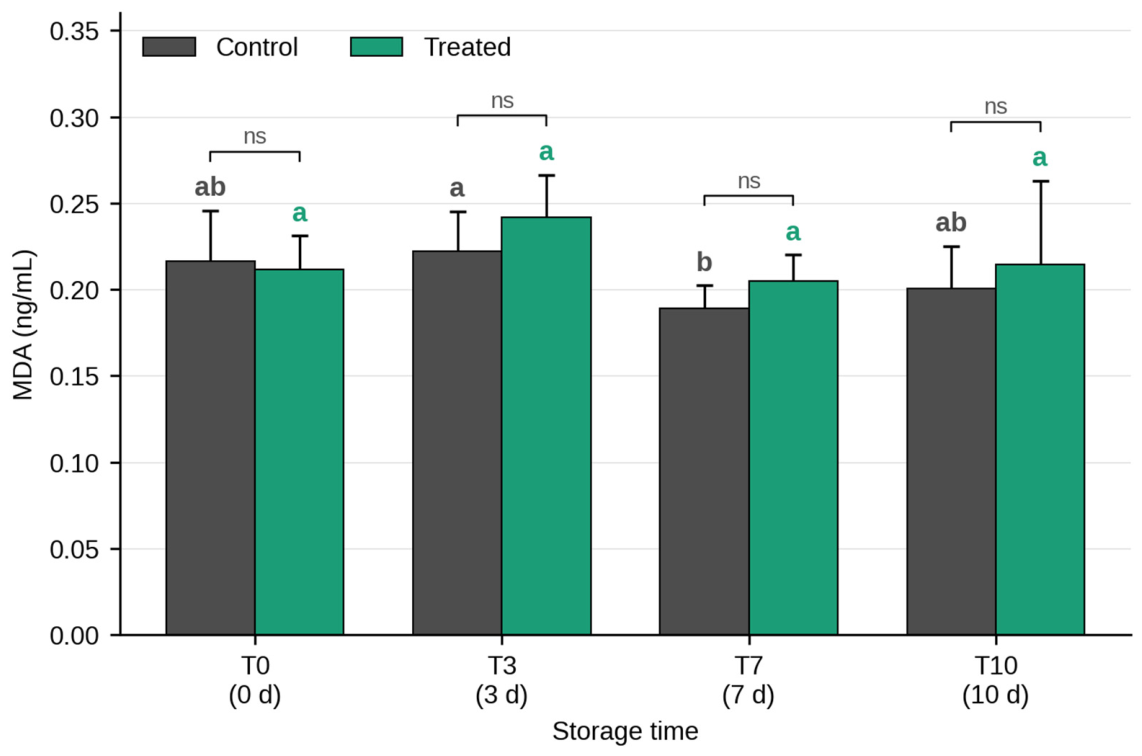
The presence of MDA, a marker of lipid peroxidation, was evaluated in both control and treated sea bream samples by an ELISA assay. The results are shown in Figure 2. The values of MDA, expressed in ng/mL, ranged from 0.19 to 0.24 ng/mL. The ART factorial ANOVA showed a significant effect of storage time (F = 5.37, p = 0.003), whereas neither the experimental group (F = 2.74, p = 0.105) nor the experimental group × time interaction (F = 0.71, p = 0.552) was statistically significant. Tukey-adjusted comparisons showed higher MDA levels at T3 than at T7 (p = 0.002) and T10 (p = 0.035), with no other significant differences between storage times. Within-group comparisons showed a significant difference only between T3 and T7 in control samples, and no significant differences between control and treated samples were detected at any storage time (Figure 2).

3.5. Evaluation of the Xanthine Concentration

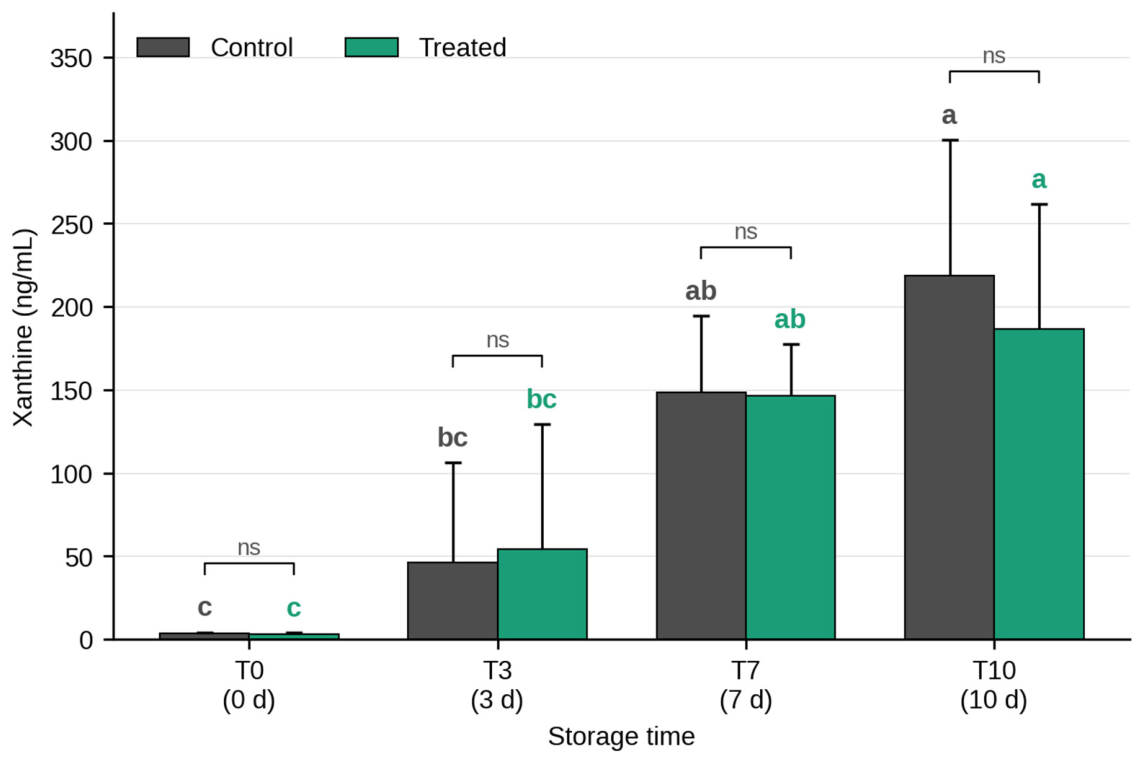
The amount of xanthine present in the samples was determined by a colorimetric assay. The results are shown in Figure 3. At time T0, hypoxanthine/xanthine values were close to 0 ng/mL in both control and treated samples. At T3, mean values increased moderately in both groups (46.02 ± 60.20 and 54.38 ± 74.96 ng/mL in control and treated samples, respectively), with high variability among samples. By T7, a substantial increase was observed in both control and treated samples. The statistical analysis showed a significant effect of storage time on xanthine concentration (F = 16.05, p < 0.001), whereas neither the experimental group (F = 0.08, p = 0.777) nor the interaction between experiment and time was statistically significant (F = 0.15, p = 0.927). The effect of storage time was significant, indicating that most of the explainable variation in xanthine concentrations was associated with storage duration. Tukey-adjusted pairwise comparisons showed significantly higher xanthine concentrations at T7 compared with T0 (p = 0.0018) and T3 (p = 0.035) and at T10 compared with T0 (p < 0.0001) and T3 (p = 0.0011). Conversely, no significant differences were observed between T0 and T3 (p = 0.481) or between T7 and T10 (p = 0.341). The same pattern was observed in both groups when analysed separately, and control and treated samples did not differ significantly at any storage time (Figure 3).

3.6. Evaluation of the Histamine Concentration

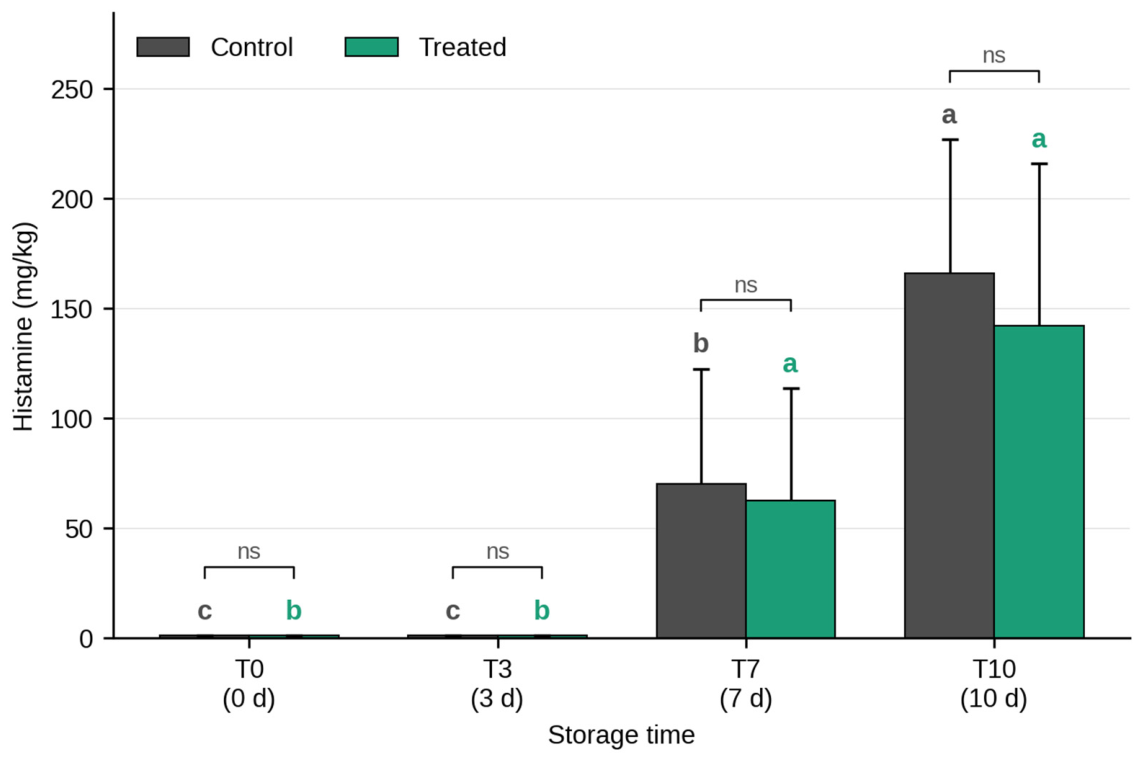
Detectable histamine contents were observed after 7 days of storage, reaching a maximum of 152.65 mg/kg in the control group, with mean values of 69.96 ± 52.43 mg/kg and 62.55 ± 51.06 mg/kg for the control and treatment groups, respectively. After 10 days, the samples treated with H. tubulosa CsE showed numerically lower histamine contents than the control group (165.72 ± 60.90 mg/kg and 142.07 ± 73.59 mg/kg for control and treated samples, respectively).
The ART factorial ANOVA revealed a highly significant effect of storage time on histamine concentration (F = 60.68, p < 0.001). Conversely, neither the experimental group (F = 2.04, p = 0.161) nor the experimental group × time interaction (F = 0.71, p = 0.553) was statistically significant. Tukey-adjusted comparisons showed no difference between T0 and T3 when all samples were below the LoD, and significant increases between T3 and T7 and between T7 and T10 (p < 0.001). In both groups, histamine concentrations at T7 and T10 were significantly higher than at T0 and T3, and no significant differences between control and treated samples were found at any storage time (Figure 4). Therefore, although histamine concentrations were numerically lower in treated samples at the later storage times, the statistical analysis did not provide evidence of a significant treatment-related reduction in histamine formation.
A summary of the statistical models, including assumption checks and effect sizes, is reported in Table 5; distribution-free measures of the treatment effect on the original observations are given in Table 6; and an integrated overview of the time course of the microbiological, sensory and biochemical parameters in control and treated samples is shown in Figure 5.

4. Discussion

In this study, the extracts of Arbacia lixula (sea urchin) and Holothuria tubulosa (sea cucumber) coelomocytes were evaluated for their antimicrobial and preservative properties. The results demonstrated a markedly higher antibacterial activity of H. tubulosa compared to A. lixula, prompting the subsequent application of the sea cucumber extract on sea bream (Sparus aurata) fillets to assess its potential as a natural biopreservative. The integration of microbiological, biochemical, and oxidative aspects provides a better understanding of the mechanisms and effects of the extract during fish preservation.
It should be noted that the material applied to the fillets was the unfiltered H. tubulosa CsE as a whole, not an isolated or purified antimicrobial peptide fraction.
Consistent with this, the antibacterial activity of the low-molecular-weight (<10 kDa) filtered fraction was consistently lower and narrower in spectrum than that of the unfiltered extract (Table 3), indicating that the antibacterial activity is not confined to the small peptide fraction alone. H. tubulosa coelomocytes and coelomic fluid are known to contain, besides small antimicrobial peptides such as Holothuroidin 1 and 2, a broader range of innate immune effectors of larger molecular size, including antimicrobial proteins, lysozyme-like enzymes and agglutinins [14,25]. These larger components would be retained by the 10 kDa cut-off membrane and are therefore present only in the unfiltered extract, which may account for its broader inhibitory spectrum and higher potency.
In general, the extracts tested were more active on Gram-positive rather than Gram-negative bacteria, probably due to the structural differences in bacterial cell envelopes. Gram-negative bacteria, in fact, possess an additional outer membrane that acts as a permeability barrier, reducing the diffusion of bioactive molecules and thereby increasing resistance to antimicrobial agents [42].
Consistent with these findings, the evolution of TMC and Pseudomonas during storage followed trends similar to those previously reported for sea bream fillets [43] and whole gilthead sea bream [44]. The results obtained in this study highlight the antibacterial potential of H. tubulosa CsE, particularly against presumptive E. coli and staphylococci. The inhibitory activity observed in situ suggests that the bioactive compounds present in the coelomocyte extract may interfere with microbial cell membranes or with essential metabolic pathways. Similarly, Tayel et al. [45] demonstrated that bioactive plant extracts exert antimicrobial activity on E. coli and S. aureus, causing bacterial cell lysis.
However, the selective inhibition of presumptive E. coli over other Gram-negative bacteria, such as Pseudomonas spp. and broader Enterobacteriaceae, indicates that outer membrane structural differences alone cannot fully account for microbial susceptibility. Several physiological and molecular factors may explain this differential response. First, bioactive molecules in H. tubulosa CsE—including antimicrobial peptides, lectins, and lysozyme-like proteins—may possess specific binding affinities for outer membrane target sites or lipopolysaccharide (LPS) structures uniquely present in E. coli. Second, dominant fish spoilage organisms such as Pseudomonas spp. exhibit high intrinsic resistance due to highly impermeable outer membranes and active multidrug efflux pumps (e.g., MexAB-OprM systems) that efficiently extrude bioactive natural compounds. Third, under refrigerated storage conditions (4 °C), psychrotrophic bacteria like Pseudomonas adapt by altering membrane lipid composition or producing extracellular polymeric substances (EPS), which shield cells from antimicrobial agents. In contrast, mesophilic organisms like E. coli experience cold stress, which impairs membrane homeostasis and metabolic repair mechanisms, thereby increasing their sensitivity to the bioactive components of the extract.
These findings support the idea that natural compounds such as echinoderm extracts could be further explored as biopreservatives, contributing to microbial safety with the possible reduction in conventional chemical preservatives increasingly regarded as potentially harmful to humans [46].
The treated samples exhibited lower QIM scores compared to the control group (p = 0.043), suggesting a potential contribution of the extract to sensory quality preservation during refrigerated storage. However, the practical relevance of this statistical difference warrants careful consideration. At the end of the 10-day storage period, the mean difference in QIM scores between control and treated fillets was relatively small (approximately 0.6–0.8 points). In practical terms, while a statistically significant reduction in QIM score indicates a trend toward better-preserved sensory traits, such a minor numerical variation may not translate into a clearly noticeable extension of sensory acceptability for trained panellists or consumers. Furthermore, only one dose of the extract was tested, so dose dependence could not be assessed, and higher concentrations or optimised application methods may be required to achieve a practically meaningful improvement in shelf life quality.
In addition, only one dose of the extract was tested, so dose dependence could not be assessed.
Although H. tubulosa coelomocyte extract exhibited antimicrobial activity against a broad range of bacteria under in vitro conditions, its efficacy was considerably reduced when applied to sea bream fillets. It is important to emphasise that in vitro and in situ results are not directly comparable due to several critical experimental parameters. First, the effective concentration of the extract at the site of microbial contact differs markedly between agar diffusion plates and the fillet surface, where local dilution and binding to food components occur. Second, exposure times vary substantially, ranging from rapid diffusion dynamics in laboratory media to continuous exposure over a 10-day refrigerated storage period. Third, the physiological state of the target bacteria differs significantly: while in vitro assays utilise exponentially growing planktonic cells under ideal temperature and nutrient conditions, natural contamination on fish fillets involves sessile or stress-adapted microbial populations. Such differences between in vitro and food-based systems are commonly reported for natural antimicrobial compounds. In complex food matrices, active molecules may interact with proteins, lipids, and other constituents, reducing their availability to target microorganisms. Furthermore, limited diffusion within the food matrix, enzymatic degradation of bioactive compounds, variations in pH and ionic strength, and interactions with endogenous inhibitory or protective substances may further reduce antimicrobial efficacy [47,48,49]. The physiological state of bacteria in food environments may also differ from that in laboratory media, leading to adaptive responses, including modifications of the cell envelope and stress-response mechanisms that increase microbial tolerance [50]. Therefore, the reduced activity observed in situ likely reflects the combined influence of matrix-related and microbial factors, highlighting the importance of evaluating promising antimicrobial candidates under realistic food storage conditions. However, the extract showed selective antimicrobial activity and contributed to maintaining sensory freshness attributes during refrigerated storage.
Furthermore, the oxidative stability of the treated samples was also considered, in addition to the antibacterial activity.
Fish muscle tissues contain high amounts of lipids, particularly polyunsaturated fatty acids, which are highly susceptible to oxidative processes. Malondialdehyde is a well-known marker of lipid peroxidation, responsible for spoilage and the development of rancid odours in fish products. In the present study, MDA levels showed only small fluctuations during storage, with the highest values at T3 and no consistent increasing trend. However, the absence of statistically significant differences between treated and control samples should be interpreted with caution: ELISA methods for MDA can have limited specificity in complex matrices such as fish muscle [51,52].
On the other hand, it must be acknowledged that the study may have lacked sufficient statistical power to detect subtle differences in lipid oxidation rates between experimental groups.
Several studies have indicated that spectrophotometric or ELISA methods based on thiobarbituric acid (TBA) derivatives or commercial kits may lead to overestimation of lipid oxidation, since MDA can react with various other compounds. Moreover, derivatization efficiency can be affected by parameters such as pH, temperature, reagents, and extraction conditions [51,52]. In order to achieve a more precise evaluation of oxidative processes, the use of selective analytical techniques (e.g., HPLC or LC-MS) or the integration of multiple oxidation and volatile markers is recommended [53].
Following the death of the fish, endogenous enzymes in the muscle tissue catalyse the degradation of adenosine triphosphate (ATP) into a series of metabolites, eventually producing xanthine and uric acid [54]. The accumulation of xanthine contributes to the development of an unpleasant taste and serves as a reliable indicator of freshness in fish [55].
The observed increase in xanthine levels during storage is consistent with previous findings showing that hypoxanthine and xanthine progressively accumulate post-mortem and act as sensitive markers of biochemical degradation [56,57]. In the present study, however, xanthine concentrations did not differ significantly between treated and control samples (Section 3.5), indicating that xanthine accumulation was driven mainly by storage time. Although bioactive coatings and natural extracts have been reported to slow spoilage by reducing oxidative and enzymatic activity [58,59], such an effect on ATP catabolism could not be demonstrated for H. tubulosa CsE under the conditions tested.
Histamine formation occurs predominantly in fish species containing high levels of free histidine, such as those belonging to the Scombridae, Clupeidae, Engraulidae, Coryfenidae, Pomatomidae and Scombresosidae families. The decarboxylation of histidine to histamine is mainly catalysed by bacterial decarboxylases and is strongly influenced by storage temperature and duration [60,61]. Nevertheless, histamine has also been detected in species with lower histidine content, including Sparus aurata, suggesting that improper handling and microbial contamination can promote its formation.
Histamine remains a reliable indicator of freshness and safety in fish and fish-derived products, particularly when sensory alterations are not yet evident [62]. In this framework, although histamine levels were numerically lower in samples treated with H. tubulosa extract at late storage times (T10), neither the treatment effect nor the treatment-by-time interaction achieved statistical significance (p > 0.05). Importantly, the absence of statistical significance does not definitively prove the absence of a biological effect. The high inter-sample variability and potential limitations in statistical power may have masked minor to moderate reductions in histamine accumulation. Therefore, these numerical trends should be considered suggestive rather than conclusive, warranting further investigations with larger sample sizes and higher extract doses to determine whether H. tubulosa CsE can effectively inhibit bacterial histidine decarboxylase activity.
Whether H. tubulosa crude extract can delay histamine formation, for instance by inhibiting microbial proliferation or the enzymatic activity involved in histidine decarboxylation, remains to be established. Future research should focus on isolating and characterising the specific bioactive molecules responsible for this activity, as well as assessing their stability and applicability in fish species with a higher histidine content [63].
Beyond the specific findings of this study, sea cucumber is a widely consumed seafood, particularly in Asian countries, and its extracts have been reported to possess additional beneficial properties, including anti-inflammatory and anti-tumour effects [19,20,21]. Natural bioactive compounds of this kind are of growing interest for functional-food applications, and food supplements derived from sea cucumber are already commercially available; however, the fraction of an extract such as the CsE used here that would be bioavailable to the consumer in a food-preservation context remains unknown, and no health claim can be drawn from the present data. In this context, although H. tubulosa is an edible sea cucumber species traditionally consumed as seafood—suggesting a baseline of dietary tolerance—safety considerations regarding its crude extract must still be explicitly addressed. It is critical to emphasise that the safety of a raw, concentrated coelomic extract cannot be automatically inferred from the consumption of the whole cooked organism or from isolated peptides. Crude coelomic extracts contain a concentrated mixture of bioactive proteins, enzymes, and secondary metabolites (such as saponins) that, when applied unheated to a food matrix, could exert cytotoxicity or provoke allergenic responses. Therefore, targeted toxicological and allergenicity evaluations of the raw extract remain essential before any commercial food application. Moreover, large-scale extraction of natural molecules from wild echinoderm populations would raise ecological sustainability concerns, given the number of organisms this would require. Characterisation and, where feasible, chemical synthesis of the specific active molecules responsible for the antibacterial activity observed here would therefore be an important step toward any practical application of this approach.

5. Conclusions

The unfiltered H. tubulosa coelomocyte extract contributed to the preservation of sensory freshness during refrigerated storage, as evidenced by significantly lower QIM scores in treated sea bream fillets compared to controls (p = 0.043). In contrast, the microbiological analysis demonstrated a selective antimicrobial effect, primarily limiting the growth of staphylococci and presumptive E. coli, without significantly affecting the main spoilage bacterial populations monitored (such as Pseudomonas spp., Enterobacteriaceae, and total mesophilic counts). Crucially, while the extract maintained sensory attributes, the microbiological data alone do not provide evidence of an extension of microbiological shelf life, as total microbial loads in both treated and control samples approached the acceptability threshold (7Log CFU/g) by day 10. Overall, these results support H. tubulosa CsE as a promising biopreservative candidate; however, the antibacterial activity must be attributed to the crude extract as a whole. Further studies evaluating dose–response relationships, higher extract concentrations, and active component characterisation are required before practical applications or shelf life extension claims can be substantiated.

Author Contributions

Conceptualization: M.V., L.S. and V.F.; methodology: M.V., V.A., V.F. and L.S.; formal analysis and investigation: V.L., G.C., A.C., R.N. and F.C.; writing—original draft preparation: V.L., M.V., G.C., L.S. and F.C.; writing—review and editing: V.L., M.V., L.S. and F.C.; funding acquisition: M.V. and V.A.; resources: M.V., V.A., V.F. and L.S.; supervision: M.V., V.A., V.F. and L.S. All authors have read and agreed to the published version of the manuscript.

Funding

This work was supported by the project “Confezione Smart per prodotti Ittici (COSMIC)”, within the Operational Programme FEAMP 2014/2020, Measure 1.26 “Innovation in the Fisheries Sector”. Scientific supervisor: Prof. Mirella Vazzana.

Institutional Review Board Statement

Ethical approval from the University of Palermo’s Ethics Committee was not required for this research. According to Italian and European regulations (EU Regulation 536/2014; Italy: Law 3/2018; Legislative Decree 52/2019; Ministry of Health Decree 26 January 2023), ethics committee authorization applies specifically to biomedical investigations and does not extend to non-medical sensory assessments of food products. The sensory evaluation of fish was conducted using the Quality Index Method (QIM), evaluating appearance, texture, and odour without biological sampling, administration of medicinal substances, or processing of personal data.

Informed Consent Statement

Informed consent was obtained from all subjects involved in the sensory evaluation prior to testing. Participation was entirely voluntary and anonymous, with no personal or identifying data collected.

Data Availability Statement

The data generated and analysed during the current study are available from the corresponding author on reasonable request.

Conflicts of Interest

The authors declare no conflicts of interest.

Abbreviations

The following abbreviations are used in this manuscript:
AMPsAntimicrobial Peptides
QIMQuality Index Method
CsECoelomocytes Extract
CFCoelomic Fluid
PA/PEPolyamide/Polyethylene
TMCTotal Mesophilic Count
PCAPlate Count Agar
PABPseudomonas Agar Base
BPBaird–Parker Agar
HEAHektoen Enteric Agar
KAAKanamycin Aesculin Azide
VRBAViolet Red Bile Agar
VRBGAViolet Red Bile Glucose Agar
ELISAEnzyme-Linked Immunosorbent Assay
YPDYeast Extract Peptone Dextrose
UHPLCUltra High-Performance Liquid Chromatography
DADDiode Array Detector
LoDLimit of Detection
LoQLimit of Quantification
MDAMalondialdehyde
ANOVAAnalysis of Variance
ARTAligned Rank Transform
CFUColony-Forming Unit
TBAThiobarbituric Acid
ATPAdenosine Triphosphate

References

  1. Ahmed, M.; Ranjan, H.; Roy, S. Pulsed electric fields for sustainable meat, poultry, and fish processing: Recent advances, prospects, and industry challenges. Innov. Food Sci. Emerg. Technol. 2025, 102, 104008. [Google Scholar] [CrossRef] [Scilit]
  2. Mei, J.; Ma, X.; Xie, J. Review on natural preservatives for extending fish shelf life. Foods 2019, 8, 490. [Google Scholar] [CrossRef] [Scilit] [PubMed]
  3. Jónsdóttir, R.; Ólafsdóttir, G. Volatile aroma compounds in marine resources. In Handbook of Seafood and Seafood Products Analysis, 2nd ed.; Toldrá, F., Nollet, L., Eds.; CRC Press: Boca Raton, FL, USA, 2024; pp. 145–166. [Google Scholar]
  4. Bermúdez-Medranda, A.E.; Ureña-Peralta, M.O.; Cruz-Quintana, Y.; Lucas, A.R. Nutritional composition of Dormitator latifrons (Richardson, 1844, Perciformes, Eleotridae) and quality index method (QIM) scheme for determining its shelf life. J. Food Sci. Technol. 2025, 62, 1383–1391. [Google Scholar] [CrossRef] [Scilit] [PubMed]
  5. Lalani, A.R.; Rastegar-Pouyani, N.; Askari, A.; Tavajohi, S.; Akbari, S.; Jafarzadeh, E. Food additives, benefits, and side effects: A review article. J. Chem. Health Risks 2024, 14, 1–10. [Google Scholar] [CrossRef]
  6. Silva, M.; Lidon, F. Food preservatives—An overview on applications and side effects. Emir. J. Food Agric. 2016, 28, 366. [Google Scholar] [CrossRef] [Scilit]
  7. Stamatis, N.; Arkoudelos, J.S. Effect of modified atmosphere and vacuum packaging on microbial, chemical and sensory quality indicators of fresh, filleted Sardina pilchardus at 3 C. J. Sci. Food Agric. 2007, 87, 1164–1171. [Google Scholar] [CrossRef] [Scilit]
  8. Uçak, İ.; Özogul, Y.; Durmuş, M. The effects of rosemary extract combination with vacuum packing on the quality changes of Atlantic mackerel fish burgers. Int. J. Food Sci. Technol. 2011, 46, 1157–1163. [Google Scholar] [CrossRef] [Scilit]
  9. Tsironi, T.; Ntzimani, A.; Gogou, E.; Tsevdou, M.; Semenoglou, I.; Dermesonlouoglou, E.; Taoukis, P. Modeling the effect of active modified atmosphere packaging on the microbial stability and shelf life of gutted sea bass. Appl. Sci. 2019, 9, 5019. [Google Scholar] [CrossRef] [Scilit]
  10. Nobile, M.; Ghidini, S.; Panebianco, F.; Pessina, D.; Chiesa, L.M.; Panseri, S. Essential oil vapour inclusion in protective atmosphere packaging for shelf-life management of fisheries. Int. J. Food Sci. Technol. 2024, 59, 4530–4545. [Google Scholar] [CrossRef] [Scilit]
  11. Sánchez-García, F.; Machado, N.D.; Tirado-Fernández, M.; Cejudo-Bastante, C.; Roldán, A.M.; Mantell-Serrano, C.; Casas-Cardoso, L. Hake fish preservation using plant-based impregnated polylactic acid food films as active packaging. Appl. Sci. 2025, 15, 643. [Google Scholar] [CrossRef] [Scilit]
  12. Maghami, M.; Motalebi, A.A.; Anvar, S.A.A. Influence of chitosan nanoparticles and fennel essential oils (Foeniculum vulgare) on the shelf life of Huso huso fish fillets during the storage. Food Sci. Nutr. 2019, 7, 3030–3041. [Google Scholar] [CrossRef] [Scilit] [PubMed]
  13. Solinho, J.; Santos, J.; Vázquez, M.; Pinheiro, R. Comparative study of preservation techniques for refrigerated Atlantic bonito fillets: Effects of modified atmosphere packaging, vacuum packaging, and alginate coating on shelf life and quality. Food Packag. Shelf Life 2025, 50, 101556. [Google Scholar] [CrossRef] [Scilit]
  14. Arizza, V.; Schillaci, D. Echinoderm antimicrobial peptides: The ancient arms of the deuterostome innate immune system. In Lessons in Immunity; Ballarin, L., Cammarata, M., Eds.; Academic Press: Cambridge, MA, USA, 2016; pp. 159–176. [Google Scholar]
  15. Gomes, A.R.; Rocha-Santos, T.; Duarte, A.C. Advances in Natural Products Discovery; Nova Science Publishers: New York, NY, USA, 2017; Volume 6, pp. 191–224. [Google Scholar]
  16. Popov, R.S.; Ivanchina, N.V.; Dmitrenok, P.S. Application of MS-based metabolomic approaches in analysis of starfish and sea cucumber bioactive compounds. Mar. Drugs 2022, 20, 320. [Google Scholar] [CrossRef] [Scilit] [PubMed]
  17. Bordbar, S.; Anwar, F.; Saari, N. High-value components and bioactives from sea cucumbers for functional foods—A review. Mar. Drugs 2011, 9, 1761–1805. [Google Scholar] [CrossRef] [Scilit] [PubMed]
  18. Saeid, A.; Dave, D.; Shahidi, F. Polysaccharides from echinoderms: Unlocking health benefits and food applications—A review. Food Funct. 2025, 16, 5679–5704. [Google Scholar] [CrossRef] [Scilit] [PubMed]
  19. Luparello, C.; Ragona, D.; Asaro, D.M.L.; Lazzara, V.; Affranchi, F.; Celi, M.; Arizza, V.; Vazzana, M. Cytotoxic potential of the coelomic fluid extracted from the sea cucumber Holothuria tubulosa against triple-negative MDA-MB231 breast cancer cells. Biology 2019, 8, 76. [Google Scholar] [CrossRef] [Scilit] [PubMed]
  20. Garcia-Candela, E.; Pariona-Velarde, C.; Mondragón-Martínez, A.; Chumpitaz-Cerrate, V. Antiviral activity of the sea cucumber tegument extract (Pattalus mollis) on human rotavirus A (RVA). Nat. Prod. Res. 2021, 35, 1014–1018. [Google Scholar] [CrossRef] [Scilit] [PubMed]
  21. Hossain, A.; Dave, D.; Shahidi, F. Antioxidant potential of sea cucumbers and their beneficial effects on human health. Mar. Drugs 2022, 20, 521. [Google Scholar] [CrossRef] [Scilit] [PubMed]
  22. Zhang, R.; Xu, L.; Dong, C. Antimicrobial peptides: An overview of their structure, function and mechanism of action. Protein Pept. Lett. 2022, 29, 641–650. [Google Scholar] [CrossRef] [Scilit] [PubMed]
  23. Solstad, R.G.; Li, C.; Isaksson, J.; Johansen, J.; Svenson, J.; Stensvåg, K.; Haug, T. Novel antimicrobial peptides EeCentrocins 1, 2 and EeStrongylocin 2 from the edible sea urchin Echinus esculentus have 6-Br-Trp post-translational modifications. PLoS ONE 2016, 11, e0151820. [Google Scholar] [CrossRef] [Scilit] [PubMed]
  24. Kang, H.K.; Lee, H.H.; Seo, C.H.; Park, Y. Antimicrobial and immunomodulatory properties and applications of marine-derived proteins and peptides. Mar. Drugs 2019, 17, 350. [Google Scholar] [CrossRef] [Scilit] [PubMed]
  25. Schillaci, D.; Cusimano, M.; Cunsolo, V.; Saletti, R.; Russo, R.; Vazzana, M.; Vitale, M.; Arizza, V. Immune mediators of sea-cucumber Holothuria tubulosa (Echinodermata) as source of novel antimicrobial and anti-staphylococcal biofilm agents. AMB Express 2013, 3, 35. [Google Scholar] [CrossRef] [Scilit] [PubMed]
  26. La Paglia, L.; Vazzana, M.; Mauro, M.; Dumas, F.; Urso, A.; Simon, S.; Drahos, L.; Vizzini, A. Identification of antioxidant and anti-inflammatory activity of sea cucumber (Holothuria tubulosa) active peptides by a combined approach of omics data and bioinformatics analysis. Mar. Drugs 2026, 24, 158. [Google Scholar] [CrossRef] [Scilit] [PubMed]
  27. Moretta, A.; Scieuzo, C.; Petrone, A.M.; Salvia, R.; Manniello, M.D.; Franco, A.; Lucchetti, D.; Vassallo, A.; Vogel, H.; Sgambato, A.; et al. Antimicrobial peptides: A new hope in biomedical and pharmaceutical fields. Front. Cell. Infect. Microbiol. 2021, 11, 668632. [Google Scholar] [CrossRef] [Scilit] [PubMed]
  28. Guryanova, S.V.; Ovchinnikova, T.V. Immunomodulatory and allergenic properties of antimicrobial peptides. Int. J. Mol. Sci. 2022, 23, 2499. [Google Scholar] [CrossRef] [Scilit] [PubMed]
  29. Militello, M.; Settanni, L.; Aleo, A.; Mammina, C.; Moschetti, G.; Giammanco, G.M.; Blàzquez, M.A.; Carrubba, A. Chemical composition and antibacterial potential of Artemisia arborescens L. essential oil. Curr. Microbiol. 2011, 62, 1274–1281. [Google Scholar] [CrossRef] [Scilit] [PubMed]
  30. Pennisi, L.; Olivieri, V.; Vergara, A.; Ianieri, A. Shelf-life of sea bream (Sparus aurata) packaged in modified atmosphere: Relationships between sensory and microbiological parameters. Ital. J. Food Saf. 2009, 1, 19. [Google Scholar] [CrossRef] [Scilit][Green Version]
  31. Alfonzo, A.; Miceli, C.; Nasca, A.; Franciosi, E.; Ventimiglia, G.; Di Gerlando, R.; Tuohy, K.; Francesca, N.; Moschetti, G.; Settanni, L. Monitoring of wheat lactic acid bacteria from the field until the first step of dough fermentation. Food Microbiol. 2017, 62, 256–269. [Google Scholar] [CrossRef] [Scilit] [PubMed]
  32. Cicero, A.; Galluzzo, F.G.; Cammilleri, G.; Pulvirenti, A.; Giangrosso, G.; Macaluso, A.; Vella, A.; Ferrantelli, V. Development of a rapid and eco-friendly UHPLC analytical method for the detection of histamine in fish products. Int. J. Environ. Res. Public Health 2020, 17, 7453. [Google Scholar] [CrossRef] [Scilit] [PubMed]
  33. ISO/IEC 17025:2017; General requirements for the competence of testing and calibration laboratories. International Organization for Standardization (ISO): Geneva, Switzerland, 2017.
  34. Elkin, L.A.; Kay, M.; Higgins, J.J.; Wobbrock, J.O. An aligned rank transform procedure for multifactor contrast tests. In Proceedings of the 34th Annual ACM Symposium on User Interface Software and Technology (UIST ’21); ACM: New York, NY, USA, 2021; pp. 754–768. [Google Scholar] [CrossRef] [Scilit]
  35. Wobbrock, J.O.; Findlater, L.; Gergle, D.; Higgins, J.J. The aligned rank transform for nonparametric factorial analyses using only ANOVA procedures. In Proceedings of the SIGCHI Conference on Human Factors in Computing Systems (CHI ’11); ACM: New York, NY, USA, 2011; pp. 143–146. [Google Scholar] [CrossRef] [Scilit]
  36. Bernardi, D.C.; Mársico, E.T.; Freitas, M.Q.D. Quality Index Method (QIM) to assess the freshness and shelf life of fish. Braz. Arch. Biol. Technol. 2013, 56, 587–598. [Google Scholar] [CrossRef] [Scilit]
  37. Lauteri, C.; Ferri, G.; Pennisi, L. A Quality Index Method-based evaluation of sensory quality of red mullet (Mullus barbatus) and its shelf-life determination. Ital. J. Food Saf. 2023, 12, 10927. [Google Scholar] [CrossRef] [Scilit] [PubMed]
  38. Huidobro, A.; Pastor, A.; Tejada, M. Quality index method developed for raw gilthead seabream (Sparus aurata). J. Food Sci. 2000, 65, 1202–1205. [Google Scholar] [CrossRef] [Scilit]
  39. Alfonzo, A.; Martorana, A.; Guarrasi, V.; Barbera, M.; Gaglio, R.; Santulli, A.; Settanni, L.; Galati, A.; Moschetti, G.; Francesca, N. Effect of the lemon essential oils on the safety and sensory quality of salted sardines (Sardina pilchardus Walbaum 1792). Food Control 2017, 73, 1265–1274. [Google Scholar] [CrossRef] [Scilit]
  40. Ntzimani, A.; Semenoglou, I.; Dermesonlouoglou, E.; Tsironi, T.; Taoukis, P. Surface decontamination and shelf-life extension of gilthead sea bream by alternative washing treatments. Sustainability 2022, 14, 5887. [Google Scholar] [CrossRef] [Scilit]
  41. Aubourg, S.P.; Mondragón, A.C.; Trigo, M.; Miranda, J.M.; Barros-Velázquez, J. Integrated assessment of shelf life evolution in small marine fish from the Northwestern Spanish Coast: Microbial, chemical, and sensory changes during chilled storage. Foods 2026, 15, 2398. [Google Scholar] [CrossRef] [Scilit] [PubMed]
  42. Epand, R.M.; Epand, R.F. Biophysical analysis of membrane-targeting antimicrobial peptides: Membrane properties and the design of peptides specifically targeting Gram-negative bacteria. In Antimicrobial peptides: Discovery, Design and Novel Therapeutic Strategies; Wang, G., Ed.; CABI: Wallingford, UK, 2010; pp. 116–127. [Google Scholar]
  43. Zhao, R.; Guan, W.; Zheng, P.; Tian, F.; Zhang, Z.; Sun, Z.; Cai, L. Development of edible composite film based on chitosan nanoparticles and their application in packaging of fresh red sea bream fillets. Food Control 2022, 132, 108545. [Google Scholar] [CrossRef] [Scilit]
  44. Ntzimani, A.; Angelakopoulos, R.; Stavropoulou, N.; Semenoglou, I.; Dermesonlouoglou, E.; Tsironi, T.; Moutou, K.; Taoukis, P. Seasonal pattern of the effect of slurry ice during catching and transportation on quality and shelf life of gilthead sea bream. J. Mar. Sci. Eng. 2022, 10, 443. [Google Scholar] [CrossRef] [Scilit]
  45. Tayel, A.A.; Bahnasy, A.G.; Mazrou, K.E.; Alasmari, A.; El Rabey, H.A.; Elboghashy, S.A.; Diab, A.M. Biopreservation and quality enhancement of fish surimi using colorant plant extracts. J. Food Qual. 2021, 2021, 1–8. [Google Scholar] [CrossRef] [Scilit]
  46. Davoudi, M.; Gavlighi, H.A.; Javanmardi, F.; Benjakul, S.; Nikoo, M. Antimicrobial peptides derived from food byproducts: Sources, production, purification, applications, and challenges. Compr. Rev. Food Sci. Food Saf. 2024, 23, e13422. [Google Scholar] [CrossRef] [Scilit] [PubMed]
  47. Wang, L.; Dekker, M.; Heising, J.; Zhao, L.; Fogliano, V. Food matrix design can influence the antimicrobial activity in food systems: A narrative review. Crit. Rev. Food Sci. Nutr. 2024, 64, 8963–8989. [Google Scholar] [CrossRef] [Scilit] [PubMed]
  48. Corrêa, J.A.F.; Nazareth, T.M.; Rocha, G.F.; Luciano, F.B. Bioactive antimicrobial peptides from food proteins: Perspectives and challenges for controlling foodborne pathogens. Pathogens 2023, 12, 477. [Google Scholar] [CrossRef] [Scilit] [PubMed]
  49. Jha, S.; Adhikari, A. Antimicrobial peptides in food systems: Classification, mechanism, and industrial application. Processes 2026, 14, 527. [Google Scholar] [CrossRef] [Scilit]
  50. Ahmed, A.G.A.; El-Dougdoug, N.K. Controlling foodborne pathogens with natural antimicrobials by biological control and antivirulence strategies. Heliyon 2020, 6, e05020. [Google Scholar] [CrossRef] [Scilit] [PubMed]
  51. Rizzo, M. Measurement of malondialdehyde as a biomarker of lipid oxidation in fish. Am. J. Anal. Chem. 2024, 15, 303–332. [Google Scholar] [CrossRef]
  52. Durand, E.; Laguerre, M.; Bourlieu-Lacanal, C.; Lecomte, J.; Villeneuve, P. Navigating the complexity of lipid oxidation and antioxidation: A review of evaluation methods and emerging approaches. Prog. Lipid Res. 2025, 97, 101317. [Google Scholar] [CrossRef] [Scilit] [PubMed]
  53. Mozzon, M.; Foligni, R.; Mannozzi, C.; Vittori, S. Assessment of lipid oxidation in fish and fish products processed by cold plasma technologies. Appl. Food Res. 2024, 4, 100646. [Google Scholar] [CrossRef] [Scilit]
  54. Hwang, J.-H.; Kim, Y.; Choi, H.; Lee, K.-G. ATP degradation products as freshness indicator of flatfish during storage. Food Sci. Biotechnol. 2019, 28, 1891–1897. [Google Scholar] [CrossRef] [Scilit] [PubMed]
  55. Xue, G.; Yu, W.; Yutong, L.; Qiang, Z.; Xiuying, L.; Yiwei, T.; Jianrong, L. Construction of a novel xanthine biosensor using zinc oxide (ZnO) and the biotemplate method for detection of fish freshness. Anal. Methods 2019, 11, 1021–1026. [Google Scholar] [CrossRef] [Scilit]
  56. Guo, C.; You, S.; Li, C.; Chen, T.; Wang, X. One-step and colorimetric detection of fish freshness indicator hypoxanthine based on the peroxidase activity of xanthine oxidase grade I ammonium sulfate suspension. Front. Microbiol. 2021, 12, 791227. [Google Scholar] [CrossRef] [Scilit] [PubMed]
  57. Wang, Y.; Li, F.; Wang, X.; Ma, C. Integrating hypoxanthine and K value for reliable and rapid freshness assessment in marine fish. Food Chem. 2025, 470, 142630. [Google Scholar] [CrossRef] [Scilit] [PubMed]
  58. Kurek, M.; Pišonić, P.; Ščetar, M.; Janči, T.; Čanak, I.; Vidaček Filipec, S.; Benbettaieb, N.; Debeaufort, F.; Galić, K. Edible coatings for fish preservation: Literature data on storage temperature, product requirements, antioxidant activity, and coating performance—A Review. Antioxidants 2024, 13, 1417. [Google Scholar] [CrossRef] [Scilit] [PubMed]
  59. Dong, W.; Feng, R.; Pang, J.; Wei, K.; Li, J.; Sun, J.; Wang, S.; Mao, X. An intelligent colorimetric paper-based hypoxanthine biosensor enabled by smartphone and dual-enzyme system for efficient shrimp freshness monitoring. Food Chem. 2025, 491, 145112. [Google Scholar] [CrossRef] [Scilit] [PubMed]
  60. Oktariani, A.F.; Ramona, Y.; Sudaryatma, P.E.; Dewi, I.A.M.M.; Shetty, K. Role of marine bacterial contaminants in histamine formation in seafood products: A review. Microorganisms 2022, 10, 1197. [Google Scholar] [CrossRef] [Scilit] [PubMed]
  61. Buczkowska, M.; Szczyrba, A.; Szajnoga, D.; Górski, M.; Malinowska-Borowska, J.; Domagalska, J.; Rozentry, P. The factors influencing the concentration of histamine in jarred baby foods containing fish, considering evaluation of daily histamine intake. J. Food Prot. 2024, 87, 100328. [Google Scholar] [CrossRef] [Scilit] [PubMed]
  62. Ntzimani, A.; Papamichail, E.; Dermesonlouoglou, E.; Semenoglou, I.; Tsironi, T.; Taoukis, P. Shelf life study of chilled mullet (Mugil cephalus): Histamine formation and quality degradation at constant and dynamic storage conditions. Fishes 2024, 9, 480. [Google Scholar] [CrossRef] [Scilit]
  63. Maskur, M.; Prihanto, A.A.; Firdaus, M.; Kobun, R.; Nurdiani, R. Review of the potential of bioactive compounds in seaweed to reduce histamine formation in fish and fish products. Ital. J. Food Saf. 2025, 14, 1299. [Google Scholar] [CrossRef] [Scilit] [PubMed]
Figure 1. QIM scores of sea bream fillets treated and not treated with H. tubulosa extract during refrigerated storage. Bars show means, and error bars are SD (n = 3). Within each experimental group, different letters indicate significant differences between storage times (Tukey-adjusted comparisons on aligned ranks, p < 0.05), with letter a denoting the highest mean; letters are compared only within the same group. Brackets show the comparison between control and treated samples at the same storage time (Bonferroni-adjusted; ns, not significant). The overall treatment effect was significant (ART ANOVA, p = 0.043), whereas the treatment × time interaction was not. The dashed line indicates the acceptability limit (QIM score = 6).
Applsci 16 09931 g001
Figure 2. Malondialdehyde concentration (ng/mL) in control and treated samples at T0, T3, T7 and T10 (0, 3, 7 and 10 days of storage). Bars show means, and error bars show (n = 6). Within each experimental group, different letters indicate significant differences between storage times (Tukey-adjusted comparisons on aligned ranks, p < 0.05), with letter a denoting the highest mean; letters are compared only within the same group. Brackets show the comparison between control and treated samples at the same storage time (Bonferroni-adjusted; ns, not significant).
Applsci 16 09931 g002
Figure 3. Xanthine concentration (ng/mL) in control and treated samples at T0, T3, T7 and T10 (0, 3, 7 and 10 days of storage). Bars show means, and error bars show SD (n = 3). Within each experimental group, different letters indicate significant differences between storage times (Tukey-adjusted comparisons, p < 0.05), with letter a denoting the highest mean; letters are compared only within the same group. Brackets show the comparison between control and treated samples at the same storage time (Bonferroni-adjusted; ns, not significant).
Applsci 16 09931 g003
Figure 4. Histamine concentration (mg/kg) in control and treated samples at T0, T3, T7 and T10 (0, 3, 7 and 10 days of storage). Bars show means, and error bars show SD (n = 6); values below the LoD were set to half the LoD. Within each experimental group, different letters indicate significant differences between storage times (Tukey-adjusted comparisons on aligned ranks, p < 0.05), with letter a denoting the highest mean; letters are compared only within the same group. Brackets show the comparison between control and treated samples at the same storage time (Bonferroni-adjusted; ns, not significant).
Applsci 16 09931 g004
Figure 5. Time course of microbiological, sensory and biochemical parameters in control and H. tubulosa CsE-treated sea bream fillets stored under vacuum at 4 °C. (A) Total mesophilic count; (B) pseudomonads; (C) Enterobacteriaceae; (D) staphylococci; (E) presumptive E. coli; (F) QIM score; (G) histamine; (H) xanthine; (I) malondialdehyde. Values are means ± SD. Filled symbols indicate measured values. Open symbols indicate values below the detection limit, plotted at the limit (histamine: half the LoD). In panels (A–E), asterisks indicate significant differences between control and treated samples at the same storage time (Student’s t-test; * p ≤ 0.05; *** p ≤ 0.001; see Table 4); in panels (F–I), the p-value of the overall treatment effect from the two-factor models (Table 5) is shown, in bold where the treatment effect is significant (p < 0.05); comparisons between storage times within each group and between control and treated samples at each storage time are shown in Figure 1, Figure 2, Figure 3 and Figure 4. Dashed lines indicate the acceptability limits (7 Log CFU/g for total mesophilic count; QIM score = 6).
Applsci 16 09931 g005
Table 1. Technical characteristics of PA/PE bags used for vacuum packaging.
Barrier PropertiesTensile Properties
Oxygen Transmission Rate: <40 cc/m2/24 h
(Calculated at atm, T = 23 ± 2 °C, 75% RH)
Yield load: ld ≥ 57; cd ≥ 42
Water Vapour Transmission Rate: <2 g/m2/24 h
(Calculated at atm, T = 23 ± 1 °C, 85 ± 2% RH)
Breaking load: ld ≥ 200; cd ≥ 250
Permeability Carbon Dioxide: <130 cc/m2/24 h
(Calculated at atm, T = 23 ± 2 °C, 75% RH)
Nitrogen Transmission Rate: <15 cc/m2/24 h
(Calculated at atm, T = 23 ± 2 °C, 75% RH)
Abbreviations: atm, atmospheric pressure; T, temperature; RH, relative humidity; ld, longitudinal direction; cd, transversal direction.
Table 2. Quality index parameters used for the sea bream fillets analysed.
ParametersAttributesDemerit Points
AppearanceSkinVery bright0
Bright1
Dull2
FleshElasticityElastic0
Marked by pressure1
OdourFresh0
Neutral1
Fishy2
Off odours3
Table 3. Antibacterial assay of echinoderm coelomocyte extracts.
StrainsNCC1C2C3C4PC
Salmonella Infantis 50270−−−−+++
Listeria monocytogenes 15BO−−+−++++
Listeria monocytogenes ATCC 19114−−++−++++
Listeria monocytogenes 130−−+−++++
Enterobacter cloacae 62A −+++++++
Escherichia coli PSS 52−−−+++++
Staphylococcus haemolyticus ICE 182−−++−++++
Staphylococcus aureus 4ADI−−++++++
Staphylococcus aureus C15634−+++−+++
Salmonella typhimurium 50432−−−−++++
Salmonella enteritidis 50431−−−−+++
Enterobacter amnigenus 60A2−−−−+++
Enterobacter spp. 17UTIN−−−−++++
Staphylococcus aureus C38249.1−++++++++++
Stenotrophomonas maltophilia ICE 272−−−−++++
Abbreviations: NC, negative control; C1, A. lixula 10 kDa extract; C2, H. tubulosa 10 kDa extract; C3, A. lixula cellular lysate; C4, H. tubulosa cellular lysate; PC, positive control. Symbols: −, no inhibition; +, clear inhibition (8–10 mm diameter); ++, strong inhibition (>10 mm diameter). Results indicate the mean value of two independent assays.
Table 4. Effect of H. tubulosa coelomocyte extract on the microbiological characteristics of sea bream fillets stored under vacuum.
SampleMicrobial Loads (Log CFU/g)
PCAPABYPDBPHEAKAAFRASERVRBGAVRBA
Control T04.95 ± 0.29 a5.06 ± 0.33 a3.77 ± 0.06 a2.67 ± 0.33 a<2 a<2 a<2 a<1 a1.50 ± 0.28 a
Treated T04.81 ± 0.52 a4.96 ± 0.47 a3.47 ± 0.06 b2.47 ± 0.09 a<2 a<2 a<2 a<1 a1.58 ± 0.39 a
N.S.N.S.**N.S.N.S.N.S.N.S.N.S.N.S.
Control T35.54 ± 0.48 a6.16 ± 0.43 a3.89 ± 0.27 a<22.77 ± 0.57 a<2 a<2 a3.35 ± 0.78 a2.89 ± 0.40 a
Treated T35.49 ± 0.55 a6.11 ± 0.44 a3.83 ± 0.19 a<2<2 b<2 a<2 a3.29 ± 0.77 a2.44 ± 0.38 a
N.S.N.S.N.S.N.S.***N.S.N.S.N.S.N.S.
Control T76.42 ± 0.37 a6.82 ± 0.59 a3.96 ± 0.35 a2.99 ± 0.38 a4.48 ± 0.34 a<2 a<2 a4.02 ± 0.58 a3.32 ± 0.45 a
Treated T76.26 ± 0.12 a6.66 ± 0.29 a3.72 ± 0.05 a<2 b3.46 ± 0.55 a<2 a<2 a4.06 ± 0.22 a3.05 ± 0.26 a
N.S.N.S.N.S.***N.S.N.S.N.S.N.S.N.S.
Control T107.31 ± 0.48 a7.09 ± 0.50 a5.06 ± 0.63 a2.20 ± 0.43 a4.88 ± 0.01 a<2 a<2 a4.78 ± 0.22 a3.65 ± 0.50 a
Treated T106.95 ± 0.62 a6.77 ± 0.41 a4.50 ± 0.58 a<2 b3.80 ± 0.48 b<2 a<2 a4.74 ± 0.40 a3.66 ± 0.22 a
N.S.N.S.N.S.****N.S.N.S.N.S.N.S.
Abbreviations: PCA, plate count agar for total mesophilic count; PAB, Pseudomonas agar base for Pseudomonas spp.; BP, Baird–Parker medium for coagulase-positive and coagulase-negative staphylococci; HEA, Hektoen Enteric Agar for Gram-negative enteric pathogens; KAA, kanamycin aesculin azide, for enterococci; VRBGA, violet red bile glucose agar for Enterobacteriaceae; VRBA, violet red bile agar for the total coliform; YPD, yeast peptone dextrose agar for yeast. Results indicate mean values ± SD of two determinations. Significance: * = p ≤ 0.05; ** = p ≤ 0.01; *** = p ≤ 0.001; N.S. = not significant. Different letters indicate significant differences between control and treated samples at the same storage time (Student’s t-test, p ≤ 0.05), with letter a denoting the highest value.
Table 5. Summary of the two-factor models (experimental group × storage time) applied to QIM scores and to histamine, xanthine and malondialdehyde concentrations.
Variable (Model; n)EffectF (df)pη2p [95% CI]Assumption Checks
QIM score (ART ANOVA; n = 3)Treatment4.84 (1, 16)0.0430.23 [0.00, 0.53]SW p = 0.006; Levene p = 0.680
Storage time39.58 (3, 16)<0.0010.88 [0.72, 0.93]
Treatment × time1.24 (3, 16)0.3280.19 [0.00, 0.45]
Histamine (ART ANOVA; n = 6)Treatment2.04 (1, 40)0.1610.05 [0.00, 0.22]SW p = <0.001; Levene p = 0.009
Storage time60.68 (3, 40)<0.0010.82 [0.71, 0.88]
Treatment × time0.71 (3, 40)0.5530.05 [0.00, 0.18]
Xanthine (two-way ANOVA; n = 3)Treatment0.08 (1, 16)0.7770.01 [0.00, 0.22]SW p = 0.732; Levene p = 0.885
Storage time16.05 (3, 16)<0.0010.75 [0.44, 0.86]
Treatment × time0.15 (3, 16)0.9270.03 [0.00, 0.13]
Malondialdehyde (ART ANOVA; n = 6)Treatment2.74 (1, 40)0.1050.06 [0.00, 0.25]SW p = 0.004; Levene p = 0.325
Storage time5.37 (3, 40)0.0030.29 [0.05, 0.47]
Treatment × time0.71 (3, 40)0.5520.05 [0.00, 0.18]
Abbreviations: ART, aligned rank transform; SW, Shapiro–Wilk test on model residuals; Levene, Levene’s test (median-centred) across the eight group × storage time cells; η2p, partial eta squared with two-sided 95% confidence interval; n, number of samples per experimental group and storage time. The ART ANOVA was used when residual normality was rejected. p-values < 0.05 are shown in bold. For the ART models, F statistics and partial eta squared refer to the aligned ranks and therefore quantify the proportion of rank variance explained; they are not directly comparable with partial eta squared obtained from a parametric ANOVA on the original measurements (see Table 6).
Table 6. Distribution-free measures of the treatment effect (treated vs. control) on the original observations, averaged over storage times.
VariableMean Difference (Treated − Control)Cliff’s δ [95% CI]Probability of Superiority
QIM score (demerit points)−0.46−0.42 [−0.75, −0.06]0.71
Histamine (mg/kg)−7.8−0.06 [−0.29, 0.19]0.53
Xanthine (ng/mL)−6.5−0.22 [−0.67, 0.28]0.61
Malondialdehyde (ng/mL)+0.011+0.29 [−0.04, 0.61]0.35
Values are averaged over the four storage times. Cliff’s δ ranges from −1 to +1; negative values indicate lower values in treated samples. Confidence intervals were obtained by bootstrap stratified by storage time (20,000 resamples). The probability of superiority is the probability that a randomly chosen treated sample shows a lower value than a randomly chosen control sample, with ties counted as 0.5; a value of 0.50 indicates no difference. Confidence intervals including zero indicate that the direction of the effect is not established.
Disclaimer/Publisher’s Note: The statements, opinions and data contained in all publications are solely those of the individual author(s) and contributor(s) and not of MDPI and/or the editor(s). MDPI and/or the editor(s) disclaim responsibility for any injury to people or property resulting from any ideas, methods, instructions or products referred to in the content.