Article

Research on Task Assignment Method Based on Multi-Strategy Improved Whale Migration Hybrid Genetic Algorithm

1
School of Computer and Information Engineering, Harbin University of Commerce, Harbin 150028, China
2
Public Policy and Modern Service Industry Innovation Think Tank, Harbin 150028, China
*
Author to whom correspondence should be addressed.
Appl. Sci. 2026, 16(19), 9933; https://doi.org/10.3390/app16199933 (registering DOI)
Submission received: 2 June 2026 / Revised: 9 July 2026 / Accepted: 10 July 2026 / Published: 8 October 2026
(This article belongs to the Section Computing and Artificial Intelligence)

Featured Application

This improved algorithm can effectively adapt to multi-unmanned vehicle distribution task allocation problems. It rationally schedules unmanned vehicle resources to complete delivery tasks while minimizing total distribution cost.

Abstract

In modern supply chain systems, task allocation is indispensable to logistics transportation. Sound and efficient allocation strategies are key to improving distribution efficiency and resource utilization. To address the limitations of traditional optimization algorithms in logistics task allocation, such as poor dynamic adaptability, susceptibility to local optima, and insufficient robustness under coupled operational constraints, this paper develops an optimization model with the objective of minimizing total cost and proposes a multi-strategy improved whale migration hybrid genetic algorithm. The algorithm enhances solution quality and convergence performance through tournament selection, improved order crossover operator, 2-opt operator, and hierarchical competition strategy. Comparative experiments with multiple algorithms are conducted to verify the effectiveness of the model and algorithm on small-, medium-, and large-scale instances. Simulation results show that the proposed model is applicable to unmanned vehicle distribution task allocation under coupled operational constraints, and the WMA-GA effectively solves logistics task allocation problems, exhibiting competitive performance in path optimization, convergence speed, and solution stability.

1. Introduction

Recent years have witnessed the explosive growth of e-commerce and the surging demand for same-day delivery services, which has significantly intensified the need for efficient logistics solutions [1]. Traditional manual delivery methods are no longer adequate to meet these escalating demands. Unmanned vehicle technology, with its inherent advantages of high efficiency, operational flexibility, and low cost, has demonstrated significant practical value in diverse fields, including logistics distribution and military reconnaissance [2]. As a core enabling technology for such applications, cooperative task assignment for multiple unmanned vehicles requires optimal resource allocation under the constraints imposed by complex operating environments [3].

1.1. Literature Review

The multi-unmanned vehicle task assignment problem in urban logistics distribution is a combinatorial optimization problem subject to multiple constraints [4], and establishing an appropriate mathematical model is a prerequisite for solving this problem. Recent studies have investigated vehicle routing and scheduling under different types of time-window constraints. Guo et al. formulated a two-echelon multi-trip capacitated vehicle routing problem with time windows by considering customer time windows, vehicle-load constraints, transshipment synchronization, and multi-vehicle coordination, and developed a hybrid genetic algorithm combined with neighborhood search to solve the resulting scheduling problem [5]. Jiang et al. investigated the capacitated vehicle routing problem with soft time windows and proposed a multiobjective evolutionary algorithm incorporating neighborhood detection to balance routing efficiency and time-window penalty costs [6]. These studies demonstrate that vehicle capacity and time-window constraints significantly increase the complexity of route planning and scheduling. Beyond the modeling of capacity and time-window constraints, existing studies have also developed mathematical formulations for vehicle routing and task assignment under diverse practical operating conditions. Zhang et al. constructed a mathematical model focusing on optimizing distribution cost, greenhouse gas emissions, and vehicle utilization to address the vehicle task allocation problem with seasonal demand fluctuations, heterogeneous vehicle sources, and multi-depot constraints. The experimental results show that the model has certain practical application value [7]. Wei et al. formulated a two-echelon truck–unmanned ground vehicle routing problem by considering time-dependent travel times, customer service requirements, operating costs, and UGV deployment, and developed a hybrid optimization algorithm for last-mile delivery [8]. Miller et al. developed an energy-aware collaborative task-assignment and route-planning framework for a team of unmanned ground vehicles, jointly optimizing task allocation, charging coordination, energy consumption, and overall mission completion time [9]. Gao proposed a multi-objective optimization model for carbon emission issues. Taking carbon dioxide emissions as constraints, the model aims to minimize costs to the greatest extent. Experimental results verify the effectiveness of the model under different problem scales [10]. Yu et al. studied the routing problem of electric refrigerated vehicles under the mixed public–private charging mode. The model comprehensively considers complex constraints, including vehicle payload, battery capacity and customer time windows. Experimental results show that the proposed model can effectively capture the operational characteristics of power and cooling energy allocation in mixed charging scenarios [11].
After establishing an appropriate mathematical model, effective solution methods are required. The Vehicle Routing Problem (VRP) is a classic problem in the field of combinatorial optimization and is a typical NP-hard problem [12]. Its solution difficulty increases with the number of customers and constraints [13]. Learning-based methods, particularly deep reinforcement learning, graph neural networks, and attention-based models, have recently been applied to vehicle routing problems. These methods can learn route-construction policies from training instances and rapidly generate solutions after training. Wang et al. proposed a token-based deep reinforcement learning method for the heterogeneous vehicle routing problem with service-time constraints [14], while Yan et al. developed a graph-driven deep reinforcement learning framework for vehicle routing problems with pickup and delivery [15]. However, when applied to multi-constrained vehicle routing problems involving customer time windows, vehicle-capacity limitations, and other operational requirements, learning-based methods still face challenges in explicitly incorporating hard constraints, adequately representing complex solution spaces, and generalizing to unseen problem instances [16]. In contrast, swarm intelligence algorithms are widely used to solve VRPs due to their natural adaptability to combinatorial optimization and hard constraints, as well as their ability to efficiently explore the vast solution space [17]. Metaheuristic intelligence algorithms feature parallel search and strong robustness and have been widely applied to solve the VRP, including Particle Swarm Optimization (PSO) [18], Differential Evolution (DE) [19], Simulated Annealing (SA) [20], Ant Colony Optimization (ACO) [21] and hybrid optimization methods [22]. These algorithms have demonstrated great potential in addressing VRP.
Recent studies have increasingly combined evolutionary and swarm-intelligence algorithms with local search operators to improve the balance between global exploration and local exploitation. Chen et al. integrated an improved genetic algorithm with ant colony optimization to enhance search diversity and convergence performance in the vehicle routing problem with time windows [23]. Hvattum investigated a hybrid genetic search for the capacitated vehicle routing problem by combining population evolution, order crossover, route splitting, and neighborhood-based local improvement [24]. These studies demonstrate the effectiveness of hybrid heuristic frameworks in solving constrained vehicle routing problems. However, hybridization alone does not necessarily guarantee effective coordination among population diversity preservation, global exploration, and route-level local refinement. Therefore, there remains a need for a more coordinated hybrid mechanism for complex multi-unmanned-vehicle task assignment problems. Swarm intelligence algorithms do not rely on large-scale labeled data and offer flexible parameter tuning [25]. These algorithms originate from observations of the behaviors and patterns of biological swarms in nature, emphasizing local interactions and information sharing among individuals and achieving global optimization through self-organization and self-adaptation mechanisms [26]. They are better able to balance the feasibility and optimality of solutions in complex multi-constrained VRP scenarios [27]. Among them, the Whale Migration Algorithm (WMA) is widely used due to its advantages of high optimization accuracy, strong robustness, and fast convergence [28]. However, due to its shortcomings in population diversity and dynamic adaptability during the early stage of operation, WMA is prone to falling into local optima when solving logistics task allocation problems with complex constraints, resulting in reduced exploration ability of the search space. There is still significant room for improvement in its global and local search capabilities.

1.2. Research Gaps and Contributions

Although the aforementioned studies have made considerable progress in logistics task assignment and vehicle routing optimization, several research gaps remain insufficiently addressed. First, existing studies generally focus on individual operational factors or specific optimization objectives, while the coupled effects of task allocation, route planning, vehicle capacity, customer time windows, and load-dependent energy consumption have not been sufficiently considered within a unified framework for multi-unmanned-vehicle distribution. Second, most existing swarm-intelligence and hybrid optimization methods mainly improve individual search operators or simply combine several established optimization strategies. However, the coordination among population-level global exploration, route-feasibility preservation, and solution-level local refinement remains limited. In particular, the conventional WMA mainly relies on leader-centered information transmission, which may cause follower individuals to converge prematurely toward similar regions of the search space, thereby reducing population diversity and increasing the risk of convergence stagnation.
To address the above research gaps, this paper presents a multi-strategy improved hybrid algorithm combining whale migration and genetic algorithms for task assignment. By integrating the fast convergence of WMA and the strong global exploration ability of GA, the proposed method addresses the shortcomings of conventional algorithms under large-scale and coupled operational constraints and offers an efficient and robust optimization solution for multi-unmanned vehicle cooperative task assignment. It should be emphasized that the novelty of this study does not lie in the individual genetic operators or the original WMA, but in their problem-oriented coordination and the newly designed hierarchical information-interaction mechanism. The key contributions of this paper are outlined as follows:
(1)
A constrained task-assignment model is formulated for multi-unmanned-vehicle logistics distribution. The model jointly considers vehicle fixed costs, load-dependent energy consumption, vehicle-capacity limitations, customer service time windows, and route-continuity requirements. Hard operational requirements are represented through explicit feasibility constraints, whereas violations of customer time windows are handled through a soft-constraint penalty mechanism. This formulation provides a unified optimization objective for task allocation and route planning in practical distribution scenarios.
(2)
A coordinated hybrid optimization framework integrating genetic evolution with hierarchical whale migration is developed. Rather than simply executing the GA and WMA independently or sequentially, the proposed framework uses binary tournament selection and an improved order-crossover operator to generate and recombine candidate routes. The resulting population is then reorganized according to fitness and further optimized through hierarchical whale-migration updates, dynamic mutation, and local route refinement. This coordinated search process improves population diversity, convergence stability, and solution feasibility under coupled operational constraints.
(3)
The population is divided into a multi-level structure based on fitness values, where high-level individuals dominate the convergence of global exploration. A hierarchical competition and cooperation mechanism for the whale swarm is established, and individuals achieve efficient information flow through intra-layer local competition and cross-layer information interaction. Low-level individuals improve optimization accuracy via local competition, which strengthens the robustness of the algorithm in complex constrained delivery scenarios and simultaneously optimizes convergence speed and global search efficiency, effectively addressing the deficiency of a single information transmission mode in traditional whale swarm algorithms.
(4)
A route-oriented refinement mechanism is constructed by combining an iteration-dependent mutation strategy with 2-opt local search. The mutation probability is gradually decreased during the optimization process to encourage broader exploration in the early stage and improve search stability in the later stage, while the 2-opt operator refines promising routes by eliminating inefficient path segments. Together with the hierarchical competition mechanism, these operators improve the balance between population-level exploration and solution-level local refinement. Their individual contributions are further evaluated through ablation experiments under identical experimental settings.

2. Model Construction

2.1. Problem Description

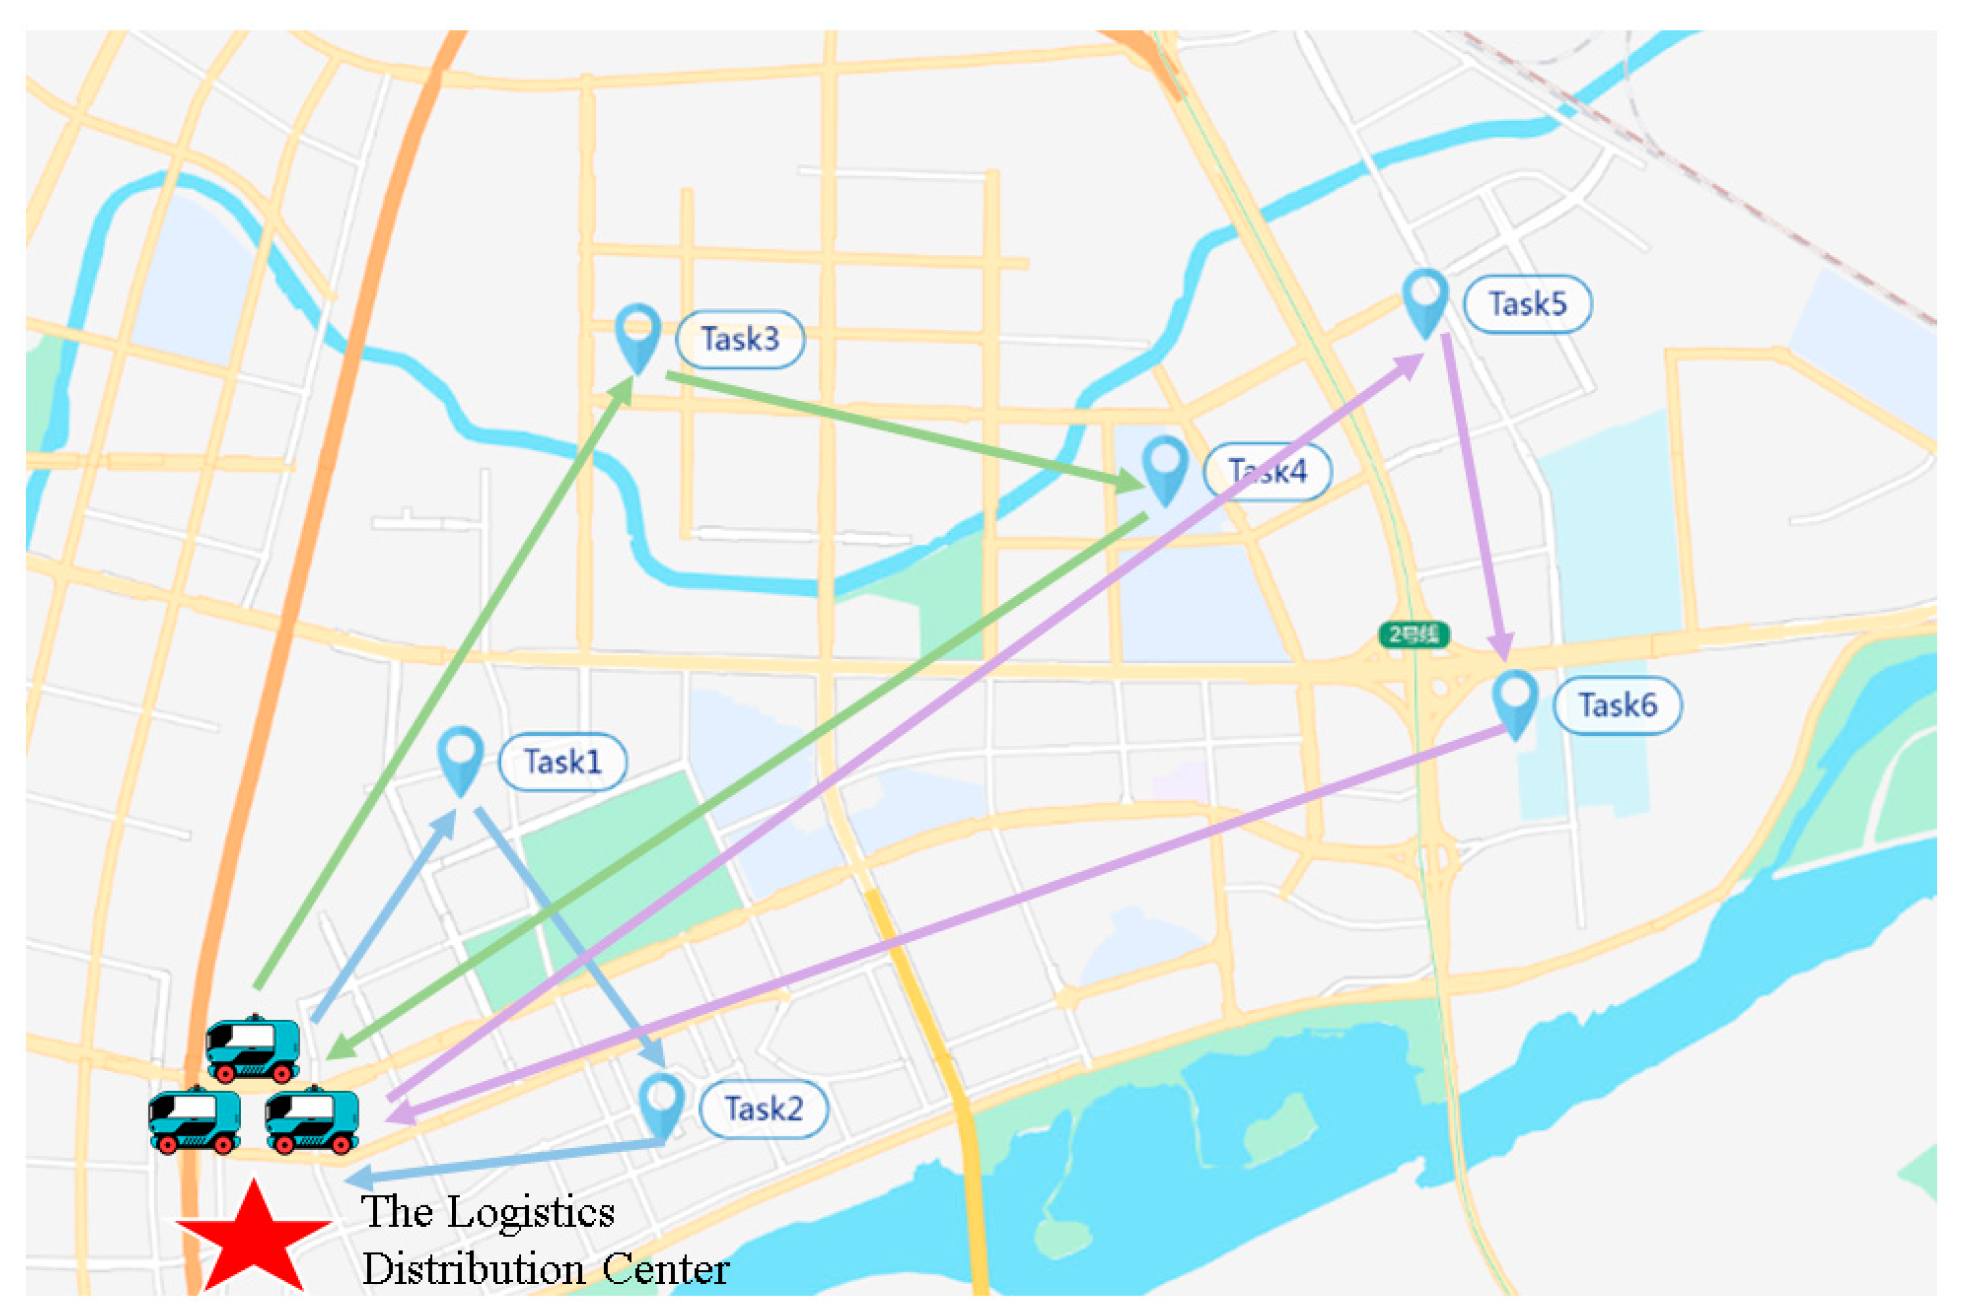
The multi-unmanned vehicle task assignment for logistics distribution in urban environments is a complex optimization problem. Assume that there exists only one distribution center and several logistics demand points within a given distribution area. The coordinates, specific demand quantities, and time windows for receiving delivery services of these demand points are all known in advance. After the unmanned logistics vehicles obtain the detailed information of the distribution tasks issued by the center, the distribution center dispatches the unmanned vehicles to carry small-batch goods. The unmanned vehicles depart from the distribution center, transport the goods to the corresponding demand points, and return to the distribution center upon completion of the assigned tasks. The schematic diagram of urban logistics unmanned vehicle delivery is shown in Figure 1, and the definitions of the parameters involved are provided in Table 1.
(1)
The model is specifically defined as follows:

Table 1. Parameter Definition Table.
SymbolDescription
N Customer center (excluding distribution centers)
K Unmanned vehicle set, including K vehicles
c Electricity cost coefficient
Q Maximum load capacity of the unmanned vehicle
d i j Distance from node i to node j
q i j k Load of the k -th unmanned vehicle traveling from i to j
q j Required load at customer point j
f k Fixed cost of the unmanned vehicle
T i k Arrival time of vehicle k at customer i
α Advance penalty coefficient
β Late penalty coefficient
M Vehicle current load
ρ ( M ) Unit energy consumption per distance with load M
r 0 No-load battery consumption per unit distance
r 1 Full-load battery consumption per unit distance
C i k Time window penalty for vehicle k at customer i
F Total energy consumption
C 1 Transportation energy cost
C 2 Fixed vehicle cost
C 3 Time window penalty cost
a i Earliest allowable service time of customer i
b i Latest allowable service time of customer i
E i j k Electricity consumption of vehicle k on arc i → j
P i k Time window penalty of vehicle k serving customer i
x i j k Binary decision variable: x i j k = 1 if vehicle k travels from node i to node j otherwise x i j k = 0 .
τ i j Travel time from node i to node j
H A sufficiently large positive constant used to deactivate conditional constraints
u i Visiting-order variable of customer i
(2)
Reducing distribution costs is an important optimization objective of the urban logistics distribution system. In practical logistics distribution tasks, the task assignment process should prioritize economic cost as the core orientation. Its key objective is to minimize the overall distribution cost while ensuring that goods are delivered efficiently and on time. Economic cost remains a crucial influencing factor throughout the entire task assignment process.
Constrained by task requirements and other factors, it is often difficult to fully satisfy all time window restrictions in actual delivery. If handled as hard constraints, the feasible solution space of the problem will be severely compressed, which may cause the optimization algorithm to easily fall into local optima or even yield no feasible solutions. Therefore, this paper adopts a strategy combining soft constraints and a penalty mechanism to relax the time window constraints and gradually guides the optimal solutions to converge toward the feasible region during the iterative optimization process.
(3)
Objective Function
The transportation cost of unmanned vehicles is related to their travel distance and cargo weight. This paper adopts the load estimation method to calculate the battery consumption of unmanned vehicles during driving. When the cargo weight carried by the unmanned vehicle is M and its maximum load capacity is Q , the battery consumption per unit distance is expressed in the equation as follows:
ρ ( M ) = r 0 + r 1 − r 0 Q M
where r 0 denotes the battery consumption per unit distance of the unmanned vehicle under no-load condition, and r 1 denotes that under a full-load condition. The load-dependent energy-consumption model is a first-order approximation based on linear interpolation between the no-load rate r 0 and the full-load rate r 1 . It assumes homogeneous vehicles operating at a relatively stable speed on approximately level roads. Actual energy consumption may also be affected by traffic conditions, acceleration, road gradient, ambient temperature, battery state, and auxiliary loads, which are not explicitly considered in this study. These factors are not explicitly included in the present model because this study focuses on comparing task-assignment and route-optimization algorithms under consistent operating conditions. The development of a more detailed energy-consumption model incorporating vehicle dynamics, road conditions, and battery characteristics has been identified as a direction for future research.
When the unmanned delivery vehicle carries cargo with weight q i j k and travels from customer i to customer j , the corresponding battery consumption is given by the following equation:
E i j k = ρ ( q i j k ) d i j
where d i j represents the distance between customer i and customer j . The total battery consumption when all unmanned vehicles complete the delivery tasks along their routes is given by the following equation:
F = ∑ k = 1 K ∑ i = 0 N ∑ j = 0 j ≠ i N x i j k ρ ( q i j k ) d i j
When the electricity price is c , the transportation energy cost is expressed in the equation as follows:
C 1 = c F
C 1 = c ∑ k = 1 K ∑ i = 0 N ∑ j = 0 j ≠ i N x i j k ρ ( q i j k ) d i j
The fixed cost for an unmanned vehicle to perform a single delivery task is denoted by C 2 , where f k mainly includes the depreciation cost and maintenance cost of the unmanned vehicle in a single trip, as shown in the following equation:
C 2 = ∑ k = 1 K f k ∑ j = 1 N x 0 j k
Timeliness is another key factor in logistics distribution, which directly affects customer satisfaction and the service level of logistics enterprises. Customers are generally sensitive to delivery delays, and late delivery is often one of the core factors causing customer complaints. If an unmanned vehicle arrives at a delivery point too early, it will not only cause a waste of resources but also reduce delivery efficiency. Assuming the service time window of a customer is fixed, no penalty will be incurred if the unmanned vehicle completes the delivery within this time range. However, if the vehicle arrives earlier or later than the specified time window, corresponding early or delay penalties will be imposed, and the penalty severity increases with the degree of time deviation. Therefore, the penalty function of the time window can be expressed as:
P i k = 0 , a i ≤ T i k ≤ b i , α ⋅ ( a i − T i k ) , T i k < a i , β ⋅ ( T i k − b i ) , T i k > b i
The time-window penalty P i k is calculated only when customer i is served by vehicle k ; otherwise, P i k = 0 . In the experiments, the early-arrival penalty coefficient is set to α = 1 CNY/min, whereas the late-arrival penalty coefficient is set to β = 2 CNY/min. Therefore, each minute of early arrival incurs a penalty of 1 CNY, while each minute of late arrival incurs a penalty of 2 CNY. A higher penalty is assigned to late arrival because delayed delivery generally has a greater negative impact on customer satisfaction, service reliability, and subsequent delivery schedules. In contrast, early arrival mainly results in vehicle waiting and temporary resource-idling costs. The penalty is calculated according to the deviation between the actual arrival time and the specified customer time window. If vehicle k arrives before a i , the penalty is α ⋅ ( a i − T i k ) . If it arrives after b i , the penalty is β ⋅ ( T i k − b i ) . No penalty is incurred when the arrival time falls within [ a i , b i ] .
By aggregating the time window penalties of all customers, the total time cost is expressed as:
C 3 = ∑ k = 1 K ∑ i = 1 N ∑ j = 0 j ≠ i N x i j k P i k
Based on the above analysis of relevant influencing factors, the overall objective of task assignment for logistics unmanned vehicles is to minimize the total distribution cost arising from transportation. Therefore, the first term of the objective function represents the economic cost, including fixed costs and transportation costs of unmanned vehicles, and the second term represents the time cost related to the arrival time of unmanned vehicles at customer points. The formula of the objective function is given as follows:
min C total = min ( C 1 + C 2 + C 3 )
The total objective function is formulated as follows:
min C total = c F + ∑ k = 1 K f k ∑ j = 1 N x 0 j k + ∑ k = 1 K ∑ i = 1 N ∑ j = 0 j ≠ i N x i j k P i k
(4)
Constraint Functions
The fleet of logistics unmanned vehicles is required to complete all logistics delivery tasks, and each task shall be performed only once by a single unmanned vehicle. Therefore, the following constraints must be satisfied.
∑ k ∈ K ∑ i = 0 N x i j k = 1 , ∀ j = 1 , … N
The cargo weight carried by the logistics unmanned vehicle during task execution shall not exceed its load limit, which is subject to the following constraint.
∑ j = 1 N q j · ∑ i = 0 N x i j k ≤ Q , ∀ k ∈ K
In the formula, q j represents the cargo weight of task j at the customer point, and Q represents the maximum load capacity of logistics unmanned vehicle.
To ensure the route integrity of unmanned vehicles, that is, after each vehicle departs from one customer node, it must enter another customer node.
∑ i = 0 i ≠ j N x i j k = ∑ h = 0 h ≠ j N x j h k ,       j = 1 , … , N ,       k = 1 , … , K
Constraint (14) ensures that each dispatched vehicle departs from the distribution center and returns to it after completing its assigned tasks. Each vehicle is allowed to perform at most one delivery route.
∑ j = 1 N x 0 j k = ∑ i = 1 N x i 0 k ≤ 1 ,       k = 1 , … , K
Constraint (15) establishes the temporal relationship between two consecutively visited nodes. Since the service time at each customer is assumed to be zero, if vehicle k travels directly from node i to node j , the arrival time at node j must not be earlier than the arrival time at node i plus the travel time from node i to node j . When x i j k = 0 , the sufficiently large constant H renders this constraint inactive.
T j k ≥ T i k + τ i j − H 1 − x i j k i = 0 , … , N ,       j = 1 , … , N ,       i ≠ j ,       k = 1 , … , K
The customer time window [ a i , b i ] is treated as a soft constraint rather than a hard feasibility restriction. Early and late arrivals are permitted but are penalized according to the time-window penalty function in Equation (7), and the resulting penalties are aggregated in Equation (8).
Constraints (16) and (17) are the MTZ subtour-elimination constraints, which prevent customer nodes from forming isolated cycles disconnected from the distribution center and ensure the validity of the generated vehicle routes.
u i − u j + N ∑ k = 1 K x i j k ≤ N − 1 ,
1 ≤ u i ≤ N
Constraint (18) specifies the domains of the routing and arrival-time variables. The routing variable x i j k is binary, and x i i k = 0 prohibits a vehicle from traveling from a node directly back to the same node.
x i j k ∈ { 0 , 1 } ,       i , j = 0 , … , N ,       k = 1 , … , K , x i i k = 0 ,       i = 0 , … , N ,       k = 1 , … , K , T i k ≥ 0 ,       i = 0 , … , N ,       k = 1 , … , K , T 0 k = 0 ,       k = 1 , … , K .

2.2. Whale Migration Algorithm

The WMA is a novel meta-heuristic algorithm inspired by the collective and cooperative migration behavior of whales in the ocean, proposed by Mojtaba et al. Its core inspiration originates from the group cooperative migration of humpback whales. Distinct from traditional algorithms, its design focuses on “group collaboration” and “hierarchical division of labor” during humpback whale migration, rather than single predation or movement patterns, thereby achieving a dynamic balance between exploration and exploitation. The WMA incorporates a dynamic leader-follower mechanism, in which experienced adult whales act as leaders to guide the direction of the population, while other individuals behave as close followers to avoid unnecessary energy consumption. This corresponds to the hierarchical optimization mechanism of the algorithm. In the context of logistics task assignment, leaders correspond to high-quality solutions, namely those with the shortest total distance, and are responsible for exploring new assignment combinations. Followers correspond to ordinary solutions, meaning the remaining solutions converge toward the global optimal solution. Leaders represent elite solutions and undertake exploitation and local search, whereas followers maintain population diversity by imitating leaders. The leader updates its position and velocity according to the following formulas.
W i n e w = W i + r 1 ⊙ L + r 1 ⊙ r 2 ⊙ ( U − L ) , i = 1 , … , N L
The follower updates its position and velocity according to the following formulas.
W i n e w = W M e a n + r a n d ( 1 , D ) ⊙ ( W i − 1 − W i ) + r a n d ( 1 , D ) ⊙ ( W b e s t − W M e a n ) , i = N L + 1 , … , N p o p
where W i n e w denotes the updated position vector of the i -th leader, and W i denotes the current position vector of the i -th leader before update. r 1 and r 2 are random vectors with dimension 1 × D , where each element is within the range 0 , 1 , used to control the randomness of exploration. U and L represent the upper and lower bounds of the decision variables, respectively. W M e a n and W b e s t denote the average position vector of the leader group and the position vector of the global optimal solution, respectively.
The calculation formula of W M e a n is given as follows.
W M e a n = 1 N L ∑ j = 1 N L W j

2.3. Genetic Algorithm

The Genetic Algorithm (GA) is a computational model that simulates the biological evolutionary process based on Darwin’s natural selection and genetic mechanisms. It is a method for searching optimal solutions by mimicking natural evolution. Its main characteristics include direct operation on structural objects, no restrictions on derivative calculation or function continuity, inherent implicit parallelism, and superior global optimization capability. GA evolves a population of encoded candidate solutions through stochastic search mechanisms. Selection, crossover, and mutation constitute its principal genetic operators and jointly determine the exploration and exploitation performance of the algorithm [29].

3. Multi-Strategy Improved Whale Migration Hybrid Genetic Algorithm

3.1. Hybrid Genetic Algorithm Strategy

3.1.1. Binary Tournament Selection Strategy

Although the WMA has demonstrated excellent global optimization and local exploitation capabilities in various benchmark functions and engineering cases, it may suffer from performance degradation and tend to fall into local optima when solving more complex optimization problems. To address these issues, this paper proposes a multi-strategy improved whale migration hybrid genetic algorithm.
The randomly generated population produced by existing algorithms may contain a large number of low-quality individuals, resulting in poor overall population quality. Moreover, when the initial population lacks sufficient diversity or coverage, the algorithm may converge prematurely to a suboptimal solution and become easily trapped in local optima [30]. Therefore, the tournament selection of the GA is first employed to improve the quality of individuals in the initial population. Tournament selection works by randomly selecting individuals from the population to form a group and then choosing the individual with the best fitness value to enter the offspring population according to the fitness of each individual. The proposed algorithm adopts binary tournament selection, where exactly two individuals are selected as competitors. Such a small selection scale effectively improves the diversity of population screening [31].

3.1.2. Improved OX Operator

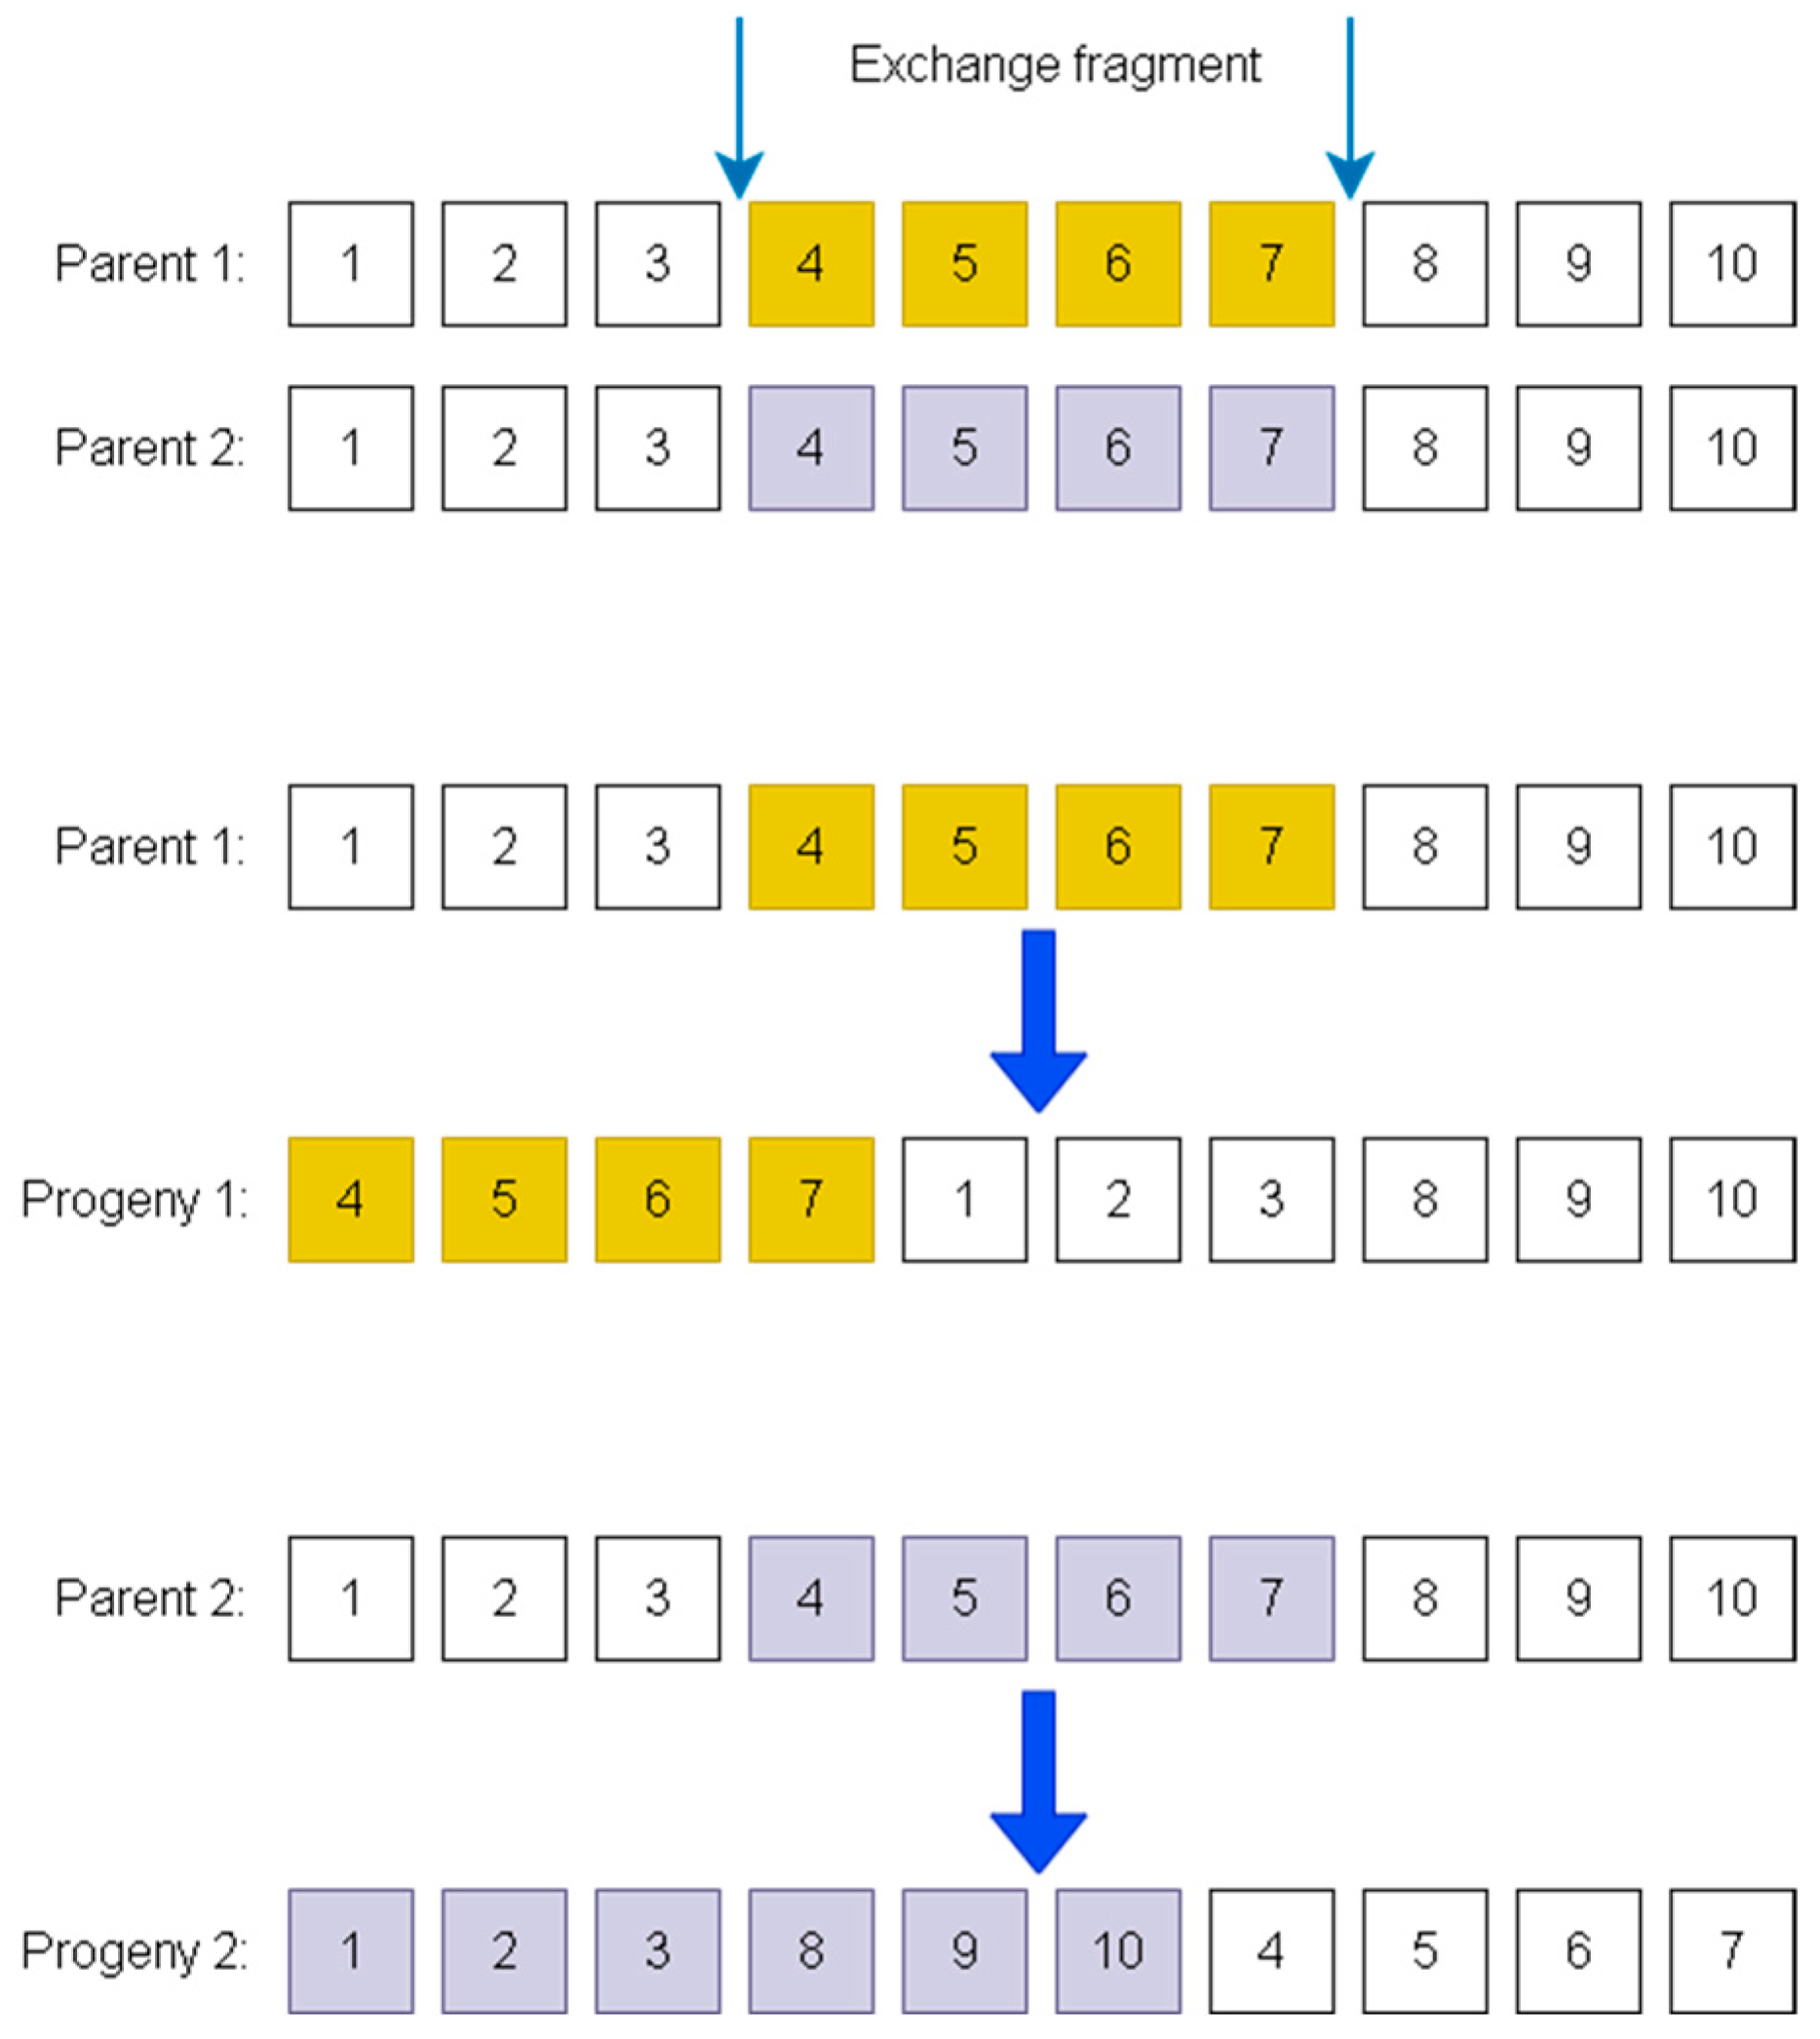
Given the characteristics of VRP path planning, simply swapping node segments in a route may destroy route feasibility, resulting in repeated visits to some nodes and omission of others. To solve this problem, researchers have proposed multiple crossover methods suitable for the VRP, such as Partially Mapped Crossover (PMX) [32] and Position Based Crossover (PBX) [33]. In this paper, the Order Crossover (OX) operator is adopted and improved to address the issue that conventional crossover operations fail to generate new offspring from identical parent individuals. The specific implementation process is as follows: the crossover subpaths are randomly determined first; the crossover segments of the two parents are placed at the head and tail of each other’s chromosomes respectively, followed by the removal of duplicate genes.
Let the two parent chromosomes be P 1 and P 2 , each represented by a permutation of all customer nodes. Two distinct crossover positions r 1 and r 2 are randomly selected, where 1 ≤ r 1 ≤ r 2 ≤ N . The customer segments between the two positions are extracted from the two parents and denoted by S 1 = P 1 [ r 1 : r 2 ] and S 2 = P 2 [ r 1 : r 2 ] .
To construct the first offspring, segment S 1 is placed at the beginning of the chromosome. Parent P 2 is then scanned from left to right, and the customer nodes that are not contained in S 1 are appended in their original order. To construct the second offspring, the customer nodes of P 1 that are not contained in S 2 are first retained in their original order, and segment S 2 is then placed at the end of the chromosome. This operation ensures that every customer appears exactly once in each offspring.
As illustrated in Figure 2, when the selected segment is (4,5,6,7), the two offspring are (4,5,6,7,1,2,3,8,9,10) and (1,2,3,8,9,10,4,5,6,7). Therefore, even when the two parent chromosomes are identical, relocating the selected segment can generate offspring with different customer visiting orders. After crossover, the resulting chromosomes are checked for customer uniqueness and route feasibility before fitness evaluation.

3.1.3. Dynamic Mutation Strategy and 2-Opt Local Search Operator

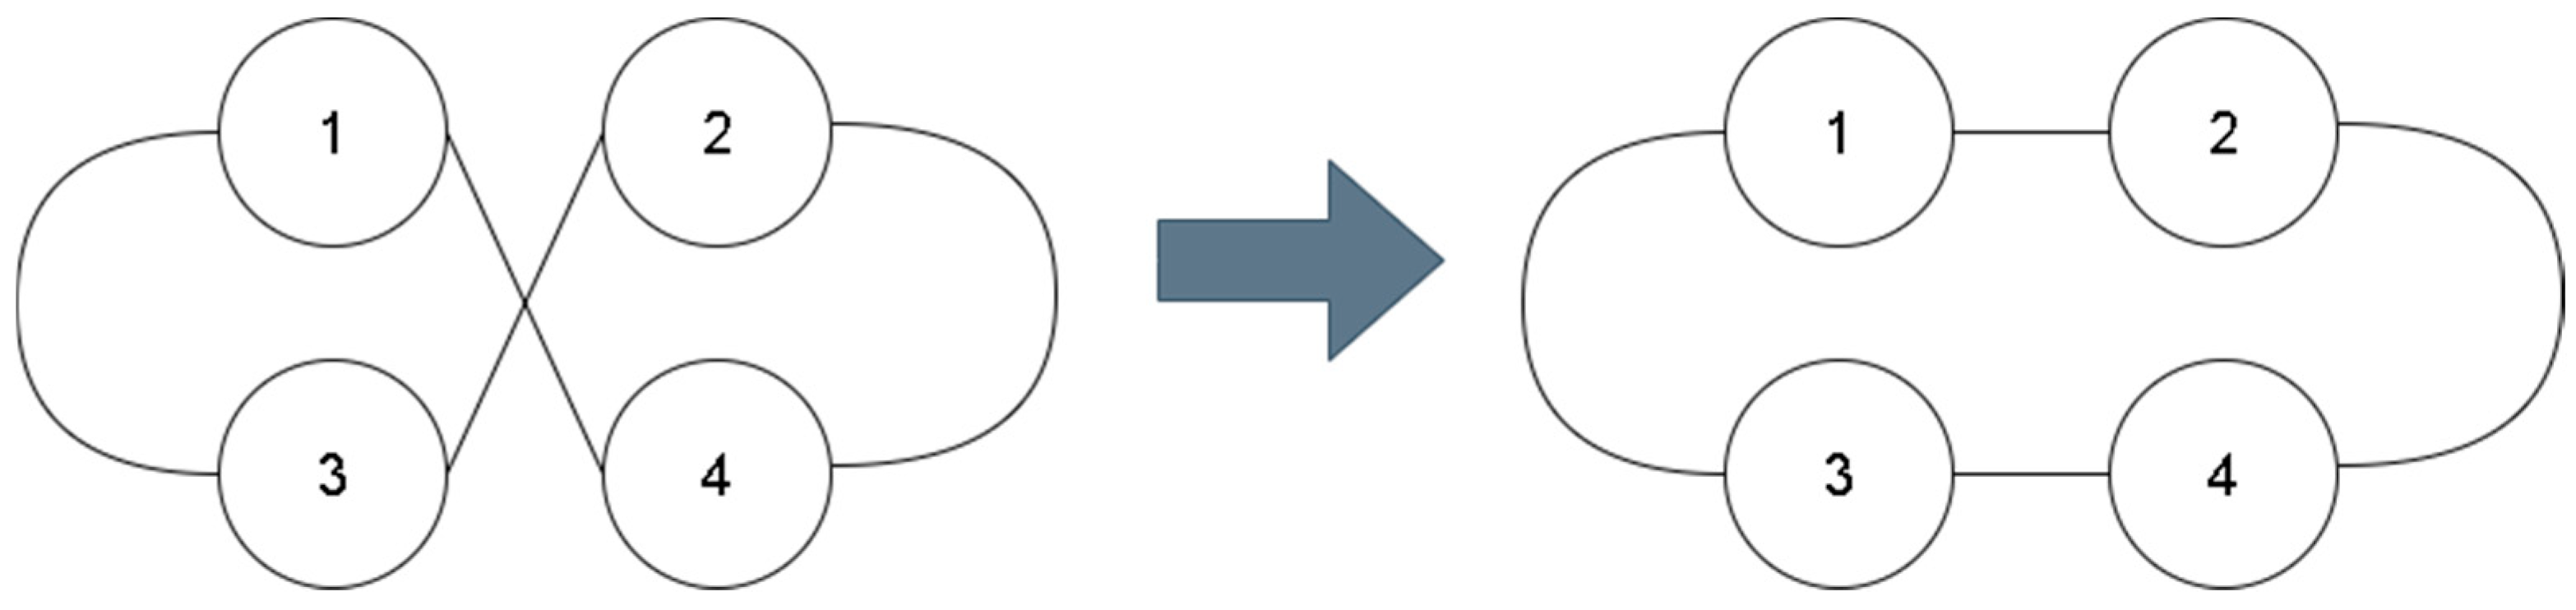
To improve route-level refinement, the 2-opt local search is applied after each offspring is decoded into vehicle-specific routes. When the local-search condition is satisfied, one nonempty vehicle route containing at least four customer nodes is selected. Two different positions within this route are then randomly chosen, and the customer subsequence between them is reversed. The operation is performed only within a single vehicle route and therefore does not change the assignment of customers to vehicles.
Since the customer set assigned to the selected vehicle remains unchanged, the total load of the route is not affected by the 2-opt operation. However, the visiting order and arrival times may change. Therefore, after each 2-opt move, the travel distance, load-dependent energy consumption, customer arrival times, time-window penalties, and total objective value are recalculated. The modified route is accepted only if it produces a lower total cost; otherwise, the original route is retained.
In each generation, the 2-opt operation is applied independently to each offspring with probability P L S = 0.2 . The procedure is repeated until no improving 2-opt move can be found or the preset local-search limit is reached. As shown in Figure 3, the schematic of the 2-opt operator is displayed.
In addition, this paper improves the mutation operation. To avoid the GA from falling into local optima in the early stage of evolution, a dynamic mutation strategy is introduced, which increases the mutation probability in the early stage to help the algorithm escape local optima and gradually reduces the mutation probability in the later stage, greatly improving the stability of the algorithm [34].
P m = P m a x × 1 − t T m a x
where P m is the mutation probability of the algorithm, t denotes the current iteration, and T max represents the total number of iterations. As the iteration increases, the mutation probability decreases gradually, which ensures better exploration in the early stage and satisfactory stability in the later stage of the algorithm.
A linearly decreasing mutation probability is adopted to balance global exploration and local exploitation during different stages of the optimization process. At the beginning of the search, a relatively high mutation probability introduces greater route diversity and reduces the risk of premature convergence. As the iteration proceeds, the population gradually approaches promising regions, and excessive mutation may destroy high-quality route structures. Therefore, the mutation probability is gradually reduced to improve local refinement and convergence stability. The linear schedule is selected because it provides a smooth and easily interpretable transition from exploration to exploitation without introducing additional control parameters. Compared with an abrupt or fixed mutation strategy, it avoids sudden changes in the search behavior and maintains consistent adjustment throughout the optimization process.

3.2. Hierarchical Competition Strategy

The proposed hierarchical competition strategy is inspired by existing hierarchical and competitive swarm mechanisms, such as hierarchical particle swarm optimization [35] and adaptive competitive swarm optimization [36]. Different from directly applying these mechanisms, this study adapts hierarchical and competitive learning ideas to the WMA-GA framework for discrete multi-unmanned-vehicle task assignment. The original WMA leader–follower mechanism is retained as the basic update framework, while follower individuals are further divided into fitness-based layers and updated through intra-layer competition to balance local exploitation and global exploration.
Based on the original WMA leader–follower mechanism, this study further introduces a fitness-based hierarchical competition strategy to enhance information exchange among follower individuals.
The hierarchical competition strategy is particularly suitable for multi-unmanned-vehicle task assignment because each solution simultaneously determines customer-to-vehicle assignment and customer visiting sequences. Small changes in the encoded solution may therefore affect route structure, vehicle capacity, and time-window satisfaction, producing a discrete search space with many local optima. Under the conventional leader–follower mechanism, followers may rapidly converge toward a limited number of elite solutions, causing alternative task-allocation and routing patterns to disappear prematurely. To alleviate this problem, followers are divided into fitness-based levels, and local competition is performed between neighboring individuals within the same level. Winners learn from higher-level solutions, while inferior individuals learn from competitive individuals within their own level. This mechanism enables high-quality assignment information to spread gradually rather than forcing the entire population toward one global leader. It also preserves diverse vehicle-assignment and route-ordering patterns, thereby reducing premature convergence and improving the search for high-quality feasible solutions under capacity and time-window constraints.
The Followers are stratified into hierarchical levels, with a local competition mechanism introduced among individuals at the same level. This mechanism strengthens the local optimal search capability by enabling individuals to learn through comparison with their neighboring peers. For each pair of whale individuals W i and W j , the Euclidean distance between them is calculated according to Equation (23).
d i j = W i − W j 2 = ∑ k = 1 d W i , k − W j , k 2
For each whale individual W i , the nearest individual in the same layer needs to be identified, satisfying Equation (24). The winning and losing individuals are determined through fitness evaluation: the winner is allowed to learn from individuals in higher hierarchical levels, while the loser can only refer to leading individuals within the same layer.
j * = arg min j ≠ i d i j
Following the introduction of the hierarchical competition strategy, the positions of winners and losers in the Followers layer are updated according to the following equations. Equation (25) corresponds to the position update formula for winners, while Equation (26) is for losers.
W i new = W Mean ( l ) + rand ( 1 , D ) ⊙ W j * ( l ) − W i + rand ( 1 , D ) ⊙ W Best − W Mean ( l )
W i new = W Mean ( l ) + rand ( 1 , D ) ⊙ W j * ( l ) − W i + rand ( 1 , D ) ⊙ W leader ( l ) − W Mean ( l )
Based on the aforementioned hierarchical competition strategy, each whale individual gains the opportunity to cooperate with a greater number of other whale individuals. In addition to leveraging its own personal best solution, each individual also has the chance to collaborate with multiple higher-performing peers as well as the leaders. Through this collaborative mechanism, richer local information is acquired, thereby enhancing its capability to explore local optimal solutions.

3.3. Whale Migration Hybrid Genetic Algorithm

In the logistics transportation task allocation problem, significant challenges arise from resource scheduling, dynamic task requirements, and the coupling of multiple constraints. Conventional swarm intelligence algorithms suffer from limitations, including insufficient local exploration accuracy, slow late-stage convergence, and low feasibility of obtained solutions [37]. The WMA-GA proposed in this paper is designed to address these issues and deliver more precise solutions to the problem at hand.
The overall procedure of the proposed WMA-GA is summarized as follows.
First, the initial task allocation and route schemes are generated based on the WMA to complete population initialization. Subsequently, the binary tournament selection strategy is used to screen high-quality parent populations, and the improved OX operator is adopted to realize gene fusion of excellent solutions. Combined with the 2-opt local search operator and the iteration-dependent mutation probability, diverse offspring populations are generated. Afterwards, the mutated population is divided into leader and follower levels according to fitness values. Position exploration is implemented under the guidance of the mean value of leaders and the core mechanism of the follower hierarchical competition strategy. Finally, the algorithm gradually converges to the global optimal solution through iterative optimization.
The parameter settings of the proposed WMA-GA are determined based on the characteristics of vehicle routing optimization and widely accepted empirical values in existing studies. The crossover probability p c is set to 0.8, which ensures population update efficiency while retaining excellent individual schemas. The mutation probability adopts a linear adaptive decreasing strategy with a maximum base value of 0.15: high mutation probability maintains population diversity and avoids premature convergence in the early iteration stage, while the probability gradually decreases to stabilize the convergence direction in the late stage. The 2-opt local search probability P L S is set to 0.2, which improves local optimization accuracy on the premise of controlling additional computational cost.
The proposed algorithm provides a reliable theoretical and algorithmic support for the efficient allocation of complex logistics distribution tasks. The operational flow of the algorithm is encapsulated in the procedure outlined in Algorithm 1.
Algorithm 1 WMA-GA
Inputs: Population size N , maximum number of iterations M a x I t e r , crossover probability P c , maximum mutation probability P m max , local search probability P L S
Outputs: optimal solution W b e s t
1. Initialize population w i , v i , calculate fitness values, and record the optimal value
2. for gen = 1 to M a x I t e r do
3. // GA module
4.   Select parent population via binary tournament selection
5.   for each pair in parent population do
6.   if rand() < P c then
7.    Perform improved OX to generate offspring
8.   else
9.    Keep parents as offspring
10.   end if
11.        P m   =   P m max × 1 − g e n / T
12.   for each offspring in Offspring do
13.     if rand() < P m then
14.      Perform mutation
15.     end if
16.     if rand() < P L S
17.      Perform 2-opt local search
18.     end if
19.     Update the population individuals
20.   end for
21.   // WMA module
22.   Sort the population by fitness and divide into layers
23.   for each individual m do
24.     if individual m is a follower then
25.      Search for neighboring individuals in the same layer for competition
26.       if the fitness of the individual is better than that of the neighboring individual
27.       Update position according to Equation (25)//Winner update: local exploitation
28.       else
29.       Update position according to Equation (26)//Loser update: global exploration
30.       end if
31.     else//individual m is a leader
32.     Update position according to Equation (19)//Leader update: convergence guidance
33.     end if
34.   end for
35. Calculate fitness values, retain better individuals, and update the global best
36. end for
37. Output the optimal solution W b e s t

4. Testing and Result Analysis of the WMA-GA

4.1. Test Function Selection

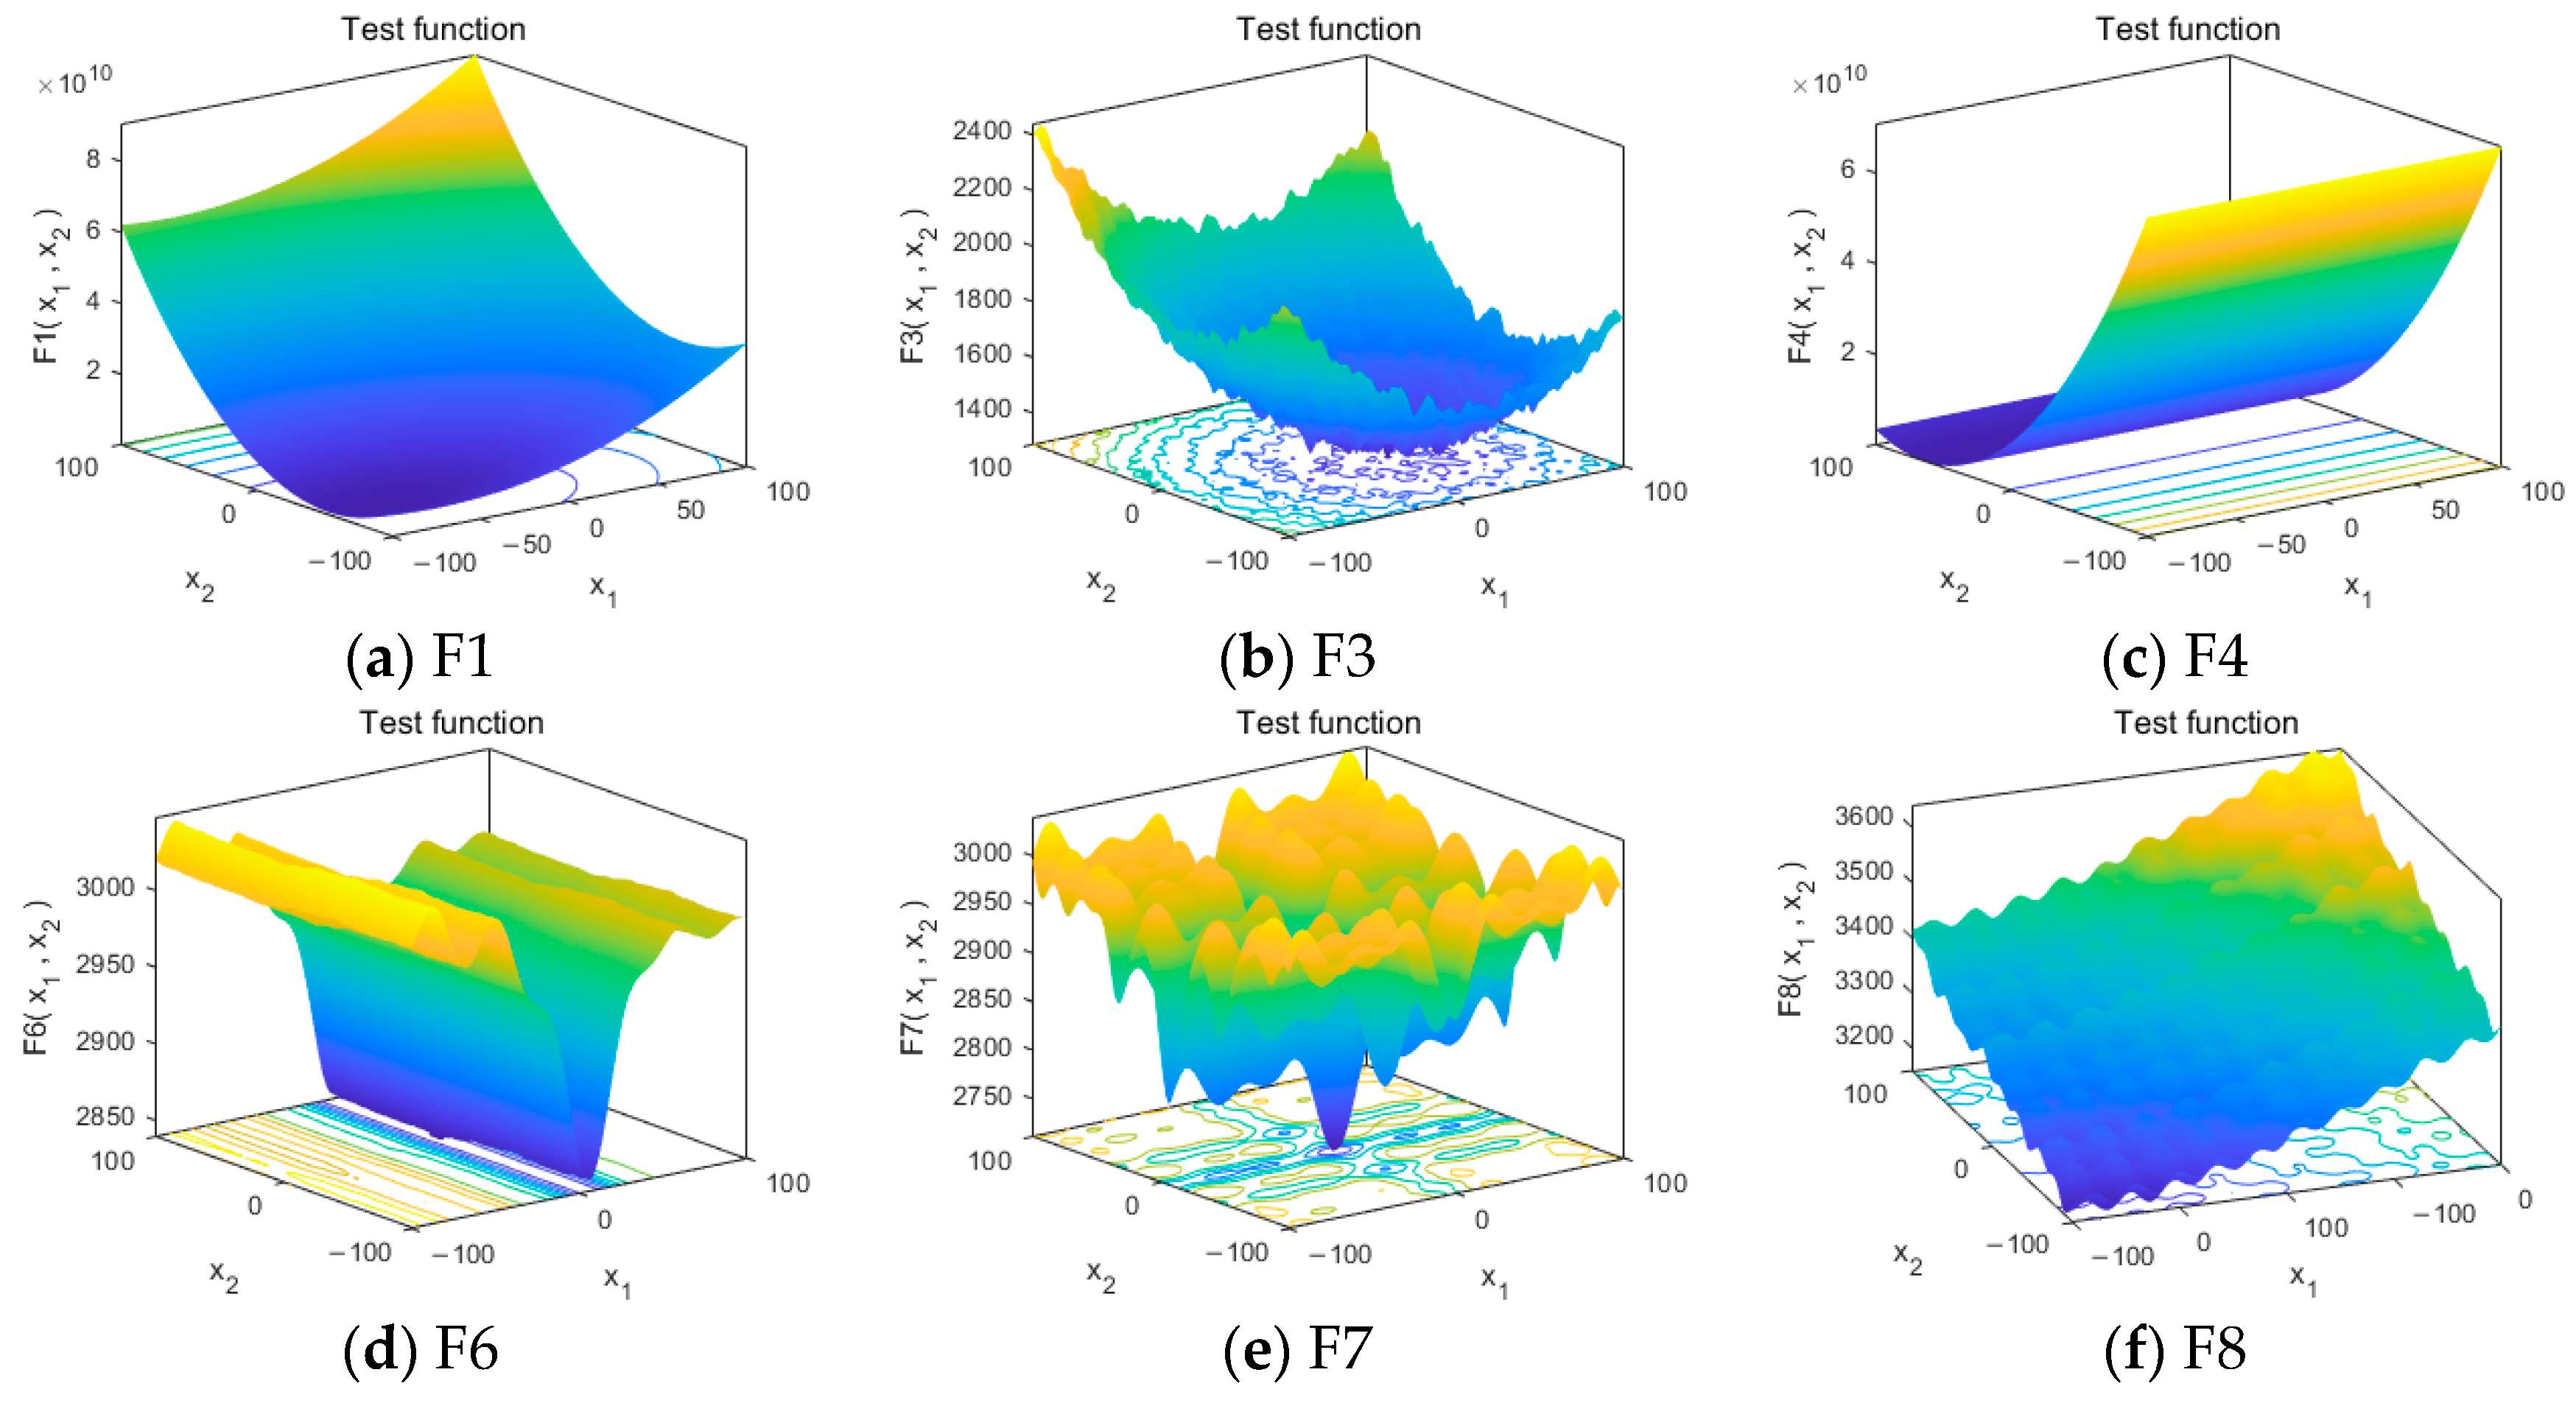
To fully verify the comprehensive performance of the proposed WMA-GA in terms of global search, local exploitation, and convergence speed, and to further analyze its advantages and characteristics in the optimization process, nine standard test functions are selected for the experiments, namely, unimodal function (F1), multimodal functions (F2, F3), hybrid functions (F4, F5, F6), and composite functions (F7, F8, F9). Continuous benchmark functions can effectively evaluate the fundamental search capability of the algorithm and verify the rationality of improved strategies, which lays a solid foundation for solving practical problems. The selected test functions cover F1 to F9, and their detailed parameters are presented in Table 2.
It should be emphasized that these continuous benchmark functions do not directly model the discrete multi-unmanned-vehicle task assignment problem. Their purpose is to evaluate the fundamental search characteristics of WMA-GA independently of the task-specific encoding and constraints. The different function types correspond to optimization difficulties also encountered in task assignment. Unimodal functions evaluate convergence and local refinement around a promising solution. Multimodal functions examine whether the algorithm can escape local optima generated by different customer-assignment and route-ordering combinations. Hybrid and composition functions evaluate robustness in complex landscapes, which is relevant to the coupled effects of transportation cost, vehicle utilization, capacity constraints, and time-window penalties. Therefore, the benchmark experiments provide auxiliary evidence regarding the optimization mechanisms of WMA-GA, whereas its applicability to unmanned-vehicle task assignment is directly evaluated through the constrained small-, medium-, and large-scale instances in Section 5.

4.2. Algorithm Performance Test

4.2.1. Time Complexity Analysis of the Algorithm

To further evaluate the computational efficiency, feasibility, and effectiveness of the WMA-GA in complex task allocation problems, in swarm intelligence optimization algorithms, time complexity refers to the number of evolutionary iterations required for the algorithm to obtain the optimal or suboptimal solution of an optimization problem [38]. The time complexity of the proposed algorithm is analyzed as follows.
Let N P denote the population size, D the chromosome length, and T max the maximum number of iterations. Population initialization and fitness evaluation require O ( N p D ) . In each iteration of the original WMA, population sorting requires O ( N P log N P ) , while leader–follower position updating and fitness evaluation require O ( N P D ) . Therefore, the complexity of the original WMA is O ( N P D + T max ( N P log N P + N P D ) ) .
The additional modules of WMA-GA introduce further computational costs. Because binary tournament selection uses a fixed tournament size of two, its complexity is O ( N P ) . The improved OX reconstructs chromosomes of length D and therefore requires O ( P c N P D ) , where P c is the crossover probability. The segment-based mutation operation requires O ( P m N P D ) , where P m is the mutation probability.
The 2-opt operator has a higher computational cost. Let d k denote the number of customers assigned to vehicle k . Examining all candidate edge pairs in one 2-opt pass requires O ( ∑ k = 1 K d k 2 ) ≤ O ( D 2 ) . If the local search is activated with probability P L S and performs R 2 o p t passes before satisfying its stopping condition, its expected cost per iteration is O ( P L S N P R 2 o p t D 2 ) .
For hierarchical competition, identifying the nearest individual within each level by direct pairwise distance calculation requires at most O ( N P 2 D ) . Combining all components, the total complexity is:
O ( N P D + T max [ N P log N P + N P D + P c N P D + P m N P D + P L S N P R 2 o p t D 2 + N P 2 D ] )
After retaining the dominant terms, the complexity can be expressed as:
O ( T max [ N p 2 D + P L S N p R 2 o p t D 2 ] )
Thus, the proposed WMA-GA has a higher computational complexity than the original WMA, mainly because of 2-opt local search and hierarchical competition. However, P L S is set to 0.2, so 2-opt is not applied to every individual in every iteration. The additional computational cost is exchanged for improved local search accuracy, population diversity, and final solution quality.

4.2.2. Results Analysis

The proposed WMA-GA is compared with five representative metaheuristic optimizers, including the original Whale Migration Algorithm (WMA), Genetic Algorithm (GA), Grey Wolf Optimizer (GWO) [39], Dung Beetle Optimizer (DBO) [40], and Sparrow Search Algorithm (SSA) [41], in terms of iterative performance on the test functions presented in Table 3. Each algorithm is executed independently 30 times for each test function on the same system. To ensure the fairness and consistency of the experiments, the population size of all algorithms is uniformly set to 50, and the maximum number of function evaluations (iterations) is fixed at 500. The optimization performance is evaluated using three key metrics: the mean value, standard deviation, and the best experimental result.
To ensure the fairness of the comparison, the algorithm-specific parameters of GA, SSA, GWO, DBO, and WMA were adopted from the recommended settings reported in their corresponding reference publications [28,37,38,39,42] and were kept unchanged throughout the experiments. These parameters were not additionally tuned using the final test instances. The parameters of WMA-GA were determined through the sensitivity analysis presented in Section 5.3.
It should be noted that GA, SSA, GWO, DBO, and the original WMA were evaluated using their recommended reference/default parameter settings and were not additionally tuned for the specific task-assignment instances in this study. In contrast, the proposed WMA-GA used a unified parameter setting selected through the sensitivity analysis in Section 5.3. Therefore, the comparison should be interpreted as a reference/default-parameter baseline comparison versus a sensitivity-selected WMA-GA setting, rather than as a fully equal-budget parameter-tuning comparison for all algorithms.
Within each experiment, all algorithms used the same problem instances, objective function, population size, maximum number of iterations, stopping criterion, hardware and software environment, and number of independent runs. Thus, the algorithms were compared under the same iteration budget rather than the same wall-clock-time budget. Since WMA-GA contains additional genetic operations, 2-opt local search, and hierarchical competition, its computational cost per iteration is higher. Therefore, CPU time is reported together with the objective value to provide a transparent comparison between solution quality and computational efficiency.
Table 3 presents the experimental results evaluated using three key indicators: mean value, standard deviation, and best value.
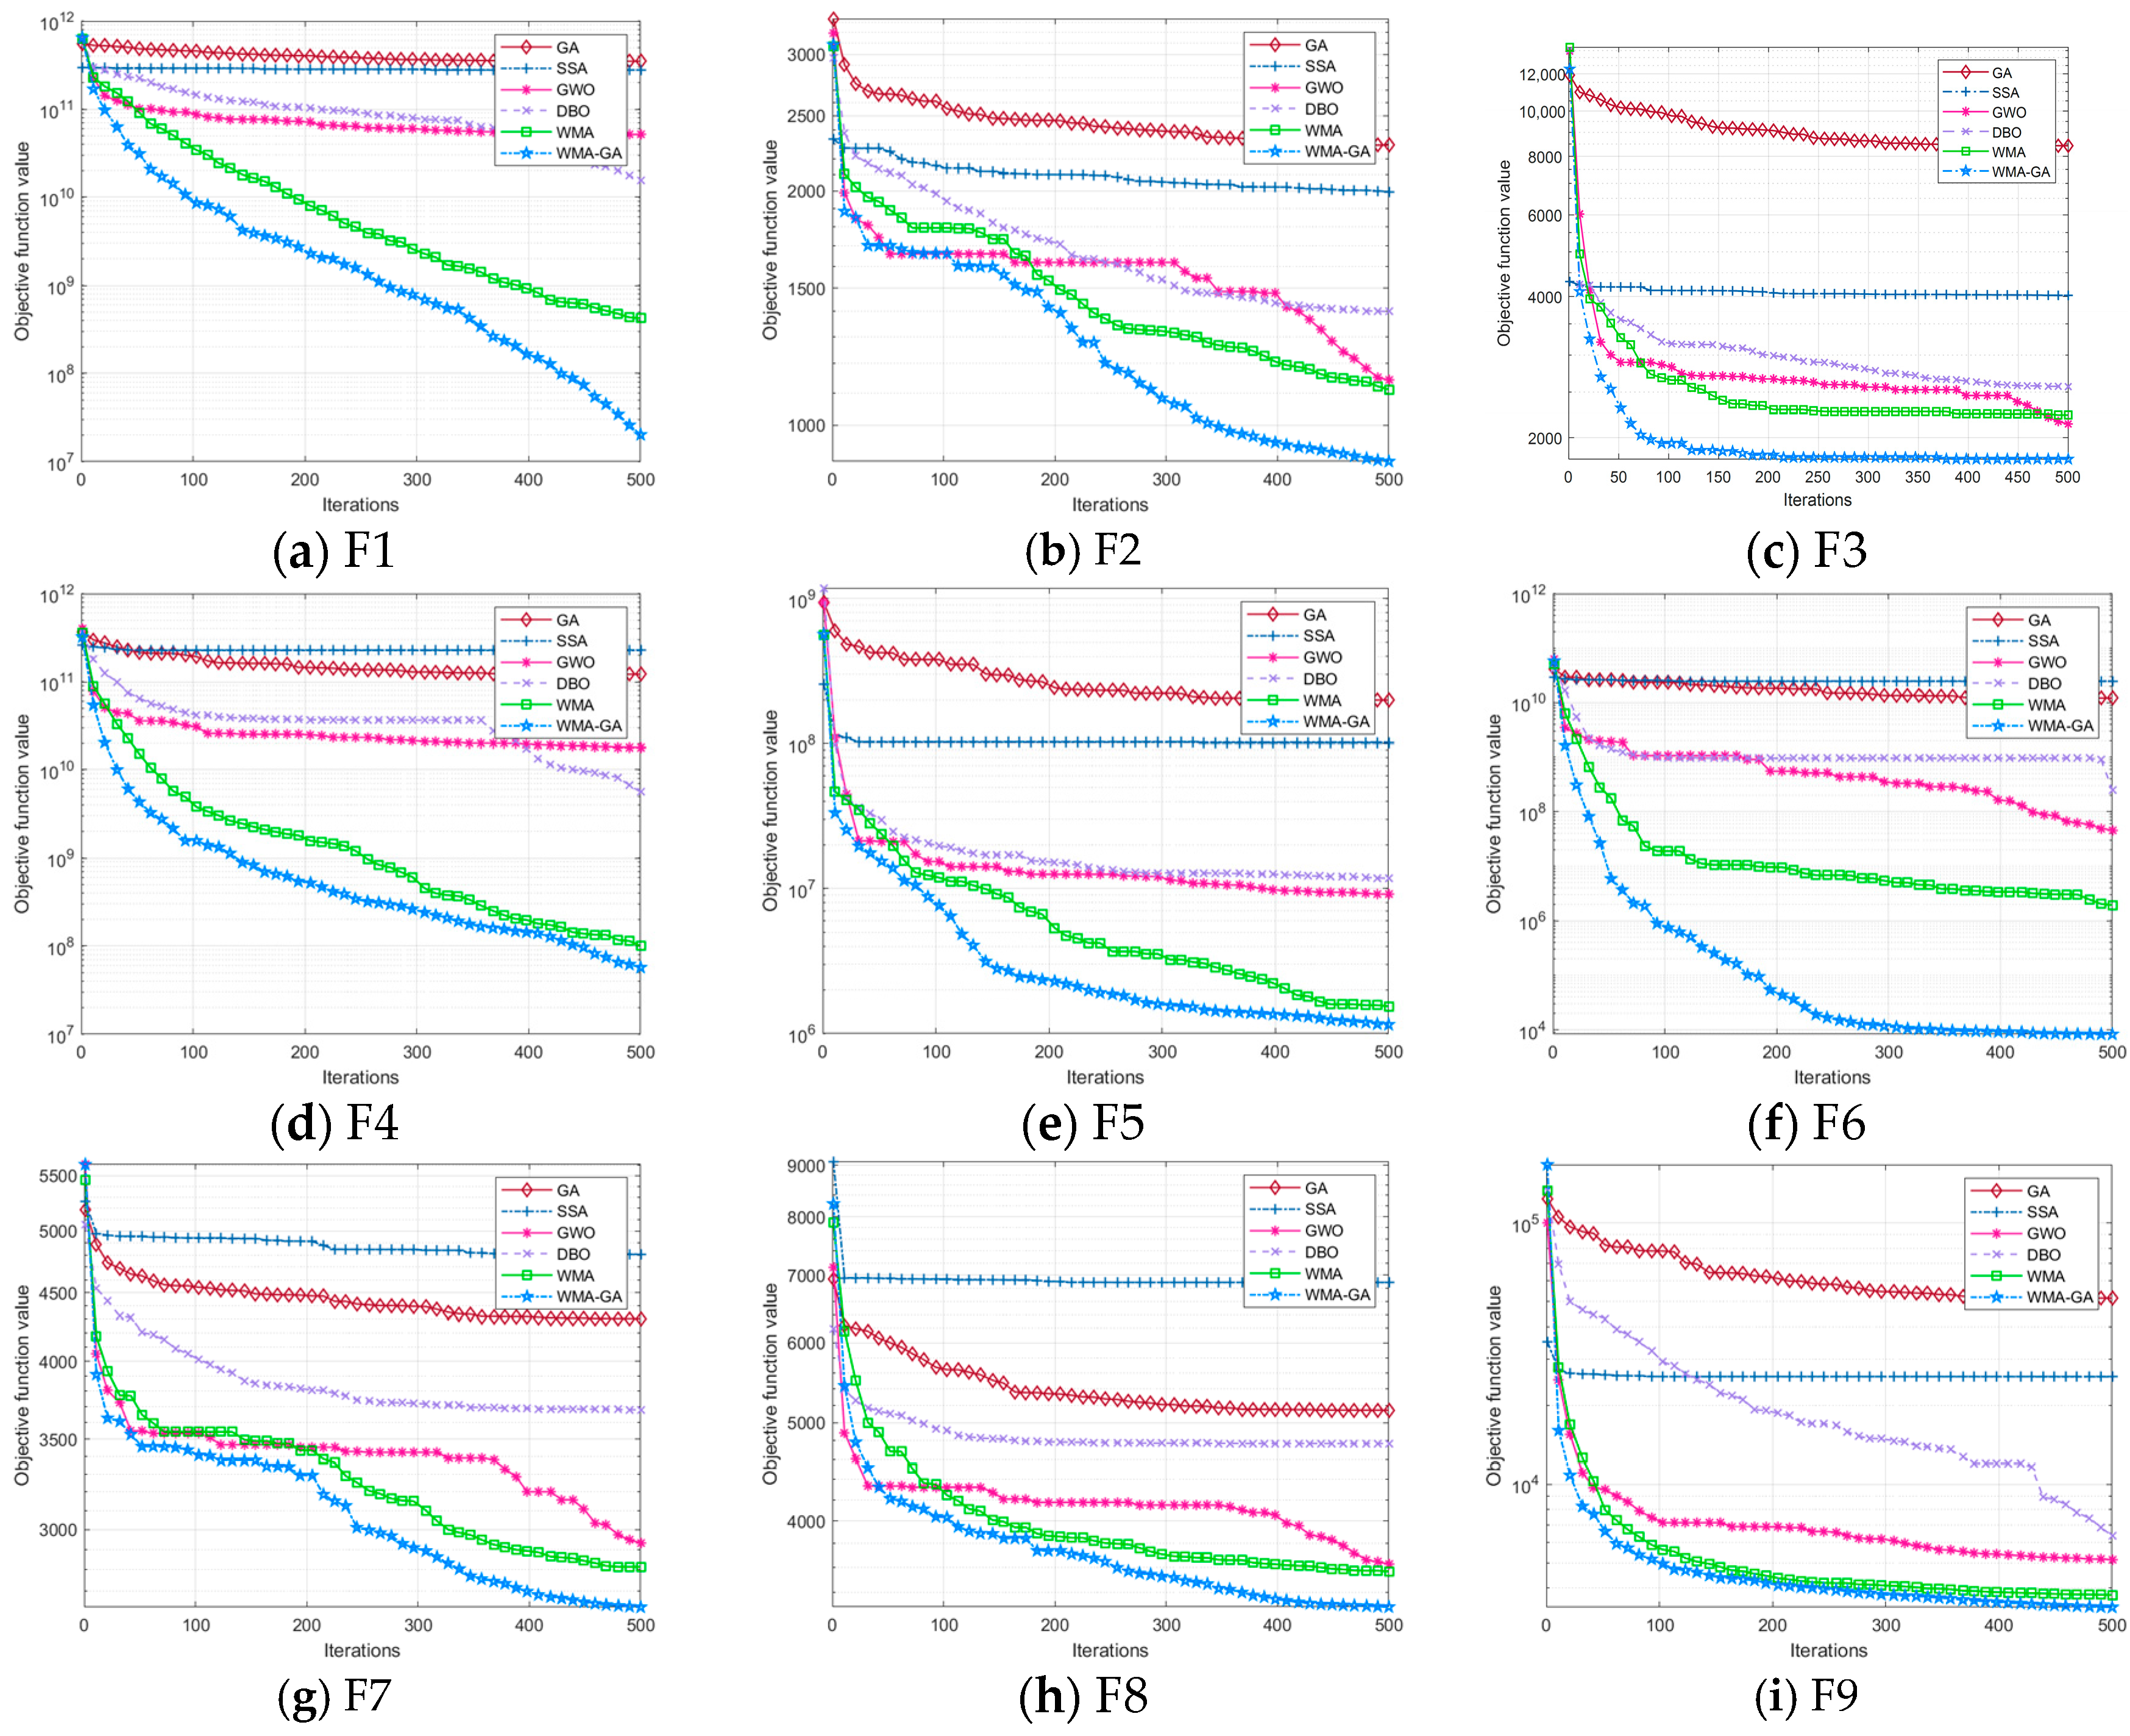
For the multimodal test function F3 shown in Figure 4, the WMA is prone to falling into local optima due to insufficient population diversity, resulting in decreased optimization accuracy. The proposed WMA-GA effectively improves the population’s exploration ability by introducing a tournament selection strategy and improved genetic operators.
For the hybrid functions F4 and F6, which are composed of sub-functions with different characteristics, the optimization space is complex with strong interference from local optima. Traditional algorithms often fall into local optima or suffer from convergence stagnation due to difficulty in balancing exploration and exploitation. The proposed WMA-GA achieves a dynamic balance between global exploration and local exploitation by combining the genetic algorithm with the whale migration algorithm, significantly improving the optimization performance and robustness on hybrid optimization problems.
For the composite functions F7 and F8, which are formed by weighted combinations of sub-functions with different characteristics, the optimization space contains multiple independent local optimal basins with complex spatial structures and strong multimodal interference. Traditional algorithms often lose direction among different optimal regions or fall into local optima due to insufficient convergence stability, making it difficult to obtain reliable global optimal solutions. By introducing a hierarchical competition strategy, the proposed WMA-GA further enhances global and local search capabilities, effectively improving the optimization stability and robustness under composite optimization problems.
It can be observed from the tables that the proposed WMA-GA yields better and more competitive results than other optimizers for most of the test functions under all the above criteria. Under identical experimental conditions for optimizing real-parameter functions, the proposed algorithm outperforms these conventional metaheuristic optimizers in the comparative study.
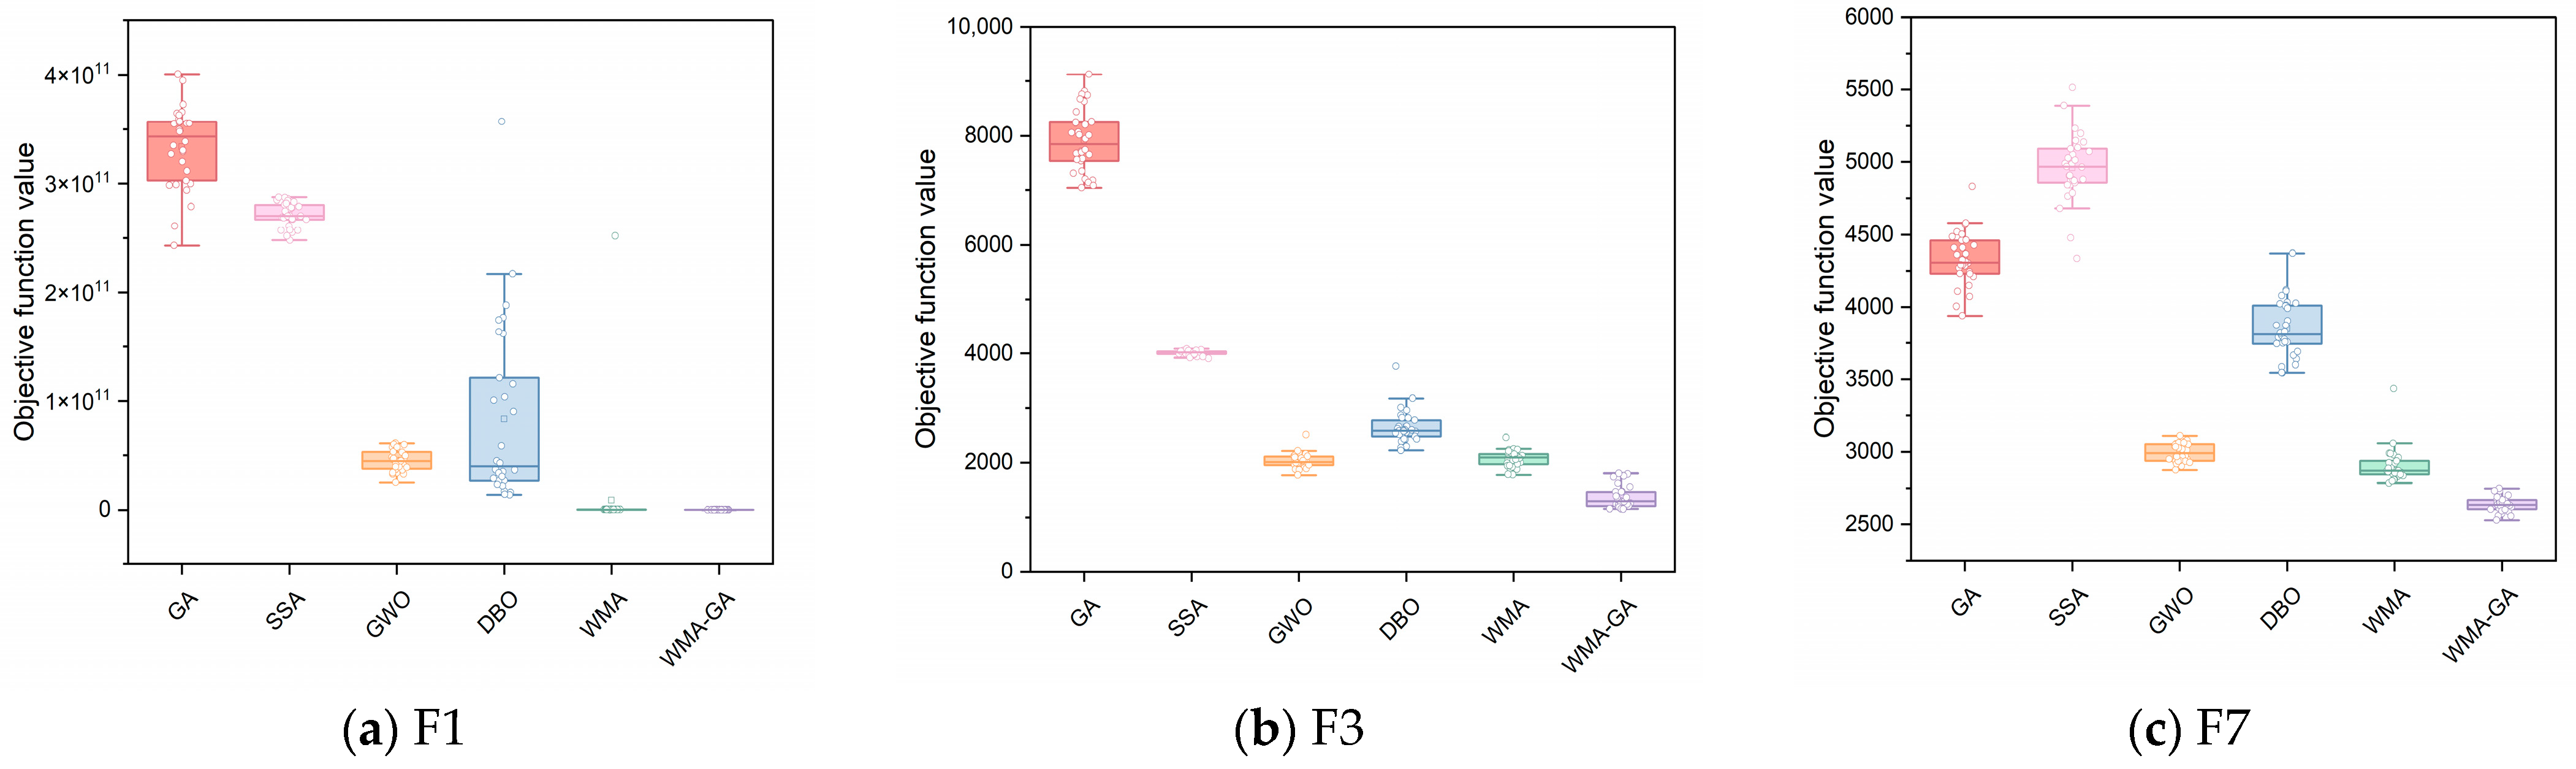
As can be observed from the box plot of optimization accuracy in Figure 5, compared with other algorithms, the box plot of WMA-GA is narrower and the corresponding fitness values are lower, which demonstrates the strong capability of the proposed algorithm in solving complex problems. For the unimodal function F1, WMA-GA achieves a significantly lower average value than the other algorithms, marking a substantial improvement over the original WMA. For the multimodal function F3, WMA-GA exhibits excellent robustness and is less prone to falling into local optima. For the composite function F7, despite the increased complexity of the function, the fitness value of WMA-GA remains far lower than that of the other algorithms, verifying its remarkable performance in addressing complex problems. In conclusion, WMA-GA can effectively solve problems involving unimodal, multimodal, hybrid, and complex functions, and the test results fully demonstrate the superiority of the proposed algorithm.
WMA-GA performs significantly better than most other algorithms. In terms of performance, its closest competitors are WMA and GWO. Overall, the convergence curves can intuitively characterize the optimization processes of various algorithms, while clearly revealing their global convergence properties and ability to escape from local optima. As illustrated in Figure 6, in this evaluation, WMA-GA is the most robust and efficient optimization algorithm, which converges rapidly on both unimodal and multimodal functions. WMA-GA achieves the best average ranking, highlighting its superior performance, whereas WMA and GWO rank second and third, respectively. On these specific test functions, namely the nine distinct benchmark functions, the WMA-GA exhibits outstanding performance, demonstrating superior convergence accuracy and favorable robustness compared with other algorithms.
In summary, the WMA-GA demonstrates strong global search ability and local exploitation capability, enabling it to effectively solve complex problems and consistently outperform other compared algorithms. This performance advantage can be attributed to the integration of the hierarchical competition strategy and the leader-follower mechanism, which facilitates more comprehensive exploration of the solution space and helps the algorithm effectively escape local optima. In particular, the introduction of the improved OX operator and the adaptive 2-opt mutation strategy strengthens the algorithm’s local search capability, significantly improves its solution accuracy, and further verifies the effectiveness and superiority of the WMA-GA algorithm.
The benchmark results indicate that WMA-GA has strong exploration, exploitation, convergence, and robustness. These properties are beneficial for task assignment because changes in customer allocation or visiting order may produce substantially different route costs and constraint violations. However, the benchmark functions do not include the discrete encoding, vehicle-capacity constraints, or customer time windows of the actual problem. Therefore, these results should be regarded as mechanism-level validation rather than direct evidence of task assignment performance. The practical effectiveness of the algorithm is further verified in Section 5 using task-specific instances and constraints.

4.2.3. Statistical Analysis

To determine whether the observed performance differences were statistically significant, the two-sided Wilcoxon rank-sum test was consistently applied to all comparative experiments. This non-parametric test was selected because the results obtained from independent algorithm runs could not be assumed to follow a normal distribution.
For the benchmark-function and task-assignment experiments, WMA-GA was compared separately with each competing algorithm. For the ablation study, the complete WMA-GA was compared with each ablation variant. In the parameter-sensitivity analysis, the selected parameter setting was compared with each alternative setting. Holm’s correction was applied within each group of comparisons to control the family-wise error rate. The significance level was set to α = 0.05 , and a Holm-adjusted p-value below 0.05 was regarded as statistically significant. The Holm-adjusted Wilcoxon rank-sum test results for the benchmark functions are presented in Table 4.

5. Multi-Task Assignment of Multiple Unmanned Vehicles Based on the Whale Migration Algorithm Combined with the Genetic Algorithm

5.1. Application of WMA-GA in Task Allocation for Logistics Unmanned Vehicles

In the logistics task allocation problem, task allocation serves as a core optimization issue in the digital transformation of intelligent logistics and supply chains. It aims to achieve the optimal matching between distribution tasks and execution agents under multi-dimensional constraints. Through task priority ranking and resource collaborative scheduling, single or multi-objective optimization requirements can be fulfilled, such as minimizing total transportation cost, maximizing task completion efficiency, optimizing resource utilization, and improving customer satisfaction [43]. This problem is essentially a typical NP-hard combinatorial optimization problem, whose complexity significantly increases with the expansion of task scale, the enhancement of execution agent heterogeneity, and the introduction of dynamic environmental factors. Traditional allocation methods based on rules or heuristics can no longer meet the high requirements of modern logistics systems for scheduling accuracy and efficiency due to their lack of global optimization capability and dynamic adaptability [42]. In this context, to effectively solve the task allocation problem, this study embeds the constructed task allocation model into the hybrid algorithm framework combining the WMA and GA. Through adaptive adjustments to the WMA and the synergy of genetic algorithm operations, the optimization of the total cost of unmanned vehicles is achieved.
(1)
Encoding and Decoding
In this study, each whale individual W i represents a task allocation scheme for express delivery unmanned vehicles. Assume there are N customer nodes and K unmanned vehicles, and the encoding of each whale individual includes the following contents:
Delivery sequence: A path encoding method is adopted, where each whale individual W i is represented as a vector containing the order of customer nodes, denoted as x i = ( x i 1 , x i 2 , … , x i N ) . In this vector, x i j denotes the j -th customer node visited by the unmanned vehicle in sequence. This path satisfies the constraint conditions that all nodes are visited only once and finally return to the warehouse node.
Unmanned vehicle assignment: A specific delivery unmanned vehicle is assigned to each customer node. An unmanned vehicle assignment vector k i = ( k i 1 , k i 2 , … , k i N ) is defined, where k i j ∈ { 1 , 2 , … , K } denotes the number of the unmanned vehicle assigned to serve customer node x i j . This assignment vector satisfies the constraints of unmanned vehicle capacity and total path cost.
The overall representation is W i = ( x i , k i ) , where x i and k i represent the path sequence and unmanned vehicle assignment information, respectively, and together constitute a complete task allocation scheme.
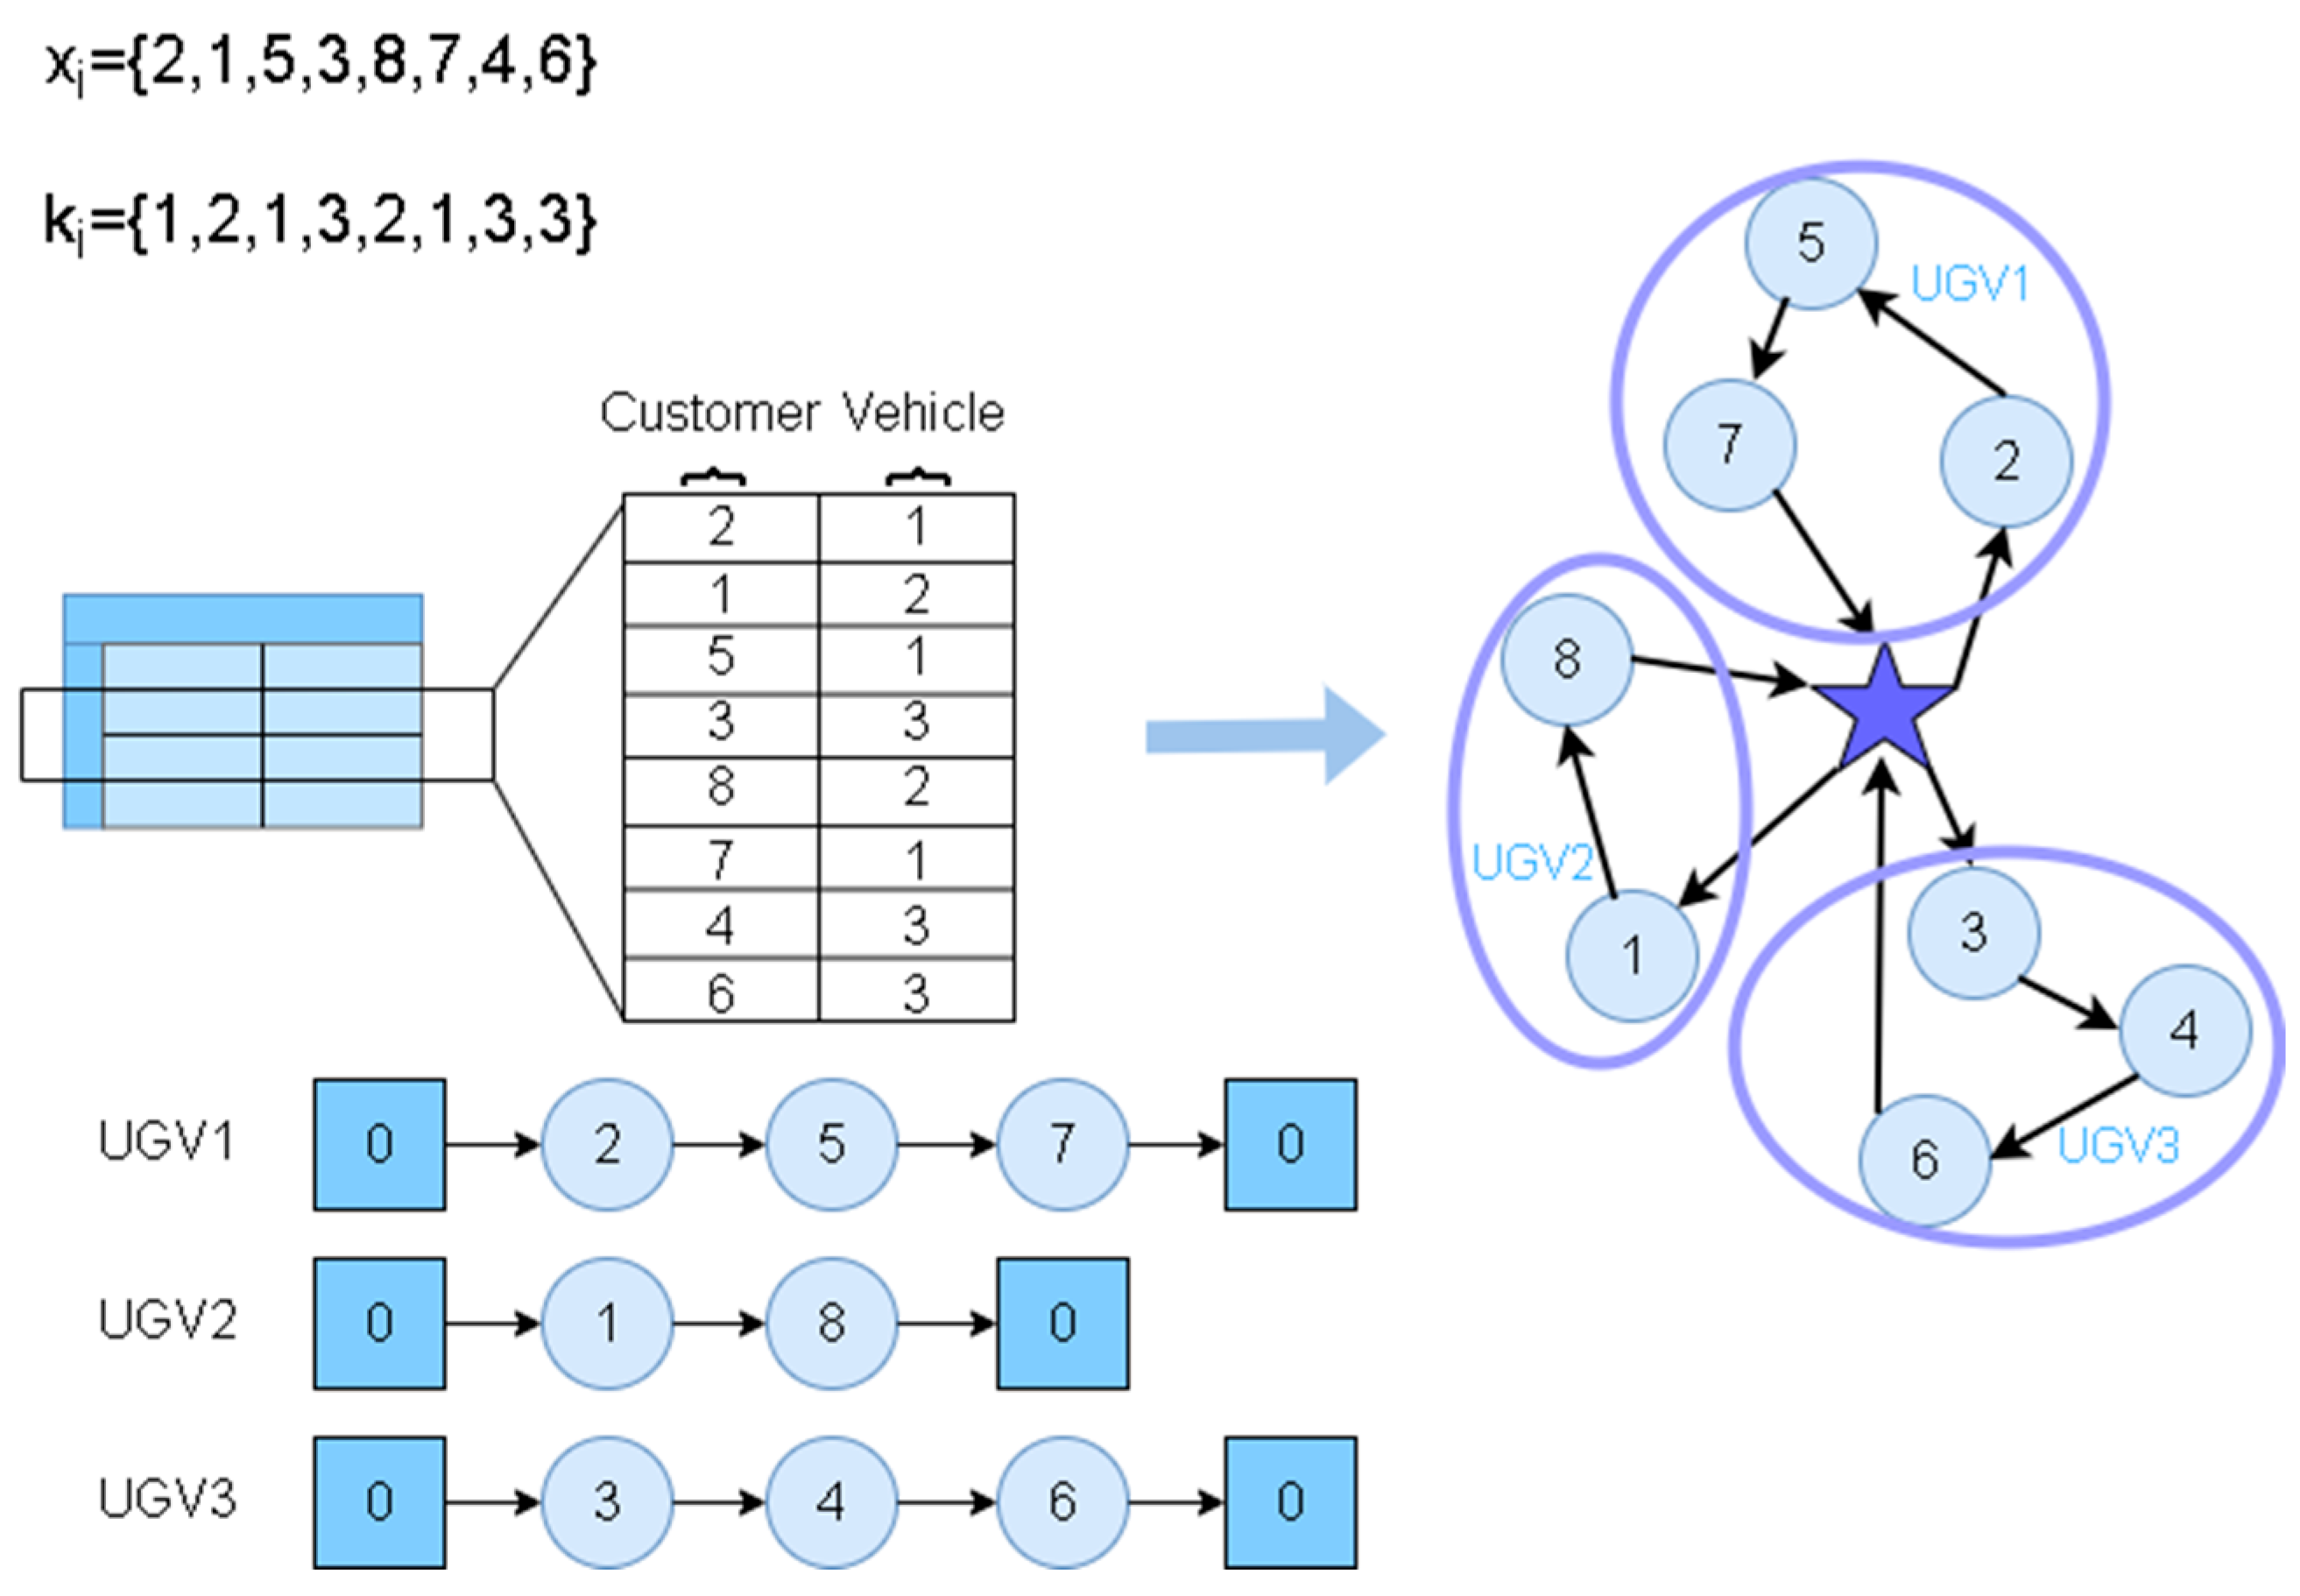
During decoding, the customer-sequence vector is scanned from left to right. Customers assigned to the same vehicle are extracted in their original order to construct that vehicle’s delivery route. The distribution center, denoted by node 0, is then inserted at the beginning and end of each nonempty route. Figure 7 provides an example of the encoding and decoding process. The customer-sequence vector is ( x i = (2,1,5,3,8,7,4,6)), and the corresponding vehicle-assignment vector is ( k i = (1,2,1,3,2,1,3,3)). The elements at the same position in the two vectors indicate the customer node and its assigned vehicle, respectively. During decoding, the customer sequence is scanned from left to right, and customers assigned to the same vehicle are extracted while preserving their original order. Therefore, the decoded routes are (0-2-5-7-0) for UGV1, (0-1-8-0) for UGV2, (0-3-4-6-0) for UGV3, where node 0 denotes the distribution center. After decoding, each route is checked for customer uniqueness, vehicle capacity, depot departure and return, and time-window penalties. The total energy cost, fixed vehicle cost, and time-window penalty are then calculated from the decoded routes to obtain the fitness value of the whale individual.
Since the original WMA position-update equations operate in a continuous search space, a continuous-to-discrete mapping is introduced for the task-assignment problem. Each whale position is treated as an auxiliary continuous vector rather than a delivery route itself. After each WMA update, the position values corresponding to the customer sequence are sorted in ascending order, and their ranks are used to obtain a permutation of all customer nodes. Therefore, each customer appears exactly once in the decoded sequence. The position values corresponding to vehicle assignment are rounded to the nearest integer and restricted to the interval [ 1 , K ] , where K is the number of available vehicles. The resulting customer sequence and vehicle-assignment vector are then decoded into vehicle-specific routes. In this way, changes in the continuous whale positions alter the relative order of customers and their vehicle assignments, thereby enabling the WMA search mechanism to explore the discrete solution space. The genetic crossover, mutation, and 2-opt operators are subsequently applied directly to the decoded discrete routes. After each update, the feasibility-checking and repair procedure is performed to remove duplicate customers, insert missing customers, and correct capacity violations.
(2)
Feasibility Check and Repair
After crossover, mutation, and whale-position updating, each candidate solution is checked and repaired before fitness evaluation. First, duplicate customers in the customer-sequence vector are removed, and any missing customers are inserted into the vacant positions, ensuring that each customer appears exactly once. Second, vehicle-assignment values are restricted to the valid range from 1 to K .
The decoded routes are then checked against the vehicle-capacity constraint. If the total demand of a route exceeds the vehicle capacity, customers are sequentially removed from the overloaded route and reassigned to another vehicle with sufficient remaining capacity while preserving their relative visiting order. The distribution center is subsequently added to the beginning and end of every nonempty route. Customer time windows are treated as soft constraints and are therefore not repaired; early and late arrivals are handled through the time-window penalty in the fitness function. If a candidate solution cannot be repaired after these operations, it is assigned a large fitness penalty and is not retained in the next generation.
(3)
Algorithm Initialization
During the initialization process, the generation of the initial population simulates the initial distribution of the whale migration population. The specific procedure is as follows: For an optimization problem with dimension D , first define the lower bound vector L and upper bound vector U of the search space, as well as the population size N P (i.e., the number of initial whale individuals). The Whale Migration Algorithm randomly generates solutions between the lower bound L and upper bound U of the search space for the given problem via a specific formula. These initially generated populations act as a group of migrating whales. The formula is presented as follows.
W i = L + rand ( 1 , D ) ⊙ ( U − L ) ,   i = 1 , 2 , … , N pop
where function r a n d 1 , D generates a random vector of dimension D with values in the interval [0,1], and the operation “ ⊙ ” denotes the Hadamard product of two vectors, meaning each element of the resulting vector is obtained by multiplying the corresponding elements of the two original vectors. Each vector corresponds to a whale individual, representing a candidate solution to the problem. After generation, the objective function value of each individual is calculated, ultimately forming an initial population that can be used for subsequent iterative optimization.
To minimize the total driving distance of express delivery unmanned vehicles, this study takes the objective function in the problem modeling as the fitness function of the algorithm. For each individual, the total cost of its delivery path is calculated based on its encoding, which is used as the fitness function value to guide the algorithm in judging and selecting the quality of solutions.
The application of the WMA-GA to the task allocation of logistics unmanned vehicles addresses the issues of insufficient population diversity and the tendency to fall into local optima by introducing the selection, crossover, and mutation strategies of the GA. By retaining the “leader-follower” mechanism of the Whale Migration Algorithm, the algorithm can quickly focus on the potential optimal solution space, effectively shorten the convergence path, and improve the initial search efficiency. Based on the algorithm’s iterative process, the population fitness distribution, and the characteristics of the optimization problem, the leader’s guidance intensity, the follower’s exploration step size, and the population migration range are adjusted in real time. In the early stage of iteration, the algorithm expands the migration search range and enhances population diversity to strengthen the efficient exploration of the global optimal solution space and avoid local optima. In the later stage of iteration, it narrows the search range and focuses on high-quality solution regions to enhance the algorithm’s ability to finely mine the optimal solution and accelerate the convergence speed [44]. The encoding structure simultaneously incorporates considerations for path sequence and vehicle type adaptability and accurately screens valid solutions with the aid of vehicle service-related constraints, thereby significantly improving the feasibility and effectiveness of the solutions.

5.2. Simulation Experiment

On the premise that the constraint conditions conform to the actual problem, it is necessary to achieve the determined objectives of task completion and clarify the number of various types of unmanned vehicles used, the task allocation scheme for each vehicle, and the collaborative relationship between vehicles. Without considering factors such as weather conditions, road resistance, and sudden obstacles, the following assumptions are made:
(1)
The delivery task involves two types of nodes, namely the distribution center and customers. The distribution center serves as the starting point and end point for unmanned vehicles to perform delivery tasks, as well as the location for loading goods, and undertakes functions such as scheduling, sorting, and packaging. The location coordinates, specific demand, and time window for receiving delivery services of each customer are all known.
(2)
There is only one distribution center with known location coordinates. All logistics unmanned vehicles depart from the distribution center and return to it after completing their tasks.
(3)
One logistics unmanned vehicle can serve multiple customers, but each customer can only be served by one unmanned vehicle exactly once.
(4)
The driving speed of the unmanned vehicles is known and is not affected by natural conditions, human factors, or other external factors. The charging problem during delivery is not considered, and only the cost of unified charging at night is taken into account.
(5)
The load capacity of each vehicle shall not exceed the maximum load capacity of the unmanned vehicle. It is assumed that when the unmanned vehicle arrives at the service point for delivery, the service time is 0 and no power is consumed.
(6)
During the driving process, the unmanned vehicles must comply with traffic rules and deliver goods in accordance with the predetermined route. During the delivery process, the unmanned vehicles will not withdraw midway due to damage or other reasons, unless an emergency occurs requiring intervention or maintenance.

5.2.1. Experimental Settings

To verify the effectiveness of the task allocation model and the WMA-GA designed in this paper, simulation experiments are carried out. The simulations are implemented using MATLAB 2024b on a 64-bit Windows platform equipped with 32 GB of memory and an Intel(R) Core(TM) i7-13620H CPU running at a base frequency of 2.4 GHz.
A homogeneous fleet of unmanned delivery vehicles was considered in all logistics experiments. The vehicles had identical load capacity, traveling speed, fixed cost, and energy-consumption characteristics. The charging process during delivery was not considered, and the service time at each customer was set to zero. The vehicle, cost, energy, and time-window penalty parameters used in the experiments are summarized in Table 5. To ensure a fair comparison, all algorithms were evaluated using the same problem instances, population size, maximum number of iterations, stopping criterion, and computing environment. For each customer scale, every algorithm was independently run 30 times, and the final total delivery cost obtained in each run was recorded for statistical analysis.
It should be noted that one distinct fixed problem instance was used for each customer scale in the current experiments. The 30 independent runs for each scale correspond to stochastic re-runs of each algorithm on the same fixed instance, rather than 30 independently generated problem instances. Therefore, the reported standard deviations and Wilcoxon rank-sum tests mainly reflect within-instance algorithmic stability and stochastic variation, rather than cross-instance generalization across different customer geometries and demand distributions.

5.2.2. Small-Scale Benchmark Instance Analysis

A logistics distribution center can deploy up to 10 unmanned delivery vehicles. For the small-scale experimental verification, a synthetic test instance containing 30 customer nodes was randomly generated. The depot was fixed at the coordinate point [0,0]. The customer coordinates, cargo demands, and time-window constraints were randomly generated within predefined ranges, and the complete instance data are reported in Table 6. After generation, the instance was fixed and used consistently for all compared algorithms to ensure a fair comparison.
Specifically, the customer coordinates were generated within the [ 0 , 40 ] × [ 0 , 40 ] km planar service region, and each customer demand was randomly generated as an integer between 1 and 10 demand units. The earliest service time was randomly generated within the daytime delivery period. The time-window width was randomly generated between 90 and 270 min, and the latest service time was restricted to no later than 20:00. In the resulting instance, the actual time-window widths range from 109 to 263 min, thereby avoiding excessively narrow delivery windows.
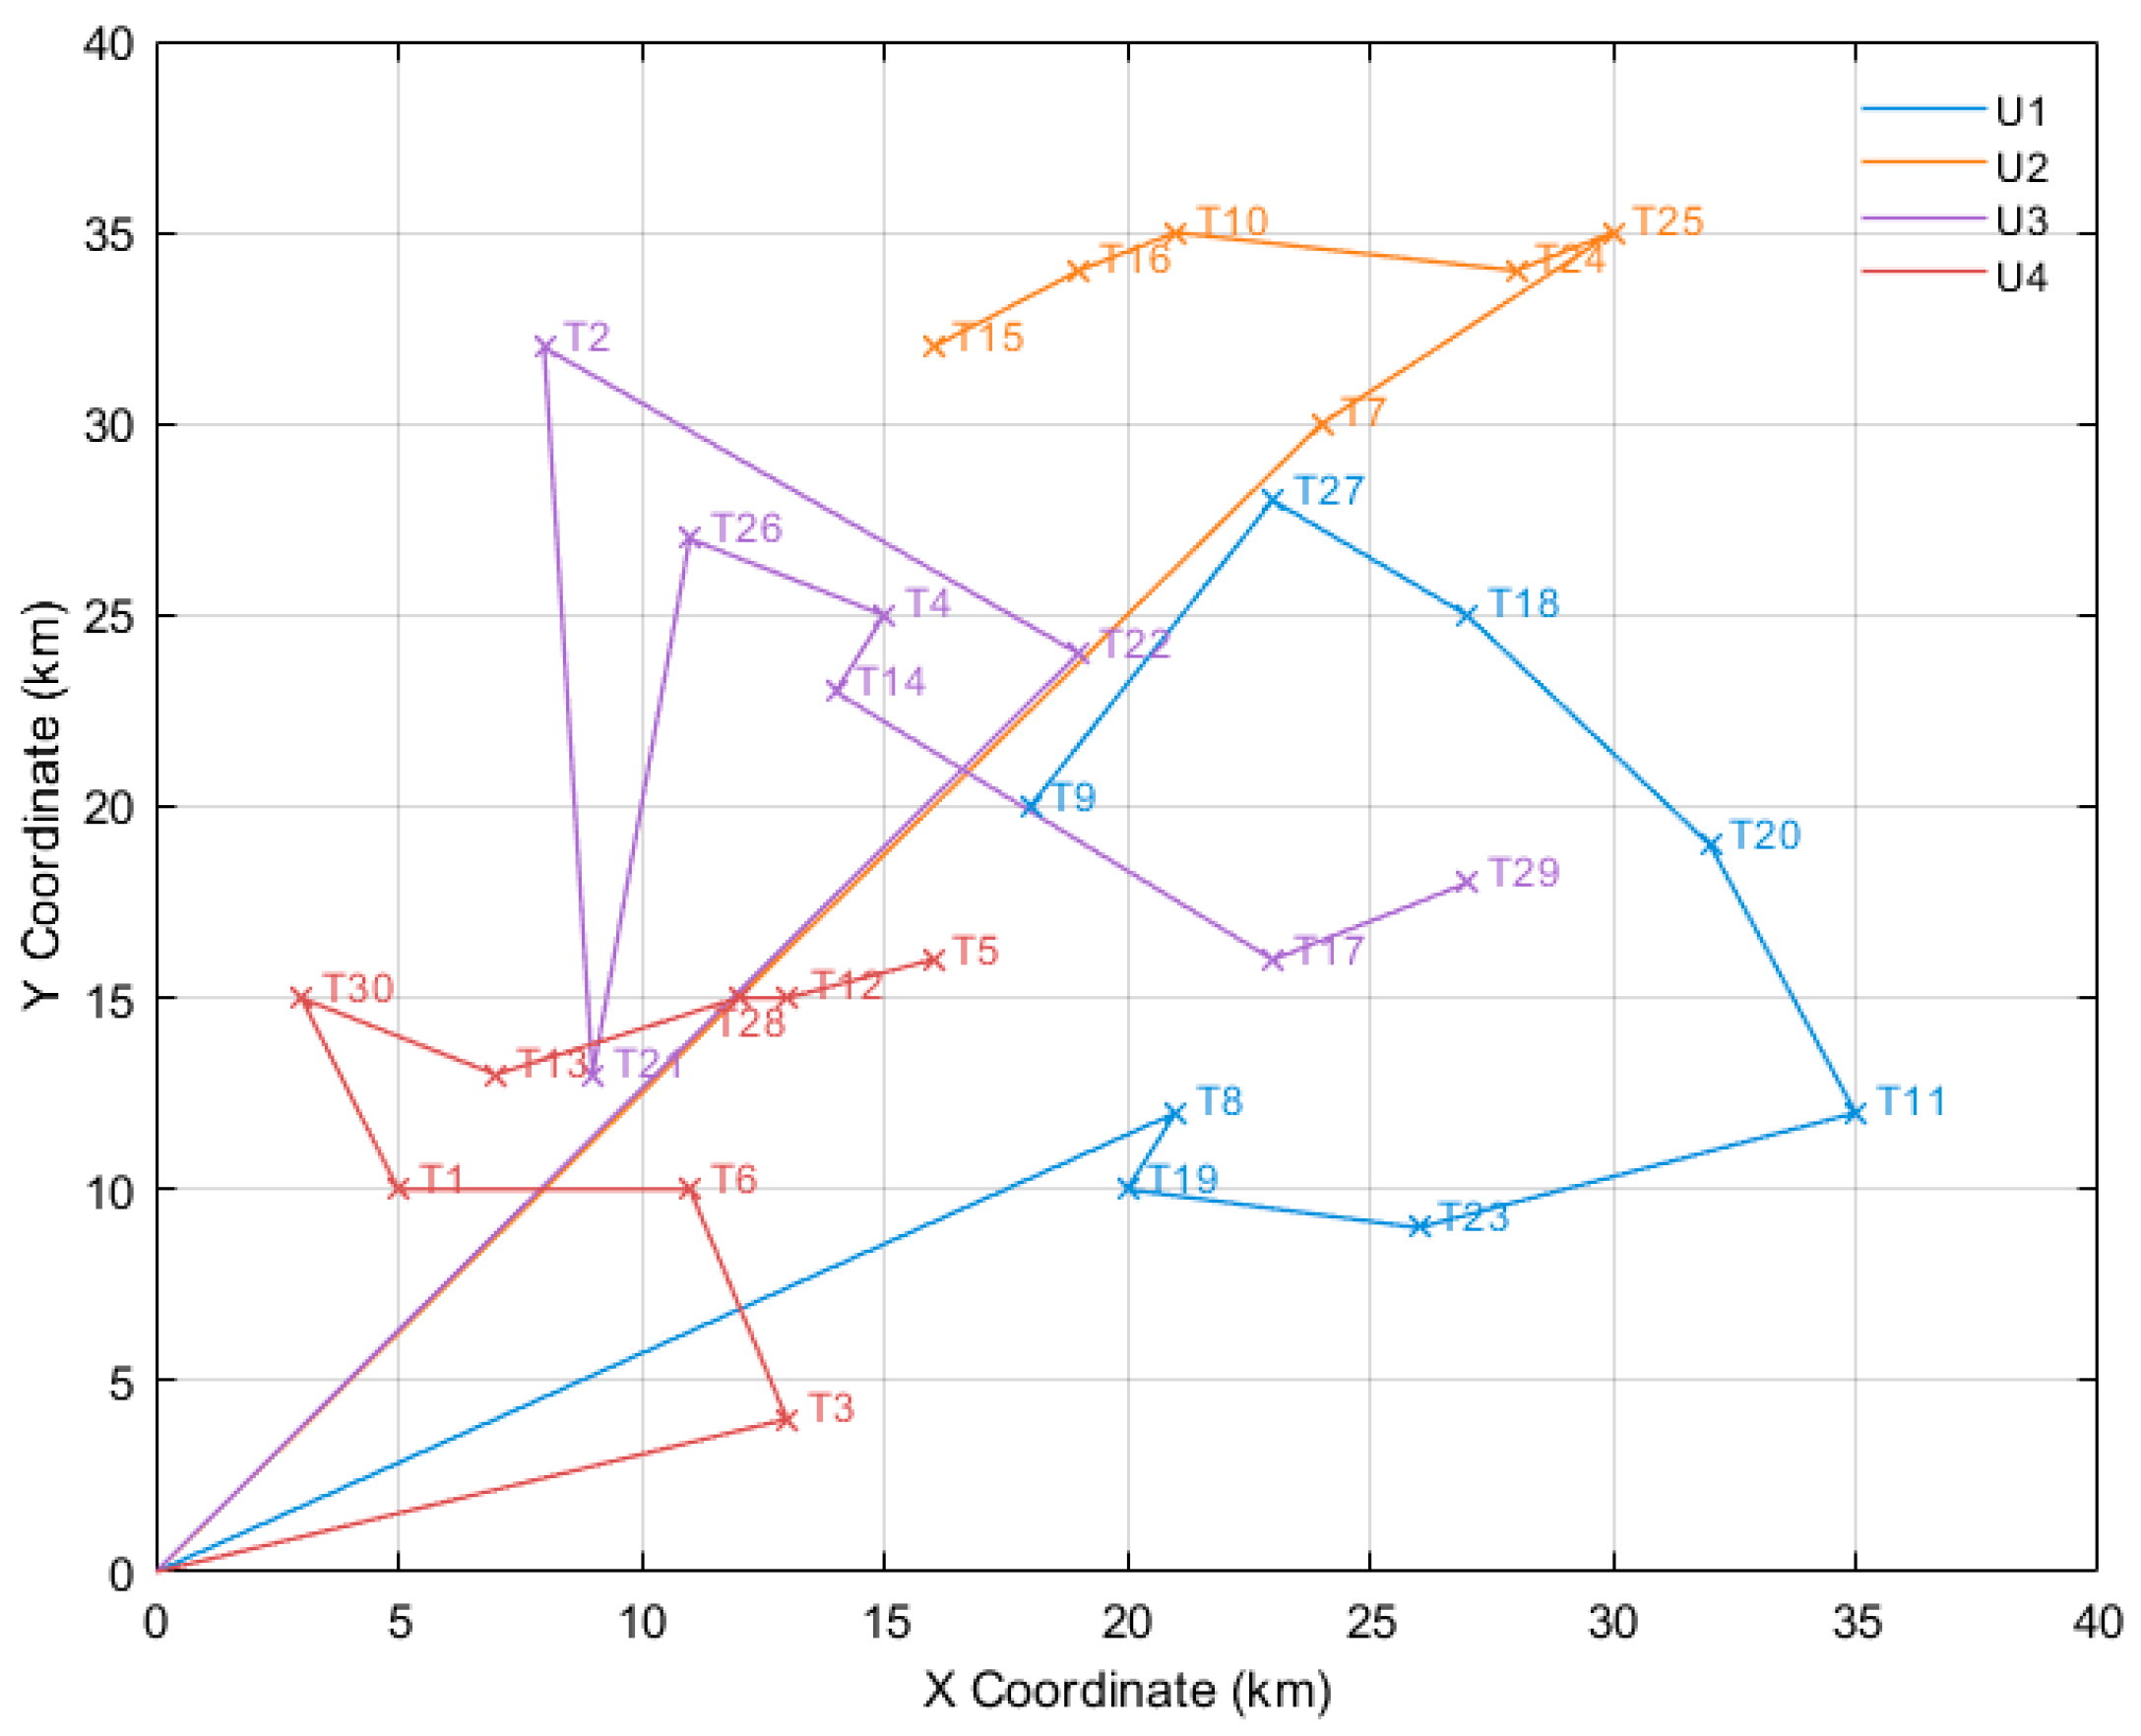
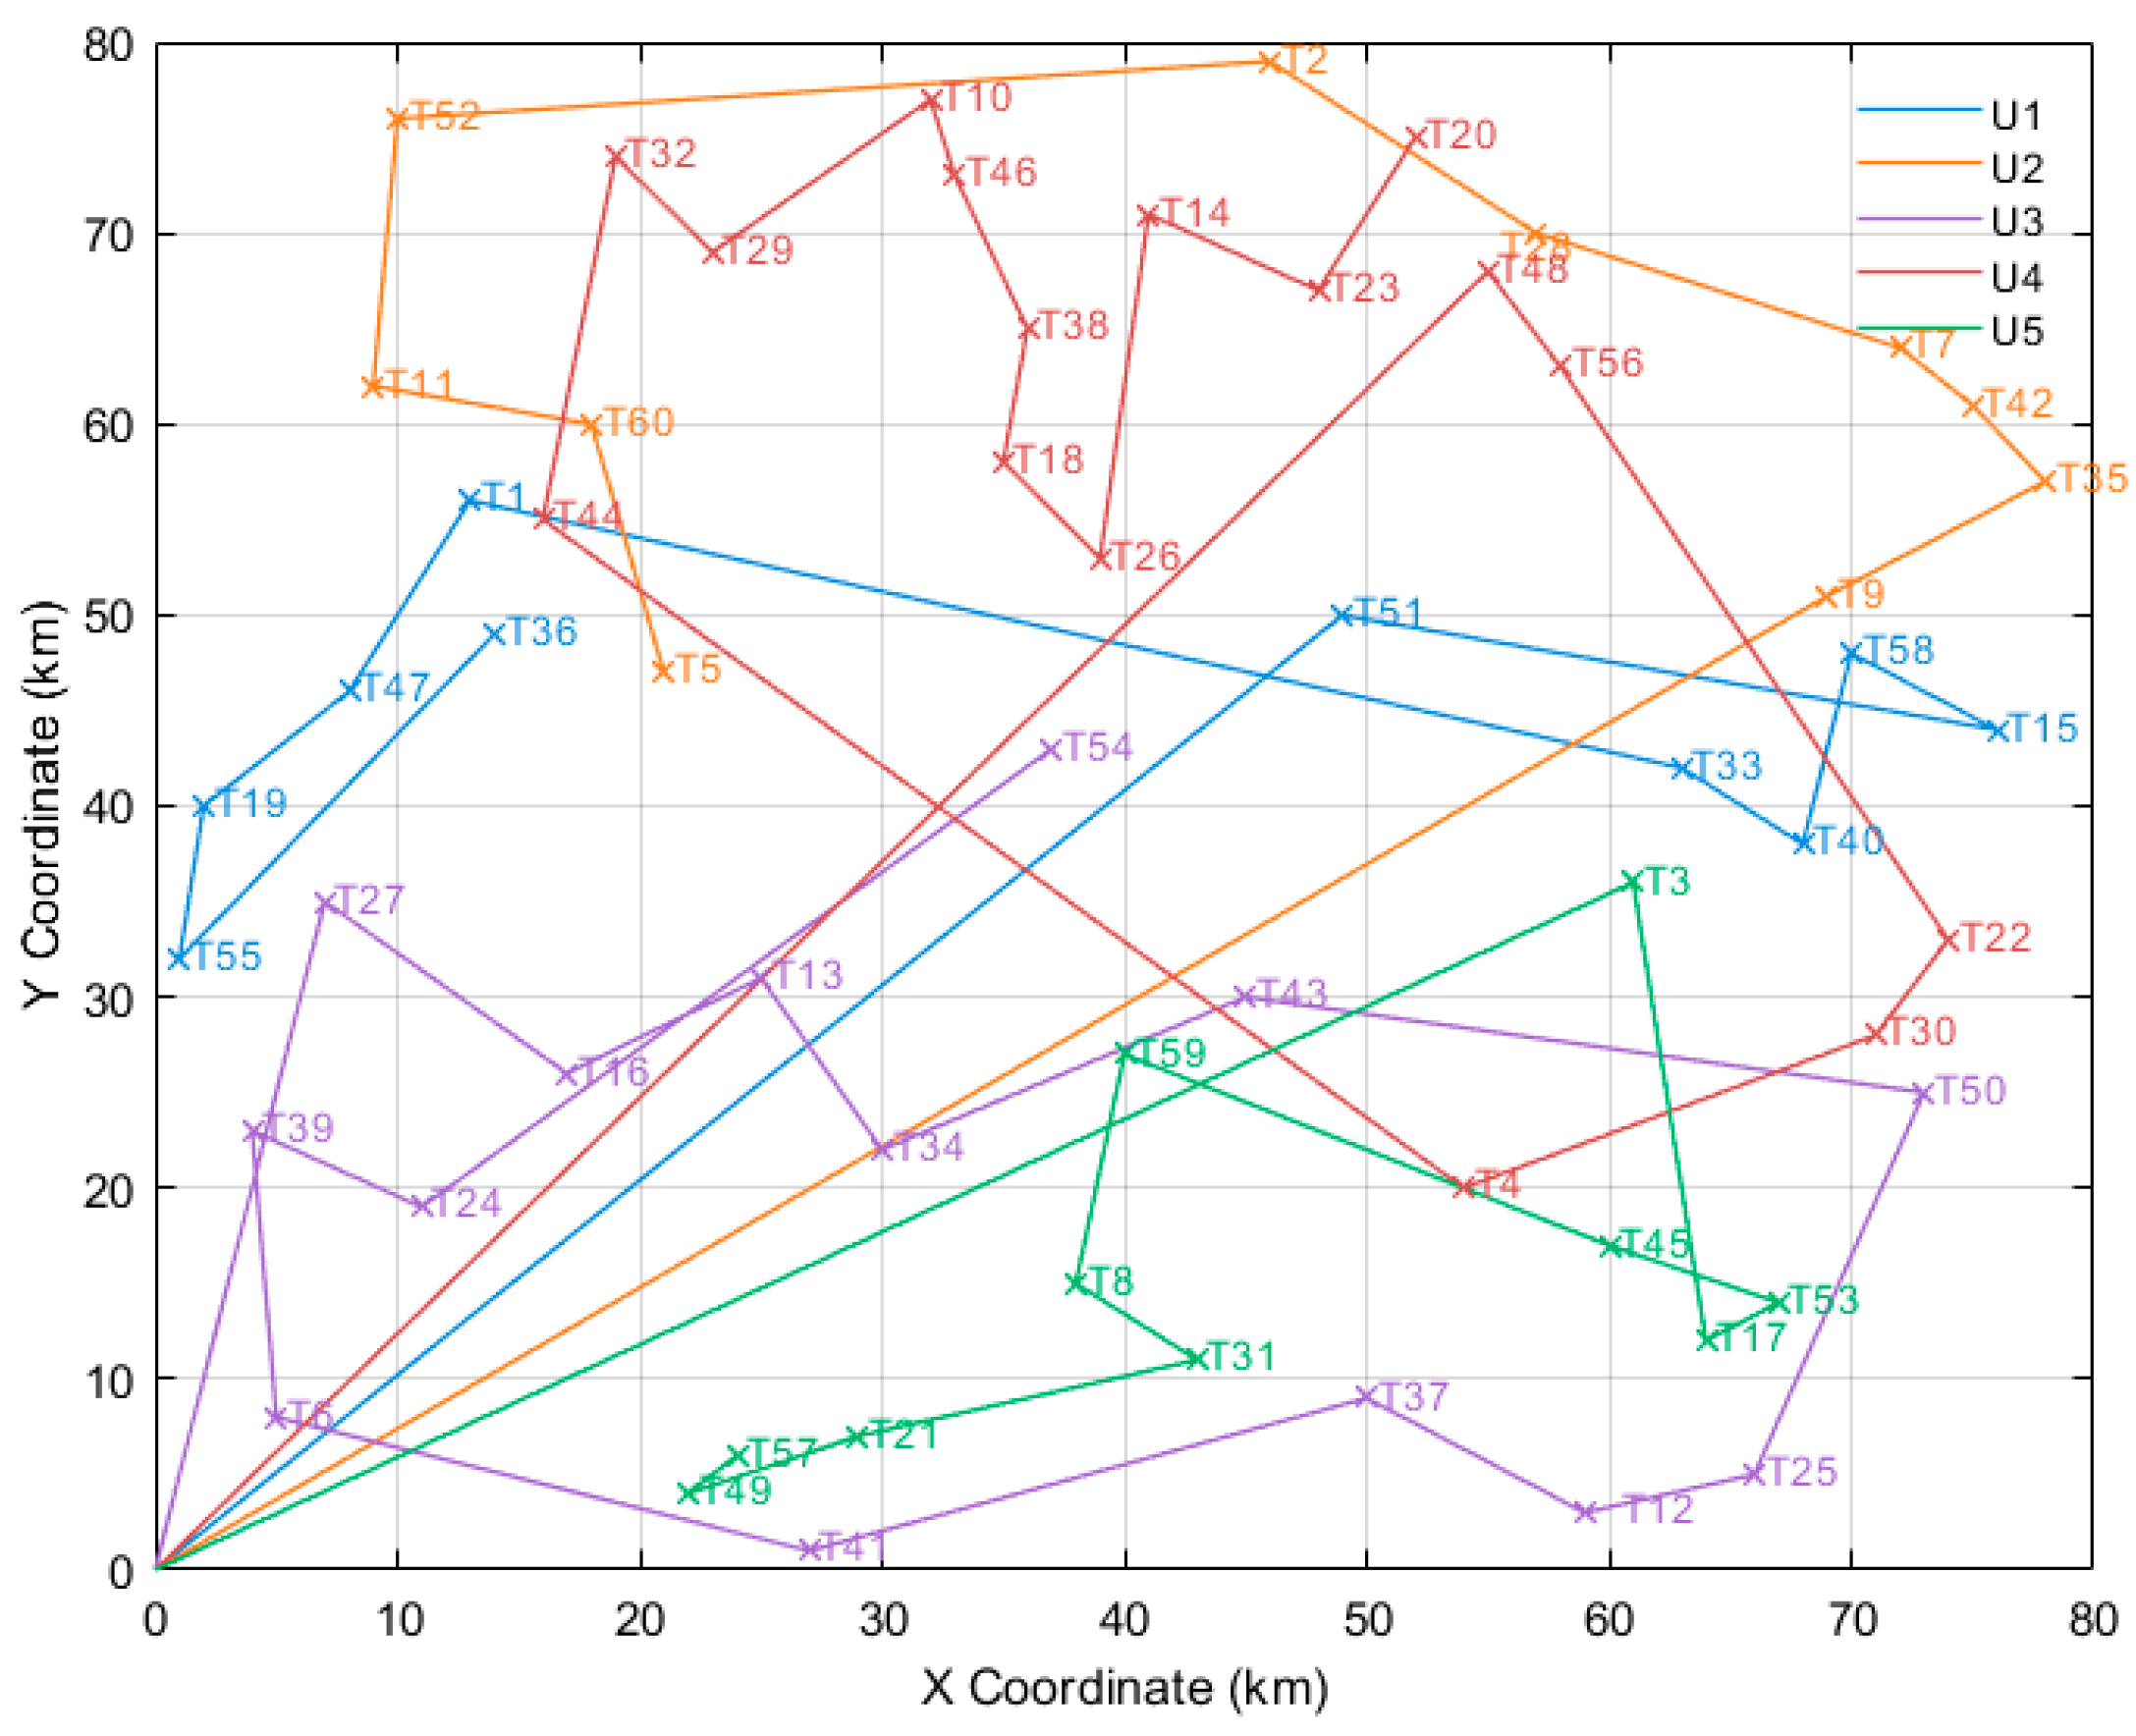
To avoid the randomness of the algorithm, multiple independent repeated experiments are conducted. The experiments are independently performed 30 times, with the total delivery cost adopted as the evaluation index for the experiments, and a smaller value of this index indicates better performance. The optimal solution to the multi-unmanned-vehicle task-assignment problem is shown in Figure 8.
To evaluate the effectiveness of the algorithm in the task allocation of unmanned vehicle delivery, comparative experiments are conducted with five optimization algorithms: WMA [28], SSA [41], GWO [39], GA [45], and the proposed WMA-GA. All comparative experiments adopt the parameter settings used in the original literature. The settings of the WMA-GA are shown in Table 7.
In logistics delivery task allocation, the optimum is defined as the minimum total cost, corresponding to the best solution found during algorithm execution. Each algorithm was independently run 30 times on the same fixed 30-customer instance. Experimental results are recorded to compare the performance of the algorithms in terms of transportation cost, time window penalty cost, and total delivery cost. The optimization results of the five algorithms are calculated and analyzed.
The experimental results are shown in Table 8.
From Table 8, it can be observed that the proposed WMA-GA obtains the lowest total cost on the fixed 30-customer instance. In terms of solution quality, the improved algorithm not only achieves the lowest average total cost, with improvement rates ranging from above 3.4% to a maximum of 13.17%. This indicates that WMA-GA consistently finds better driving routes and lower time window penalty costs in the experiments and is capable of obtaining higher-quality solutions in most cases, demonstrating strong robustness and fast convergence speed. In contrast, the standard GA and SSA are prone to falling into local optima. The original WMA is generally outperformed by the hybrid WMA-GA, which achieves noticeable improvements after incorporating genetic operators. This confirms that the integration of genetic algorithms effectively enhances the optimization capability of the WMA.
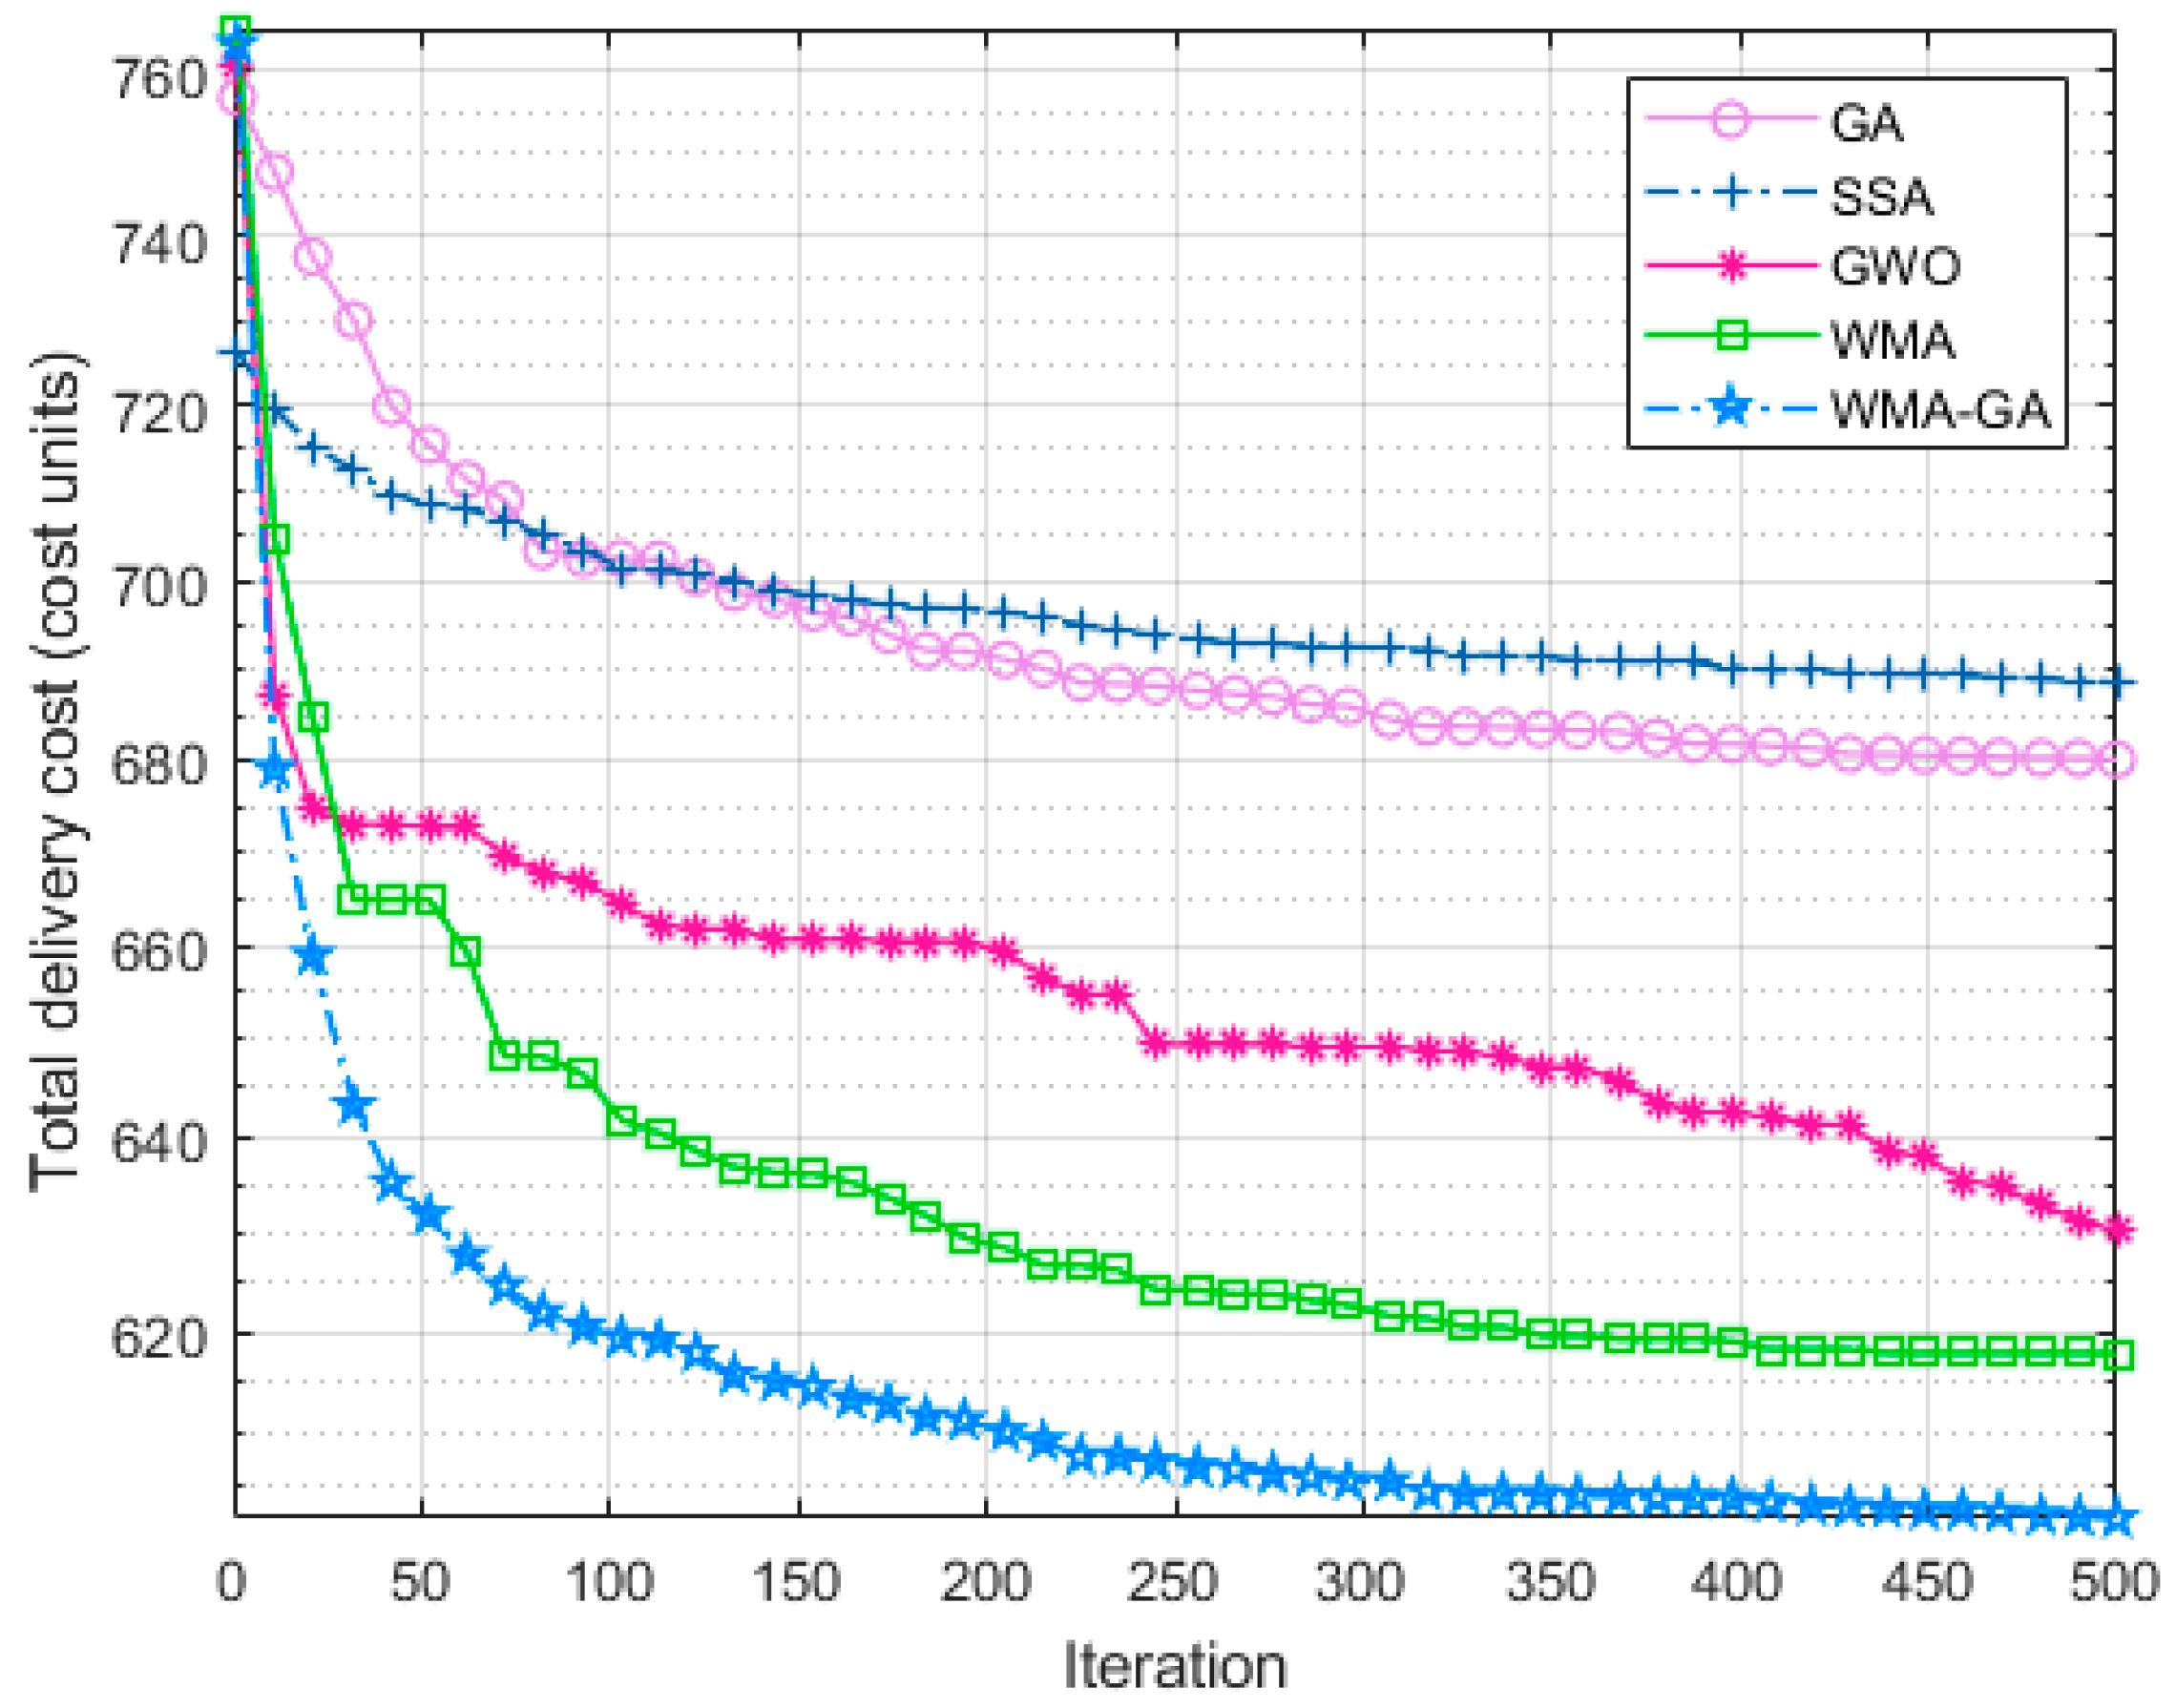
The comparison of convergence curves is shown in Figure 9 below. The convergence curve comparison indicates that the optimization efficiency of WMA-GA is significantly better than that of WMA. From the curve trend, WMA-GA rapidly reduces the fitness value in the early stage and reaches a relatively optimal solution within fewer iterations, whereas GA and SSA converge slowly with a smaller overall decline. This shows that WMA-GA integrates the local search ability of the genetic algorithm in the early stage, which accelerates the process of global optimization while avoiding local optima. Finally, the total delivery cost of the WMA-GA scheme is much lower than that of the other algorithms, verifying its effectiveness in optimizing path selection. Therefore, WMA-GA exhibits superior optimization ability and faster convergence speed in the task allocation problem of logistics unmanned vehicle delivery.

5.2.3. Medium- and Large-Scale Benchmark Instance Analysis

To provide a problem-specific comparison, Adaptive Large Neighborhood Search (ALNS) was added to the medium- and large-scale dataset experiments. ALNS was selected because its destroy-and-repair mechanism is particularly suitable for capacitated vehicle routing and scheduling problems with customer time windows. All algorithms were evaluated using the same dataset instances, objective function, operational constraints, termination criterion, and number of independent runs.
For the medium- and large-scale experiments, five logistics instances containing 60, 70, 80, 90, and 100 customer nodes were constructed using the publicly available Amazon Delivery Dataset. The delivery-location coordinates in the dataset were used to represent customer locations, and records with missing or invalid coordinates were removed. The selected customer instances were fixed and consistently used for all compared algorithms. Since the dataset does not directly provide all variables required by the proposed model, customer demands and time windows were generated according to the same predefined rules used in the small-scale experiment. Five groups of medium- and large-scale instances with customer points ranging from 60 to 100 are selected, and WMA, GA, ALNS and the proposed WMA-GA are chosen for comparison. For each customer scale, each algorithm was independently run 30 times under the same experimental conditions. The mean objective value, standard deviation, and average CPU time over the 30 runs are reported. The table summarizes the results obtained by each algorithm using the following performance indicators: average total delivery cost ‘Obj’ and its standard deviation ‘Std’, improvement effect ‘Gap’, and average algorithm running time ‘CPU’. The calculation formula for the indicator improvement effect ‘ind.Gap’ is as follows.
i n d . G a p = i n d i m p − i n d c o m i n d c o m × 100 %
where i n d i m p and i n d c o m denote the indicators of the improved algorithm and the comparison algorithm, respectively.
The task-allocation result obtained by WMA-GA for the representative 60-customer instance is illustrated in Figure 10. By analyzing the Table 9, it can be observed that WMA-GA outperforms the comparison algorithms across all test scales. In terms of solution results, WMA-GA achieves the lowest average delivery cost in every test case, with improvement rates ranging from above 1.68% to a maximum of 13.24%, and its standard deviation is the smallest among all algorithms. These results indicate that the proposed algorithm achieves good optimization performance and can stably output high-quality feasible solutions on the tested fixed instances of different scales, demonstrating within-instance algorithmic stability and search stability under repeated stochastic runs. The computational efficiency of the compared algorithms is further analyzed in Section 5.2.4.

5.2.4. Runtime Analysis for Medium- and Large-Scale Instances

The CPU column in Table 9 records the average running time, in seconds, of the four algorithms, namely GA, the original WMA, ALNS, and the proposed WMA-GA, on medium- and large-scale instances with 60 to 100 customers. It can be observed from the data that, over the tested range of 60–100 customers, the computational time of all four algorithms generally increases as the number of customer nodes increases. A horizontal comparison of the time consumption under instances of the same scale shows that ALNS also requires higher computational overhead than GA and the original WMA, because its adaptive large-neighborhood search framework iteratively performs destruction and repair operations to explore the solution space.
The proposed WMA-GA incurs the highest computational cost among the four algorithms. This additional time cost mainly stems from the embedded hierarchical competition-based population update mechanism and the adaptive 2-opt local search operator. In particular, the local search module iteratively refines delivery routes to reduce the total cost, thereby introducing additional computational iterations. Nevertheless, when the objective value and standard deviation metrics are considered together, WMA-GA achieves the lowest total delivery cost and the most stable solutions across all medium- and large-scale test scenarios. It outperforms not only GA and the original WMA, but also ALNS in terms of optimization accuracy and solution stability. Therefore, the proposed WMA-GA achieves substantial improvements in optimization quality while incurring a moderate and controllable increase in computational time. In urban unmanned distribution scenarios where high-quality delivery schemes are prioritized, this trade-off is acceptable and demonstrates practical engineering value.
It should be noted that the increasing trend in CPU time observed over the tested range of 60–100 customers does not imply that the asymptotic complexity of WMA-GA is linear. The theoretical complexity derived in Section 4.2.1 represents an upper bound and includes quadratic terms introduced by hierarchical competition and 2-opt local search. In these experiments, the population size, maximum number of iterations, fleet size, and local-search probability were fixed, and the tested problem-size range was limited. Therefore, constant factors and lower-order terms dominated the measured runtime. The CPU results are thus consistent with the theoretical analysis, as WMA-GA incurs higher computational overhead than the original WMA while remaining computationally feasible for the tested instances.
The results also provide an empirical evaluation of the scalability of WMA-GA. Under the reported hardware and parameter settings, the algorithm successfully solved instances containing 60–100 customers and up to 10 available vehicles. Its average running time increased from 73.49 s for the 60-customer instance to 142.21 s for the 100-customer instance. Thus, WMA-GA remains computationally feasible within the tested range and can obtain stable solutions for medium- and large-scale offline distribution planning.
It should be emphasized that the largest tested instance, containing 100 customers, represents the experimentally verified scale rather than the theoretical upper limit of the algorithm. Larger instances may require longer computation because the numbers of possible task assignments and route sequences increase rapidly. Further experiments involving more customers, larger fleets, and parallel implementations will be considered in future work.

5.2.5. Wall-Clock-Equalized Supplementary Comparison

To further reduce the influence of different per-iteration computational costs, a supplementary wall-clock-equalized comparison was conducted on representative medium- and large-scale instances. For each customer scale, the time budget was set to the average CPU time required by WMA-GA in the original equal-iteration experiment. GA, WMA, ALNS, and WMA-GA were then executed under the same wall-clock-time budget, and the best solution obtained within the time limit was recorded over repeated independent runs. Each algorithm was independently run 10 times under the same wall-clock-time budget, and the results are reported as mean ± standard deviation. The results are reported in Table 10.
As shown in Table 10, WMA-GA still achieves competitive or lower objective values under the same wall-clock-time budget. This result indicates that the improvement in solution quality is not solely caused by the equal-iteration setting. Nevertheless, because the supplementary comparison is still conducted on representative fixed instances, more comprehensive wall-clock-equalized experiments over multiple independently generated instances will be conducted in future work.

5.2.6. Statistical Significance Analysis of Task-Assignment Results

To determine whether the improvements obtained by WMA-GA were statistically reliable, the two-sided Wilcoxon rank-sum test was applied to the final total delivery costs obtained from 30 independent runs. At each customer scale, WMA-GA was separately compared with each competing algorithm. Holm’s correction was applied within each group of comparisons to control the family-wise error rate. The significance level was set to α = 0.05 , and a Holm-adjusted p-value below 0.05 was considered statistically significant. The statistical comparison results for the small-, medium-, and large-scale task-assignment experiments are presented in Table 11.
As shown in Table 11, WMA-GA significantly outperformed GA at all tested customer scales, with Holm-adjusted p-values below 0.05. For the 30-customer experiment, statistically significant improvements were also observed over SSA, GWO, and the original WMA. In the medium- and large-scale experiments, WMA-GA significantly reduced the final total delivery cost compared with the original WMA for all five customer scales. These results demonstrate that the performance improvements of WMA-GA are statistically reliable rather than being caused by random fluctuations.

5.3. Sensitivity Analysis

To assess the parameter sensitivity of WMA-GA, we analyze its key parameters, including population size, crossover probability, mutation probability and 2-opt local search probability. Ten independent runs are performed for each parameter setting to guarantee result reliability. The corresponding experimental results are shown below.
As shown in Table 12, as the population size increases from 50 to 200, the fitness of the algorithm presents a parabolic trend. The optimal performance is achieved when the population size is set to 100, with a favorable runtime. Meanwhile, the computational time increases linearly with the expansion of the population size.
As shown in Table 13, the fitness presents a parabolic trend when the crossover probability rises from 0.6 to 0.9, reaching the optimal value at 0.8. The slight increase in computation time is acceptable. Therefore, setting the crossover probability to 0.8 can obtain the optimal fitness with minor time cost.
As shown in Table 14, the fitness changes in a parabolic trend when the mutation probability increases from 0.05 to 0.2, reaching the optimum at 0.15 with slight variation in running time. Accordingly, setting the probability to 0.15 can acquire optimal solutions within acceptable time consumption.
As shown in Table 15, the fitness increases steadily as the 2-opt local search probability rises from 0.2 to 0.5, suggesting that higher probabilities do not benefit solution quality for this task. Hence, setting the probability to 0.2 achieves the lowest fitness at the minimum computational cost.
The statistical results in Table 16 show that the selected parameter settings generally provide favorable solution quality. A population size of 100 significantly outperformed a population size of 50, whereas no statistically significant differences were observed between population sizes of 100, 150, and 200. Considering that the CPU time increased from 59.46 s at a population size of 100 to 113.54 s and 204.97 s at population sizes of 150 and 200, respectively, a population size of 100 was selected as the best compromise between solution quality and computational efficiency.
For the crossover probability, P c = 0.8 significantly outperformed P c = 0.6 and P c = 0.7 , while its difference from P c = 0.9 was not statistically significant. For the mutation probability, P m = 0.15 significantly outperformed P m = 0.05 and P m = 0.20 , whereas no significant difference was observed relative to P m = 0.10 . Regarding the local-search probability, P L S = 0.2 significantly outperformed all larger probability settings. These results support the parameter configuration adopted in the subsequent experiments.

5.4. Ablation Study

To verify the effectiveness and generality of each key module in the proposed WMA-GA, we sequentially remove the 2-opt local search module, the GA improvement module including improved OX and binary tournament selection, and the hierarchical competition strategy from the baseline model to test their impacts on the total delivery cost. All experiments are conducted under identical environmental settings, three groups of test instances containing 30, 50 and 80 customer nodes are selected for experiments, corresponding to small-, medium- and large-scale logistics distribution scenarios respectively. The small-scale instance with 30 customers verifies the basic solution feasibility of each algorithm; the medium-scale instance with 50 customers matches the routine daily delivery tasks of urban unmanned distribution stations; the large-scale instance with 80 customers simulates intensive order demands during delivery peak hours to test the anti-premature convergence performance and robust optimization capacity of the proposed WMA-GA algorithm within high-dimensional discrete search spaces. The configurations of each ablated variant are as follows:
  • Full WMA-GA: Includes all improved modules and serves as the performance baseline.
  • Without the 2-opt local search module: Only the 2-opt-based local search operator is removed.
  • The improved OX operator and binary tournament selection strategy are combined into the “GA improvement module”. In the ablation experiment, after removing this module, the algorithm adopts the original OX crossover and the default selection mechanism of WMA.
  • Without the hierarchical competition framework: Only the hierarchical competition update strategy is removed, reverting to the original WMA mechanism.
It can be seen from Table 17 that, in terms of computational time, although the WMA-GA has a slightly longer runtime due to the inclusion of the hierarchical competition strategy, 2-opt local search module, and other modules, it is still within a reasonable range and maintains good overall solution efficiency. The results of the ablation study show that the Obj values of WMA-GA are significantly lower than those of other variants, verifying that the hierarchical competition strategy, 2-opt local search module, binary tournament selection, and improved OX strategy all contribute to the performance improvement of the WMA-GA algorithm. By further comparing the objective increments after removing each single component across all 30, 50 and 80-customer instances, we find that the variant without the hierarchical competition strategy (No-HC) produces the maximum Obj increase consistently, followed by No-GA and No-OPT in sequence. This quantitative contrast clearly demonstrates that the hierarchical competition strategy exerts the most dominant and significant impact on the optimization performance of WMA-GA, while the improved OX, dynamic mutation strategy, and 2-opt local search module provide additional auxiliary performance gains.
To further quantify the performance superiority of the hierarchical competition strategy, we calculate the specific cost reduction rates between WMA-GA and No-HC for each instance scale. The contribution of the hierarchical competition strategy is evaluated by comparing WMA-GA with the No-HC variant. For the 30-, 50-, and 80-customer instances, removing hierarchical competition increases the objective value from 608.29 to 643.54, from 1277.93 to 1362.45, and from 2278.63 to 2476.84, respectively. Therefore, the complete strategy reduces the total distribution cost by 5.48%, 6.20%, and 8.00%. The improvement becomes more evident as the problem scale increases. Larger instances contain more vehicle-assignment combinations, route permutations, and local optima. Without hierarchical competition, followers are more likely to concentrate around the current leader and lose alternative allocation patterns. In contrast, same-level competition and cross-level learning maintain multiple search directions and improve solution quality. Although hierarchical competition introduces moderate computational overhead, the consistent cost reductions, especially the 8.00% improvement for the 80-customer instance, confirm its effectiveness for constrained multi-unmanned-vehicle task assignment.
For the 30-customer instance, WMA-GA obtains an objective value of 608.29 with an average runtime of 38.76 s. Compared with the No-OPT, No-GA, and No-HC variants, it reduces the objective value by 2.61%, 4.48%, and 5.48% while requiring an additional 4.23, 6.20, and 9.62 s, respectively. Therefore, the additional computational cost provides a measurable improvement in solution quality and is acceptable for offline distribution planning. For applications requiring an immediate response, a simplified variant may be selected instead. The ablation results for the 30-, 50-, and 80-customer instances are illustrated in Figure 11.
The two-sided Wilcoxon rank-sum test was used to compare the complete WMA-GA with each ablated variant.
Table 18 presents the Holm-adjusted Wilcoxon rank-sum test results for the ablation study, where each algorithm variant is compared against the full WMA-GA across 30-, 50- and 80-customer instances. Overall, all three improved modules make positive contributions to solution quality, and their statistical significance generally strengthens with increasing problem scale. Removing the hierarchical competition strategy (No-HC) causes significant performance degradation on all instance sizes, with adjusted p-values ranging from 0.006 to less than 0.001, confirming it as the core driver of performance improvement. The genetic crossover-mutation module (No-GA) also delivers statistically significant performance drops across all scales, verifying its role in enhancing population search diversity. For the local search module (No-OPT), no significant difference is detected in the 30-customer instance (adjusted p = 0.081) owing to the limited search space, while its refinement effect becomes statistically significant in 50- and 80-customer cases. These findings collectively validate the rationality of each module design, and the synergistic advantage of the multi-module framework becomes more prominent as problem complexity increases.

6. Discussion

A multi-strategy improved whale migration algorithm hybridized with genetic optimization is proposed for logistics distribution task allocation involving multiple task points, time-window constraints, and coupled operational constraints. By comparing with the results reported in previous studies on the whale migration algorithm, genetic algorithm, and other metaheuristic methods, the performance improvements of the hybrid algorithm in terms of convergence speed, solution quality, and robustness are verified, which is consistent with the working hypothesis that integrating genetic operators can enhance population diversity and avoid local optima. The advantages of WMA-GA in reducing total distribution cost and time window penalty cost reflect its practical implications for real-world logistics unmanned vehicle dispatching and intelligent distribution systems. In the broader context, the proposed method provides a reference for solving constrained vehicle routing problems. For future research, more complex scenarios such as dynamic road conditions, multi-depot distribution, real-time battery consumption, and collaborative scheduling of multiple types of unmanned vehicles can be further considered to improve the applicability and stability of the algorithm.

7. Conclusions and Future Work

Aiming at the task allocation problem of multi-unmanned vehicle distribution in urban logistics, this paper presents a multi-strategy improved whale migration algorithm to solve the problem. A mathematical model is established with the objective of minimizing the total distribution cost. Experimental results verify that the proposed algorithm is capable of addressing the multi-constrained task allocation problem for unmanned vehicle distribution in urban logistics. The main research conclusions are summarized as follows:
(1)
A task allocation model for logistics unmanned vehicle delivery is established with practical constraints, including vehicle capacity, time windows, and cruising range. A unified fitness function is constructed, which takes the minimum total cost as the optimization objective, enabling the algorithm to effectively solve the problem to a certain extent.
(2)
The proposed WMA-GA integrates GA-based recombination, dynamic mutation, 2-opt route refinement, and hierarchical whale-migration competition, thereby improving the balance between global exploration and local exploitation.
(3)
Simulation experiments verify the effectiveness of the WMA-GA. Comparative tests are carried out based on benchmark functions. The results demonstrate that WMA-GA possesses excellent global search and local exploitation capabilities. It can effectively address the unmanned vehicle distribution task allocation problem and outperforms several mainstream algorithms.
Furthermore, aiming at practical challenges in unmanned vehicle distribution task allocation, we conduct experiments using a small-scale synthetic instance and real logistics data from the Amazon Delivery Dataset. Compared with other algorithms, WMA-GA achieves the optimal performance in multiple indicators, including mean value, optimal value and total distribution cost. It is proven that the proposed algorithm can efficiently solve the task allocation problem of urban unmanned vehicle logistics distribution and has promising practical application value.
In future work, we will further improve the WMA-GA and expand its application scope, focusing on the following aspects. First, we will extend the algorithm from a static to a dynamic urban logistics environment by introducing real-time factors, such as traffic congestion and task-demand changes, and by optimizing its adaptive mechanism to better meet practical operational requirements. Second, we will enhance the optimization performance of the algorithm by exploring more efficient hybrid strategies and adopting adaptive parameter-adjustment mechanisms to improve convergence speed and solution quality. Third, we will further validate the proposed method on standard VRPTW benchmark instances, such as Solomon C1, R1, and RC1 instances, after adapting the objective function and constraint-handling mechanism to the corresponding benchmark settings. This will improve the comparability of the proposed algorithm with existing vehicle-routing studies. Fourth, we will expand its application to multi-depot and multi-type unmanned-vehicle collaborative scheduling scenarios to further improve logistics efficiency. Finally, we will conduct physical experiments on a small-scale test platform to verify the feasibility and practical effectiveness of the algorithm in real-world scenarios. Another limitation is that only one fixed representative instance was used for each customer scale in the current experiments. Future work will generate multiple independent instances for each scale by varying customer-location distributions, depot settings, and demand patterns and will further evaluate cross-instance generalization using performance profiles or instance–algorithm statistical analysis. In addition, equal-budget parameter tuning will be conducted for all compared algorithms in future work to reduce the influence of parameter-setting differences and to provide a more balanced evaluation of their relative performance.

Author Contributions

Y.Y. is mainly responsible for designing the outline; S.Y. is mainly responsible for writing the article, designing the models and conducting the simulation experiments; J.L. is mainly responsible for writing guidance; L.C. is responsible for article polishing. All authors have read and agreed to the published version of the manuscript.

Funding

This research was supported by the 2022 Heilongjiang Philosophy and Social Science Research Planning Project, grant number 22SHE416.

Institutional Review Board Statement

Not applicable.

Informed Consent Statement

Not applicable.

Data Availability Statement

The complete implementation code and processed experimental data are not publicly released at this stage because they are part of an ongoing research project. Detailed parameter settings, instance-construction procedures, and experimental configurations are provided in the manuscript to support reproducibility.

Conflicts of Interest

The authors declare no conflicts of interest.

References

  1. Mogire, E.; Kilbourn, P.; Luke, R. Last Mile Delivery Technologies for Electronic Commerce: A Bibliometric Review. J. Electron. Commer. Organ. 2025, 23, 1–26. [Google Scholar] [CrossRef] [Scilit]
  2. Liu, Q.; You, X.; Zhang, X.; Zuo, J. Construction of Dynamic Trafficability Map for Unmanned Vehicles Considering Multiple Environmental Factors and Path Planning. Sci. Rep. 2025, 15, 9957. [Google Scholar] [CrossRef] [Scilit] [PubMed]
  3. Liu, X.; Duan, Z.; Yue, H. Route Optimization for Unmanned Delivery Vehicles Using Improved Q-Learning and Lego-Loma. J. Eng. Proj. Prod. Manag. 2026, 16, 2025-196. [Google Scholar] [CrossRef] [Scilit]
  4. Wen, J.; Wang, F.; Su, Y. A Bi-Layer Collaborative Planning Framework for Multi-UAV Delivery Tasks in Multi-Depot Urban Logistics. Drones 2025, 9, 512. [Google Scholar] [CrossRef] [Scilit]
  5. Guo, S.; Hu, H.; Xue, H. A Two-Echelon Multi-Trip Capacitated Vehicle Routing Problem with Time Windows for Fresh E-Commerce Logistics under Front Warehouse Mode. Systems 2024, 12, 205. [Google Scholar] [CrossRef] [Scilit]
  6. Jiang, H.; Zhang, Z.; Wang, C.; Xiang, X. A Multiobjective Evolutionary Algorithm Incorporating Neighborhood Detection for the Vehicle Routing Problem with Soft Time Windows. Complex Intell. Syst. 2025, 11, 419. [Google Scholar] [CrossRef] [Scilit]
  7. Yanhu, Z.; Lijuan, Y.; ShuMei, K.; Decheng, M. Research on Multi-Objective Optimization of Multi-Endpoint VRP with Time Window for the Distribution of Seasonal Products by Multi-Homing Heterogeneous Fleets. Expert Syst. Appl. 2026, 298, 129595. [Google Scholar] [CrossRef] [Scilit]
  8. Wei, Y.; Wang, Y.; Hu, X. The two-echelon truck–unmanned ground vehicle routing problem with time-dependent travel times. Transp. Res. Part E Logist. Transp. Rev. 2025, 194, 103954. [Google Scholar] [CrossRef] [Scilit]
  9. Miller, N.; Goulet, N.; Ayalew, B. Energy-Aware Collaborative Teaming and Route Planning for Unmanned Ground Vehicles. IFAC-PapersOnLine 2024, 58, 1007–1012. [Google Scholar] [CrossRef] [Scilit]
  10. Gao, X.; Liu, S.; Wang, Y.; Yu, D.Z.; Peng, Y.; Ma, X. Consideration of Carbon Emissions in Multi-Trip Delivery Optimization of Unmanned Vehicles. Sustainability 2024, 16, 2357. [Google Scholar] [CrossRef] [Scilit]
  11. Ji, Y.; Su, K.; Chen, C. Route Optimization for Electric Vehicle Cold Chain Delivery Under a Mixed Public–Private Charging Mode: A China-Oriented Case Study. Appl. Sci. 2026, 16, 4700. [Google Scholar] [CrossRef] [Scilit]
  12. Álvarez, P.; Serrano-Hernandez, A.; Lerga, I.; Faulin, J. Using Modeling Techniques for Sustainable Last Mile Deliveries in Urban Areas: A VRP Simulation in Pamplona’s Old Town Using Cargo Bikes. Comput. Ind. Eng. 2026, 216, 111928. [Google Scholar] [CrossRef] [Scilit]
  13. Wang, C.; Cao, Z.; Wu, Y.; Teng, L.; Wu, G. Deep Reinforcement Learning for Solving Vehicle Routing Problems With Backhauls. IEEE Trans. Neural Netw. Learn. Syst. 2025, 36, 4779–4793. [Google Scholar] [CrossRef] [Scilit] [PubMed]
  14. Wang, Y.; Hong, X.; Wang, Y.; Zhao, J.; Sun, G.; Qin, B. Token-Based Deep Reinforcement Learning for Heterogeneous VRP with Service Time Constraints. Knowl.-Based Syst. 2024, 300, 112173. [Google Scholar] [CrossRef] [Scilit]
  15. Yan, D.; Guan, Q.; Ou, B.; Yan, B.; Cao, H. Graph-Driven Deep Reinforcement Learning for Vehicle Routing Problems with Pickup and Delivery. Appl. Sci. 2025, 15, 4776. [Google Scholar] [CrossRef] [Scilit]
  16. Zhang, W.; Wang, X.; Mu, Y.; Deng, M.; Li, P. Deep Reinforcement Learning with Evolutionary Algorithm-Guided Imitation for Capacitated Vehicle Routing Problems. Appl. Soft Comput. 2025, 184, 113705. [Google Scholar] [CrossRef] [Scilit]
  17. Chen, Y.; Wei, J.; Luo, T.; Zhou, J. Mcaaco: A Multi-Objective Strategy Heuristic Search Algorithm for Solving Capacitated Vehicle Routing Problems. Complex Intell. Syst. 2025, 11, 211. [Google Scholar] [CrossRef] [Scilit]
  18. Li, Q.; Fan, T.W.; Kei, L.S.; Li, Z. Scalable and Energy-Efficient Task Allocation in Industry 4.0: Leveraging Distributed Auction and IBPSO. PLoS ONE 2025, 20, e0314347. [Google Scholar] [CrossRef] [Scilit] [PubMed]
  19. Zhang, H.; Zhang, Y.; Zhao, F.; Zhou, L.; Zhou, B. Rich Vehicle Routing Optimization Based on Variable Neighborhood Descent and Differential Evolution Algorithm. Sci. Rep. 2025, 15, 32887. [Google Scholar] [CrossRef] [Scilit] [PubMed]
  20. Dupanloup, I.; Schneider, S.; Excoffier, L. A Simulated Annealing Approach to Define the Genetic Structure of Populations. Mol. Ecol. 2002, 11, 2571–2581. [Google Scholar] [CrossRef] [Scilit] [PubMed]
  21. Chávez, J.J.S.; Escobar, J.W.; Echeverri, M.G. A Multi-Objective Pareto Ant Colony Algorithm for the Multi-Depot Vehicle Routing Problem with Backhauls. Int. J. Ind. Eng. Comput. 2016, 7, 35–48. [Google Scholar] [CrossRef] [Scilit]
  22. Yang, M.; Chen, Y.; Li, Y.; Zhang, T.; Wu, T. A Two-Stage Hybrid NSGA-III with BWO for Path Planning and Task Allocation in Agricultural Land Preparation. PLoS ONE 2025, 20, e0315670. [Google Scholar] [CrossRef] [Scilit] [PubMed]
  23. Chen, G.; Gao, J.; Chen, D. Research on Vehicle Routing Problem with Time Windows Based on Improved Genetic Algorithm and Ant Colony Algorithm. Electronics 2025, 14, 647. [Google Scholar] [CrossRef] [Scilit]
  24. Hvattum, L.M. Where to Split in Hybrid Genetic Search for the Capacitated Vehicle Routing Problem. Algorithms 2025, 18, 165. [Google Scholar] [CrossRef] [Scilit]
  25. Stamadianos, T.; Taxidou, A.; Marinaki, M.; Marinakis, Y. Swarm Intelligence and Nature Inspired Algorithms for Solving Vehicle Routing Problems: A Survey. Oper. Res. 2024, 24, 47. [Google Scholar] [CrossRef] [Scilit]
  26. Chang, Y.; Yu, J.; Wang, Y.; Xie, X. An Improved Salp Swarm Algorithm for Solving a Multi-Temperature Joint Distribution Route Optimization Problem. Mathematics 2025, 13, 677. [Google Scholar] [CrossRef] [Scilit]
  27. Xia, M.; Chong, Q.; Dong, M. A Constrained Multi-Objective Evolutionary Algorithm with Two-Stage Resources Allocation. Swarm Evol. Comput. 2023, 79, 101313. [Google Scholar] [CrossRef] [Scilit]
  28. Ghasemi, M.; Deriche, M.; Trojovský, P.; Mansor, Z.; Zare, M.; Trojovská, E.; Abualigah, L.; Ezugwu, A.E.; Mohammadi, S. kadkhoda An Efficient Bio-Inspired Algorithm Based on Humpback Whale Migration for Constrained Engineering Optimization. Results Eng. 2025, 25, 104215. [Google Scholar] [CrossRef] [Scilit]
  29. Meniz, B. Genetic Algorithm Optimization with Selection Operator Decider. Arab. J. Sci. Eng. 2025. [Google Scholar] [CrossRef] [Scilit]
  30. Bolotbekova, A.; Hakli, H.; Beskirli, A. Trip Route Optimization Based on Bus Transit Using Genetic Algorithm with Different Crossover Techniques: A Case Study in Konya/Türkiye. Sci. Rep. 2025, 15, 2491. [Google Scholar] [CrossRef] [Scilit] [PubMed]
  31. Nakanishi, Y.; Doi, M.; Sato, H. Impact of Static/Dynamic Tournament Sizing in Evolutionary Multi- and Many-Objective Optimization. J. Adv. Comput. Intell. Intell. Inform. 2026, 30, 311–325. [Google Scholar] [CrossRef] [Scilit]
  32. Zheng, H.; Shi, X.; Pan, Z.; Wang, Y.; Yun, X. A Multi-Load AGV Task Allocation Method Considering Battery Constraints. J. Phys. Conf. Ser. 2025, 3108, 012006. [Google Scholar] [CrossRef] [Scilit]
  33. Palamutçuoğlu, B.T.; Çavuşoğlu, S.; Çamlı, A.Y.; Virlanuta, F.O.; Bacalum, S.; Züngün, D.; Moisescu, F. Solution of the Capacity-Constrained Vehicle Routing Problem Considering Carbon Footprint Within the Scope of Sustainable Logistics with Genetic Algorithm. Sustainability 2025, 17, 727. [Google Scholar] [CrossRef] [Scilit]
  34. Gopal, G.; Kumar, R.; Jawa, I.; Kumar, N. Enhanced Order Crossover for Permutation Problems. Int. J. Innov. Res. Sci. Eng. Technol. 2015, 4, 151–157. [Google Scholar] [CrossRef] [Scilit]
  35. Janson, S.; Middendorf, M. A Hierarchical Particle Swarm Optimizer and Its Adaptive Variant. IEEE Trans. Syst. Man Cybern. Part B 2005, 35, 1272–1282. [Google Scholar] [CrossRef]
  36. Ge, Y.; Chen, D.; Zou, F.; Fu, M.; Ge, F. Large-Scale Multiobjective Optimization with Adaptive Competitive Swarm Optimizer and Inverse Modeling. Inf. Sci. 2022, 608, 1441–1463. [Google Scholar] [CrossRef] [Scilit]
  37. Du, N.; Ji, Y.; Wu, C.; Hou, A.; Nie, W. Scheduling DAG-Structured Workloads Based on Whale Optimization Algorithm. J. Supercomput. 2025, 81, 911. [Google Scholar] [CrossRef] [Scilit]
  38. Pérez-Delgado, M.-L.; Román-Gallego, J.-Á.; Pérez-Delgado, M.-L.; Román-Gallego, J.-Á. Computational Complexity of Swarm-Based Algorithms: A Detailed Analysis. AIMS Math. 2025, 10, 15539–15587. [Google Scholar] [CrossRef]
  39. Mirjalili, S.; Mirjalili, S.M.; Lewis, A. Grey Wolf Optimizer. Adv. Eng. Softw. 2014, 69, 46–61. [Google Scholar] [CrossRef] [Scilit]
  40. Xue, J.; Shen, B. Dung Beetle Optimizer: A New Meta-Heuristic Algorithm for Global Optimization. J. Supercomput. 2023, 79, 7305–7336. [Google Scholar] [CrossRef] [Scilit]
  41. Xue, J.; Shen, B. A Novel Swarm Intelligence Optimization Approach: Sparrow Search Algorithm. Syst. Sci. Control Eng. 2020, 8, 22–34. [Google Scholar] [CrossRef] [Scilit]
  42. Liu, L.; Chen, Y.; Li, A.; Chen, Y. Research on Intelligent Logistics Warehouse Scheduling Optimization Based on Integrated Reinforcement Learning. Int. J. High Speed Electron. Syst. 2025, 35, 2540715. [Google Scholar] [CrossRef] [Scilit]
  43. Zhu, Y.; Song, Q.; Li, M. Optimization of Multi-AGV Task Allocation Based on an Improved PSO Algorithm. PLoS ONE 2025, 20, e0321616. [Google Scholar] [CrossRef] [Scilit] [PubMed]
  44. Majhi, N.; Mishra, R. A Novel Hybrid Genetic Algorithm and Nelder-Mead Approach and It’s Application for Parameter Estimation. F1000Research 2025, 13, 1073. [Google Scholar] [CrossRef] [Scilit] [PubMed]
  45. Fu, H.; Li, H.; Ramayah, T.; Fu, A. A Hybrid Genetic Based Approach for Solving Vehicle Routing Problem in Cold Chain Logistics Distribution. J. Logist. Inform. Serv. Sci. 2023, 10, 362–387. [Google Scholar] [CrossRef] [Scilit]
Figure 1. Schematic Diagram of Urban Logistics Unmanned Vehicle Delivery.
Applsci 16 09933 g001
Figure 2. Schematic of Improved Order Crossover.
Applsci 16 09933 g002
Figure 3. 2-opt Operator Schematic.
Applsci 16 09933 g003
Figure 4. 3D surface plots of different test functions.
Applsci 16 09933 g004
Figure 5. Box Plot of Optimization Accuracy Test Results.
Applsci 16 09933 g005
Figure 6. Convergence curves of fitness values for different algorithms on test functions.
Applsci 16 09933 g006
Figure 7. Schematic diagram of encoding and decoding.
Applsci 16 09933 g007
Figure 8. Optimal solution to the multiple unmanned vehicles task assignment problem.
Applsci 16 09933 g008
Figure 9. Comparative convergence curves of different algorithms.
Applsci 16 09933 g009
Figure 10. Task allocation diagram for 60 customers.
Applsci 16 09933 g010
Figure 11. Ablation study.
Applsci 16 09933 g011
Table 2. Test function information.
FunctionTypeFunction NameDimensionRangeOptimal Value
F1UnimodalShifted and Rotated Bent Cigar Function100[−100, 100]100
F2MultimodalShifted and Rotated Rastrigin’s Function100[−100, 100]500
F3MultimodalShifted and Rotated Lunacek Bi_Rastrigin Function100[−100, 100]700
F4HybridHybrid Function 2 (N = 3)100[−100, 100]1200
F5HybridHybrid Function 4 (N = 4)100[−100, 100]1400
F6HybridHybrid Function 6 (N = 5)100[−100, 100]1900
F7CompositionComposition Function 1 (N = 3)100[−100, 100]2100
F8CompositionComposition Function 3 (N = 4)100[−100, 100]2300
F9CompositionComposition Function 5 (N = 5)100[−100, 100]2500
Table 3. Experimental results of all algorithms on test functions.
FunctionStatisticGASSAGWODBOWMAWMA-GA
F1Mean3.06 × 10112.68 × 10114.83 × 10107.52 × 10103.12 × 1082.44 × 107
Std4.29 × 10101.57 × 10108.58 × 1096.19 × 10105.66 × 1074.66 × 106
Best2.43 × 10112.48 × 10113.74 × 10102.68 × 10102.53 × 1082.02 × 107
F2Mean2.21 × 1032.04 × 1031.19 × 1031.58 × 1039.93 × 1028.69 × 102
Std1.27 × 1022.77 × 1016.47 × 1012.60 × 1023.36 × 1013.68 × 101
Best2.05 × 1032.02 × 1031.09 × 1031.33 × 1033.68 × 1018.07 × 102
F3Mean7.70 × 1034.01 × 1032.02 × 1032.51 × 1032.24 × 1031.50 × 103
Std5.29 × 1024.44 × 1011.03 × 1021.49 × 1021.26 × 1022.66 × 102
Best7.18 × 1033.94 × 1031.92 × 1032.30 × 1032.15 × 1031.24 × 103
F4Mean1.58 × 10111.89 × 10117.54 × 1095.06 × 1092.22 × 1083.30 × 107
Std2.76 × 10101.86 × 10103.02 × 1091.88 × 1095.31 × 1071.23 × 107
Best1.11 × 10111.58 × 10114.19 × 1093.14 × 1091.46 × 1085.22 × 107
F5Mean8.47 × 1071.32 × 1081.00 × 1071.77 × 1071.11 × 1066.47 × 105
Std3.50 × 1078.03 × 1077.03 × 1067.45 × 1063.03 × 1052.53 × 105
Best4.62 × 1075.72 × 1074.03 × 1061.10 × 1076.08 × 1054.14 × 105
F6Mean9.70 × 1092.43 × 10107.30 × 1079.69 × 1071.87 × 1065.07 × 103
Std5.31 × 1092.38 × 1095.95 × 1079.59 × 1072.81 × 1052.32 × 103
Best1.39 × 1092.17 × 10103.37 × 1061.45 × 1071.54 × 1062.14 × 103
F7Mean4.37 × 1034.97 × 1032.98 × 1033.89 × 1032.92 × 1032.63 × 103
Std1.30 × 1021.13 × 1027.39 × 1012.17 × 1025.87 × 1013.23 × 101
Best4.21 × 1034.84 × 1032.90 × 1033.64 × 1032.87 × 1032.59 × 103
F8Mean5.72 × 1036.16 × 1033.59 × 1034.41 × 1033.47 × 1033.11 × 103
Std1.78 × 1024.22 × 1021.21 × 1021.54 × 1027.04 × 1014.64 × 101
Best5.54 × 1035.67 × 1033.47 × 1034.19 × 1033.36 × 1033.06 × 103
F9Mean5.05 × 1042.81 × 1045.82 × 1031.26 × 1043.64 × 1033.49 × 103
Std1.36 × 1042.02 × 1034.61 × 1026.31 × 1031.01 × 1026.34 × 101
Best3.39 × 1042.57 × 1045.15 × 1036.34 × 1033.49 × 1033.38 × 103
Note: Mean, Std, and Best denote the mean objective value, standard deviation, and best objective value obtained from 30 independent runs, respectively. Lower values indicate better optimization performance.
Table 4. Holm-adjusted Wilcoxon rank-sum test results on the benchmark functions.
Compared Algorithm+=−
GA900
SSA900
GWO810
DBO900
WMA720
Note: The symbols are determined using the two-sided Wilcoxon rank-sum test with Holm correction at α = 0.05 . “+” indicates that WMA-GA performs significantly better than the compared algorithm, “=” indicates no statistically significant difference, and “−” indicates that WMA-GA performs significantly worse.
Table 5. Main parameters of unmanned vehicle delivery.
ParameterSymbolParameter SettingsUnit
Maximum available vehicles K 10vehicles
Maximum load capacity per vehicle Q 50demand units
Vehicle travel speed v 30km/h
Energy consumption per unit distance under no load r 0 0.5kWh/km
Energy consumption per unit distance under full load r 1 1kWh/km
Electricity price coefficient c 1.2cost units/kWh
Fixed usage cost of a single vehicle f k 75cost units
Table 6. Parameters of task points in logistics distribution.
CustomerX-CoordinateY-CoordinateDemandEarliest Arrival TimeLatest Arrival Time
1510308:1510:13
28121016:1218:59
3134709:4412:50
415251009:5312:08
51616709:2112:32
61110114:4418:20
72430316:0318:19
82112515:4319:06
918201012:3115:27
1021351012:5815:41
113512412:1515:22
121215809:0811:59
137131015:2617:48
141423509:4312:31
151632908:2411:44
161934213:5316:11
172316512:5115:46
1827251010:1913:06
192010808:2010:36
203219408:3312:11
21913714:2217:20
221924309:3411:23
23269210:3214:04
2428341011:2315:32
253035412:0016:23
261127113:1215:23
272328212:2415:21
28131549:1212:21
292718310:2213:45
30315611:3415:23
Table 7. Main algorithm parameters of the proposed WMA-GA.
ParameterParameter Settings
Population size100
Maximum iterations500
Crossover probability0.8
Tournament size2
Number of leaders50
Base mutation probability0.15
2-opt local search probability0.2
Table 8. Comparative results of different algorithms.
AlgorithmTransportation CostTime Window Penalty CostFixed CostTotal Cost
GA351.3941.90300693.29
SSA373.6736.34300710.01
GWO316.2327.21300643.44
WMA311.4538.72300650.17
WMA-GA285.6624.87300610.53
Table 9. Comparative results of medium- and large-scale instances.
Customer ScaleAlgorithmObjStdGapCPU
60GA1628.2320.35−13.24%46.28
WMA1496.3121.51−5.59%50.49
ALNS1474.9619.45−4.22%61.42
WMA-GA1412.6720.14—73.49
70GA1982.6724.57−13.08%50.75
WMA1817.2824.65−5.17%66.34
ALNS1784.3523.78−3.42%75.47
WMA-GA1723.3423.12—87.76
80GA2545.1328.97−11.35%54.56
WMA2378.6928.40−5.14%78.25
ALNS2294.8427.41−1.68%88.43
WMA-GA2256.3226.45—94.36
90GA3023.7637.28−8.27%66.48
WMA2852.9634.65−2.77%93.46
ALNS2834.1934.20−2.13%109.73
WMA-GA2773.8331.57—123.64
100GA3563.4646.74−8.93%71.46
WMA3412.3241.76−4.90%123.23
ALNS3378.3740.94−3.94%135.68
WMA-GA3245.1738.98—142.21
Table 10. Wall-clock-equalized comparison.
Customer ScaleTime Budget (s)GA Mean ± StdWMA Mean ± StdALNS Mean ± StdWMA-GA Mean ± Std
6073.491605.47 ± 18.911481.66 ± 20.121460.93 ± 18.691415.26 ± 21.15
8094.362516.74 ± 27.582365.85 ± 27.562288.97 ± 26.132259.48 ± 27.28
100142.213520.61 ± 45.243395.72 ± 40.743367.23 ± 39.413249.91± 40.52
Table 11. Holm-adjusted Wilcoxon rank-sum test results for task-assignment experiments.
Customer ScaleCompared AlgorithmAdjusted p-ValueResult
30GA<0.001+
30SSA<0.001+
30GWO0.018+
30WMA0.026+
60GA<0.001+
60WMA0.004+
60ALNS0.047+
70GA<0.001+
70WMA0.004+
70ALNS0.029+
80GA<0.001+
80WMA0.002+
80ALNS0.012+
90GA<0.001+
90WMA0.001+
90ALNS0.009+
100GA<0.001+
100WMA0.001+
100ALNS0.021+
Note: The reported values are Holm-adjusted p-values obtained using the two-sided Wilcoxon rank-sum test based on 30 independent stochastic runs on the same fixed instance for each customer scale. “+” indicates that the proposed WMA-GA achieves a significantly lower objective value than the compared algorithm. The significance level is set to α = 0.05 .
Table 12. Experimental results with varying population sizes.
Pop SizeObjCPU
50643.7634.21
100610.2559.46
150609.44113.54
200612.76204.97
Table 13. Experimental results with varying crossover probabilities.
P c ObjCPU
0.6634.3354.59
0.7632.7857.21
0.8612.4959.79
0.9618.6262.46
Table 14. Experimental results with varying mutation probabilities.
P m ObjCPU
0.05625.4656.75
0.10618.3858.23
0.15611.5360.06
0.20634.2967.34
Table 15. Experimental results with varying 2-opt local search probabilities.
P L S ObjCPU
0.2611.1457.24
0.3627.2561.53
0.4641.7770.29
0.5648.3683.75
Table 16. Statistical results of the parameter-sensitivity analysis.
ParameterSelected SettingCompared SettingAdjusted p-ValueResult
Population size100500.006+
Population size1001500.732=
Population size1002000.412=
Pc0.80.60.008+
Pc0.80.70.012+
Pc0.80.90.173=
Pm0.150.050.021+
Pm0.150.100.196=
Pm0.150.200.005+
PLS0.20.30.032+
PLS0.20.40.006+
PLS0.20.50.002+
Note: The reported values are Holm-adjusted p-values obtained using the two-sided Wilcoxon rank-sum test based on 10 independent runs. “+” indicates that the selected parameter setting achieves a significantly lower objective value than the compared setting, “=” indicates that no statistically significant difference is observed. The significance level is set to α = 0.05 .
Table 17. Ablation experiment results under different problem sizes.
Number of CustomersAlgorithmObjCPU
30Baseline608.2938.76
No-OPT624.5834.53
No-GA636.7932.56
No-HC643.5429.14
50Baseline1277.9358.25
No-OPT1312.3654.56
No-GA1339.4450.32
No-HC1362.4547.28
80Baseline2278.6392.56
No-OPT2325.5785.18
No-GA2456.1479.89
No-HC2476.8477.21
Table 18. Holm-adjusted Wilcoxon rank-sum test results for the ablation study.
CustomersComparisonAdjusted p-ValueResult
30No-OPT0.081=
30No-GA0.019+
30No-HC0.006+
50No-OPT0.034+
50No-GA0.008+
50No-HC0.003+
80No-OPT0.017+
80No-GA0.002+
80No-HC<0.001+
Note: The reported values are Holm-adjusted p-values obtained using the two-sided Wilcoxon rank-sum test based on 30 independent runs. “+” indicates that the complete WMA-GA achieves a significantly lower objective value than the corresponding ablated variant, “=” indicates that no statistically significant difference is observed. The significance level is set to α = 0.05 .
Disclaimer/Publisher’s Note: The statements, opinions and data contained in all publications are solely those of the individual author(s) and contributor(s) and not of MDPI and/or the editor(s). MDPI and/or the editor(s) disclaim responsibility for any injury to people or property resulting from any ideas, methods, instructions or products referred to in the content.