Article

Bioactive and Nutritional Profiling of Freeze-Dried Pigmented Sweet Potato Powders: Antioxidant Capacity, Phenolic Compounds, and Mineral Composition

by
Nicoleta Cristina Chiorean
1,
Maria Simona Chiș
2,*,
Alexandru Ioan Apahidean
1,
Rodica Sima
1,
Anca Corina Fărcaș
2,
Adriana Păucean
2,
Anamaria Iulia Török
3,
Oana Cadar
3,
Gina Maria Cucuiet
2,
Gheorghe Coteț
4 and
Emese Gal
5
1
Faculty of Horticulture and Business in Rural Development, University of Agricultural Sciences and Veterinary Medicine, Calea Mănăștur 3–5, 400372 Cluj-Napoca, Romania
2
Faculty of Food Science and Technology, University of Agricultural Sciences and Veterinary Medicine, Calea Mănăștur 3–5, 400372 Cluj-Napoca, Romania
3
NCDO-INOE 2000 Research Institute for Analytical Instrumentation, 67 Donath Street, 400293 Cluj-Napoca, Romania
4
Research-Development Station for Field Crops on Sandy Soils-Dăbuleni, 217 Petre Baniţă Str., 207220 Călăraşi Village, Romania
5
Faculty of Chemistry and Chemical Engineering, Babeș-Bolyai University, Arany János No. 11, 400028 Cluj-Napoca, Romania
*
Author to whom correspondence should be addressed.
Appl. Sci. 2026, 16(17), 8815; https://doi.org/10.3390/app16178815
Submission received: 27 July 2026 / Revised: 1 September 2026 / Accepted: 2 September 2026 / Published: 4 September 2026

Abstract

Freeze-dried sweet potato powders derived from three distinct genotypes—white (Koretta), orange (Ro-Ch-G), and purple (Ro-Ch-M)—were comprehensively characterized with respect to their proximate composition, phenolic profile, antioxidant activity, color attributes, and mineral composition. The purple sweet potato powder showed the highest total phenolic content (5.79 mg GAE/g dw), flavonoid content (0.38 mg QE/g dw), and DPPH, ABTS and FRAP radical-scavenging activity (DPPH: 8.8 μM TE/g dw; ABTS: 11.7 μM TE/g dw; FRAP: 13.32 μM TE/g dw). In contrast, the white sweet potato powder exhibited the lowest values. HPLC-DAD-MS analysis revealed 19 tentatively identified phenolic compounds, with anthocyanins detected exclusively in the purple sample, which might be associated with its higher antioxidant activity. Color measurements showed distinct profiles among the analyzed composite powders. The purple sweet potato powder exhibited the lowest lightness (L) and hue angle values, whereas the orange sweet potato powder showed the highest b and chroma values, consistent with its characteristic orange pigmentation. Mineral and elemental analysis also showed variation in macro-, micro-, and trace-element composition among the composite powders, with the pigmented samples generally exhibiting higher concentrations of several elements, including K, Ca, Mn, P, and Zn. The resulting freeze-dried powders exhibited a diverse profile of quantifiable bioactive compounds, particularly in the purple sweet potato powder, supporting their compositional interest for further investigation in food applications.

1. Introduction

Globally, sweet potato (Ipomoea batatas L.) is recognized as an important and versatile crop contributing significantly to food security. Beyond its agronomic advantages, it possesses a high nutritional value, exceeding many carbohydrate-rich foods in its content of vitamins, minerals, dietary fiber, and proteins [1]. Likewise, sweet potato is widely recognized for its rich phytochemical composition, particularly its phenolic acids, flavonoids, anthocyanins, and carotenoids, whose concentrations vary considerably among varieties and contribute to their antioxidant capacity and potential health-promoting properties [2].
Given the highly perishable nature of sweet potato roots, characterized by high moisture content and susceptibility to post-harvest losses, processing technologies play a critical role in improving shelf life and preserving nutritional quality [1,3]. In this context, freeze-drying (lyophilization) has emerged as an effective preservation technology for the production of stable powdered ingredients due to its ability to minimize nutrient degradation and maintain the integrity of bioactive compounds [4]. Compared with conventional drying methods, particularly hot-air drying, freeze-drying demonstrates superior retention of phenolic compounds and antioxidant capacity, thereby enhancing the functional and nutritional quality of the final product.
Sweet potato powder can be utilized as a functional ingredient in various food products, including soups, beverages, noodles, gravies, and bakery items, contributing to improved colour, flavour, and nutritional value. Owing to its high starch content, it can also function as a thickening agent and as a substitute for cereal flour, particularly in gluten-free formulations intended for individuals with celiac disease [5].
Despite the availability of numerous studies focusing on the compositional analysis of sweet potatoes, limited information is available regarding the integrated evaluation of different genotypes processed as freeze-dried powders and their potential as functional ingredients [1].
In addition to the aspects discussed above, recent studies have emphasized the influence of processing conditions on the preservation of nutritional and bioactive compounds in sweet potato-derived products [1,6]. The stability of phenolic compounds and antioxidant capacity is strongly affected by drying techniques, including hot-air drying, vacuum-drying, and freeze-drying, which differently impact the retention of heat-sensitive compounds [4,7,8,9,10,11,12]. Moreover, phenolic compounds play a key role in antioxidant mechanisms and radical-scavenging activity, contributing to the overall functional properties of the final products [13,14]. The transformation of fresh roots into powder form further improves stability and extends applicability in food systems [4,11,12,15]. At the same time, the compositional and functional characteristics of sweet potato powders are highly dependent on genotype, with different varieties exhibiting distinct profiles of bioactive compounds and antioxidant activity [6,16,17,18,19].
The selected genotypes were chosen to represent distinct pigmentation profiles (white, orange, and purple), which are directly associated with differences in phytochemical composition, particularly phenolic compounds, anthocyanins, and carotenoids [6,19]. In addition, the selected plant materials include both an officially registered cultivar (Koretta) and experimental lines developed under local agro-climatic conditions, providing a relevant framework for comparing sweet potato powders with distinct compositional profiles.
It was hypothesized that freeze-dried powders obtained from the three selected sweet potato genotypes would exhibit distinct compositional and phytochemical profiles. To assess these differences, the resulting powders were comparatively characterized for proximate composition (moisture, protein, fat, fiber, total carbohydrates), mineral content, antioxidant activity, total phenolic and flavonoid contents, individual phenolic compounds and color parameters, while Fourier-transform infrared (FTIR) spectroscopy was employed to further characterize their chemical profiles.
The novelty of this research lies in the comprehensive and integrated characterization of sweet potato powders obtained from three genotypes cultivated in Romania at SCDCPN (Research and Development Station for Plant Culture on Sandy Soils Dăbuleni), including one registered cultivar and two experimental lines, through a combination of nutritional, phytochemical, mineral, and spectroscopic analyses.

2. Materials and Methods

2.1. Chemicals and Reagents

All chemicals and reagents used for the chemical composition, antioxidant, and chromatographic analyses were selected according to the requirements of the respective analytical methods. Methanol (95%), hydrochloric acid (HCl), nitric acid (HNO3, 65%), hydrogen peroxide (H2O2), sodium carbonate (Na2CO3), aluminum chloride (AlCl3), ferric chloride (FeCl3), 2,4,6-tripyridyl-s-triazine (TPTZ), and Folin–Ciocalteu reagent were used for sample preparation, extraction, and spectrophotometric analyses and were purchased from Merck (Darmstadt, Germany). Gallic acid, quercetin, and Trolox were used as reference standards for the determination of total phenolic content, total flavonoid content, and antioxidant activity, respectively. 2,2-Diphenyl-1-picrylhydrazyl (DPPH) and 2,2′-azinobis-(3-ethylbenzothiazoline-6-sulfonic acid) (ABTS) were used for the corresponding radical-scavenging assays and achieved form Sigma-Aldrich (St. Louis, MO, USA).
For the FRAP assay, acetate buffer (0.3 M, pH 3.6), TPTZ solution (10 mM in 40 mM HCl), and ferric chloride solution (20 mM) were used to prepare the working reagent and achieved from Merck (Darmstadt, Germany). Acetic acid and acetonitrile (Merck, Darmstadt, Germany) were used as components of the HPLC mobile phase, while ultrapure water was generated using a Direct-Q UV water purification system (Millipore, Burlington, MA, USA). High-purity standards for the identification and quantification of individual polyphenols were purchased from Sigma-Aldrich (St. Louis, MO, USA), while multi-element standards for ICP-OES and ICP-MS calibration were obtained from Merck (Darmstadt, Germany) and PerkinElmer (Shelton, CT, USA), respectively.

2.2. Plant Material, Growing Conditions, and Sample Preparation

Three sweet potato genotypes developed at the Research and Development Station for Plant Culture on Sands (SCDCPN Dăbuleni, Călărași, Romania) were investigated: the white-fleshed variety Koretta (officially registered in 2024), and two experimental lines currently under homologation, namely Ro-Ch-G (orange-fleshed) and Ro-Ch-M (purple-fleshed). These genotypes were cultivated under controlled agronomic conditions using drip irrigation and polyethylene mulching, following a randomized block design with three replicates.
The climatic conditions recorded during the 2025 agricultural year were characterized by higher average temperatures and reduced precipitation compared to the multiannual averages (1956–2024). During the growing season (May–October), temperatures ranged from 11.28 °C to 25.75 °C, with extreme values exceeding 40 °C in summer months. In addition, low precipitation levels were recorded during critical stages of tuber development, with 11.6 mm in July and 26.4 mm in August.
The experimental study was conducted in the southern region of Oltenia (Romania), an area characterized by sandy soils with moderate-to-low fertility. Such soils are generally well-suited for sweet potato cultivation due to their good drainage properties, although careful management of nutrients and water is required. The soil from the experimental field was characterized by a neutral pH (7.36), low nitrogen content, and moderate levels of phosphorus and potassium, reflecting typical conditions for sandy soils in this region.
For each genotype, roots were collected separately from each of the three randomized field blocks and processed and freeze-dried independently, resulting in three field-derived powder samples. Equal portions of the three powders corresponding to the same genotype were subsequently combined to obtain one representative composite powder sample per genotype. The resulting composite powders were used for all subsequent analytical determinations. Each composite powder was analyzed in triplicate, and the reported mean ± SD values were calculated from these three analytical replicate measurements. Thus, these measurements represent analytical replicates rather than independent biological replicates.
White sweet potato (WPP), purple sweet potato (PPP), and orange sweet potato (OPP) were manually collected, cleaned to remove adhering soil and impurities, thoroughly washed with distilled water, peeled, and cut into uniform slices and frozen at −40 °C for 24 h until further analysis.
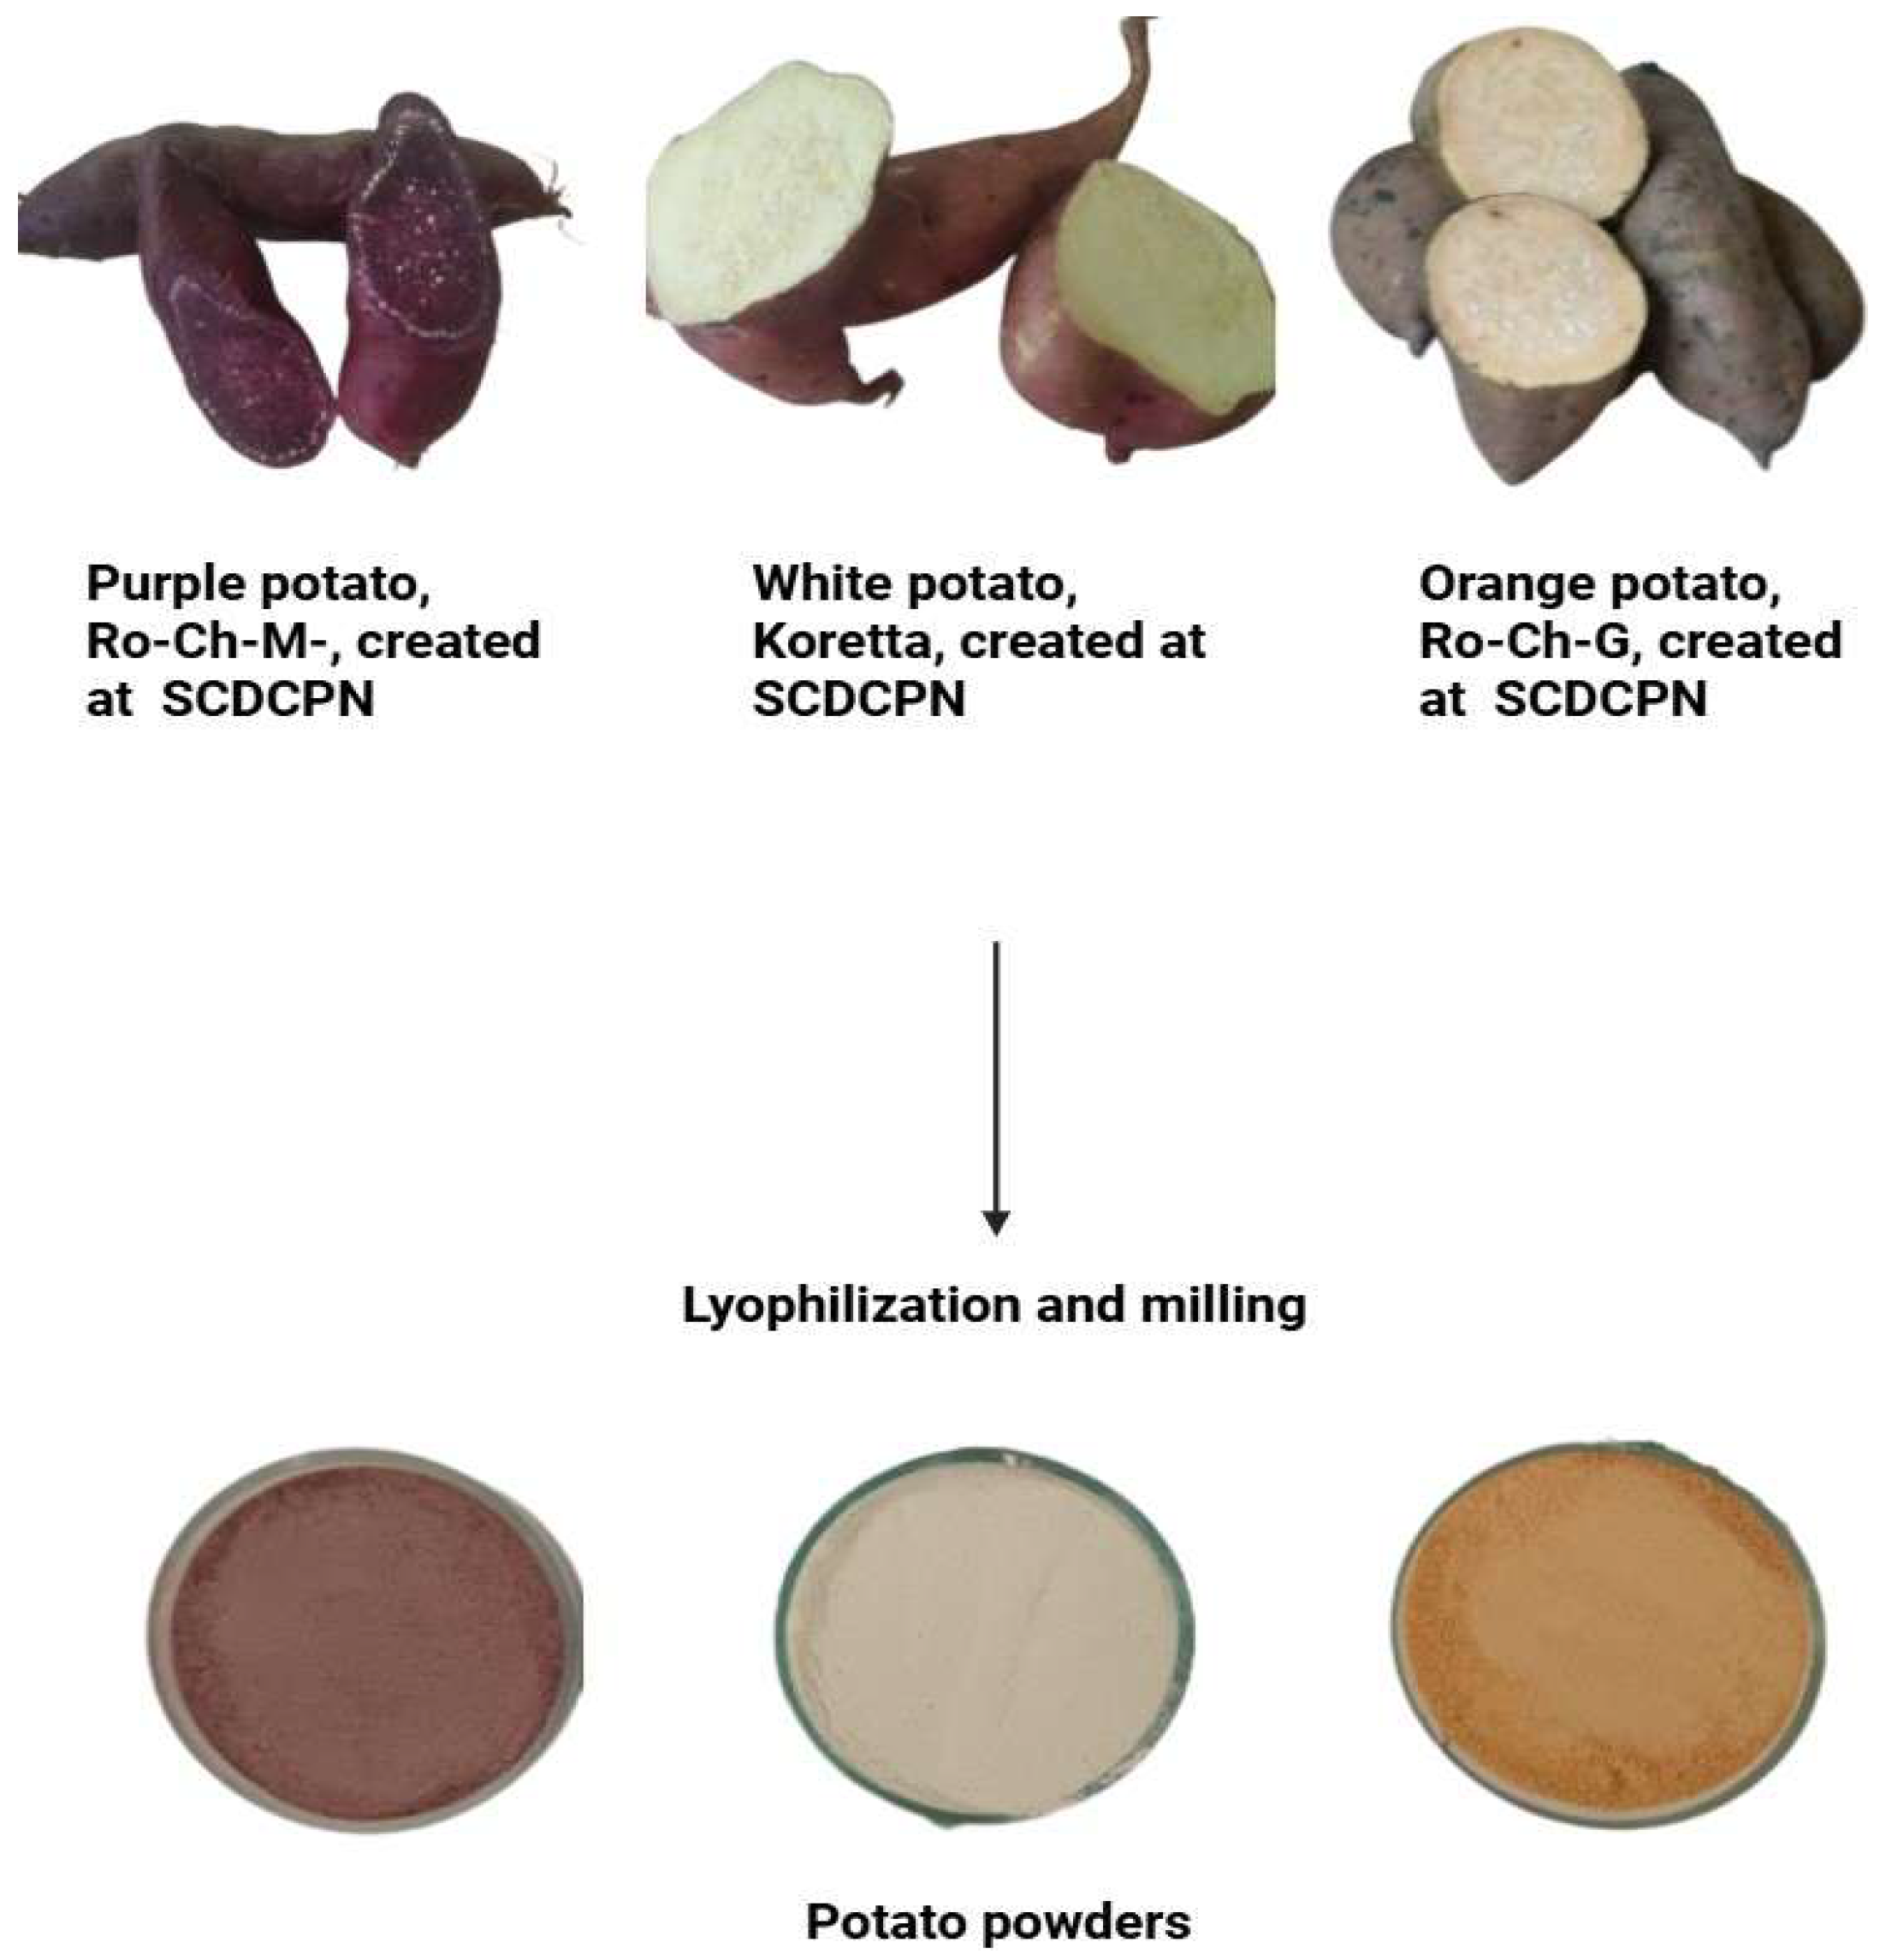
Freeze-drying was performed using a BÜCHI Lyovapor™ L-200 freeze-dryer (BÜCHI Labortechnik AG, Flawil, Switzerland). Frozen samples were lyophilized under vacuum (approximately 0.1 mbar) with a condenser temperature maintained at −50 °C. The process was continued for 48 h, or until a constant sample weight was achieved, indicating complete moisture removal. The resulting lyophilized samples were then used for subsequent analyses. After lyophilization, the samples were ground using a laboratory mill to obtain fine powders and sieved to ensure uniform particle size. The powders (Figure 1) were stored in airtight containers, protected from light, oxygen, and humidity, at room temperature until further analyses.

2.3. Proximate Composition Analysis

The proximate composition of the freeze-dried sweet potato powders was determined according to standard methods of the AACC International (2000) [20].
The samples were analyzed for moisture (AACC 44-15.02, 2000), ash (AACC 08-01.01, 2000), fat (AACC 30-25.01, 2000), and crude fiber (AACC 32-07.01, 2000). Protein content was determined using the Kjeldahl method (AACC 46-11.02, 2000), based on nitrogen determination and conversion to protein. Fat (AACC 30-25.01, 2000) was determined by Soxhlet extraction [21]. Total carbohydrate content (%) was calculated by difference, according to the following equation:
Carbohydrates (%) = 100 − (moisture (%) + protein (%) + fat (%) + ash (%) + fiber (%))
This approach is widely applied in food composition analysis [22,23].
The total energy value was calculated using the Atwater conversion factors [24], which estimate the caloric contribution of macronutrients:
Energy (kcal/100 g) = (Carbohydrates × 4.0) + (Protein × 4.0) + (Lipids × 9.0)
where:
Carbohydrates, Protein, and Lipids are expressed as grams per 100 g of product.

2.4. Determination of Mineral Content

Sample digestion was performed according to previously reported methods [25,26]. Briefly, approximately 0.5 g of freeze-dried sample was digested using 8 mL nitric acid (HNO3, 65%) and 3 mL hydrogen peroxide (H2O2) using a closed-vessel microwave digestion system (Xpert, Berghof, Eningen, Germany). Sample digestion was carried out using a microwave-assisted protocol consisting of two heating stages at 120 °C and 170 °C, followed by two cooling stages at 100 °C and 25 °C. Throughout the digestion process, a pressure of 30 bar was maintained to ensure efficient mineralization and process stability. The total digestion time was 25 min. After digestion, the solutions were cooled and diluted to a final volume of 20 mL with ultrapure water [25,26].
The resulting solutions were analyzed using an inductively coupled plasma optical emission spectrometer Optima 5300 DV instrument (ICP-OES, PerkinElmer, Norwalk, CT, USA) for the determination of macroelements (K, Ca, Mg, Na, and P) and selected microelements (Fe, Cu, Zn). Trace elements (As, Ba, Cd, Cr, Co, Hg, Mn, Ni, Pb, Rb, Se, Sr, V) were determined by iCAP TQ inductively coupled plasma mass spectrometer (ICP-MS) equipped with a triple-quadrupole mass filter (Thermo Fisher Scientific, Waltham, MA, USA). Calibration was performed using multi-element standard solutions (1000 mg/L multielement standard solution, Merck, Darmstadt, Germany, for ICP_OES, and ICP Multi-Element Calibration Standard 3, PerkinElmer Pure Plus, Shelton, CT, USA for ICP-MS analysis), and the results were expressed as mg/kg dry weight (dw). All analyses were conducted in triplicate.

2.5. Preparation of Extracts

2.5.1. Extraction for Phenolic and Flavonoid Compounds

Phenolic and flavonoid compounds were extracted using an acidified methanolic solvent system, which improves extraction efficiency and stabilizes phenolic compounds, particularly anthocyanins present in colored potato varieties [27].
Approximately 2 g of each sample was extracted with 95% methanol acidified with 1% HCl (v/v). Extraction was carried out under continuous stirring at room temperature. Successive extractions were performed using 5 mL portions of solvent and repeated for a maximum of three cycles, or until complete discoloration of the plant matrix was achieved, indicating exhaustive extraction of the soluble compounds. This procedure ensured both extraction efficiency and experimental reproducibility.
The combined extracts were filtered, and the solvent was evaporated under controlled conditions. The residues were subsequently reconstituted to a final volume of 10 mL with methanol to ensure uniformity and comparability between samples.

2.5.2. Extraction for Antioxidant Activity

For antioxidant activity assays, extraction was performed using non-acidified methanol. Approximately 2 g of sample was mixed with 20 mL of 95% methanol, corresponding to a solid-to-solvent ratio of 1:10 (w/v).
The extraction was carried out under continuous stirring at room temperature, followed by filtration. The use of a non-acidified solvent prevents potential interference in radical-scavenging assays [28].

2.5.3. Total Phenolic Content (TPC)

Total phenolic content was determined using the Folin–Ciocalteu colorimetric method [29,30].
An aliquot of extract was mixed with diluted Folin–Ciocalteu reagent, followed by sodium carbonate solution. The mixture was incubated in the dark for 30 min at room temperature. Absorbance was measured at 765 nm using a microplate reader. The results were expressed as mg gallic acid equivalents (GAE)/g dry weight.

2.5.4. Total Flavonoid Content (TFC)

Total flavonoid content was determined using the aluminum chloride colorimetric method [30].
The extract was mixed with AlCl3 solution and incubated at room temperature. Absorbance was measured at 415 nm using a microplate reader. The results were expressed as mg quercetin equivalents (QE)/g dry weight.

2.5.5. Antioxidant Activity

DPPH Radical-Scavenging Activity
The DPPH assay was performed according to Brand-Williams et al. [31] and Hulujan et al. [32]. The method is based on the reduction of the DPPH radical, resulting in a decrease in absorbance at 517 nm. Briefly, 35 µL of extract was mixed with 250 µL of a methanolic DPPH solution, followed by incubation in the dark for 30 min.
The results were expressed as Trolox equivalents (TE), with the following calibration curve: y = −0.002x + 0.6781 (R2= 0.9999).
ABTS Radical Cation Assay
The ABTS assay was conducted according to Hulujan et al. [32]. For the determination of ABTS radical-scavenging activity, 20 µL of extract was added to 170 µL of diluted ABTS+ solution in a 96-well microplate. Following thorough mixing, the reaction mixture was incubated in the dark for 6 min at room temperature to allow the reaction to reach completion before spectrophotometric analysis, and absorbance was measured at 734 nm.
The results were expressed as Trolox equivalents (TE).
Ferric Reducing Antioxidant Power (FRAP)
FRAP reagent was prepared immediately before use by combining acetate buffer (0.3 M, pH 3.6), TPTZ solution (10 mM in 40 mM HCl), and FeCl3 solution (20 mM) in a 10:1:1 (v/v/v) ratio. An aliquot of 25 µL of extract was mixed with 175 µL of the freshly prepared reagent and incubated in the dark at room temperature for 30 min to allow for complete reduction of the ferric complex. The absorbance was then measured at 593 nm, and the antioxidant reducing power was calculated according to Sall et al. [33].

2.6. Instrumental Color Analysis

Color characteristics of the potato powder samples were determined using a portable spectrophotometer colorimeter (3NH model) (NH300, Shenzhen 3NH Technology Co., Ltd., Shenzhen, China). The device operates by directing a controlled light beam onto the sample surface and measuring the reflected radiation, enabling the quantification of color parameters within the CIE L*a*b*C* and h color space.
Within this system, L* indicates lightness on a scale from black (0) to white (100), a* represents the red–green axis (positive values indicate redness, negative values indicate greenness), and b* corresponds to the yellow–blue axis (positive values indicate yellowness, negative values indicate blueness). Additionally, chroma (C*) and hue angle (h°) were calculated to better describe color intensity and hue. Chroma (C*) reflects color saturation, while the hue angle (h°) defines the type of color perceived.
Higher chroma values are associated with more vivid and intense coloration [34].
Chroma was calculated as follows:
C* = √(a*2 + b*2)
Hue angle was calculated as follows:
h° = arctan (b/a) × (180/π)

2.7. HPLC Analysis

The chemical composition of the obtained extracts was characterized using a high-performance liquid chromatography (HPLC) system (Agilent 1200, Agilent Technologies, Santa Clara, CA, USA), equipped with a quaternary pump, an online degasser, an autosampler, and a UV–VIS diode array detector (DAD), according to Călinoiu et al., and Nemeș et al. [35,36]. The system was further coupled to a single-quadrupole mass spectrometer (Agilent 6110) for compound detection and confirmation. Separation of compounds was carried out on a Kinetex XB-C18 column (4.6 × 150 mm, 5 µm particle size, Phenomenex, Torrance, CA, USA). The mobile phases consisted of (A) water with 0.1% acetic acid and (B) acetonitrile with 0.1% acetic acid. The gradient elution program was as follows: 0 min, 5% B; 0–2 min, 5% B; 2–18 min, 5–40% B; 18–20 min, 40–90% B; 20–24 min, 90% B; 24–25 min, 90–5% B; 25–30 min, 5% B.
The column temperature was maintained at 25 °C, with a flow rate of 0.5 mL/min. Spectral data were recorded in the range of 200–600 nm, and chromatograms were monitored at 280, 340, and 520 nm.
For quantitative analysis, calibration curves were prepared using external standards, and linearity was confirmed within the tested concentration range. UV–Vis spectra of chromatographic peaks were recorded over the wavelength range of 200–600 nm and used to support compound assignment based on their spectral characteristics.
Mass spectrometric detection was performed using an electrospray ionization source in positive mode (ESI+) with full-scan acquisition over the m/z range of 120–1200. The operating conditions were as follows: capillary voltage, 3000 V; temperature, 350 °C; nitrogen flow rate, 7 L/min; and fragmentor voltage, 100 V. Phenolic compounds were tentatively identified based on a combination of chromatographic retention behavior, UV–Vis spectral characteristics, and molecular ions obtained by HPLC-DAD-ESI-MS, together with comparison with available reference standards and previously reported literature data. Given the use of single-quadrupole MS in full-scan mode, structural assignments, particularly those of complex acylated anthocyanins, were considered tentative. For quantitative analysis, external calibration curves were constructed using representative standards for the corresponding phenolic classes. Hydroxybenzoic acids were quantified as gallic acid equivalents (R2 = 0.9978; LOD = 0.35 µg/mL; LOQ = 1.05 µg/mL), hydroxycinnamic acids as chlorogenic acid equivalents (R2 = 0.9937; LOD = 0.41 µg/mL; LOQ = 1.64 µg/mL), flavonols as rutin equivalents (R2 = 0.9981; LOD = 0.21 µg/mL; LOQ = 0.84 µg/mL), anthocyanins as cyanidin equivalents (R2 = 0.9951; LOD = 0.36 µg/mL; LOQ = 1.44 µg/mL), and flavanols as catechin equivalents (R2 = 0.9985; LOD = 0.18 µg/mL; LOQ = 0.72 µg/mL). Data acquisition and processing for both DAD and MS analyses were performed using Agilent ChemStation software (Rev. B.02.01-SR2), according to the previously reported analytical procedure [35,36].

2.8. FTIR Analysis

FTIR spectra were recorded on a Bruker ALPHA II FT-IR spectrometer (Bruker Corporation, Billerica, MA, USA) equipped with a Platinum ATR (attenuated total reflection) diamond accessory. The spectra were acquired in the mid-infrared region from 4000 to 400 cm−1 at a resolution of 4 cm−1, averaging 64 scans per spectrum.

2.9. Statistical Analysis

Statistical analyses were performed using IBM SPSS Statistics version 26. For each genotype, analytical determinations were performed in triplicate on one composite powder sample obtained by pooling equal portions of powders derived from the three randomized field blocks. The results are expressed as mean ± standard deviation (SD) calculated from three analytical replicate measurements of each composite sample. Since the field-derived powders were pooled prior to chemical analysis, these measurements were considered analytical rather than independent biological replicates and were used to characterize analytical variability. Consequently, no inferential statistical comparisons among genotypes were performed for variables determined on the composite powder samples. Principal component analysis (PCA) was conducted using GraphPad Prism version 9.3.0 for Windows (GraphPad Software, Boston, MA, USA) as an exploratory multivariate analysis to visualize patterns and relationships among the measured variables.

3. Results & Discussion

3.1. Proximate Composition of Sweet Potato Powders

The proximate composition of the analyzed sweet potato powders is presented in Table 1.
Moisture content ranged from 3.08% to 4.00%, demonstrating low residual moisture levels in the analyzed freeze-dried powders. In this line, Kılıç et al. (2025) showed values ranging between 1.99 to 3.21% in purple potatoes obtained through freeze-drying and hot air drying [37]. Moreover, comparable low moisture levels have been reported for freeze-dried sweet potato (Ipomoea batatas) by Kręcisz et al. (2021), who found a dry matter content of 97.05%, corresponding to approximately 2.95% residual moisture [15,38].
Protein content differed among samples, with the highest value recorded in the purple sweet potato powder (PPP—6.58%). PPP showed higher protein content compared to WPP. Similar trends have been reported in previous studies, suggesting that pigmented potato varieties often exhibit enhanced nutritional profiles compared to traditional white cultivars. For instance, the protein content obtained in the present study (5.10–6.58%) was higher than the range reported for potato ordinary (Solanum tuberosum) varieties (0.85–4.2%) [39]. On the other hand, Repas et al. [40] showed that protein potato content (Solanum tuberosum) is directly affected by heat, variety and processing methods, highlighting values between 1.73% to 3.01%. Furthermore, Pęksa et al. (2013) [41] showed values in purple, red and yellow flesh-coloured varieties ranging between 1.19% to 2.76%. The obtained values were within the expected range reported for dehydrated potato products [41], thereby supporting the reliability of the analytical approach.
As expected, fat content remained low across all samples (<0.4%), consistent with the well-established characterization of potatoes as naturally low-fat foods [42]. OPP exhibited slightly higher values than the other investigated varieties; however, these differences are interpreted descriptively, as the measurements were performed on composite powder samples.
Ash content, used as an indicator of total mineral composition, showed relatively small variations among samples, ranging from 1.50% to 1.81%. These values are comparable to those reported in the literature and suggest that mineral content is less affected by varietal pigmentation [43].
In contrast, fiber content was higher in the orange sweet potato powder (OPP; 4.43%) than in the white sweet potato powder (WPP; 3.70%). Such variation may reflect differences in cell wall composition and structural polysaccharides [42], as variability in cellulose, hemicellulose, lignin, and pectic fractions has also been reported among sweet potato varieties by Xu et al. [44]. From a nutritional perspective, higher fiber content could enhance the functional value of the product.
Carbohydrates represented the major component in all samples, exceeding 83%, which is typical for potato-based products. WPP showed higher carbohydrate values compared to the other samples. This pattern may suggest a compositional trade-off, where lower protein and fiber levels are associated with relatively higher carbohydrate fractions, as also described in previous studies [45].The calculated energy values showed numerical variation among samples, exhibiting a decreasing pattern from WPP to OPP.
Overall, the analyzed composite sweet potato powders showed different nutritional profiles. Among the three composite powders, PPP and OPP showed higher values for several nutritional parameters compared with WPP, including protein and fiber content.
On the other hand, freeze-drying resulted in powders with low residual moisture, ranging from 3.08% to 4.00%. However, no direct comparison with other processing methods or storage conditions was performed; therefore, no conclusions regarding the preservation or stability of these compounds can be drawn. Although low moisture content may contribute to improved stability, no water activity or storage stability analyses were performed; therefore, this aspect cannot be confirmed.

3.2. Mineral Composition and Elemental Profiling

The mineral composition of the analyzed sweet potato powders showed variation among the three composite samples, reflecting distinct macromineral and micromineral profiles, as presented in Table 2a and Table 2b, respectively.
Potassium (K) was the predominant macroelement in all samples, with values ranging from 4806.73 mg/kg in the WPP to 15,642.03 mg/kg in the OPP. These results are consistent with recent studies that highlight potatoes as a significantly important dietary source of K, contributing to electrolyte balance and cardiovascular health [46,47]. The OPP exhibited higher K concentrations than both PPP and WPP. Sodium (Na) content was higher in the WPP, which may be linked to differences in ion regulation mechanisms and environmental stress responses.
Calcium (Ca) and magnesium (Mg) contents varied among the analysed composite powders, with the highest values observed in PPP (1491.00 and 1322.27 mg/kg, respectively), followed by OPP and WPP. Similar observations have been reported for pigmented sweet potato varieties, which are often associated with a richer nutritional profile and higher accumulation of bioactive compounds and minerals compared to white-fleshed varieties [48]. Both Ca and Mg are essential minerals involved in numerous physiological processes. Magnesium plays an important role in enzymatic activity and photosynthesis, while calcium contributes to cell wall stability and intracellular signaling, further supporting the nutritional value of sweet varieties.
Phosphorus (P) content followed a similar pattern, with the highest concentration observed in PPP (6523 mg/kg), followed by OPP and WPP. This result agrees with findings reported by Andre et al., who observed higher mineral density in colored potato cultivars. Soil characteristics, nutrient availability, and irrigation practices may also contribute to these differences [49].
Regarding microelements, iron (Fe) and zinc (Zn) were present in higher concentrations in the OPP, while copper (Cu) reached its maximum value in the PPP. Fe concentrations were higher in OPP and PPP than in WPP, whereas Zn concentrations were higher in OPP compared to both PPP and WPP. In contrast, OPP showed the lowest Cu concentration (4.27 mg/kg), compared with WPP (5.47 mg/kg) and PPP (6.00 mg/kg). Comparable concentration has been reported in recent studies evaluating mineral composition in potato tubers and derived products [50], confirming that potatoes can contribute meaningfully to daily micronutrient intake.
Trace element analysis revealed variation in mineral concentrations among the analyzed composite powders. It was found that manganese (Mn) was highest in the OPP, while strontium (Sr) and nickel (Ni) were more abundant in the PPP. Mn concentrations were lowest in WPP and higher in PPP and OPP, whereas Sr and Ni concentrations were highest in the PPP composite sample. Similarly to our findings, Zhang et al. [18] found that Ni was present at lower concentrations in pigmented sweet potato varieties, with the mineral elements trending in the order: K > P > Ca > Mg > Mn > Fe > Zn > Cu > Ni > Se > Cr > Cd, indicating a dependency on the nutrient content of the cultivation environment. Although Sr is not commonly reported, it may accumulate in root tissues due to its chemical similarity to Ca and its uptake via shared transport pathways in plants. Despite their low concentrations, these elements contribute to the micronutrient profile, with differences observed among the analyzed samples.
The investigated potentially toxic elements (As, Cd, Cr, Co, Hg, Pb, Se, and V) were below the analytical limit of detection (LOD < 0.03 mg/kg) in all analyzed composite powders.
Overall, the analyzed pigmented potato powders, particularly PPP, showed higher concentrations of several mineral elements compared with WPP composite sample. This aligns with recent literature emphasizing the enhanced nutritional and functional potential of colored potatoes as sustainable food ingredients [50].

3.3. Bioactive Compounds and Antioxidant Activity

The content of bioactive compounds and the antioxidant activity of the analyzed potato powders are presented in Table 3.
A clear trend can be observed across all determinations, with antioxidant activity values increasing from WPP to OPP and PPP, respectively. The total phenolic content (TPC) ranged from 0.95 mg GAE/g dw in WPP composite sample to 5.79 mg GAE/g dw in the purple variety, while the total flavonoid content (TFC) varied between 0.03 and 0.38 mg QE/g dw. The TPC values followed the order PPP > OPP > WPP, while the highest TFC value was recorded for PPP among the three analysed composite powders. Similar results have been reported in previous studies reporting higher concentrations of phenolic compounds in pigmented potato cultivars, particularly those with purple flesh, which are known to be rich in anthocyanins and other polyphenolic constituents [51,52].
The use of freeze-drying in the present study may also be relevant in this context, as the drying method can influence the retention of antioxidant compounds and, consequently, the antioxidant properties of the resulting powder. Recent findings by Kılıç and Kesen (2025) showed that freeze-dried purple potato powder exhibited more favorable antioxidant and quality characteristics than hot-air-dried powder, supporting the suitability of lyophilization for preserving the bioactive properties of purple potato powder [37]. On the other hand, the relatively low values observed in the WPP are also consistent with the literature, where reduced levels of phenolic compounds are generally characterized in non-pigmented varieties due to the absence of colored phytochemicals [53]. In contrast, the elevated TPC and TFC values in the purple potato suggest a more complex and concentrated phytochemical profile, which contributes directly to its functional properties.
Antioxidant capacity evaluated using the complementary DPPH, ABTS, and FRAP assays showed a consistent pattern among the composite powder samples, with PPP displaying the highest values across all three assays. DPPH values ranged from 1.55 to 8.80 μM TE/g dw, ABTS values from 2.31 to 11.70 μM TE/g dw and FRAP values from 2.46 to 13.32 μM TE/g dw, respectively. Employing multiple antioxidant assays enables a more comprehensive evaluation of antioxidant potential, as each method reflects different mechanisms of action, including free radical scavenging and ferric ion reducing capacity [52,54].
The higher values obtained for PPP across the antioxidant assays indicate a stronger antioxidant profile compared with the other investigated composite samples. This response is consistent with its phytochemical composition, as PPP exhibited the highest total phenolic and flavonoid contents, together with greater concentrations of several individual phenolic compounds tentatively identified by HPLC-DAD-MS. Phenolic compounds, particularly hydroxycinnamic acids, flavonoids, and anthocyanins, may contribute to antioxidant capacity through electron- and hydrogen-donating mechanisms and stabilization of reactive radical species [14,37]. The abundance of these phenolic classes in PPP may therefore partly explain its greater radical-scavenging capacity. In pigmented sweet potato genotypes, anthocyanins and other phenolic constituents have been associated with enhanced antioxidant activity, although their individual contributions depend on their concentration and chemical structure. In contrast, the lower antioxidant values recorded for WPP were consistent with its lower phenolic content, whereas the intermediate response of OPP may reflect differences in its overall phytochemical profile, including the contribution of carotenoids characteristic of orange-fleshed sweet potato. Overall, the parallel variation in phenolic composition and antioxidant assay responses suggests an association between the phytochemical profile of the powders and their antioxidant capacity [52]. However, the contribution of individual compounds cannot be established from the present data and would require compound-specific activity or fractionation studies.
Overall, these results show the relationship between phenolic composition and antioxidant activity. The increase observed for TPC and all antioxidant assays, together with the elevated TFC values recorded in PPP, suggests that phenolic compounds are the main contributors to the antioxidant potential of potato powders. Moreover, the data highlight the nutritional and functional advantages of pigmented potato varieties, particularly the purple cultivar, which may be considered a valuable ingredient for the development of functional foods with enhanced health-promoting properties.
This trend is consistent with previous studies reporting higher phenolic contents and antioxidant activity in pigmented sweet potato varieties, particularly purple varieties, compared with white varieties. Such differences have been related to variations in phenolic composition, including the presence and abundance of anthocyanins and other phenolic compounds, which may contribute to the antioxidant capacity of sweet potato [55,56,57,58].
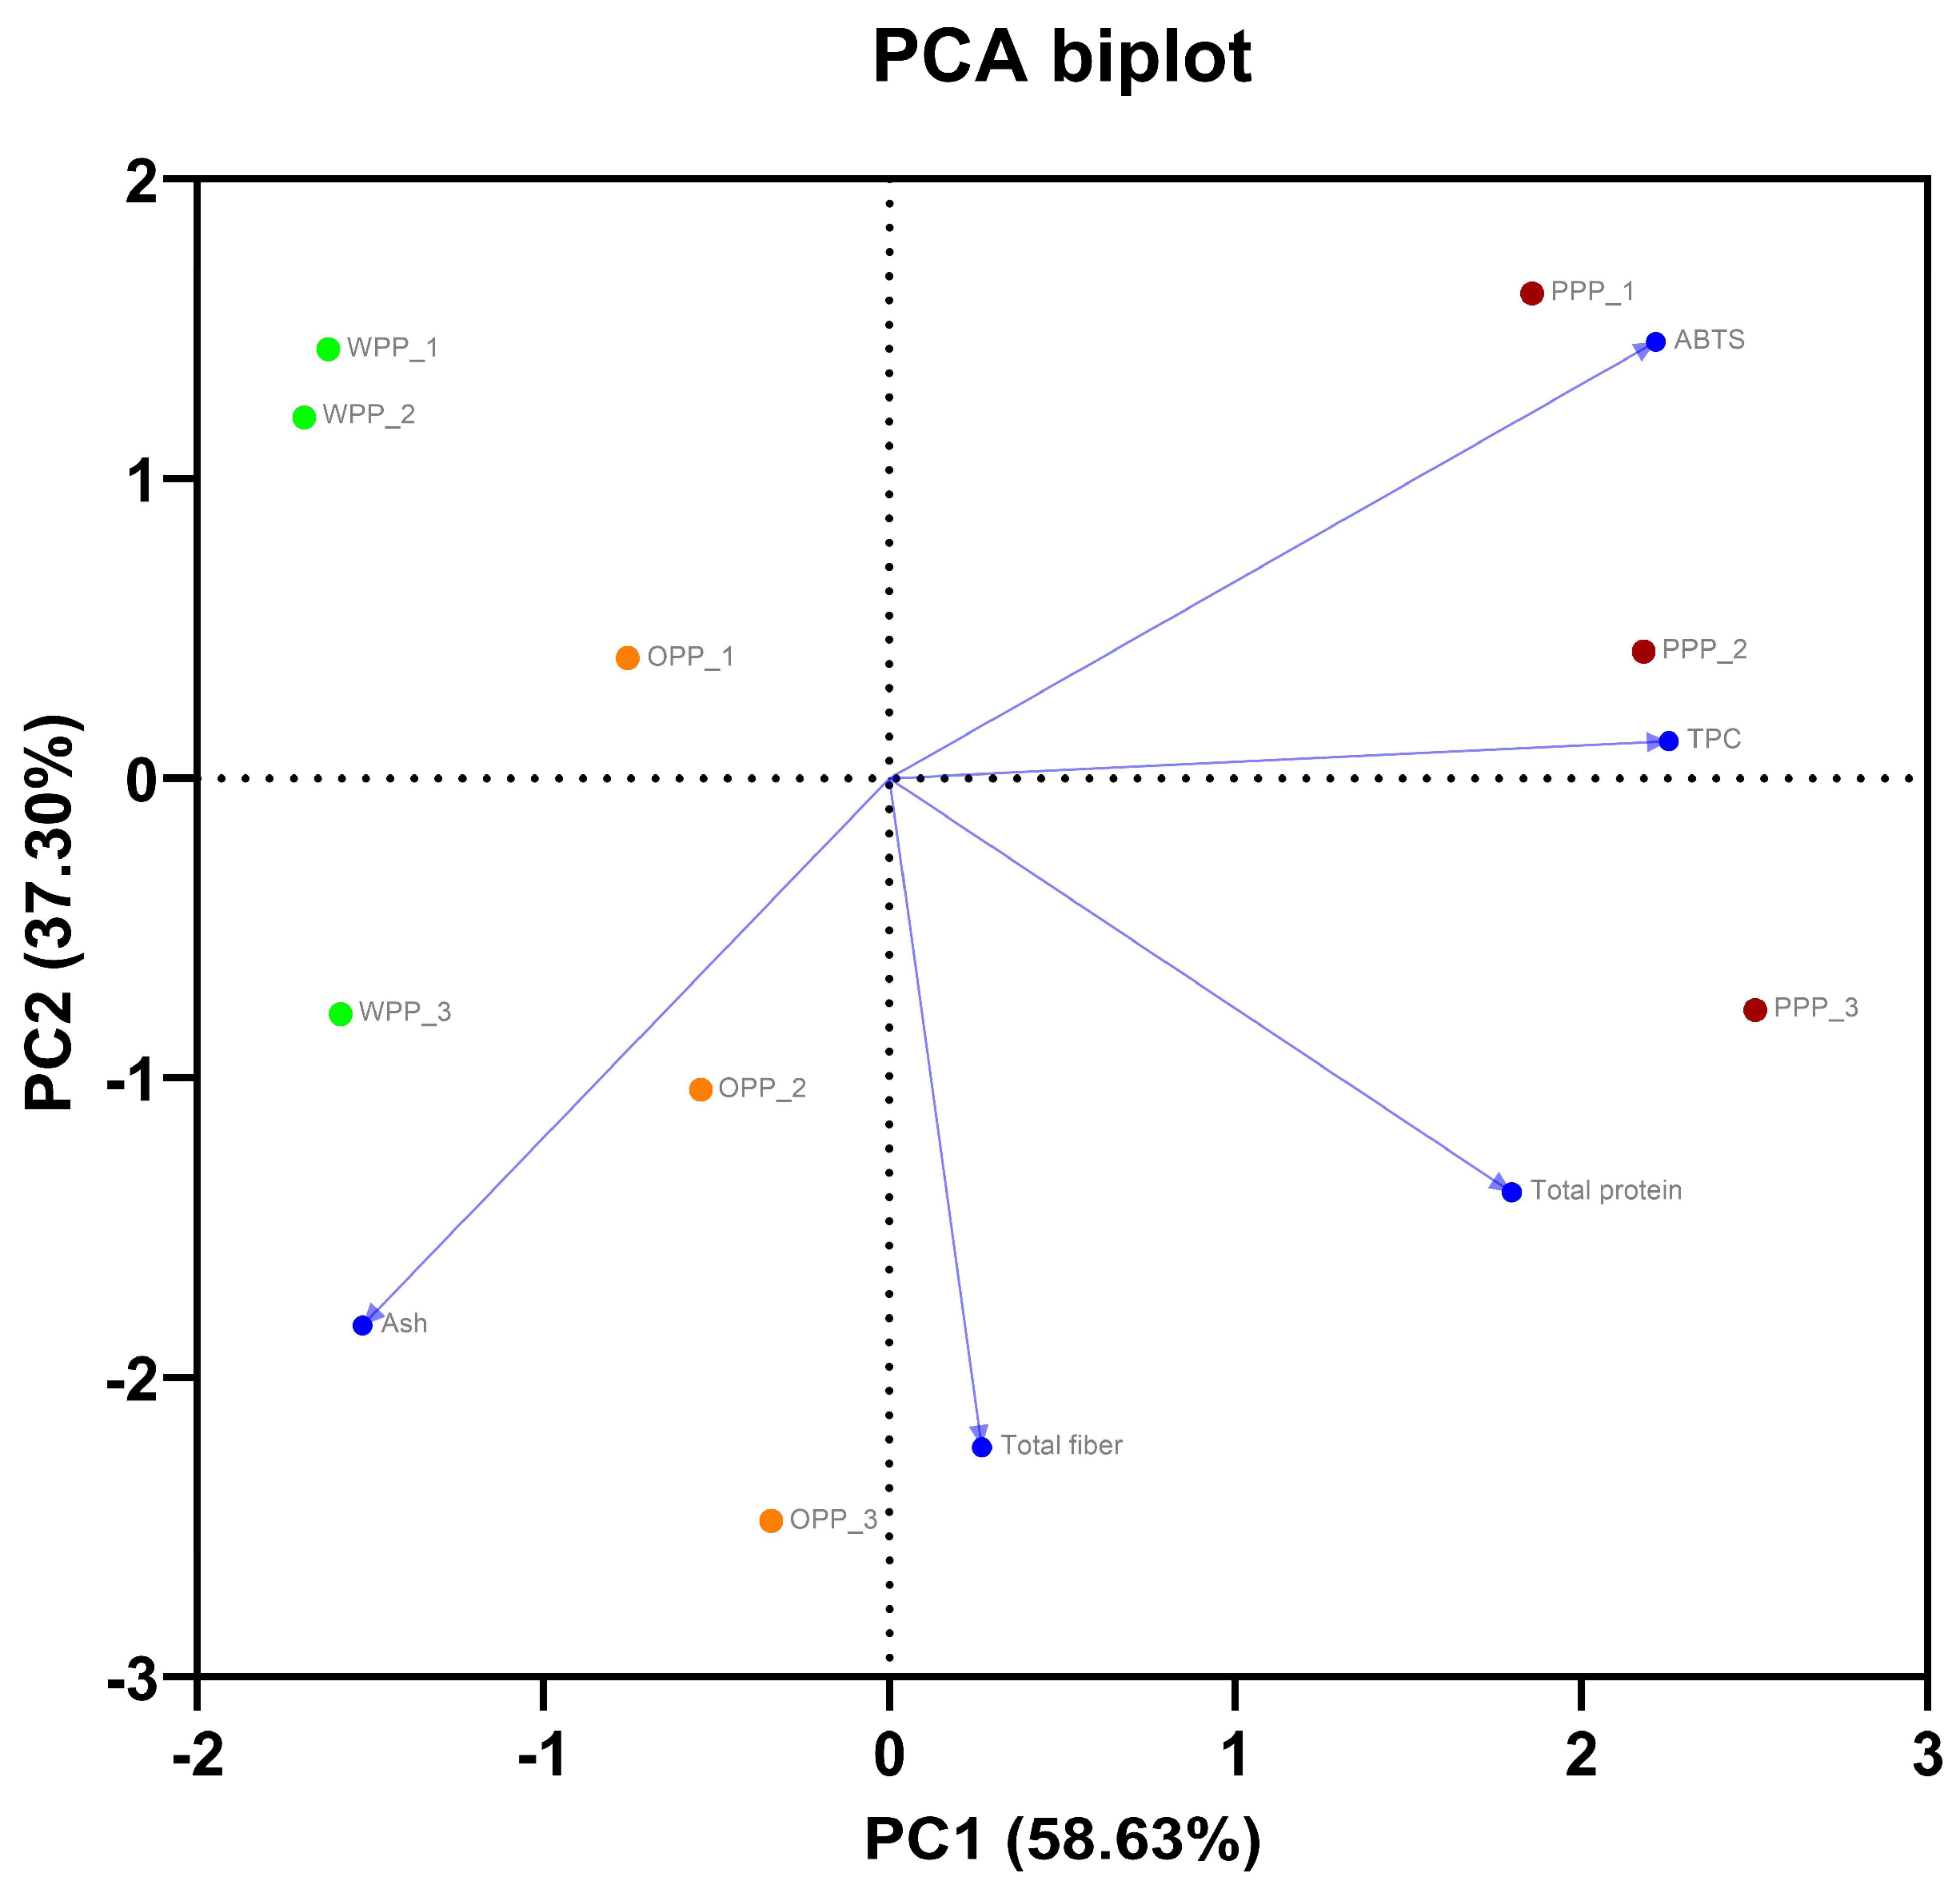
To further explore the relationships among the measured parameters, Principal Component Analysis (PCA) was performed using selected representative variables (TPC, ABTS, total protein, total fiber, and ash) (Figure 2). The first two principal components accounted for 95.93% of the variance represented in the analyzed dataset (PC1 = 58.63% and PC2 = 37.30%). In the PCA biplot, the analytical replicates corresponding to the PPP composite powder were located on the positive side of PC1, in the direction of the TPC, ABTS, and total protein loadings, whereas the analytical replicates corresponding to WPP and OPP were positioned predominantly on the negative side of PC1. The similar orientation of the TPC and ABTS vectors reflects their positive relationship within the analyzed dataset. Overall, the PCA is presented solely as an exploratory visualization of the multivariate compositional patterns of the three composite sweet potato powders. Because the plotted points represent analytical replicates of one composite sample per powder type rather than independent biological replicates, their positioning in the PCA space should not be interpreted as evidence of biological or genotype-level differences.

3.4. Color Parameters

The color parameters of the analyzed potato powders, expressed in the CIE Lab* color space along with chroma (C*) and hue angle (h°), are presented in Table 4. Variation in color attributes was observed among the analyzed composite powders, consistent with their distinct pigmentation profiles.
All color parameters (L*, a*, b*, C*, and h°) showed variation among the analysed composite powders. Lightness (L*) decreased from WPP (55.94) to OPP (45.75) and PPP (23.20), with PPP exhibiting the darkest color profile. Similar trends have been reported by Lachman et al. [55], who observed lower L* values in purple-fleshed potatoes due to high anthocyanin accumulation. Brow [53] also reported that increased phenolic pigmentation in potato tissues leads to a darker visual appearance and reduced reflectance, which is consistent with the present findings. Moreover, Luo et al. (2025) reported significant differences in CIELAB color parameters among sweet potato varieties, with dark-purple-fleshed varieties characterized by lower L values and higher anthocyanin contents [56].
The a* parameter (red–green axis) showed the highest value in the orange sweet potato powder (15.12), followed by the purple (8.77) and white (2.64). The elevated a* value in orange-fleshed potatoes has been previously associated with carotenoid accumulation, particularly lutein and β-carotene, which contribute to reddish-orange tones [57]. In contrast, the moderate a* value in the purple sample is consistent with the presence of anthocyanins, which typically produce red–purple hues depending on their structural composition and pH stability [55].
The b* values (yellow–blue axis) were highest in the orange sweet potato powder (29.97), followed by the white (12.08), and very low in the purple sample (1.27). These results are in agreement with previous studies showing that orange-fleshed potatoes are characterized by high carotenoid content, which strongly contributes to yellow-orange coloration [53,57]. The minimal b* value in the purple potato reflects the masking effect of anthocyanins, which dominate the visual appearance and suppress yellow tonalities.
The chroma (C*), representing color saturation, followed the order OPP (33.57) > WPP (12.37) > PPP (8.87). A similar behavior has been reported by Rodriguez-Amaya (2015) in carotenoid-rich plant tissues, where higher carotenoid concentrations result in more vivid and saturated colors. In contrast, anthocyanin-rich matrices often exhibit lower chroma due to their darker and less bright optical properties, which aligns with the present results for PPP [58].
The hue angle (h°) further differentiated the samples, with values of 77.79° (WPP), 63.22° (OPP), and 8.18° (PPP). According to standard interpretations of the CIE Lab* system, hue angles around 60–90° correspond to yellow–orange tones, while values close to 0° indicate red–purple coloration. The obtained results are therefore in agreement with previous findings on pigmented potatoes, where purple-fleshed genotypes typically exhibit very low hue angles due to anthocyanin dominance [55].
Overall, the color differences are consistent with the known phytochemical composition of the three potato types. White potatoes, lacking significant pigment accumulation, display higher lightness and lower chromatic intensity. Orange potatoes are characterized by carotenoid-driven yellow-orange hues, while purple potatoes exhibit anthocyanin-driven dark red–purple coloration. These findings are in strong agreement with literature reports highlighting the direct relationship between potato pigmentation and bioactive compound composition [53,55,57].
The spectrophotometric determination of total phenolic content was consistent with the quantitative HPLC results presented below. The purple sweet potato powder (PPP), which showed the highest TPC by spectrophotometry (5.79 mg GAE/g dw), also exhibited the highest total level of quantified phenolic compounds by HPLC (8.85 mg/g dw), followed by OPP (2.28 mg GAE/g dw and 3.28 mg/g dw, respectively) and WPP (0.95 mg GAE/g dw and 0.976 mg/g dw, respectively). This consistent pattern across the analyzed composite samples is in agreement with the higher phenolic richness observed for PPP using both analytical approaches.
Importantly, the color parameters correlate well with the HPLC, and antioxidant results, supporting the potential use of visual color attributes as indirect indicators of phytochemical richness in plant-based materials.

3.5. HPLC Profile of Bioactive Compounds

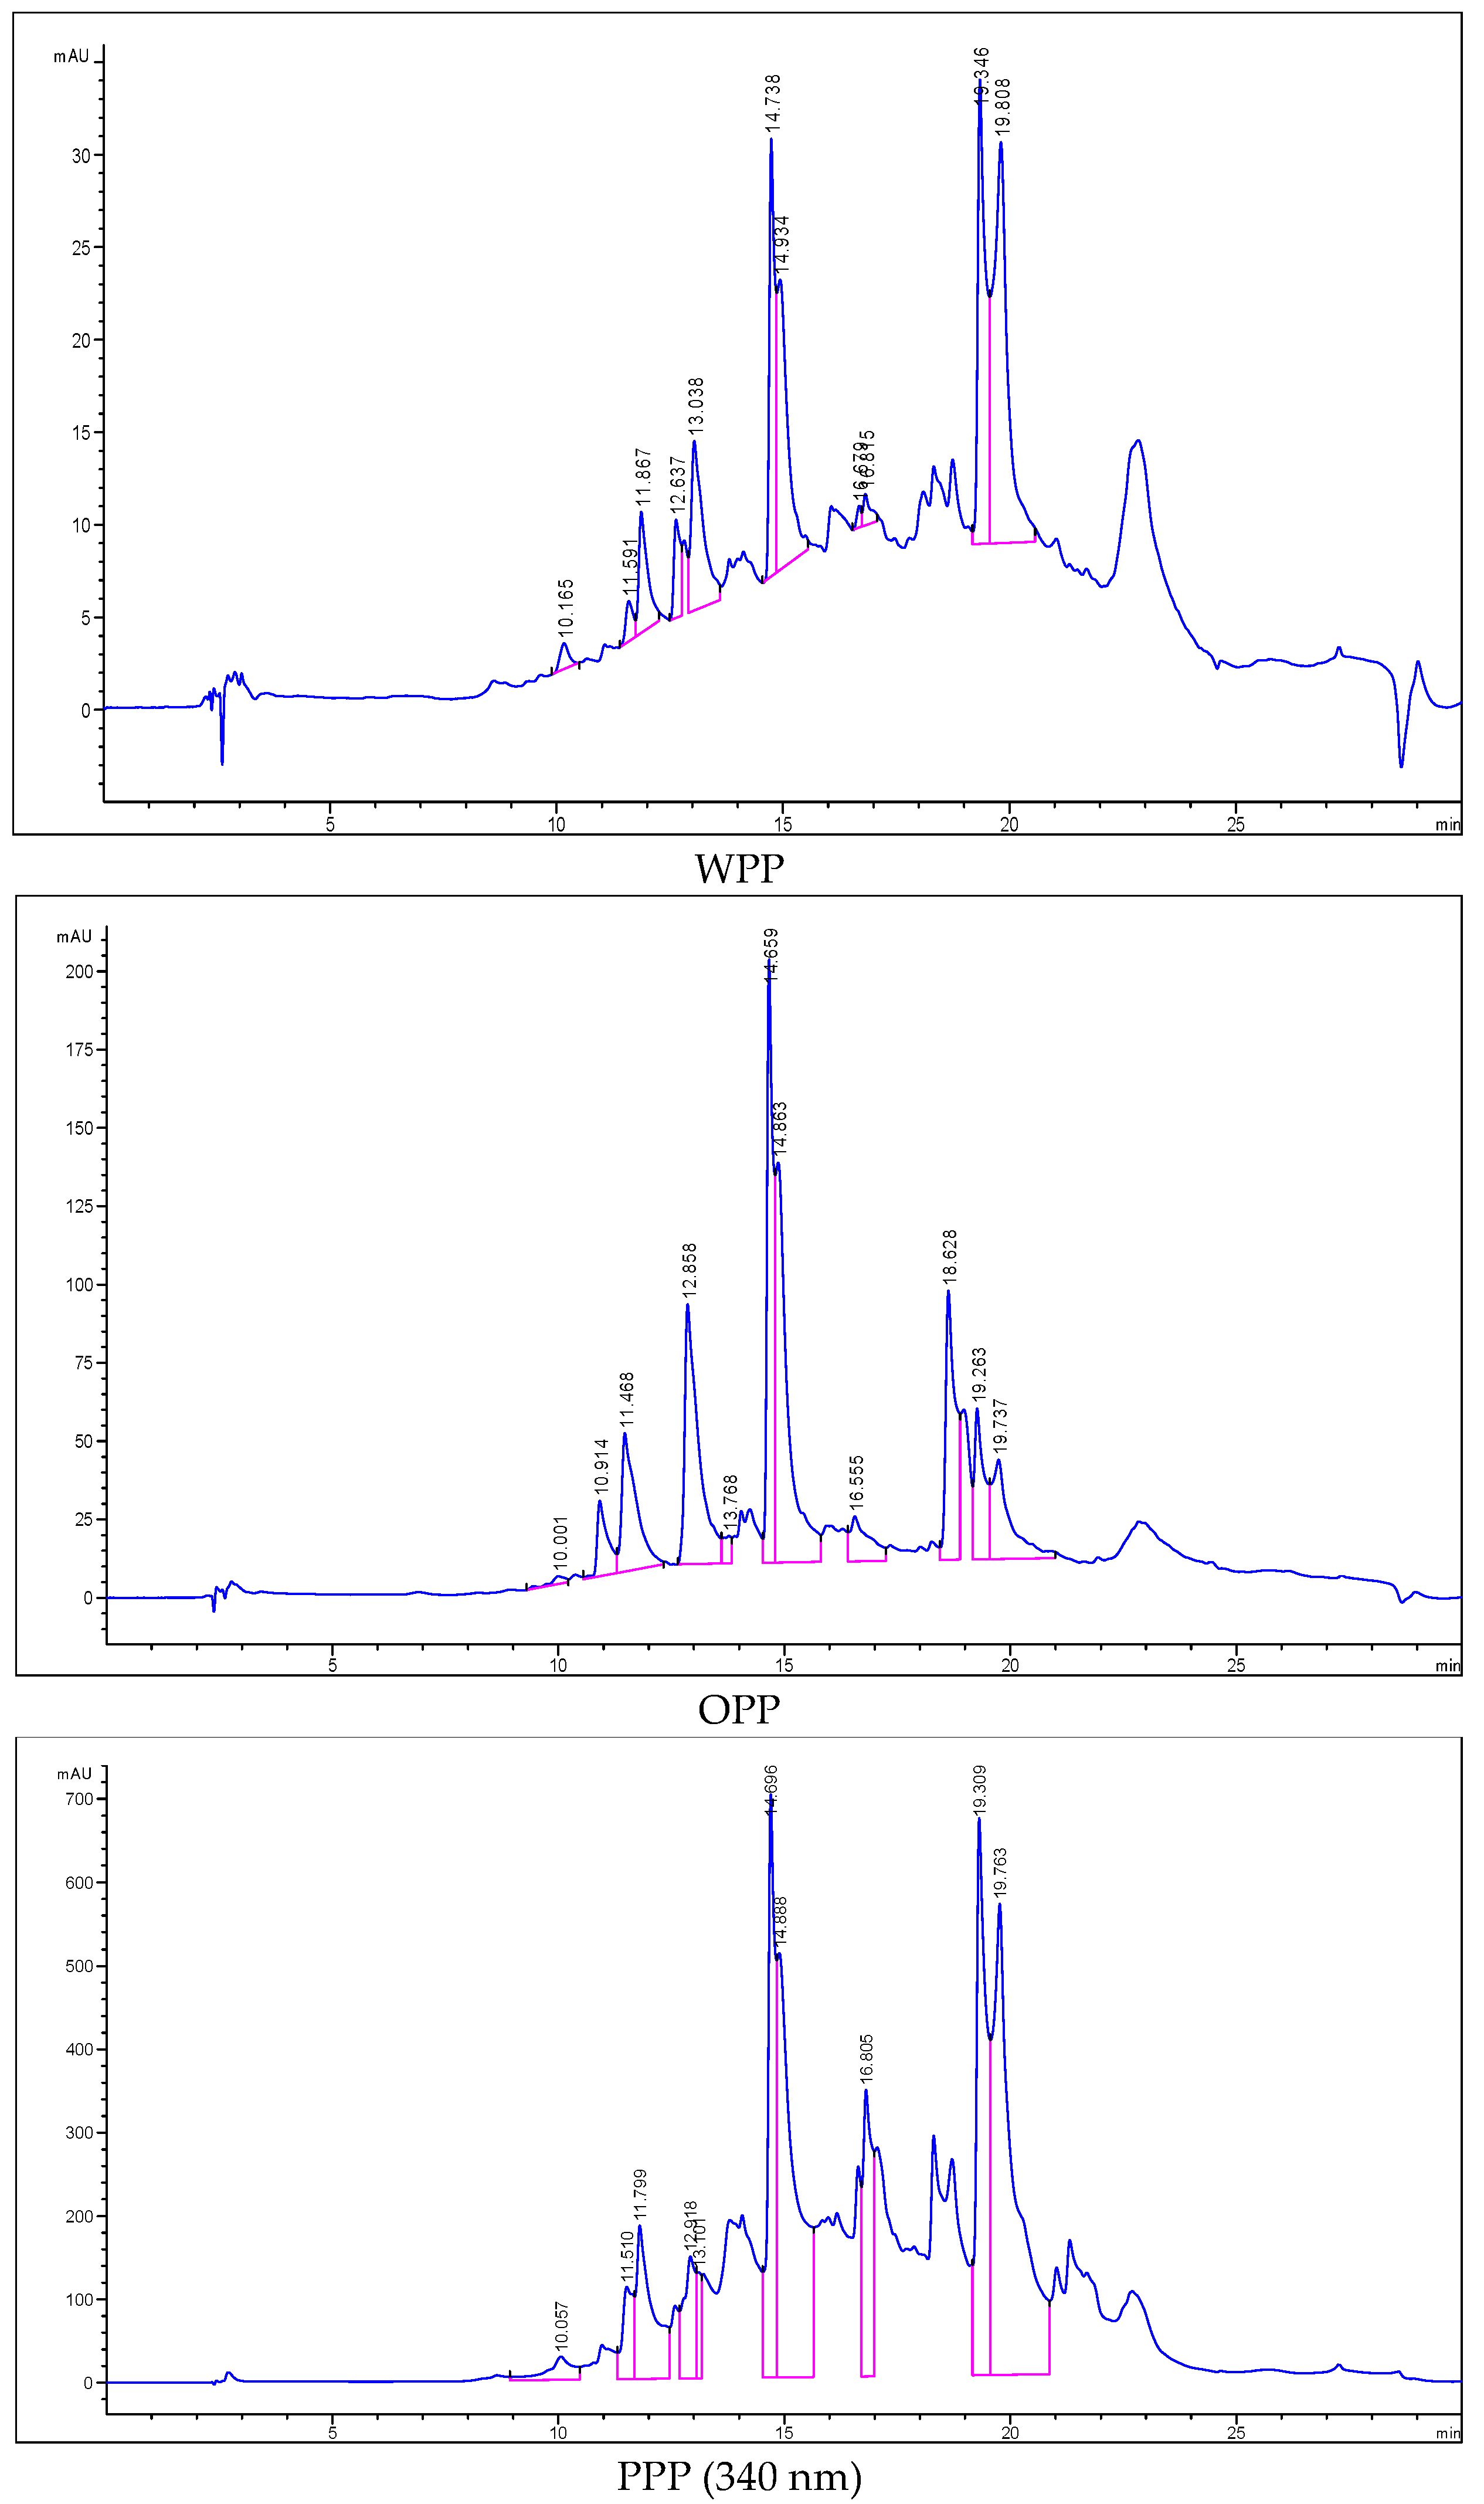
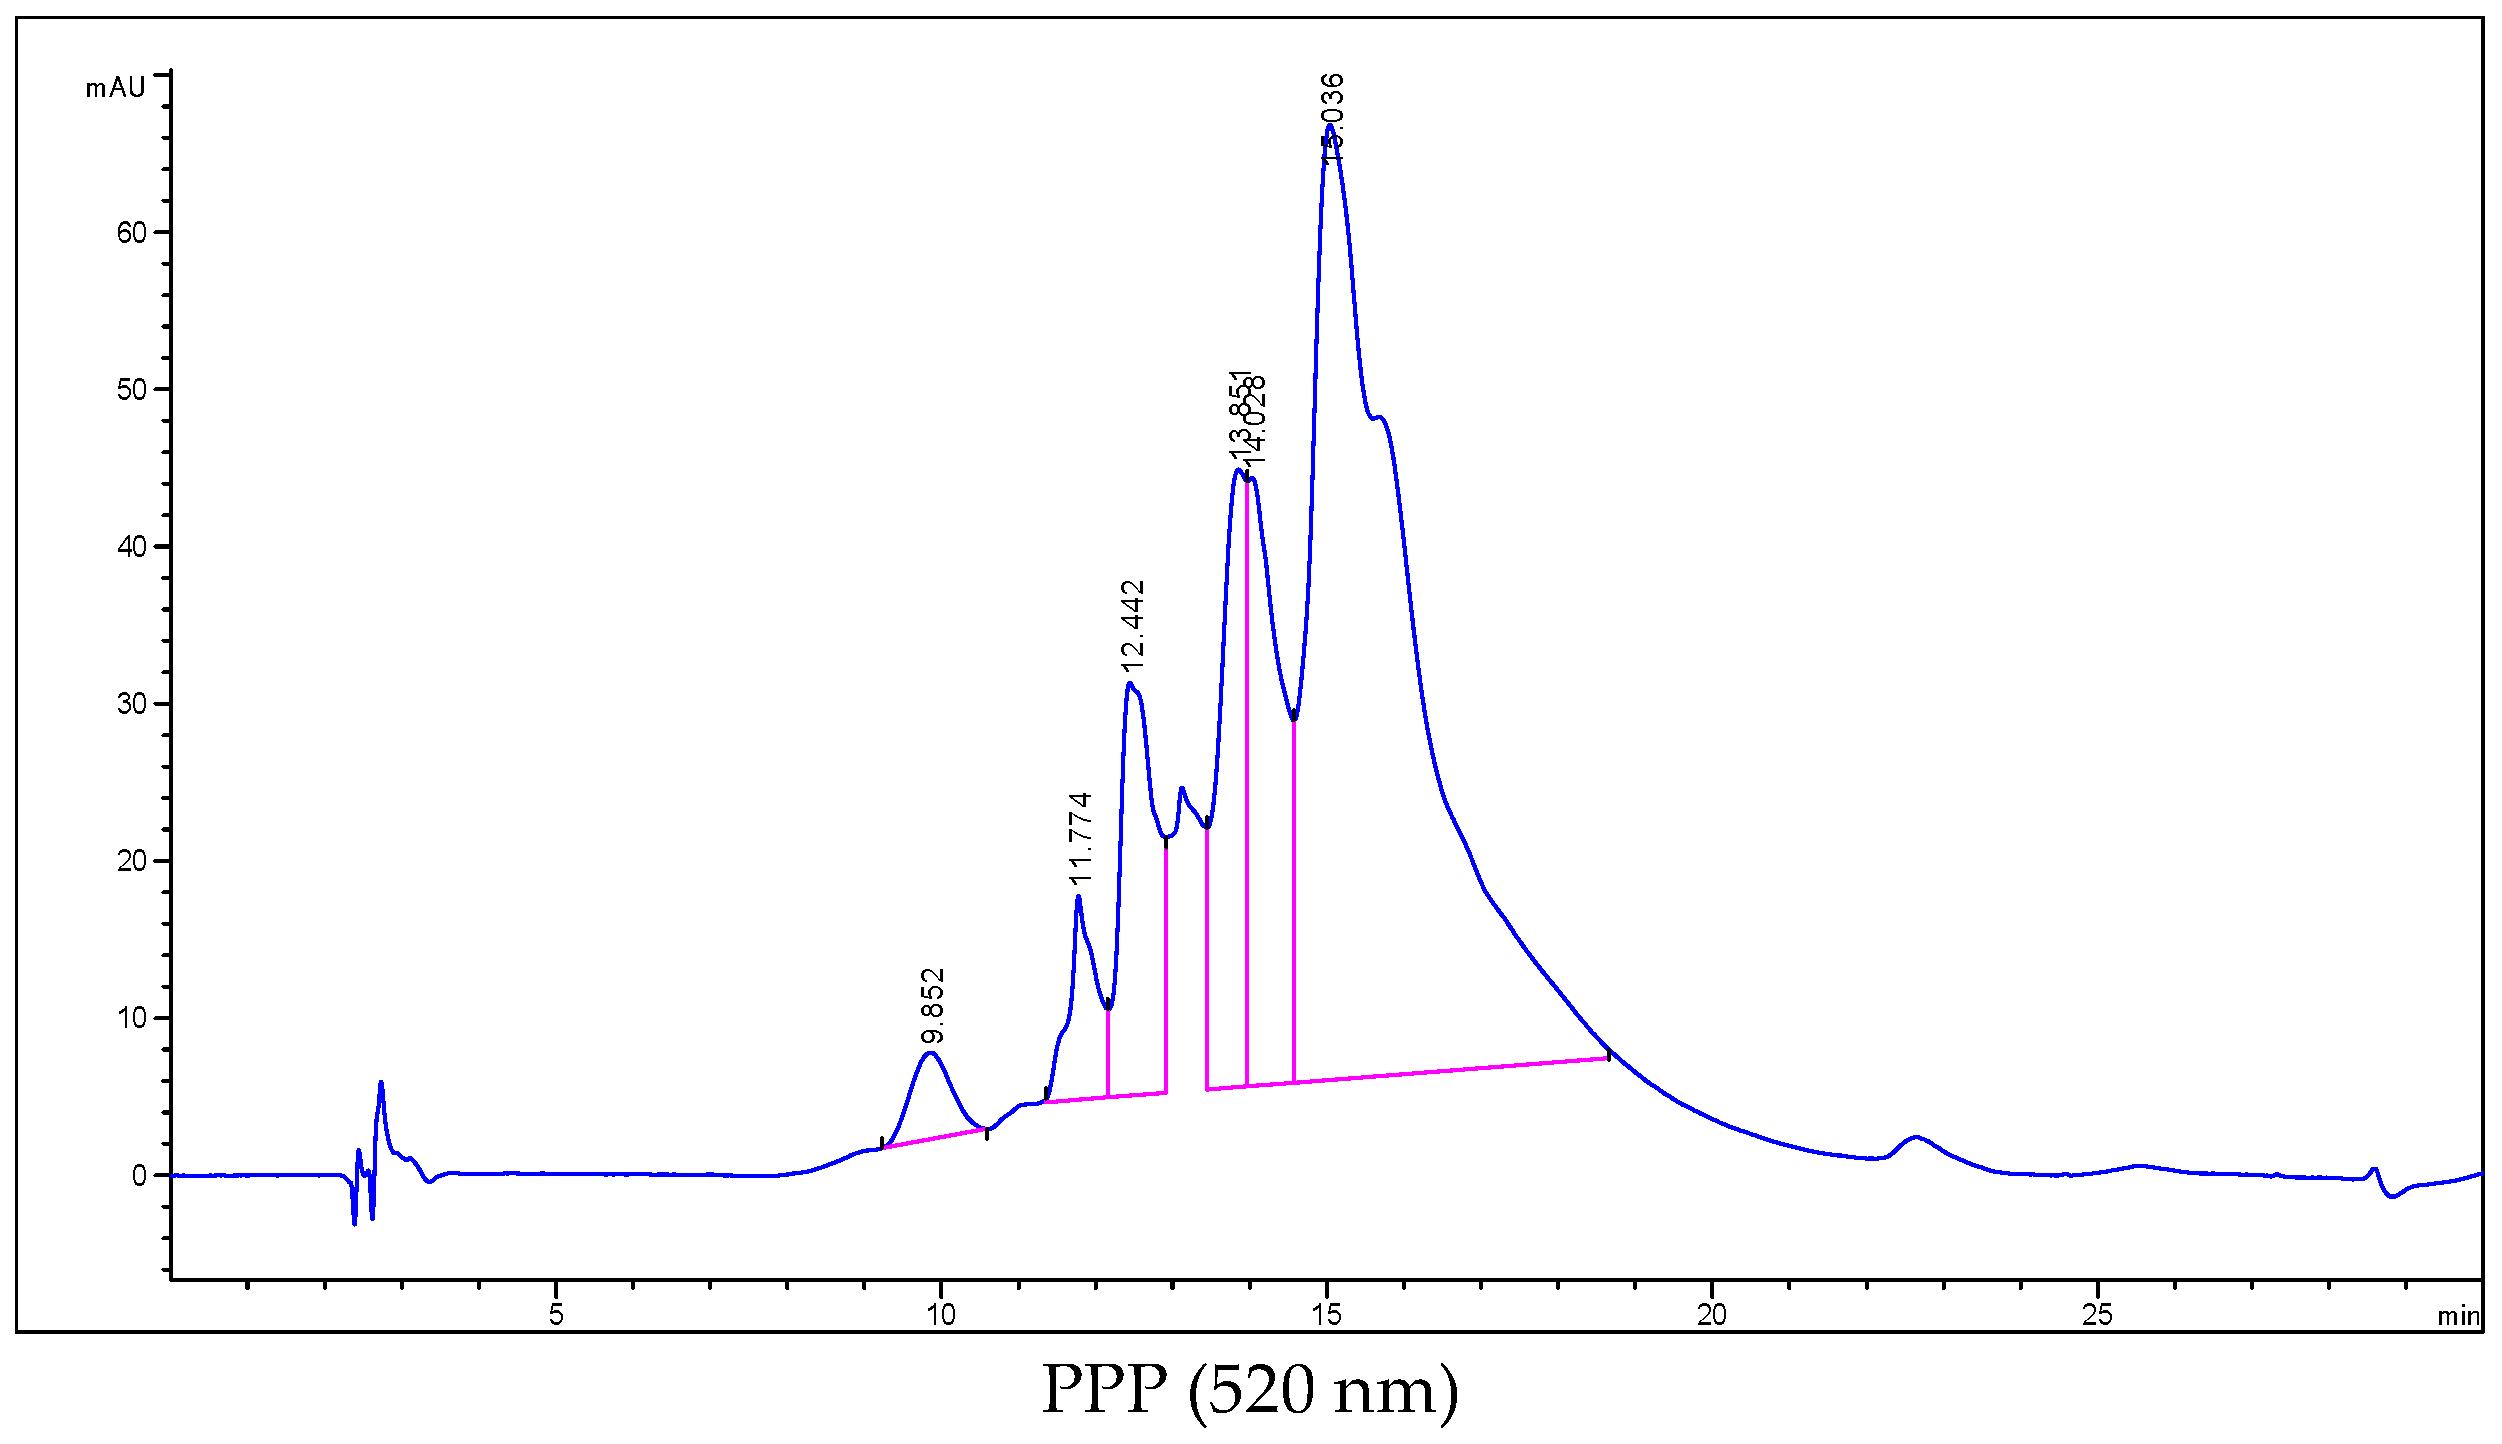
HPLC-DAD-MS analysis provided a detailed characterization of the phenolic profiles of the three sweet potato composite powders, revealing variation in both the concentrations and profiles of the detected phenolic compounds. As shown in Table 5, a total of 19 compounds were tentatively identified, predominantly phenolic acids and anthocyanin derivatives, revealing distinct compositional differences among the white, orange, and purple sweet potato powders. Representative chromatograms illustrating the separation and identification of phenolic compounds are presented in Figure 3. The chromatographic profiles showed well-resolved peaks, supporting the reliability of compound identification.
The total concentration of quantified phenolic compounds increased from WPP (944.70 ± 0.98 μg/g) to OPP (3154.53 ± 0.98 μg/g) and PPP (8501.12 ± 0.98 μg/g), with the purple sweet potato powder exhibiting the highest overall phenolic concentration. This trend is consistent with previous reports indicating that pigmented potato varieties have been reported to exhibit higher levels of secondary metabolites, which are often associated with plant defense responses, including those triggered by environmental stress conditions [59,60]. However, in the present study, no stress-related physiological or biochemical parameters were evaluated; therefore, a direct relationship between environmental stress and metabolite accumulation cannot be established.
From a comparative perspective, the white potato exhibited the simplest phenolic profile, dominated primarily by low concentrations of hydroxybenzoic and hydroxycinnamic acids, such as caffeic acid, ferulic acid, and chlorogenic acid [61]. The lack of activation of the flavonoid and anthocyanin biosynthetic pathways can explain the absence of more complex phenolic derivatives and pigments [62]. In non-pigmented varieties, metabolic flux is generally directed toward primary metabolism rather than the synthesis of secondary compounds, resulting in a reduced phytochemical diversity [63].
In contrast, the orange potato displayed an intermediate profile, both in terms of concentration and complexity. While anthocyanins were absent, this variety showed a notable increase in several phenolic acids, including chlorogenic acid, caffeic acid-glucoside, and feruloylquinic acid derivatives [63]. This may suggest an enhanced activity of the phenylpropanoid pathway compared to the white potato [64]. However, the metabolic pathway does not extend toward anthocyanin synthesis, likely due to the absence or low expression of key enzymes such as dihydroflavonol reductase (DFR) and anthocyanin synthase (ANS), which are essential for pigment formation [65]. Instead, orange-fleshed potatoes are known to accumulate carotenoids, which contribute to their color and partially compensate for antioxidant activity through different biochemical mechanisms [1].
The purple potato exhibited a more complex and concentrated phenolic profile, characterized by both high levels of phenolic acids and the exclusive presence of anthocyanin compounds [63]. Several anthocyanin derivatives were identified, including petunidin-, peonidin-, and pelargonidin-based glycosides, many of them acylated with caffeoyl or feruloyl moieties. These acylated anthocyanins are known to possess enhanced stability and higher antioxidant capacity compared to non-acylated forms [66].
The exclusive presence of these anthocyanin compounds in the purple sweet potato is likely associated with the activation of flavonoid biosynthetic pathways involved in pigment accumulation [67].
In contrast, these pathways appear to be less active in the white and orange varieties, which may explain the absence of anthocyanin derivatives in these samples. Another important observation is the higher concentration of caffeoylquinic acid derivatives, such as 3,5-dicaffeoylquinic acid and 3-caffeoyl-5-feruloylquinic acid, in the purple potato. These compounds are recognized for their strong antioxidant properties and play a key role in the overall antioxidant capacity of the sample. Their elevated levels suggest an intensified phenylpropanoid metabolism, which has been previously associated with plant stress responses in the literature; however, such relationships require targeted physiological and biochemical investigations, which were not included in the present study [68,69].
The comparative analysis showed both quantitative and qualitative variation in the phenolic profiles of the three composite sweet potato powders. While phenolic acids were detected in all samples, PPP exhibited a more diverse profile of detected phenolic compounds, including anthocyanins and several substituted phenolic derivatives. This richer phenolic profile was accompanied by higher values in the antioxidant assays, suggesting a potential contribution of these compounds to the antioxidant capacity observed in PPP.
Furthermore, the quantitative HPLC results were consistent with the spectrophotometric determination of total phenolic content, with both approaches showing the same descriptive pattern among the analyzed composite samples (PPP > OPP > WPP). The higher phenolic content of PPP was supported by its distinctive HPLC profile, characterized by elevated levels of hydroxycinnamic acid derivatives, particularly 3,5-dicaffeoylquinic acid, 3-caffeoyl-5-feruloylquinic acid, and feruloylquinic acid, together with anthocyanins detected exclusively in this. This compositional pattern was also consistent with the higher DPPH, ABTS, and FRAP values recorded for PPP, indicating an association between its phenolic profile and antioxidant capacity.
The observed variation in phenolic content and antioxidant activity among the analyzed composite powders may reflect differences in their phytochemical profiles. Previous studies suggest that genetic factors may contribute to such variation in phenolic composition among sweet potato varieties through differences in secondary metabolic pathways and the regulation of phenolic biosynthesis [68]. The current findings are in line with published data and confirm trends previously described by Vogt et al. [64] who highlighted the importance of the phenylpropanoid pathway in the biosynthesis and accumulation of phenolic compounds in plants. Differences among the analyzed composite samples may be related to variations in the activity of key enzymes, particularly phenylalanine ammonia-lyase (PAL), which regulates phenolic biosynthesis. Consequently, the higher phenolic content detected in pigmented composite sample may be associated with a more active phenylpropanoid metabolism. In this line, abiotic stress conditions, such as high temperature and limited water availability, may further contribute to the enhanced accumulation of phenolic compounds in pigmented composite sample. Environmental stresses are known to induce oxidative stress in plants, triggering the activation of defense mechanisms, including the upregulation of the phenylpropanoid pathway and the synthesis of antioxidant metabolites. Therefore, the elevated phenolic content and antioxidant activity observed in PPP composite sample may reflect both genetic factors and adaptive metabolic responses to environmental conditions, resulting in an increased capacity to scavenge reactive oxygen species and protect cellular structures from oxidative damage [60]. On the other hand, it is important to highlight that the phenolic content and antioxidant properties observed in the analyzed powders may also be considered in relation to the processing conditions. Freeze-drying has been reported to provide good retention of bioactive compounds in pigmented potatoes, with total phenolic content and antioxidant activity being largely preserved (Kaspar et al., 2012) [70].
The predominance of phenolic acids identified in the analyzed samples is consistent with previous studies reporting chlorogenic acid and its derivatives as major phenolic compounds in sweet potato. These compounds are known to contribute substantially to antioxidant activity, supporting the relationship observed between the HPLC profile and the spectrophotometric results [71].
In agreement with previous reports, the present results showed that flesh color was associated with distinct phytochemical profiles among the analyzed sweet potato powders, with PPP exhibiting the highest levels of several quantified bioactive compounds. The comprehensive characterization provided an integrated overview of the compositional, phytochemical, and antioxidant profiles of sweet potato powders obtained from the three selected plant materials. These findings provide a compositional basis for further investigation of pigmented sweet potato powders as potential ingredients in food applications. Overall, the results highlight sweet potato powders as a source of measurable bioactive compounds and support their further characterization for the development of value-added food ingredients.

3.6. FFTIR Spectral Analysis

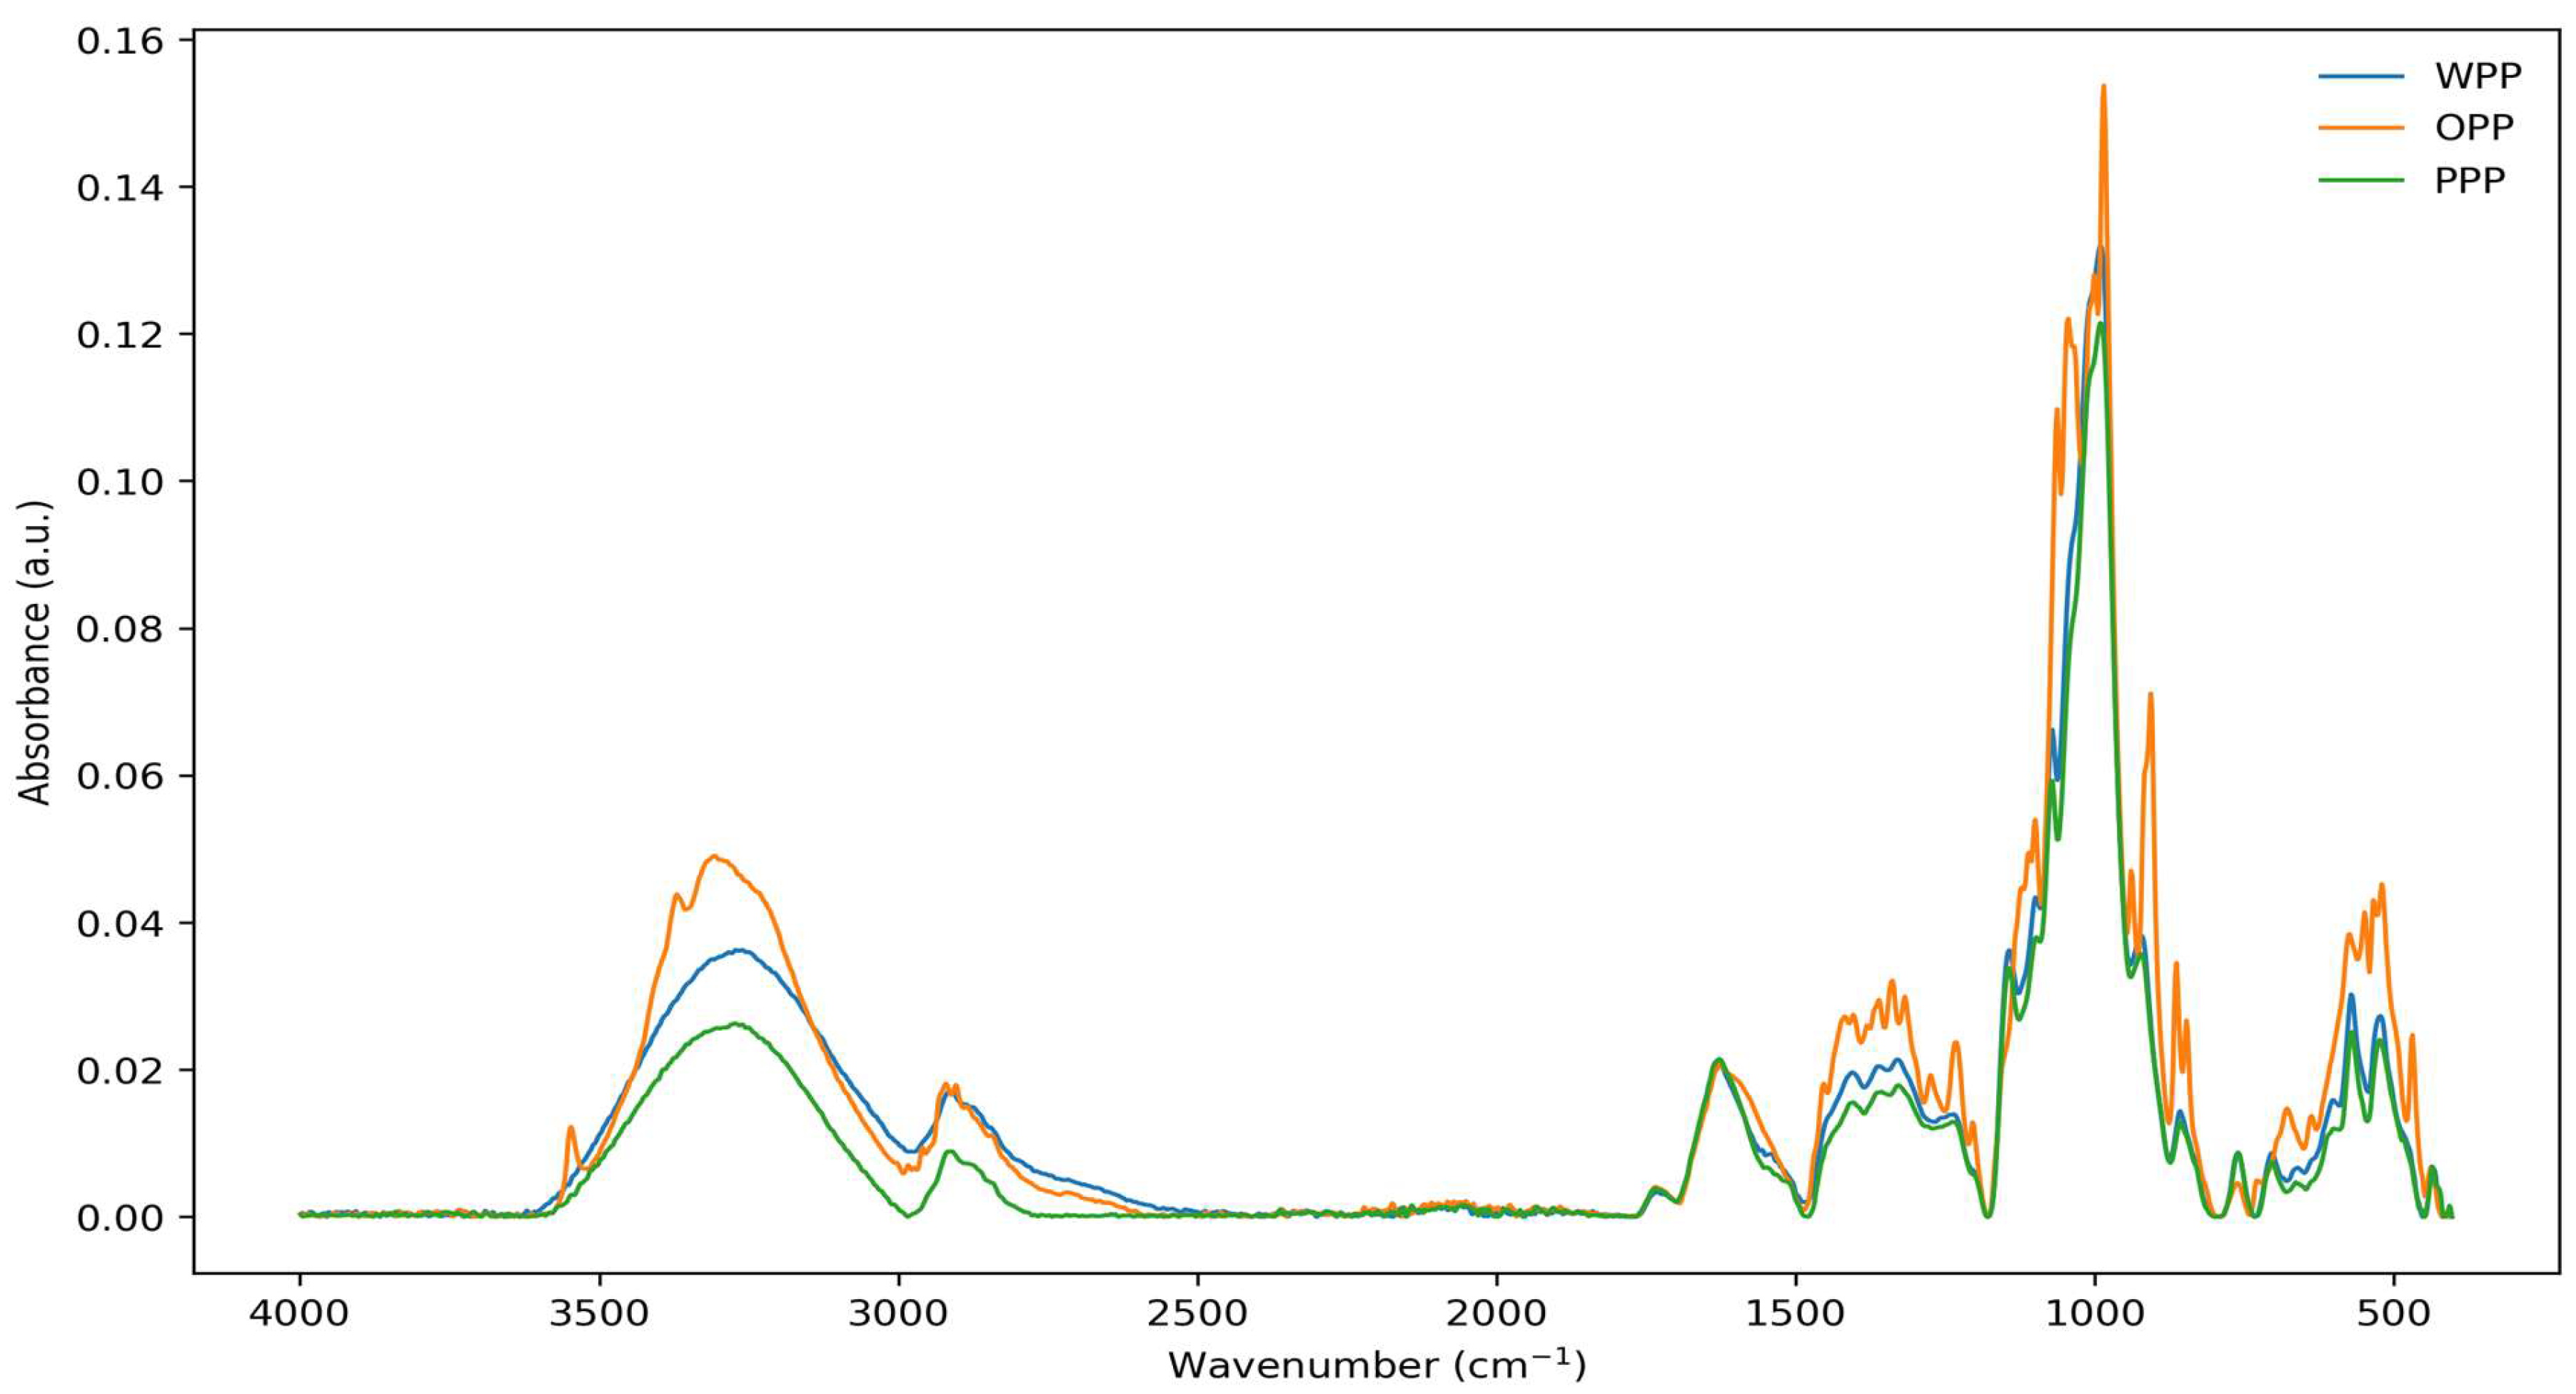
The FTIR spectra of the analyzed potato powders (WPP, OPP, and PPP) exhibited similar overall profiles, indicating a comparable basic chemical composition, with differences mainly reflected in peak intensities. The FTIR spectra of the analyzed potato powders (WPP, OPP, and PPP) are presented in Figure 4.
A broad absorption band in the region of 3200–3400 cm−1 was observed in all samples, corresponding to O–H stretching vibrations associated with hydroxyl groups from carbohydrates and residual moisture. Infrared spectroscopy is widely recognized as a rapid and non-destructive technique for assessing the chemical composition of food matrices, particularly for carbohydrates and water-related functional groups [72,73].
The bands identified at 2920–2850 cm−1 are attributed to C–H stretching vibrations of aliphatic chains, indicating the presence of lipids, which is consistent with the low fat content obtained from proximate analysis. Similar assignments have been reported in food systems, where FTIR is used to characterize lipid-related functional groups [74].
Characteristic absorption peaks were detected in the regions of 1600–1650 cm−1 and 1500–1550 cm−1, corresponding to Amide I and Amide II bands, associated with protein structures. These spectral features confirm the presence of proteins and are in agreement with the values obtained through Kjeldahl analysis [75].
The most intense bands were observed in the region of 1000–1200 cm−1, corresponding to C–O, C–C, and C–O–C stretching vibrations characteristic of polysaccharides, particularly starch, which represents the main component of potato-based matrices [76].
Differences among the samples were primarily reflected in the relative intensity of the absorption bands. The purple potato powder (PPP) exhibited more pronounced bands in the spectral regions associated with protein and polysaccharide related functional groups. These spectral features were consistent with the compositional differences observed among the analyzed samples, particularly the higher levels of phenolic compounds and antioxidant activity, as determined by complementary spectrophotometric and HPLC analyses. The white potato powder (WPP) generally exhibited lower band intensities, whereas the orange potato powder (OPP) showed intermediate spectral characteristics.
Overall, FTIR analysis provided complementary qualitative information on the chemical characteristics of the analyzed composite samples and supported the differences observed through the other compositional analyses, demonstrating its utility as a rapid and non-destructive screening technique for the characterization of food matrices.

4. Conclusions

The results showed variation in the nutritional, phytochemical, mineral, antioxidant, and color profiles of the analyzed freeze-dried sweet potato composite powders. Among the investigated samples, PPP showed the highest phenolic and flavonoid contents and antioxidant assay values, together with higher concentrations of Ca, Mg, and P. Its HPLC-DAD-MS profile was tentatively characterized by higher concentrations of several hydroxycinnamic acid derivatives and the presence of anthocyanins, consistent with its richer phenolic profile and characteristic purple coloration. OPP exhibited intermediate values for several of the investigated parameters, whereas WPP generally showed lower levels of bioactive compounds and antioxidant capacity. Exploratory PCA and FTIR analyses provided complementary descriptive information on the compositional profiles of the three composite powders.
The measurable levels of bioactive compounds in these powders provide a basis for further investigation of their potential application as food ingredients. Further studies incorporating independent biological replication and appropriate processing controls are required to assess the reproducibility of the compositional patterns identified in the analyzed composite powders.

Author Contributions

Conceptualization, N.C.C.; M.S.C.; A.I.A.; R.S. and A.C.F.; methodology, N.C.C.; M.S.C.; A.P.; G.M.C.; G.C. and E.G.; software, N.C.C.; A.P. and A.I.T.; validation, G.M.C.; M.S.C.; N.C.C.; A.C.F.; G.C.; O.C.; E.G. and R.S.; formal analysis, N.C.C.; M.S.C.; A.C.F.; G.M.C.; G.C.; A.I.T.; O.C. and E.G.; investigation, N.C.C.; M.S.C.; A.I.A.; R.S.; A.I.T. and O.C.; resources, N.C.C.; A.I.T.; A.I.A.; M.S.C.; A.P., G.C. and E.G.; data curation, N.C.C.; A.P.; A.I.T.; A.I.A.; R.S. and O.C.; writing—original draft preparation, N.C.C.; M.S.C.; A.P.; A.C.F. and A.I.T.; writing—review and editing, N.C.C.; M.S.C.; A.P. and A.I.T.; visualization, A.P.; A.I.T.; O.C.; A.C.F.; G.C. and R.S.; supervision, M.S.C.; A.P.; A.I.A. and R.S.; project administration, M.S.C.; R.S. and A.I.A.; funding acquisition, M.S.C.; All authors have read and agreed to the published version of the manuscript.

Funding

This research received no external funding.

Institutional Review Board Statement

Not applicable.

Informed Consent Statement

Not applicable.

Data Availability Statement

The raw data supporting the conclusions of this article will be made available by the authors on request.

Acknowledgments

Anamaria Iulia Török and Oana Cadar acknowledge the Core Program within the National Research Development and Innovation Plan 2022–2027, with the support of MCID, project PN No. 23 05. The APC was provided by MDPI (Multidisciplinary Digital Publishing Institute).

Conflicts of Interest

The authors declare no conflicts of interest.

References

  1. Alam, M. A comprehensive review of sweet potato (Ipomoea batatas [L.] Lam): Revisiting the associated health benefits. Trends Food Sci. Technol. 2021, 115, 512–529. [Google Scholar] [CrossRef] [Scilit]
  2. Sampaio, S.L.; Petropoulos, S.A.; Alexopoulos, A.; Heleno, S.A.; Santos-Buelga, C.; Barros, L.; Ferreira, I.C.F.R. Potato peels as sources of functional compounds for the food industry: A review. Trends Food Sci. Technol. 2020, 103, 118–129. [Google Scholar] [CrossRef] [Scilit]
  3. Mohammed, M. Post-Harvest Handling and Quality Management of Sweet Potato (Ipomoea batatas); FAO: Rome, Italy, 2022. [Google Scholar]
  4. Bhatta, S.; Stevanovic Janezic, T.; Ratti, C. Freeze-Drying of Plant-Based Foods. Foods 2020, 9, 87. [Google Scholar] [CrossRef] [Scilit]
  5. Dereje, B.; Girma, A.; Mamo, D.; Chalchisa, T. Functional properties of sweet potato flour and its role in product development: A review. Int. J. Food Prop. 2020, 23, 1639–1662. [Google Scholar] [CrossRef] [Scilit]
  6. Laveriano-Santos, E.P.; López-Yerena, A.; Jaime-Rodríguez, C.; González-Coria, J.; Lamuela-Raventós, R.M.; Vallverdú-Queralt, A.; Romanyà, J.; Pérez, M. Sweet Potato Is Not Simply an Abundant Food Crop: A Comprehensive Review of Its Phytochemical Constituents, Biological Activities, and the Effects of Processing. Antioxidants 2022, 11, 1648. [Google Scholar] [CrossRef] [Scilit]
  7. Ntsowe, K.; Workneh, T.S.; Laurie, S.; Emmambux, N. Different Drying Techniques and Their Impact on Physicochemical Properties of Sweet Potato: A Review. J. Food Sci. 2025, 90, e70458. [Google Scholar] [CrossRef] [Scilit]
  8. Karam, M.C.; Petit, J.; Zimmer, D.; Baudelaire Djantou, E.; Scher, J. Effects of drying and grinding in production of fruit and vegetable powders: A review. J. Food Eng. 2016, 188, 32–49. [Google Scholar] [CrossRef] [Scilit]
  9. Harguindeguy, M.; Fissore, D. On the effects of freeze-drying processes on the nutritional properties of foodstuff: A review. Dry. Technol. 2019, 38, 846–868. [Google Scholar] [CrossRef] [Scilit]
  10. Dziki, D. Recent Trends in Pretreatment of Food before Freeze-Drying. Processes 2020, 8, 1661. [Google Scholar] [CrossRef] [Scilit]
  11. Oyinloye, T.M.; Yoon, W.B. Effect of Freeze-Drying on Quality and Grinding Process of Food Produce: A Review. Processes 2020, 8, 354. [Google Scholar] [CrossRef] [Scilit]
  12. Sagar, V.R.; Suresh Kumar, P. Recent advances in drying and dehydration of fruits and vegetables: A review. J. Food Sci. Technol. 2010, 47, 15–26. [Google Scholar] [CrossRef] [Scilit]
  13. Rashmi, H.B.; Negi, P.S. Phenolic acids from vegetables: A review on processing stability and health benefits. Food Res. Int. 2020, 136, 109298. [Google Scholar] [CrossRef] [Scilit]
  14. Prior, R.L.; Wu, X.; Schaich, K. Standardized methods for the determination of antioxidant capacity and phenolics in foods and dietary supplements. J. Agric. Food Chem. 2005, 53, 4290–4302. [Google Scholar] [CrossRef] [Scilit]
  15. Ciurzyńska, A.; Lenart, A. Freeze-Drying—Application in Food Processing and Biotechnology—A Review. Pol. J. Food Nutr. Sci. 2011, 61, 165–171. [Google Scholar] [CrossRef] [Scilit]
  16. de Albuquerque, T.M.R.; Sampaio, K.B.; de Souza, E.L. Sweet potato roots: Unrevealing an old food as a source of health promoting bioactive compounds—A review. Trends Food Sci. Technol. 2019, 85, 277–286. [Google Scholar] [CrossRef] [Scilit]
  17. Kuan, L.-Y.; Thoo, Y.-Y.; Siow, L.-F. Bioactive components, ABTS radical scavenging capacity and physical stability of orange, yellow and purple sweet potato (Ipomoea batatas) powder processed by convection-or vacuum-drying methods. Int. J. Food Sci. Technol. 2016, 51, 700–709. [Google Scholar] [CrossRef] [Scilit]
  18. Zhang, L.; Gao, Y.; Deng, B.; Ru, W.; Tong, C.; Bao, J. Physicochemical, Nutritional, and Antioxidant Properties in Seven Sweet Potato Flours. Front Nutr. 2022, 9, 923257. [Google Scholar] [CrossRef] [Scilit]
  19. Guclu, G.; Dagli, M.M.; Ozge, A.; Keskin, M.; Kelebek, H.; Selli, S. Comparative elucidation on the phenolic fingerprint, sugars and antioxidant activity of white, orange and purple-fleshed sweet potatoes (Ipomoea batatas L.) as affected by different cooking methods. Heliyon 2023, 9, e18684. [Google Scholar] [CrossRef] [Scilit]
  20. American Association of Cereal Chemists. Approved Methods of the American Association of Cereal Chemists; American Association of Cereal Chemists: St. Paul, MN, USA, 1928. [Google Scholar]
  21. Man, S.M.; Stan, L.; Păucean, A.; Chiş, M.S.; Mureşan, V.; Socaci, S.A.; Pop, A.; Muste, S. Nutritional, Sensory, Texture Properties and Volatile Compounds Profile of Biscuits with Roasted Flaxseed Flour Partially Substituting for Wheat Flour. Appl. Sci. 2021, 11, 4791. [Google Scholar] [CrossRef] [Scilit]
  22. Zou, M.L.; Moughan, P.J.; Awati, A.; Livesey, G. Accuracy of the Atwater factors and related food energy conversion factors with low-fat, high-fiber diets when energy intake is reduced spontaneously. Am. J. Clin. Nutr. 2007, 86, 1649–1656. [Google Scholar] [CrossRef]
  23. Ciont, C.; Difonzo, G.; Pasqualone, A.; Chis, M.S.; Ranga, F.; Szabo, K.; Simon, E.; Naghiu, A.; Barbu-Tudoran, L.; Caponio, F.; et al. Phenolic profile of micro- and nano-encapsulated olive leaf extract in biscuits during in vitro gastrointestinal digestion. Food Chem. 2023, 428, 136778. [Google Scholar] [CrossRef] [Scilit]
  24. Kent, M. The Oxford Dictionary of Sports Science & Medicine; Oxford University Press: Oxford, UK, 2006. [Google Scholar]
  25. Igual, M.; Chis, M.S.; Paucean, A.; Vodnar, D.C.; Ranga, F.; Mihaiescu, T.; Torok, A.I.; Farcas, A.; Martinez-Monzo, J.; Garcia-Segovia, P. Effect on Nutritional and Functional Characteristics by Encapsulating Rose canina Powder in Enriched Corn Extrudates. Foods 2021, 10, 2401. [Google Scholar] [CrossRef] [Scilit]
  26. Mihaiescu, T.; Gyozo, G.; Mihaiescu, R.; Ioan Gheorghe, O. 7th International Multidisciplinary Scientific Geoconference SGEM 2017 Conference Proceedings Volume 17 Water Resources. Forest, Marine and Ocean Ecosystems; STEF92 Technology Ltd.: Sofia, Bulgaria, 2019. [Google Scholar]
  27. Han, L.; Li, R.; Jin, X.; Li, Y.; Chen, Q.; He, C.; Wang, M. Metabolomic analysis, extraction, purification and stability of the anthocyanins from colored potatoes. Food Chem. X 2024, 22, 101423. [Google Scholar] [CrossRef] [Scilit]
  28. Jimenez-Moreno, N.; Volpe, F.; Moler, J.A.; Esparza, I.; Ancin-Azpilicueta, C. Impact of Extraction Conditions on the Phenolic Composition and Antioxidant Capacity of Grape Stem Extracts. Antioxidants 2019, 8, 597. [Google Scholar] [CrossRef] [Scilit]
  29. Singleton, V.L.; Orthofer, R.; Lamuela-Raventós, R.M. [14] Analysis of total phenols and other oxidation substrates and antioxidants by means of folin-ciocalteu reagent. In Methods in Enzymology; Elsevier: Amsterdam, The Netherlands, 1999; Volume 299, pp. 152–178. [Google Scholar]
  30. Chandra, S.; Khan, S.; Avula, B.; Lata, H.; Yang, M.H.; Elsohly, M.A.; Khan, I.A. Assessment of total phenolic and flavonoid content, antioxidant properties, and yield of aeroponically and conventionally grown leafy vegetables and fruit crops: A comparative study. Evid. Based Complement. Altern. Med. 2014, 2014, 253875. [Google Scholar] [CrossRef] [Scilit]
  31. Brand-Williams, W.; Cuvelier, M.E.; Berset, C. Use of a free radical method to evaluate antioxidant activity. LWT-Food Sci. Technol. 1995, 28, 25–30. [Google Scholar] [CrossRef] [Scilit]
  32. Hulujan, I.-F.; Vodnar, D.C.; Ranga, F.; Borsai, O.; Mitre, V.; Toader, C.; Bordean, M.-E.; Costin, A.-D.; Cordea, M.I. Phenolic Compounds, Carbohydrates, Vitamin C, and Antioxidant Activity in Different Sweet Cherry (Prunus avium L.) Varieties. Bull. Univ. Agric. Sci. Vet. Med. Cluj-Napoca Food Sci. Technol. 2025, 82, 135–148. [Google Scholar] [CrossRef] [Scilit]
  33. Sall, I.M.; Vodnar, D.C.; Martau, G.A.; Aziez, M.; Hasas, A.D.; Hodor, D.; Tabaran, A.F. Ethanolic Extract of Kinkeliba (Combretum micranthum), Rich in Phenolic Compounds Mitigates DSS-Induced Ulcerative Colitis in C57BL/6 Mice via Antioxidation and Microbiota Regulation. Int. J. Mol. Sci. 2025, 26, 11299. [Google Scholar] [CrossRef] [Scilit]
  34. López, A.; Piqué, M.; Boatella, J.; Parcerisa, J.P.i.; Romero, A.V.; Ferrá, A.; Garcí, J. Influence of Drying Conditions on the Hazelnut Quality. III. Browning. Dry. Technol. 1997, 15, 989–1002. [Google Scholar] [CrossRef] [Scilit]
  35. Călinoiu, L.F.; Vodnar, D.C. Thermal Processing for the Release of Phenolic Compounds from Wheat and Oat Bran. Biomolecules 2020, 10, 21. [Google Scholar] [CrossRef] [Scilit]
  36. Nemes, S.A.; Mitrea, L.; Teleky, B.E.; Dulf, E.H.; Calinoiu, L.F.; Ranga, F.; Elekes, D.G.; Diaconeasa, Z.; Dulf, F.V.; Vodnar, D.C. Integration of ultrasound and microwave pretreatments with solid-state fermentation enhances the release of sugars, organic acids, and phenolic compounds in wheat bran. Food Chem. 2025, 463, 141237. [Google Scholar] [CrossRef] [Scilit]
  37. Kılıç, E.E.; Kesen, S. Determination of Quality Properties of Dried Purple Potatoes. Çukurova Tarım VE Gıda Bilim. Derg. 2025, 40, 172–180. [Google Scholar] [CrossRef] [Scilit]
  38. Kręcisz, M.; Kolniak-Ostek, J.; Stępień, B.; Łyczko, J.; Pasławska, M.; Musiałowska, J. Influence of Drying Methods and Vacuum Impregnation on Selected Quality Factors of Dried Sweet Potato. Agriculture 2021, 11, 858. [Google Scholar] [CrossRef] [Scilit]
  39. Burlingame, B.; Mouillé, B.; Charrondière, R. Nutrients, bioactive non-nutrients and anti-nutrients in potatoes. J. Food Compos. Anal. 2009, 22, 494–502. [Google Scholar] [CrossRef] [Scilit]
  40. Répás, Z.; Nagy, R.; Polgár, Z.G.; Győri, Z. Study to Determine the Nutritional Characteristics of Potato Varieties that Are Suitable for the Application of the Freeze-Drying Process. Potato Res. 2025, 68, 2237–2259. [Google Scholar] [CrossRef] [Scilit]
  41. Pęksa, A.; Kita, A.; Kułakowska, K.; Aniołowska, M.; Hamouz, K.; Nemś, A. The quality of protein of coloured fleshed potatoes. Food Chem. 2013, 141, 2960–2966. [Google Scholar] [CrossRef] [Scilit]
  42. Rosell, M.; Nystrom, C.D. Potatoes—A scoping review for Nordic Nutrition Recommendations 2023. Food Nutr. Res. 2024, 68, 10454. [Google Scholar] [CrossRef] [Scilit]
  43. Vescovo, D.; Manetti, C.; Ruggieri, R.; Spizzirri, U.G.; Aiello, F.; Martuscelli, M.; Restuccia, D. The Valorization of Potato Peels as a Functional Ingredient in the Food Industry: A Comprehensive Review. Foods 2025, 14, 1333. [Google Scholar] [CrossRef] [Scilit]
  44. Xu, X.; Wu, S.; Chen, K.; Zhang, H.; Zhou, S.; Lv, Z.; Chen, Y.; Cui, P.; Cui, Z.; Lu, G. Comprehensive Evaluation of Raw Eating Quality in 81 Sweet Potato (Ipomoea batatas (L.) Lam) Varieties. Foods 2023, 12, 261. [Google Scholar] [CrossRef] [Scilit]
  45. FAO. International Year of the Potato 2008 New Light on a Hidden Treasure; FAO: Rome, Italy, 2008. [Google Scholar]
  46. Bellumori, M.; Chasquibol Silva, N.A.; Vilca, L.; Andrenelli, L.; Cecchi, L.; Innocenti, M.; Balli, D.; Mulinacci, N. A Study on the Biodiversity of Pigmented Andean Potatoes: Nutritional Profile and Phenolic Composition. Molecules 2020, 25, 3169. [Google Scholar] [CrossRef] [Scilit]
  47. Beals, K.A. Potatoes, Nutrition and Health. Am. J. Potato Res. 2018, 96, 102–110. [Google Scholar] [CrossRef] [Scilit]
  48. Vaitkeviciene, N. A comparative study on proximate and mineral composition of coloured potato peel and flesh. J. Sci. Food Agric. 2019, 99, 6227–6233. [Google Scholar] [CrossRef] [Scilit]
  49. Andre, C.M.; Ghislain, M.; Bertin, P.; Oufir, M.; Herrera Mdel, R.; Hoffmann, L.; Hausman, J.F.; Larondelle, Y.; Evers, D. Andean potato cultivars (Solanum tuberosum L.) as a source of antioxidant and mineral micronutrients. J. Agric. Food Chem. 2007, 55, 366–378. [Google Scholar] [CrossRef] [Scilit]
  50. Camire, M.E.; Kubow, S.; Donnelly, D.J. Potatoes and human health. Crit. Rev. Food Sci. Nutr. 2009, 49, 823–840. [Google Scholar] [CrossRef] [Scilit]
  51. Lachman, J.; Hamouz, K.; Šulc, M.; Orsák, M.; Pivec, V.; Hejtmánková, A.; Dvořák, P.; Čepl, J. Cultivar differences of total anthocyanins and anthocyanidins in red and purple-fleshed potatoes and their relation to antioxidant activity. Food Chem. 2009, 114, 836–843. [Google Scholar] [CrossRef] [Scilit]
  52. Reyes, L.F.; Miller, J.C.; Cisneros-Zevallos, L. Antioxidant capacity, anthocyanins and total phenolics in purple-and red-fleshed potato (Solanum tuberosum L.) genotypes. Am. J. Potato Res. 2005, 82, 271–277. [Google Scholar] [CrossRef] [Scilit]
  53. Brown, C.R. Antioxidants in potato. Am. J. Potato Res. 2005, 82, 163–172. [Google Scholar] [CrossRef] [Scilit]
  54. Shah, P.; Modi, H. Comparative study of DPPH, ABTS and FRAP assays for determination of antioxidant activity. Int. J. Res. Appl. Sci. Eng. Technol. 2015, 3, 636–641. [Google Scholar]
  55. Lachman, J.; Hamouz, K.; Orsák, M.; Pivec, V.; Dvořák, P. The influence of flesh colour and growing locality on polyphenolic content and antioxidant activity in potatoes. Sci. Hortic. 2008, 117, 109–114. [Google Scholar] [CrossRef] [Scilit]
  56. Luo, K.; Zhang, J.; Li, X.; Chen, J.; Zhu, J.; Li, Y. Comparison of quality characteristics among 20 sweet potato varieties. Sci. Rep. 2025, 15, 28154. [Google Scholar] [CrossRef] [Scilit]
  57. Ezekiel, R.; Singh, N.; Sharma, S.; Kaur, A. Beneficial phytochemicals in potato—A review. Food Res. Int. 2013, 50, 487–496. [Google Scholar] [CrossRef] [Scilit]
  58. Rodriguez-Amaya, D.B. Carotenoids as food colorants and precursors of aroma compounds. In Food Carotenoids; Wiley: Hoboken, NJ, USA, 2015; pp. 199–224. [Google Scholar]
  59. Payyavula, R.S.; Navarre, D.A.; Kuhl, J.C.; Pantoja, A.; Pillai, S.S. Differential effects of environment on potato phenylpropanoid and carotenoid expression. BMC Plant Biol. 2012, 12, 39. [Google Scholar] [CrossRef] [Scilit]
  60. Sharma, A.; Shahzad, B.; Rehman, A.; Bhardwaj, R.; Landi, M.; Zheng, B. Response of Phenylpropanoid Pathway and the Role of Polyphenols in Plants under Abiotic Stress. Molecules 2019, 24, 2452. [Google Scholar] [CrossRef] [Scilit]
  61. Navarre, D.A.; Pillai, S.S.; Shakya, R.; Holden, M.J. HPLC profiling of phenolics in diverse potato genotypes. Food Chem. 2011, 127, 34–41. [Google Scholar] [CrossRef] [Scilit]
  62. Lepiniec, L.; Debeaujon, I.; Routaboul, J.M.; Baudry, A.; Pourcel, L.; Nesi, N.; Caboche, M. Genetics and biochemistry of seed flavonoids. Annu. Rev. Plant Biol. 2006, 57, 405–430. [Google Scholar] [CrossRef] [Scilit]
  63. Ru, W.; Pang, Y.; Gan, Y.; Liu, Q.; Bao, J. Phenolic Compounds and Antioxidant Activities of Potato Cultivars with White, Yellow, Red and Purple Flesh. Antioxidants 2019, 8, 419. [Google Scholar] [CrossRef] [Scilit]
  64. Vogt, T. Phenylpropanoid biosynthesis. Mol. Plant 2010, 3, 2–20. [Google Scholar] [CrossRef] [Scilit]
  65. Tanaka, Y.; Brugliera, F.; Chandler, S. Recent progress of flower colour modification by biotechnology. Int. J. Mol. Sci. 2009, 10, 5350–5369. [Google Scholar] [CrossRef] [Scilit]
  66. He, J.; Giusti, M.M. Anthocyanins: Natural colorants with health-promoting properties. Annu. Rev. Food Sci. Technol. 2010, 1, 163–187. [Google Scholar] [CrossRef] [Scilit]
  67. Xu, W.; Dubos, C.; Lepiniec, L. Transcriptional control of flavonoid biosynthesis by MYB-bHLH-WDR complexes. Trends Plant Sci. 2015, 20, 176–185. [Google Scholar] [CrossRef] [Scilit]
  68. Naveed, M.; Hejazi, V.; Abbas, M.; Kamboh, A.A.; Khan, G.J.; Shumzaid, M.; Ahmad, F.; Babazadeh, D.; FangFang, X.; Modarresi-Ghazani, F.; et al. Chlorogenic acid (CGA): A pharmacological review and call for further research. Biomed. Pharmacother. 2018, 97, 67–74. [Google Scholar] [CrossRef] [Scilit]
  69. Ninkuu, V.; Aluko, O.O.; Yan, J.; Zeng, H.; Liu, G.; Zhao, J.; Li, H.; Chen, S.; Dakora, F.D. Phenylpropanoids metabolism: Recent insight into stress tolerance and plant development cues. Front. Plant Sci. 2025, 16, 1571825. [Google Scholar] [CrossRef] [Scilit]
  70. Kaspar, K.L.; Park, J.S.; Mathison, B.D.; Brown, C.R.; Massimino, S.; Chew, B.P. Processing of pigmented-flesh potatoes (Solanum tuberosum L.) on the retention of bioactive compounds. Int. J. Food Sci. Technol. 2012, 47, 376–382. [Google Scholar] [CrossRef] [Scilit]
  71. Padda, M.S.; Picha, D.H. Quantification of phenolic acids and antioxidant activity in sweetpotato genotypes. Sci. Hortic. 2008, 119, 17–20. [Google Scholar] [CrossRef] [Scilit]
  72. Borba, A.; Gomez-Zavaglia, A. Infrared spectroscopy: An underexploited analytical tool for assessing physicochemical properties of food products and processing. Curr. Opin. Food Sci. 2023, 49, 100953. [Google Scholar] [CrossRef] [Scilit]
  73. Johnson, J.B.; Walsh, K.B.; Naiker, M.; Ameer, K. The Use of Infrared Spectroscopy for the Quantification of Bioactive Compounds in Food: A Review. Molecules 2023, 28, 3215. [Google Scholar] [CrossRef] [Scilit]
  74. Li, Q.; Chen, J.; Huyan, Z.; Kou, Y.; Xu, L.; Yu, X.; Gao, J.M. Application of Fourier transform infrared spectroscopy for the quality and safety analysis of fats and oils: A review. Crit. Rev. Food Sci. Nutr. 2019, 59, 3597–3611. [Google Scholar] [CrossRef] [Scilit]
  75. Kizil, R.; Irudayaraj, J.; Seetharaman, K. Characterization of irradiated starches by using FT-Raman and FTIR spectroscopy. J. Agric. Food Chem. 2002, 50, 3912–3918. [Google Scholar] [CrossRef] [Scilit]
  76. van Soest, J.J.G.; Tournois, H.; de Wit, D.; Vliegenthart, J.F.G. Short-range structure in (partially) crystalline potato starch determined with attenuated total reflectance Fourier-transform IR spectroscopy. Carbohydr. Res. 1995, 279, 201–214. [Google Scholar] [CrossRef] [Scilit]
Figure 1. Visual appearance of freeze-dried sweet potato powders obtained from the three selected genotypes cultivated at SCDCPN (Research and Development Station for Plant Culture on Sandy Soils Dăbuleni, Romania).
Applsci 16 08815 g001
Figure 2. Exploratory PCA biplot based on selected compositional and antioxidant parameters (TPC, ABTS, total protein, total fiber, and ash) of the three composite sweet potato powders (WPP, OPP, and PPP). Individual points represent analytical replicates of each composite powder and do not represent independent biological samples. The PCA is presented solely for descriptive visualization of the multivariate structure of the analyzed dataset.
Applsci 16 08815 g002
Figure 3. Representative HPLC chromatograms of phenolic compounds tentatively identified in freeze-dried sweet potato powders (WPP, OPP, and PPP), recorded at 340 nm, with an additional chromatogram of the PPP sample recorded at 520 nm.
Applsci 16 08815 g003aApplsci 16 08815 g003b
Figure 4. FTIR spectra of freeze-dried potato powders (WPP, OPP, PPP) showing the main functional groups characteristic of carbohydrates, proteins, and lipids.
Applsci 16 08815 g004
Table 1. Proximate Composition of Sweet Potato Powders.
WPPPPPOPP
Moisture (%)3.20 ± 0.453.08 ± 0.334.0 ± 0.39
Protein (%)5.1 ± 0.476.58 ± 0.566.04 ± 0.59
Fat (%)0.25 ± 0.030.22 ± 0.040.35 ± 0.04
Ash (%)1.76 ± 0.211.5 ± 0.121.81 ± 0.19
Fiber (%)3.70 ± 0.413.93 ± 0.404.43 ± 0.43
Total carbohydrate (%)86.0084.6983.37
Kcal/100 g366.61367.06360.79
Values are expressed as mean ± standard deviation (SD) of three analytical replicates performed on one composite powder sample per genotype. The composite sample was obtained by pooling equal portions of powders derived from the three randomized field blocks. Total carbohydrate and energy values were calculated from the proximate composition data. WPP—white sweet potato powder; OPP—orange sweet potato powder; PPP—purple sweet potato powder.
Table 2. (a) Macromineral Composition and Elemental Profiling of Sweet Potato Powders; (b) Micromineral Composition of Sweet Potato Powders.
(a)
mg/kg (d.w.)WPPPPPOPP
Ca988.99 ± 28.311491.00 ± 15.981475.70 ± 15.03
Mg958.54 ± 18.201322.27 ± 18.071215.32 ± 17.98
K4806.73 ± 30.557261.09 ± 74.6315,642.03 ± 87.26
Na2248.13 ± 21.041027.58 ± 14.34236.54 ± 15.02
P3987 ± 27.386523 ± 50.624356 ± 26.23
(b)
mg/kg (d.w.)WPPPPPOPP
Fe15.90 ± 0.9920.1 ± 1.8121.17 ± 1.42
Cu5.47 ± 0.526.00 ± 0.544.27 ± 0.34
Zn4.91 ± 0.296.08 ± 0.5710.20 ± 0.98
Mn3.60 ± 0.386.38 ± 0.568.79 ± 0.67
Ni0.61 ± 0.100.98 ± 0.180.27 ± 0.01
Rb3.98 ± 0.234.45 ± 0.346.37 ± 0.47
Sr3.59 ± 0.234.79 ± 0.451.15 ± 0.11
Ba1.27 ± 0.121.29 ± 0.141.73 ± 0.10
As, Cd, Cr, Co, Hg, Pb, Se, and V were below the limit of detection (LOD < 0.03 mg/kg). Values are expressed as mean ± standard deviation (SD) of three analytical replicates performed on one composite powder sample per genotype. The composite sample was obtained by pooling equal portions of powders derived from the three randomized field blocks. WPP—White sweet potato powder, OPP—Orange sweet potato powder, PPP—Purple sweet potato powder; d.w.—dry weight.
Table 3. Content of bioactive compounds and the antioxidant activity.
ParametersWPPOPPPPP
DPPH (μM TE/g d.w.)1.55 ± 0.113.5 ± 0.298.8 ± 0.67
ABTS (μM TE/g d.w.)2.31 ± 0.193.5 ± 0.3111.7 ± 0.12
FRAP (μM TE/g d.w.)2.46 ± 0.205.21 ± 0.4513.32 ± 0.56
TPC (mg GAE/g d.w.)0.95 ± 0.062.28 ± 0.215.79 ± 0.41
TFC (mg QE/g d.w.)0.03 ± 0.010.09 ± 0.010.38 ± 0.05
Values are expressed as mean ± standard deviation (SD) of three analytical replicates performed on one composite powder sample per genotype. The composite sample was obtained by pooling equal portions of powders derived from the three randomized field blocks. WPP—white sweet potato powder; OPP—orange sweet potato powder; PPP—purple sweet potato powder; TPC—total phenolic content; TFC—total flavonoid content; TE—Trolox equivalents; GAE—gallic acid equivalents; QE—quercetin equivalents; d.w.—dry weight.
Table 4. Color attributes of sweet potato powders in the CIE Lab system.
AttributesWPPOPPPPP
L*55.94 ± 0.8545.75 ± 0.9223.20 ± 0.78
a*2.64 ± 0.2115.12 ± 0.888.77 ± 0.55
b*12.08 ± 0.6429.97 ± 1.101.27 ± 0.18
C*12.37 ± 0.7033.57 ± 1.258.87 ± 0.60
77.79 ± 1.0563.22 ± 1.308.18 ± 0.95
Values are expressed as mean ± standard deviation (SD) of three analytical replicate measurements performed on one composite powder sample per genotype. The composite sample was obtained by pooling equal portions of powders derived from the three randomized field blocks. WPP—white sweet potato powder; OPP—orange sweet potato powder; PPP—purple sweet potato powder. L*—lightness; a*—red/green coordinate; b*—yellow/blue coordinate; C*—chroma; h°—hue angle.
Table 5. Quantitative profile of tentatively identified phenolic compounds in sweet potato powders determined by HPLC-DAD-MS.
Peak
No.
Rt
(min)
[M+H]+
(m/z)
Phenolic Compound
μg/g d.w.
WPPOPPPPP
12.611552,3-Hydroxybenzoic acid173.88 ± 0.56575.38 ± 0.45270.68 ± 0.23
27.07155Gentisic acid108.45 ± 0.65989.81 ± 0.56210.16 ± 0.19
39.62155Protocatechuic acid125.99 ± 0.14161.68 ± 0.12459.39 ± 0.67
49.85787Petunidin-rutinosyl-glucosideN.D.N.D.31.11 ± 0.03
510.47355Neochlorogenic acid12.55 ± 0.1450.63 ± 0.07169.07 ± 0.11
610.811394-Hydroxybenzoic acid109.64 ± 0.1076.18 ± 0.09101.61 ± 0.05
711.56355Chlorogenic acid28.05 ± 0.03227.52 ± 0.21437.39 ± 0.67
811.77947Peonidin-(feruloyl-rutinosyl)-glucosideN.D.N.D.40.08 ± 0.04
912.44903Pelargonidin-(caffeoyl-rutinosyl)-glucosideN.D.N.D.59.35 ± 0.08
1012.63343Caffeic acid-glucoside19.64 ± 0.19335.33 ± 0.45216.23 ± 0.12
1113.01181Caffeic acid46.43 ± 0.5612.55 ± 0.01276.01 ± 0.20
1213.85887Pelargonidin-(p-coumaroyl-rutinosyl)-glucosideN.D.N.D.46.89 ± 0.04
1314.03949Petunidin-(caffeoyl-rutinosyl)-glucosideN.D.N.D.50.74 ± 0.43
1414.75369Feruloyquinc acid75.43 ± 0.08394.89 ± 0.291189.22 ± 0.59
1514.88165p-Coumaric acid31.37 ± 0.0163.03 ± 0.19477.46 ± 0.45
1615.03771Petunidin-p-coumaroyl-rutinosideN.D.N.D.211.26 ± 0.20
1716.58195Ferulic acid20.75 ± 0.0245.76 ± 0.04612.51 ± 0.09
1819.365173,5-Dicaffeoylquinic acid76.31 ± 0.09112.40 ± 0.092088.27 ± 0.23
1919.765313-Caffeoyl-5-feruloylquinic acid116.16 ± 0.17109.30 ± 0.191553.62 ± 0.15
Total phenolics944.70 ± 0.983154.53 ± 0.988501.12 ± 0.98
Values are expressed as mean ± standard deviation (SD) of three analytical replicates performed on one composite powder sample per genotype. The composite sample was obtained by pooling equal portions of powders derived from the three randomized field blocks. WPP—White sweet potato powder, OPP—Orange sweet potato powder, PPP—Purple sweet potato powder, d.w.—dry weight, N.D. (not detected), Rt—retention time.
Disclaimer/Publisher’s Note: The statements, opinions and data contained in all publications are solely those of the individual author(s) and contributor(s) and not of MDPI and/or the editor(s). MDPI and/or the editor(s) disclaim responsibility for any injury to people or property resulting from any ideas, methods, instructions or products referred to in the content.