Article

Technological Potential and Changes in Bioactive Compounds During Ripening of Four Sea Buckthorn (Hippophae rhamnoides L.) Cultivars Grown in the Republic of Moldova


1
Food Engineerig Faculty, Ștefan cel Mare University of Suceava, 720229 Suceava, Romania
2
Food Technology Department, Technical University of Moldova, MD-2004 Chisinau, Moldova
*
Authors to whom correspondence should be addressed.
Appl. Sci. 2026, 16(15), 7543; https://doi.org/10.3390/app16157543
Submission received: 26 June 2026 / Revised: 20 July 2026 / Accepted: 27 July 2026 / Published: 29 July 2026

Abstract

Sea buckthorn (Hippophae rhamnoides L.), known as a “superfruit” due to its complex nutritional profile, exhibits significant variations in bioactive compounds depending on variety and ripening stage. This study evaluates the ripening dynamics of four specific varieties—Dora, Cora, Clara, and Mara—cultivated in the Republic of Moldova to identify the optimal harvest window and technological potential for each variety. Over a seven-week period (August–September), several physicochemical and biochemical parameters were monitored, including pH, titratable acidity, total soluble solids (TSS), total dry matter (TDM), lipid content, color, hardness, vitamin C, total carotenoids content (TCC), and organic acids. Analytical methods such as refractometry, spectrophotometry, and capillary electrophoresis were employed to track these components. A downward trend in TSS and titratable acidity, characteristic of non-climacteric fruits, was observed. The Cora and Mara varieties exhibited the highest productivity and total dry matter content (up to 35.61%), making them suitable for concentrated food products. Clara stood out with the highest lipid accumulation (reaching 2.32%), identifying it as the premium variety for oil extraction. Vitamin C levels generally decreased across all varieties during ripening, with the Mara variety maintaining the highest concentrations (up to 518 mg/100 g). Conversely, total carotenoids showed a peak during full maturity (late August) for most varieties, with Dora reaching the highest values (40.73 mg/100 g). The present study highlights that the optimal harvest time for maximizing bioactive compounds is between late August and early September.

1. Introduction

Sea buckthorn (H. rhamnoides L.) is a plant with yellow or orange berries, very light-loving, but sensitive to shadow, also known as the “highland holy fruit” [1].
H. rhamnoides L. belongs to the family Elaeagnaceae and is a perennial, deciduous, dioecious shrub characterized by high ecological adaptability [2,3]. The species usually develops a strong and extensive root system capable of forming symbiotic associations with nitrogen-fixing microorganisms, which contributes to its ability to grow under poor soil conditions [2,4,5]. The plants are characterized by thorny branches, narrow lanceolate leaves covered with silvery trichomes, and clusters of yellow-to-orange berries rich in biologically active compounds [2,6]. The dioecious nature of the species, with separate male and female plants, represents an important biological characteristic that influences fruit production and cultivation practices.
From a taxonomic perspective, the genus Hippophae includes several species distributed mainly throughout Europe and Asia, with H. rhamnoides L. being the most economically important species due to its nutritional and medicinal value. Significant morphological and biochemical variability exists among subspecies and cultivars, particularly regarding plant architecture, fruit size, color, ripening period, and the accumulation of bioactive compounds [2,3].
From an ethnobotanical perspective, sea buckthorn has been traditionally used in various regions as a food and medicinal plant. Fruits, seeds, leaves, and oil obtained from the berries have been used in traditional preparations due to their nutritional properties and potential health benefits. In traditional medicine, sea buckthorn-derived products have been associated with applications related to skin care, wound healing, digestive health, and general health maintenance. Currently, these traditional uses have contributed to increasing interest in sea buckthorn as a source of functional foods, nutraceuticals, and pharmaceutical ingredients [3,7].
It is recognized for controlling soil erosion, but also for the nutritional value of its fruits [8]. The main countries that grow sea buckthorn are China and Russia, where it is appreciated for its applications in medicine or as an ingredient in food [9,10]. To date, approximately 150 species, subspecies, and varieties of sea buckthorn have been identified in Eurasia; they differ in terms of the shrub’s habitat, their intended use, the color and appearance of the berries, and the ripening period [8]. The area of use of this plant is vast, in fields such as: food, medicine, environment or agricultural tools [11]. Sea buckthorn is a plant that thrives in poor soil and at temperatures ranging from −40 to +40 °C [12,13]. Pruning the shoots, the method used for harvesting, results in a lower average annual yield. After harvesting, the berry-bearing shoots are frozen at −38 °C, and the berries are separated from the shoots without being damaged, and then collected and processed [14]. Sea buckthorn has a valuable nutritional profile, and the entire plant can be used, in line with the principles of the circular economy [15]. The chemical composition of sea buckthorn varies depending on several factors, including subspecies, origin, harvest time, climatic and growing conditions, storage conditions, and also variations between years [16], but it is estimated to contain approximately 200 bioactive compounds [17]. The most valuable component is the oil contained in the fruit, but sea buckthorn is also rich in carotenoids, flavonoids, phytosterols, and organic acids, exhibiting multiple functions, including antioxidant, anti-inflammatory, lipid-regulating, and immunomodulatory properties [18,19]. Not only are the fruits considered a good source of nutrients, but the other parts of the plant also contain a number of bioactive substances [11]. This study evaluated four native sea buckthorn (H. rhamnoides L.) varieties selected for their high productivity and adaptability to local climatic conditions: Dora, Cora, Clara, and Mara. Dora is an early-maturing variety, notable for its high productivity and large, oval-elongated fruits with an intense orange hue [20]. Cora is distinguished by its early-to-mid-season ripening and is valued for the fruit’s high resistance to shattering, which influences harvest dynamics. Clara is a mid-season variety, characterized by consistent yield and a balanced dry matter content in the fruit [20,21]. Mara is a late-maturing variety with excellent productivity and vigorous fruit [21], ideal for extending the processing season [20]. The complete morphological characteristics and agronomic details specific to each analyzed variety are summarized and presented comparatively in Table 1.
The morphological and physiological differences among the studied varieties highlight distinct production and processing potential, with the Cora and Mara varieties standing out for their high productivity, while Clara is distinguished by early ripening and Dora by specific sensory characteristics. The ripening dynamics of sea buckthorn (H. rhamnoides L.) berries is a complex physiological and biochemical process that is strongly influenced by genotype, climate, and harvest time. In the scientific literature, the changes in bioactive compounds during ripening often show divergent trends. For example, studies by Andersson et al., 2009, demonstrated that total carotenoid levels tend to increase steadily as the fruits reach full maturity [19]. In contrast, the concentration of vitamin C (ascorbic acid) generally follows a downward trend during the late stages of ripening, a phenomenon attributed to oxidative degradation or the dilution effect caused by water accumulation in the fruit. As for the profile of organic acids, it varies significantly depending on geographic origin and subspecies (for example, the distinct profiles of ecosystems in China, Russia, or Finland). However, most existing research focuses either on the isolated analysis of bioactive compounds or on narrow harvest windows, leaving a significant analytical gap. There is a lack of a systematic, multidimensional comparative assessment that correlates physical parameters (such as firmness and CIELab color coordinates) with fine metabolic dynamics (such as the determination of individual organic acids by capillary electrophoresis and lipid changes) over an extended period of weekly monitoring. This gap is even more pronounced in the case of the specific varieties Dora, Cora, Clara, and Mara, whose ripening characteristics and technological potential under the influence of the soil and climate conditions in the Republic of Moldova have not been comparatively evaluated to date.
The purpose of this study was to evaluate the dynamics of fruit ripening in four sea buckthorn cultivars (H. rhamnoides L.) (Dora, Cora, Mara and Clara) over a seven-week period under the same cultivation conditions. The study aimed to characterize cultivar-dependent changes in physicochemical and biochemical parameters, including pH, titratable acidity, total soluble solids, vitamin C content, total carotenoid content, organic acid composition, color characteristics, berry firmness, and antioxidant activity.

2. Materials and Methods

During a two-month period (August–September; each sampling week designated as W1–W7), four sea buckthorn cultivars (Dora, Cora, Mara and Clara) were monitored to evaluate changes in ripening-related parameters, including pH [20], titratable acidity [20], vitamin C content [15], total carotenoid content [16], color [13], berry firmness [23], organic acid composition [20,24], and antioxidant activity [21], the period marking the transition from late summer to early fall in the Republic of Moldova. Sampling was performed weekly from 3 August to 28 September, with the sampling dates designated as W1–W7: 3 August (W1), 11 August (W2), 22 August (W3), 29 August (W4), 8 September (W5), 19 September (W6), and 28 September (W7). The studied cultivars (Dora, Cora, Mara and Clara) are officially registered and included in the Catalogue of Plant Varieties of the Republic of Moldova. The cultivar identity was confirmed based on their official descriptions and morphological characteristics.
The study was conducted on an experimental plantation located in Pohrebea village, Dubossary District, Republic of Moldova (47°10′34″ N, 29°10′04″ E). The experimental period was characterized by typical pedoclimatic conditions for central Moldova, with slightly higher temperatures (2–3 °C above the norm) and reduced precipitation during fruit ripening. Fruit samples were collected exclusively from female shrubs of the four sea buckthorn cultivars (Dora, Cora, Mara, and Clara). Male plants (cultivar Andros) were present in the orchard solely as pollinators, at a ratio of one male plant to eight female plants. This region is characterized by a moderate temperate–continental climate. For each cultivar, fruits were collected weekly from 8 shrubs. Fruit-bearing branches were sampled from the north, south, east, and west sides of each shrub to ensure representative sampling. The fruit collected from the 8 shrubs of each cultivar was pooled into a single composite sample, yielding approximately 5 kg of fruit per cultivar at each sampling date.
All shrubs were grown under identical agronomic and environmental conditions, including the same planting density (3.5 × 1.75 m), irrigation, fertilization, and light exposure, in order to minimize environmental variability among cultivars. After harvest, the fruits were analyzed fresh [22]. All chemicals used in this study were of analytical grade and were purchased from Sigma-Aldrich (St. Louis, MO, USA).

2.1. pH and Titrable Acidity

Fresh sea buckthorn berries were homogenized, and 25.00 ± 0.01 g of the homogenized sample was transferred into a 250 mL volumetric flask. Approximately three-quarters of the flask volume was filled with distilled water preheated to 80 °C. The mixture was heated in a water bath (SBS40 STUART, Cole-Parmer, Altrincham, UK) at 80 °C for 30 min with continuous stirring. After cooling to 20 °C, the extract was diluted to the mark with distilled water, thoroughly homogenized, and filtered.
An aliquot of 25 mL of the filtrate was transferred into an Erlenmeyer flask and titrated with 0.1 mol L−1 NaOH using an automatic titrator (TitroLine 5000, SI Analytics, Mainz, Germany) under continuous stirring. Titratable acidity was expressed as percentage (%) [20].

2.2. Soluble Dry Matter, Insoluble Dry Matter, and Total Dry Matter

The soluble dry matter was determined using the PAL-1 digital refractometer (Atago, Tokyo, Japan), expressed in °Brix, the insoluble dry matter was performed by filtering the sample (filtration system, Buchner funnel and vacuum filter), drying the filter with the residue at 105 °C for 2.5 h until constant mass, and the total dry matter was determined by complete evaporation of water to constant mass in the laboratory oven (SLW 115 SMART, Pol-Eco Apparatus, Wodzisław Śląski, Poland), t = 105 °C for 3 h [20].

2.3. Total Carotenoid Content

The extraction procedure was performed using a 2 g sample mixed with 25 mL of solvent (methanol acetate ether, 1:1:1, v/v/v). The mixture was subjected to ultrasonic extraction for 15 min at 37 kHz (ISOLAB Laborgeräte GmbH, Eschau, Germany) and subsequently centrifuged for 10 min at 5000 rpm using a Hermle Z 366 K centrifuge (Hermle Labortechnik GmbH, Wehingen, Germany). The supernatant was collected, diluted 1:10 with the extraction solvent, and the total carotenoid content was determined spectrophotometrically using a UV-1900 UV–VIS spectrophotometer (Shimadzu, Kyoto, Japan) at a wavelength of 448 nm, according to the method described in [16]. The total carotenoid content was calculated using the formula presented below (Equation (1)):
Total carotenoid content ( mg / 100   g )   =   A × V e x t r . × D × 1000 2500 × 100
where A—absorbance; Vextr.—extract volume, mL; and D—dilution, mL.

2.4. Vitamin C Content

For this determination, 5 g of the sample was used, which was mixed with 100 mL HCl 2%, stirred continuously for 10 min, and then filtered. Then, 0.5 mL of extract together with 25 mL HCl 2% was inserted into the potentiometer electrodes and titrated with 2,6-dichlorophenolindolphenolate [15]. The mass fraction of ascorbic acid in percentages is calculated using the following formula (Equation (2)):
Vitamin   C   content   =   V 1 V 2 × T × V 3 × 100 V 4 × m
where V1—volume of 2,6-dichlorophenolindolphenolate used for titration, mL; V2—volume of 2,6-dichlorophenolindolphenolate used for control, mL; T—titer of 2,6-dichlorophenolindolphenolate, g/mL; V3—extract volume, mL; V4—extract volume used for titration, mL; and m—sample weight, g.

2.5. Color

A Konica Minolta CR-400 colorimeter (Tokyo, Japan) was used to measure the sea buckthorn fruit samples’ color using CIELab color space coordinates, where L* values describe black to white (0 to 100), a* is the degree of redness (positive) or greenness (negative), and b* is yellowness (positive) or blueness (negative) [13]. The total color differences (ΔE*) between the samples were calculated according to the following formula (Equation (3)):
Δ E = L i * L 0 * 2 + a i * a 0 * 2 + b i * b 0 * 2
where L i * = L* sample, L 0 * = L control, a i * = a* sample, a 0 * = a* control, b i * = b* sample, and b 0 * = b* control.

2.6. Hardness of the Berries

A digital fruit hardness tester FR-5120 (Lutron Electronic Enterprise, Taipei, Taiwan) with a capacity of 20 kg and a resolution of 0.01 kg was used to determine hardness. The 3 mm penetration tip was attached and the device was calibrated. The fruit was positioned stably and the tip of the penetrometer was applied perpendicular to its surface. A constant force was applied until the tip penetrated the pulp and the peak hold value was recorded [22].

2.7. Organic Acids

The KAPEL105M system, the most recent certified model in the Kapelseries, was used to determine the organic acids using capillary electrophoresis. The KAPEL105M (Lumex Instruments, Saint Petersburg, Russia) system incorporates full instrument control, data, and the most recent electronic database collection, processing using its software and the capacity to capture the absorption spectra of the sample’s constituent parts while it is being examined. An unaltered quartz capillary measuring 64.5 cm in total length (effective length of 56 cm) and 50 μm in inner diameter was utilized. At 20 °C, the capillary was thermostatically regulated. Research conditions were as follows: capillary Leff/Ltot = 40/50 cm, phosphate buffer served as the primary electrolyte, ID = 50 μm, at 300 mbar × s, the sample inlet is hydrodynamic, and 17 kV of voltage. A UV detector with a wavelength of 190 nm (±1.0 nm) was used. The capillary was first cleaned for 60 s with a 0.1 M NaOH solution, then twice for one minute with deionized water, five minutes with background electrolyte solution, and five minutes with background electrolyte solution between analyses. The calculation of all quantitative characteristics was carried out and recalculated on absolutely dry raw material [20].

2.8. Lipids

Fresh fruits in the amount of 5 g were dried completely in an oven (SLW 115 SMART, Pol-Eco Aparatura, Wodzisław Śląski, Poland) at a temperature of 60 °C for 3 h or until constant weight. For the extraction, a Velp SER 148 (VELP Scientifica Srl, Velate, Italy) was used, and the solvent used was n-hexane [15]. Lipids were extracted from the sea buckthorn samples using the Soxhlet method. The ground sample was extracted using 100 mL of n-hexane. The process took place over a period of 3 h, ensuring approximately 10–12 cycles per hour. After the extraction was complete, the solvent was completely removed using a vacuum rotary evaporator, and the lipid residue was dried in an oven to constant weight. The total lipid content was calculated using the following equation:
Lipids = (m2 − m1)/m0 × 100
where m2 = the mass of the balloon containing the extracted lipids (g), m1 = the mass of the empty extraction balloon (g), and m0 = the mass of the sample taken for analysis (g). The oil content in 100 g of fresh fruit was reported as a percentage, %.

2.9. Antioxidant Activity

The effect of antioxidant activity on 1,1-dipheny l-2-picrylhydrazyl (DPPH) was estimated according to the procedure described by Stanciu et al. [21]. For each measurement, 0.05 mL filtered extract solution (10 g of sample was macerated in 50 mL ethanol (75% v/v) for 48 h in the dark at room temperature) was added to 1.95 mL DPPH ethanolic solution and thoroughly homogenized, and incubated in dark at room temperature for 30 min. Sample absorbance was measured at 515 nm. The final extract concentration in the reaction mixture was 5 mg fresh fruit equivalent/mL, identical for all samples. Results are expressed as percentage inhibition of the DPPH radical (% inhibition), calculated as (A0 − A1)/A0 × 100, where A0 is the absorbance of the control and A1 the absorbance of the sample; IC50 was not determined, as a single fixed extract concentration was used for all comparisons.

2.10. Statistical Analysis

All of the analyses in the present study were performed in triplicate. Statistical software XLStat (trial version) (Addinson, New York, NY, USA) was used to calculate the mean values and standard deviations for the quantitative data. A principal component analysis (PCA) was performed to observe the similarities or dissimilarities between the evaluated parameters and formulated samples.

3. Results and Discussion

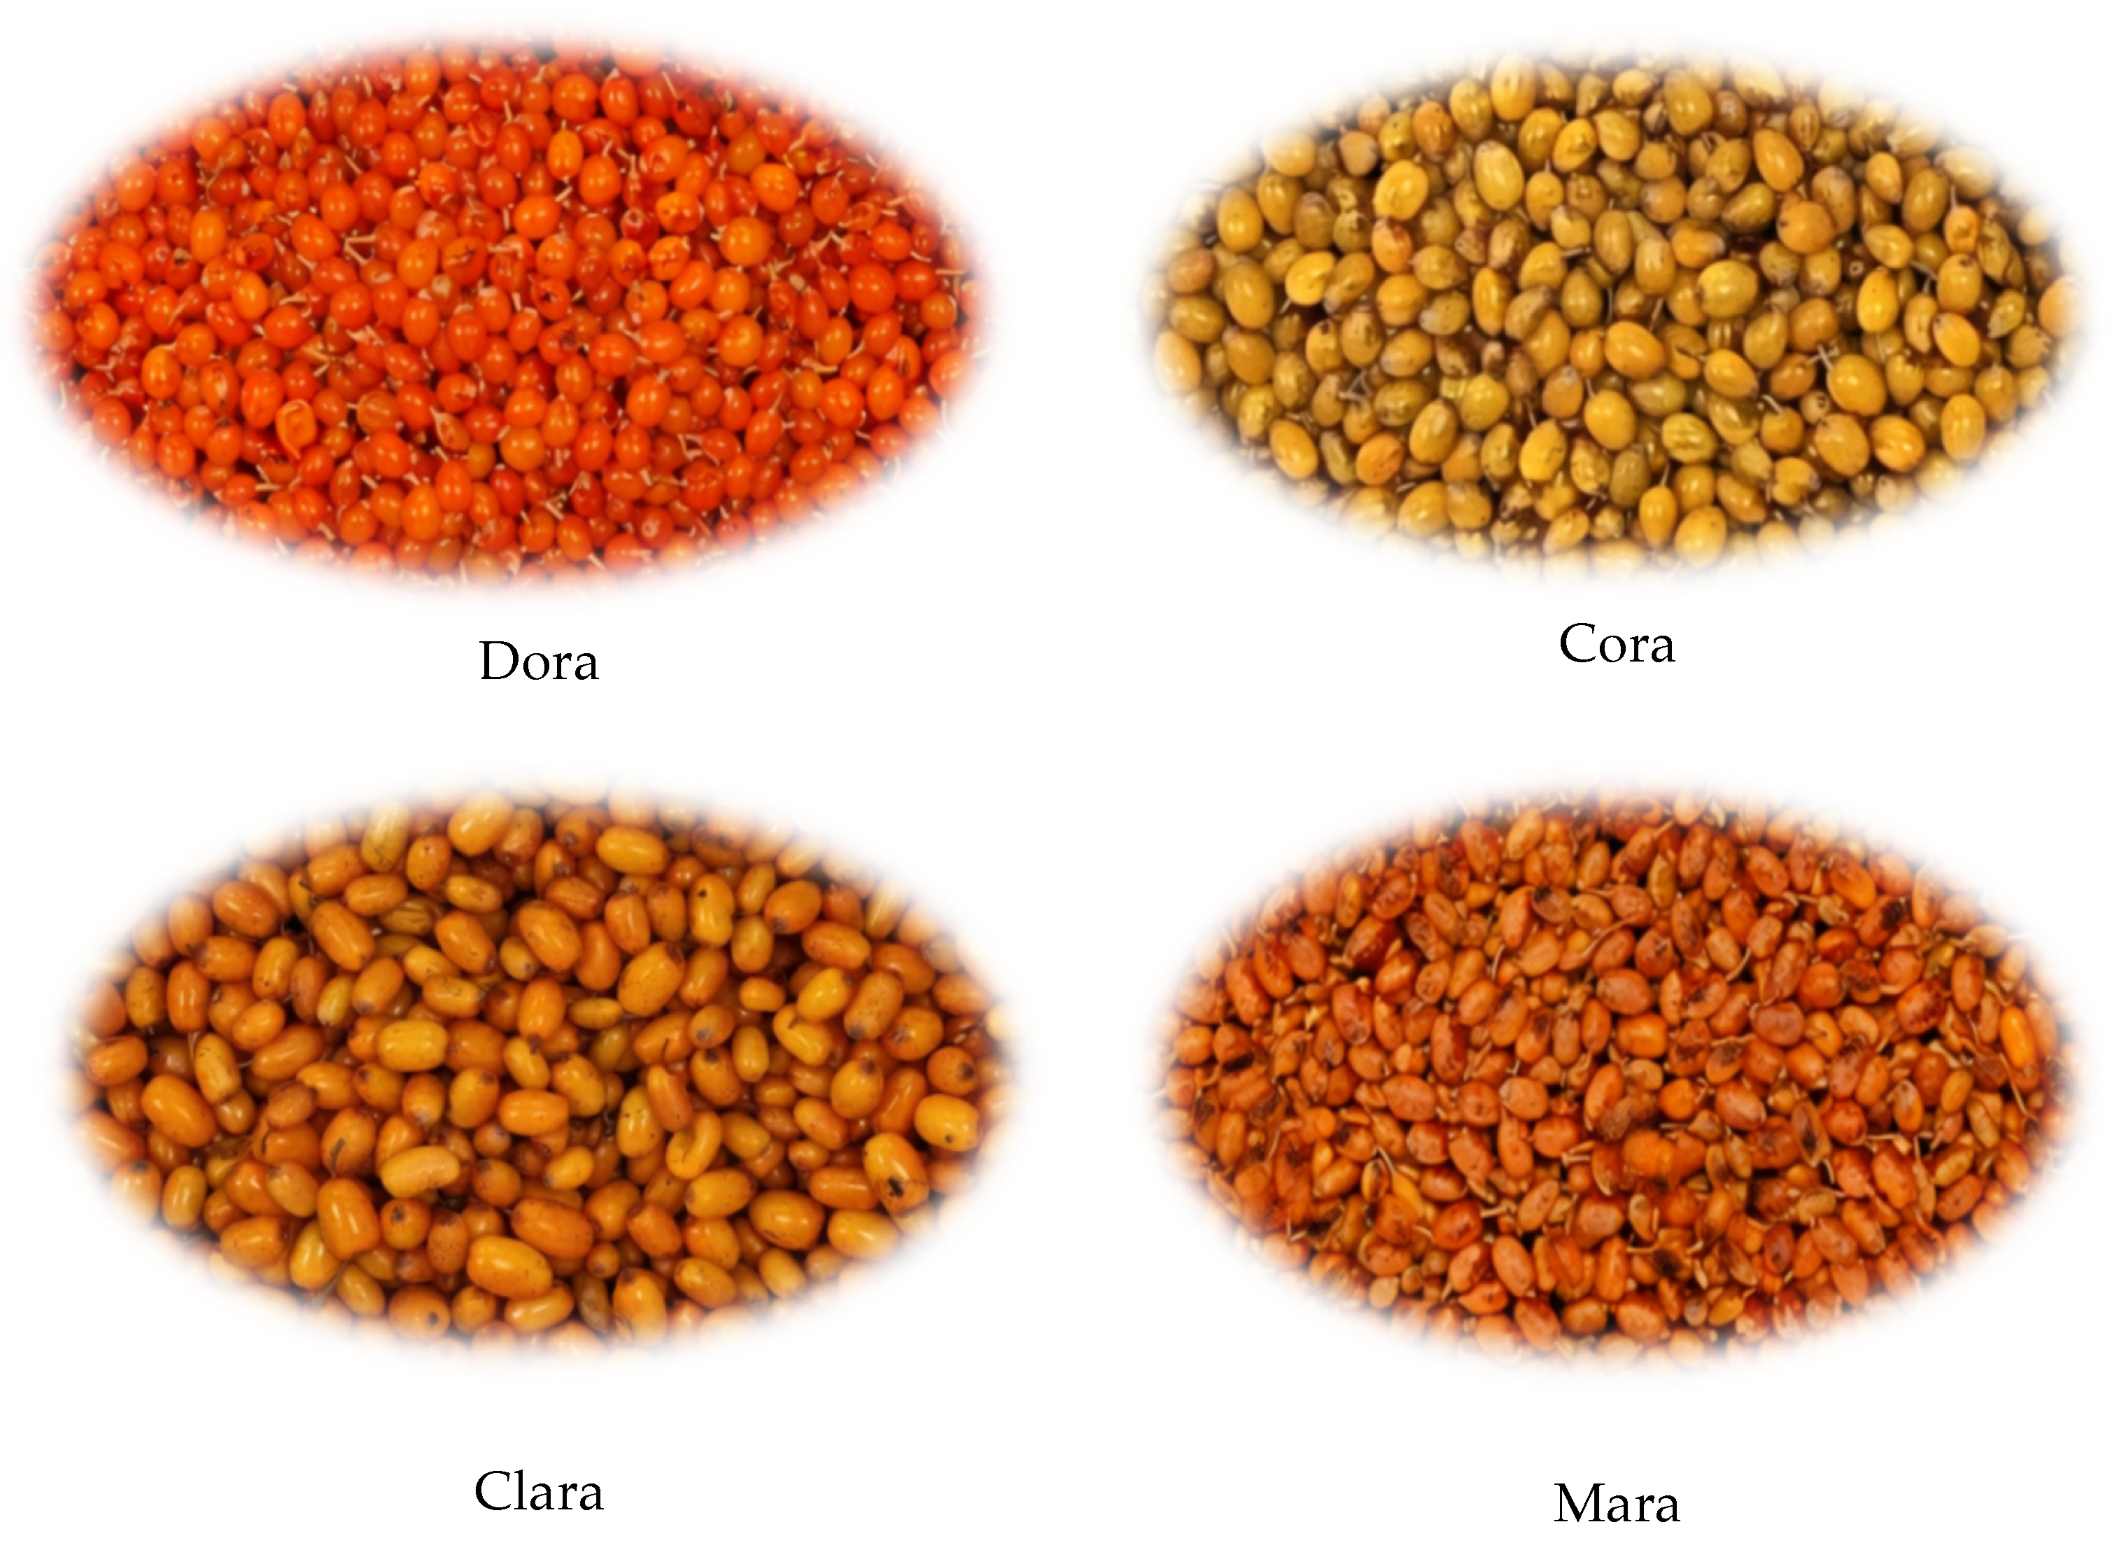
Internal factors, such as the sea buckthorn variety, as well as external factors (temperature, climatic conditions, cultivation technology) influence the ripening period [19]. In order to determine the optimal harvesting period, a series of chemical, physical and biochemical parameters were analyzed over a period of approximately two months, the period between the beginning of August and the end of September (week 1–7). Figure 1 shows differences in the berries of the four sea buckthorn varieties studied.
Table 1 gives a brief description of the four varieties, both in terms of the plant itself, crown, thorns, resistance to pests and diseases, and productivity capacity. On the other hand, the table also describes the fruits contained in each variety: size, shape, color, taste, and also length and diameter. The ripening period of the fruits is also suggested.

3.1. Chemical Parameters

The initial pH of the samples taken in the study was between 2.808 (Clara variety) and 3.276 (Cora variety), and at the end of the analyzed period the values were between 3.071 (Mara variety) and 3.264 (Clara variety), as can be seen from Table 2. Throughout the study period, pH values between 2.808 and 3.276 were recorded. In their study, Netreba et al., 2024, observed pHs in the range from 2.734 to 2.928 [22]. Although sea buckthorn remains a highly acidic fruit throughout ripening, even small changes in pH are enough to alter enzymatic kinetics, leading to increased cellular permeability and increased susceptibility to oxidative processes [24].
It can be observed from Table 3 that the total acidity of the studied sea buckthorn fruits ranged from 1.659 to 4.642%. The Dora and Mara varieties showed no changes in the titratable acidity values throughout the study (1.633–2.162% and 4.248–4.642%, respectively), and the Cora and Clara varieties showed greater variations in values (1.599–3.840% and 1.869–2.530%, respectively). According to Sadowska et al., 2025, total acidity (as citric acid) of the studied sea buckthorn fruits ranged from 3.04 to 3.81 [25]. Sandulachi et al., 2023, found in their study a range from 2.15 to 8.76% for all four varieties (Dora, Cora, Clara, and Mara) [20]. Netreba et al., 2024, found that the total acidity of sea buckthorn fruits had closer values, ranging from 3.2 to 5.9% [22]. While some of the varieties studied (Dora and Mara) show a downward trend in titratable acidity toward the end of the study period (W6–W7), the Cora and Clara varieties exhibit a completely different and opposite trend [25,26,27].
The results obtained highlight the fact that the dynamics of the dry matter in sea buckthorn fruits is influenced both by the time of harvest and by the analyzed variety. The trend in total soluble solids (TSS) content shown in Table 4 provides clear evidence of the non-climacteric physiological behavior of sea buckthorn berries. Unlike climacteric fruits, where the ripening phase is marked by a sudden and massive increase in TSS caused by starch hydrolysis, the sea buckthorn fruits analyzed show a general downward trend in TSS toward the end of the monitoring period. The highest values of total soluble solids were recorded for the Cora and Mara varieties (15.10 °Brix–12.27 °Brix and 14.9–11.53 °Brix, respectively), and the Clara and Dora varieties showed significantly lower values (10.23–7.33 °Brix and 8.77–7.20 °Brix, respectively), the decrease in these values being specific to non-climatic fruits. The data presented in the study by Bal et al., 2011, record TSS values between 9.3 and 22.75 °Brix, which is in agreement with the data presented in the present study [27]. Selimaj et al., 2022, obtained higher values for the Mara variety (10.9 °Brix) compared to the Clara variety (7.3 °Brix), values close to those in the present study [28]. The insoluble solids content had a decreasing trend: the Dora, Cora and Mara varieties showed a decrease until the end of August, and then increased slightly, an increase explained by the onset of overripening processes or by potential dehydration [27,28,29]. In the case of total dry matter, the Cora variety showed the highest values (35.61–21.42%), followed by the Mara variety (28.26–19.68%); Clara and Dora had lower values, reaching below 18% towards the end of the period. These data are in agreement with those presented in the study by Netreba et al., 2024, and Sandulachi et al., 2023 [20,22].
The significant decrease in TSS observed in all varieties over the final few weeks (W6–W7) reflects the intensive use of soluble carbohydrates as a respiratory substrate in cellular metabolic processes that maintain tissue viability. This late decrease in TSS underscores the importance of determining an optimal harvest time to prevent the loss of the fruit’s sensory and nutritional quality [25].
The analysis of the soluble, insoluble and total dry matter revealed significant differences between the sea buckthorn varieties studied, as well as a general trend of these parameters decreasing during ripening. The Cora and Mara varieties showed higher dry matter values, indicating a higher potential for processing, while Clara and Dora recorded lower values, associated with a higher water content.
Table 5 shows the lipid values for all four varieties during the approximately two-month period. The general trend is that the oil content in sea buckthorn fruits increased during the study. The highest values are observed in the fruits of the Clara variety, while the lowest values are recorded for the Cora variety, being around a third of those of the Clara variety. The data are in agreement with those presented by Bal et al., 2011 [27].
Oil content is a key parameter in sea buckthorn processing, and lipid behavior varies significantly: in the Dora variety, lipid content rose steadily toward the end of ripening and peaked in W6 and W7; in the Cora variety, lipids accumulated earlier, peaking in W4, W5, and W6, and in W7, the oil content decreased. An analysis of the dynamics of lipid accumulation shown in Table 5 reveals significant kinetic differences among the varieties studied. Contrary to a delayed accumulation pattern, the Clara variety is characterized by a steady increase in lipid content starting from the earliest stages of ripening. It starts at a minimum value in W1 (0.40%) and increases progressively until reaching a maximum of 2.32% in W5. This gradual accumulation indicates a close correlation between the structural development of the fruit and the enzymatic activity responsible for fatty acid biosynthesis during the active ripening phase. After reaching this peak in W5, a plateau or a slight decrease in lipid concentration is observed during the last two weeks of monitoring (W6–W7), a phenomenon associated with a slowing of lipid metabolism as full maturity sets in.

3.2. Biochemical Parameters

Vitamin C has numerous biological activities in the human body, but the content of this vitamin can be influenced by numerous factors: climatic conditions, genotypic differences, harvesting and handling procedures and degree of maturity [30]. In all four varieties taken in the study, the general trend was a decrease in vitamin C content. The Clara, Dora and Mara varieties recorded a decrease of about 2.5 times in the values of vitamin C, while the Cora variety had a decrease of about four times, as can be seen in Table 6 [27]. DPPH radical scavenging activity (% inhibition) of the berries of the four sea buckthorn varieties (Clara, Dora, Cora, Mara) was measured at seven stages of ripening (W1–W7), determined at a fixed extract concentration of 5 mg fresh fruit equivalent per mL of reaction mixture. Values are given as mean ± standard deviation (n = 2).
The vitamin C results are consistent with the literature; for example, Sadowska et al., 2025, obtained in their study a content of vitamin C ranging from 79.7 to 130.5 mg/100 g fresh weight [25]. Chen et al., 2023, called sea buckthorn fruits “the king of vitamin C” [17,31]. The vitamin C content of sea buckthorn can be compared with that of acerola fruits (Malpighia emarginata), 1677.6 mg/100 g [32], with rosehips (Rosa canina), 420 mg/100 g [33], or with that of blackcurrants (Ribes nigrum L.), 201.6–228 mg/100 g [30].
The carotenoids in sea buckthorn contribute to the characteristic orange–yellow color and support biological activities [17,34,35]; additionally, studies have shown that when fresh sea buckthorn berries ripen, their overall carotenoid content rises [19,34]. In the case of the Clara, Dora, and Mara varieties, the total carotenoid content increases to 22.08–29.08, and then decreases as a result of the fruit entering the overripening phase, while in the Cora variety the growth is constant, with a maximum towards the end of the analyzed interval; these data are presented in Table 7. This is due to a slower but even ripening. The total carotenoid content ranged from 5.08 to 40.73 mg/100 g fresh fruit, which is in according with the study by Olas, 2016 [36]. Andersson et al., 2009, found in their study that the total carotenoid content grew steadily throughout the ripening period, registering values between 323.4 and 1014.9 µg/g dry weight [19]. Dora and Cora reach their peak levels of vitamin C and antioxidant activity halfway through the growing season (W2–W3). Subsequently, these values decline as the fruit develops during the fall months. In the case of the Clara variety, vitamin C reaches its peak in W1–W2 and then steadily declines. Antioxidant activity, however, reaches a delayed peak in W6. The Mara variety reaches its peak vitamin C level in W2.
Sandulachi et al., 2023, investigated the four varieties of sea buckthorn, and in terms of total carotenoid content, the Cora and Clara varieties recorded values around 7 mg/100 g, while the Mara variety had a higher total carotenoid content of 13.93 mg/100 g, and the Dora variety a content of 23.16 mg/100 g [20]. One of the main characteristics by which sea buckthorn oil is marketed is its carotenoid content [26].
The content of organic acids is responsible for the sour and astringent taste [37], being a link of direct proportionality; a high malic acid concentration is primarily responsible for sourness [38], although quinic acid adds to the astringency of fresh sea buckthorn berries [34]. The data about organic acids are presented in Table 8. The large differences between varieties show the potential of the fruits to be selected for a certain end-product (processing to obtain juice, jams, or other end-products) [39]. Organic acids promote the absorption of polyphenols in the body and enhance antioxidant properties [17]. In this study, malic acid is predominant, which is in agreement with the data presented by Wang et al., 2021 [40], and Tang et al., 2026 [41]; malic acid is known as an agent supporting roots against pathogen attack [8].
An integrated comparative analysis of the data in Table 8 highlights inter-varietal differences in the accumulation and evolution of total organic acids during ripening. The most striking feature is the profile of the Cora variety, which exhibits an extremely high concentration of total organic acids throughout the entire study period. By comparison, the other three varieties recorded significantly lower and relatively similar values. The high acid level in the Cora variety, even in the advanced stages of ripening (W6–W7), indicates a lower rate of degradation (consumption as a respiratory substrate) of organic acids relative to the accumulation of soluble sugars. From a technological perspective, this distinct behavior offers clear opportunities for selecting raw materials based on their industrial use: while the Clara, Dora, and Mara varieties (with lower acidity and a more balanced flavor) are ideal for fresh consumption or direct juicing, the Cora variety is an excellent source of natural acidity, making it extremely valuable for the formulation of blended beverages, jellies, or as a natural preservative due to the extremely low pH it naturally induces. Subspecies from China show a higher total of organic acids, ranging from 3.5 to 9.1 g/100 mL, while subspecies from Russia show a lower content of organic acids, ranging from 2.1 to 3.2 g/100 mL [2], and Finnish subspecies have an intermediate content of 4.2–6.5 g/100 mL [27].
The values given in Table 9 represent DPPH radical scavenging activity, expressed as a percentage of inhibition (% inhibition), rather than IC. In this study, the IC50 value was not determined, as antioxidant activity was assessed at a single fixed extract concentration, which was the same for all samples, rather than across a concentration gradient, which is necessary for plotting a “dose–response” curve and calculating the IC50 value. This comparative approach using a single concentration is a generally accepted and widely used method for screening and comparing DPPH radical scavenging activity amongst varieties, stages of ripening, or processing methods [42]. Concerning units of concentration, 10 g of fresh fruit was macerated in 50 mL of 75% (v/v) ethanol; 0.05 mL of this extract was added to 1.95 mL of DPPH solution (total reaction volume—2.0 mL). This corresponds to a final extract concentration of 5 mg fresh fruit equivalent/mL in the reaction mixture, which is the same for all samples and sampling dates, allowing for a direct comparison of % inhibition values between varieties and stages of ripening.
As shown in Table 9, in the early maturation phase the DPPH value increases, reaching a maximum value at optimal maturity, and then decreases with the beginning of the overmaturation phase. The % inhibition values recorded in this study (approximately 10–19%, depending on cultivar and ripening stage) are consistent with the range reported for other sea buckthorn genotypes evaluated by single-concentration DPPH assays. For instance, Ion et al., 2019 [43], reported DPPH inhibition values of 22.6–48.6% for Romanian wild sea buckthorn berries extracted by microwave-assisted extraction, a higher range attributable to the more exhaustive extraction method and the use of dried material. Criste et al., 2020 [44], working with four Romanian sea buckthorn cultivars (a comparable experimental design to the present study), expressed DPPH activity as Trolox-equivalent antioxidant capacity (36.6–42.3 µM Trolox/g fresh weight) rather than % inhibition, illustrating that the same radical scavenging reaction is commonly reported either as a percentage at a fixed concentration or as a Trolox-equivalent value, depending on the aim of the comparison. In a Moldovan sea buckthorn study using the same institutional analytical framework, Popovici et al., 2024 [45], reported DPPH inhibition of non-encapsulated sea buckthorn extracts of around 90% under simulated gastric digestion, a markedly higher value explained by the much higher extract-to-reaction-volume ratio used in that in vitro digestion model. These comparisons support the interpretation that the moderate % inhibition values found here reflect the deliberately diluted, standardized single-concentration protocol used for inter-cultivar and inter-week comparison, rather than a genuinely low antioxidant potential of the fruit. The rise in % inhibition toward the optimal ripening stage followed by a decline during overripening is also in agreement with the genotype- and harvest-time-dependent pattern described by Makovics-Zsohár et al., 2014 [46], for other sea buckthorn cultivars.

3.3. Physical Parameters

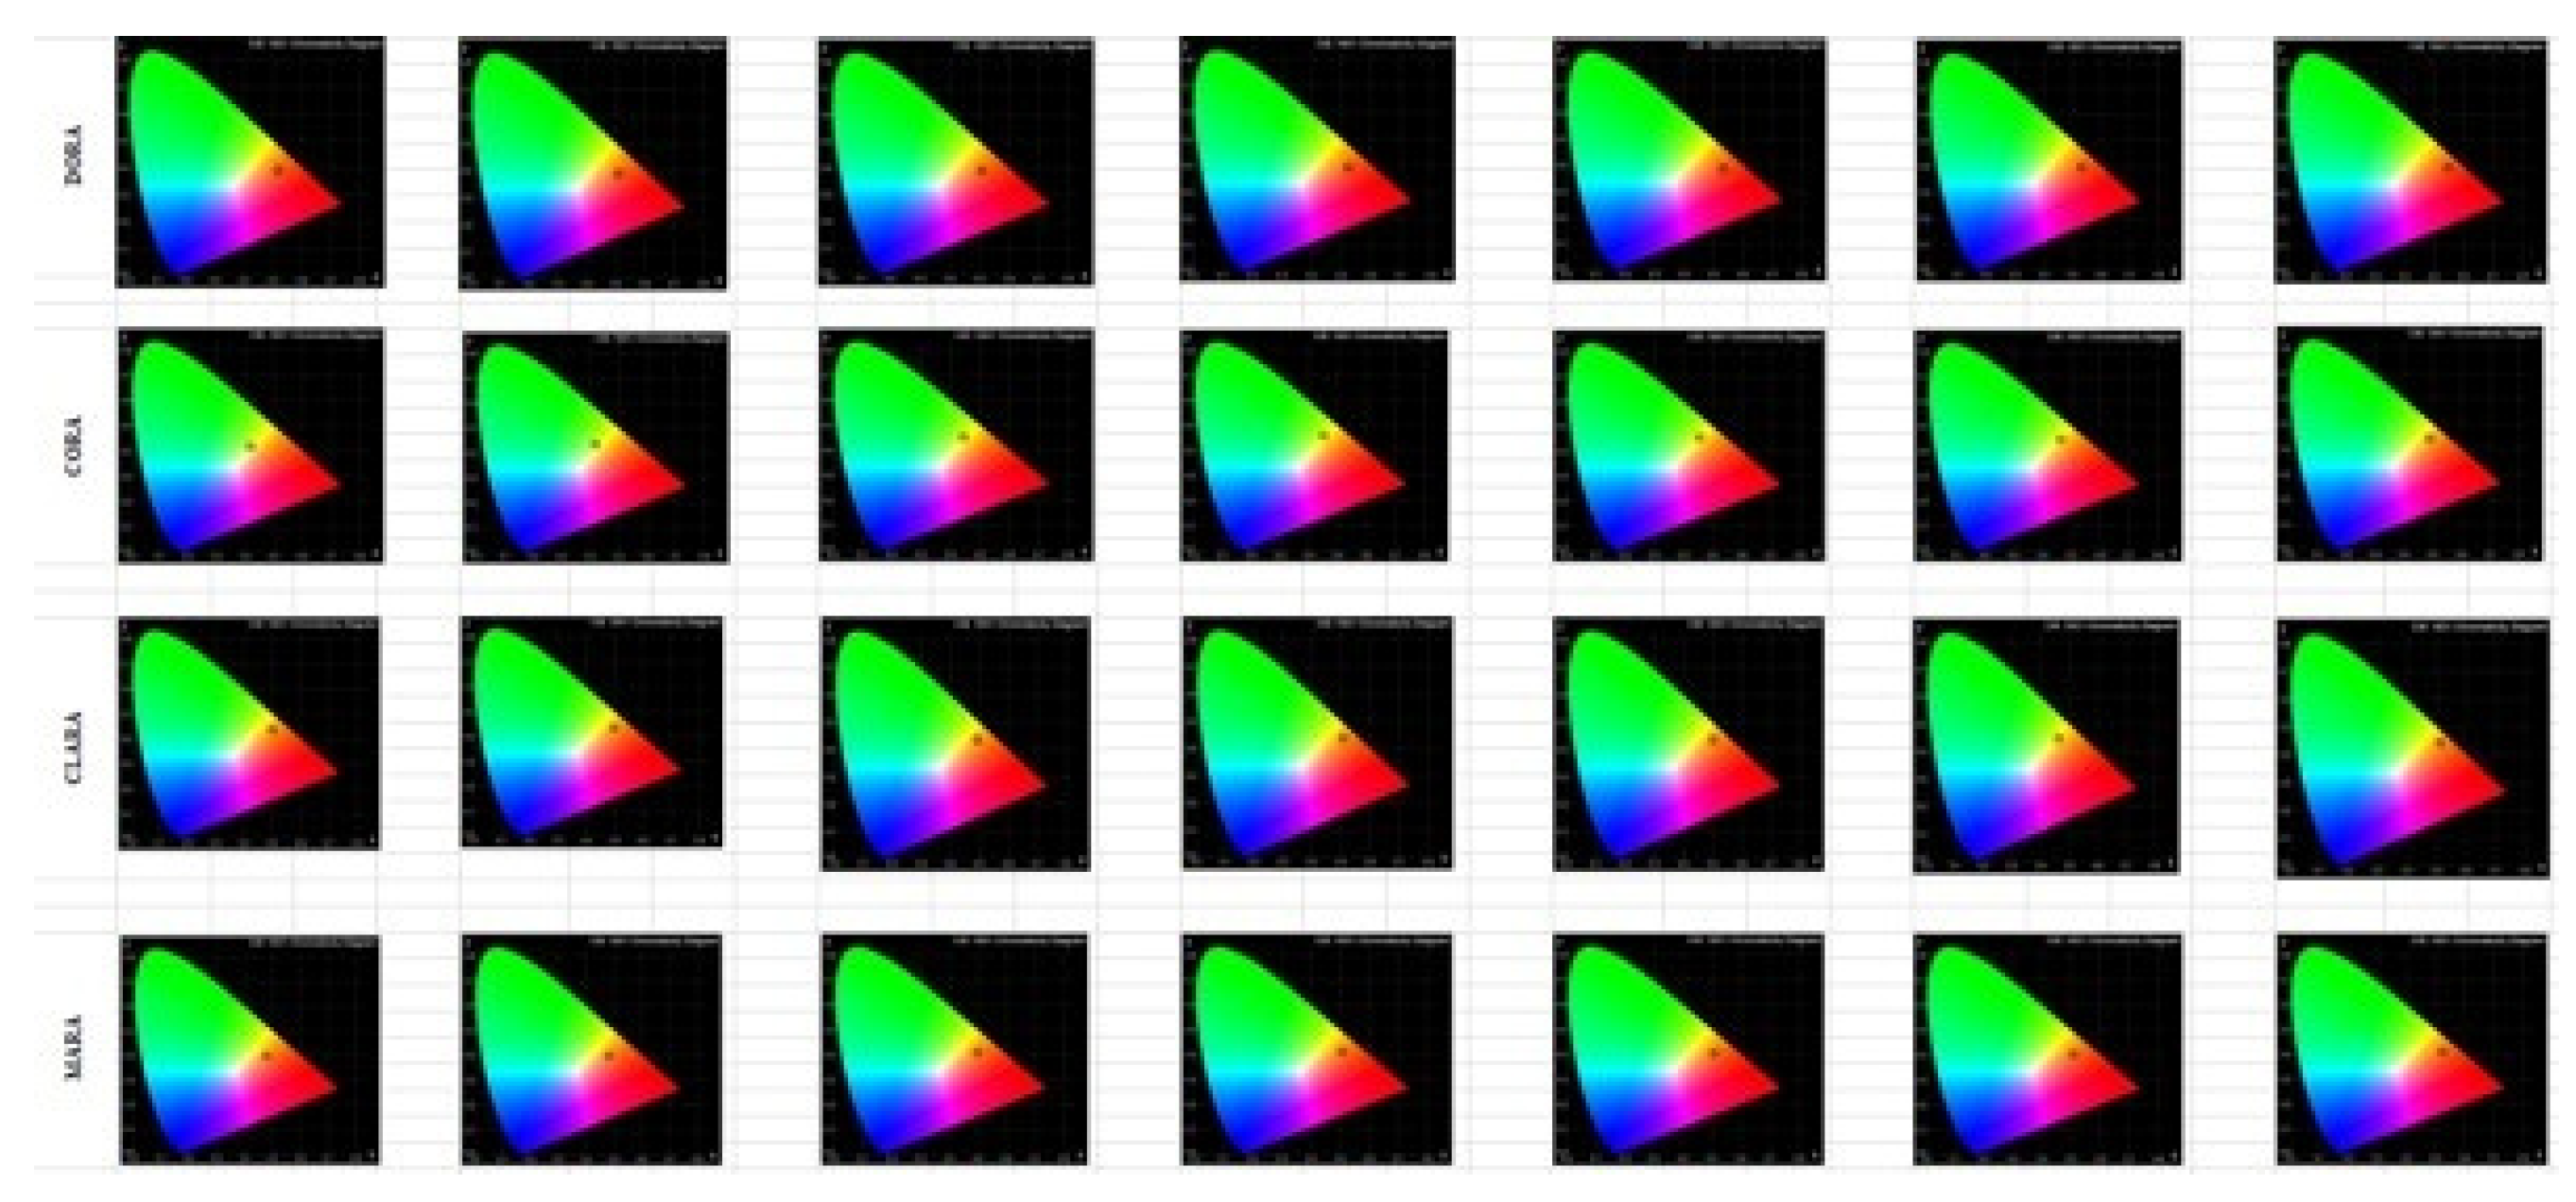
The lightness (L*) of the fruit ranged from 37.33 to 57.68, a* values ranged from 1.08 to 30.78, and b* values from 28.05 to 68.41, as can be seen from Table 10 and Figure 2. Color parameters expressed in the CIELAB system showed clear changes during ripening and were closely associated with carotenoid accumulation in sea buckthorn (H. rhamnoides L.) berries. With regard to changes in chromatic parameters, the high values recorded for b (the yellow/blue coordinate) and L (luminance) during the intermediate stages of ripening reflect an active accumulation of the pigments responsible for the yellow–orange hues characteristic of sea buckthorn berries. The key compounds that contribute to the berries’ yellow-to-orange color are carotenoids [34]. At the overripening stage, stabilization or reduction in a* and b* values suggested possible carotenoid degradation. All these data are in agreement with Sadowska et al., 2025 [25].
The analysis of colorimetric dynamics during the seven harvesting stages reveals distinct ripening patterns for the four sea buckthorn varieties studied. The Cora variety showed the most pronounced phenotypic transformation, marked by a significant increase in the a* parameter indicating a rapid transition from greenish-yellow to orange. In contrast, the Dora, Clara and Mara varieties showed greater shade stability, their maturation process being defined mainly by the intensification of chromatics (Chroma). Most remarkable is the Clara variety, which achieved the highest values of brightness (L*) and b parameter, suggesting a biochemical profile dominated by flavonoid pigments and zeaxanthin. The inflection point observed in the penultimate stage for all chromatic parameters suggests the existence of a critical physiological threshold in the accumulation of carotenoids, thus providing a precise non-destructive indicator for establishing the optimal harvesting time according to the specifics of each variety.
While the color parameters indicate the accumulation of pigments, the decrease in hardness indicates the enzymatic degradation of the cell wall (pectins and hemicellulose), an inverse process proportional to maturation. The decrease in fruit firmness observed over the 7-week study period reflects a progressive softening of tissue texture, a phenomenon typical of the advanced ripening stage of sea buckthorn. This decrease in mechanical resistance is frequently attributed to complex structural modification processes, such as the degradation of cell wall components and the potential hydrolysis of pectic substances by endogenous enzymes. However, since the present study did not include direct biochemical measurements of enzymatic activity (such as polygalacturonase or pectin methylesterase) or of changes in pectin fractions, the progression of fruit ripening was confirmed by the inverse correlation between color intensity and textural hardness. Over the course of the seven stages, a progressive decrease in penetration resistance was observed for all genotypes, with the highest initial values recorded for the Cora (0.96 ± 0.16) and Dora (0.91 ± 0.19) varieties, as can be seen in Table 11. This early structural rigidity coincides with low values of the a* parameter, suggesting a pre-climacteric stage. By the final stage (T7), hardness had decreased by approximately 45–50%, reaching minimum values of 0.45 ± 0.09 for the Mara variety and 0.49 ± 0.07 for Cora. Interestingly, although the Clara variety exhibited the highest brightness and color intensity (C*), it maintained a more consistent softening rate, suggesting a superior ability to preserve post-harvest structural integrity compared to the Mara variety, which exhibited the lowest hardness at the end of the study period.
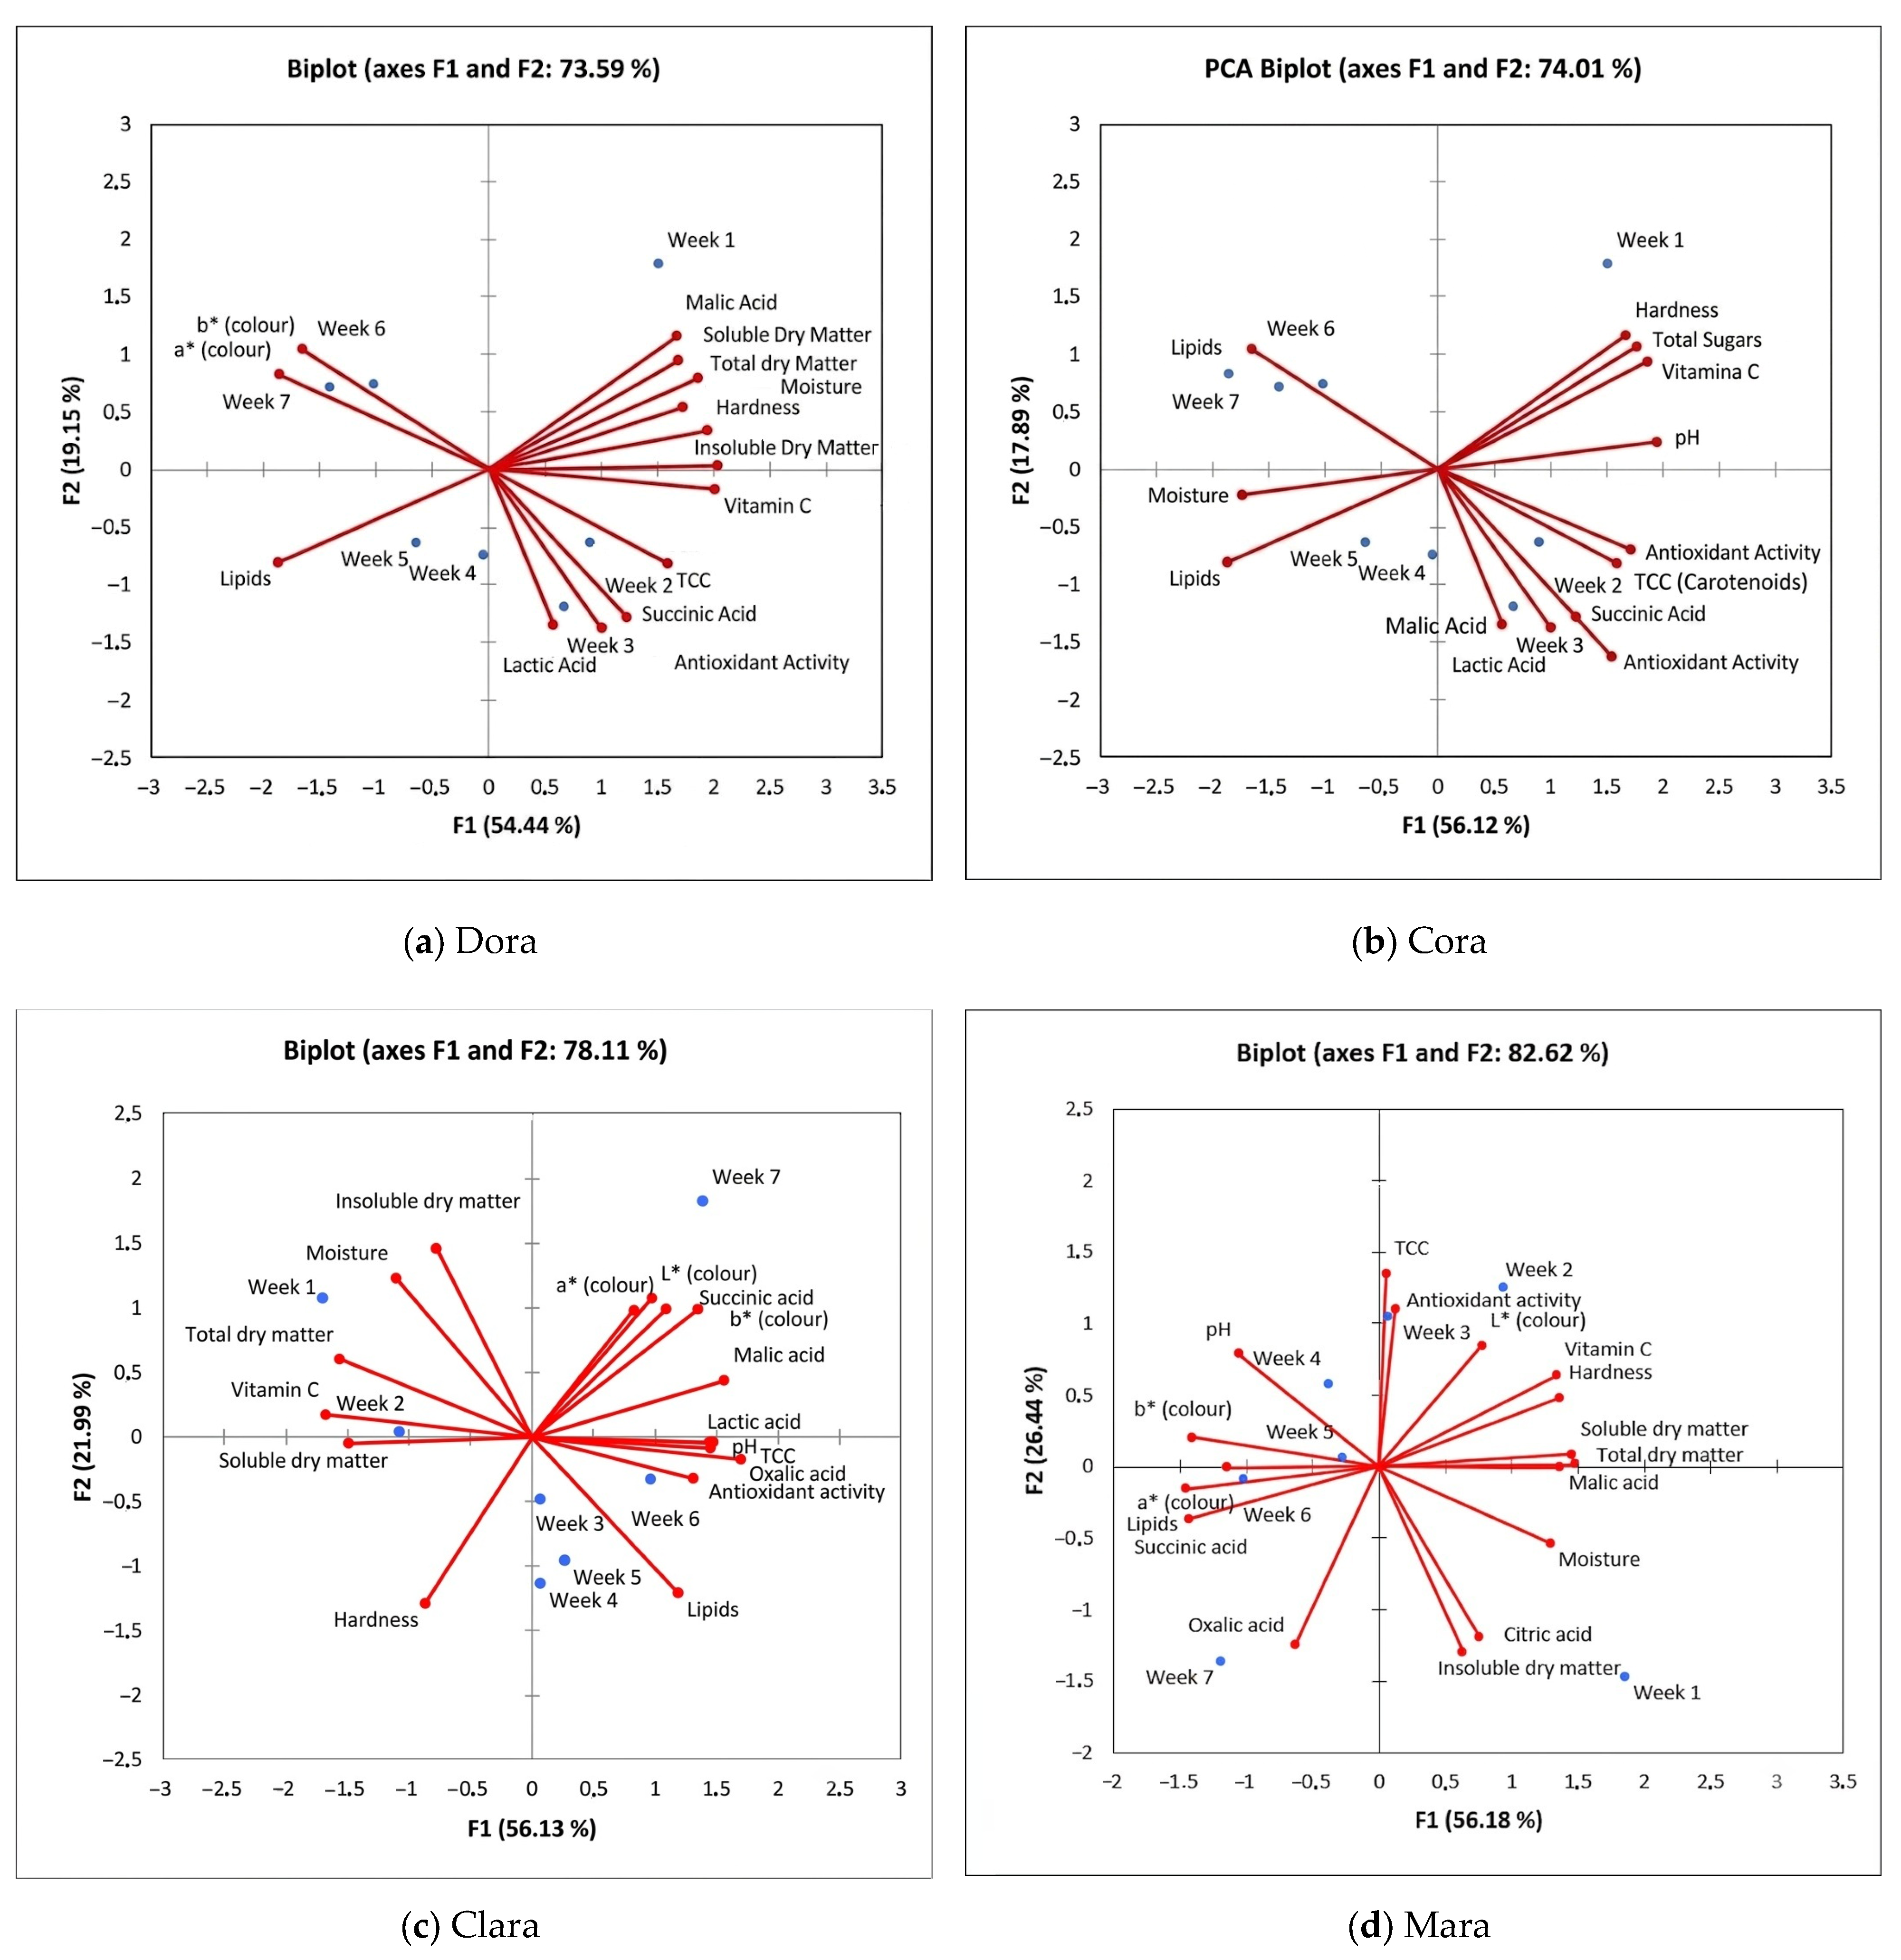
The significant decrease in berry hardness observed during the late ripening stage aligns with the findings of Khazaei and Mann (2004) [47], who reported that the rupture force of sea buckthorn berries drops dramatically as the moisture and sugar contents reach their peaks. This soft texture indicates an advanced hydrolysis of protopectins into soluble pectin within the cell walls, a physiological phenomenon well documented for small berries [39]. Consequently, reaching this low-hardness threshold severely limits traditional manual harvesting due to high juice losses and skin puncturing, suggesting that alternative harvesting methods, such as branch freezing, should be prioritized for late-harvested cultivars like Cora or Mara [48]. Principal component analysis (PCA) was used to highlight similarities or differences among the specified characteristics, as can be seen from Figure 3.
The blue dots indicate the weeks of harvesting, and the red lines represent the variables analyzed. Component 1 explains 54.44% of the variance of the data, and component 2 explains 19.15% of the total variance; together they cover 73.59%, which means that the model is very robust and the interpretations are safe. Soluble dry matter, total dry matter, moisture, and malic acid indicate a close correlation, as does antioxidant activity, lactic acid, succinic acid, and TCC (total carotenoid content). On the other hand, the color parameters a and b are exactly in opposition to lactic and succinic acids and vitamin C. Also, lipids are diametrically opposite to the group with dry matter and malic acid. In the first week, sea buckthorn fruits have the highest concentrations of malic acid and dry matter (total and soluble). The fruit is still very firm (hardness is high) and has a high moisture content. In weeks 2 and 3, sea buckthorn massively accumulates bioactive compounds. The fruits peak in terms of antioxidant activity, TCC (total carotenoids, so berries begin to turn an intense orange color), vitamin C, and organic ripening acids (lactic acid and succinic acid). In weeks 4 and 5, antioxidant and vitamin C levels begin to drop from the previously recorded peak. Instead, a gradual increase in lipid content is observed (sea buckthorn oil in the pulps and seeds begins to become a defining element). At the end of the period, the fruits have the highest values for color parameters a and b (they reach maximum visual maturity, intensely colored), but they also accumulate the highest amount of lipids. However, they lose hardness (hardness is on the opposite side, so the fruits become soft) and the concentration of vitamin C and antioxidants decreases compared to weeks 2–3. The graph for the Cora variety shows completely changed dynamics of chemical and physical parameters. In the first period of harvest, the Cora variety is characterized by a very low pH (the fruits are extremely acidic) and high values for total dry matter and insoluble dry matter. Also, hardness and vitamin C are quite high from the beginning. Week 1 is isolated in the bottom-right quadrant. In weeks 2 and 3, Cora reaches maximum TCC (carotenoids) and antioxidant activity. Also in this phase, the fruits retain an increased hardness, and weeks 2 and 3 climb to the upper-right quadrant. Over the next 3 weeks, the samples migrate strongly to the left. Lipids (oil), moisture and color parameter b accumulate together at the end of the period. In week 6, the fruits are rich in oil and very juicy. In the last week, the fruit profile changes radically. It accumulates organic acids (malic acid, succinic acid and oxalic acid) and intensifies in chromatic component a. However, the fruits decrease in vitamin C and soluble dry matter. Week 7 can be found in the bottom-left quadrant.
Atypically, at the beginning of the period, the Clara variety has a very high level of vitamin C, total dry matter, insoluble dry matter and moisture. In this early phase, the fruit is juicy and very rich in vitamin C, and weeks 1 and 2 are in the upper-left and left-center quadrants. In the next 3 weeks the samples descend sharply on the vertical axis, grouping in the lower area (center-right). The hardness is oriented left-down, being quite close to the axis of weeks 3–4, indicating a compact texture of the fruit at that time. The last two weeks are of interest; week 6 is in the lower-right quadrant. During this period, the peak for antioxidant activity, lipid content (maximum oil), carotenoids, and oxalic acid and lactic acid is reached. Week 7 rises strongly in the upper-right quadrant. The fruits reach absolute visual maturity, being closely correlated with the color parameters L (brightness), a (red) and b (yellow). At the same time, the maximum concentrations of malic acid and succinic acid are recorded. In week 7, the fruit not only becomes intensely colored, but massively accumulates malic and succinic acid, which suggests a late ripening where organic acids persist strongly and give an intense, astringent taste, even at full chromatic maturity.
The Mara variety has a very well-defined ripening dynamic, where the weeks gradually move counterclockwise (it starts from the bottom right, goes up, turns left and goes down at the end). Components 1 and 2 explain 82.62% of the total variance of the data. At the beginning of the analyzed period, sea buckthorn berries of the Mara variety have a very high concentration of citric acid and insoluble dry matter, and the moisture level is high. The initial taste is dominated by a strong acidity. Vitamin C, hardness, soluble dry matter, total dry matter and malic acid reach their maximum in week 2. In week 3 the carotenoid content is at maximum and the antioxidant activity is high. In weeks 4 and 5 the fruits begin to lose their sharp acidity, becoming less sour, with a sharp increase in pH being observed. An intense color is obtained in week 6, when color parameters a and b reach maximum values, and the lipid content is the highest. In the last week the fruits reach overripeness, accumulating oxalic acid and succinic acid. Harvesting in weeks 2 and 3 can be done to obtain juices with high biological value, while harvesting in week 6 can be done in order to obtain oils.
The Dora variety has a classic, linear ripening, with a gradual and uniform evolution during the 7 weeks taken in the study; the Cora variety has an accelerated evolution in the middle of the period, as weeks 4, 5 and 6 are very grouped in the upper-left quadrant, which means that the fruit maintains a stable bioactive profile for almost a month, before abruptly moving into the overripening phase of week 7. The Mara variety has a perfectly circular dynamic, counterclockwise, with a well-defined ripening phase. The Clara variety has the most atypical ripening behavior; the study period begins directly with maximum values of vitamin C and humidity, it stays in the lower area in weeks 3–5 and grows bioactively and chromatically only in the last two weeks (6 and 7).

4. Conclusions

The dynamics of the ripening process in sea buckthorn (H. rhamnoides L.) are a complex phenomenon, governed both by genetic factors (the variety) and by the time of harvest, with direct implications on nutritional quality and technological processing potential. The evolution of the physicochemical parameters confirmed the non-climacteric character of sea buckthorn fruits. The results of the study indicate that the dynamics of sea buckthorn fruit ripening are a process that is highly dependent on genotype and are not characterized by a universal metabolic pattern applicable to all varieties, indicating that the optimal balance between chemical composition and post-harvest stability is achieved, for most varieties, between the end of August and the beginning of September. On the other hand, the analysis of bioactive compounds revealed a contrast in the dynamics of maturation. While the vitamin C content showed a progressive decrease in all varieties (especially the Cora variety), the total carotenoid content increased until full maturity was reached, followed by a decrease in the overripening phase (except for the Cora variety, which showed a constant accumulation). The Mara variety stood out for the highest vitamin C content, while the Dora variety had the highest concentrations of carotenoids. Morphological and biochemical differences between varieties may suggest distinct industrial destinations. The Cora and Mara varieties, due to their high productivity and superior dry matter values, are recommended for obtaining concentrates and dehydrated products. The Clara variety, standing out for its highest lipid content, is the optimal variety for sea buckthorn oil extraction, and the Dora variety, due to its specific sensory notes and high carotenoid content, is ideal for juices and products with high added value. The predominance of malic acid in all the studied varieties emphasizes the specific sensory profile (astringent–sour) of sea buckthorn, this parameter being essential for the standardization of finished products in the food and pharmaceutical industry. In conclusion, rigorous monitoring of the harvest window is crucial for maximizing yield in bioactive compounds. The results provide valuable data for growers and processors to select the right varieties for specific production goals, while supporting the full use of the plant in the context of the circular economy.

Author Contributions

Conceptualization, A.C., A.D. and A.M.; methodology, I.D.; software, A.C. and A.P.; validation, A.D., G.G.C. and A.M.; formal analysis, I.A.; investigation, I.D. and N.N.; resources, I.D. and A.M.; data curation, I.S.; writing—original draft preparation, A.C.; writing—review and editing, A.D. and A.M.G.; visualization, A.D. and A.M.; supervision, A.D. All authors have read and agreed to the published version of the manuscript.

Funding

This research received no external funding.

Institutional Review Board Statement

Not applicable.

Informed Consent Statement

Not applicable.

Data Availability Statement

The original contributions presented in this study are included in the article. Further inquiries can be directed to the corresponding author.

Acknowledgments

This work was supported by a grant from the Ministry of Education and Research, CCCDI-UEFISCDI, project number PN-IV-PCB-RO-MD-2024-0214.

Conflicts of Interest

The authors declare no conflicts of interest.

References

  1. Ren, J.; Liu, T.; Zhang, S.; Wang, X.; Lei, W.; Han, Y.; Tang, G.; Wang, M.; Tu, X.; Zhang, B.; et al. Effects of Germplasm Type and Geographic Origin on Juice Quality of Sea Buckthorn: A Comparative Study of Physicochemical Properties, Functional Activities, and Flavor Chemistry. Food Chem. 2026, 511, 148850. [Google Scholar] [CrossRef] [Scilit] [PubMed]
  2. Wang, Z.; Zhao, F.; Wei, P.; Chai, X. Phytochemistry, Health Benefits and Food Applications of Sea Buckthorn (Hippophae rhamnoides L.): A Comprehensive Review. Front. Nutr. 2022, 9, 1036295. [Google Scholar] [CrossRef] [Scilit] [PubMed]
  3. Zuchowski, J. Phytochemistry and Pharmacology of Sea Buckthorn (Elaeagnus rhamnoides; syn. Hippophae rhamnoides): Progress from 2010 to 2021. Phytochem. Rev. 2023, 22, 3–33. [Google Scholar] [PubMed]
  4. Sabir, S.M.; Ahmed, S.D.; Lodhi, N. Morphological and Biochemical Variation in Sea Buckthorn Hippophae rhamnoides ssp. Turkestanica, a Multipurpose Plant for Fragile Mountains of Pakistan. S. Afr. J. Bot. 2003, 69, 587–592. [Google Scholar] [CrossRef] [Scilit]
  5. Thapliyal, V.; Kumari, J.; Verma, R.; Jabi, S.; Pandey, D. Seabuckthorn Hippophae rhamnoides: A Miracle Shrub to Combat Environmental Shift. Def. Life Sci. J. 2025, 10, 325–339. [Google Scholar] [CrossRef] [Scilit]
  6. Ilhan, G.; Gundogdu, M.; Karlovi, K.; Židovec, V.; Vokurka, A.; Ercişli, S. Main Agro-Morphological and Biochemical Berry Characteristics of Wild-Grown Sea Buckthorn (Hippophae rhamnoides L. ssp. caucasica Rousi) genotypes in Turkey. Sustainability 2021, 13, 1198. [Google Scholar] [CrossRef] [Scilit]
  7. Pundir, S.; Garg, P.; Dviwedi, A.; Ali, A.; Kapoor, V.K.; Kapoor, D.; Kulshrestha, S.; Ranjan, U.; Negi, P. Ethnomedicinal Uses, Phytochemistry and Dermatological Effects of Hippophae rhamnoides L.: A Review. J. Ethnopharmacol. 2021, 266, 113434. [Google Scholar] [CrossRef] [Scilit] [PubMed]
  8. Ciesarová, Z.; Murkovic, M.; Cejpek, K.; Kreps, F.; Tobolková, B.; Koplík, R.; Belajová, E.; Kukurová, K.; Daško, Ľ.; Panovská, Z.; et al. Why Is Sea Buckthorn (Hippophae rhamnoides L.) so Exceptional? A Review. Food Res. Int. 2020, 133, 109170. [Google Scholar] [CrossRef] [Scilit] [PubMed]
  9. Yang, B.; Kallio, H. Composition and Physiological Effects of Sea Buckthorn (Hippophae) Lipids. Trends Food Sci. Technol. 2002, 13, 160–167. [Google Scholar] [CrossRef] [Scilit]
  10. Li, T.S.C. Product Development of Sea Buckthorn. In Trends in New Crops and New Uses; ASHS Press: Alexandria, VA, USA, 2002; pp. 393–398. [Google Scholar]
  11. Suryakumar, G.; Gupta, A. Medicinal and Therapeutic Potential of Sea Buckthorn (Hippophae rhamnoides L.). J. Ethnopharmacol. 2011, 138, 268–278. [Google Scholar] [CrossRef] [Scilit] [PubMed]
  12. Hakeem, S.; Ali, Z.; Abu, M.; Saddique, B.; Sher, M.A.; Merrium, S.; Wiehle, M. Altitudinal Variation in Leaf Morphology and Functional Traits of Sea-Buckthorn (Hippophae rhamnoides) in Gilgit Region, Pakistan. Sci. Rep. 2026, 16, 202. [Google Scholar] [CrossRef] [Scilit] [PubMed]
  13. Dianu, I.; Macari, A.; Dabija, A.; Netreba, N.; Sandu, I.; Oroian, M.; Buculei, A.; Cusmenco, T. Evaluation of the Impact of Sea Buckthorn Pomace Addition on the Physicochemical and Quality Properties of Meat Snack. J. Eng. Sci. 2026, XXXIII, 165–182. [Google Scholar] [CrossRef] [Scilit]
  14. Galitsyn, G.; Lomovskiy, I.; Podgorbunskikh, E. Seasonal and Geographic Variation in Serotonin Content in Sea Buckthorn. Plant Foods Hum. Nutr. 2023, 78, 186–192. [Google Scholar] [CrossRef] [Scilit] [PubMed]
  15. Murariu, O.C.; Lipșa, F.D.; Marian, P.C.; Frunză, G.; CIobanu, M.M.; Cara, I.G.; Murariu, F.; Stoica, F.; Albu, A.; Tallarita, A.V.; et al. The Effect of Including Sea Buckthorn Berry By-Products on White Chocolate Quality and Bioactive Characteristics under a Circular Economy Context. Plants 2024, 13, 2799. [Google Scholar] [CrossRef] [Scilit] [PubMed]
  16. Ratti, C.; Belkacemi, K.; Gutie, L. Effects of Drying Method on the Extraction Yields and Quality of Oils from Quebec Sea Buckthorn (Hippophaë rhamnoides L.) Seeds and Pulp. Food Chem. 2008, 106, 896–904. [Google Scholar] [CrossRef] [Scilit]
  17. Zhu, P.; Ren, Y.; Wei, C.; Luo, J.; Wu, D.; Ye, X.; Donlao, N.; Tian, J. Compounds from Sea Buckthorn and Their Application in Food: A Review. Food Chem. 2025, 476, 143428. [Google Scholar] [CrossRef] [Scilit] [PubMed]
  18. Yu, X.; Liu, Y.; Zhao, X.; Liu, J.; Dai, X.; Zhao, X.; Shang, Y. Enhanced Lipid-Lowering Activity of Sea Buckthorn Juice by Sequential Fermentation with Compound Probiotics and Its Inhibitory Mechanism against Cholesterol Esterase. Food Biophys. 2026, 21, 1–14. [Google Scholar] [CrossRef] [Scilit]
  19. Andersson, S.T.C.A.; Olsson, M.A.E.O.; Johansson, E.V.A.J.; Rumpunen, K.I.R. Carotenoids in Sea Buckthorn (Hippophae rhamnoides L.) Berries during Ripening and Use of Pheophytin a as a Maturity Marker. J. Agric. Food Chem. 2009, 57, 250–258. [Google Scholar] [CrossRef] [Scilit] [PubMed]
  20. Sandulachi, E.; Netreba, N.; Macari, A.; Sandu, I.; Boeștean, O.; Dianu, I.; Popa, S. The Correlation between Chemical Compositions and Antimicrobial Properties of Sea Buckthorn. Preprints 2023. [Google Scholar] [CrossRef] [Scilit]
  21. Stanciu, I.L.; Geicu-cristea, M.; Popa, E.E.; Popescu, P.A.; Răghici, M.C.D.; Iteluț, A.C.M.; Popa, M.E. Efects of Some Drying Methods on the Content in Bioactive Compounds in Sea Buckthorn By-Products. Horticulture 2023, LXVII, 846–853. [Google Scholar]
  22. Netreba, N.; Sandulachi, E.; Macari, A.; Popa, S.; Ribintev, I.; Sandu, I. A Study on the Fruiting and Correlation between the Chemical Indicators and Antimicrobial Properties of Hippophae rhamnoides L. Horticulturae 2024, 10, 137. [Google Scholar] [CrossRef] [Scilit]
  23. Geng, Z.; Zhu, L.; Wang, J.; Yu, X.; Li, M.; Yang, W.; Hu, B.; Zhang, Q. Drying Sea Buckthorn Berries (Hippophae rhamnoides L.): Effects of Different Drying Methods on Drying Kinetics, Physicochemical Properties, and Microstructure. Front. Nutr. 2023, 10, 1106009. [Google Scholar] [CrossRef] [Scilit] [PubMed]
  24. Geng, Z.; Wang, J.; Zhu, L.; Yu, X.; Zhang, Q.; Li, M.; Hu, B.; Yang, X. Metabolomics Provide a Novel Interpretation of the Changes in Flavonoids during Sea Buckthorn (Hippophae rhamnoides L.) Drying. Food Chem. 2023, 413, 135598. [Google Scholar] [CrossRef] [Scilit] [PubMed]
  25. Sadowska, U.; Słupski, J. The Effect of the Harvest Date on the Possibility of Harvesting by Shaking, Chemical Composition, Color, and Antioxidant Properties of Common Sea Buckthorn Fruit (Hippophae rhamnoides L.). Agronomy 2025, 15, 1184. [Google Scholar] [CrossRef] [Scilit]
  26. Anca-mihaela, G.; Gutt, G. Sea Buckthorn in Plant Based Diets. An Analytical Approach of Sea Buckthorn Fruits Composition: Nutritional Value, Applications, and Health Benefits. Int. J. Environ. Res. Public Health 2021, 18, 8986. [Google Scholar] [CrossRef] [Scilit]
  27. Bal, L.M.; Meda, V.; Naik, S.N.; Satya, S. Sea Buckthorn Berries: A Potential Source of Valuable Nutrients for Nutraceuticals and Cosmoceuticals. Food Res. Int. 2011, 44, 1718–1727. [Google Scholar] [CrossRef] [Scilit]
  28. Selimaj, G.; Simon, G.; Szal, L. Assessment of Berries of Some Sea Buckthorn Genotypes by Physicochemical Properties and Fatty Acid Content of the Seed. Plants 2022, 11, 3412. [Google Scholar] [CrossRef] [Scilit]
  29. Paulauskienė, A.; Zvicevičius, E.; Atkočiūnienė, V. Šaltalankių (Hippophae rhamnoides L.) Uogų Perdirbimo Produktų Cheminė Sudėtis Ir Kokybė. Žemės Ūkio Moksl. 2021, 27, 135–142. [Google Scholar] [CrossRef] [Scilit]
  30. Content, M.; Black, I.N. Vitamin and mineral content in black currant (Ribes nigrum L.) fruits as affected by soil management system. Acta Sci. Pol. Hortorum Cultus 2017, 16, 135–144. [Google Scholar] [CrossRef] [Scilit]
  31. Chen, A.; Feng, X.; Dorjsuren, B.; Chimedtseren, C.; Damda, T.; Zhang, C. Traditional Food, Modern Food and and Nutritional Value of Sea Buckthorn (Hippophae rhamnoides L.): A Review. J. Future Foods 2023, 3, 191–205. [Google Scholar] [CrossRef] [Scilit]
  32. Prakash, A.; Baskaran, R. Acerola, an Untapped Functional Superfruit: A Review on Latest Frontiers. J. Food Sci. Technol. 2018, 55, 3373–3384. [Google Scholar] [CrossRef] [Scilit] [PubMed]
  33. Vartolomei, N.; Turtoi, M. Effect of Rosehip Powder Addition on Dough Extensographic, Amylographic and Rheofermentographic Properties and Sensory Attributes of Bread. Processes 2023, 11, 1088. [Google Scholar] [CrossRef] [Scilit]
  34. Dong, K.; Fernando, W.M.A.D.B.; Durham, R.; Stockmann, R.; Jayasena, V. Nutritional Value, Health-Promoting Benefits and Food Application of Sea Buckthorn. Food Rev. Int. 2021, 39, 2122–2137. [Google Scholar] [CrossRef] [Scilit]
  35. Roman, D.; Constantin, O.E.; Stănciuc, N.; Râpeanu, G. Bioactive compounds and antioxidant activity in different extracts of sea buckthorn (Hippophae rhamnoides L) berries. Ann. Univ. Dunarea Jos Galati 2020, 44, 178–192. [Google Scholar]
  36. Olas, B. Sea Buckthorn as a Source of Important Bioactive Compounds in Cardiovascular Diseases. Food Chem. Toxicol. 2016, 97, 199–204. [Google Scholar] [CrossRef] [Scilit] [PubMed]
  37. Meng, D.; Zhao, D.; Zhao, Z.; Wang, X.; Wu, Y.; Li, Y.; Lv, Z.; Zhong, Q. Revealing Key Aroma Compounds and the Potential Metabolic Pathways in Sea Buckthorn Berries. Food Chem. 2025, 476, 143430. [Google Scholar] [CrossRef] [Scilit] [PubMed]
  38. Zulfiqar, R.; Fatima, K.; Haq, I.-; Mugabi, R.; Sharma, A.; Rustagi, S.; Singh, R.; Ahmad, G. Human Nutrition & Metabolism The Miracle Berry: Unveiling the Therapeutic Attributes of Sea Buckthorn—A Review. Hum. Nutr. Metab. 2025, 41, 200321. [Google Scholar] [CrossRef] [Scilit]
  39. Tiitinen, K.; Hakala, M.; Kallio, H. Quality Components of Sea Buckthorn (Hippophae rhamnoides) Varieties. J. Agric. Food Chem. 2005, 53, 1692–1699. [Google Scholar] [CrossRef] [Scilit] [PubMed]
  40. Wang, K.; Xu, Z.; Liao, X. Bioactive Compounds, Health Benefits and Functional Food Products of Sea Buckthorn: A Review. Crit. Rev. Food Sci. Nutr. 2021, 62, 6761–6782. [Google Scholar] [CrossRef] [Scilit] [PubMed]
  41. Tang, J.; Zhang, H.; Wu, R.; Liu, H.; He, K.; Fang, H.; Wu, J. Sea Buckthorn: A Potential Prebiotic and Promising Functional Ingredient for Fermented Dairy Products. J. Future Foods 2026, 6, 348–360. [Google Scholar] [CrossRef] [Scilit]
  42. Akar, Z.; Küçük, M.; Doğan, H. A New Colorimetric DPPH Scavenging Activity Method with No Need for a Spectrophotometer Applied on Synthetic and Natural Antioxidants and Medicinal Herbs. J. Enzym. Inhib. Med. Chem. 2017, 32, 640–647. [Google Scholar] [CrossRef] [Scilit] [PubMed]
  43. Ion, V.A.; Parvulescu, O.C.; Velcea, D.; Popa, O.; Ahmadi, M. Physico-Chemical Parameters and Antioxidant Activity of Romanian Sea Buckthorn Berries. Rev. Chim. 2019, 70, 4187–4193. [Google Scholar]
  44. Criste, A.; Urcan, A.C.; Bunea, A.; Roxana, F.; Furtuna, P.; Olah, N.K.; Madden, R.H. Phytochemical Composition and Biological Activity of Berries and Leaves from Four Romanian Sea Buckthorn (Hippophae rhamnoides L.) Varieties. Molecules 2020, 25, 1170. [Google Scholar] [CrossRef] [Scilit] [PubMed]
  45. Popovici, V.; Boldianu, A.B.; Pintea, A.; Caraus, V.; Ghendov-Mosanu, A.; Subotin, I.; Druta, R.; Sturza, R. In Vitro Antioxidant Activity of Liposomal Formulations of Sea Buckthorn and Grape Pomace. Foods 2024, 13, 2478. [Google Scholar] [CrossRef] [Scilit] [PubMed]
  46. Makovics-Zsohár, N.; Hegedûs, A.; Stefanovits-Bányai, É.; Rédei, R.; Papp, N. The Antioxidant Capacity of Sea Buckthorn (Hippophae rhamnoides L.) Berries Depends on the Genotype and Harvest Time. Int. J. Hortic. Sci. 2014, 20, 27–29. [Google Scholar] [CrossRef] [Scilit]
  47. Khazaei, J.; Mann, D.D. Effects of Temperature and Loading Characteristics on Mechanical and Stress-Relaxation Properties of Sea Buckthorn Berries. Part 1. Compression Tests. Agric. Eng. Int. 2004, 1–9. [Google Scholar]
  48. Li, T.S.C.; Beveridge, T.H.J.; Oomah, B.D.; Schroeder, W.R. Sea Buckthorn (Hippophae rhamnoides L.): Production and Utilization; Oomah, B.D., Schroeder, W.R., Small, E., Eds.; NRC Research Press: Ottawa, ON, Canada, 2003. [Google Scholar]
Figure 1. Sea buckthorn varieties.
Applsci 16 07543 g001
Figure 2. Color variation in the studied sea buckthorn varieties.
Applsci 16 07543 g002
Figure 3. Principal component analysis.
Applsci 16 07543 g003
Table 1. Sea buckthorn varieties (adapted from Netreba et al. [22]).
DoraCoraClaraMara
Applsci 16 07543 i001Applsci 16 07543 i002Applsci 16 07543 i003Applsci 16 07543 i004
Shrub descriptiontree is of medium-to-weak vigor;
thick crown;
high capacity to form
thin thorns, although 3–5 cm long;
fruits in the third year after planting
tree is of high vigor;
exhibits erect growing and is thick and resistant to diseases and pests;
high capacity to form sparse thorns 3–5 cm long on branches;
fruits in the third year after planting
tree is of high vigour;
a thick and compact crown;
medium capacity to form 4–6 cm thorns;
high regeneration capacity;
is resistant to fusariosis and overwintering;
fruits in the third year after planting
tree is of high vigour;
a rare crown with a high capacity for regeneration;
thorns about 3–5 cm long;
immune to fusariosis;
fruits in the third year after planting
Productivitylow productivity;
it fruits regularly on annual and early branches
high productivity;
fruits on annual and early branches
high productivity;
fruits on annual and early branches
high productivity;
fruits regularly on annual and early branches
Fruit appearancemedium-size fruits;
a mass of about 0.45 g each;
elliptical shape;
dark orange to red in color;
sour-tasting, with a strong pineapple and melon flavor;
fruit is 8–9 mm long and 6–7 mm in diameter
small-size fruits;
oval shape;
yellow–orange in color;
elastic and resistant skin;
fruit is 9–10 mm long and 6–7 mm in diameter
medium-size fruits;
elongated shape;
orange–yellow with thin skin;
fruit is 11–12 mm long and 7–8 mm in diameter
medium-size fruits;
dark orange–orange color with elastic and tough skin;
sweet–sour taste;
fruit is 9–10 mm long and 6–7 mm in diameter
Ripeninglate July–early Augustlate August–early Septemberend of July–mid-Augustmid-August
Table 2. Evolution of pH.
PeriodDoraCoraClaraMara
W13.168 ± 0.112 ghij3.276 ± 0.001 j2.808 ± 0.045 a2.820 ± 0.042 a
W23.260 ± 0.049 ij2.960 ± 0.001 abcde3.034 ± 0.024 bcdefg3.054 ± 0.167 bcdefg
W33.044 ± 0.012 bcdefg2.939 ± 0.001 abcd3.018 ± 0.013 bcdefg3.131 ± 0.099 fghij
W43.235 ± 0.016 hij3.091 ± 0.001 defgh3.163 ± 0.042 ghij3.103 ± 0.087 efghi
W52.915 ± 0.131 abc2.900 ± 0.001 ab3.067 ± 0.069 cdefg2.940 ± 0.024 abcd
W63.018 ± 0.010 bcdefg2.999 ± 0.132 bcdef3.099 ± 0.058 efgh3.155 ± 0.057 ghij
W73.237 ± 0.047 hij3.120 ± 0.118 fghij3.264 ± 0.021 j3.071 ± 0.025 cdefg
Different letters indicate significant differences among the samples (p < 0.05).
Table 3. Titrable acidity.
PeriodDora (%)Cora (%)Clara (%)Mara (%)
W12.162 ± 0.021 fg1.599 ± 0.044 a2.53 ± 0.034 h4.642 ± 0.088 q
W21.725 ± 0.081 abc2.710 ± 0.087 i2.402 ± 0.066 h4.387 ± 0.006 nop
W31.979 ± 0.024 de2.951 ± 0.085 j2.115 ± 0.013 efg4.402 ± 0.027 op
W41.773 ± 0.129 bc3.118 ± 0.011 k1.869 ± 0.036 cd4.248 ± 0.045 n
W51.717 ± 0.096 abc3.631 ± 0.037 l1.965 ± 0.06 de4.410 ± 0.004 p
W61.659 ± 0.002 ab3.840 ± 0.01 m2.017 ± 0.002 def4.253 ± 0.196 no
W71.633 ± 0.053 ab3.789 ± 0.02 m2.233 ± 0.127 g4.309 ± 0.025 nop
Different letters indicate significant differences among the samples (p < 0.05).
Table 4. Total soluble content.
PeriodClaraDoraCoraMara
Total soluble solids (TSS), °BrixW110.23 ± 0.06 g8.77 ± 0.06 e15.10 ± 0.10 n14.90 ± 0.10 n
W29.40 ± 0.001 f8.27 ± 0.6 d14.47 ± 0.06 m14.20 ± 0.35 m
W37.77 ± 0.153 bc7.67 ± 0.12 bc12.63 ± 0.06 j12.73 ± 0.06 jk
W47.80 ± 0.15 bc7.87 ± 0.06 c13.23 ± 0.06 l12.77 ± 0.06 jk
W57.50 ± 0.10 ab7.87 ± 0.06 c14.33 ± 0.21 m13.00 ± 0.10 kl
W67.47 ± 0.06 ab7.87 ± 0.01 c12.47 ± 0.06 ij11.27 ± 0.06 h
W77.73 ± 0.06 bc7.20 ± 0.01 a12.27 ± 0.06 i11.53 ± 0.06 h
Total dry matter, %W120.34 ± 0.02 g21.92 ± 0.03 k35.61 ± 0.09 m28.26 ± 0.06 s
W218.78 ± 0.02 f18.35 ± 0.07 j27.32 ± 0.02 fghi25.21 ± 0.06 q
W318.54 ± 0.05 bc18.53 ± 0.06 hi23.08 ± 0.08 ghi23.52 ± 0.05 p
W418.19 ± 0.06 bc17.86 ± 0.07 efgh23.12 ± 0.09 de22.76 ± 0.09 no
W517.95 ± 0.08 ab17.52 ± 0.04 def22.47 ± 0.09 cd22.31 ± 0.08 mn
W618.06 ± 0.09 ab16.72 ± 0.09 efg20.22 ± 0.09 a20.52 ± 0.07 k
W717.22 ± 0.08 bc16.82 ± 0.02 bc21.42 ± 0.03 ab19.68 ± 0.03 j
Total insoluble solids, %W16.98 ± 0.01 k11.50 ± 0.02 efg9.20 ± 0.01 m9.95 ± 0.01 l
W26.82 ± 0.02 fg9.75 ± 0.02 cdef7.06 ± 0.02 l7.23 ± 0.01 fgh
W36.76 ± 0.03 abcd8.45 ± 0.02 cdef6.49 ± 0.02 j6.36 ± 0.02 abc
W46.43 ± 0.04 ab7.87 ± 0.01 abcd6.13 ± 0.02 i7.15 ± 0.04 fgh
W56.15 ± 0.04 ab8.57 ± 0.03 ab6.18 ± 0.04 j7.38 ± 0.02 gh
W66.11 ± 0.03 bcde7.66 ± 0.03 ab6.57 ± 0.07 hi6.84 ± 0.01 def
W76.09 ± 0.02 i8.58 ± 0.01 a7.90 ± 0.07 j8.84 ± 0.02 jk
Different letters indicate significant differences among the samples (p < 0.05).
Table 5. Lipid content.
PeriodClara (%)Dora (%)Cora (%)Mara (%)
W10.4 ± 0.06 ab0.22 ± 0.12 ab0.08 ± 0.06 a0.32 ± 0.12 ab
W21.12 ± 0.01 fg0.26 ± 0.36 ab0.52 ± 0.11 abcd0.47 ± 0.03 abc
W31.67 ± 0.15 hij1.23 ± 0.06 fgh0.92 ± 0.18 cdef1.19 ± 0.05 fg
W42.1 ± 0.17 jkl1.1 ± 0.03 efg0.99 ± 0.09 def1.3 ± 0.03 fgh
W52.32 ± 0.43 l1.1 ± 0.08 efg0.95 ± 0.11 def1.49 ± 0.01 ghi
W62.28 ± 0.14 l1.19 ± 0.09 fg0.97 ± 0.02 def1.68 ± 0.16 hij
W72.2 ± 0.06 kl1.36 ± 0.04 fghi0.64 ± 0.04 bcde1.78 ± 0.01 ijk
Different letters indicate significant differences among the samples (p < 0.05).
Table 6. Vitamin C of sea buckthorn content.
PeriodClara (mg/100 g)Dora (mg/100 g)Cora (mg/100 g)Mara (mg/100 g)
W1247.53 ± 0.69 ef297.03 ± 0.83 def198.02 ± 0.55 de495.54 ± 0.69 ij
W2236.00 ± 0.67 def236.24 ± 0.33 def189.18 ± 0.01 cde518.68 ± 0.73 j
W3211.98 ± 0.6 def234.59 ± 0.66 def94.02 ± 0.26 ab421.85 ± 0.59 hi
W4198.22 ± 0.83 de195.70 ± 0.54 de99.41 ± 0.84 abc397.22 ± 0.56 h
W5146.91 ± 0.20 bcd198.61 ± 0.28 de97.85 ± 0.27 abc349.30 ± 0.01 gh
W6146.63 ± 0.61 bcd198.61 ± 0.84 de49.41 ± 0.14 a298.21 ± 0.84 fg
W798.04 ± 0.54 abc148.08 ± 0.62 bcd49.65 ± 0.07 a200 ± 0.01 de
Different letters indicate significant differences among the samples (p < 0.05).
Table 7. Total carotenoids content.
PeriodClara (mg/100 g)Dora (mg/100 g)Cora (mg/100 g)Mara (mg/100 g)
W111.57 ± 0.75 d32.65 ± 0.80 l5.08 ± 0.12 a16.66 ± 0.29 f
W214.16 ± 0.15 e32.41 ± 0.24 l5.23 ± 0.42 a29.52 ± 0.17 k
W315.77 ± 0.38 f40.73 ± 0.13 n5.32 ± 0.07 a29.56 ± 0.21 k
W49.88 ± 0.25 c36.44 ± 0.47 m8.36 ± 0.11 b21.14 ± 0.79 hi
W58.06 ± 0.03 b36.51 ± 0.67 m9.64 ± 0.01 c22.04 ± 0.73 ij
W68.18 ± 0.01 b32.03 ± 0.42 l10.03 ± 0.03 c22.50 ± 0.32 j
W78.35 ± 0.06 c21.04 ± 0.46 h10.07 ± 0.36 c18.86 ± 0.78 g
Different letters indicate significant differences among the samples (p < 0.05).
Table 8. Organic acid content.
ClaraOxalic acid
g/L
Malic acid
g/L
Citric acid
g/L
Lactic acid
g/L
Succinic acid
g/L
Total
W10.040 ab7.403 a0.017 a0.021 a0.071 defgh7.552
W20.070 b8.272 b0.024 a0.010 a0.119 hi8.495
W30.130 c9.773 c0.526 bcdef0.047 abc0.109 fgh10.584
W40.140 cd10.599 d0.047 ab0.031 ab0.084 defgh10.901
W50.150 cde13.180 ij0.014 a0.042 abc0.097 fgh13.483
W60.180 de18.040 o0.032 a0.075 bcd0.106 fgh18.443
W70.190 e19.310 p0.076 abc0.053 abc0.182 j19.811
CoraOxalic acid
g/L
Malic acid
g/L
Citric acid
g/L
Lactic acid
g/L
Succinic acid
g/L
Total
W10.030 ab24.020 q0.524 bcdef0.046 abc0.045 abcd24.665
W20.040 ab24.780 r0.529 cdef0.050 abc0.046 abcde25.444
W30.040 ab25.630 s0.634 def0.052 abc0.048 abcde26.404
W40.050 ab35.840 t1.292 g0.020 a0.063 cdef37.265
W50.040 ab36.420 u0.834 efg0.019 a0.061 bcdef37.374
W60.070 b37.570 v0.924 fg0.073 bcd0.084 defgh38.722
W70.140 cd42.410 w0.937 fg0.029 ab0.076 defgh43.592
DoraOxalic acid
g/L
Malic acid
g/L
Citric acid
g/L
Lactic acid
g/L
Succinic acid
g/L
Total
W10.050 ab15.820 l0.407 abcde0.042 abc0.014 ab16.332
W20.050 ab12.980 i0.246 abcd0.072 bcd0.015 abc13.363
W30.050 ab12.020 g0.227 abcd0.048 abc0.021 abc12.366
W40.050 ab11.090 e0.304 abcd0.075 bcd0.014 ab11.533
W50.050 ab11.410 f0.358 abcde0.081 cd0.020 abc11.919
W60.050 ab11.290 ef0.315 abcd0.031 ab0.008 a11.694
W70.050 ab11.250 ef0.290 abcd0.023 a0.008 a11.620
MaraOxalic acid
g/L
Malic acid
g/L
Citric acid
g/L
Lactic acid
g/L
Succinic acid
g/L
Total
W10.040 ab17.660 n0.814 efg0.015 a0.013 a18.542
W20.010 a16.430 m0.134 abc0.073 bcd0.043 abcd16.689
W30.030 ab14.750 k0.243 abcd0.080 cd0.072 defgh15.175
W40.030 ab11.970 g0.236 abcd0.217 f0.093 efgh12.545
W50.030 ab12.620 h0.305 abcd0.137 e0.116 ghi13.208
W60.040 ab13.360 j0.323 abcd0.119 de0.158 ij13.999
W70.050 ab12.010 g0.358 abcde0.056 abc0.184 cdef12.658
Different letters indicate significant differences among the samples (p < 0.05).
Table 9. Antioxidant activity of sea buckthorn berries.
PeriodClara (% inhibition)Dora (% inhibition)Cora (% inhibition)Mara (% inhibition)
W111.64 ± 0.46 bc13.70 ± 0.92 e16.17 ± 0.18 ghi12.11 ± 0.05 cd
W211.52 ± 0.93 bc16.95 ± 0.86 hij17.13 ± 0.45 ij13.71 ± 0.97 ef
W313.82 ± 0.45 e17.34 ± 0.29 ij17.93 ± 0.31 jk17.01 ± 1.00 hij
W413.05 ± 0.26 de18.72 ± 0.12 k17.07 ± 1.10 hij16.29 ± 0.46 ghi
W517.65 ± 0.04 jk12.10 ± 0.23 cd15.15 ± 0.88 fg14.02 ± 0.68 ef
W615.80 ± 0.40 gh11.81 ± 0.84 bcd10.08 ± 0.18 a11.56 ± 0.31 bc
W715.51 ± 0.66 g11.05 ± 0.44 abc10.73 ± 0.05 ab11.35 ± 0.15 abc
Different letters indicate significant differences among the samples (p < 0.05).
Table 10. Color parameters of sea buckthorn varieties.
PeriodDoraCoraClaraMaraChroma
L*a*b*L*a*b*L*a*b*L*a*b*DoraCoraClaraMara
W141.0727.8338.7940.844.0828.0550.318.0454.3346.5421.2336.6647.7428.3457.2542.37
W241.1126.9136.1243.751.0832.2348.8516.9752.9650.4623.4139.2345.0432.2455.6145.69
W341.9926.6737.8942.372.3440.4254.6717.9156.7747.4623.0244.2946.3340.4859.5349.9
W440.4428.8239.4342.242.5542.7748.3618.4556.1343.2322.443.7648.8442.8459.0849.15
W537.3329.4438.4447.244.546.9549.3218.3854.247.3225.5944.6548.4147.1657.2351.48
W643.5830.4944.7248.397.4347.2251.3816.8860.8647.3226.0844.2254.1247.863.1651.34
W738.8430.7846.2042.0512.4147.5457.6821.1268.4141.1524.9745.5855.5149.1371.5951.97
Table 11. Hardness values of the berries.
PeriodDora (N)Cora (N)Clara (N)Mara (N)
W10.91 ± 0.19 hijkl0.96 ± 0.16 jkl0.63 ± 0.14 abcdefgh0.75 ± 0.11 ghijk
W20.74 ± 0.09 efghij0.87 ± 0.16 ijkl0.65 ± 0.05 abcdefgh0.72 ± 0.66 efghij
W30.73 ± 0.11 efghij0.76 ± 0.13 ghijk0.69 ± 0.09 cdefghi0.66 ± 0.13 bcdefgh
W40.72 ± 0.07 efghij0.75 ± 0.09 fghijk0.71 ± 0.10 defghij0.64 ± 0.10 abcdefgh
W50.65 ± 0.09 abcdegh0.75 ± 0.09 fghijk0.67 ± 0.09 bcdefghi0.63 ± 0.11 abcdefgh
W60.62 ± 0.11 abcdefg0.55 ± 0.11 abcde0.56 ± 0.10 abcdef0.49 ± 0.07 ab
W70.50 ± 0.07 abc0.49 ± 0.07 ab0.51 ± 0.11 abcd0.45 ± 0.09 a
Different letters indicate significant differences among the samples (p < 0.05).
Disclaimer/Publisher’s Note: The statements, opinions and data contained in all publications are solely those of the individual author(s) and contributor(s) and not of MDPI and/or the editor(s). MDPI and/or the editor(s) disclaim responsibility for any injury to people or property resulting from any ideas, methods, instructions or products referred to in the content.