Article

Mineralogical and Geochemical Constraints on the Ore-Forming Processes of the Datangpo Manganese Deposits in Western and Central Hunan, South China

1
School of Earth Sciences and Spatial Information Engineering, Hunan University of Science and Technology, Xiangtan 411201, China
2
Hunan Center of Natural Resources Affairs, Changsha 410000, China
3
Observation and Research Station of Lengshuijiang Mining Ecological Environmental Monitoring, Ministry of Natural Resources, Changsha 410004, China
4
Technology Innovation Center for Ecological Conservation and Restoration in Dongting Lake Basin, Ministry of Natural Resources, Changsha 410004, China
5
Hubei Key Laboratory of Petroleum Geochemistry and Environment, Yangtze University, Wuhan 430100, China
6
Engineering and Mine Geological Survey and Monitor Institute of Hunan Province, Changsha 410007, China
*
Author to whom correspondence should be addressed.
Appl. Sci. 2026, 16(17), 8590; https://doi.org/10.3390/app16178590 (registering DOI)
Submission received: 29 July 2026 / Revised: 24 August 2026 / Accepted: 27 August 2026 / Published: 28 August 2026
(This article belongs to the Special Issue Oil and Gas Exploration, Applications and Development)

Abstract

Datangpo-type manganese (Mn) deposits in South China constitute a key archive of Cryogenian postglacial oceanic evolution and large-scale Mn mineralization. However, systematic comparisons between western and central Hunan remain limited, particularly regarding redox conditions, Mn precipitation pathways, and Mn sources. This study investigates Mn ores hosted within the Datangpo black shale succession in western and central Hunan through integrated petrographic, mineralogical, and whole-rock geochemical analyses. The ores are dominated by rhodochrosite and dolomite, with subordinate quartz, pyrite, and illite. Pyrite framboid characteristics together with redox-sensitive trace element systematics record increasingly reducing conditions from high- to low-grade ores, highlighting the control of redox conditions on Mn enrichment. Medium- to high-grade ores show limited terrigenous input and generally shift toward hydrothermal Fe–Mn end members, consistent with a hydrothermal contribution to Mn supply. Mn enrichment generally involved oxidative fixation during deposition, followed by reductive carbonatization during early diagenesis. Locally intensified hydrothermal input may also have promoted limited direct precipitation of Mn carbonate under reducing, Mn-rich, and alkaline conditions. This model may provide a useful basis for interpreting other Datangpo-type Mn deposits in South China.

1. Introduction

Manganese (Mn) is an important strategic metal widely used in steelmaking, alloys, and new-energy technologies. With continuously increasing demand, further exploration for Mn deposits has become increasingly urgent [1,2,3]. Mn deposits have diverse genetic origins, including marine sedimentary, volcanogenic–sedimentary, hydrothermal, metamorphic, and supergene types [4,5,6]. Among these, marine sedimentary Mn deposits represent one of the most important types. Their formation is closely related to basin tectonics, oceanic redox conditions, and the biogeochemical cycling of Mn, while their temporal and spatial distribution also records important changes in Earth-surface environments [7,8].
The Neoproterozoic Era was an important interval of large-scale Mn mineralization in Earth history, during which sedimentary Mn deposits were widely developed worldwide, including major marine sedimentary Mn deposits and Fe–Mn formations in India, Brazil, Namibia, and South China [9]. These deposits commonly formed in tectonically active marine sedimentary basins, but differ markedly in Mn sources, precipitation pathways, and diagenetic evolution. For example, the Penganga Mn deposits in India occur in outer-shelf sediments of a carbonate platform and are dominated by rhodochrosite and kutnohorite. Their formation has been linked to early diagenetic reduction processes [10]. The Otjosondu Mn–Fe deposits in Namibia occur within the Neoproterozoic Damara Supergroup and have been interpreted to record hydrothermal and marine sedimentary contributions to Fe–Mn mineralization [11], whereas the Urucum Fe–Mn deposits in Brazil developed in a rift-controlled sedimentary basin, where microbial and hydrothermal processes may have contributed to Mn enrichment [12].
South China hosts widespread Neoproterozoic marine sedimentary Mn deposits, among which Datangpo-type Mn deposits are particularly representative. Datangpo-type Mn deposits mainly refer to marine sedimentary Mn-carbonate deposits formed during the Cryogenian interglacial interval between the Sturtian and Marinoan glaciations and hosted in the black shale succession of the lower Datangpo Formation. They are widely distributed across Hunan, Guizhou, Chongqing, Guangxi, Hubei, and Anhui [9,13,14]. These deposits formed within the Nanhua rift basin developed during the breakup of the Rodinia supercontinent, and their spatial distribution and orebody geometry were strongly controlled by synsedimentary faults and subordinate fault-bounded depressions [15,16,17]. Following the termination of the Sturtian glaciation, major climatic and oceanographic changes altered basin water redox conditions, as well as the transport and accumulation of Mn. The supply of Mn-rich materials, microbial activity, and early diagenetic carbonatization further contributed to Mn-carbonate formation [14,18]. Datangpo-type Mn deposits also represent a major Mn resource. In northeastern Guizhou, several large to supergiant Mn deposits, including Pujue, Gaodi, and Daotuo, have been discovered in recent years [19,20]. Proven rhodochrosite reserves in this region have been reported to reach approximately 800 Mt [16,17], demonstrating the substantial economic significance of Datangpo-type Mn mineralization.
Hunan Province is a major Mn-producing region in China and hosts typical Datangpo-type deposits in both western and central Hunan, represented by the Minle and Lannitian deposits in the west and the Xiangtan deposit in the central part of the province [13,21,22]. Compared with the systematic exploration and multidisciplinary studies conducted in Guizhou [17], Datangpo-type Mn deposits in Hunan remain less well studied. Previous work has focused largely on the geology, depositional environment, and tectonic setting of individual deposits [21,23]. Consequently, systematic cross-regional comparisons remain scarce, and a unified mineralogical and geochemical framework has yet to be established. In particular, the similarities and differences among deposits from different regions, as well as the controls of depositional setting, terrigenous input, carbonate mineral assemblages, and redox conditions on ore grade and elemental enrichment, remain poorly constrained.
To address these issues, this study investigates the Minle and Lannitian deposits in western Hunan and the Xiangtan deposit in central Hunan through integrated petrographic, mineralogical, and whole-rock geochemical analyses of representative Mn-bearing successions, together with published data from other representative Datangpo-type Mn deposits in South China for regional comparison. Using cross-regional and cross-grade comparisons as the central framework, the objectives are to (1) systematically compare the mineralogical and geochemical characteristics between western and central Hunan, among individual deposits, and across different ore grades to identify their similarities and differences, (2) compare redox characteristics across regions and ore grades to reconstruct depositional redox conditions and evaluate Mn precipitation pathways, and (3) constrain the source of Mn through regional comparison with other representative Datangpo-type Mn deposits in South China and assess the influences of depositional setting, terrigenous input, and carbonate mineralization on Mn enrichment and ore-grade variation.

2. Geological Setting

2.1. Tectonic Setting and Stratigraphy

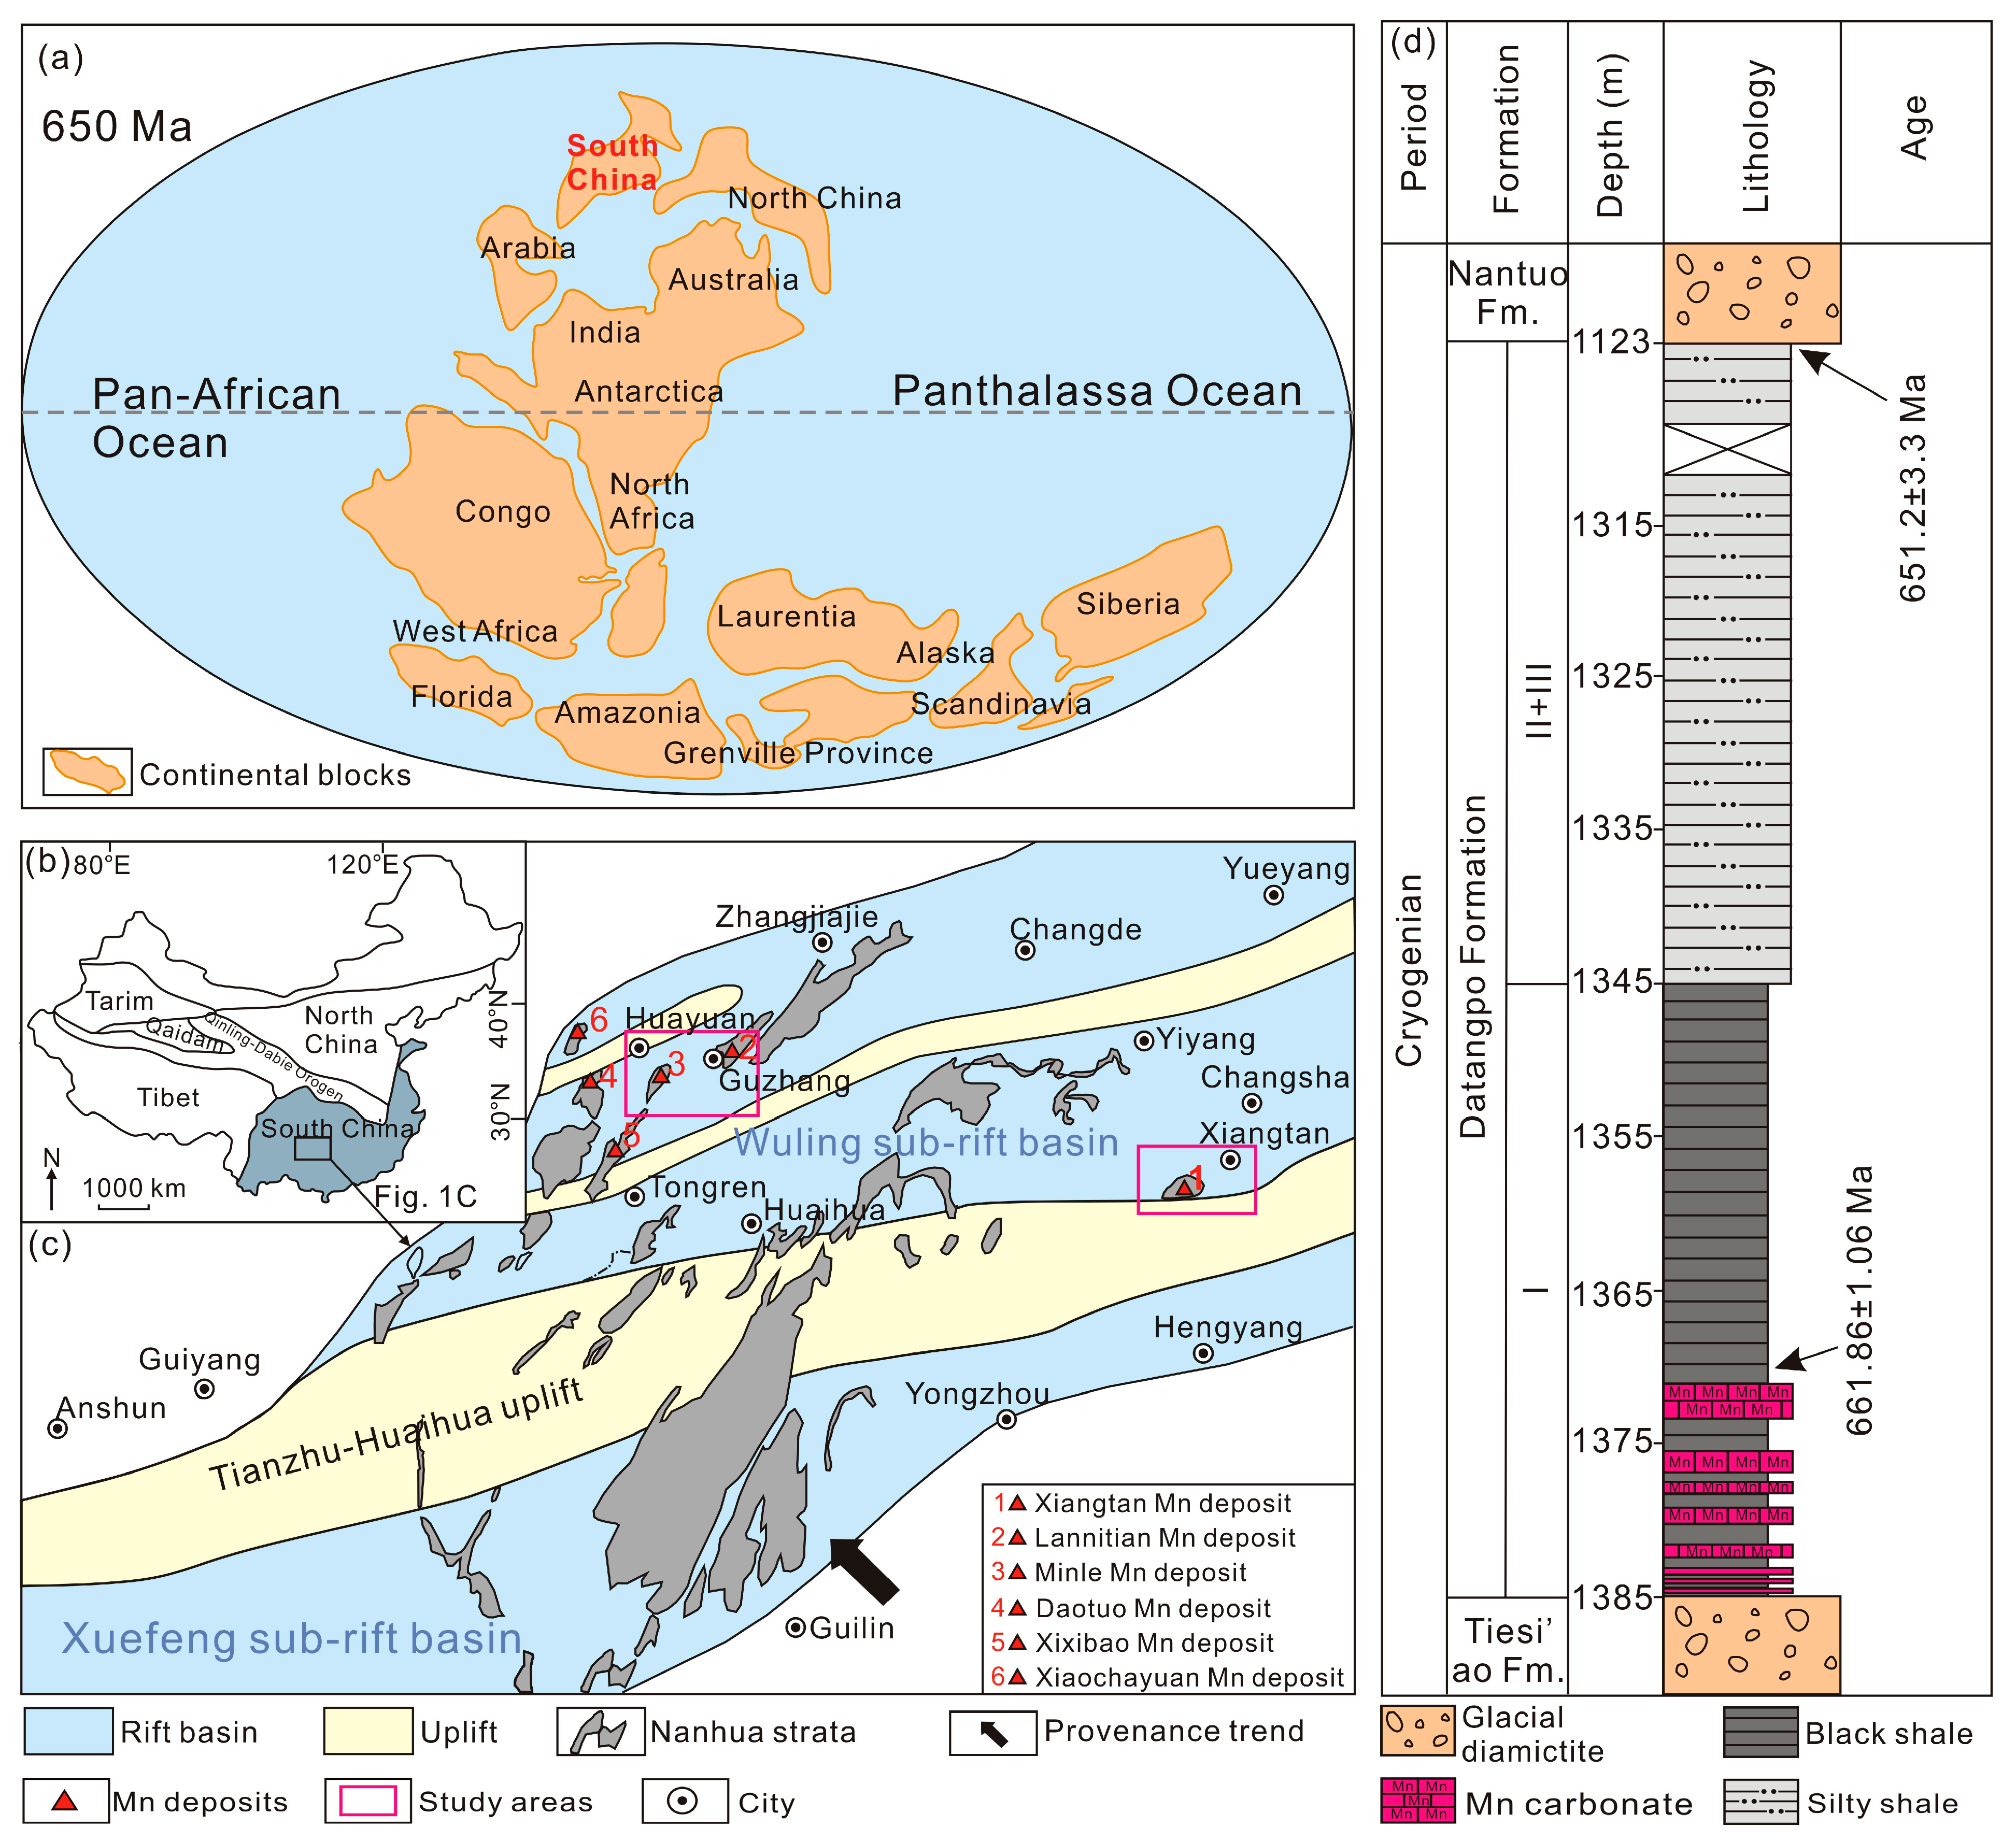
This study focuses on the Lannitian and Minle Mn deposits in western Hunan and the Xiangtan Mn deposit in central Hunan, all of which occur within fault-bounded depocenters of the Cryogenian Nanhua rift system along the southeastern margin of the Yangtze Block (Figure 1) [24]. Following the amalgamation of the Yangtze and Cathaysia blocks, breakup of Rodinia triggered regional extension and rifting along the southeastern margin of the South China Block [25,26]. Continued Cryogenian extension partitioned the Nanhua rift system into secondary rift basins, fault-controlled depressions, and intervening uplifts. This segmented architecture governed differential subsidence, accommodation development, stratigraphic thickness, and facies distribution, thereby controlling the localization and preservation of the Datangpo Mn-bearing succession. The Nanhua rift system comprises the Wuling and Xuefeng secondary rift basins (Figure 1c). The Wuling basin contains several fault-controlled depressions. Among these, the Songtao–Guzhang depression formed a major ore-hosting depocenter within the Guizhou–Hunan–Chongqing Mn metallogenic belt and localized Mn deposition in the Songtao, Huayuan, and Guzhang districts [14,17]. The Xiangtan Mn deposit in central Hunan also belongs to this regional metallogenic belt but occupies a more easterly palaeogeographic position (Figure 1c) [21].
The Nanhua succession records three principal depositional stages corresponding to the Sturtian glaciation, the interglacial Datangpo interval, and the Marinoan glaciation [17]. The Datangpo Formation, bracketed by lower and upper diamictite-bearing glacial successions, is the principal host of Cryogenian sedimentary Mn deposits in South China. The lower part of its first member comprises black shale, Mn-bearing carbonaceous shale, and stratiform Mn carbonate ore, grading upward into silty shale and siltstone [27]. Geochronological constraints place deposition of the lower Mn-bearing interval at ca. 661–659 Ma, whereas a tuffaceous horizon near the Datangpo–Nantuo boundary yields an age of 651.2 ± 3.3 Ma (Figure 1d) [27,28].
Figure 1. Paleogeographic, tectonic, and stratigraphic setting of the studied Mn deposits. (a) Global paleogeographic reconstruction at ca. 650 Ma, with the South China Block highlighted, modified from Scotese [29]; (b) major tectonic units of China, showing the location of the South China Block and the extent of the area shown in panel (c), modified from Yu et al. [18]; (c) locations of the three studied Mn deposits—(1) Xiangtan, (2) Lannitian, and (3) Minle—and three comparative Mn deposits—(4) Daotuo, (5) Xixibao, and (6) Xiaochayuan—within the Wuling sub-rift basin, together with the regional tectonic framework of the Nanhua Basin, modified from Zhou et al. [17]; (d) composite stratigraphic column of the Cryogenian succession in Hunan Province, showing the Datangpo Formation and the stratigraphic positions of the Mn-carbonate layers. Geochronological data are from Ma et al. [27] and Xu et al. [28].
Applsci 16 08590 g001

2.2. Geology of the Studied Deposits

The Lannitian Mn deposit is located in the Guzhang area of northwestern Hunan and represents an important sedimentary Mn deposit in western Hunan (Figure 1b,c). It lies within a NE-trending structural belt at the transition between the southeastern margin of the Upper Yangtze Block and the Xuefeng orogenic belt. The Guzhang–Jishou fault and associated NE-trending structures exerted a major control on the distribution of the Datangpo Mn-bearing succession [17]. Exposed strata include the Banxi Group, the Nanhua Tiesi’ao, Datangpo, and Nantuo formations, the Doushantuo and Dengying formations, and the lower Cambrian Niutitang Formation. Mn mineralization is confined to the black-shale interval of the first member of the Datangpo Formation, which comprises black shale, Mn-bearing shale, argillaceous dolostone, and Mn carbonate beds.
The Minle Mn deposit, near Huayuan at the western Hunan–eastern Guizhou boundary, is a representative Datangpo-type deposit in western Hunan [30]. It occurs in the eastern Wuling rift basin, where ore bodies are hosted by the black shale succession of the first member of the Datangpo Formation. The ore-bearing interval consists mainly of Mn carbonate ore, Mn-containing shales, and organic-rich black shale. Ore bodies are typically stratiform, stratiform-like, or lenticular and are conformable with the enclosing strata.
The Xiangtan Mn deposit in central Hunan occurs on the northern limb of the Xiannvshan anticline. Its ore-bearing Datangpo (Xiangmeng) Formation is bounded below by the Jiangkou or Tiesi’ao Formation and above by the Hongjiang or Nantuo Formation [31]. The succession comprises carbonaceous and organic-rich black shale, Mn-containing shales, and Mn carbonate ore. Compared with the western Hunan deposits, the ore-bearing interval is thinner and generally contains only one or two Mn carbonate layers.

3. Materials and Methods

3.1. Samples

A total of 21 Datangpo-type Mn deposit samples were collected from western and central Hunan, including 15 Mn ores and six Mn-containing shales. The samples were collected from three Mn deposits, including the Nanmuchong and Xiangtan Mn Mine Park areas of the Xiangtan deposit in central Hunan and the Lannitian and Minle deposits in western Hunan. Samples from the Xiangtan deposit include both outcrop and drill core samples. At Nanmuchong, samples were collected from exposed ore-bearing sections and drill cores, whereas samples from the Xiangtan Mn Mine Park area were obtained from hydrological drill cores. Because the ore bodies in the Xiangtan Mn Mine Park area have largely been mined out, the exposed ore horizons are incomplete. Samples from the Lannitian deposit were collected from exposed ore-bearing sections, whereas those from the Minle deposit were obtained from shallow drill cores. All samples were characterized by optical microscopy and scanning electron microscopy–energy-dispersive X-ray spectroscopy and analyzed for whole-rock major, trace, and rare earth element compositions.

3.2. Petrographic Analysis

Petrographic thin sections were prepared for optical microscopy. Fresh samples were cut, epoxy-impregnated, mounted on glass slides, and ground and polished to a final thickness of approximately 30 μm. Petrographic observations were performed under plane-polarized and cross-polarized transmitted light using a ZEISS Axio Imager A2m polarizing microscope at the Geological New Energy Research Center, Central South University, Changsha, Hunan, China.

3.3. Scanning Electron Microscopy–Energy-Dispersive X-Ray Spectroscopy (SEM–EDS) Analysis

Fifteen representative samples were selected for SEM–EDS analysis to examine mineral morphology, occurrence, and composition, including pyrite morphology and framboid size. Fresh blocks were cut perpendicular to bedding into approximately 1 cm × 2 cm sections, polished, cleaned with 3% HNO3, rinsed with distilled water, dried, and gold-coated. Samples were examined in backscattered-electron mode. Pyrite framboids were imaged at approximately 4000× magnification. Their diameters were calculated as the mean of the longest and shortest axes. At least 100 framboids were measured where possible, although some Mn ore samples contained fewer measurable grains. SEM–EDS analyses were performed using a TESCAN MIRA4 LMH scanning electron microscope equipped with an Oxford Instruments One Max 50 energy-dispersive X-ray spectrometer at Hunan Nano-Micro New Material Technology Co., Ltd., Changsha, Hunan, China.

3.4. XRD Analysis

X-ray diffraction (XRD) analyses were conducted following the petroleum and natural gas industry standard SY/T 5163–2018. Three representative samples were dried below 60 °C and powdered to <40 μm for bulk rock analysis. XRD patterns were collected using Cu Kα radiation over a 2θ range of 5–45°, with a step size of 0.02° and a scanning rate of 2° min−1. Mineral phases were identified by comparison with the ICDD Powder Diffraction File (PDF) database, and quantitative mineral contents were calculated using the K-value method described in SY/T 5163–2018 [32] based on background-corrected peak intensities and reference intensity values. For clay mineral analysis, carbonates were removed, and the <2 μm fraction was separated and prepared as oriented mounts. Air-dried, ethylene glycol-solvated, and heated patterns were used to identify clay mineral assemblages and estimate relative mineral abundances. XRD analyses were performed using a Rigaku SmartLab X-ray diffractometer at Beijing Oriental Oil Technology Company, Beijing, China.

3.5. Major, Trace, and Rare Earth Element Analyses

Major element concentrations were determined by wavelength-dispersive X-ray fluorescence spectrometry (WD-XRF) following GB/T 14506.28-2010 [33]. Fused glass beads were prepared from 0.6 g of sample and 6.0 g of Li2B4O7–LiBO2–LiNO3 flux at 1200 °C. The detection limits were 0.033 wt.% for SiO2, 0.030 wt.% for Al2O3, 0.028 wt.% for TFe2O3, 0.018 wt.% for MgO, 0.017 wt.% for CaO, 0.015 wt.% for K2O, 0.038 wt.% for Na2O, 0.012 wt.% for TiO2, 0.015 wt.% for MnO, and 0.012 wt.% for P2O5. Analyses were performed using a PANalytical Axios mAX WD-XRF spectrometer (PANalytical B.V., Almelo, The Netherlands).
Trace and rare earth elements were determined by inductively coupled plasma mass spectrometry (ICP–MS) following the Chinese national standard GB/T 14506.30–2010 [34]. Approximately 50 mg of the prepared whole-rock powder was digested in high-purity HNO3–HF at 190 °C for 48 h, evaporated to dryness, redissolved in HNO3, and diluted with 2% HNO3. Procedural blanks, duplicates, and reference materials BCR-2, BHVO-2, and AGV-2 were used for quality control. Analytical accuracy was better than 5%, and relative standard deviations were generally <3.5%. Analyses were performed using a NexION 300D ICP–MS.
Both analyses were conducted at Beijing Oriental Oil Technology Company, Beijing, China.
Elemental enrichment factors were calculated relative to post-Archean Australian shale (PAAS), using Al as the detrital reference:
XEF = (X/Al)sample/(X/Al)PAAS
REE and Y concentrations were normalized to PAAS values from Taylor and McLennan [35].
Eu* and (Ce/Ce*)SN were calculated as follows:
Eu* = Eun/(Smn × Gdn)0.5
(Ce/Ce*)SN = Cen/(Lan × Prn)0.5
where the subscript N denotes PAAS-normalized values, and SN denotes shale-normalized values.

4. Results

4.1. Lithological Characteristics

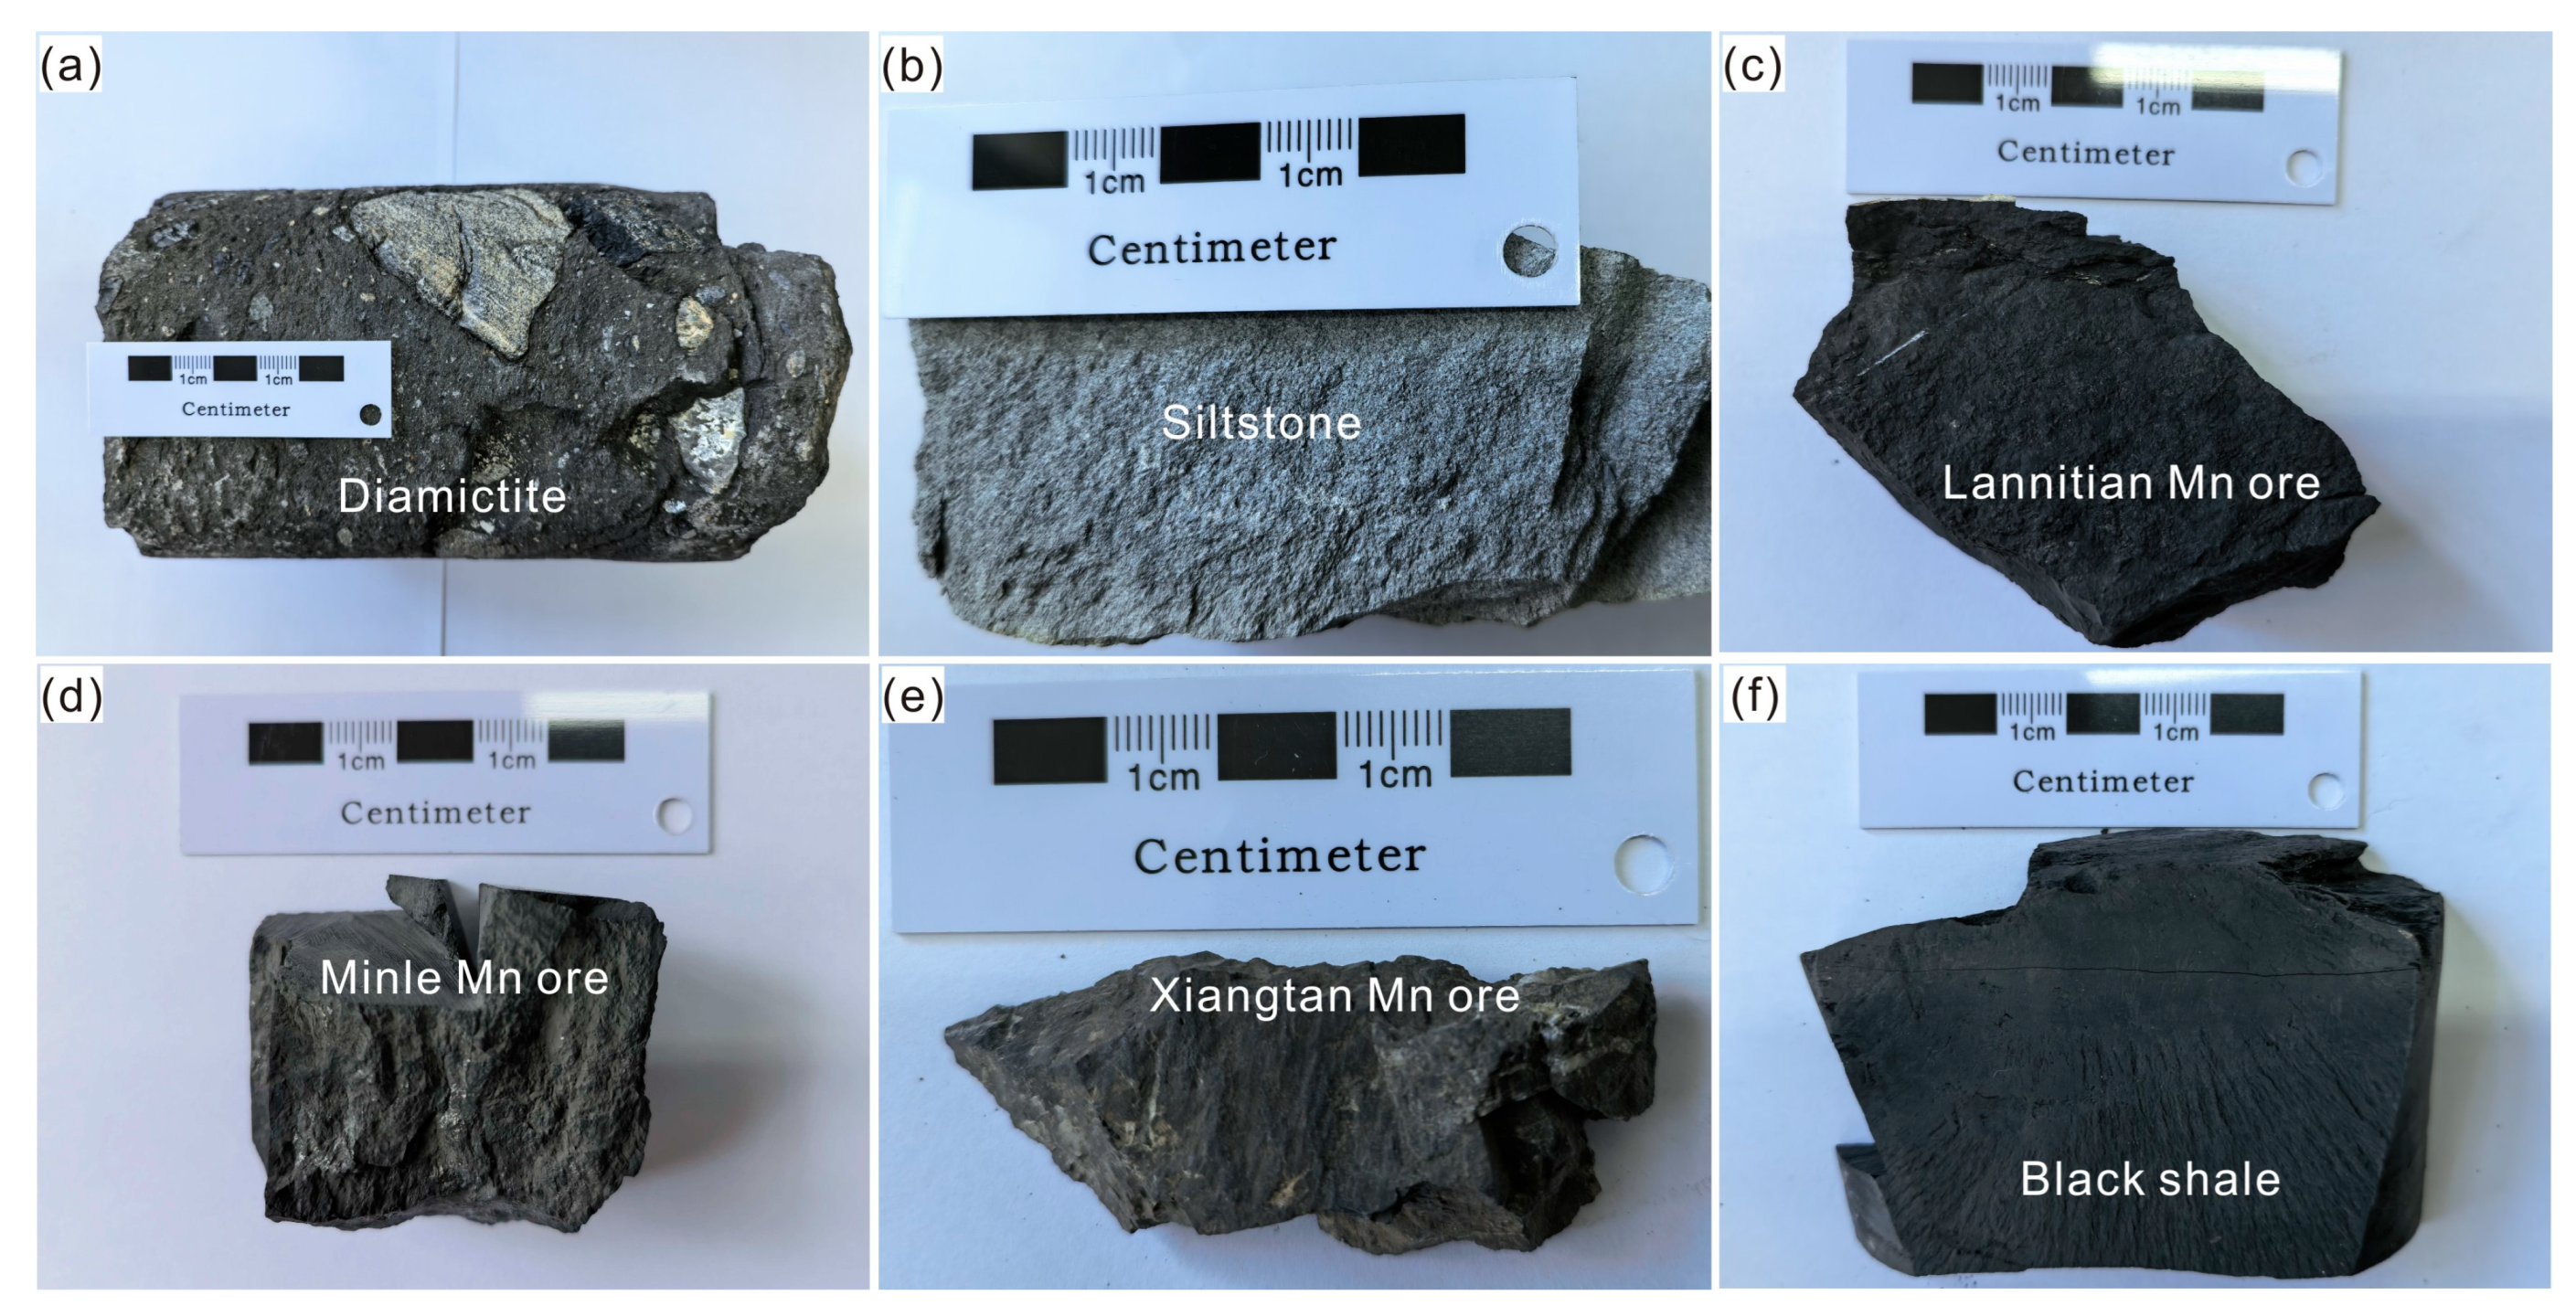
The Mn-bearing interval occurs in the lowermost part of the Datangpo Formation, immediately above the underlying Tiesi’ao Formation. The upper Tiesi’ao Formation consists predominantly of dark gray diamictite containing clasts of quartzite, slate, sandstone, siliceous rock, and chert (Figure 2a). Moving upward, the diamictite grades into gray siltstone, which is overlain by the Mn-bearing succession at the base of the Datangpo Formation (Figure 2b). The Mn ores from the Lannitian, Minle, and Xiangtan deposits are generally dark gray to black in hand specimens and commonly show compact or weakly laminated textures, with local thin carbonate veinlets (Figure 2c–e). The associated Mn-containing shales are also dark gray to black but are generally more homogeneous and finer-grained (Figure 2f). Because of their similar colors and appearances, the Mn ores and Mn-containing shales are not always readily distinguishable in hand specimens.
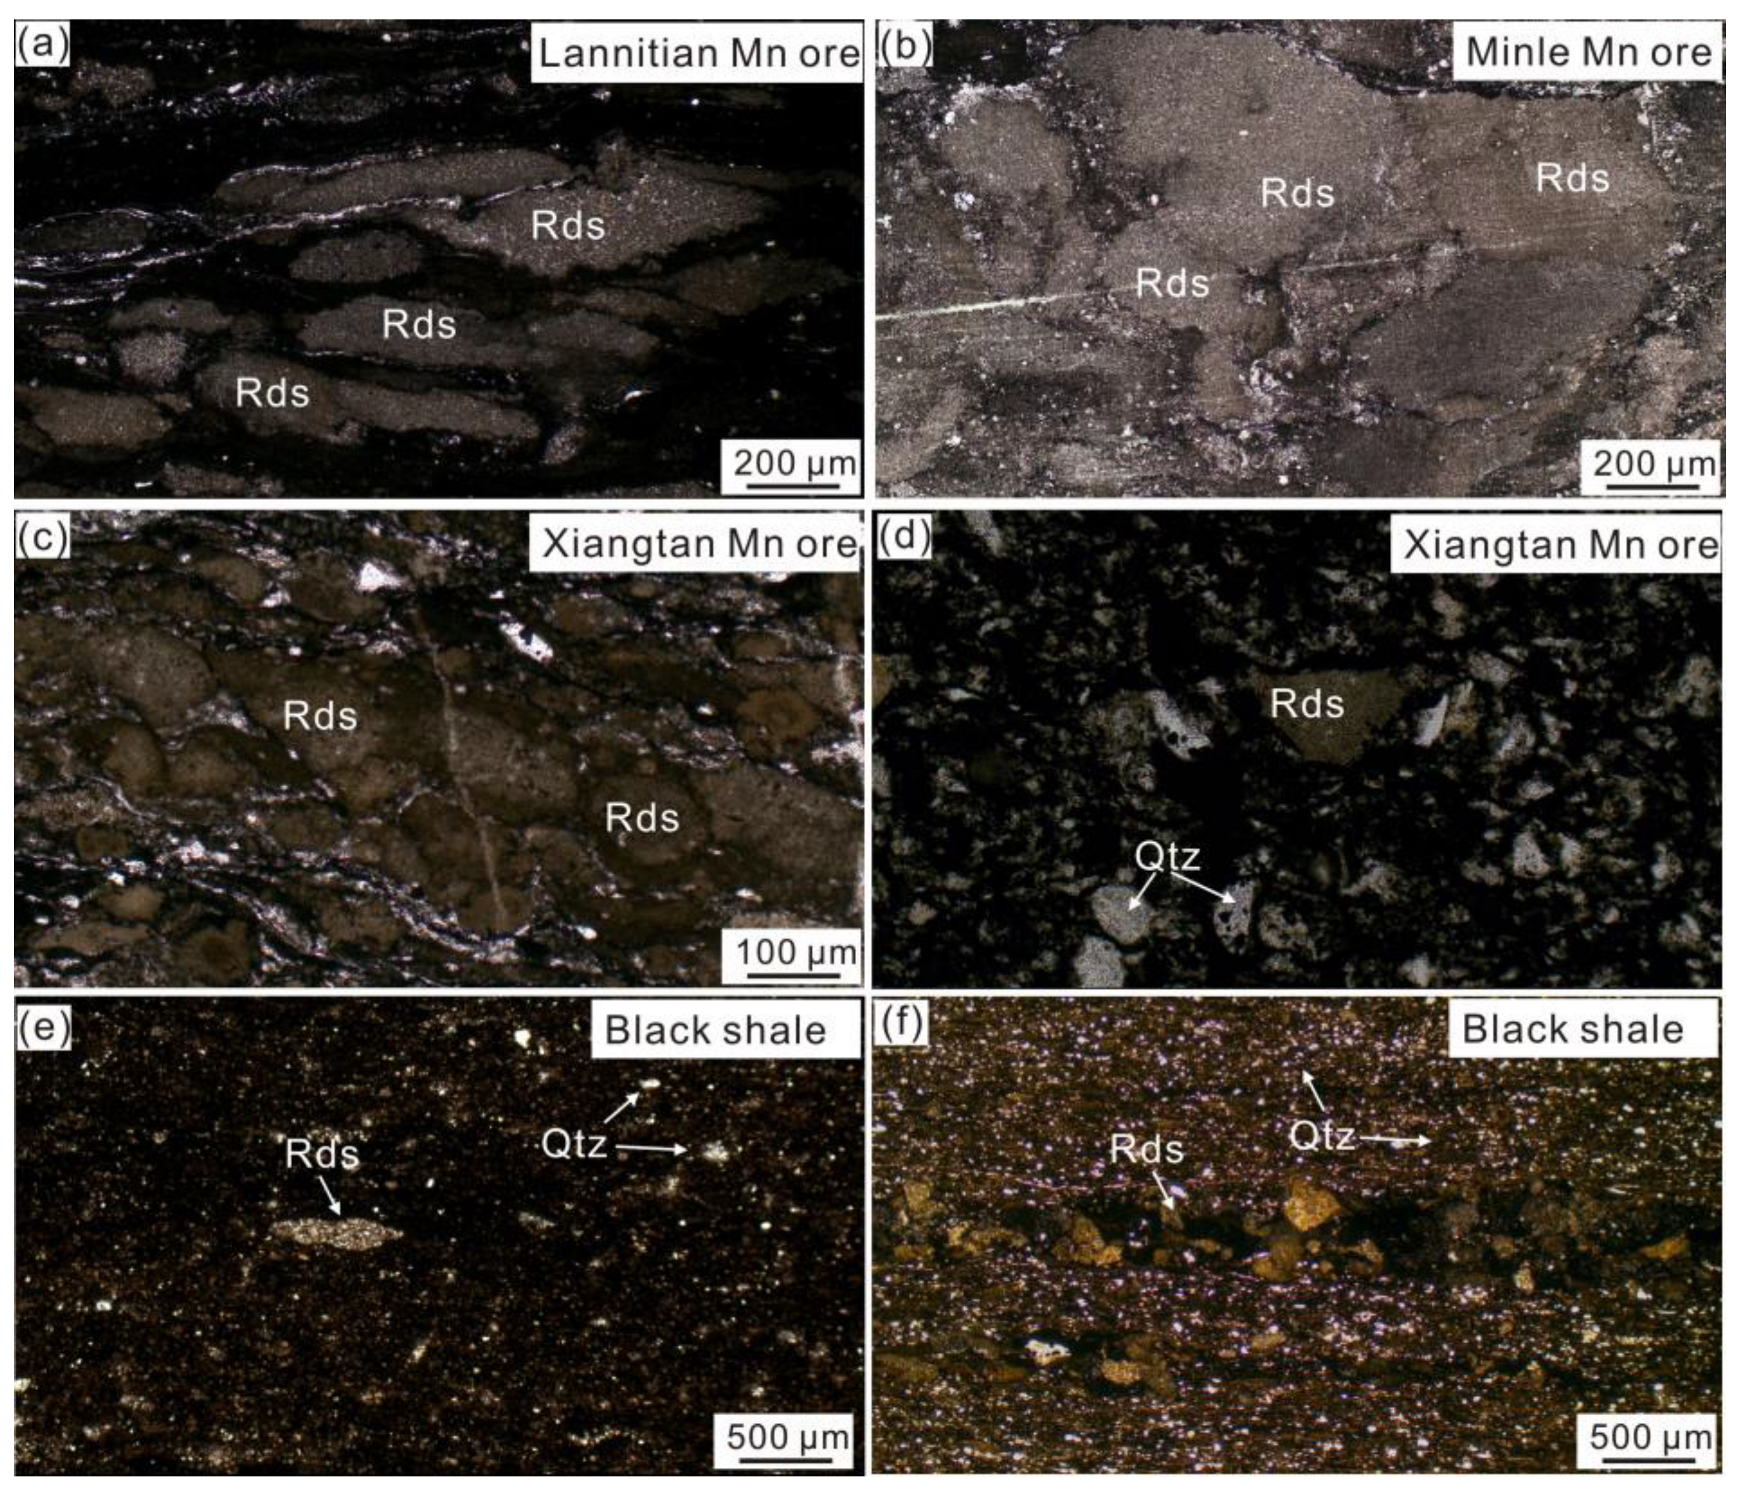
Thin-section observations show clear differences in mineral assemblages among Mn ores of different grades and Mn-containing shales (Figure 3). The high-grade Mn ores from the Lannitian and Minle deposits are characterized by abundant rhodochrosite aggregates. In the Lannitian ore, rhodochrosite occurs mainly as elongate to lenticular aggregates that are locally aligned into discontinuous bands (Figure 3a). In the Minle ore, abundant rounded to ellipsoidal rhodochrosite aggregates occur within a fine-grained matrix (Figure 3b). In the Xiangtan ores, the proportion of quartz becomes more apparent with decreasing Mn grade (Figure 3c,d). The medium-grade ore contains irregular to ellipsoidal rhodochrosite aggregates together with subordinate quartz in the matrix (Figure 3c), whereas the low-grade ore contains more conspicuous quartz among the rhodochrosite aggregates (Figure 3d). Compared with the Mn ores, the Mn-containing shales are dominated by a dark fine-grained matrix with abundant detrital quartz and only sparse rhodochrosite (Figure 3e,f).

4.2. Major Elements

The Lannitian Mn ores contain 11.3–20.4 wt.% MnO, with an average of 16.8 wt.% (Supplementary Table S1). The Minle Mn ores contain 13.1–30.3 wt.% MnO, with an average of 24.3 wt.%. The Xiangtan Mn ores show larger variations, ranging from 8.5 to 31.5 wt.% MnO, with an average of 18.5 wt.%. For comparison, samples with MnO > 20 wt.% are classified as high-grade Mn ores, samples with 10–20 wt.% as medium-grade Mn ores, and samples with MnO < 10 wt.% as low-grade Mn ores.
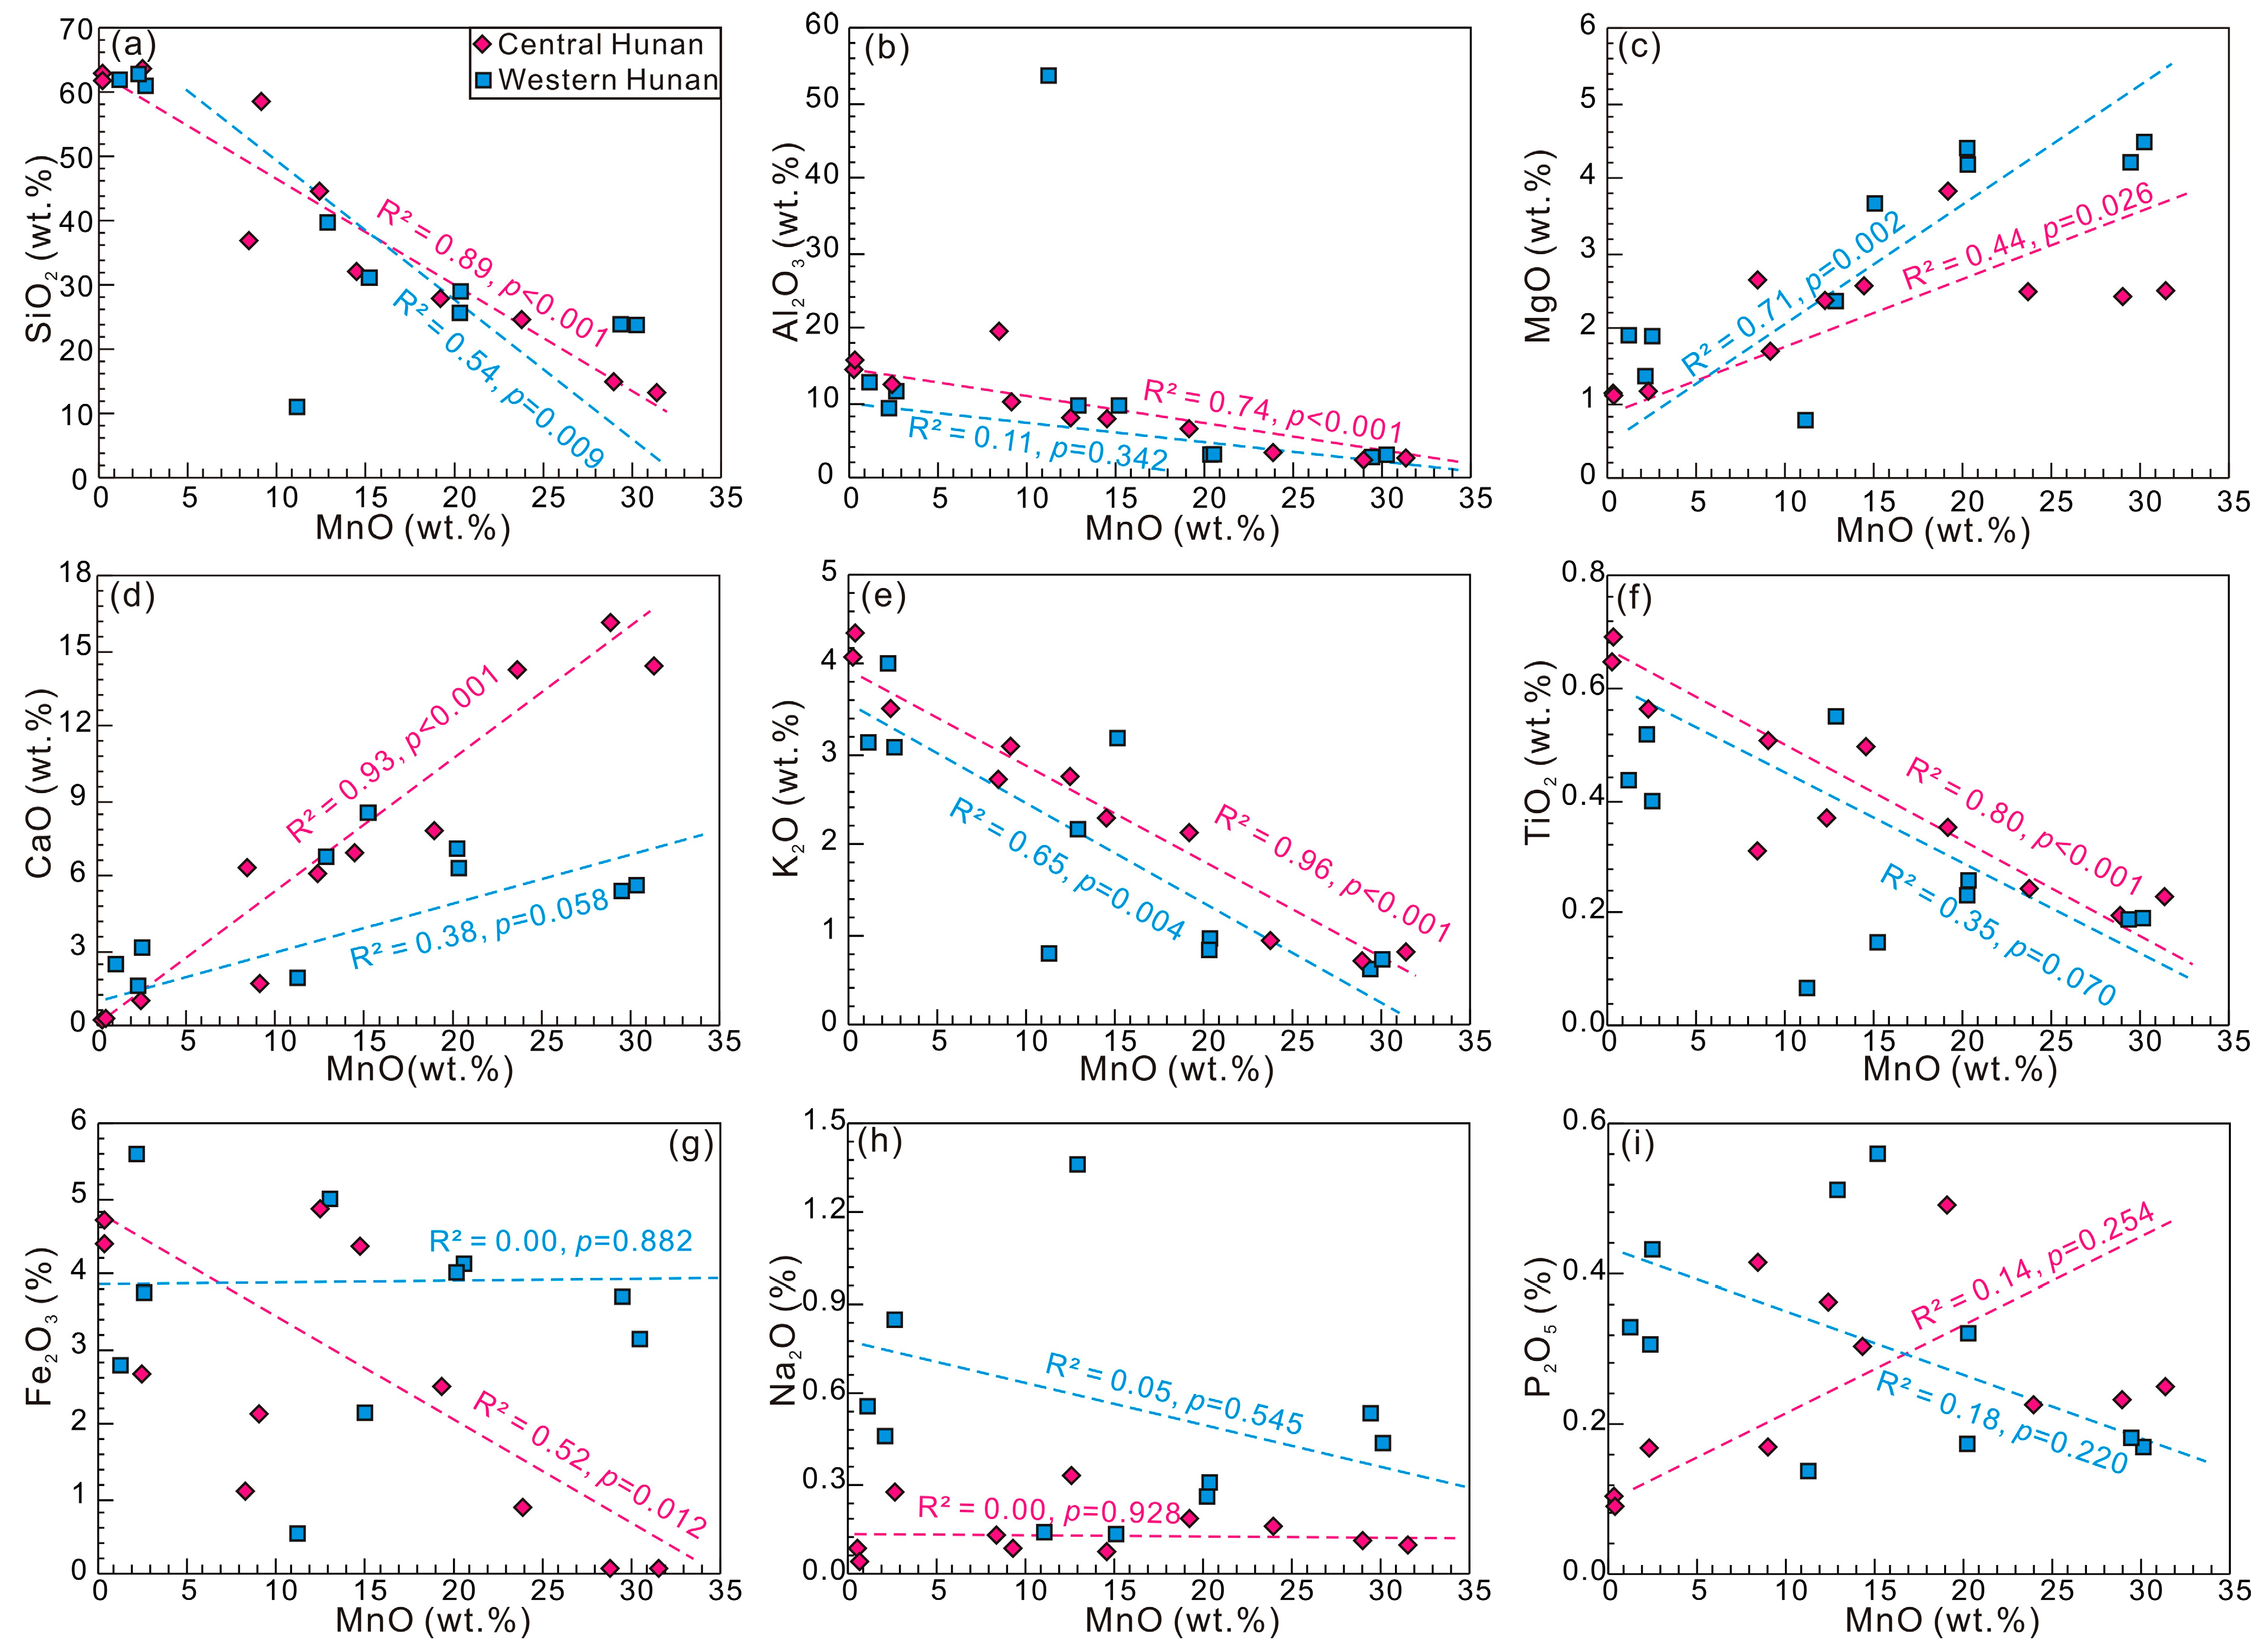
Samples from western and central Hunan show broadly similar major element trends (Figure 4). As MnO increases, SiO2, Al2O3, K2O, and TiO2 generally decrease (Figure 4a,b,e,f). The negative correlations are particularly clear for SiO2 and K2O in central Hunan, with R2 values of 0.89 and 0.96, respectively. Low-grade samples contain higher SiO2 and Al2O3, whereas high-grade samples contain much lower amounts of these components. K2O and TiO2 also decrease with increasing MnO, consistent with a greater contribution of terrigenous material to lower-grade Mn ores and Mn-containing shales. MnO is positively correlated with MgO (Figure 4c) and CaO (Figure 4d), with a particularly strong correlation between MnO and CaO in central Hunan (R2 = 0.93), suggesting that Mn enrichment is linked to higher carbonate-mineral abundances. However, the scattered MgO and CaO data indicate variable proportions of calcite, dolomite, and Mn-bearing dolomite across the samples. Fe2O3 shows a variable relationship with MnO (Figure 4g), whereas Na2O and P2O5 show no significant correlations with MnO in either region (Figure 4h,i).

4.3. Trace Elements

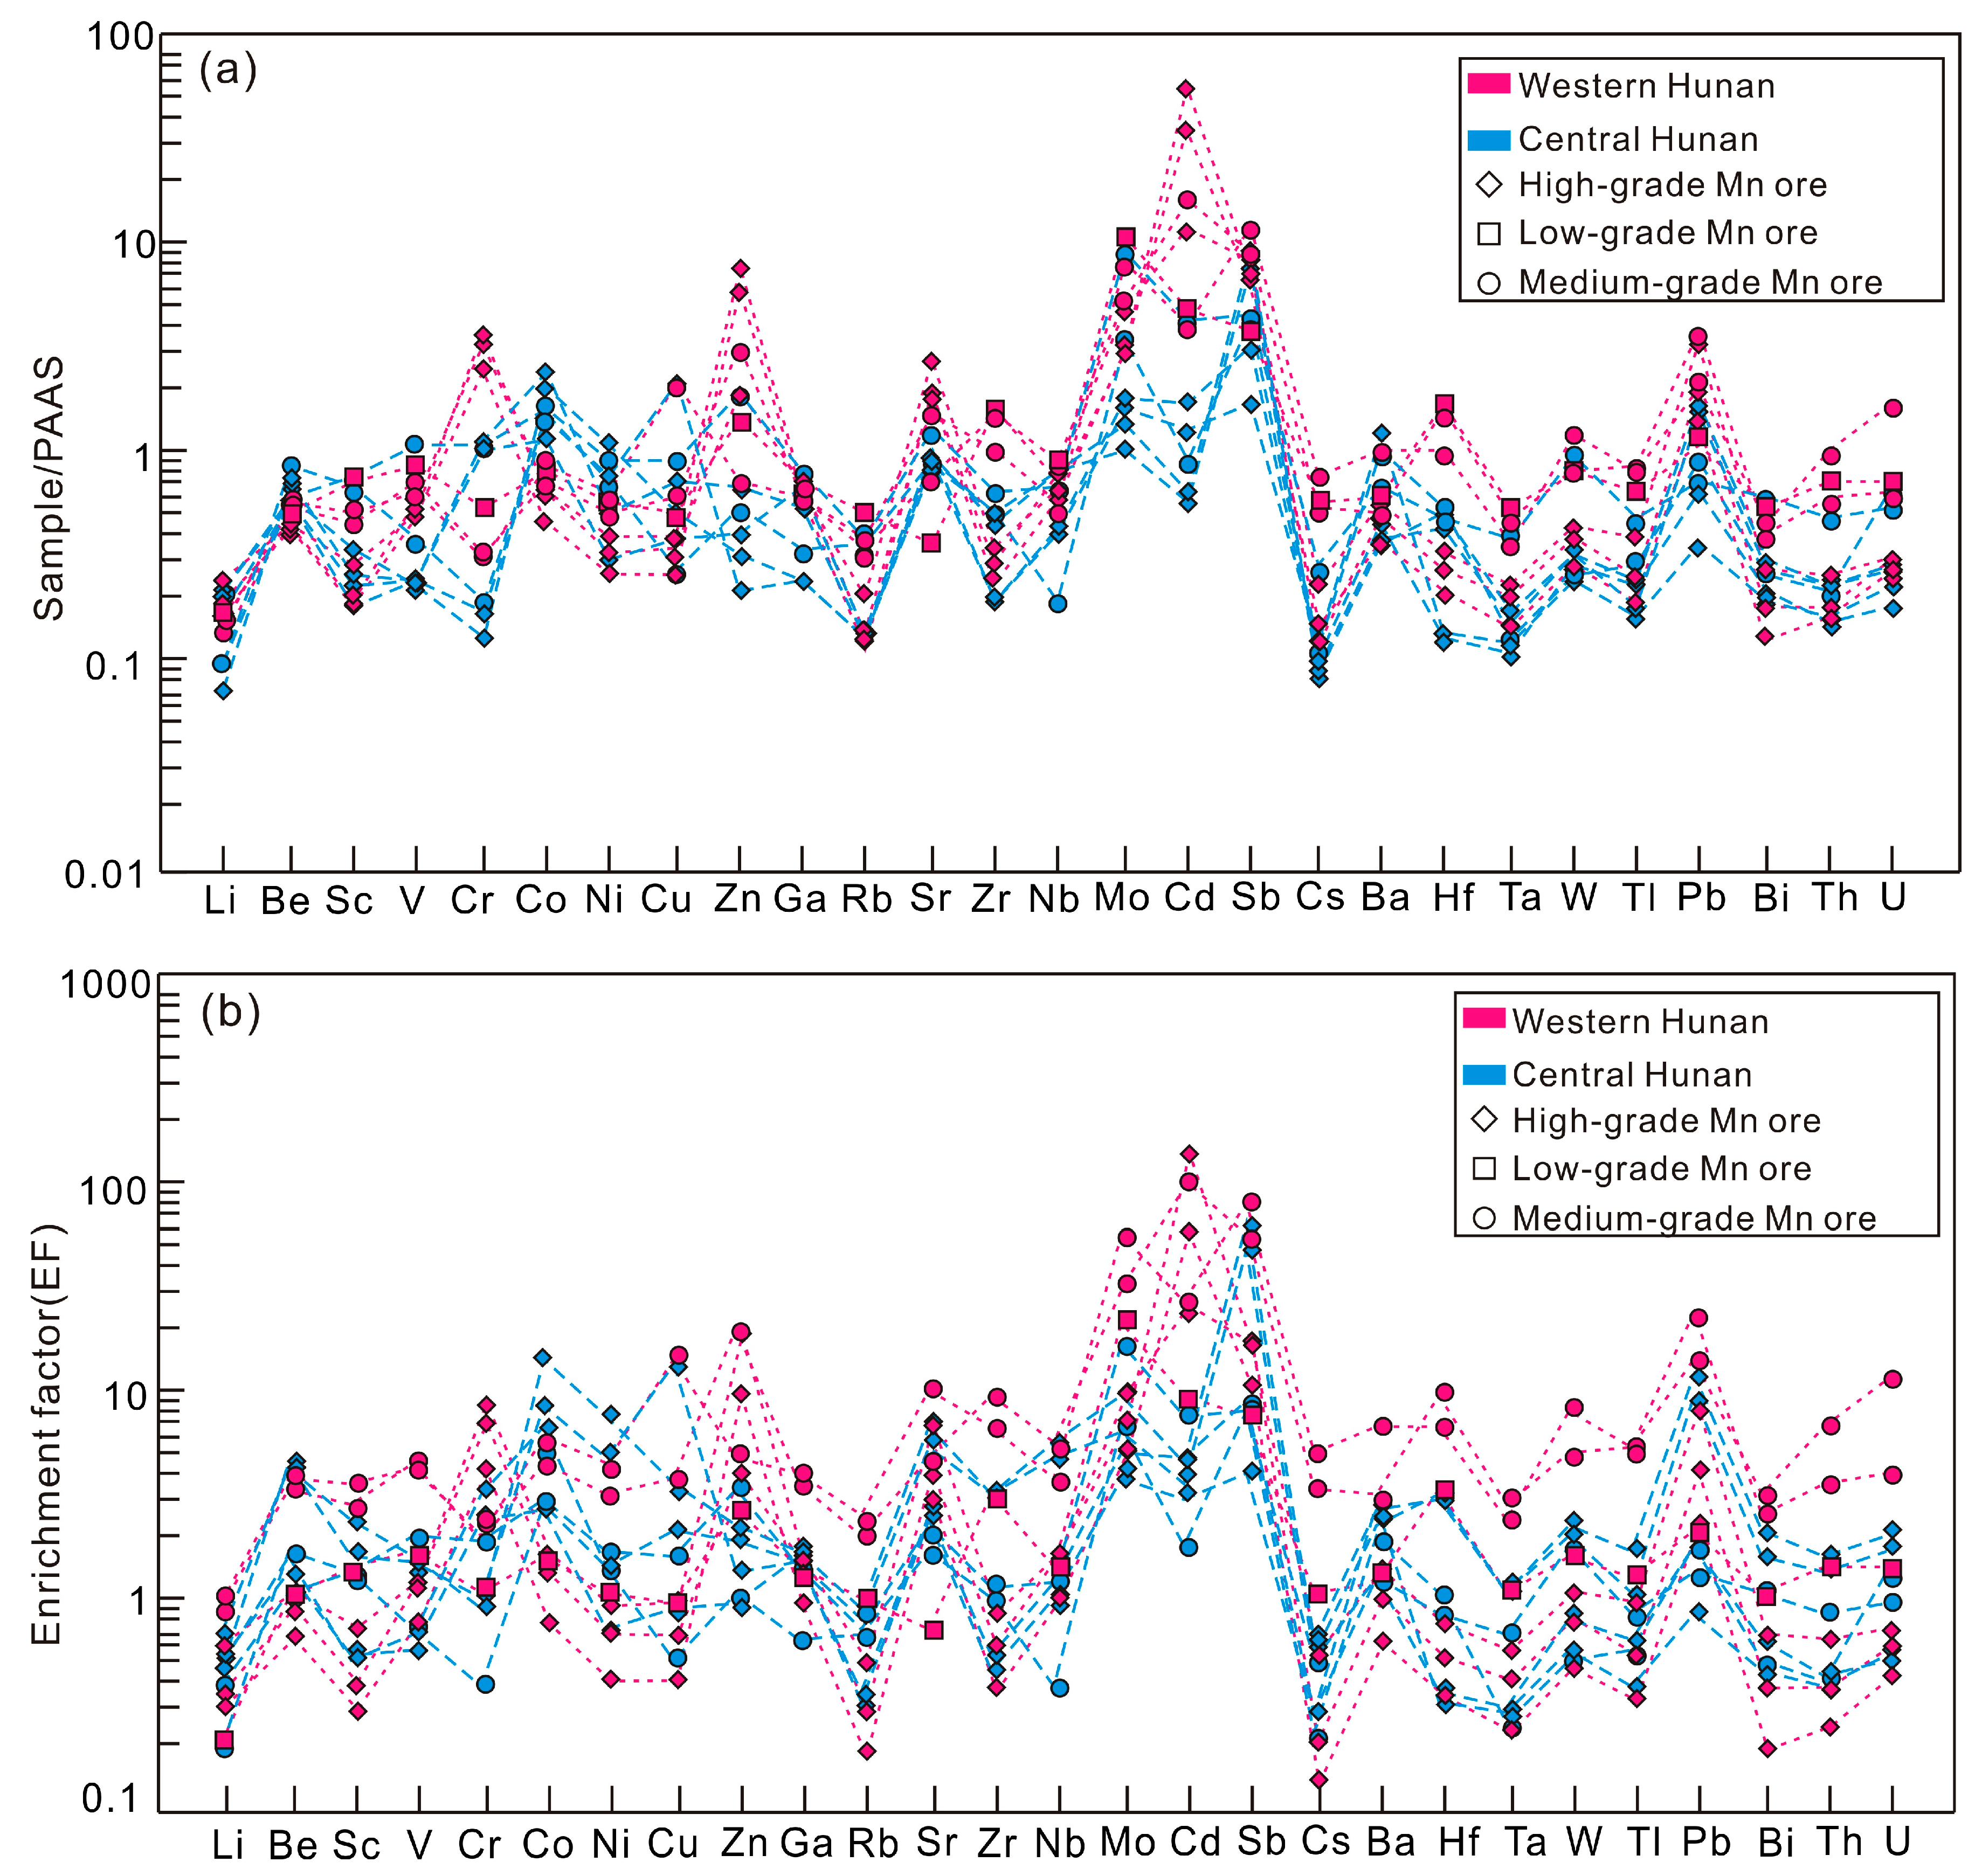
PAAS-normalized trace element patterns vary markedly among deposits and ore grades (Figure 5a). In western Hunan, the Lannitian and Minle samples show variable enrichments in Mo, Cd, Sb, Co, Y, Sr, Ba, and Zn. High-grade ores generally contain lower Rb, Cs, Th, Ta, Zr, and Hf, whereas medium-grade ores show higher and more variable contents of Mo, U, V, Ba, and other trace elements. The Minle black shale is relatively enriched in lithogenic elements, indicating stronger terrigenous input. In central Hunan, the Nanmuchong medium-grade ores contain elevated Mo, Sb, U, Rb, Th, Zr, and Hf, whereas the high-grade ores are relatively enriched in Cr, Zn, Cd, and Pb. Cu shows variable distribution and is locally enriched in the Nanmuchong ores. In particular, sample NMC-1 contains 106 ppm Cu and 41.1 ppm Pb, showing pronounced Cu enrichment and relatively elevated Pb. Low-grade ores and black shales from the Xiangtan Mn Mine Park contain high Rb, Cs, Th, Ta, Zr, and Hf, together with relatively high Ni, U, and W.
The enrichment factor patterns further confirm that Mo, Cd, Sb, Zn, and Cr are the most variably enriched elements, whereas Co, Y, Sr, Ba, and locally Cu show enrichments (Figure 5b). High-grade Mn ores are generally depleted in lithogenic elements such as Rb, Cs, Th, Ta, Zr, and Hf. Medium- and low-grade ores and black shales commonly retain stronger terrigenous signatures. However, the distributions of redox-sensitive and chalcophile elements do not vary uniformly with ore grade.

4.4. Rare Earth Elements

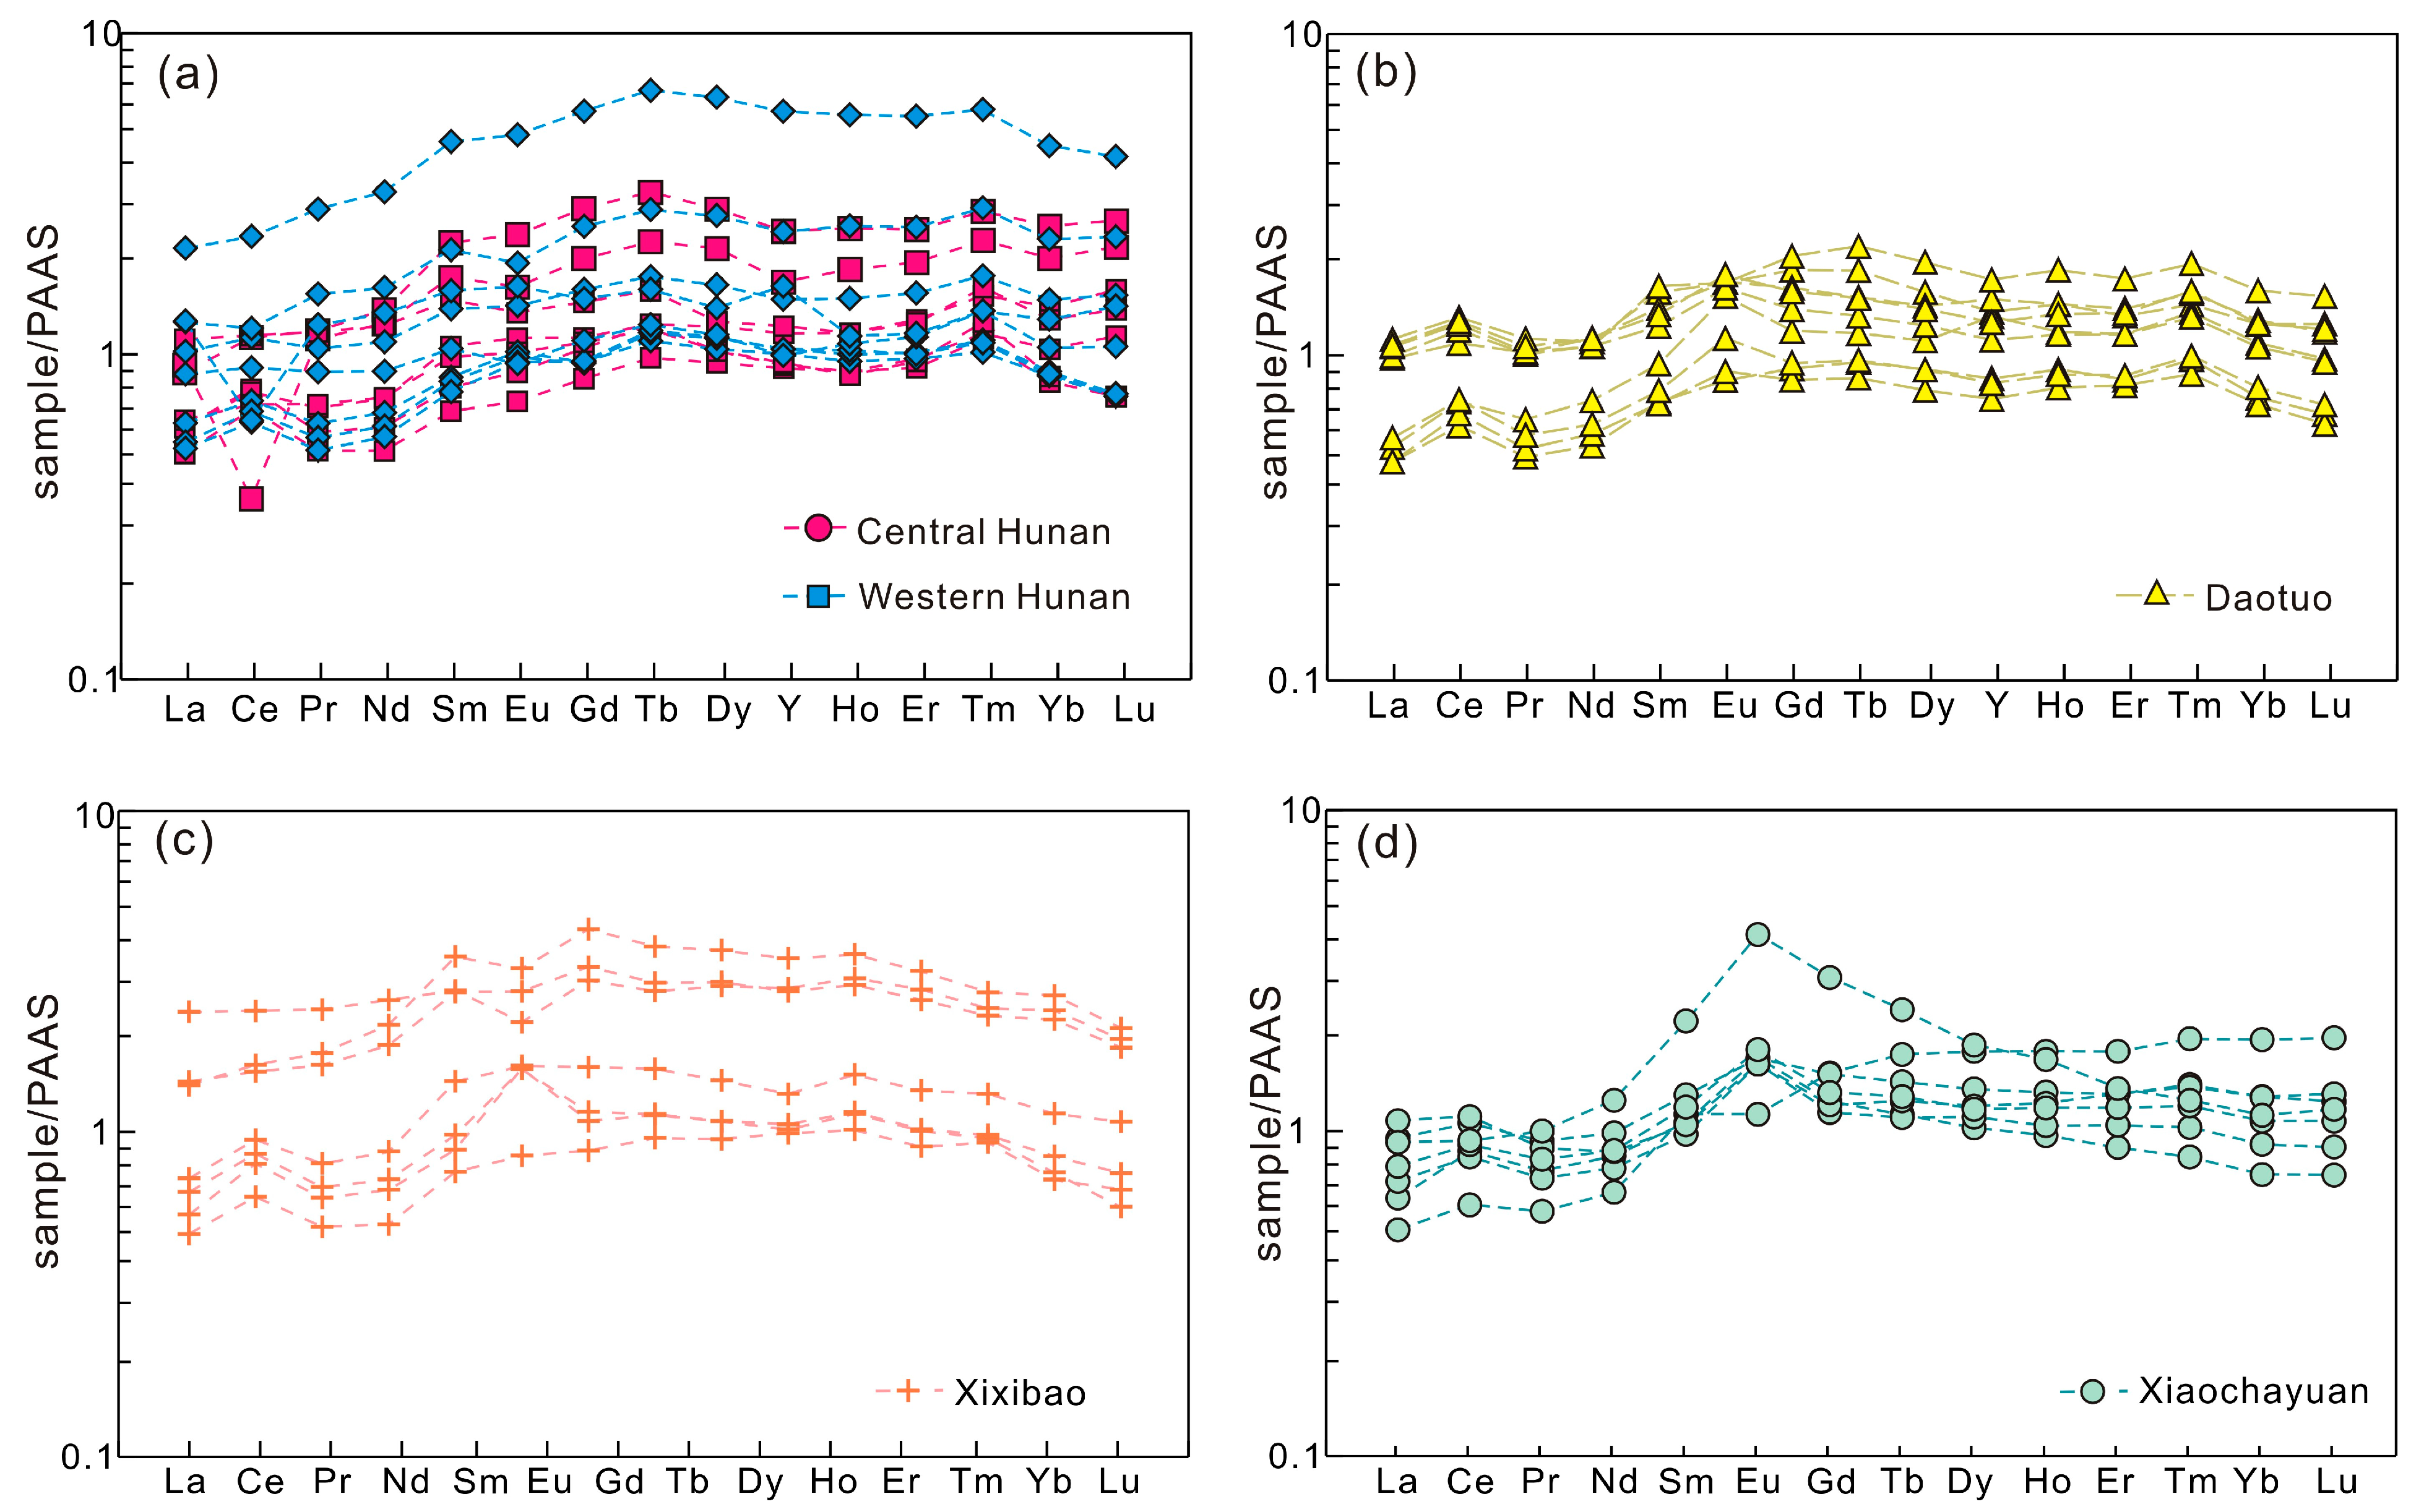
The Mn ores analyzed in this study from western and central Hunan show broadly similar PAAS-normalized REE–Y patterns, characterized mainly by MREE-enriched cap-shaped profiles (Figure 6a). Most samples have relatively low normalized abundances from La to Nd, followed by an increase toward Sm–Gd–Tb and a subsequent decrease or flattening toward the HREEs. The western Hunan Mn ores generally display relatively smooth cap-shaped patterns, although one sample shows markedly higher overall normalized REE–Y abundances than the others. The central Hunan Mn ores exhibit similar MREE enrichment but greater sample-to-sample variation in the relative abundances of individual REEs. Ce and Eu anomalies are generally weak in the Hunan Mn ores, and most samples show no pronounced Y anomaly. Published data from other coeval Mn deposits, including Daotuo, Xixibao, and Xiaochayuan (Figure 6b–d), likewise show predominantly MREE-enriched REE–Y patterns, although positive Ce anomalies are more evident in the Daotuo and Xixibao samples, whereas several Xiaochayuan samples display more pronounced positive Eu anomalies. Overall, the Hunan Mn ores show REE–Y patterns broadly similar to those of these coeval comparison deposits, although the magnitudes of the Ce and Eu anomalies differ among deposits. Quantitative REE–Y concentrations of the samples are provided in Supplementary Table S2.

4.5. Mineralogical Characteristics

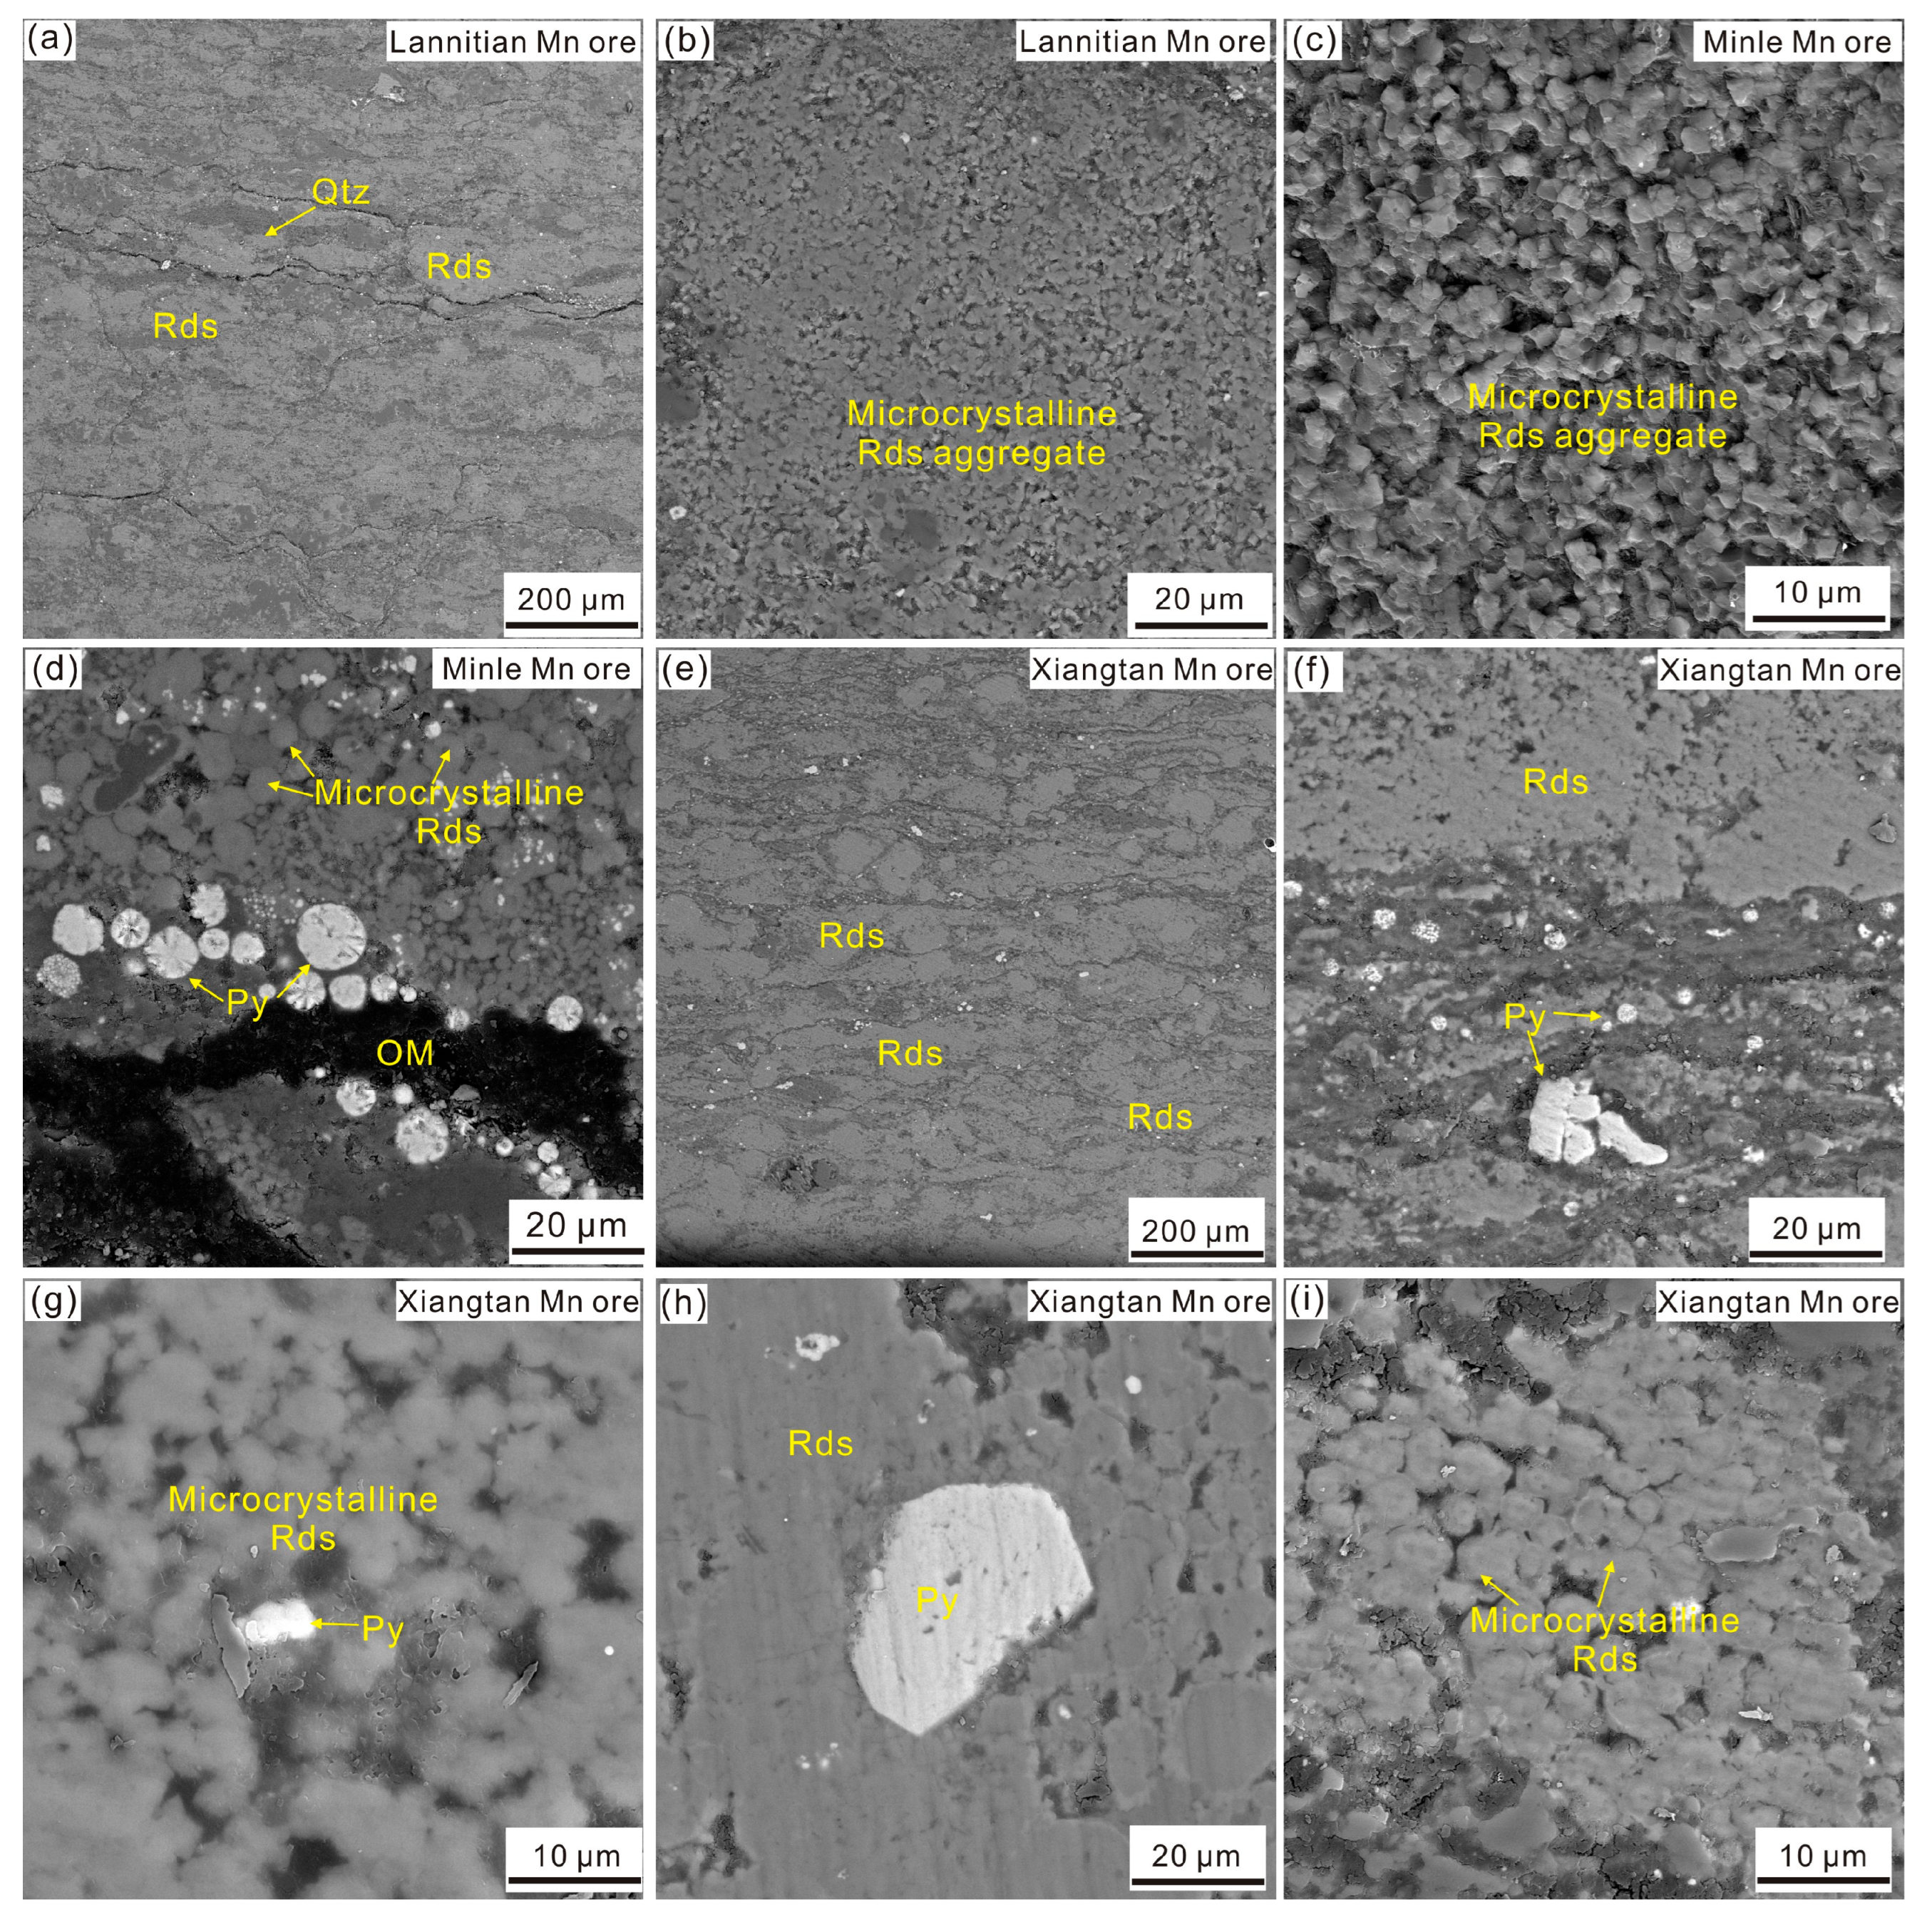
In the Lannitian Mn ore, rhodochrosite occurs as laterally continuous to irregular aggregates on the hundred-micrometer scale and is locally associated with quartz (Figure 7a), broadly consistent with the thin-section observations (Figure 3a). At higher magnification, these aggregates exhibit a compact fine-grained texture composed of closely packed rhodochrosite grains (Figure 7b). The Minle Mn ore more clearly reveals the internal characteristics of fine-grained rhodochrosite (Figure 7c,d). Figure 7c was obtained from a natural fracture surface, where numerous closely packed individual rhodochrosite grains can be distinguished. These grains are generally irregular to subhedral in outline and are tightly intergrown to form aggregates. In the polished section, rhodochrosite appears as closely packed rounded to irregular grain sections (Figure 7d). Pyrite also occurs within and adjacent to the fine-grained rhodochrosite and is locally concentrated near organic matter.
Fine-grained rhodochrosite aggregates are also widely developed in the Xiangtan Mn ores (Figure 7e–i). Low-magnification images show irregular rhodochrosite-rich domains within the ores (Figure 7e), whereas higher-magnification images reveal that these domains consist of closely packed fine-grained rhodochrosite (Figure 7g,i). Pyrite displays several modes of occurrence. Fine-grained pyrite and pyrite aggregates occur locally within or adjacent to the rhodochrosite-rich domains (Figure 7f,g), whereas coarser subhedral to irregular pyrite grains occur as isolated grains within the rhodochrosite matrix (Figure 7f,h).
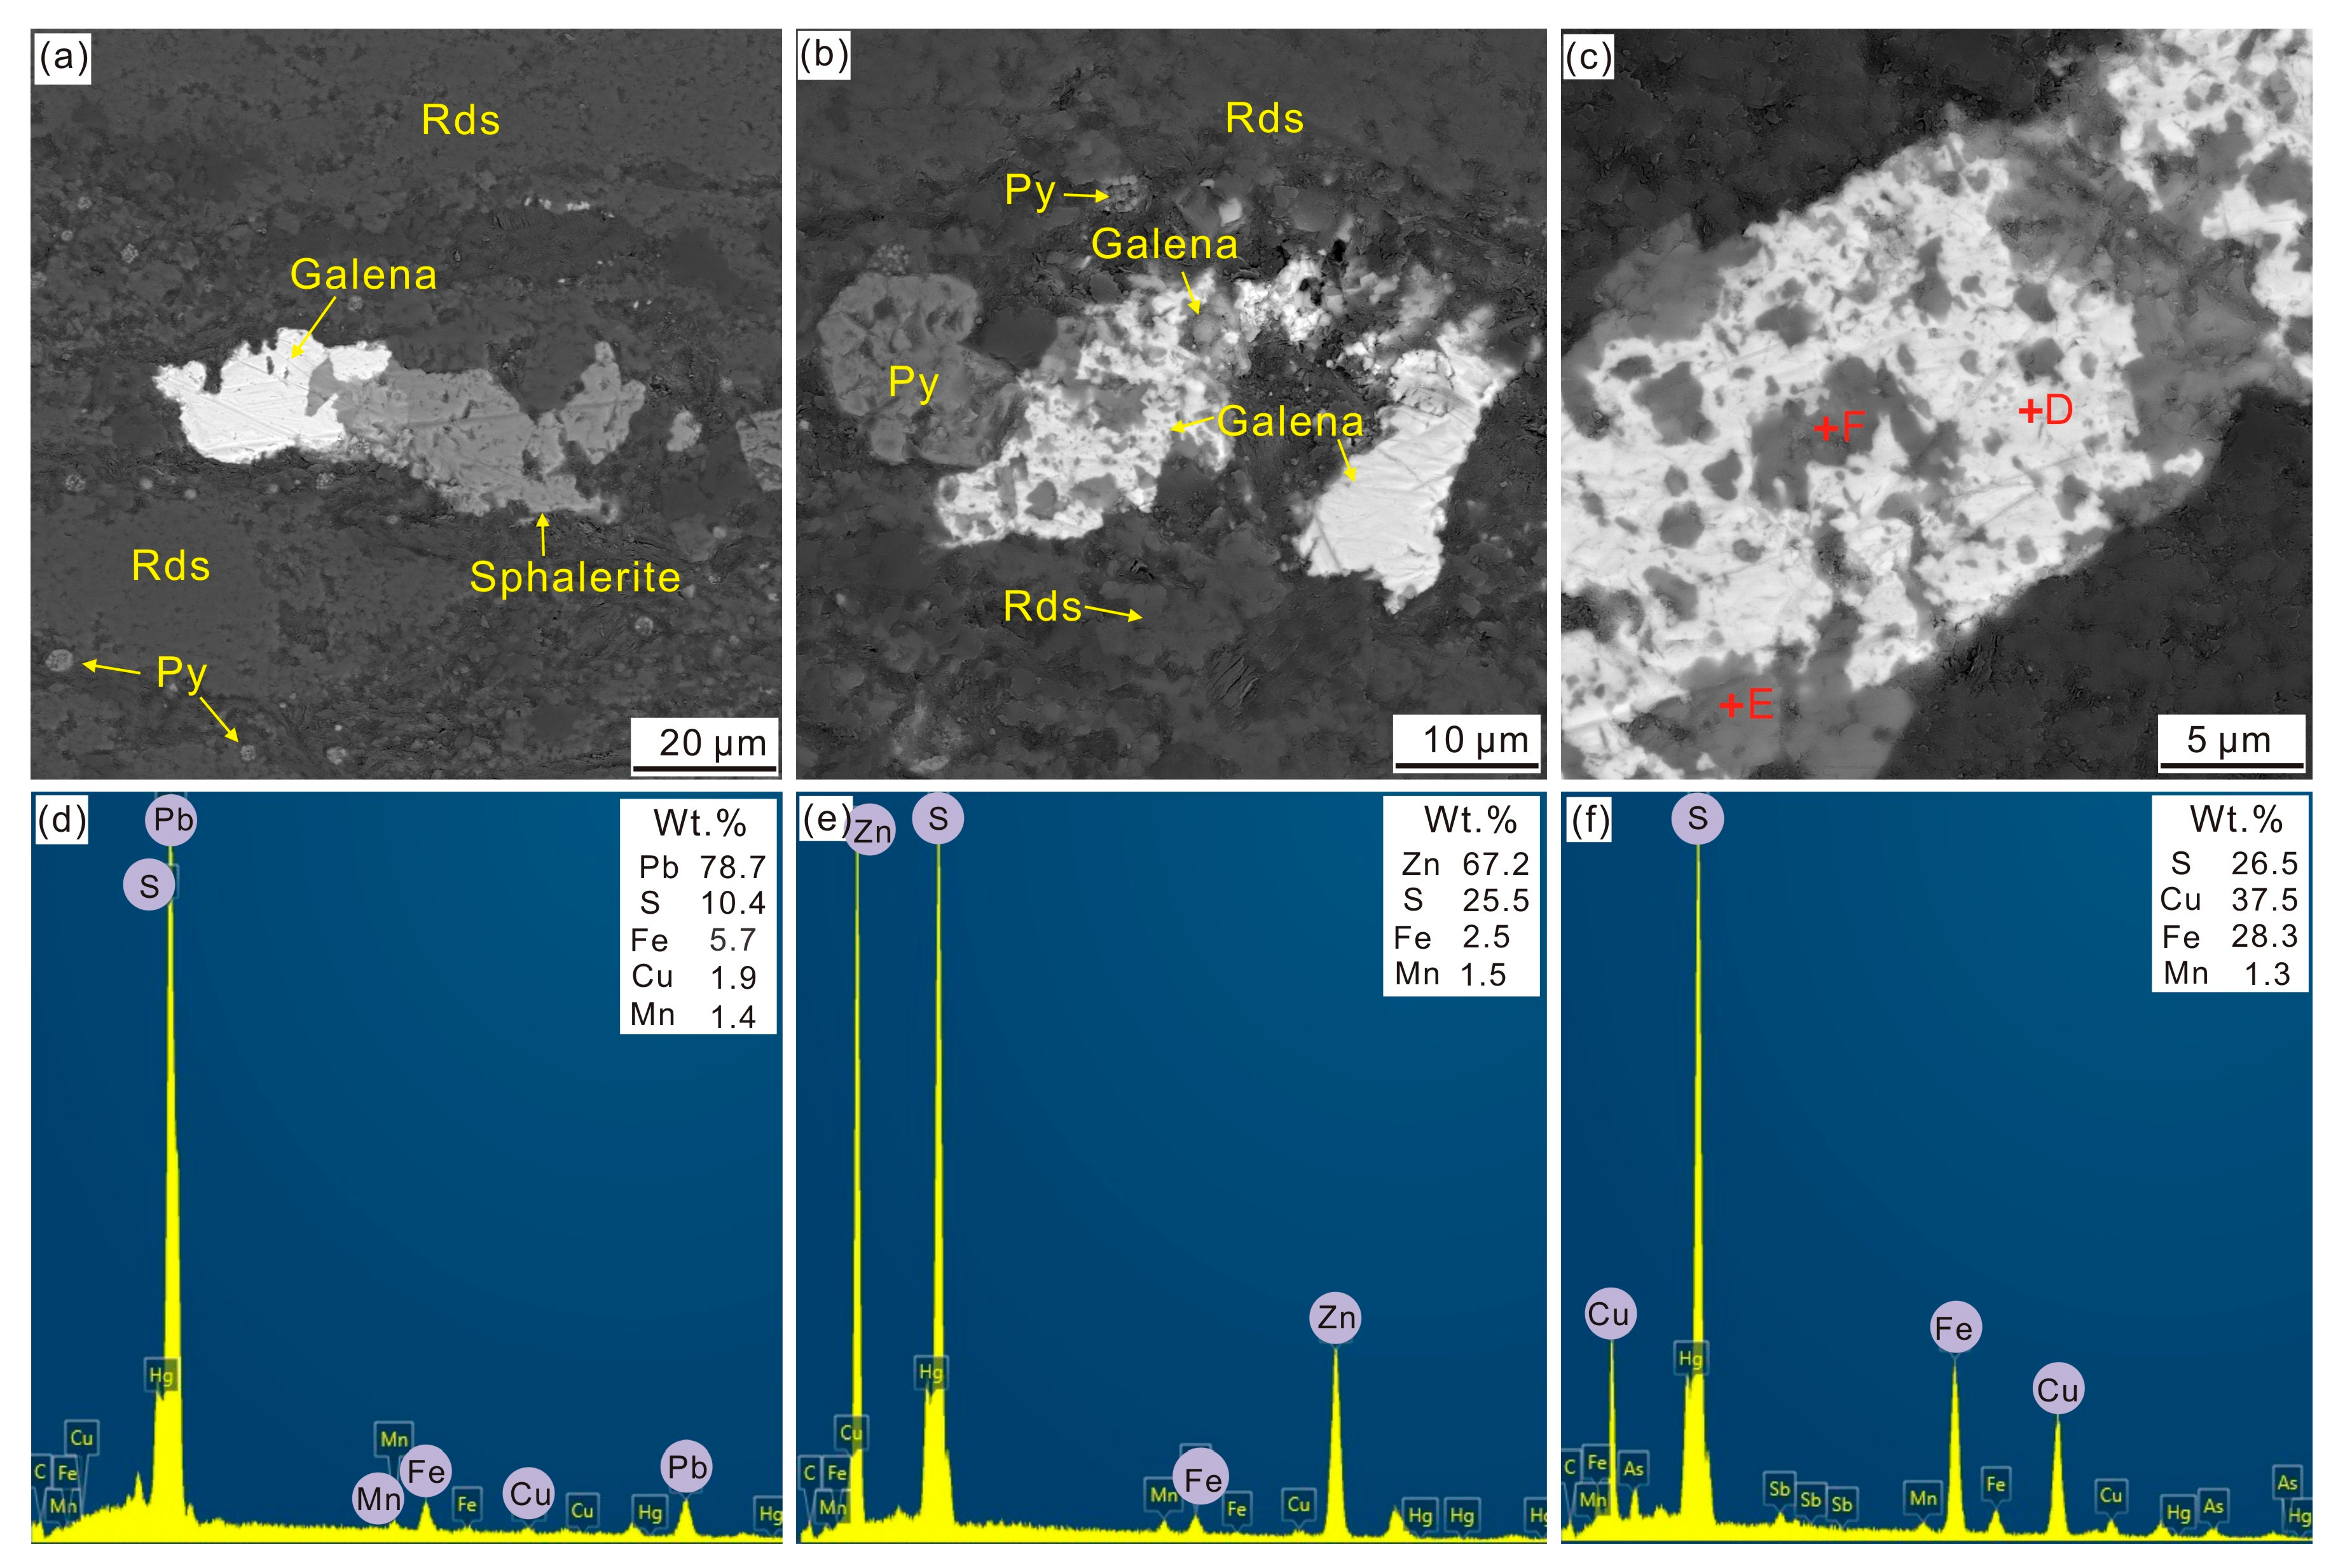
In addition to the common mineral phases described above, EDS spot analyses of representative grains in the medium-grade Mn ore sample NMC-1 from the Nanmuchong mining area of the Xiangtan Mn deposit identify galena, sphalerite, and Cu–Fe sulfides (Figure 8d–f). SEM–BSE images show that these sulfides occur mainly as irregular grains or small aggregates within the rhodochrosite matrix and are surrounded by rhodochrosite, forming close spatial contacts with the surrounding carbonate (Figure 8a–c). Some sulfide grains occur adjacent to or in direct contact with one another, locally forming sulfide aggregates composed of galena, sphalerite, and Cu–Fe sulfides, whereas rhodochrosite occurs around and between these sulfide grains. Contacts between the different sulfides and the surrounding rhodochrosite are generally irregular. Galena is readily distinguished by its high BSE brightness, whereas sphalerite and Cu–Fe sulfides commonly occur nearby, with pyrite also locally present. These unusual sulfide phases were not observed in the other samples examined in this study.
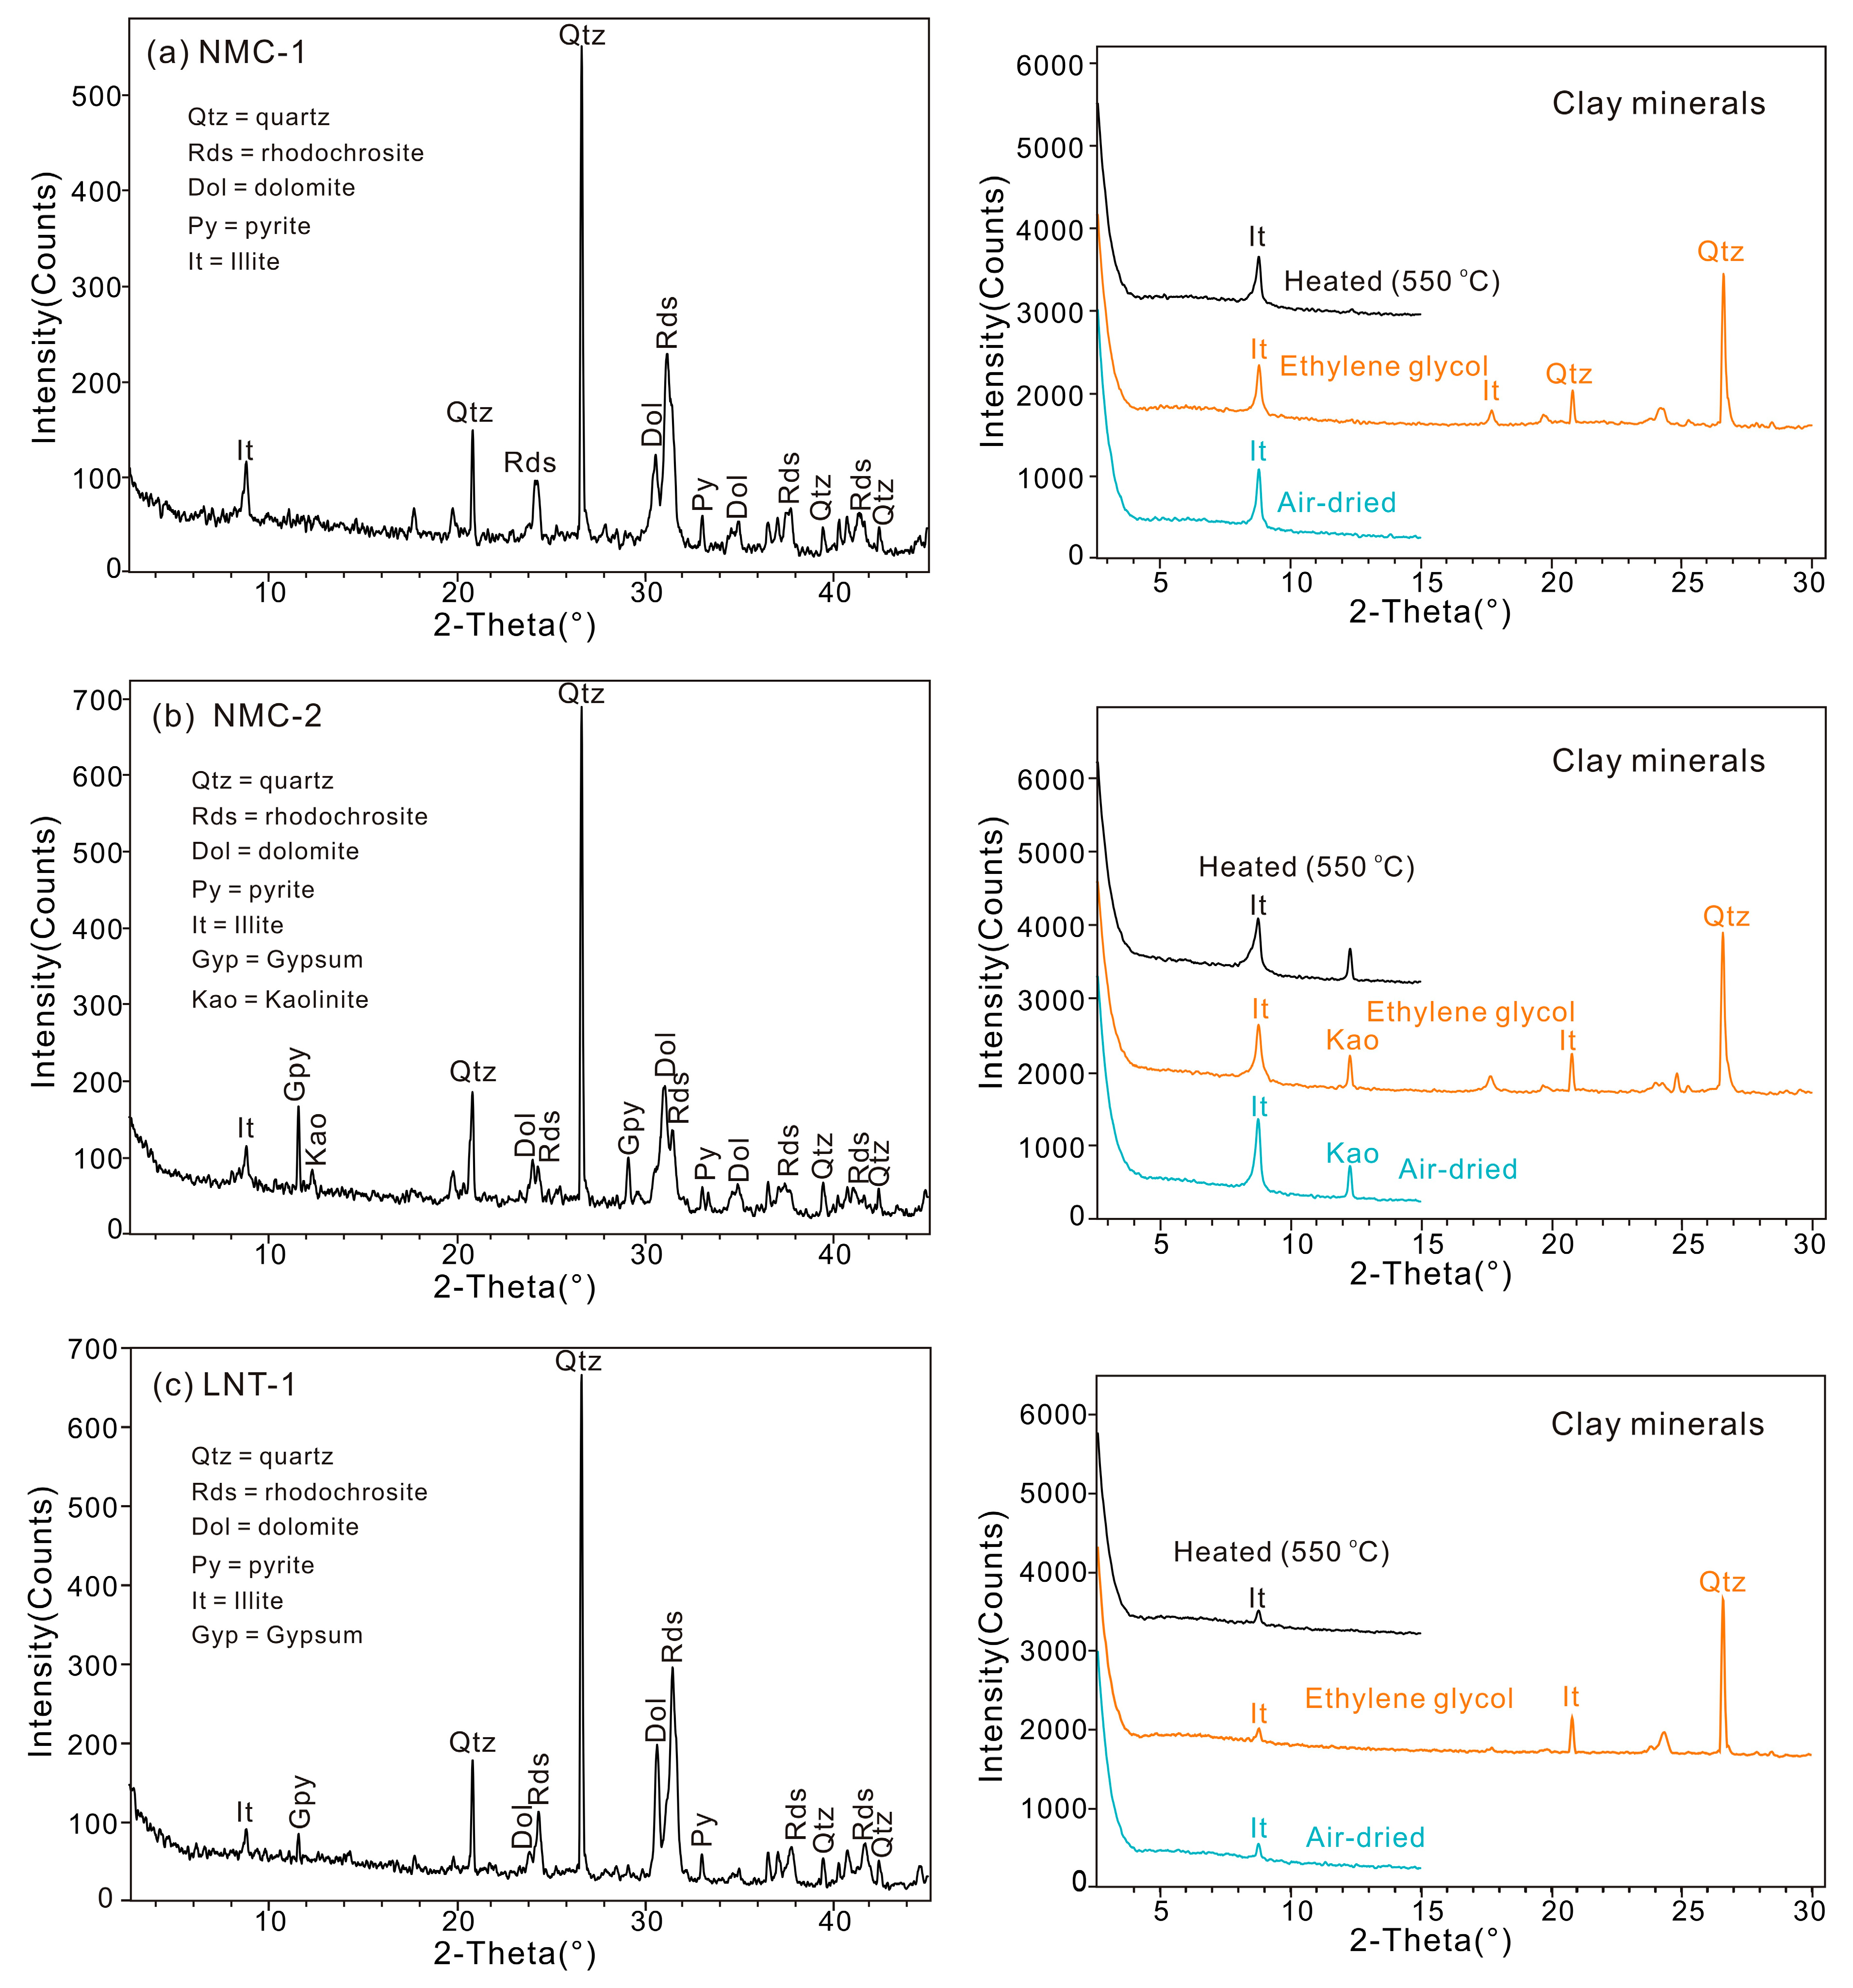
Bulk-rock XRD analysis shows that all three samples are composed mainly of quartz, rhodochrosite, dolomite, and clay minerals, with minor pyrite (Figure 9; Table 1). The high-grade western Hunan sample LNT-1 (MnO = 20.33 wt.%) contains the highest proportion of rhodochrosite and the lowest proportion of clay minerals, together with minor gypsum. The medium-grade Xiangtan sample NMC-1 (MnO = 19.29 wt.%) contains slightly less rhodochrosite but the highest proportion of clay minerals, as well as minor K-feldspar and plagioclase. The medium-grade Xiangtan sample NMC-2 (MnO = 14.52 wt.%) contains the lowest proportion of rhodochrosite and the highest proportion of dolomite, together with minor gypsum. Oriented XRD analysis shows that illite dominates the clay mineral assemblages of all three samples, whereas NMC-2 additionally contains mixed-layer illite–smectite and kaolinite (Table 2).

4.6. Pyrite Types and Framboid Size

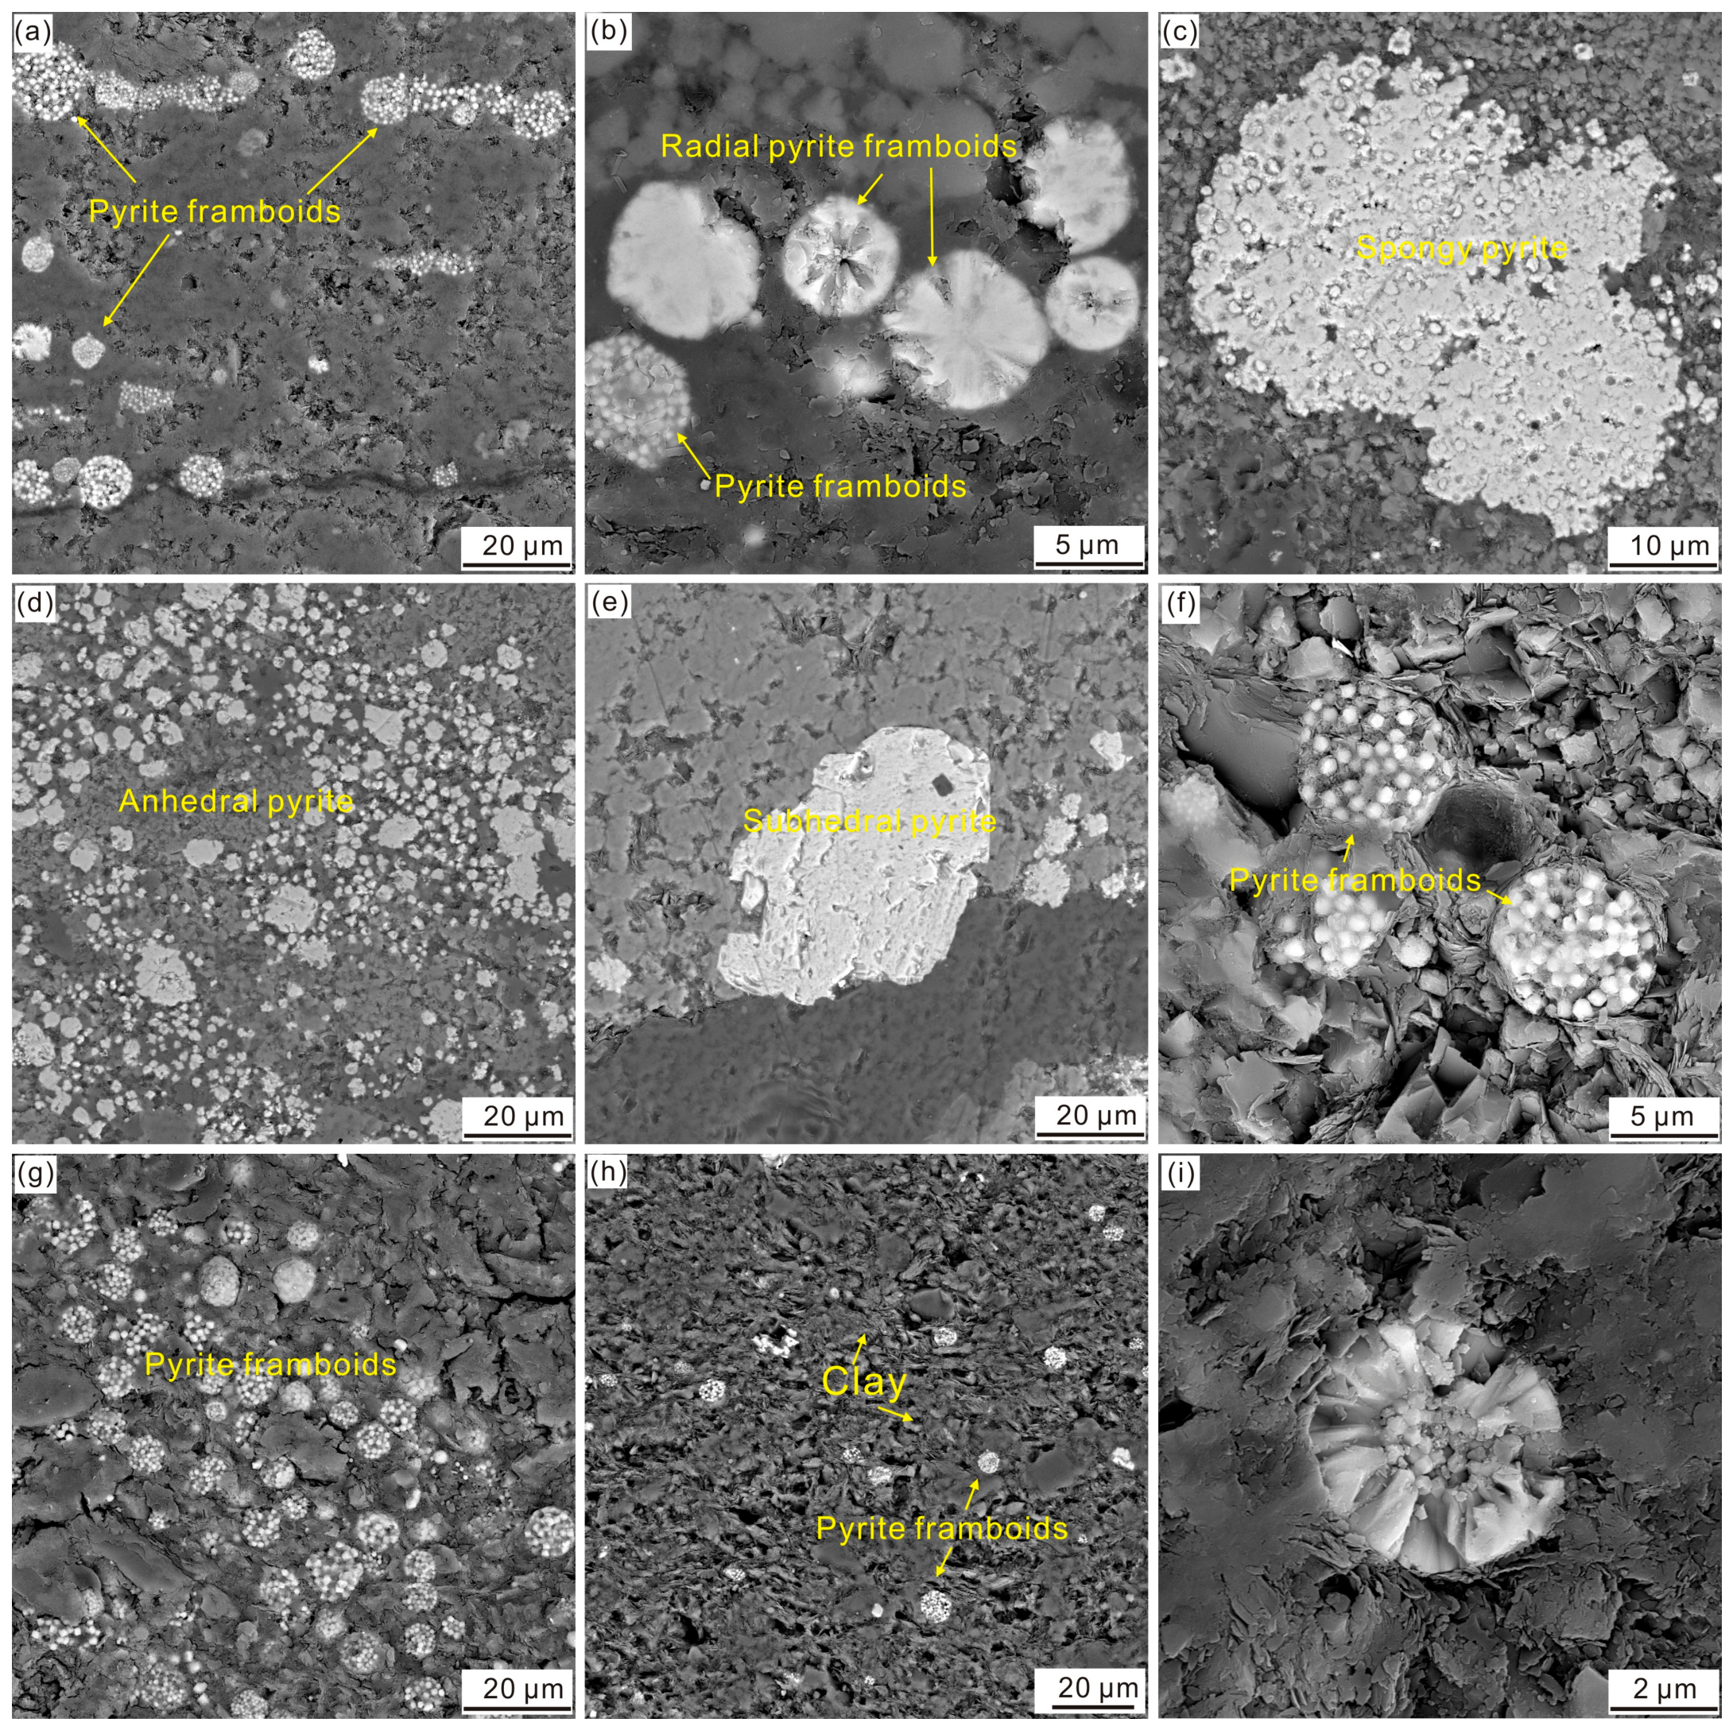
Pyrite is abundant and morphologically diverse in the Datangpo Mn ores and Mn-containing shales (Figure 10). It occurs mainly as pyrite framboids and subhedral to anhedral non-framboidal grains (Figure 10a,d–h). Anhedral pyrite is locally developed in high-grade Mn ore from the Lannitian deposit (Figure 10d), whereas subhedral pyrite occurs in medium-grade Mn ore from the Xiangtan deposit (Figure 10e). Spongy pyrite is also locally present in high-grade Mn ore from the Lannitian deposit (Figure 10c). Pyrite framboids occur in Mn ores of different grades but are particularly abundant in the Mn-containing shales, where numerous framboids are dispersed throughout the fine-grained matrix (Figure 10g,h). Typical framboids consist of closely packed pyrite microcrystals with distinct intercrystalline pores (Figure 10a,f,g). Rare radial pyrite framboids occur in high-grade Mn ore from the Minle deposit (Figure 10b), and some framboids in the Mn-containing shale show secondary overgrowth around the original framboidal aggregates (Figure 10i).
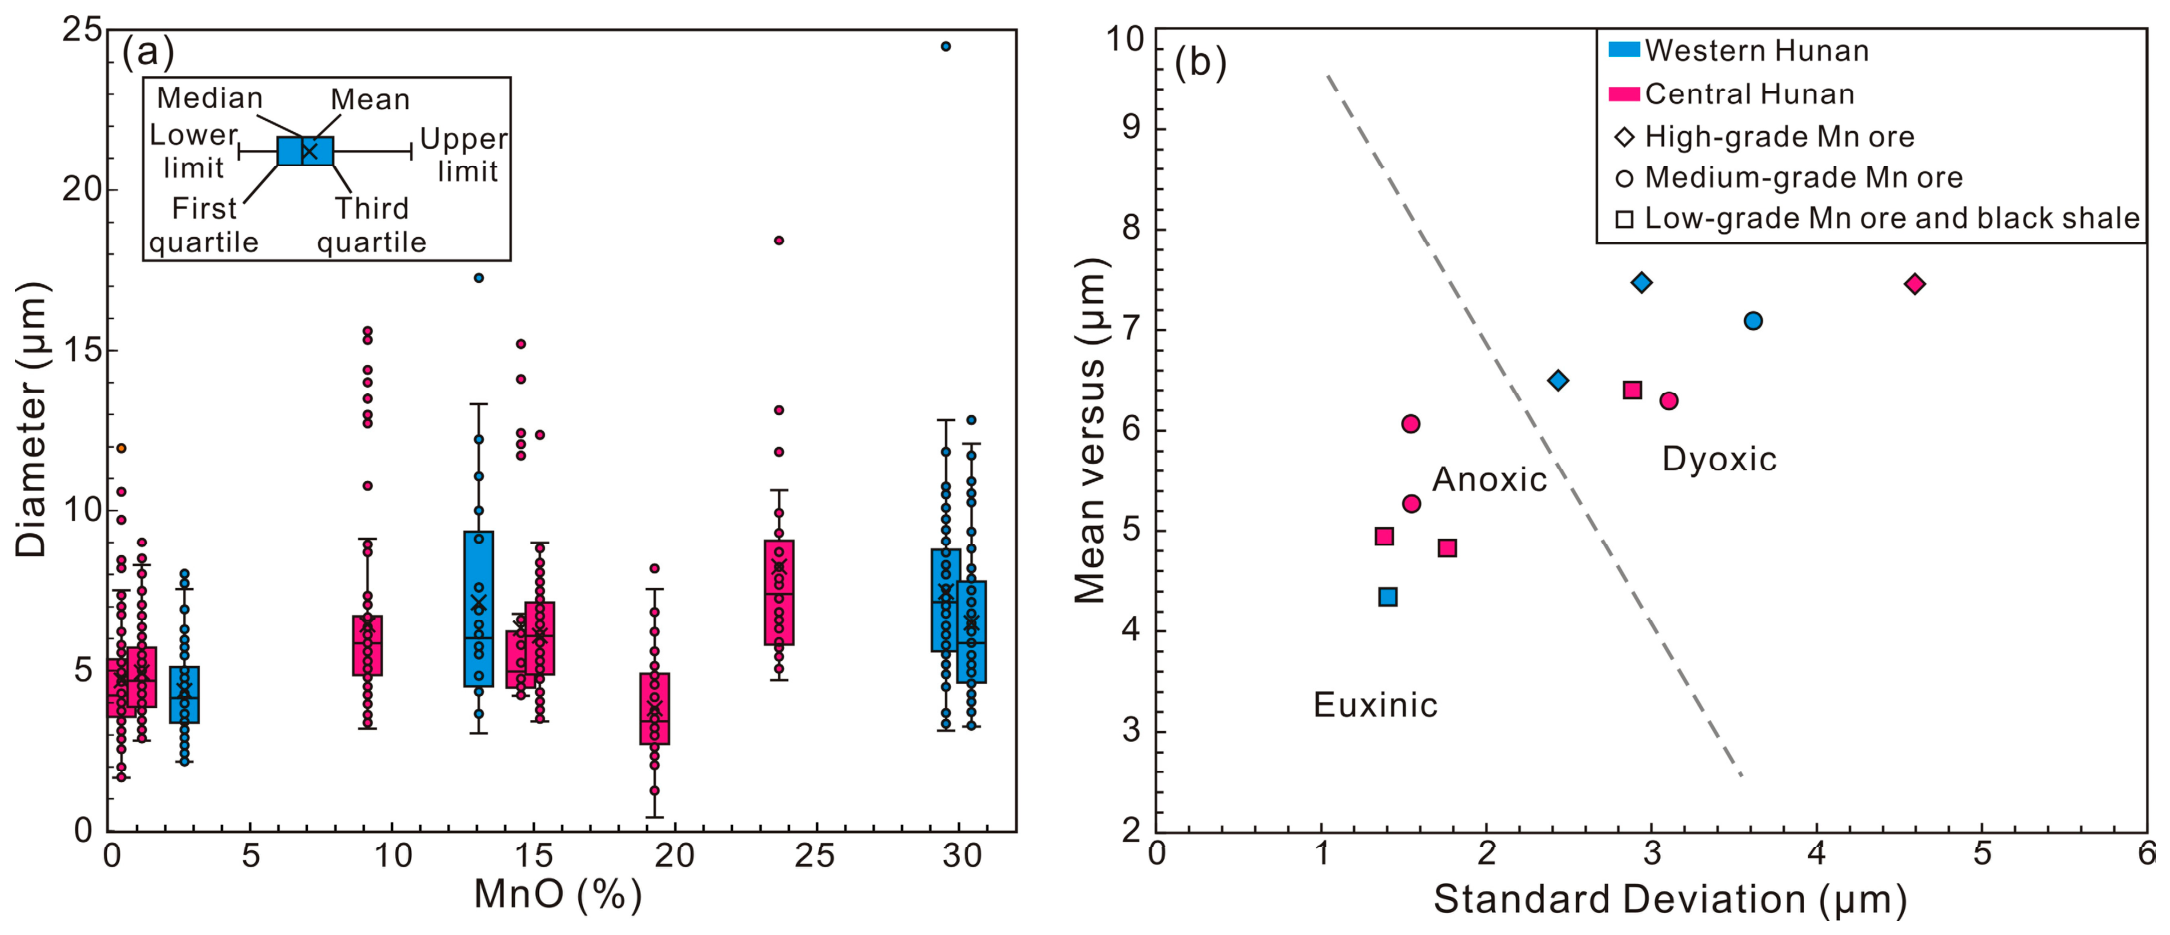
Pyrite morphology and framboid-size distributions vary systematically with lithology and Mn ore grade (Table 3). Pyrite framboids are abundant in Mn-containing shales and low-grade Mn ores, occur in moderate abundance in medium-grade ores, and are generally less abundant in high-grade ores (Figure 10a,b,f–h). The Mn-containing shales contain relatively small framboids, with mean diameters of 4.8–5.0 µm and standard deviations of 1.4–1.8 µm (Figure 10g,h). The Mn-containing shales have mean framboid diameters of 4.4–5.0 µm and standard deviations of 1.4–1.8 µm. The low-grade Mn ore has a mean framboid diameter of 6.4 µm, whereas medium-grade ores have mean diameters of 5.3–7.1 µm and standard deviations of 1.5–3.6 µm. Measurable framboids in high-grade ores have mean diameters of 6.5–7.5 µm and maximum diameters of 12.8–24.5 µm, with the largest occurring in sample M-1. Samples NMC-4, NMC-5, LNT-1, and LNT-2 contain relatively few measurable framboids and are dominated by non-framboidal subhedral to anhedral pyrite. Overall, non-framboidal pyrite is more common in medium- and high-grade ores, whereas pyrite framboids are more abundant in low-grade ores and Mn-containing shales (Figure 10d–h).

5. Discussion

5.1. Redox Conditions During Mn Deposition

Manganese is a redox-sensitive, multivalent element that occurs in seawater mainly as dissolved Mn(II), including Mn2+ and MnCl+. Under oxic conditions, Mn(II) is oxidized to sparingly soluble Mn(III/IV) oxides or oxyhydroxides, whereas reductive dissolution near redox boundaries releases Mn2+ back into solution [36]. Rhodochrosite precipitation requires high Mn2+ activity and sufficient carbonate alkalinity, conditions commonly attained in reducing, HCO3-rich pore waters. The marine Mn cycle is therefore closely controlled by redox gradients in the water column and sedimentary pore-water system [37].

5.1.1. Mineralogical Constraints

The size and morphology of pyrite framboids are widely used as robust proxies for depositional redox conditions because their formation and size distributions are closely linked to the position of the redox interface and are generally resistant to post-depositional modification [23,38,39,40]. Pyrite framboids formed under euxinic conditions are typically abundant, fine-grained, and narrowly distributed, with mean diameters of 3–5 µm. Under anoxic but non-euxinic conditions, framboids commonly form near the sediment–water interface and average 4–6 µm. Dysoxic conditions produce larger, more variable framboids and more subhedral and anhedral pyrite. With increasing oxygenation, framboids become sparse or absent as pyrite formation shifts deeper into the sediment.
High-grade Mn ores from Lannitian, Minle, and Xiangtan are dominated by non-framboidal pyrite, including anhedral to subhedral and locally spongy forms, and contain only sparse framboids (Figure 7 and Figure 10). The sparse framboids have relatively large diameters and broad size distributions, with maximum diameters up to 24.5 µm (Figure 11a), indicating relatively oxic to weakly dysoxic bottom waters [38]. Comparable pyrite assemblages have been documented in several Datangpo-type Mn deposits across South China. Massive Mn ores from the Gaolou, Yanglizhang, Zhenxing, and Minle deposits are characterized by sparse to absent pyrite framboids, consistent with deposition under relatively oxic to dysoxic bottom-water conditions [39,40]. In medium-grade Mn ores from Xiangtan and Minle, subhedral pyrite remains common, but pyrite framboids are more frequent, and their size distributions remain broad (Figure 11a). These features are consistent with dysoxic conditions and redox fluctuations rather than persistently euxinic conditions. Low-grade Mn ores and black shales contain abundant fine framboids with narrower distributions and fewer non-framboidal pyrite grains, indicating more stable anoxic conditions and locally stronger sulfate reduction (Figure 11b).
Overall, depositional redox conditions exerted a primary control on ore grade. More oxygenated bottom waters enhanced Mn(II) oxidation and favored the formation of high-grade ores, whereas persistent anoxia promoted organic matter and pyrite preservation but suppressed Mn oxidation and enrichment. The NMC-1 medium-grade ore is an exception, because its relatively small pyrite framboids indicate more reducing local conditions.

5.1.2. Geochemical Constraints

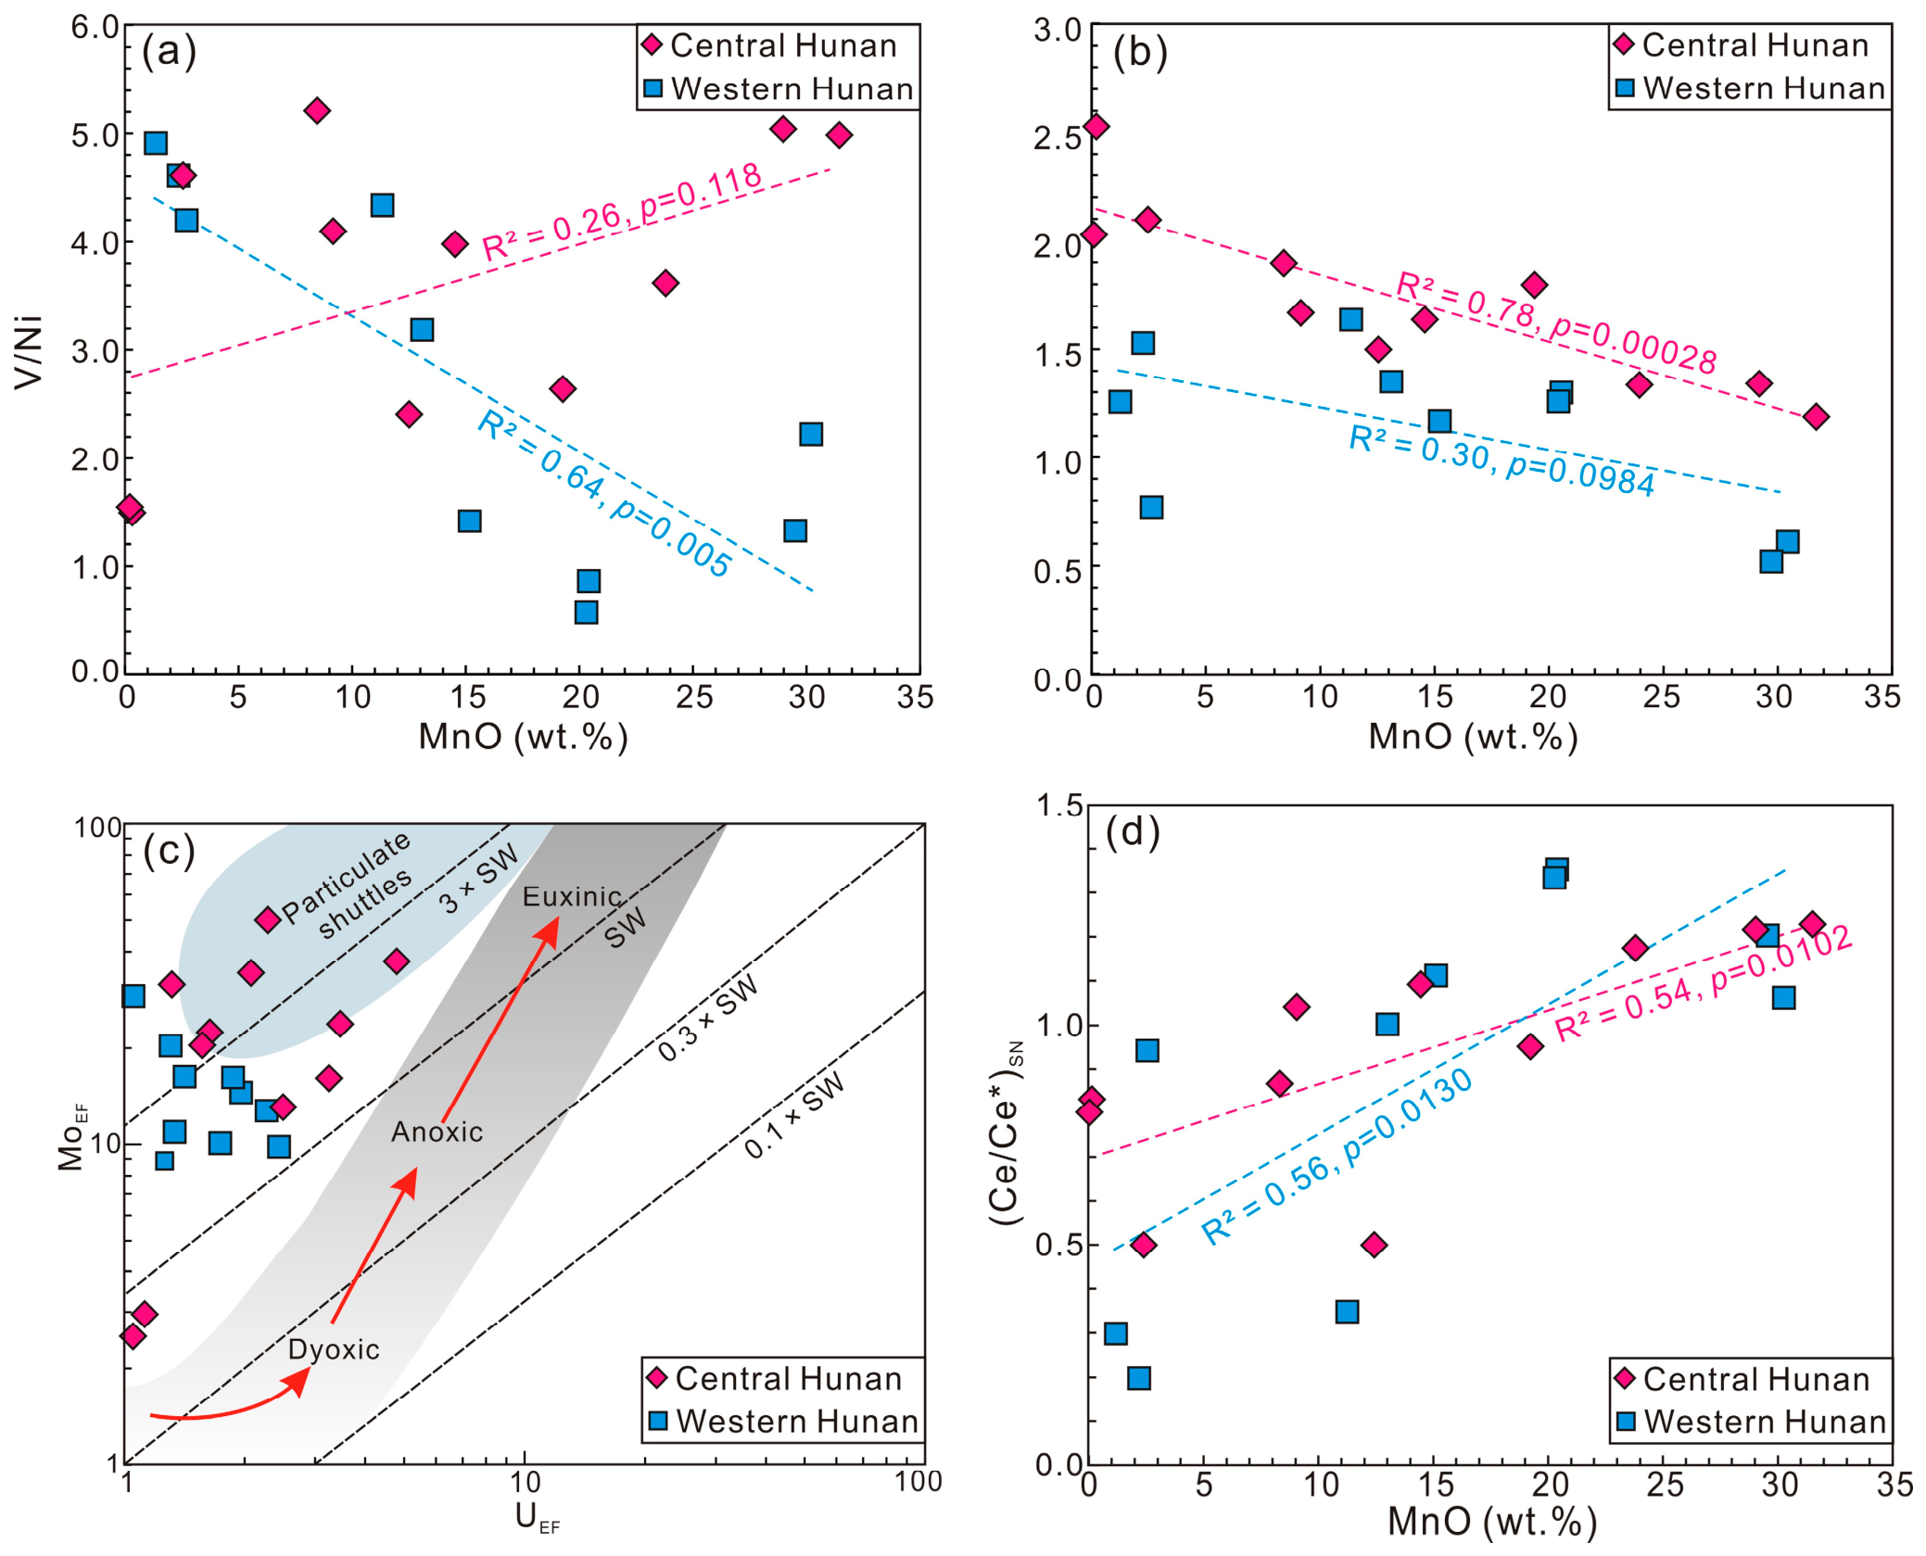
Trace element geochemistry provides additional constraints on redox state [41,42,43]. The relationships of V/Ni and Ni/Co with MnO show clear regional differences (Figure 12a,b) (Table 4). In western Hunan, V/Ni decreases significantly with increasing MnO (R2 = 0.64, p = 0.005), whereas central Hunan shows a weak positive but statistically insignificant relationship (R2 = 0.26, p = 0.118). Ni/Co decreases with MnO in both regions, with a strong relationship in central Hunan (R2 = 0.78, p < 0.001) but a weaker and statistically insignificant relationship in western Hunan (R2 = 0.30, p = 0.098). Under reducing conditions, V is preferentially reduced and immobilized through association with organic matter, clay minerals, and sulfides, whereas Ni is less sensitive to redox changes [42]. Ni/Co may also respond to redox conditions, although Co can be affected by Mn-bearing minerals, Fe–Mn oxides, terrigenous input, and early diagenetic redistribution. Thus, the generally higher V/Ni and Ni/Co ratios at lower MnO contents, particularly the V/Ni trend in western Hunan and the Ni/Co trend in central Hunan, are broadly consistent with more reducing conditions during the formation of low-grade Mn ores and black shales [42,44].
MoEF–UEF covariation is widely used to reconstruct the redox state of paleo-marine and lacustrine depositional systems [37,43]. However, the Datangpo Mn deposits in Hunan display pronounced Mo–U decoupling, particularly in high-grade ores, which are strongly enriched in Mo but only weakly enriched in U (Figure 12c) (Table 4). Most samples plot within or close to the particulate shuttle field, indicating that Mo enrichment was governed primarily by Fe–Mn particulate shuttling rather than by persistent euxinic bottom waters. Fe–Mn oxides or hydroxides formed in oxic to weakly dysoxic waters efficiently scavenged molybdate and transported it to the sediment–water interface. Subsequent reductive dissolution or mineral transformation in sediment pore waters released the adsorbed Mo, which was then sequestered by organic matter, sulfides, or Fe-sulfide minerals [42,46]. This process accounts for the pronounced Mo enrichment without a corresponding increase in UEF.
The observed Mo–U decoupling must also be evaluated in the context of Neoproterozoic ocean chemistry. Relative to the modern ocean, Precambrian seawater likely contained smaller dissolved Mo and U inventories, lower sulfate concentrations, different elemental residence times, and more restricted exchange between marginal basins and the open ocean [47,48]. Consequently, the combination of high MoEF and low UEF in the Datangpo Mn-bearing succession does not necessarily indicate persistent euxinic bottom waters. Instead, it more likely reflects the combined effects of Fe–Mn particulate shuttling, limited marine trace metal inventories, and local early diagenetic sequestration. Integrated pyrite and geochemical evidence indicate that the Mn-bearing precursors of high-grade ores were deposited under relatively oxic to weakly dysoxic conditions, whereas medium-grade ores were associated with fluctuating dysoxic conditions, and low-grade ores and black shales with more persistently anoxic conditions.

5.2. Source of Ore-Forming Materials

Mn in marine sedimentary deposits is commonly derived from hydrothermal activity or terrigenous weathering [13]. Specifically, terrigenous weathering supplies dissolved Mn and fine-grained Mn-bearing particles to sedimentary basins through riverine runoff, nearshore clastic transport, and sediment resuspension [48]. In the particulate fraction, Mn may occur in Mn-bearing aluminosilicates and clay minerals, as well as secondary Mn oxides or oxyhydroxides formed during weathering, whereas dissolved Mn is transported mainly as Mn2+ under reducing conditions [13,49,50]. Hydrothermal activity directly supplies Mn, Fe, and other metals to seawater, while their dispersal and deposition are controlled by synsedimentary faulting, rifting, hydrothermal plume transport, and restricted-basin circulation [8,13]. Because terrigenous and hydrothermal inputs may overlap and produce partly similar geochemical signatures, the source of Mn cannot be reliably constrained using a single proxy. Provenance discrimination therefore requires integrated evaluation of detrital indicators, hydrothermal geochemical signatures, REE–Y patterns, and the regional tectonic setting.
In the Hunan Mn deposits, MnO contents are negatively correlated with proxies for terrigenous detrital input (Figure 4). High-grade ores have high MnO contents but low Al2O3, TiO2, Zr, and Th, whereas low-grade ores and black shales contain higher proportions of detrital material and correspondingly lower MnO contents. This pattern is consistent with patterns observed in the Daotuo and Xixibao deposits in Guizhou and the Xiaochayuan deposit in Chongqing [14,19,20], where the Mn is generally interpreted to have been supplied predominantly by hydrothermal fluids [13]. Al, Ti, Zr, and Th are relatively immobile elements and are widely used as tracers of terrigenous detrital input [35,51]. If Mn-bearing aluminosilicates, clay minerals, and other secondary Mn-bearing particles associated with terrigenous clastic material had been the principal source of Mn, MnO would be expected to covary positively with Al2O3, TiO2, Zr, and Th. The observed inverse relationships therefore argue against a dominantly terrigenous source. Terrigenous weathering may have provided a background flux of dissolved and particulate Mn to the basin, but it cannot account for the pronounced Mn enrichment in the medium- and high-grade ores (Figure 3 and Figure 4).
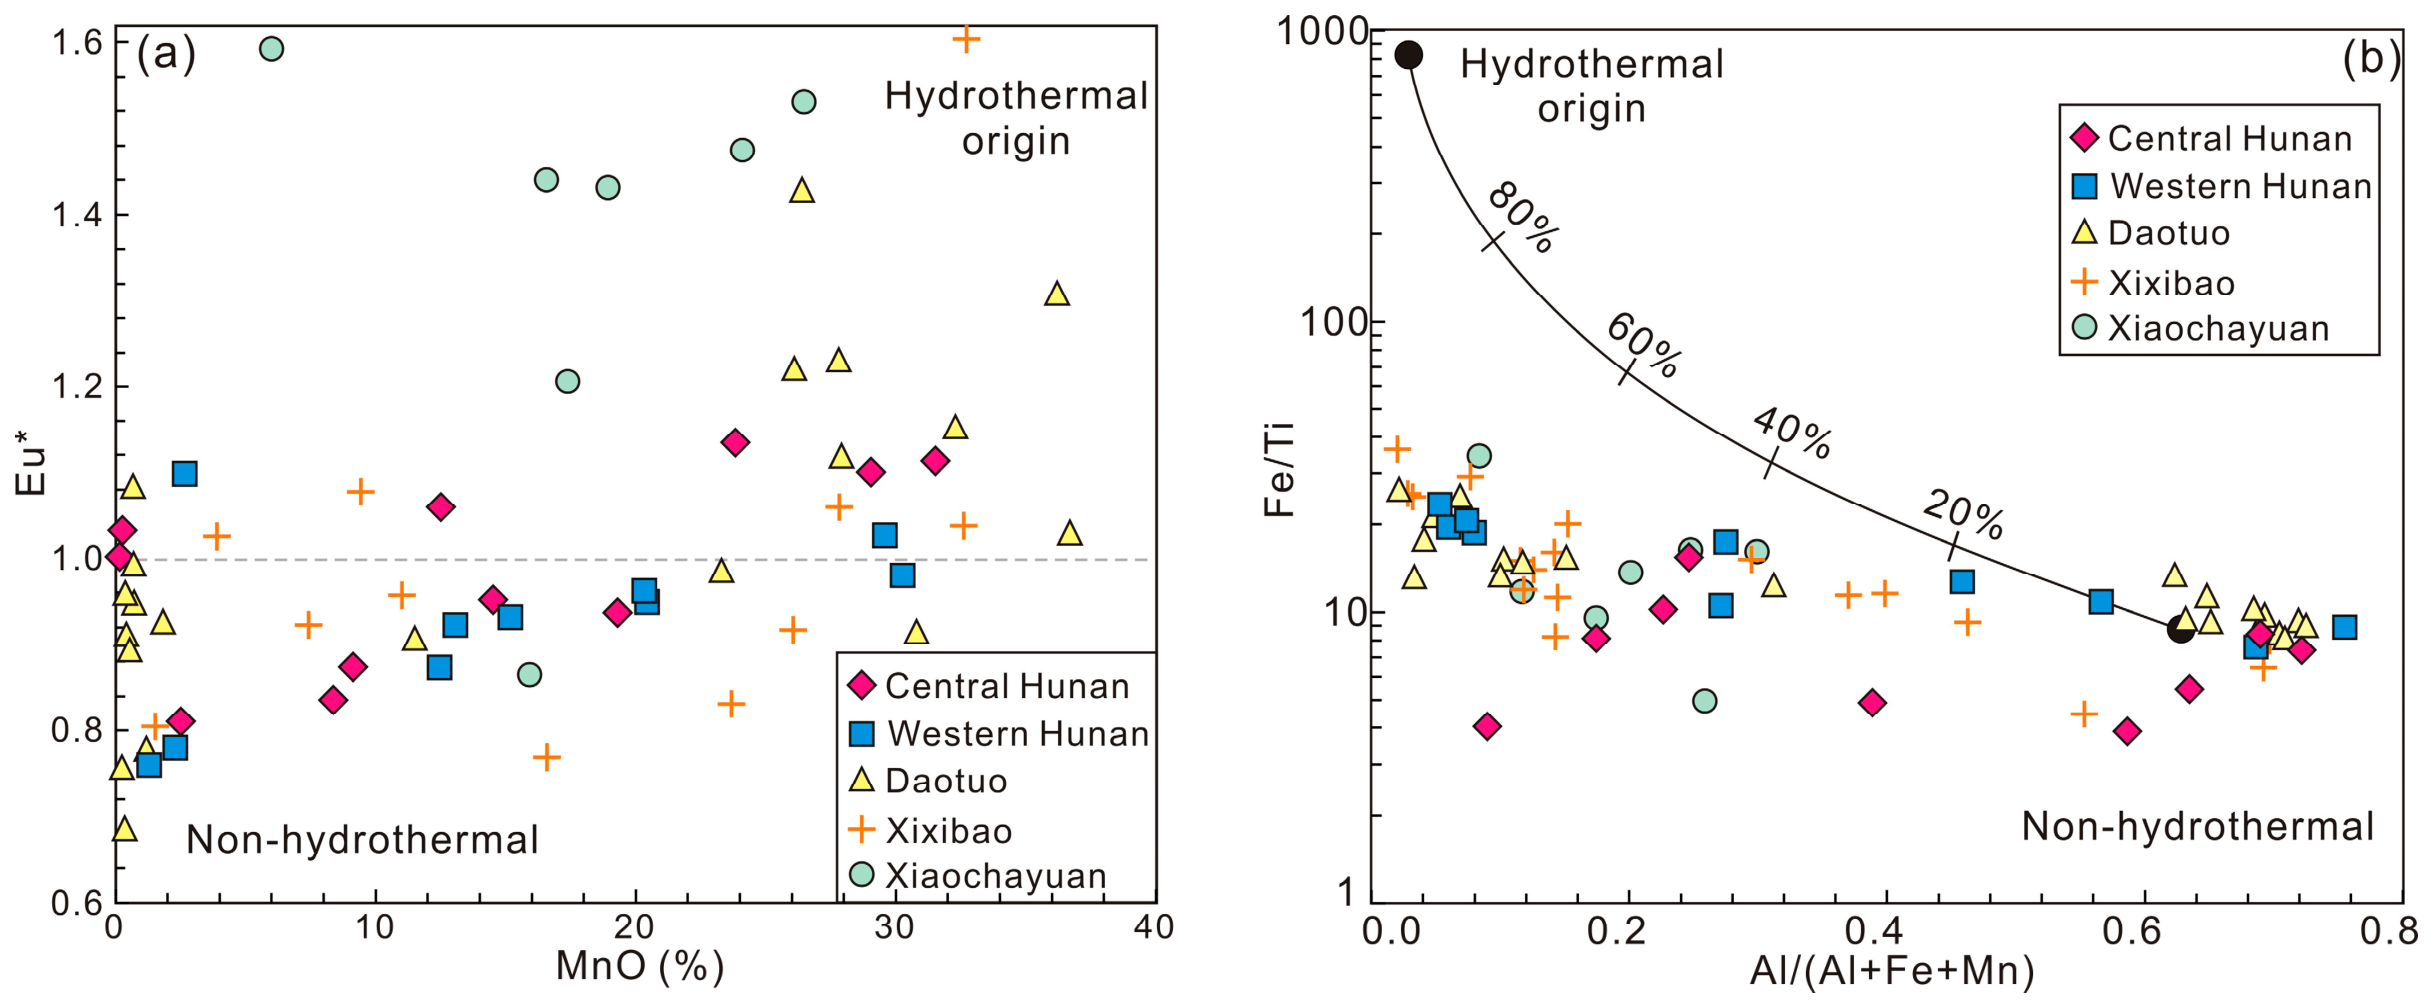
Under high-temperature and reducing conditions, Eu(III) is reduced to the more mobile Eu(II), leading to preferential Eu mobilization during fluid–rock interaction and positive Eu* values in hydrothermal fluids and precipitates [52,53,54]. Thus, Eu* is widely used to assess hydrothermal influence. Across the Hunan and Guizhou datasets and the Xiaochayuan deposit, samples with higher MnO contents tend to have relatively higher Eu* values (Figure 13a). This overall tendency is consistent with stronger hydrothermal input and enhanced Mn supply during the formation of higher-grade ores. This interpretation is further supported by the Fe/Ti versus Al/(Al + Fe + Mn) diagram (Figure 13b) (Table 4). High-grade ores generally have higher Fe/Ti and lower Al/(Al + Fe + Mn), reflecting enrichment of hydrothermal Fe–Mn components and limited detrital dilution (Figure 13b) [55]. However, the strength of the hydrothermal signature varies markedly among regions (Figure 13). Daotuo ores exhibit the strongest and most frequent positive Eu* values, indicating a substantial hydrothermal contribution. Pronounced positive Eu* values also occur in some high-grade ores from central Hunan, whereas most ores from western Hunan show weak or negligible positive anomalies. These differences likely reflect spatial and temporal variations in hydrothermal flux and variable dilution by seawater and terrigenous material. Northeastern Guizhou occupied a more distal, basinward setting and experienced stronger hydrothermal activity [13]. Western Hunan was located closer to the margin of the adjacent paleoland and received greater detrital input, which may have diluted the hydrothermal signature [56].
The sulfide assemblage in sample NMC-1 provides further mineralogical evidence for hydrothermal influence. Galena, sphalerite, and Cu–Fe sulfides occur as irregular grains and aggregates within the rhodochrosite-rich matrix (Figure 8). Similar hydrothermal-related mineral assemblages have also been reported from the Permian Dongxiangqiao Mn deposit in Hunan and the Changgou Mn deposit in Guizhou, including galena, sphalerite, chalcopyrite, and Ni–Co sulfides [57,58]. Therefore, the Pb–Zn–Cu sulfide assemblage in NMC-1 is difficult to explain solely by precipitation from ambient seawater or ordinary detrital input and may reflect the influence of metal-rich hydrothermal fluids. Their spatial association with rhodochrosite suggests a possible relationship between the two, although their precise timing remains difficult to constrain, and the influence of later hydrothermal activity cannot be excluded. Previously reported Hg enrichment from the same stratigraphic interval further supports hydrothermal influence, with Hg concentrations of up to 3976 ppb and Hg/TOC values of up to 1420 ppb/% [21].
Figure 13. Geochemical constraints on hydrothermal contributions to Mn mineralization in the Datangpo Formation. (a) Variation in Eu* with Mn*; (b) Fe/Ti versus Al/(Al + Fe + Mn) discrimination diagram, modified after Marchig et al. [59] and Boström [60]. The curved line represents mixing between hydrothermal metalliferous sediments and non-hydrothermal sediments, and the percentages along the curve represent the proportions of the hydrothermal component.
Applsci 16 08590 g013

5.3. Manganese Mineralization Process

Rhodochrosite in marine Mn deposits may form through two end-member pathways. It can precipitate directly from Mn2+-rich, alkaline waters under anoxic conditions or form through reductive transformation of Mn oxides or oxyhydroxides deposited initially under oxic to suboxic conditions [61,62,63]. The PAAS-normalized REE patterns favor a substantial Mn-oxide precursor for most of the studied ores (Figure 6). Samples from central and western Hunan, Daotuo, Xixibao, and Xiaochayuan consistently display broad cap-shaped profiles marked by MREE enrichment, weak LREE–HREE fractionation, subdued Y anomalies, and locally positive Ce anomalies (Figure 6a–d). Although their normalized abundances vary, the overall similarity among deposits suggests a common precipitation process rather than control by local detrital input alone. Comparable high REE contents, MREE enrichment, positive Ce anomalies, and weak Y anomalies have also been documented in other Datangpo-type Mn deposits [31].
These cap-shaped patterns contrast markedly with those of modern Pacific seawater, which are characterized by pronounced negative Ce anomalies, strong positive Y anomalies, and progressive HREE enrichment [64]. This contrast is difficult to explain by simple inheritance of the dissolved REE signature of ambient seawater. Instead, Mn oxides or oxyhydroxides may have scavenged REEs from seawater, accompanied by the oxidation and preferential uptake of Ce (Figure 6 and Figure 12d). During early burial, organic matter degradation consumed oxidants and promoted the reductive dissolution of Mn(III/IV) phases, releasing dissolved Mn2+ and inorganic carbon into pore waters. The resulting increase in Mn2+ activity and alkalinity favored rhodochrosite supersaturation and precipitation [23,38], while partly preserving and redistributing the REE signature inherited from Mn-rich precursor phases. In addition, Mn carbonates from western Hunan and other Datangpo-type Mn deposits have been reported to show generally low δ13Ccarb values, averaging approximately −8.3%0 [65], markedly lower than the approximately 0%0 value of coeval marine carbonates [66]. This difference supports the involvement of isotopically light carbon derived from organic matter degradation in rhodochrosite formation. Carbonate carbon isotope data are currently unavailable for the central Hunan deposits. Therefore, the cap-shaped REE patterns are more consistent with initial oxidative Mn fixation followed by reductive carbonatization during early diagenesis than with direct precipitation of Mn carbonates from ambient seawater. Efficient accumulation of Mn oxides under oxic conditions, together with limited detrital dilution, may have favored the formation of medium- to high-grade Mn ores.
Direct rhodochrosite precipitation may nevertheless have occurred locally where Mn-rich reducing fluids entered alkaline pore waters. For example, the medium-grade ore sample NMC-1 records anoxic to dysoxic depositional conditions, which are not readily reconciled with an initial oxidative Mn fixation pathway. Significantly, the occurrence of galena, sphalerite, and Cu–Fe sulfides in this sample (Figure 8), together with previously reported Hg enrichment from the same stratigraphic interval [21], supports a hydrothermal contribution. Under such conditions, hydrothermal Mn2+ could precipitate directly as carbonate without an extensive intermediate oxide stage [57]. This process may explain local mineralogical and geochemical heterogeneity, particularly in hydrothermally influenced medium-grade ores. Overall, the REE patterns and redox evidence indicate that reductive transformation of Mn oxides or oxyhydroxides was the dominant mechanism of rhodochrosite formation. Direct precipitation from Mn2+-rich reducing fluids was probably subordinate but locally important where hydrothermal activity was intense.

5.4. Metallogenic Model for Datangpo Mn Deposits in Hunan

Despite differences in their local tectonosedimentary and palaeogeographic settings, the Datangpo Mn deposits of western and central Hunan share broadly similar mineralogical and geochemical characteristics. These similarities point to comparable sources of ore-forming materials, basin redox evolution, and Mn mineralization processes. Their formation can therefore be explained by a unified model involving hydrothermal Mn supply, postglacial oxidative Mn enrichment, early diagenetic reductive carbonatization, and locally direct rhodochrosite precipitation.
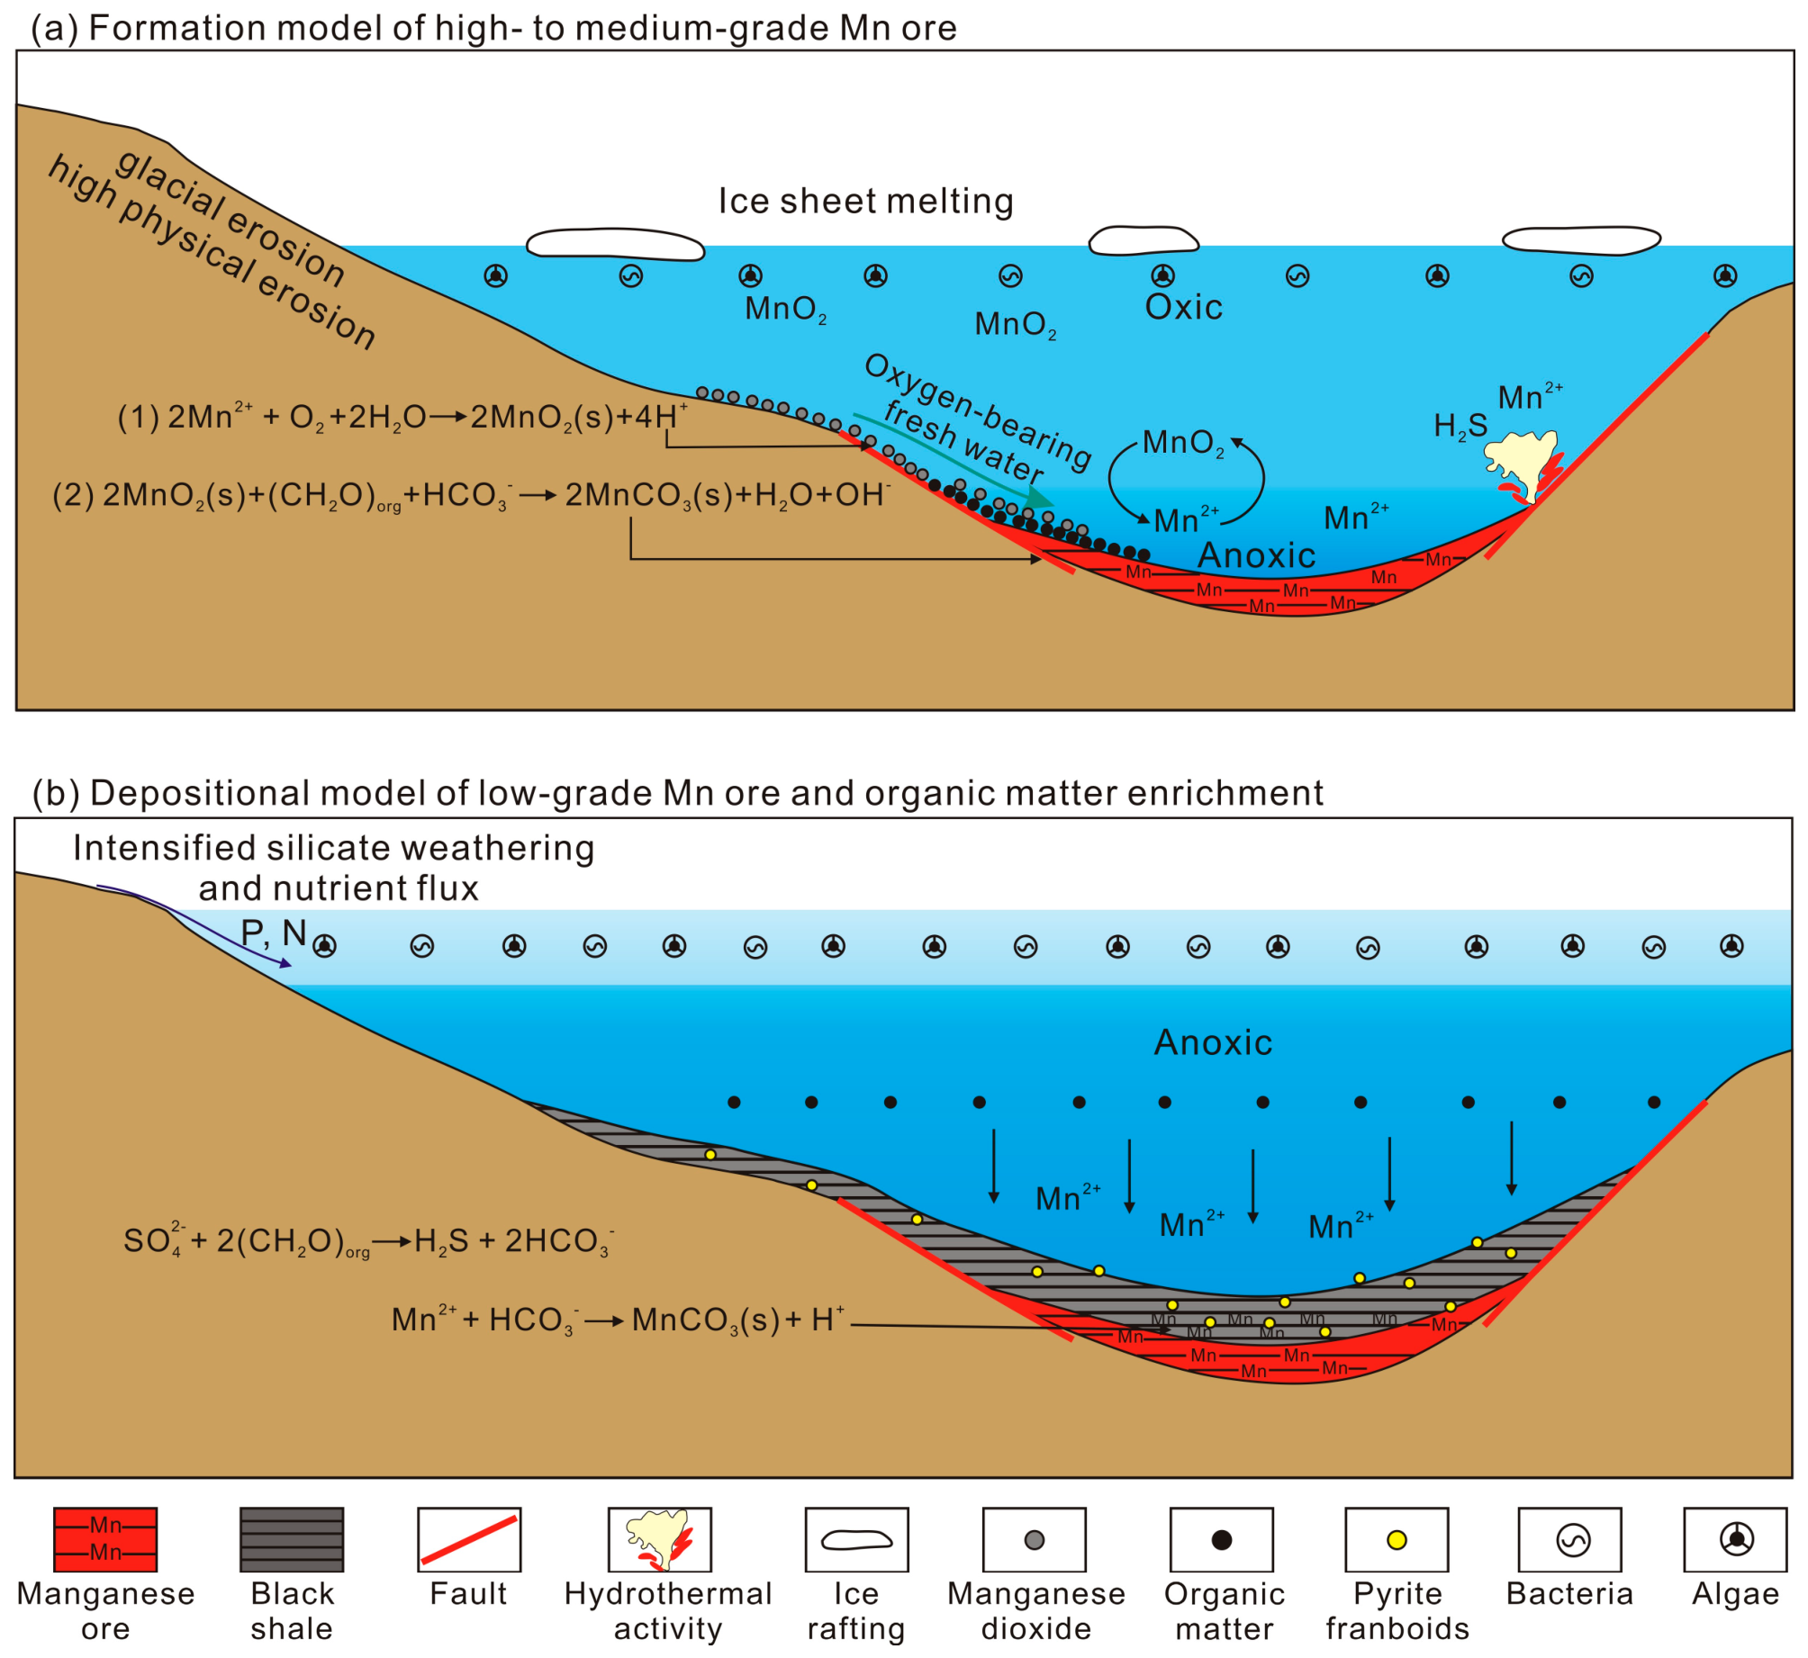
Following the Sturtian deglaciation, meltwater input, enhanced air–sea exchange, and renewed basin circulation drove the formerly restricted deep-water basin from anoxic toward oxic to weakly dysoxic conditions [67,68,69]. Concurrent hydrothermal activity supplied abundant dissolved Mn2+. Where Mn2+-rich waters encountered relatively oxygenated waters near the redoxcline, Mn2+ was oxidized to poorly soluble Mn(III/IV) oxides or oxyhydroxides and deposited as fine Mn-rich particles. This oxidative trapping constituted the initial enrichment stage of the medium- to high-grade ores (Figure 14a). Following burial in organic-rich sediments, these Mn phases underwent reductive dissolution in shallow pore waters. Organic matter degradation consumed oxidants, released Mn2+ and dissolved inorganic carbon, and increased pore water alkalinity. The resulting rise in Mn2+ activity and carbonate alkalinity promoted rhodochrosite supersaturation, converting the Mn-rich precursor particles into medium- to high-grade carbonate ores. However, in areas such as Xiangtan, stronger hydrothermal activity may also have introduced Mn2+- and metal-rich reducing fluids. Under anoxic and alkaline conditions, part of the dissolved Mn2+ could have precipitated directly as rhodochrosite, contributing locally to the formation of medium-grade ores.
Continued interglacial warming enhanced silicate weathering, terrigenous and nutrient input, primary productivity, and organic matter burial [70,71]. Increasing basin restriction and oxygen demand subsequently promoted more persistent bottom water anoxia. Under these conditions, dissolved Mn2+ could not be efficiently oxidized and trapped as Mn oxides or oxyhydroxides, limiting Mn enrichment. Direct carbonate precipitation remained possible in alkaline anoxic waters or pore fluids but generally produced low-grade Mn ores. Persistent anoxia also favored organic matter preservation and microbial sulfate reduction, accounting for the abundance of small pyrite framboids in low-grade ores and Mn-containing shales.

6. Conclusions

The Datangpo Mn deposits in western and central Hunan show similar mineralogical and geochemical characteristics, with ore grade decreasing under increasingly reducing conditions. High-grade Mn ores are dominated by rhodochrosite and dolomite, with minor terrigenous detrital components and pyrite framboids. Where present, the pyrite framboids are relatively large and display a broad size distribution, indicating oxic to weakly dysoxic conditions. Medium-grade Mn ores contain more pyrite framboids, which retain a broad size distribution, suggesting deposition under dysoxic conditions. Low-grade Mn ores and Mn-containing shales contain higher proportions of quartz and clay minerals, together with abundant pyrite framboids characterized by a narrow size distribution, consistent with deposition under an anoxic water column.
Mn was supplied predominantly by hydrothermal activity and released into the water column as dissolved Mn2+ after Sturtian deglaciation. Under oxic to weakly dysoxic conditions, this Mn2+ was oxidized to Mn oxides, which were subsequently converted to rhodochrosite, producing medium- to high-grade carbonate Mn ores. Locally in Xiangtan, stronger hydrothermal input may have favored limited direct precipitation of manganese carbonate under anoxic conditions characterized by high Mn2+ activity and alkalinity. Progressive interglacial warming and enhanced organic-matter burial intensified bottom-water anoxia and reduced the efficiency of Mn oxidation, thereby favoring the formation of low-grade Mn ores and manganiferous black shales.

Supplementary Materials

The following supporting information can be downloaded at: https://www.mdpi.com/article/10.3390/app16178590/s1, Table S1: Major element compositions of Mn ores and black shales from the Datangpo Formation in western and central Hunan; Table S2: Trace element and rare earth element compositions of Mn ores and black shales from the Datangpo Formation in western and central Hunan; Table S3: Calculated geochemical parameters of compiled Datangpo-type Mn deposits from Guizhou and Chongqing.

Author Contributions

Conceptualization, X.M. and W.X.; methodology, W.X.; validation, Y.H. and P.Z.; formal analysis, F.Y. and Y.Q.; investigation, G.M.; resources, H.Z. and L.S.; data curation, Y.L.; writing—original draft preparation, W.X.; writing—review and editing, X.M.; visualization, G.M.; supervision, H.Z. and L.S.; project administration, X.M.; funding acquisition, X.M. and W.X. All authors have read and agreed to the published version of the manuscript.

Funding

This research was funded by the Department of Natural Resources of Hunan Province, grant number HBZ20240128; the Deep Earth Probe and Mineral Resources Exploration-National Science and Technology Major Project, grant number 2026ZD1013205; the National Natural Science Foundation of China, grant numbers 42502134 and 42472208; the Science and Technology Innovation Program of Hunan Province, grant number 2025RC3196; the Natural Science Foundation of Hunan Province, grant number 2026JJ60170 and 2026JJ60408; and the Research Fund Program of the Hubei Key Laboratory of Petroleum Geochemistry and Environment, Yangtze University, grant number HKLPGE-202506.

Data Availability Statement

The original contributions presented in this study are included in the article; further inquiries can be directed to the corresponding authors.

Acknowledgments

We sincerely thank the Academic Editor and the four anonymous reviewers for their constructive comments and valuable suggestions, which contributed substantially to improving the quality of this manuscript. We also gratefully acknowledge Yong Wang and Xianghua Liu for their valuable discussions and insightful suggestions regarding the manuscript.

Conflicts of Interest

The authors declare no conflicts of interest.

Abbreviations

The following abbreviations are used in this manuscript:
RdsRhodochrosite
QtzQuartz
PyPyrite
OMOrganic matter
DolDolomite
ItIllite
KaoKaolinite
GypGypsum
EFEnrichment factor
SNShale-normalized
EDSEnergy-dispersive spectroscopy

References

  1. Zhao, X.; Han, X.; Feng, H.; Liu, L.; Liu, Q.; Liu, G.; Du, B.; Zhu, H. Study on China’s manganese resource demand from 2024 to 2035 based on GM-SVR method. Front. Earth Sci. 2025, 13, 1538908. [Google Scholar] [CrossRef] [Scilit]
  2. Thackeray, M.M.; Croy, J.R.; Lee, E.; Gutierrez, A.; He, M.; Park, J.S.; Yonemoto, B.T.; Long, B.R.; Blauwkamp, J.D.; Johnson, C.S.; et al. The quest for manganese-rich electrodes for lithium batteries: Strategic design and electrochemical behavior. Sustain. Energy Fuels 2018, 2, 1375–1397. [Google Scholar] [CrossRef] [Scilit]
  3. Song, J.; Wang, H.; Zuo, Y.; Zhang, K.; Yang, T.; Yang, Y.; Gao, C.; Chen, T.; Feng, G.; Jiang, Z. Building better full manganese-based cathode materials for next-generation lithium-ion batteries. Electrochem. Energy Rev. 2023, 6, 20. [Google Scholar] [CrossRef] [Scilit]
  4. Ye, L.; Fan, D.; Yang, P. Characteristics of manganese ore deposits in China. Ore Geol. Rev. 1988, 4, 99–113. [Google Scholar] [CrossRef] [Scilit]
  5. Fu, Y.; Xu, Z.; Pei, H.; Jiang, R. Study on metallogenic regularity of manganese ore deposits in China. Acta Geol. Sin. 2014, 88, 2192–2207. [Google Scholar]
  6. Fan, D.; Yang, P. Introduction to and classification of manganese deposits of China. Ore Geol. Rev. 1999, 15, 1–13. [Google Scholar] [CrossRef] [Scilit]
  7. Roy, S. Sedimentary manganese metallogenesis in response to the evolution of the Earth system. Earth-Sci. Rev. 2006, 77, 273–305. [Google Scholar] [CrossRef] [Scilit]
  8. Maynard, J.B. The chemistry of manganese ores through time: A signal of increasing diversity of earth-surface environments. Econ. Geol. 2010, 105, 535–552. [Google Scholar] [CrossRef] [Scilit]
  9. Yu, W.; Du, Y.; Zhou, Q.; Wang, P.; Qi, L.; Xu, Y.; Jin, S.; Pan, W.; Yuan, L.; Xie, X. Coupling between metallogenesis of the Cryogenian Datangpo-type manganese deposit in South China and major geological events. Chin. Ed. 2020, 22, 855–871. [Google Scholar]
  10. Gutzmer, J.; Beukes, N. The manganese formation of the Neoproterozoic Penganga Group, India; revision of an enigma. Econ. Geol. 1998, 93, 1091–1102. [Google Scholar] [CrossRef] [Scilit]
  11. Cabral, A.; Moore, J.; Mapani, B.; Koubová, M.; Sattler, C.-D. Geochemical and mineralogical constraints on the genesis of the Otjosondu ferromanganese deposit, Namibia: Hydrothermal exhalative versus hydrogenetic (including snowball-earth) origins. S. Afr. J. Geol. 2011, 114, 57–76. [Google Scholar] [CrossRef] [Scilit]
  12. Biondi, J.C.; Lopez, M. Urucum Neoproterozoic–Cambrian manganese deposits (MS, Brazil): Biogenic participation in the ore genesis, geology, geochemistry, and depositional environment. Ore Geol. Rev. 2017, 91, 335–386. [Google Scholar] [CrossRef] [Scilit]
  13. Yu, W.; Du, Y.; Zhou, Q.; Peng, T.; Wang, P.; Yuan, L.; Xu, Y.; Pan, W.; Xie, X.; Qi, L. Provenance of Nanhuan Datangpo Formation Manganese Mn Deposit in Songtao Area, East Guizhou Province: Evidence from Sr Isotope. Earth Sci. 2016, 41, 1110–1120. [Google Scholar]
  14. Liao, Z.; Xu, Z.; Zhang, Y.; Wang, X.; Wu, H.; Liu, X.; Qin, H.; Wan, Y. Controls on Mn carbonate precipitation in the formation of Cryogenian Datangpo manganese deposits, southeastern Chongqing, South China. J. Asian Earth Sci. 2025, 294, 106810. [Google Scholar] [CrossRef] [Scilit]
  15. Wang, J.; Li, Z.-X. History of Neoproterozoic rift basins in South China: Implications for Rodinia break-up. Precambrian Res. 2003, 122, 141–158. [Google Scholar] [CrossRef] [Scilit]
  16. Wu, C.; Zhang, S.; Xu, K.; Yuan, L.; Kong, C.; Zhang, Z.; Shen, H. Sedimentary evolution for the Wuling secondary rift of the western Nanhua Rift and exhalative-sedimentary mineralization cycles of “Datangpo-type” manganese ore deposits in South China. J. Asian Earth Sci. 2025, 287, 106566. [Google Scholar] [CrossRef] [Scilit]
  17. Zhou, Q.; Du, Y.; Yuan, L.; Zhang, S.; Yu, W.; Yang, S.; Liu, Y. The structure of the Wuling rift basin and its control on the manganese deposit during the Nanhua Period in Guizhou-Hunan-Chongqing border area, South China. Earth Sci. 2016, 41, 177–188. [Google Scholar]
  18. Yu, W.; Polgári, M.; Gyollai, I.; Fintor, K.; Szabó, M.; Kovács, I.; Fekete, J.; Du, Y.; Zhou, Q. Microbial metallogenesis of Cryogenian manganese ore deposits in South China. Precambrian Res. 2019, 322, 122–135. [Google Scholar] [CrossRef] [Scilit]
  19. An, Z.; Zhang, R.; Chen, J.; Qin, Y.; Pan, W.; Wu, G.; Peng, Q.; Zheng, C.; Zhang, F.; Zhu, X. Geological and geochemical characteristics of Daotuo super large manganese ore deposit in Songtao County of Guizhou Province: Constraint on formation mechanism of Mn-carbonate ores. Miner. Depos. 2014, 33, 870–884. [Google Scholar]
  20. He, Z.; Yang, R.; Gao, J.; Cheng, W.; Zhang, R.; Zhang, P. Sedimentary geochemical characteristics of manganese deposits in Xixibao, Songtao County, Guizhou Province. Geochimica 2013, 42, 576–588. [Google Scholar]
  21. Fang, H.; Jiao, P.; Xie, Y.; Xie, W.; Wen, Z.; Li, Y.; Yang, R.; Wang, Z. Hydrothermal activity drives paleoenvironmental change and manganese mineralization in South China during the Neoproterozoic interglacial. Ore Geol. Rev. 2026, 191, 107190. [Google Scholar] [CrossRef] [Scilit]
  22. Fu, W.; Li, F. Geochemical Characteristics and Sedimentary Environment Analysis of Manganese Ore from the Datangpo Formation in the Guzhang Area, Northwest Hunan Province. Acta Sedimentol. Sin. 2025, 43, 50–62. [Google Scholar] [CrossRef]
  23. Xie, W.; Cao, T.; Wang, Y.; Algeo, T.J. Declining atmospheric carbon dioxide and lacustrine algal community evolution during the Eocene-Oligocene transition. Glob. Planet. Change 2026, 264, 105570. [Google Scholar] [CrossRef] [Scilit]
  24. Li, Z.X.; Li, X.H.; Kinny, P.D.; Wang, J.; Zhang, S.; Zhou, H. Geochronology of Neoproterozoic syn-rift magmatism in the Yangtze Craton, South China and correlations with other continents: Evidence for a mantle superplume that broke up Rodinia. Precambrian Res. 2003, 122, 85–109. [Google Scholar] [CrossRef] [Scilit]
  25. Du, Y.S.; Yu, W.C.; Zhou, Q.; Guo, H.; Jin, S.; Liu, Z.; Huang, H.; Liu, H.; Wang, P.; Qi, L.; et al. Discussion about the coupling relationship between the breakup of supercontinent and the large-scale manganese accumulation in China. J. Palaeogeogr. 2023, 25, 1211–1234. [Google Scholar] [CrossRef]
  26. Hoffman, P.F.; Abbot, D.S.; Ashkenazy, Y.; Benn, D.I.; Brocks, J.J.; Cohen, P.A.; Cox, G.M.; Creveling, J.R.; Donnadieu, Y.; Erwin, D.H. Snowball Earth climate dynamics and Cryogenian geology-geobiology. Sci. Adv. 2017, 3, e1600983. [Google Scholar] [CrossRef] [Scilit] [PubMed]
  27. Ma, X.; Wang, J.; Wang, Z.; Algeo, T.J.; Chen, C.; Cen, Y.; Yin, Q.-Z.; Huang, C.; Xu, L.; Huang, C. Geochronological constraints on Cryogenian ice ages: Zircon UPb ages from a shelf section in South China. Glob. Planet. Change 2023, 222, 104071. [Google Scholar] [CrossRef] [Scilit]
  28. Xu, L.; Bekker, A.; Chamberlain, K.; Lehmann, B.; Zhang, S.; Mao, J.; Hao, Y.; Pan, W. Termination of Sturtian glaciation with protracted, multiple volcanic eruptions. Earth-Sci. Rev. 2024, 255, 104826. [Google Scholar] [CrossRef] [Scilit]
  29. Scotese, C.R. Atlas of Earth History, Volume 1: Paleogeography; PALEOMAP Project: Arlington, TX, USA, 2001; p. 52. [Google Scholar]
  30. Tang, S.; Liu, T. Origin of the early Sinian Minle manganese deposit, Hunan Province, China. Ore Geol. Rev. 1999, 15, 71–78. [Google Scholar] [CrossRef] [Scilit]
  31. Zhu, X.; Peng, Q.; Zhang, R.; An, Z.; Zhang, F.; Yan, B.; Li, J.; Gao, Z.; Qin, Y.; Pan, W. Geological and geochemical characteristics of the Daotuo super-large manganese ore deposit at Songtao County in Guizhou Province. Acta Geol. Sin. 2013, 87, 1335–1348. [Google Scholar]
  32. SY/T 5163-2018; Analysis Method for Clay Minerals and Ordinary Non-Clay Minerals in Sedimentary Rocks by the X-Ray Diffraction. Petroleum Industry Press: Beijing, China, 2018.
  33. GB/T 14506.28-2010; Methods for Chemical Analysis of Silicate Rocks—Part 28: Determination of 16 Major and Minor Elements Content. Standards Press of China: Beijing, China, 2010.
  34. GB/T 14506.30-2010; Methods for Chemical Analysis of Silicate Rocks—Part 30: Determination of 44 Elements. Standards Press of China: Beijing, China, 2010.
  35. Taylor, S.R.; McLennan, S.M. The Continental Crust: Its Composition and Evolution; Blackwell Scientific Publications (Oxford): Oxford, UK, 1985. [Google Scholar]
  36. Sternbeck, J.; Sohlenius, G. Authigenic sulfide and carbonate mineral formation in Holocene sediments of the Baltic Sea. Chem. Geol. 1997, 135, 55–73. [Google Scholar] [CrossRef] [Scilit]
  37. Tribovillard, N.; Lyons, T.; Riboulleau, A. Trace metals as paleoredox and paleoproductivity proxies: An update. Chem. Geol. 2006, 232, 12–32. [Google Scholar] [CrossRef] [Scilit]
  38. Wilkin, R.; Barnes, H.; Brantley, S. The size distribution of framboidal pyrite in modern sediments: An indicator of redox conditions. Geochim. Cosmochim. Acta 1996, 60, 3897–3912. [Google Scholar] [CrossRef] [Scilit]
  39. He, H.; Xiao, J.; Yang, H.; Yao, L.; Yang, C. Redox conditions of Datangpo-type manganese ores constrained by statistical analysis of pyrite framboids and iron isotopes. Sediment. Geol. 2024, 463, 106606. [Google Scholar] [CrossRef] [Scilit]
  40. Bond, D.P.; Wignall, P.B. Pyrite framboid study of marine Permian–Triassic boundary sections: A complex anoxic event and its relationship to contemporaneous mass extinction. Bulletin 2010, 122, 1265–1279. [Google Scholar] [CrossRef] [Scilit]
  41. Breit, G.N.; Wanty, R.B. Vanadium accumulation in carbonaceous rocks: A review of geochemical controls during deposition and diagenesis. Chem. Geol. 1991, 91, 83–97. [Google Scholar] [CrossRef] [Scilit]
  42. Algeo, T.; Li, C. Redox classification and calibration of redox thresholds in sedimentary systems. Geochim. Cosmochim. Acta 2020, 287, 8–26. [Google Scholar] [CrossRef] [Scilit]
  43. Xie, W.; Tan, J.; Wang, W.; Schulz, H.-M.; Liu, Z.; Kang, X.; Wang, Y.; Shahzad, A.; Jan, I.U. Middle Jurassic lacustrine source rocks controlled by an aridification event: A case study in the northern Qaidam Basin (NW China). Int. J. Coal Geol. 2021, 242, 103779. [Google Scholar] [CrossRef] [Scilit]
  44. Song, X.; Hu, R.; Xie, W.; Xu, J.; Liu, X.; Xu, H.; Tan, J.; Algeo, T.J. Biogeochemical nitrogen cycle response to Middle Permian climate warming in Northwest China paleolake. Glob. Planet. Change 2025, 255, 105069. [Google Scholar] [CrossRef] [Scilit]
  45. Algeo, T.J.; Tribovillard, N. Environmental analysis of paleoceanographic systems based on molybdenum–uranium covariation. Chem. Geol. 2009, 268, 211–225. [Google Scholar] [CrossRef] [Scilit]
  46. Barling, J.; Anbar, A. Molybdenum isotope fractionation during adsorption by manganese oxides. Earth Planet. Sci. Lett. 2004, 217, 315–329. [Google Scholar] [CrossRef] [Scilit]
  47. Reinhard, C.T.; Planavsky, N.J.; Robbins, L.J.; Partin, C.A.; Gill, B.C.; Lalonde, S.V.; Bekker, A.; Konhauser, K.O.; Lyons, T.W. Proterozoic ocean redox and biogeochemical stasis. Proc. Natl. Acad. Sci. USA 2013, 110, 5357–5362. [Google Scholar] [CrossRef] [Scilit] [PubMed]
  48. Chen, X.; Tissot, F.; Jansen, M.; Bekker, A.; Liu, C.; Nie, N.; Halverson, G.; Veizer, J.; Dauphas, N. The uranium isotopic record of shales and carbonates through geologic time. Geochim. Cosmochim. Acta 2021, 300, 164–191. [Google Scholar] [CrossRef] [Scilit]
  49. Dublet, G.; Juillot, F.; Brest, J.; Noël, V.; Fritsch, E.; Proux, O.; Olivi, L.; Ploquin, F.; Morin, G. Vertical changes of the Co and Mn speciation along a lateritic regolith developed on peridotites (New Caledonia). Geochim. Cosmochim. Acta 2017, 217, 1–15. [Google Scholar] [CrossRef] [Scilit]
  50. Zhang, Z.; Yang, P.; Wen, K.; Mao, H.-R.; Zhao, Z.; Liu, C.; Zhu, Q.; Zhu, M. Manganese oxidation states and availability in forest weathering profiles of contrasting climate. Geochim. Cosmochim. Acta 2025, 388, 221–235. [Google Scholar] [CrossRef] [Scilit]
  51. McLennan, S.M. Relationships between the trace element composition of sedimentary rocks and upper continental crust. Geochem. Geophys. Geosystems 2001, 2, 1021. [Google Scholar] [CrossRef] [Scilit]
  52. Sverjensky, D.A. Europium redox equilibria in aqueous solution. Earth Planet. Sci. Lett. 1984, 67, 70–78. [Google Scholar] [CrossRef] [Scilit]
  53. Olivarez, A.M.; Owen, R.M. The europium anomaly of seawater: Implications for fluvial versus hydrothermal REE inputs to the oceans. Chem. Geol. 1991, 92, 317–328. [Google Scholar] [CrossRef] [Scilit]
  54. Klinkhammer, G.; Elderfield, H.; Edmond, J.; Mitra, A. Geochemical implications of rare earth element patterns in hydrothermal fluids from mid-ocean ridges. Geochim. Cosmochim. Acta 1994, 58, 5105–5113. [Google Scholar] [CrossRef] [Scilit]
  55. Goto, K.T.; Sekine, Y.; Shimoda, G.; Hein, J.R.; Aoki, S.; Ishikawa, A.; Suzuki, K.; Gordon, G.W.; Anbar, A.D. A framework for understanding Mo isotope records of Archean and Paleoproterozoic Fe-and Mn-rich sedimentary rocks: Insights from modern marine hydrothermal Fe-Mn oxides. Geochim. Cosmochim. Acta 2020, 280, 221–236. [Google Scholar] [CrossRef] [Scilit]
  56. Xie, W.; Ma, G.; Ma, X.; Wang, Y.; Cao, T.; Wu, S. Paleo-ocean environmental fluctuations controlling manganese mineralization and organic matter enrichment in the Cryogenian Datangpo Formation, Western Hunan, China. Ore Geol. Rev. 2026, 193, 107261. [Google Scholar] [CrossRef] [Scilit]
  57. Tan, Z.; Xu, J.; Liao, F.; Luo, Y.; Li, S.; Wei, H.; Liao, J.; Fan, H.F. New precipitation mechanism in the Permian manganese ore belt in the central south China block: A case study of the Dongxiangqiao manganese deposit. Ore Geol. Rev. 2025, 183, 106693. [Google Scholar] [CrossRef] [Scilit]
  58. Xu, H.; Gao, J.; Yang, R.; Feng, K.; Wang, L.; Chen, J. Metallogenic mechanism of large manganese deposits from Permian manganese ore belt in western South China Block: New mineralogical and geochemical evidence. Ore Geol. Rev. 2021, 132, 103993. [Google Scholar] [CrossRef] [Scilit]
  59. Marchig, V.; Gundlach, H.; Möller, P.; Schley, F. Some geochemical indicators for discrimination between diagenetic and hydrothermal metalliferous sediments. Mar. Geol. 1982, 50, 241–256. [Google Scholar] [CrossRef] [Scilit]
  60. Boström, K. Genesis of ferromanganese deposits-diagnostic criteria for recent and old deposits. In Hydrothermal Processes at Seafloor Spreading Centers; Springer: Boston, MA, USA, 1983; pp. 473–489. [Google Scholar]
  61. Jensen, D.L.; Boddum, J.K.; Tjell, J.C.; Christensen, T.H. The solubility of rhodochrosite (MnCO3) and siderite (FeCO3) in anaerobic aquatic environments. Appl. Geochem. 2002, 17, 503–511. [Google Scholar] [CrossRef] [Scilit]
  62. Johnson, J.E.; Webb, S.M.; Ma, C.; Fischer, W.W. Manganese mineralogy and diagenesis in the sedimentary rock record. Geochim. Cosmochim. Acta 2016, 173, 210–231. [Google Scholar] [CrossRef] [Scilit]
  63. Chen, F.; Wang, Q.; Pufahl, P.K.; Matheson, E.J.; Xian, H.; Nan, J.; Ma, H.; Deng, J. Carbonate-hosted manganese deposits and ocean anoxia. Earth Planet. Sci. Lett. 2023, 622, 118385. [Google Scholar] [CrossRef] [Scilit]
  64. Alibo, D.S.; Nozaki, Y. Rare earth elements in seawater: Particle association, shale-normalization, and Ce oxidation. Geochim. Cosmochim. Acta 1999, 63, 363–372. [Google Scholar] [CrossRef] [Scilit]
  65. Yu, W.; Algeo, T.J.; Du, Y.; Zhou, Q.; Wang, P.; Xu, Y.; Yuan, L.; Pan, W. Newly discovered Sturtian cap carbonate in the Nanhua Basin, South China. Precambrian Res. 2017, 293, 112–130. [Google Scholar] [CrossRef] [Scilit]
  66. Yu, W.; Algeo, T.J.; Zhou, Q.; Wei, W.; Yang, M.; Li, F.; Du, Y.; Pan, W.; Wang, P. Evaluation of alkalinity sources to Cryogenian cap carbonates, and implications for cap carbonate formation models. Glob. Planet. Change 2022, 217, 103949. [Google Scholar] [CrossRef] [Scilit]
  67. Hoffman, P.F.; Schrag, D.P. The snowball Earth hypothesis: Testing the limits of global change. Terra Nova 2002, 14, 129–155. [Google Scholar] [CrossRef] [Scilit]
  68. Cheng, M.; Li, C.; Chen, X.; Zhou, L.; Algeo, T.J.; Ling, H.-F.; Feng, L.-J.; Jin, C.-S. Delayed Neoproterozoic oceanic oxygenation: Evidence from Mo isotopes of the Cryogenian Datangpo Formation. Precambrian Res. 2018, 319, 187–197. [Google Scholar] [CrossRef] [Scilit]
  69. Cai, C.; Lyons, T.W.; Sun, P.; Liu, D.; Wang, D.; Tino, C.J.; Luo, G.; Peng, Y.; Jiang, L. Enigmatic super-heavy pyrite formation: Novel mechanistic insights from the aftermath of the Sturtian Snowball Earth. Geochim. Cosmochim. Acta 2022, 334, 65–82. [Google Scholar] [CrossRef] [Scilit]
  70. Brocks, J.J.; Jarrett, A.J.; Sirantoine, E.; Hallmann, C.; Hoshino, Y.; Liyanage, T. The rise of algae in Cryogenian oceans and the emergence of animals. Nature 2017, 548, 578–581. [Google Scholar] [CrossRef] [Scilit] [PubMed]
  71. Lau, K.V.; Macdonald, F.A.; Maher, K.; Payne, J.L. Uranium isotope evidence for temporary ocean oxygenation in the aftermath of the Sturtian Snowball Earth. Earth Planet. Sci. Lett. 2017, 458, 282–292. [Google Scholar] [CrossRef] [Scilit]
Figure 2. Representative lithologies from the Upper Tiesi’ao Formation and the First Member of the Datangpo Formation. (a) Diamictite from the Tiesi’ao Formation in Xiangtan; (b) siltstone from the Tiesi’ao Formation in Xiangtan; (c) Mn ore from the Datangpo Formation in the Lannitian deposit; (d) Mn ore from the Datangpo Formation in Minle; (e) Mn ore from the Datangpo Formation in Xiangtan; (f) black shale from the Datangpo Formation in Xiangtan.
Applsci 16 08590 g002
Figure 3. Representative photomicrographs of Mn ores and Mn-containing shales from the Datangpo Formation in western and central Hunan. (a) Rhodochrosite aggregates in Mn ore from the Lannitian deposit, sample LNT-1; (b) rhodochrosite aggregates in Mn ore from the Minle deposit, sample M-2; (c) rhodochrosite aggregates in Mn ore from the Xiangtan deposit, sample NMC-1; (d) rhodochrosite associated with quartz in Mn ore from the Xiangtan deposit, sample XT-21-1; (e) sparse rhodochrosite and quartz in Mn-containing shale from the Xiangtan deposit, sample XT-27-1; (f) rhodochrosite and quartz in Mn-containing shale from the Minle deposit, sample M-4. Abbreviations: Rds, rhodochrosite; Qtz, quartz.
Applsci 16 08590 g003
Figure 4. Relationships between MnO and major element contents in samples from western and central Hunan. (a) MnO versus SiO2; (b) MnO versus Al2O3; (c) MnO versus MgO; (d) MnO versus CaO; (e) MnO versus K2O; (f) MnO versus TiO2; (g) MnO versus Fe2O3; (h) MnO versus Na2O; (i) MnO versus P2O5. Red and blue dashed lines represent least-squares linear regressions for central and western Hunan, respectively. Red and blue R2 and p values correspond to central and western Hunan, respectively. R2 denotes the coefficient of determination, and p denotes the p value of the Pearson correlation test. Correlations are considered significant at p < 0.05, marginally significant at 0.05 ≤ p < 0.10, and not significant at p ≥ 0.10.
Applsci 16 08590 g004
Figure 5. PAAS-normalized trace element patterns and elemental enrichment factors of Mn ores from western and central Hunan. (a) PAAS-normalized trace element patterns; (b) elemental enrichment-factor patterns. Magenta and blue lines represent samples from western and central Hunan, respectively. Squares, circles, and diamonds denote low-, medium-, and high-grade Mn ores, respectively.
Applsci 16 08590 g005
Figure 6. PAAS-normalized REE–Y patterns of Datangpo Formation Mn ores from Hunan and coeval comparison deposits. (a) Mn ores analyzed in this study from western and central Hunan; (bd) published data for Mn ores from the Daotuo, Xixibao, and Xiaochayuan deposits, respectively [14,19,20]. REE and Y concentrations are normalized to PAAS values. Y data are unavailable for the Xiaochayuan samples.
Applsci 16 08590 g006
Figure 7. Representative SEM–BSE images showing mineral assemblages and microtextures of Mn ores from the Datangpo Formation. (a,b) Lannitian Mn ores, samples LNT-3 and LNT-2, showing fine-grained rhodochrosite aggregates and associated quartz. (c,d) Minle Mn ore, sample M-2. Panel (c) shows a natural fracture surface with closely packed individual rhodochrosite grains, whereas panel (d) shows the corresponding fine-grained texture on a polished surface, together with pyrite and organic matter. (eh) Xiangtan Mn ores from the Nanmuchong mining area, samples NMC-1, NMC-1, NMC-4, and NMC-2, showing fine-grained rhodochrosite aggregates and pyrite with different morphologies. (i) Xiangtan Mn ore from the Xiangtan Mn Mine Park, sample XT-21-1, showing closely packed fine-grained rhodochrosite. Except for (c), all images were obtained from polished surfaces. Abbreviations: Rds, rhodochrosite; Qtz, quartz; Py, pyrite; OM, organic matter.
Applsci 16 08590 g007
Figure 8. SEM-BSE images and EDS spectra of sulfide minerals in sample NMC-1 from the Datangpo Formation. (a) Galena, sphalerite, and pyrite hosted by rhodochrosite; (b) galena and pyrite associated with rhodochrosite; (c) Cu–Fe sulfide; (d) EDS spectrum of galena; (e) EDS spectrum of sphalerite; (f) EDS spectrum of Cu–Fe sulfide. Rds, rhodochrosite; Py, pyrite; EDS, energy-dispersive spectroscopy.
Applsci 16 08590 g008
Figure 9. X-ray diffraction patterns of representative Mn ore samples from the Datangpo Formation. Left panels show bulk-rock XRD patterns, and right panels show XRD patterns of oriented clay-mineral aggregates under air-dried, ethylene glycol-solvated, and heated conditions at 550 °C. Abbreviations: Qtz, quartz; Rds, rhodochrosite; Dol, dolomite; Py, pyrite; It, illite; Kao, kaolinite; Gyp, gypsum.
Applsci 16 08590 g009
Figure 10. Typical pyrite textures in Mn ores and Mn-containing shales from the first member of the Datangpo Formation. (a) Pyrite framboids with variable sizes in high-grade Mn ore from the Minle deposit; (b) radial pyrite framboids and typical pyrite framboids in high-grade Mn ore from the Minle deposit; (c) spongy pyrite in high-grade Mn ore from the Lannitian deposit; (d) anhedral pyrite in high-grade Mn ore from the Lannitian deposit; (e) subhedral pyrite in medium-grade Mn ore from the Xiangtan deposit; (f) pyrite framboids in medium-grade Mn ore from the Lannitian deposit; (g) pyrite framboids in Mn-containing shale from the Minle deposit, sample M-5; (h) pyrite framboids in Mn-containing shale from the Xiangtan deposit, sample XT-26-1; (i) secondary overgrowth of a pyrite framboid in Mn-containing shale from the Xiangtan deposit.
Applsci 16 08590 g010
Figure 11. Pyrite framboid diameter distributions in samples of the Datangpo Formation in western and central Hunan. (a) Box plots of framboid diameter data; (b) redox discrimination diagram based on pyrite framboid size, modified after Wilkin et al. [38].
Applsci 16 08590 g011
Figure 12. Geochemical constraints on redox conditions during Mn mineralization in the Datangpo Formation of western and central Hunan. (a) MnO versus V/Ni; (b) MnO versus Ni/Co; (c) MoEF–UEF covariation diagram, modified after Algeo and Tribovillard [45]; (d) MnO versus shale-normalized Ce anomaly. The dashed lines in (c) represent multiples of the modern seawater Mo/U molar ratio, and the shaded field denotes the particulate-shuttle domain. Abbreviations: EF, enrichment factor; SN, shale-normalized; SW, seawater.
Applsci 16 08590 g012
Figure 14. Conceptual models for the formation of Mn ores and manganiferous shale in the Datangpo Formation. (a) Formation model of high- to medium-grade Mn ores under oxic to weakly dysoxic conditions with hydrothermal Mn input and oxidation-reduction cycling; (b) depositional model of low-grade Mn ores and manganiferous shale under anoxic conditions with enhanced organic matter accumulation and sulfate reduction.
Applsci 16 08590 g014
Table 1. Bulk mineral compositions of the studied samples based on X-ray diffraction analysis.
SampleQuartzK-FeldsparPlagioclaseDolomitePyriteGypsumRhodochrositeClay Minerals
NMC-126.70.21.9174.8/22.427
NMC-229.7/0.227.83.34.514.320.2
LNT-130.3//20.84.31.427.116.1
Note. Mineral contents are given in wt.%. “/” indicates that the mineral was not detected by XRD analysis.
Table 2. Relative clay mineral contents of the studied samples based on X-ray diffraction analysis.
SampleSI/SItKaoCC/S
NMC-1//100///
NMC-2/127117//
LNT-1//100///
Note. Values represent the relative proportions of individual clay minerals within the total clay mineral fraction and sum to 100%. S, smectite; I/S, mixed-layer illite–smectite; It, illite; Kao, kaolinite; C, chlorite; C/S, mixed-layer chlorite–smectite. “/” indicates that the mineral was not detected.
Table 3. Statistics of pyrite morphology and framboid size in the Datangpo Formation.
SampleLithologyMnO (wt.%)Subhedral and Anhedral
Pyrite
Pyrite FramboidsRedox
AbundanceAbundanceMinMaxMeanSD
NMC-1Medium-grade Mn ore19.3ModerateModerate1.99.65.31.5Anoxic-dysoxic
NMC-2Medium-grade Mn ore14.5ModerateRare4.215.36.33.1Dysoxic
NMC-3High-grade Mn ore23.8HighRare4.718.47.44.6Dysoxic
NMC-4High-grade Mn ore31.5HighRaren.d.n.d.n.d.n.d.Oxic
NMC-5High-grade Mn ore29.0HighRaren.d.n.d.n.d.n.d.Oxic
XT-21-1Low-grade Mn ore9.1ModerateHigh3.215.66.42.9Dysoxic
XT-26-1Black shale0.3RareHigh2.89.05.01.4Anoxic
XT-26-2Black shale0.2RareHigh1.812.14.81.8Anoxic
LNT-1High-grade Mn ore20.3HighRaren.d.n.d.n.d.n.d.Oxic
LNT-2High-grade Mn ore20.4HighRaren.d.n.d.n.d.n.d.Oxic
LNT-3Medium-grade Mn ore15.2HighLow3.412.46.11.5Dysoxic
M-1High-grade Mn ore29.6HighRare3.124.57.52.9Oxic
M-2High-grade Mn ore30.3HighRare3.312.86.52.4Oxic
M-3Medium-grade Mn ore13.1ModerateLow3.317.37.13.6Dysoxic
M-4Black shale2.7RareHigh2.18.14.41.4Anoxic
Table 4. Elemental geochemical indicators of Mn ores and black shale from the Datangpo Formation.
SampleDeposit/Sampling LocalityMnO
(wt.%)
V/NiNi/CoMoEFUEF(Ce/Ce*)SNFe/TiAl/
(Al + Fe + Mn)
Eu*
NMC-1Xiangtan deposit—Nanmuchong19.292.61.836.85.50.98.10.20.94
NMC-2Xiangtan deposit—Nanmuchong14.524.01.620.21.81.110.20.20.95
NMC-3Xiangtan deposit—Nanmuchong23.843.61.322.21.61.24.00.11.14
NMC-4Xiangtan deposit—Nanmuchong31.515.01.249.32.31.20.10.11.11
NMC-5Xiangtan deposit—Nanmuchong29.045.01.333.82.11.20.10.11.11
NMC-6Xiangtan deposit—Nanmuchong8.465.21.912.92.50.93.90.60.84
NMC-7Xiangtan deposit—Nanmuchong2.534.62.115.93.20.55.50.60.81
XT-27-1Xiangtan deposit—Xiangtan Mn Mine Park12.542.41.523.53.50.515.40.21.06
XT-21-1Xiangtan deposit—Xiangtan Mn Mine Park9.134.11.731.21.51.04.90.40.87
XT-26-1Xiangtan deposit—Xiangtan Mn Mine Park0.261.52.52.91.30.88.40.71.03
XT-26-2Xiangtan deposit—Xiangtan Mn Mine Park0.151.52.02.51.10.87.40.71.00
LNT-1Lannitian deposit20.330.61.314.32.21.320.50.10.97
LNT-2Lannitian deposit20.440.91.310.02.01.418.60.10.96
LNT-3Lannitian deposit15.181.41.210.81.51.117.30.30.94
LNT-4Lannitian deposit11.264.31.616.01.90.48.90.80.87
LNT-5Lannitian deposit2.344.61.512.62.30.212.70.50.78
M-1Minle deposit29.571.30.520.11.51.223.30.11.03
M-2Minle deposit30.272.20.616.11.61.119.40.10.98
M-3Minle deposit13.073.21.328.71.21.010.50.30.92
M-4Minle deposit2.664.20.89.72.80.910.80.61.1
M-5Minle deposit1.334.91.38.81.30.37.60.70.76
Disclaimer/Publisher’s Note: The statements, opinions and data contained in all publications are solely those of the individual author(s) and contributor(s) and not of MDPI and/or the editor(s). MDPI and/or the editor(s) disclaim responsibility for any injury to people or property resulting from any ideas, methods, instructions or products referred to in the content.