1. Introduction
The depletion of shallow mineral resources has driven extraction to greater depths, where rock masses are exposed to complex, high-geostress conditions [
1,
2,
3]. Evaluating the stability of deep underground excavations has therefore become a major challenge in mining engineering [
4]. Geological and tectonic processes produce pervasive discontinuities, including fractures, joints, and other structural defects [
5]. These discontinuities redirect stress and alter energy dissipation, promoting crack initiation, propagation, and coalescence under mining-induced disturbance. In natural rock masses, discontinuities commonly form intersecting or networked systems rather than isolated features. Their orientations and connectivity can therefore govern mechanical response and failure. Understanding how intersecting fissures influence damage evolution is essential for assessing stability and designing support systems in deep excavations.
Previous studies have established that fissure geometry strongly influences crack evolution in rock [
6]. Wong and Einstein characterized crack initiation and propagation from single flaws under uniaxial compression [
7]. Park and Bobet subsequently identified wing, coplanar shear, and oblique shear cracks in specimens containing frictional flaws [
8]. Experiments on specimens with multiple flaws have shown that flaw number and arrangement alter crack interactions and coalescence sequences [
9,
10]. Combined experimental and numerical studies have further demonstrated strong effects of non-coplanar fissures on crack-initiation stress, peak strength, and failure mode [
11]. Related work has examined coalescence among multiple flaws and provided numerical interpretations of the linkage process [
12,
13]. A recent review synthesized experimental, theoretical, and numerical advances in compression-induced cracking of flawed rock [
14]. Tests on layered specimens with parallel joints have also shown that joint orientation and rock-bridge geometry jointly control failure progression [
15]. Together, these studies indicate that position, number, length, orientation, shape, and bridge geometry govern the mechanical response of fissured rock [
16,
17].
Acoustic emission (AE) monitoring detects transient elastic waves generated by microcrack initiation and propagation and can therefore track internal damage in real time [
18,
19,
20]. Its application to crack detection and monitoring has been reviewed across laboratory and engineering settings [
21]. For fissured sandstone, combined AE and three-dimensional digital image correlation has revealed distinct acoustic and optical signatures of different fracture processes [
22,
23]. AE event rates in flawed granite also exhibit recognizable transitions from damage onset to ultimate failure [
24]. Multi-parameter AE studies of single-fissure sandstone have linked signal evolution to successive stages of crack growth [
25]. Under biaxial compression, AE characteristics have also shown potential for identifying principal stress directions in granite [
26]. Moreover, rise angle (RA) and average frequency (AF) can help distinguish tensile from shear cracking [
27,
28]. AE monitoring, particularly when combined with RA–AF analysis, thus provides a useful framework for connecting internal damage evolution with macroscopic failure.
Despite this progress, most studies have considered single fissures, parallel fissures, or multiple non-intersecting fissures. The mechanical and AE responses of rock containing intersecting fissures remain less systematically characterized. Studies of unfilled cross fissures in rock-like materials and orthogonal cross fissures in red sandstone have demonstrated pronounced geometry-dependent cracking [
17,
29]. However, the coupled effects of intersection angle, fissure arrangement, and connectivity on stress redistribution, crack coalescence, and AE evolution remain unclear. In particular, the relationship between macroscopic weakening and microscopic fracture activity requires further investigation across well-controlled intersecting-fissure configurations.
This study investigates sandstone specimens with several intersecting-fissure configurations under uniaxial compression and synchronous AE monitoring. We quantify peak strength, peak strain, and elastic modulus; identify the stages of crack activation and coalescence; and evaluate ring-down count, dominant-frequency, and RA–AF characteristics. We hypothesize that fissure geometry controls both the mechanical degradation and the temporal evolution of AE activity by modifying stress concentration, fissure closure, and crack-linkage paths.
3. Results
3.1. Stress–Strain Curves
To evaluate the effect of fissure geometry on sandstone behavior, stress–strain curves were analyzed for each configuration.
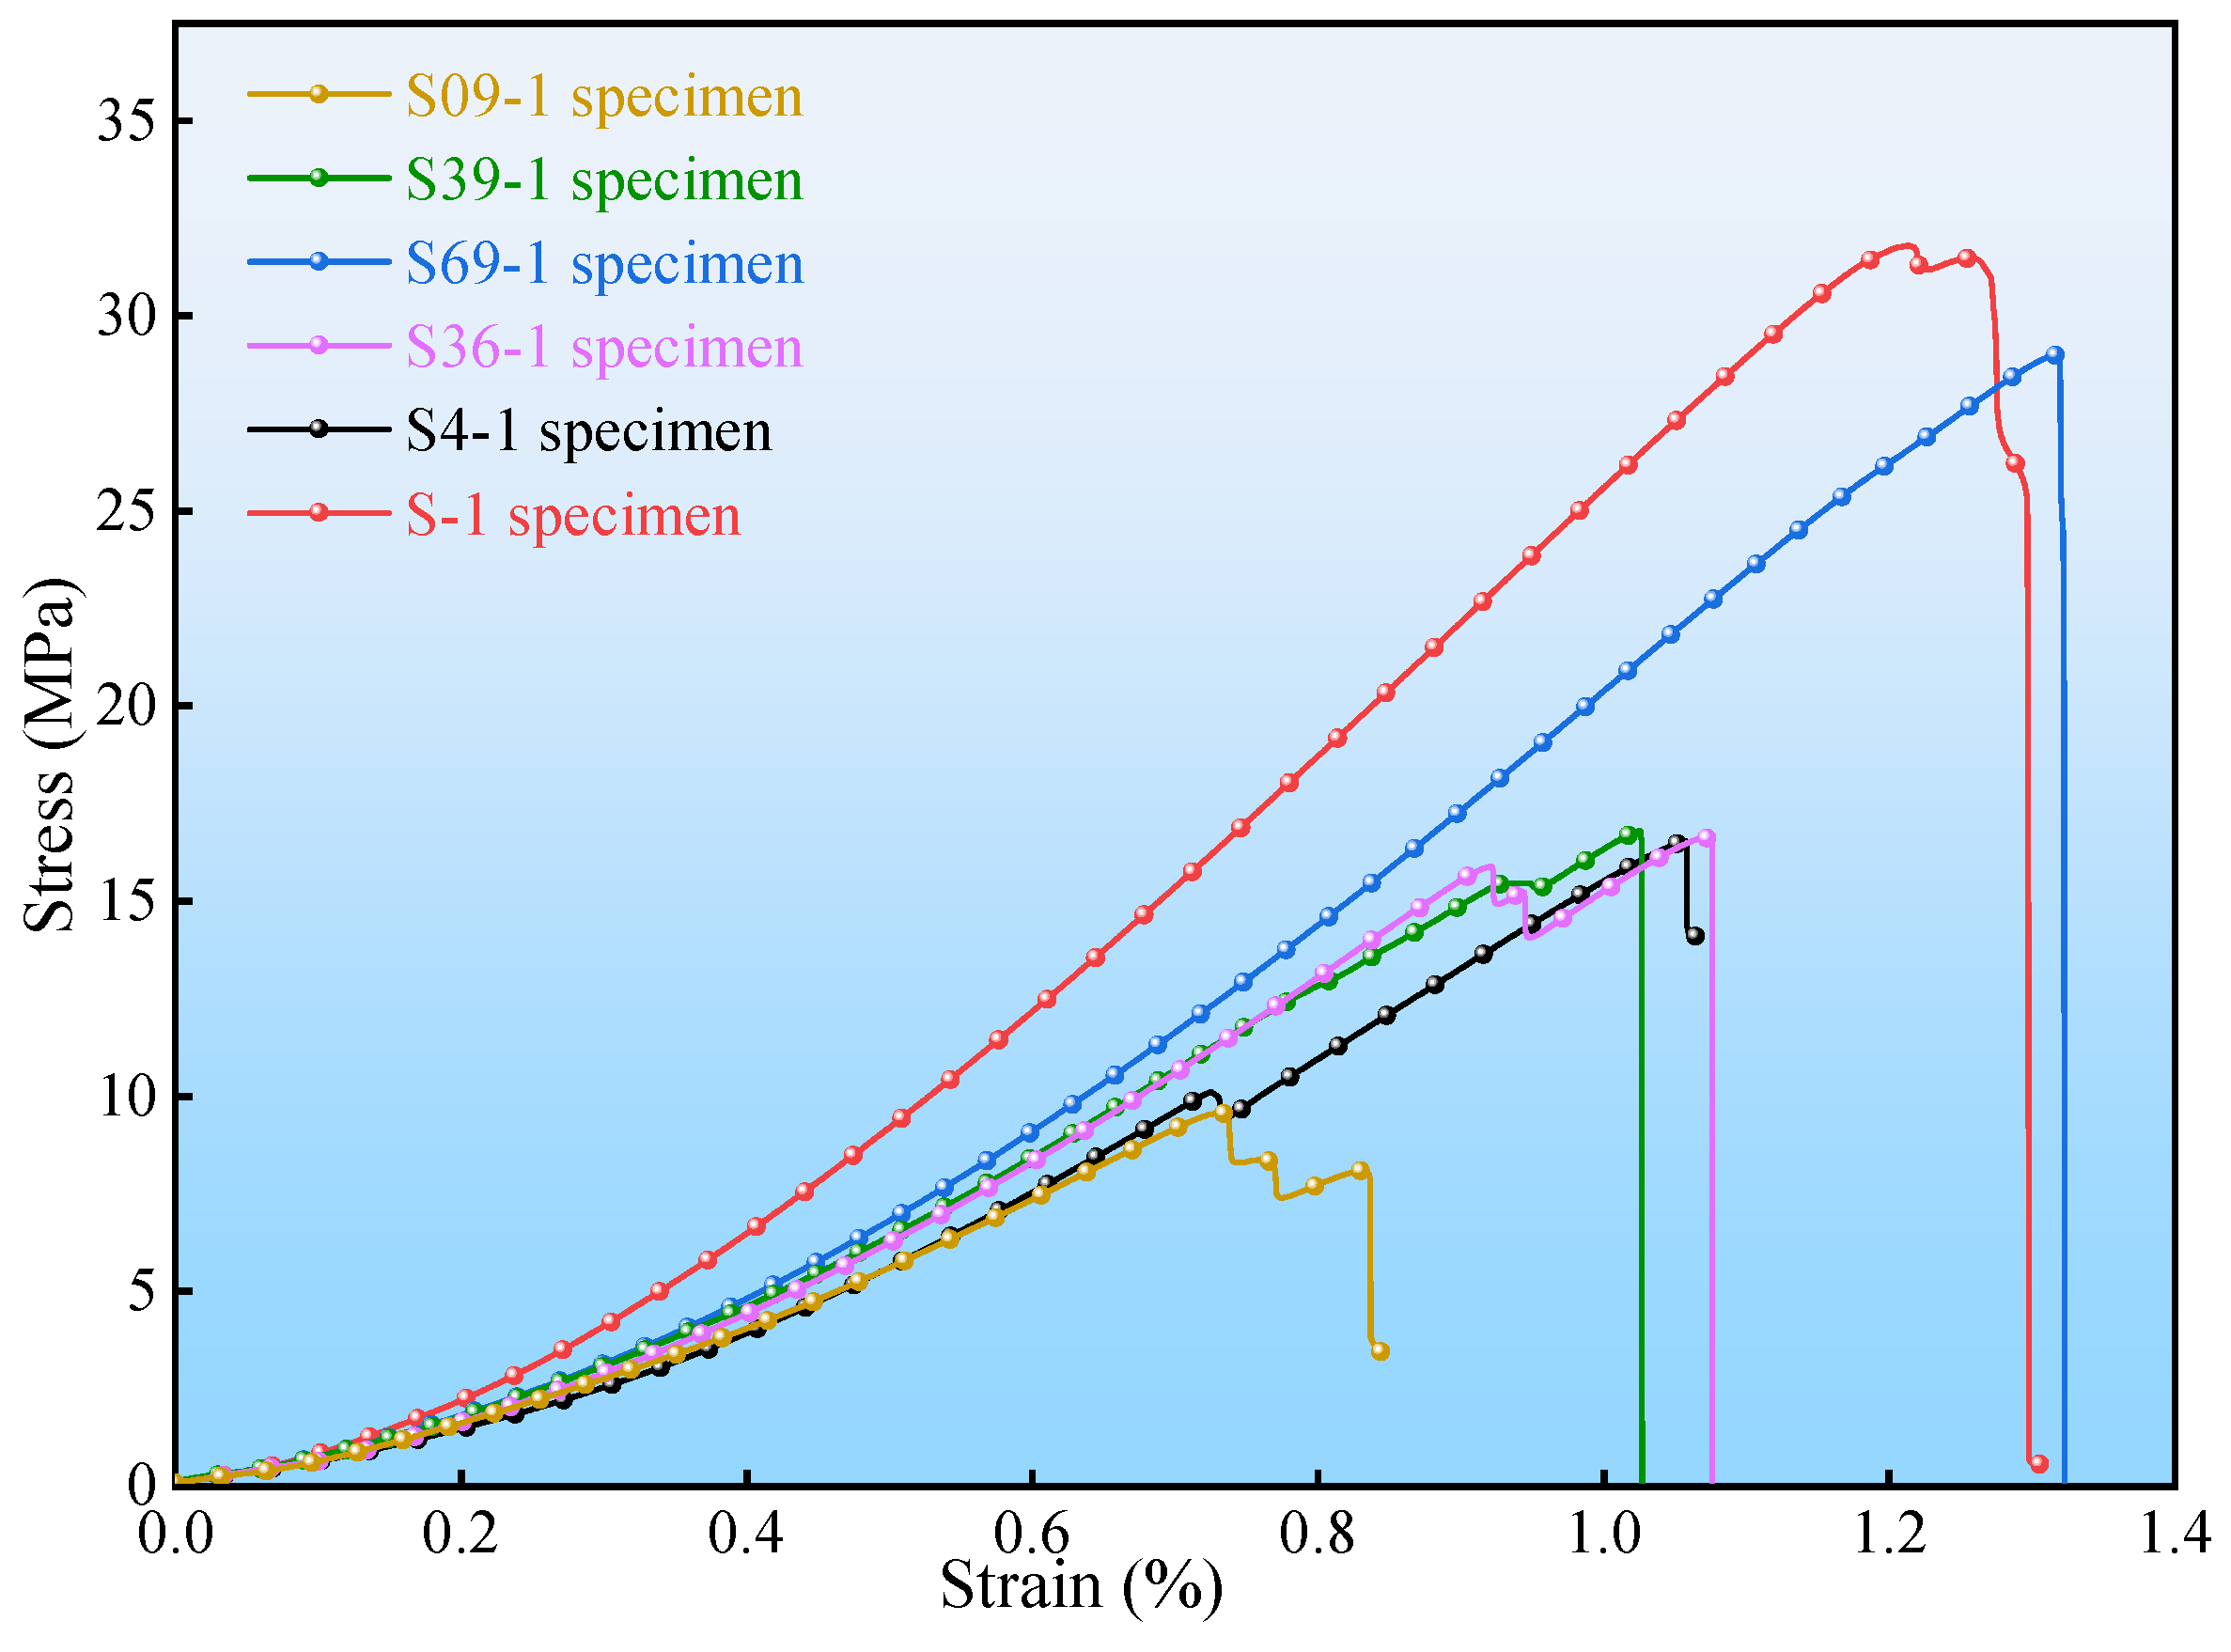
Figure 5 presents representative results for the S09-1, S39-1, S69-1, S36-1, S4-1, and S-1 specimens.
As shown in
Figure 5, the pre-peak stress–strain curves of the intact and fissured specimens comprised three stages: compaction, approximately linear elastic deformation, and irreversible deformation. During initial loading, the curves were concave upward because pores and inherent microcracks progressively closed. The response then became approximately linear until the stress exceeded the elastic limit. Beyond this point, irreversible deformation accumulated until peak stress and failure. The duration and shape of these stages varied markedly among fissure configurations.
Specimen S-1 had the steepest initial slope and the shortest compaction stage, indicating comparatively high initial integrity. In contrast, S09-1 showed the longest compaction stage and the lowest initial slope, consistent with greater compliance introduced by its fissure configuration.
All specimens except S69-1 exhibited stress drops of varying magnitude. Most occurred near peak stress, whereas the first drop in S4-1 appeared substantially earlier. This early drop marked macroscopic crack initiation, although the specimen retained considerable load-bearing capacity.
The post-peak stress in S09-1 decreased gradually, indicating progressive failure associated with crack coalescence. The other specimens showed abrupt post-peak drops, characteristic of brittle failure and rapid loss of load-bearing capacity.
3.2. Strength and Deformation Characteristics
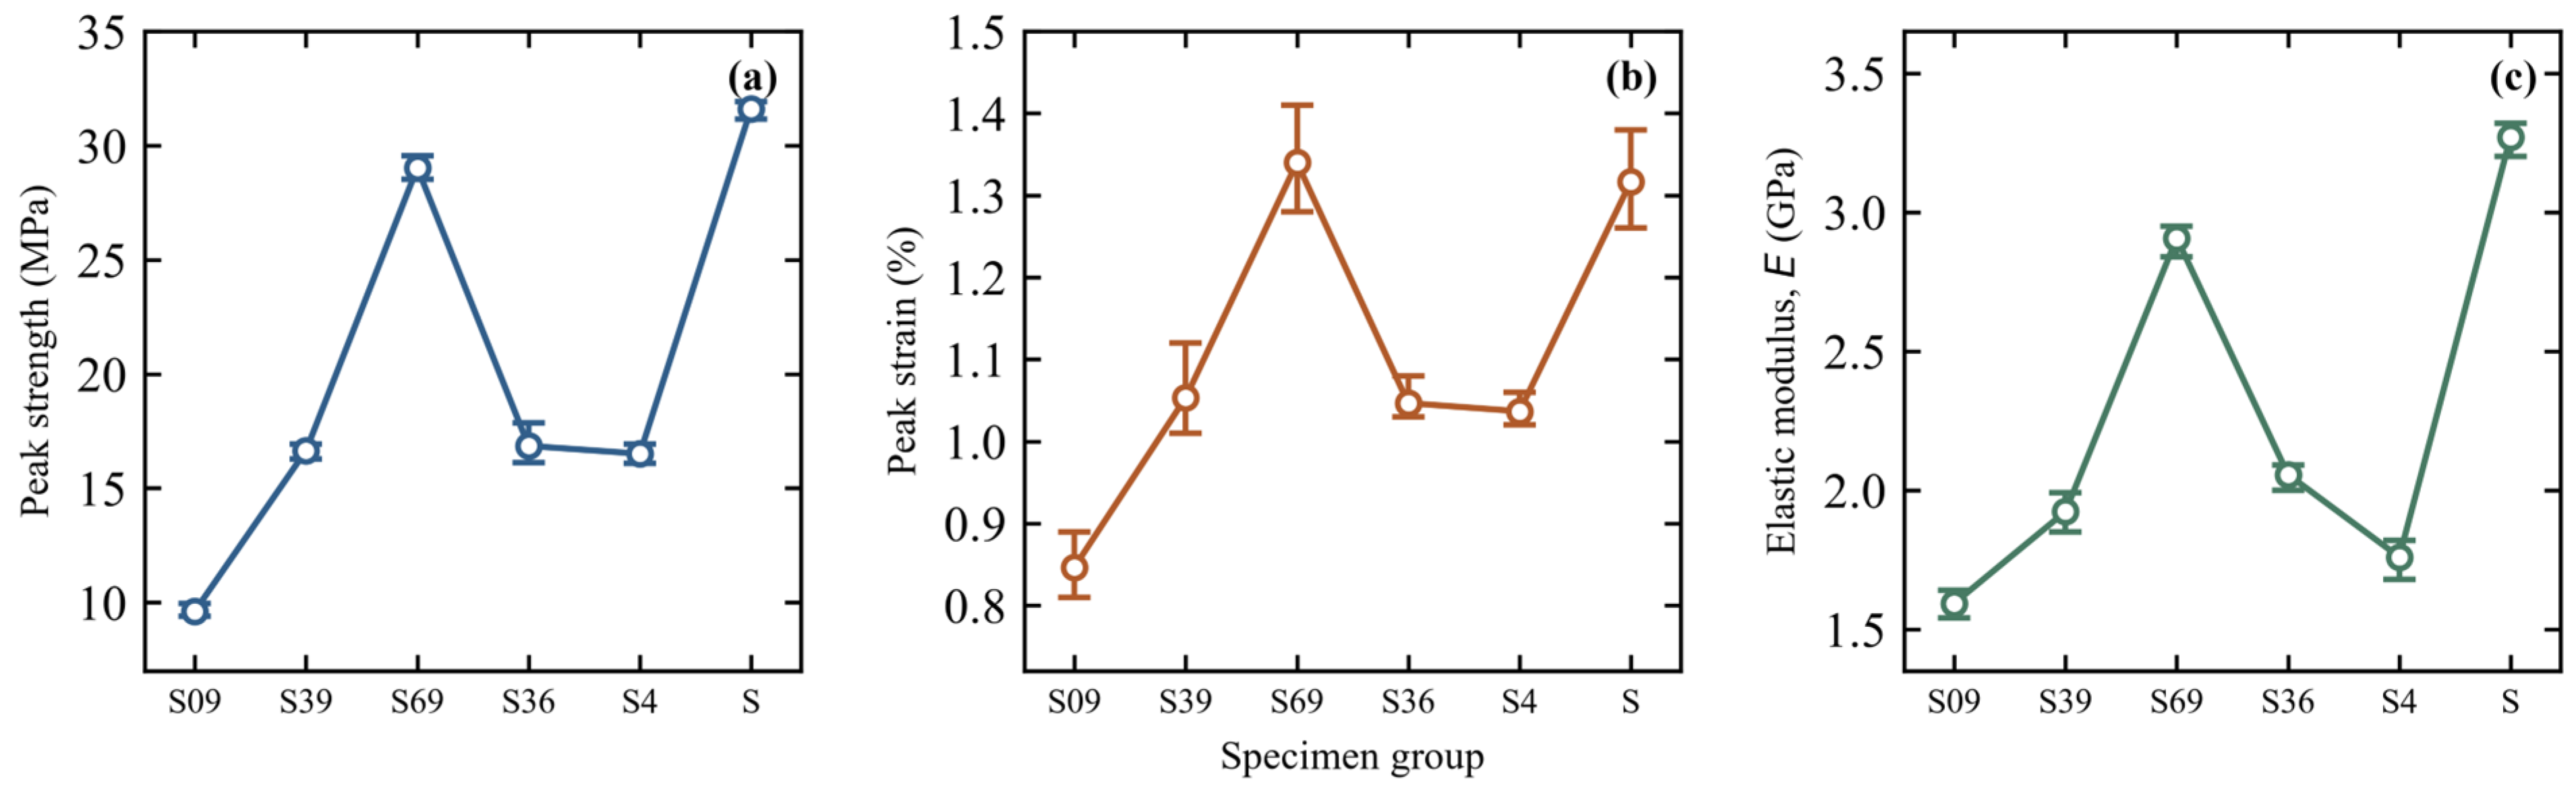
Peak strength, peak strain, and elastic modulus were quantified to evaluate the effects of intersecting-fissure configuration on sandstone strength and deformation. The results are summarized in
Table 1 and
Figure 6.
Table 1 and
Figure 6 compare the peak strength, peak strain, and elastic modulus of the intact and fissured sandstone groups. Coefficients of variation ranged from 1.30% to 5.56%, indicating limited dispersion among the three replicates in each group.
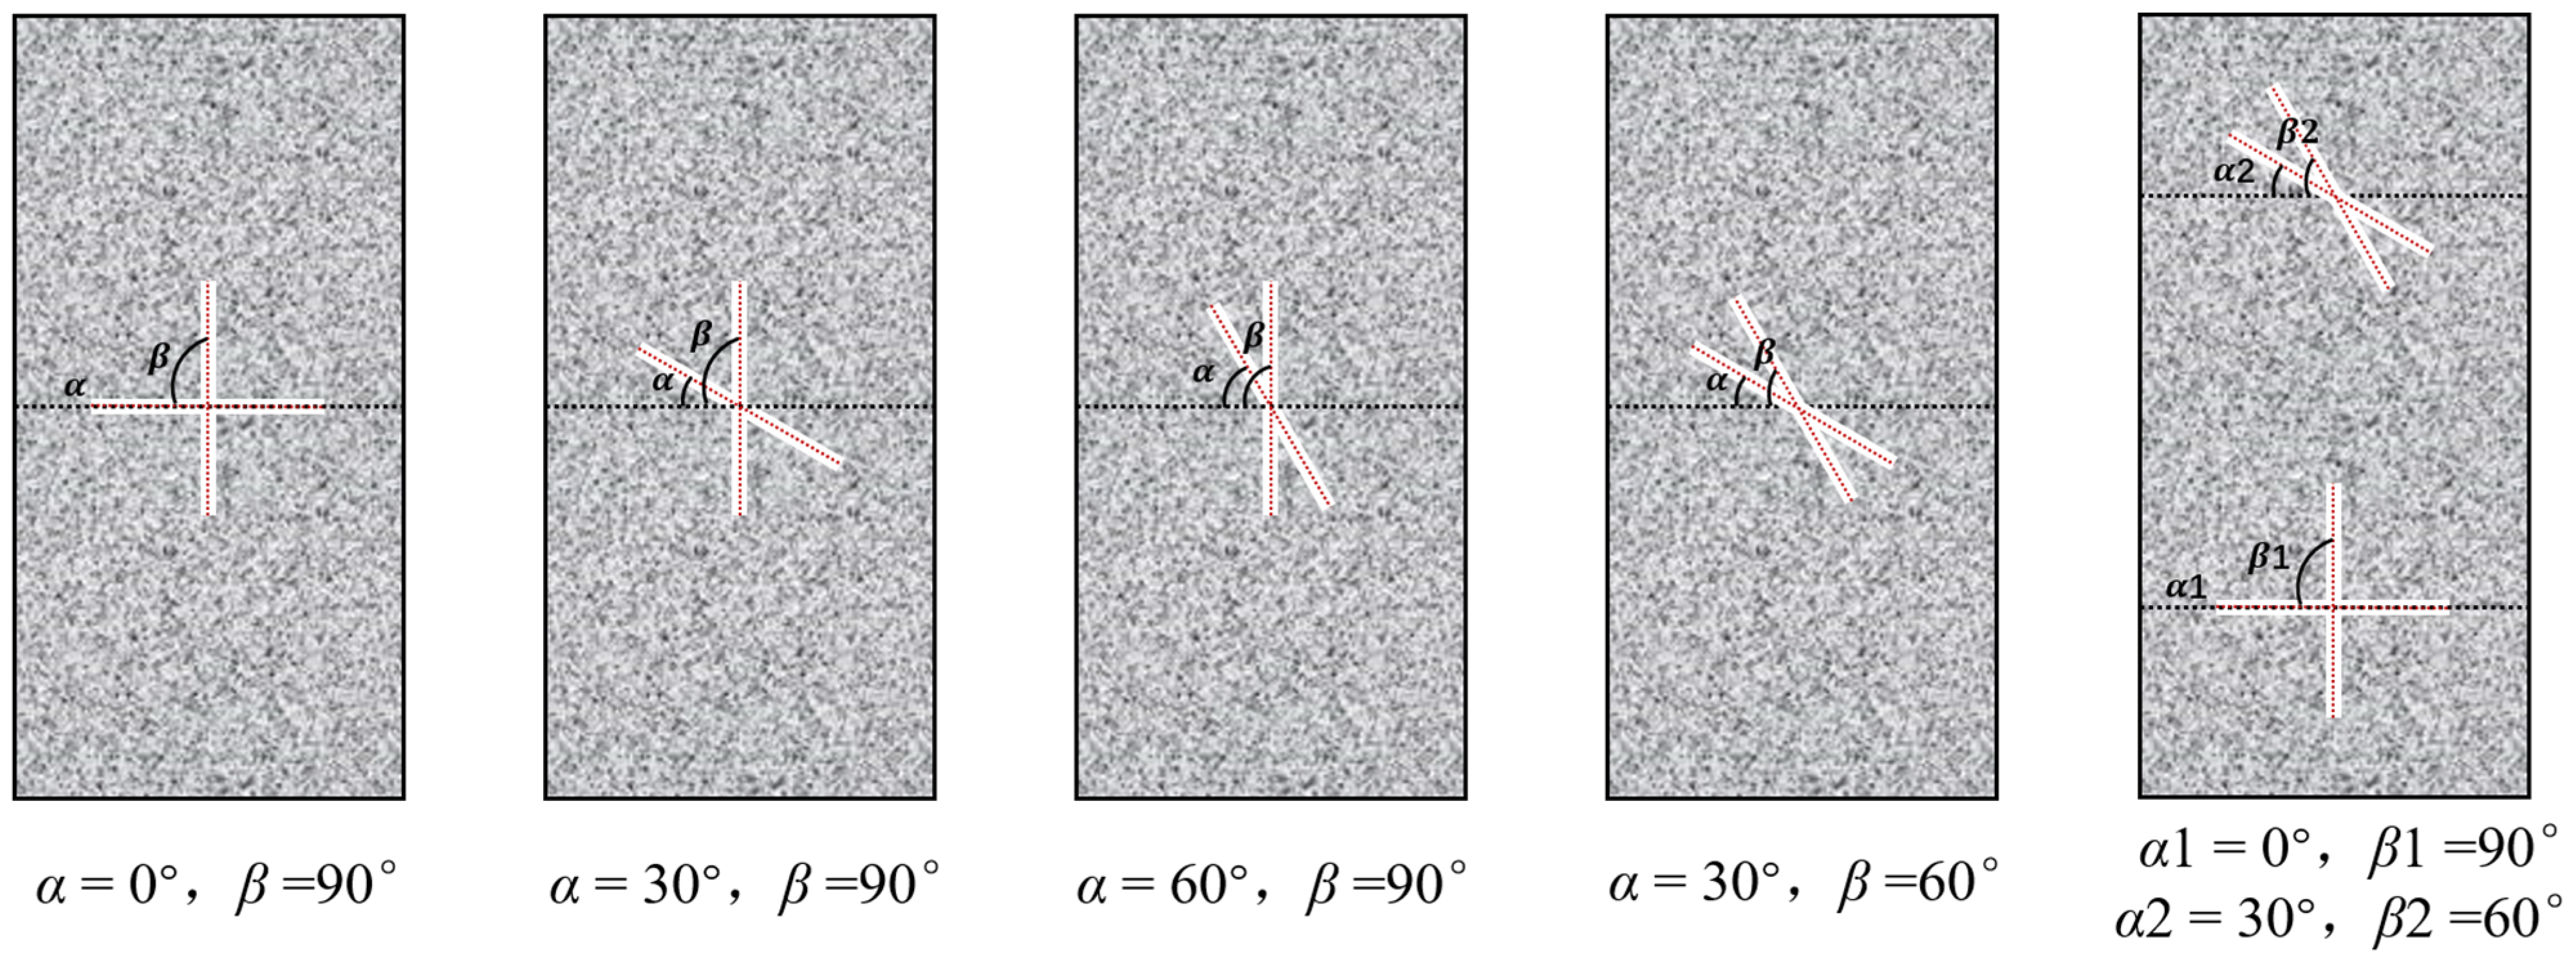
Intact sandstone had the highest mean strength (31.62 MPa), whereas every fissured group was weaker. S09 showed the greatest reduction, with a mean strength of 9.62 MPa, 69.57% below that of the intact group. At constant β = 90°, mean strength increased from 9.62 MPa for S09 to 16.65 MPa for S39 and 29.02 MPa for S69 as α increased from 0° to 60°. The corresponding reductions relative to intact sandstone were 69.57%, 47.33%, and 8.20%, demonstrating a strong dependence on fissure inclination.
The mean strengths of S39, S36, and S4 were similar at 16.65, 16.85, and 16.51 MPa, respectively. These values were 47.33%, 46.69%, and 47.78% lower than that of the intact group. Because these groups had different fissure geometries, peak strength depended on both inclination and spatial arrangement.
Peak strain showed a comparable configuration-dependent pattern. The intact and S69 groups had the highest mean peak strains, 1.32% and 1.34%, respectively. The 1.77% difference between them was small relative to the descriptive variability. The mean peak strains for S39, S36, and S4 were 1.05%, 1.05%, and 1.04%, corresponding to reductions of 20.00%, 20.00%, and 21.27% relative to the intact group. S09 had the lowest mean peak strain (0.85%), a reduction of 35.70%. Thus, the low-inclination orthogonal configuration reduced both strength and axial deformation capacity.
Elastic modulus further demonstrated the influence of fissure configuration on stiffness. The intact group had the highest mean modulus (3.27 GPa), followed by S69 (2.91 GPa), which was 11.11% lower. The moduli of S39 and S36 were 1.92 and 2.06 GPa, reductions of 41.18% and 37.10%, respectively. Although S4 had a peak strength comparable to S39 and S36, its modulus was lower at 1.76 GPa. This value was approximately 14.4% below that of S36, suggesting that greater fissure density increased compliance without proportionally reducing peak strength. S09 had the lowest modulus (1.59 GPa), which was 51.27% below that of intact sandstone.
The pronounced weakening of S09 is consistent with interruption of the axial load-transfer path and interaction between stress concentrations at the fissure tips and central intersection. These localized concentrations promote crack initiation and subsequent coalescence. As α increased, the inclined fissure became more favorably oriented for closure under axial compression. Contact, frictional sliding, and geometric interlocking could then partially restore load transfer and impede the formation of a through-going failure path, explaining the comparatively high strength and stiffness of S69.
The comparison among S39, S36, and S4 suggests that fissure inclination, density, and position influence different aspects of the response. Peak strength depends primarily on whether interacting cracks form a continuous macroscopic failure path, whereas elastic modulus is more sensitive to the distributed compliance of the fissure population. This distinction explains why S4 had a strength comparable to S39 and S36 but a lower modulus.
3.3. Evolution of Acoustic Emission Parameters
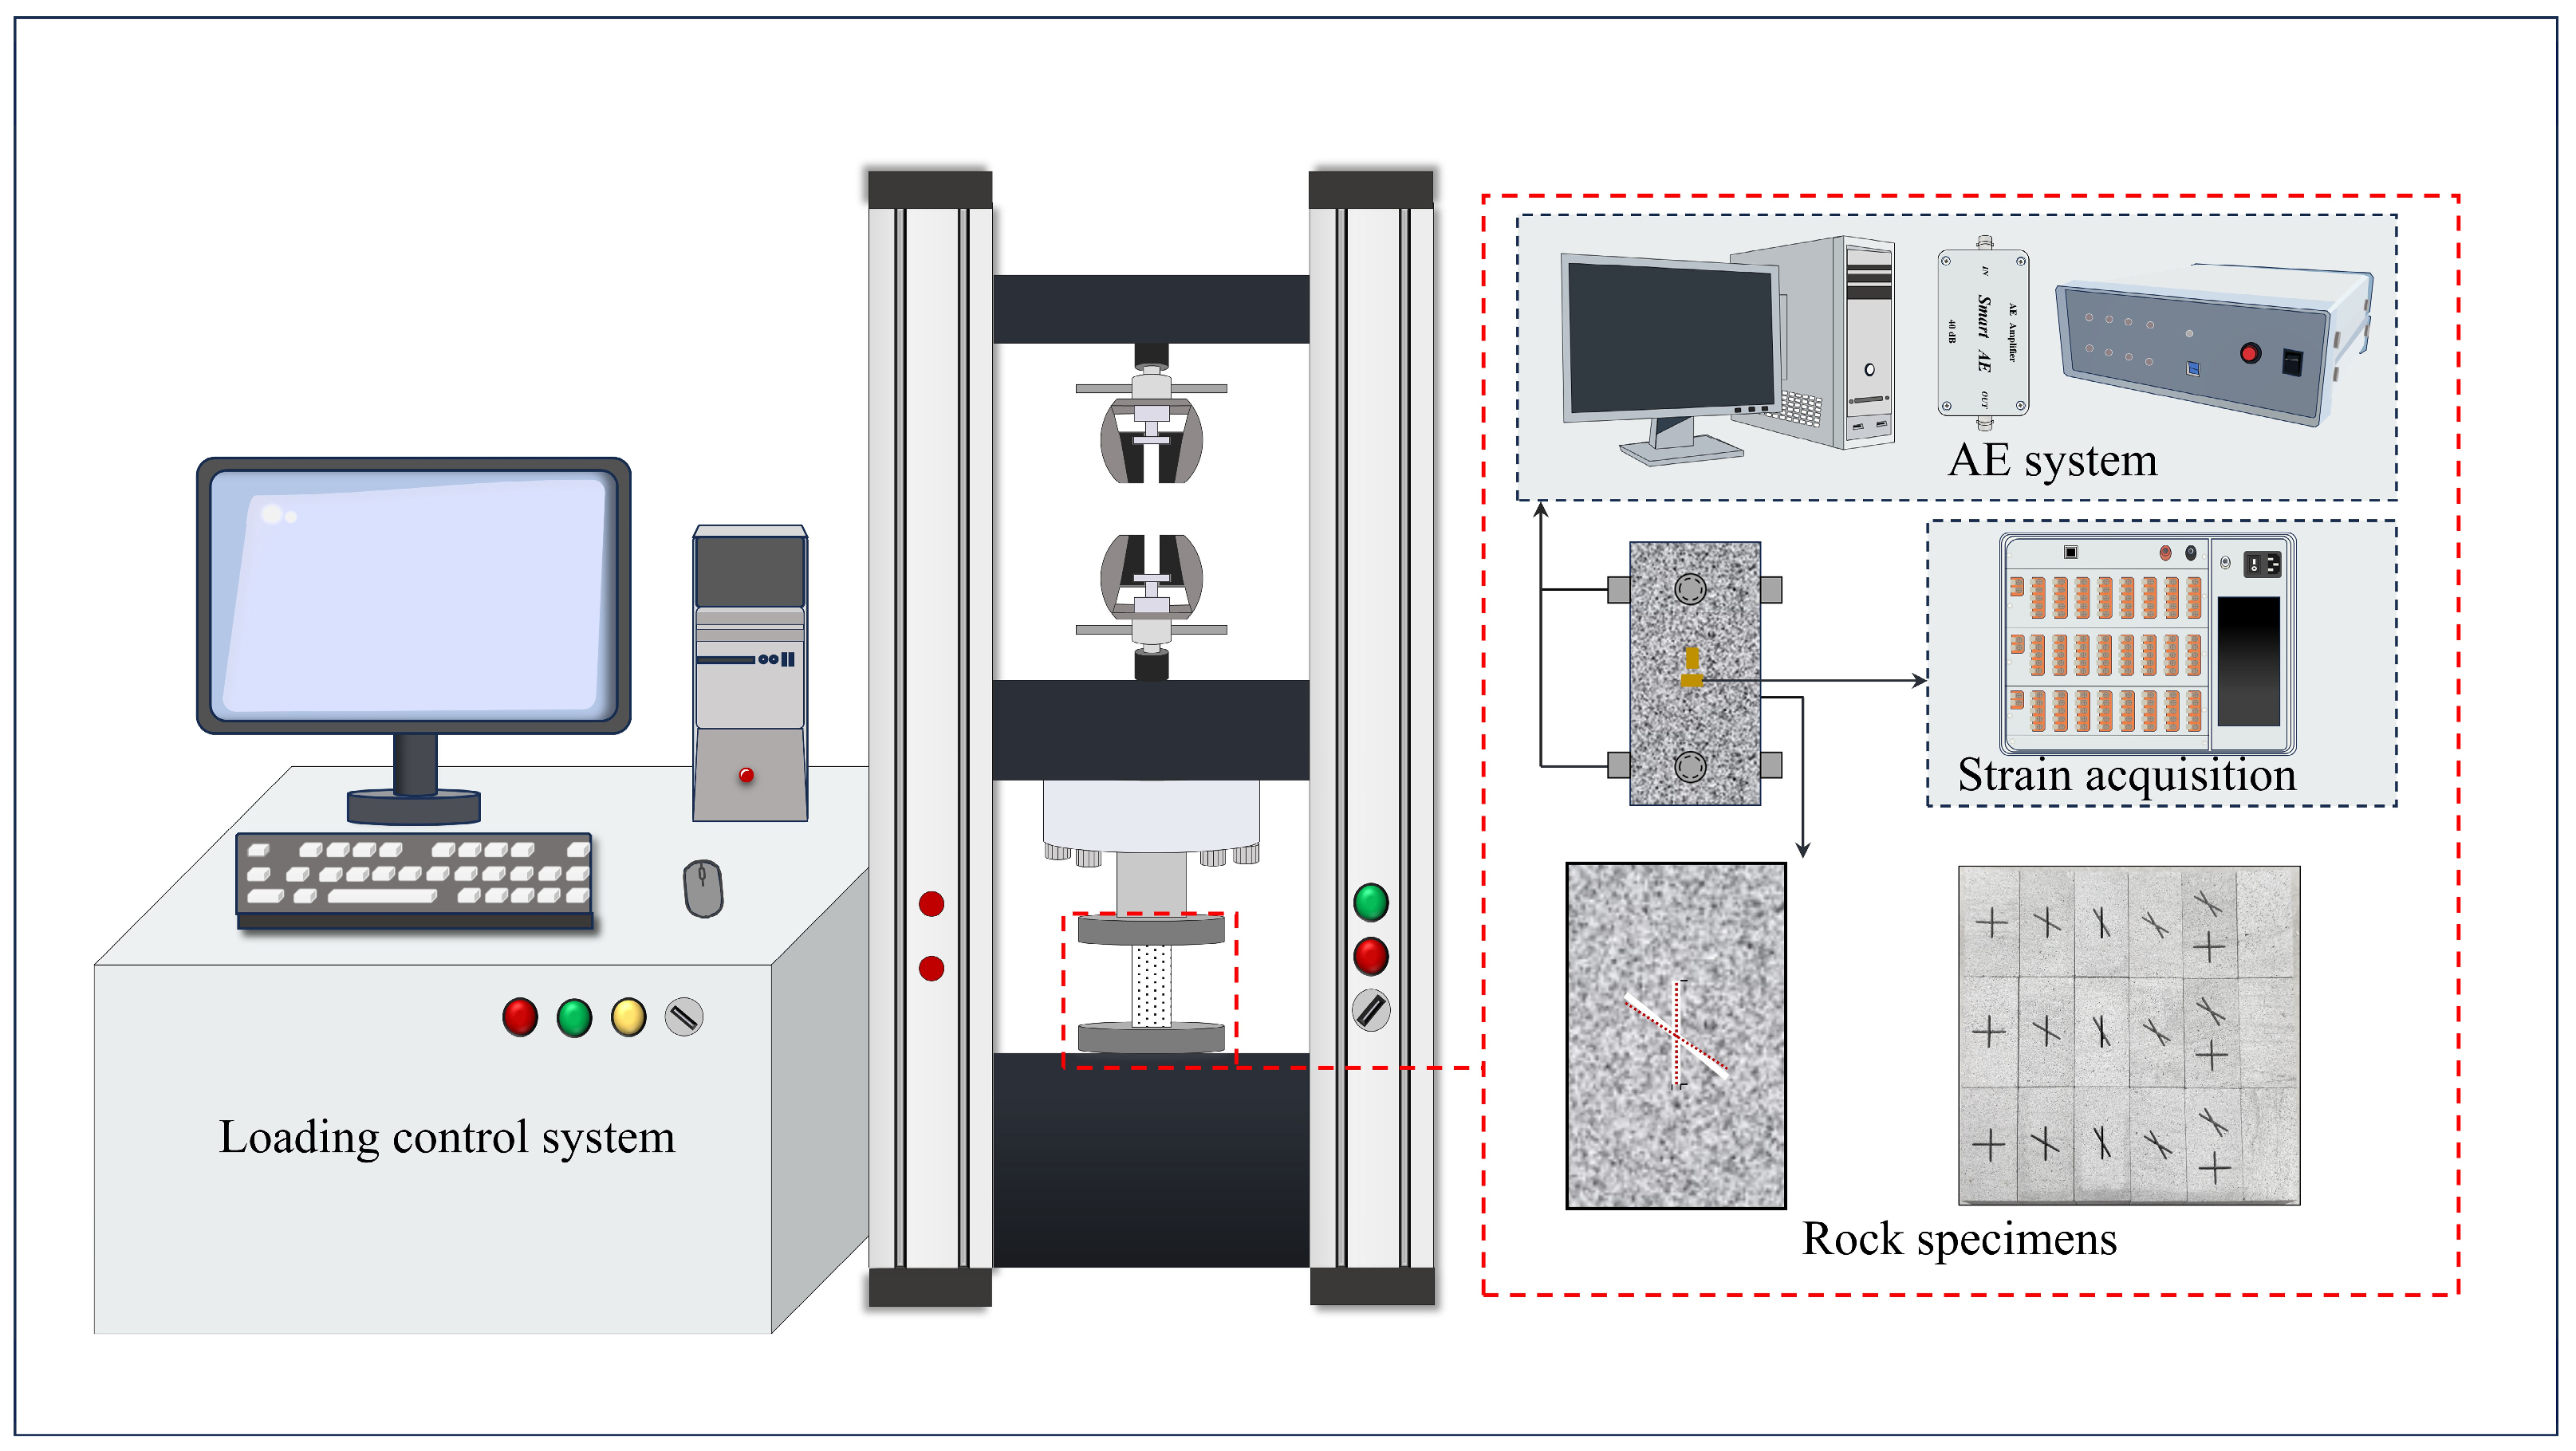
AE parameters provide real-time indicators of crack initiation, propagation, and coalescence, linking microscopic damage with macroscopic mechanical response. In this study, the AE system continuously recorded complete waveforms throughout loading.
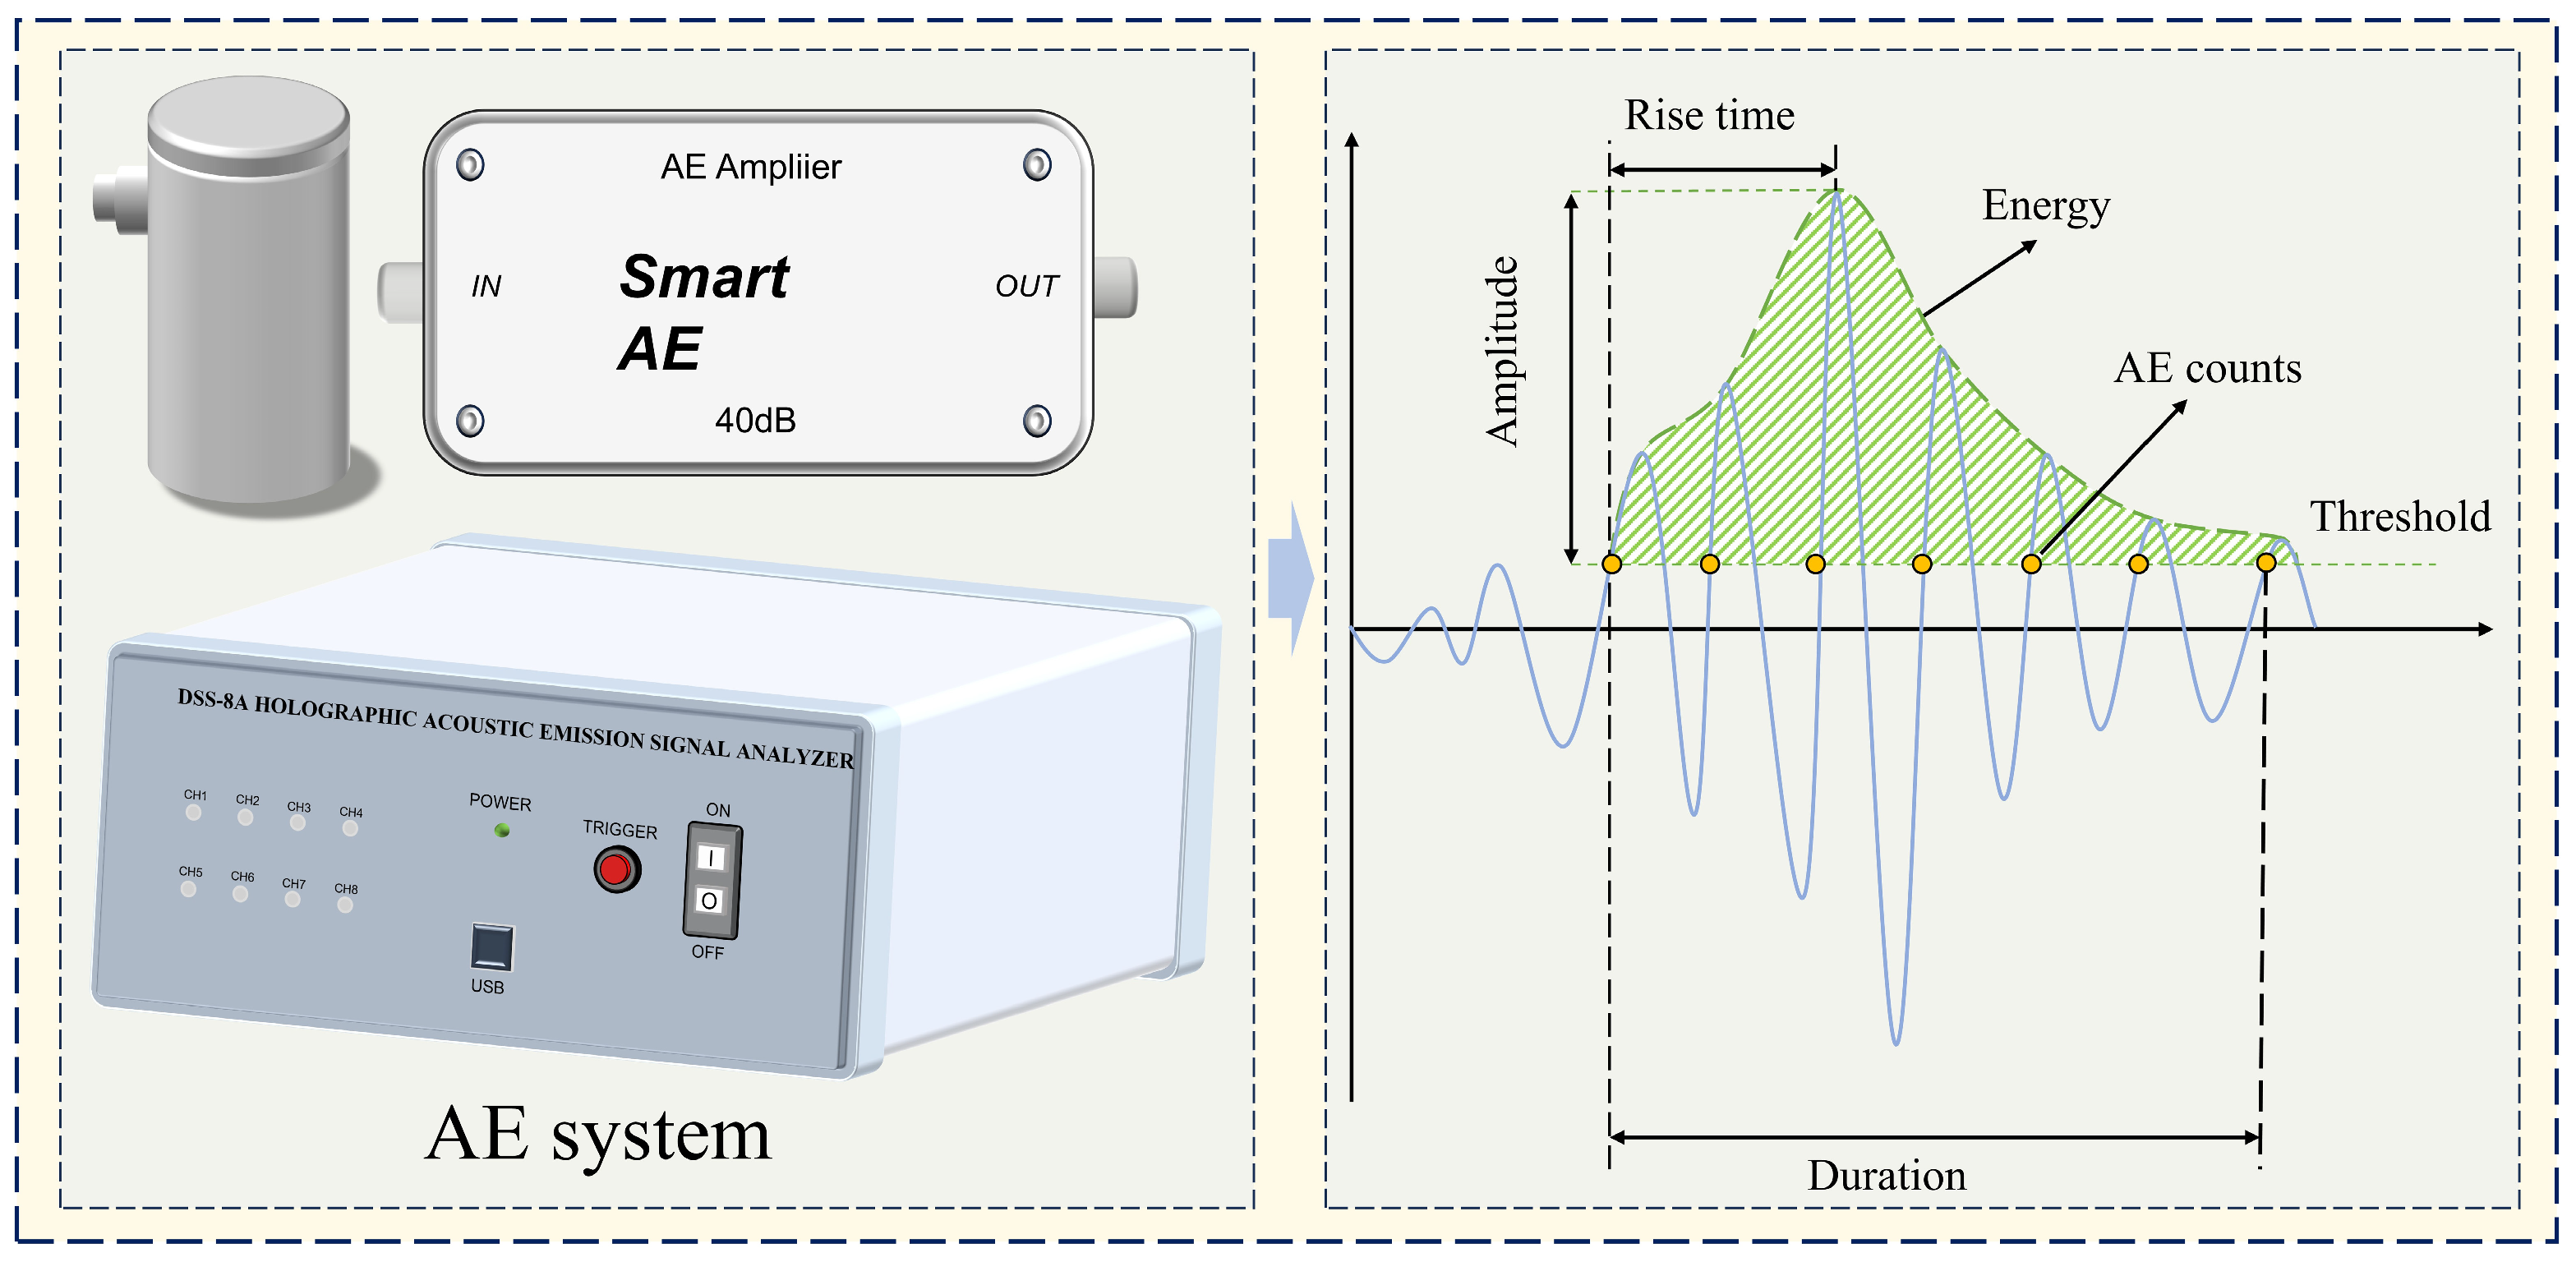
Figure 7 shows the acquisition system and defines the waveform parameters.
The crack volumetric strain method was applied to the stress–strain curves to relate microscopic damage evolution to macroscopic deformation [
31,
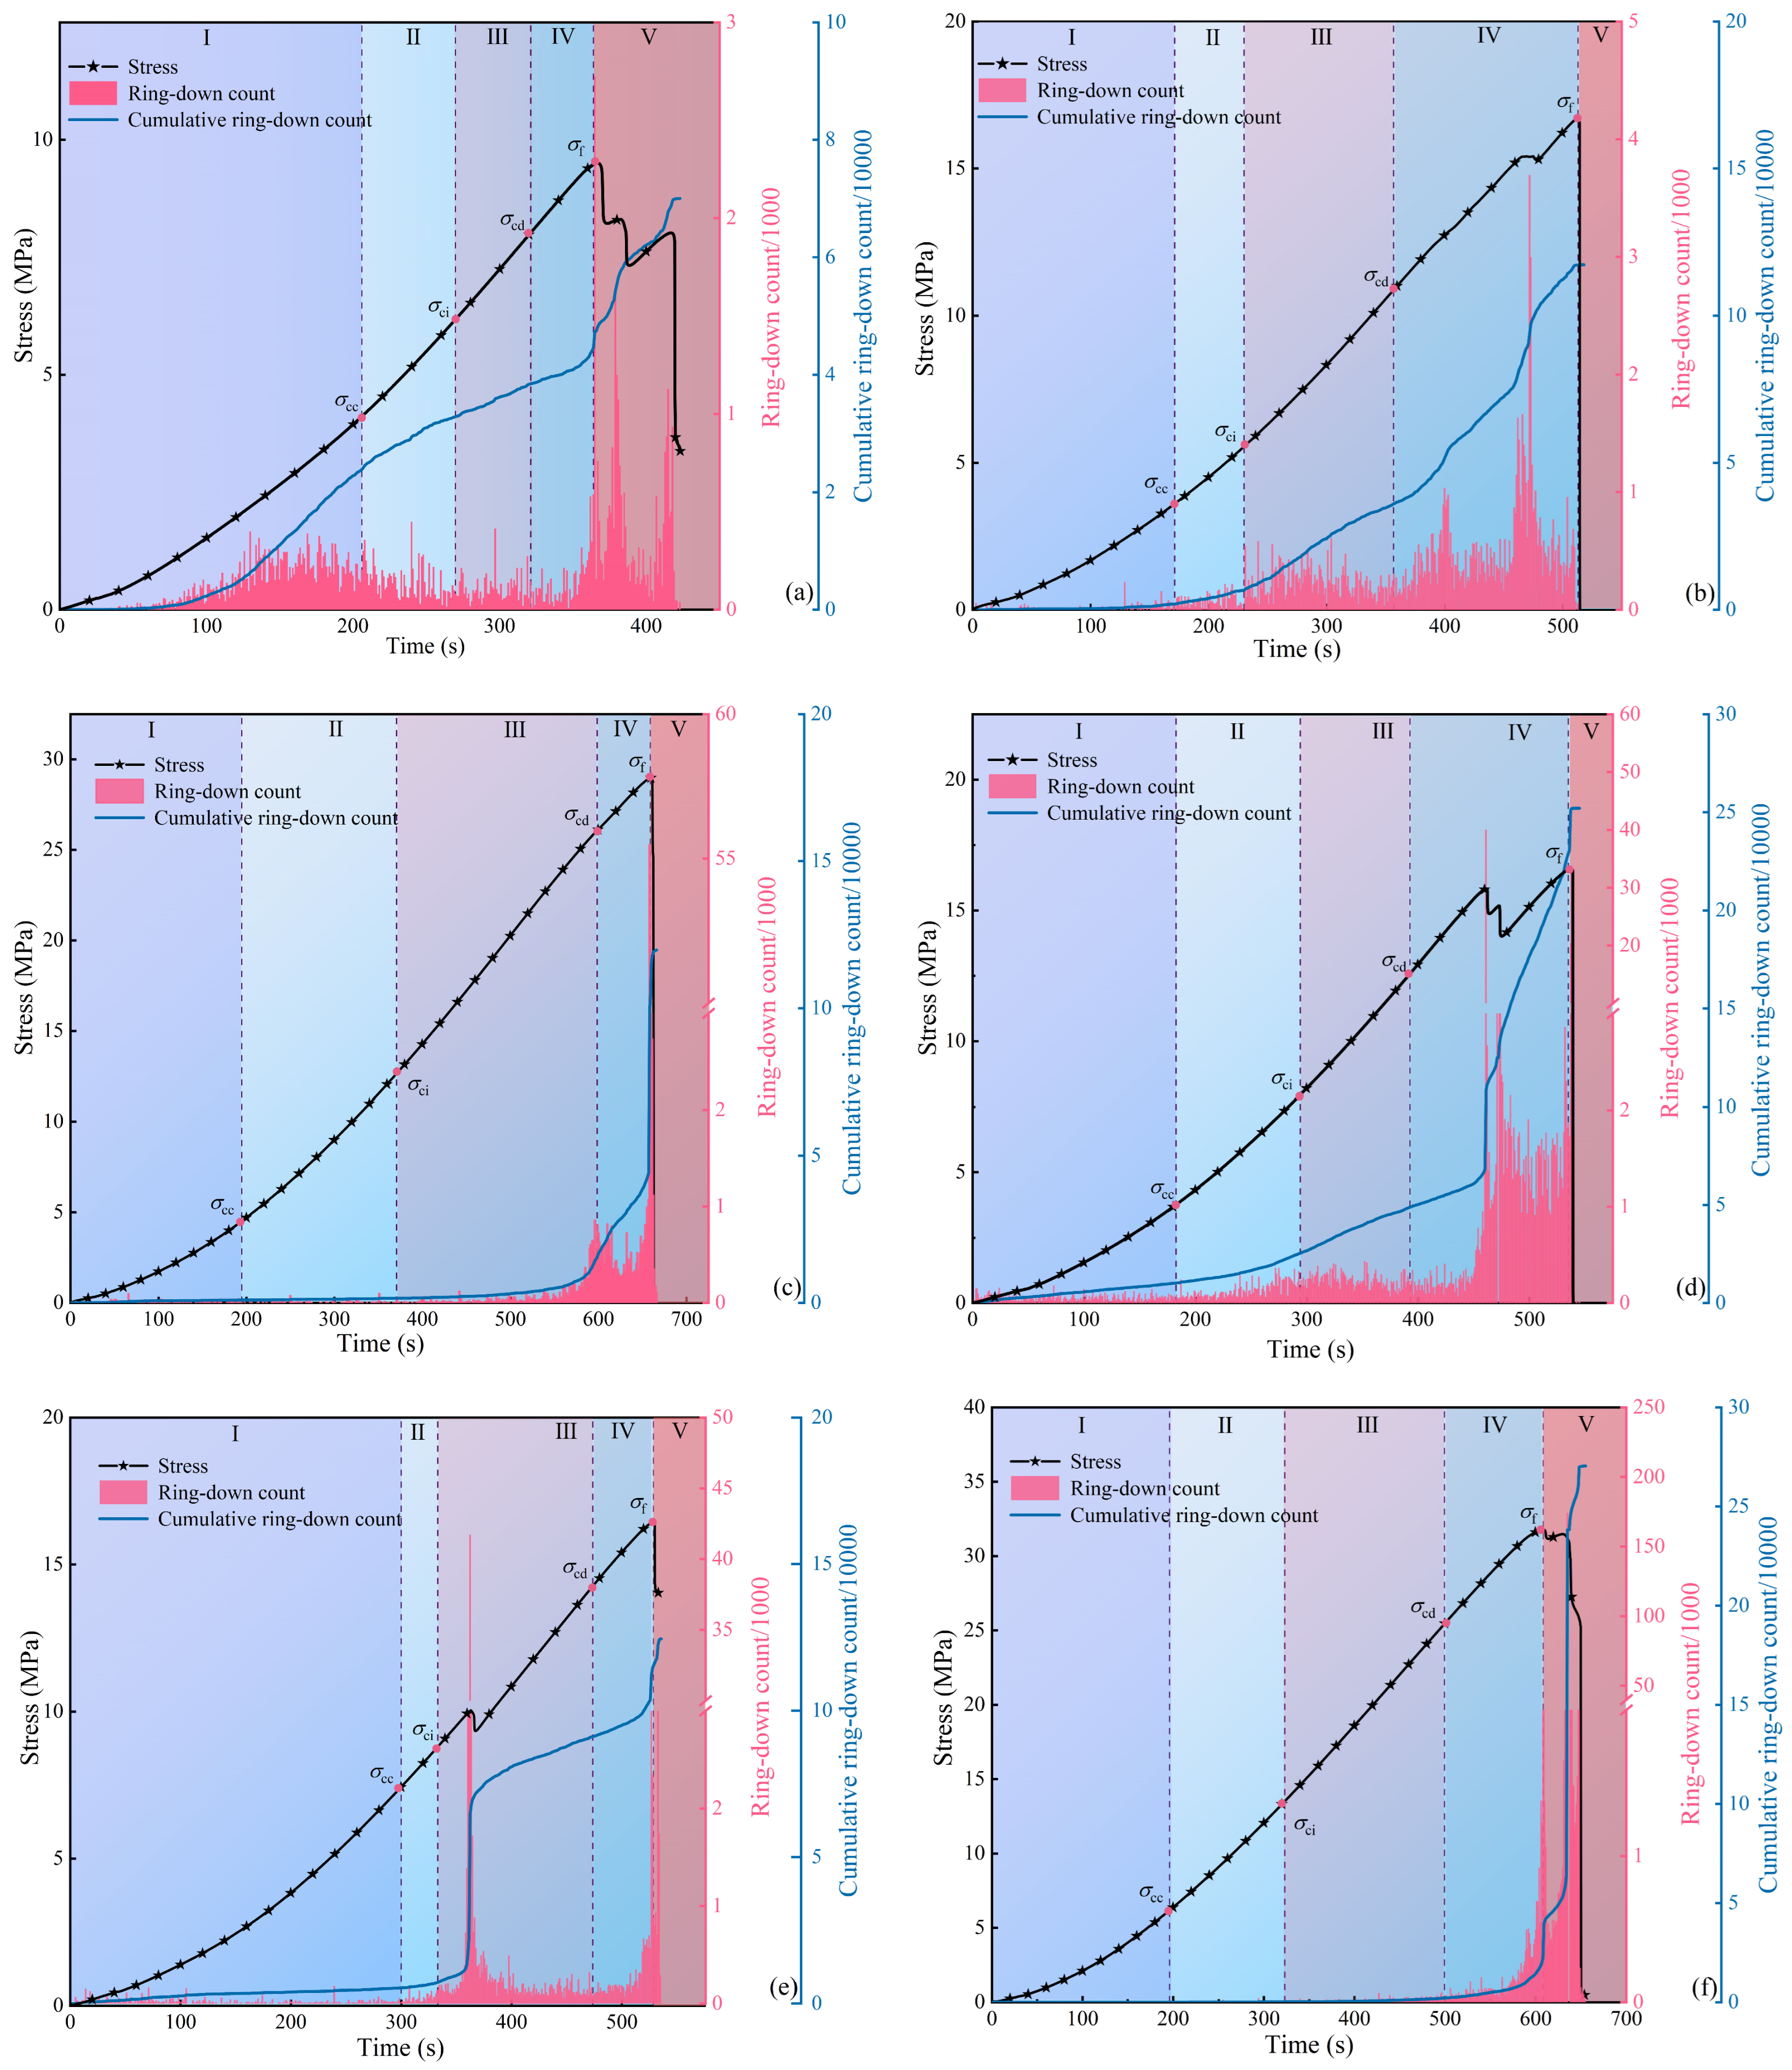
32]. The failure process was divided into five stages: crack closure (I), linear elastic deformation (II), stable crack propagation (III), unstable crack propagation (IV), and post-peak failure (V).
The AE ring-down count is the number of times a signal waveform crosses a preset threshold during one AE event. It provides a direct measure of event activity and signal intensity.
Figure 8 compares axial stress, ring-down count, and cumulative ring-down count throughout loading for each specimen.
As shown in
Figure 8, both fissured and intact specimens had low ring-down counts with minor fluctuations during stages I and II. These signals were associated primarily with compaction and closure of inherent microcracks. The fissured specimens nevertheless showed more frequent and persistent early activity, consistent with stress concentration at the prefabricated fissure tips. This effect was most pronounced in S09-1. AE activity then stabilized during matrix-dominated elastic deformation. With further loading, the ring-down count and the slope of the cumulative-count curve increased, marking stable crack initiation and growth. During stages III and IV, several pronounced count peaks indicated the transition to unstable propagation and coalescence.
To further quantify the acceleration characteristics of AE ring counts prior to macroscopic failure, this paper compared the proportions of AE ring counts within the 80–90% and 90–100% peak stress intervals (
Table 2). The results show that after the stress exceeded 90% of the peak value, the AE ring count rate of all fractured specimens exhibited a pronounced increase to varying degrees, with an amplification of 3–8 times relative to the preceding stage. Although the specific magnitude of the increase was influenced by the fracture configuration, the generally observed acceleration of the count rate near the peak stage indicates that crack activity gradually transformed from relatively dispersed and stable propagation into highly concentrated and rapid coalescence.
AE evolution differed substantially among configurations. Before stage III, S69-1 maintained a low ring-down count and behaved similarly to intact sandstone. A burst-like increase occurred only near peak stress. Closure and frictional interlocking of its high-angle fissures may have delayed early crack initiation and propagation.
3.4. Dominant-Frequency Characteristics
The frequency content of an AE waveform depends on the source process and the propagation and acquisition system. Here, complete waveforms were transformed from the time domain to the frequency domain using a fast Fourier transform (FFT). Dominant frequency was defined as the frequency of maximum spectral amplitude. Under otherwise comparable conditions, higher-frequency signals are commonly associated with smaller, more localized cracking, whereas lower-frequency signals can accompany larger-scale fracture interaction.
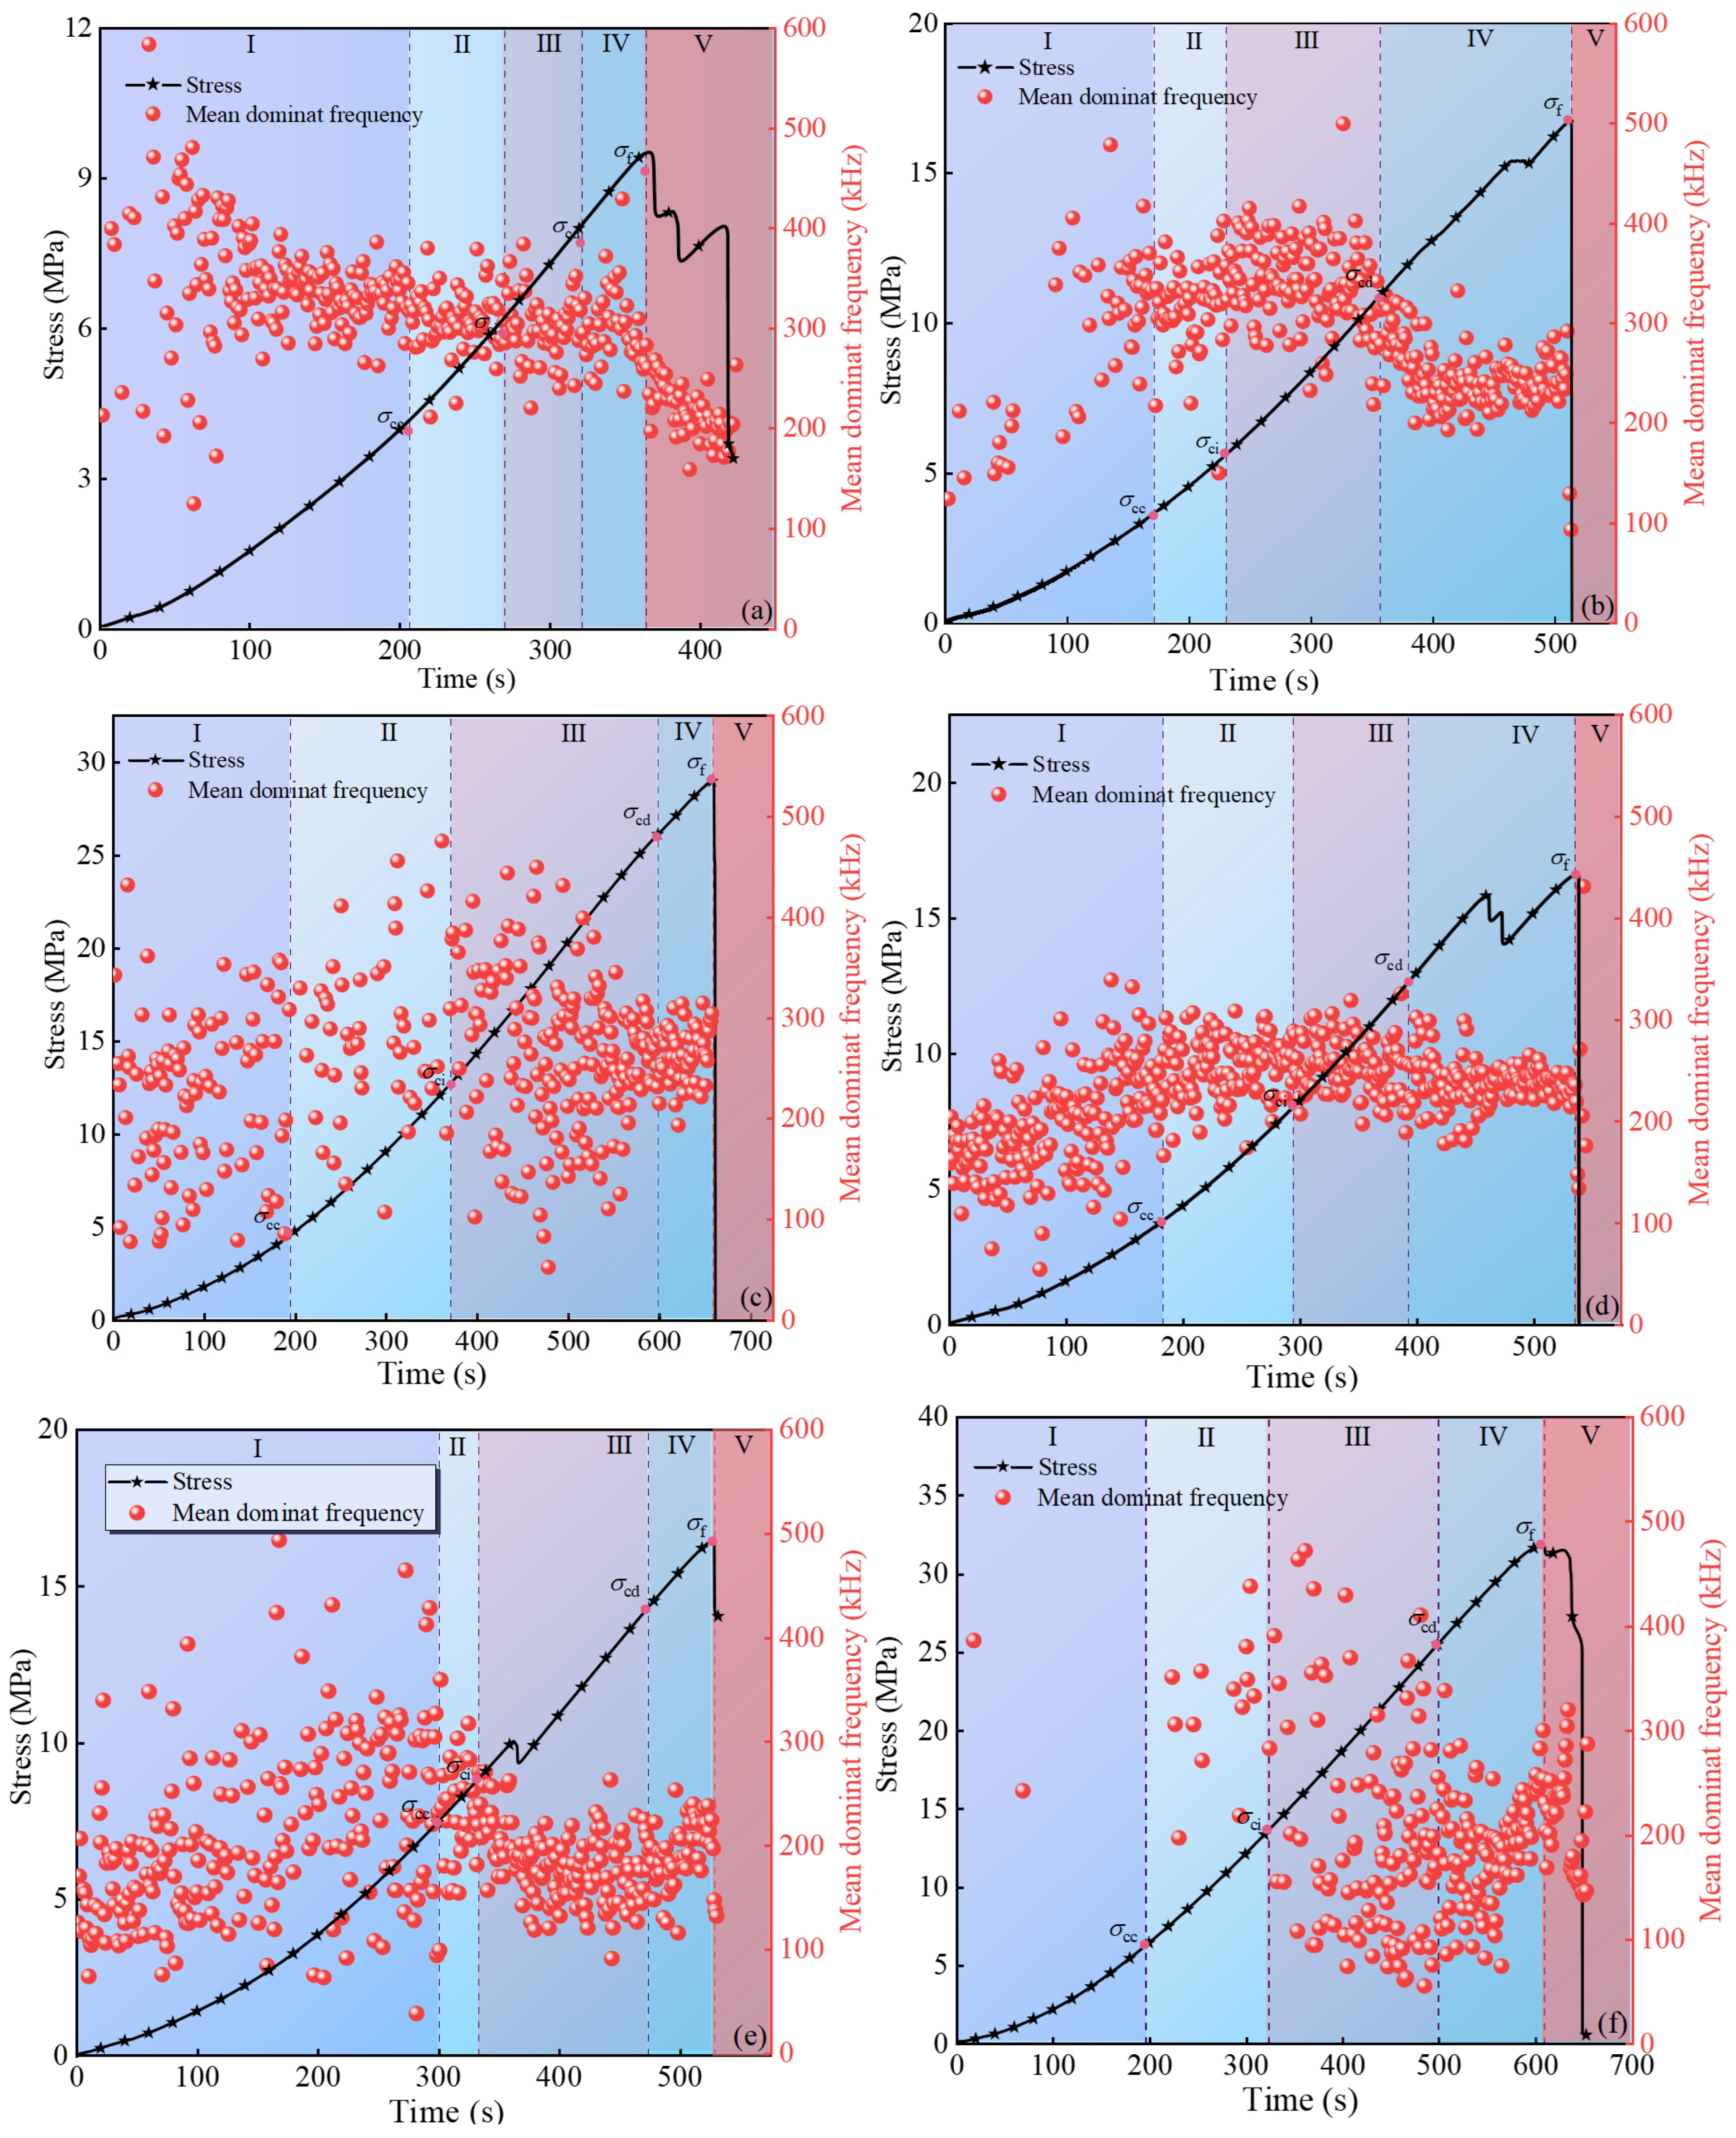
Figure 9 shows the evolution of axial stress and mean dominant frequency throughout loading.
As shown in
Figure 9, mean dominant frequencies were grouped into low (0–100 kHz), intermediate (100–300 kHz), and high (>300 kHz) bands. During stages I and II, fissured specimens generated more AE events than the intact specimen. Signals from S69-1, S36-1, and S4-1 were concentrated mainly in the intermediate-frequency band. In contrast, S09-1 and S39-1 produced persistent intermediate- and high-frequency bands, with few low-frequency events. This pattern is consistent with early activation of numerous localized cracks at fissure tips.
During stages III and IV, fissured specimens continued to generate abundant intermediate- and high-frequency events, while activity in the intact specimen also increased markedly. The earlier activity of fissured sandstone indicates that prefabricated defects advanced the onset of microcracking. Continued loading intensified interactions among distributed cracks and promoted their transition to unstable propagation and coalescence.
During stage V, the dominant-frequency distribution generally shifted toward lower frequencies. This shift is compatible with a transition from distributed microcracking to larger-scale crack coalescence and frictional sliding. The migration from intermediate and high frequencies to lower frequencies may therefore provide precursor information.
Combined with the RA–AF crack type identification results, it can be found that tensile AE events dominated throughout the entire loading process for all fractured specimens. Specifically, tensile events accounted for 83.55%, 81.05%, 75.99%, 79.95%, and 76.40% of the total classified events in specimens S09-1, S39-1, S69-1, S36-1, and S4-1, respectively. In particular, for S09-1 and S39-1, while medium- and high-frequency signals remained continuously active, the RA–AF analysis showed a relatively high proportion of tensile events, indicating that the medium- and high-frequency AE activity is generally consistent with the initiation and propagation of tensile microcracks in terms of the overall evolution trend. This may be related to the relatively strong local stress concentration at the tips of low-dip-angle fractures, which is favorable for the formation of numerous small-scale, rapidly propagating wing cracks and secondary tensile cracks, thereby generating abundant medium- and high-frequency signals. However, AE frequency is also affected by factors such as crack size, fracture rate, propagation path, and material heterogeneity.
However, dominant frequency should not be used as an isolated failure criterion. Combining frequency migration with ring-down count, stress evolution, and proximity to peak stress provides a more defensible assessment.
3.5. RA–AF Characteristics and Crack-Mode Classification
Rock failure under loading involves tensile and shear microcracking, which produce different AE waveform characteristics. Tensile events generally have shorter rise times and higher average frequencies, whereas shear events tend to have longer rise times and lower average frequencies. A Gaussian mixture model (GMM) was used to cluster the RA–AF data and distinguish the two event populations.
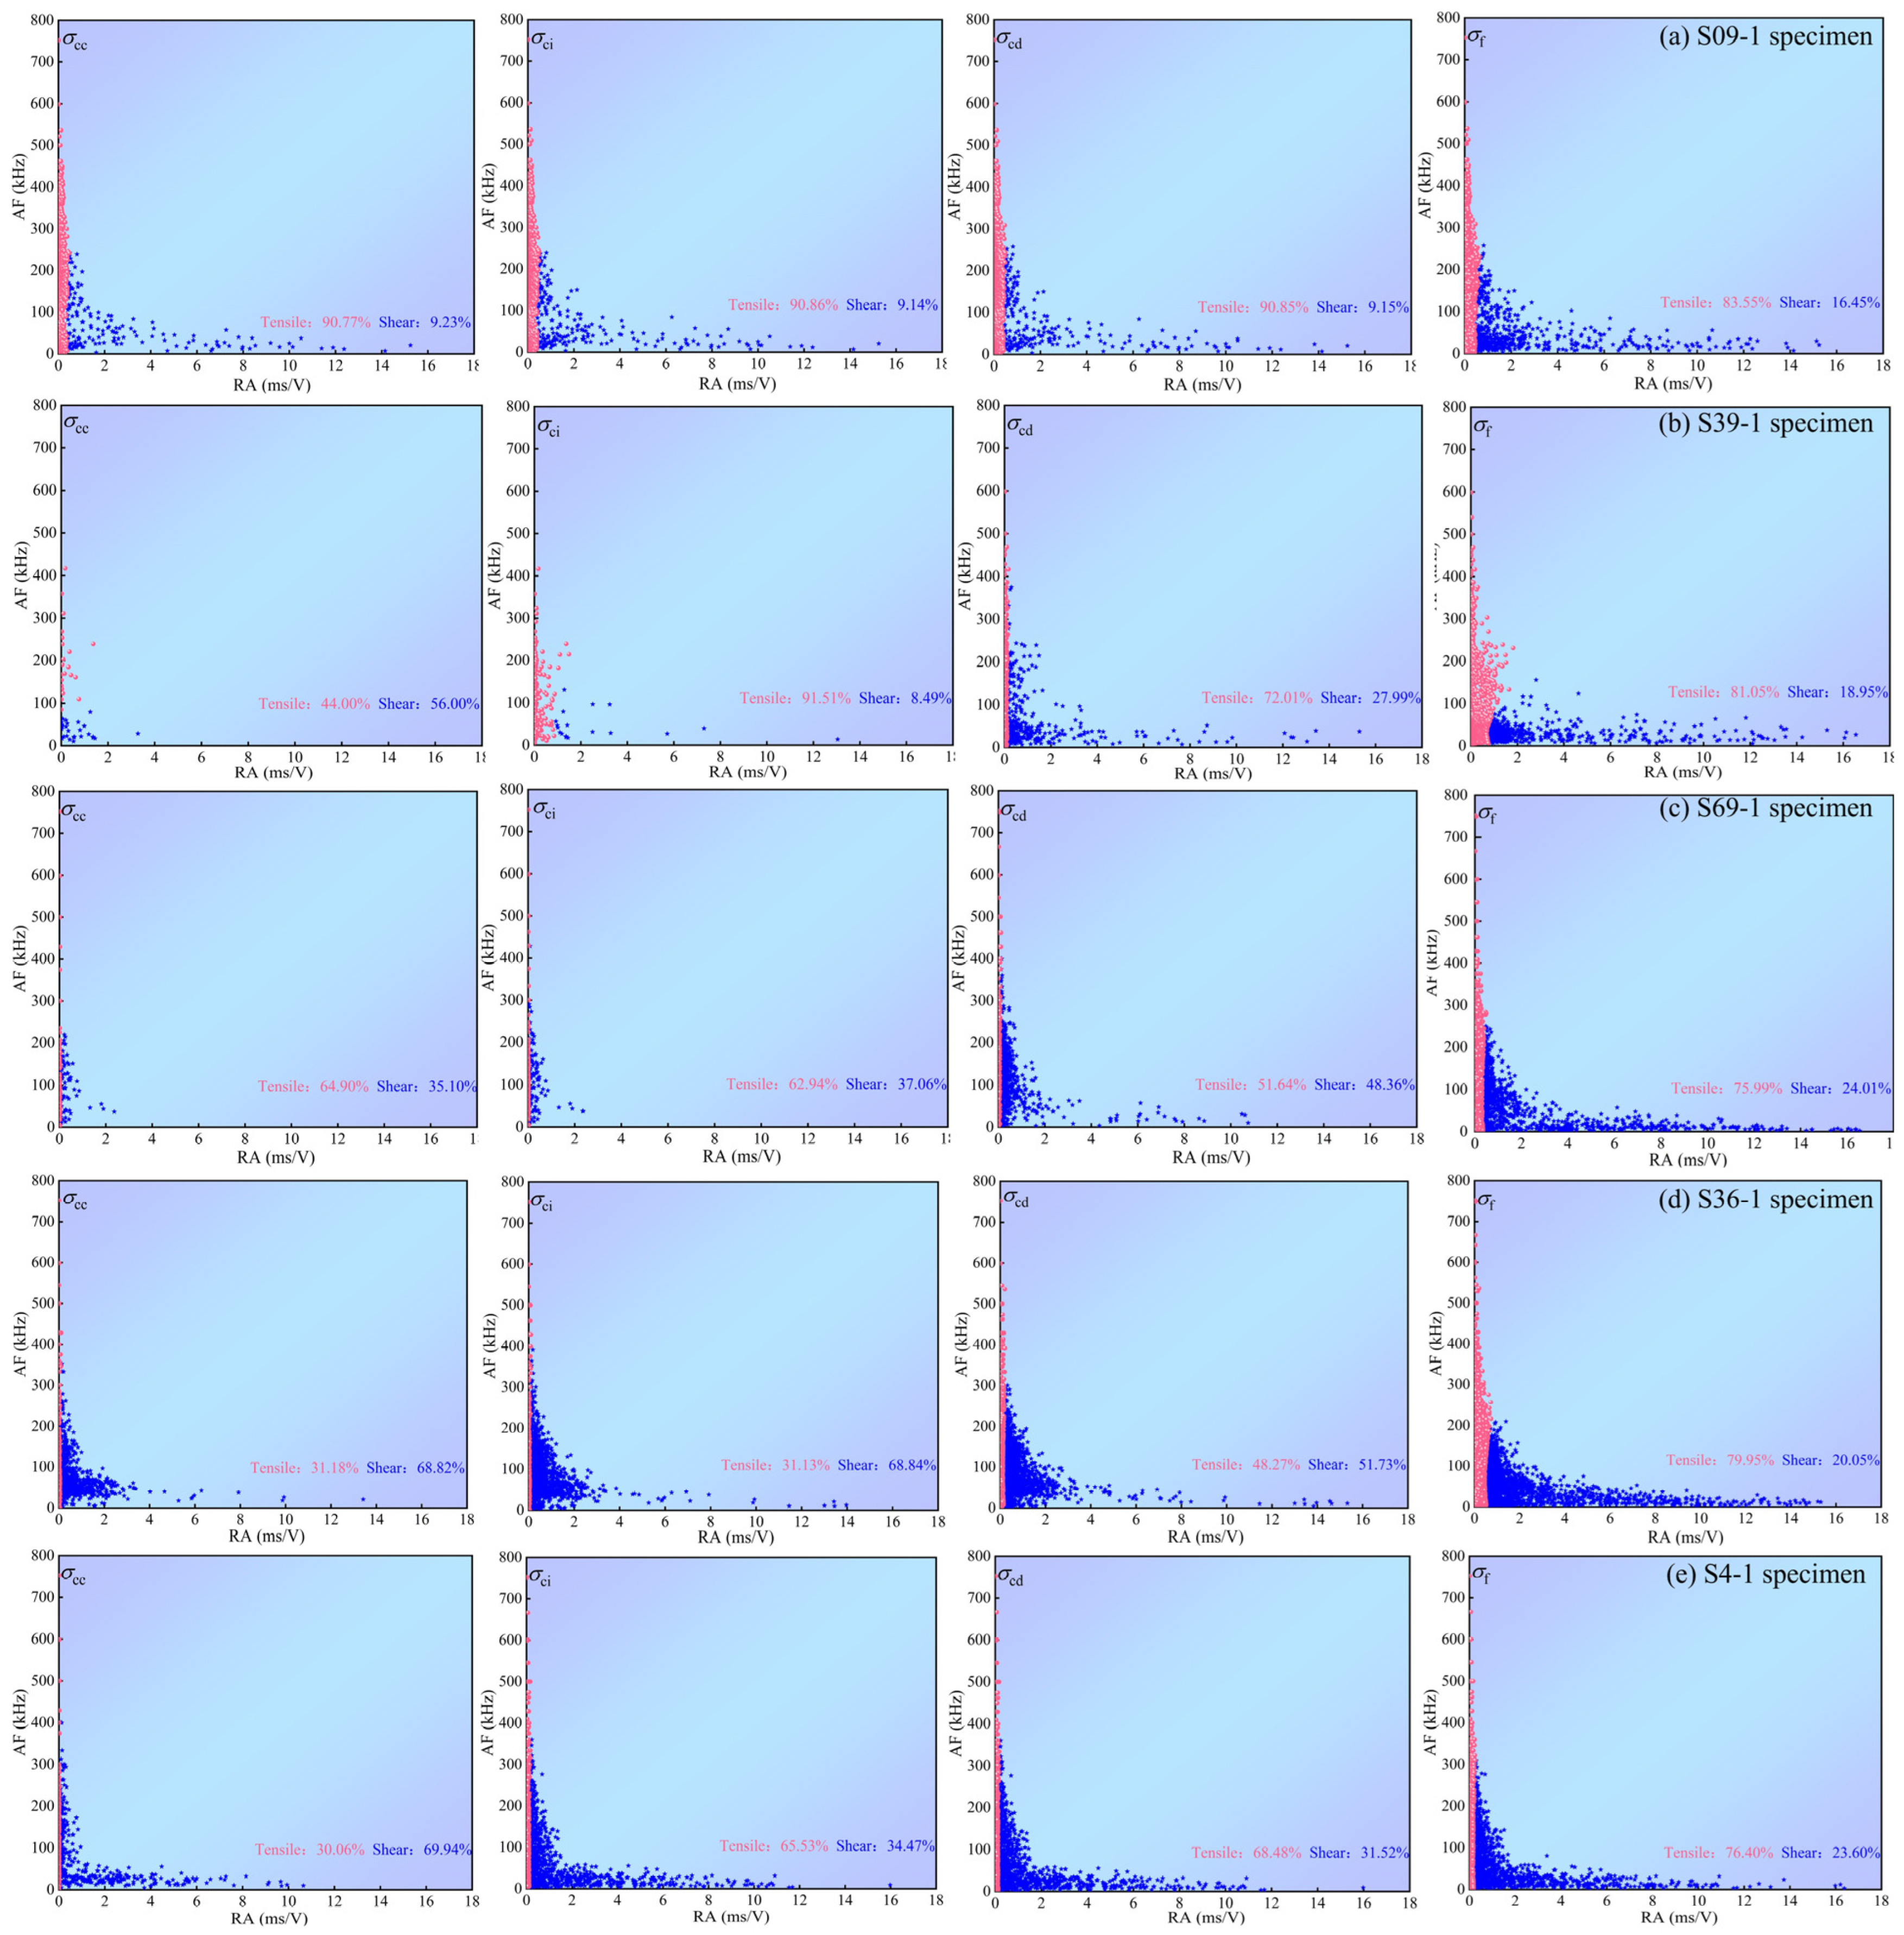
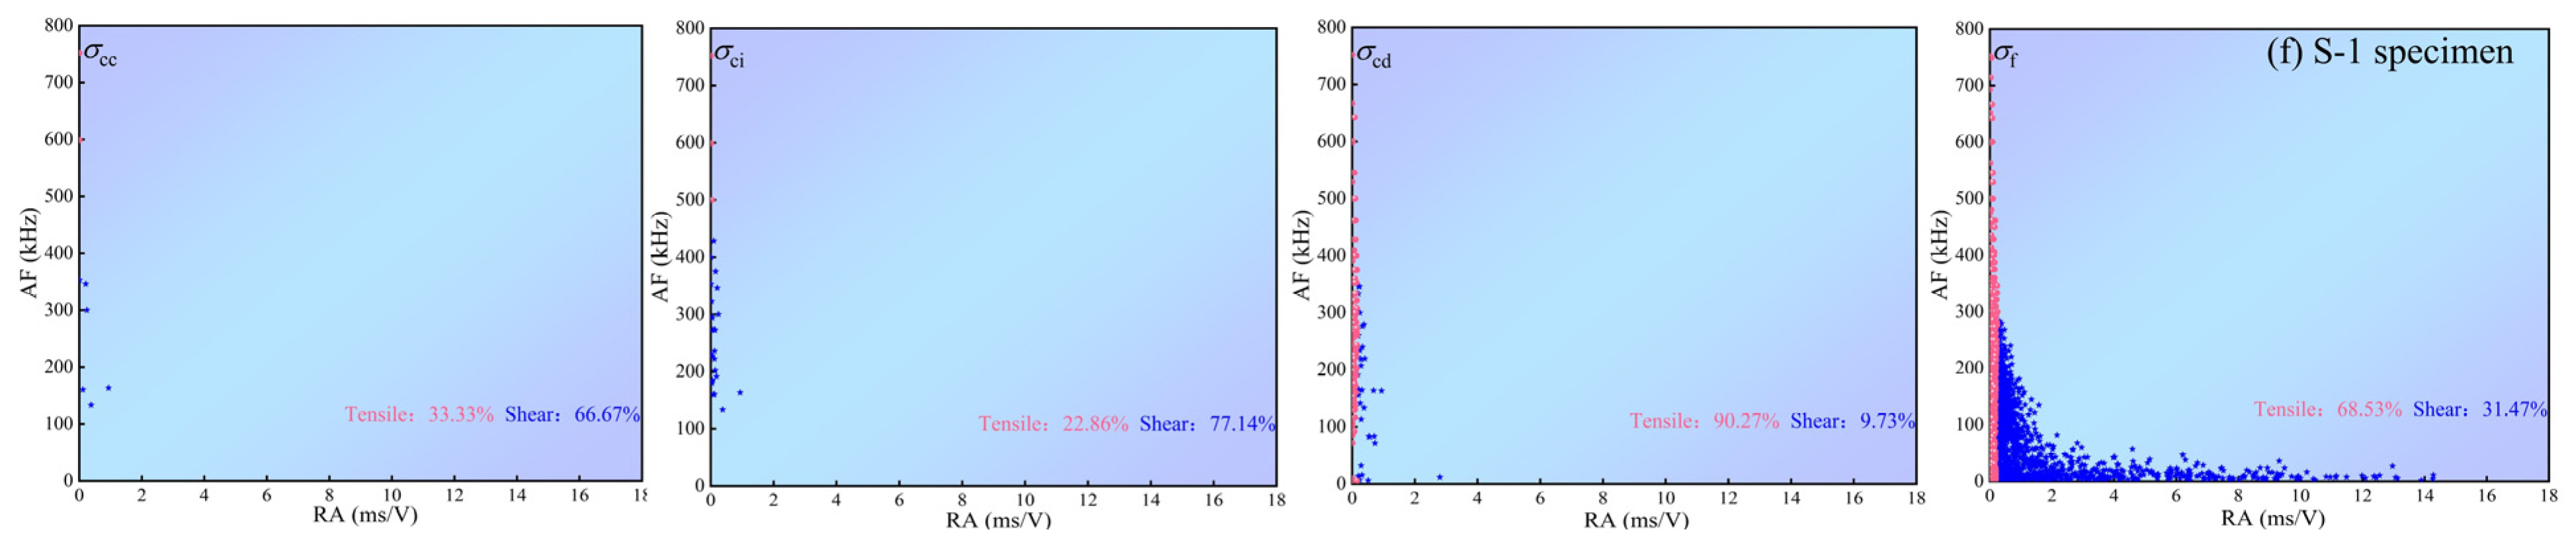
Figure 10 compares the clustered distributions at successive loading stages.
Tensile-event AF values ranged from 0 to 800 kHz and were concentrated mainly below 400 kHz, while their RA values ranged from 0 to 0.5 ms/V (
Figure 10). Shear-event AF values ranged from 0 to 300 kHz and RA values from 0 to 17 ms/V, with most RA values below 10 ms/V.
Few AE events occurred during compaction and linear elastic deformation. Both tensile- and shear-type events increased rapidly during stable and unstable crack propagation, but tensile events remained dominant in every fissured specimen. They accounted for 83.55%, 81.05%, and 75.99% of classified events in S09-1, S39-1, and S69-1, respectively. The decline with increasing α is consistent with greater fissure closure, friction, interlocking, and shear slip at higher inclinations. For S36-1, tensile and shear events accounted for 79.95% and 20.05%, respectively. For S4-1, the corresponding proportions were 76.40% and 23.60%. The intact specimen lacked directional stress concentrations and interfacial slip along artificial fissures so its AE evolution reflected the intrinsic brittle response of the sandstone matrix.
Fissure configuration strongly influenced the evolution of microcracking modes. As α increased, the RA–AF population shifted from low-RA/high-AF toward high-RA/low-AF values, indicating a larger shear-event fraction. This transition is consistent with enhanced fissure closure and interfacial slip at higher inclination.
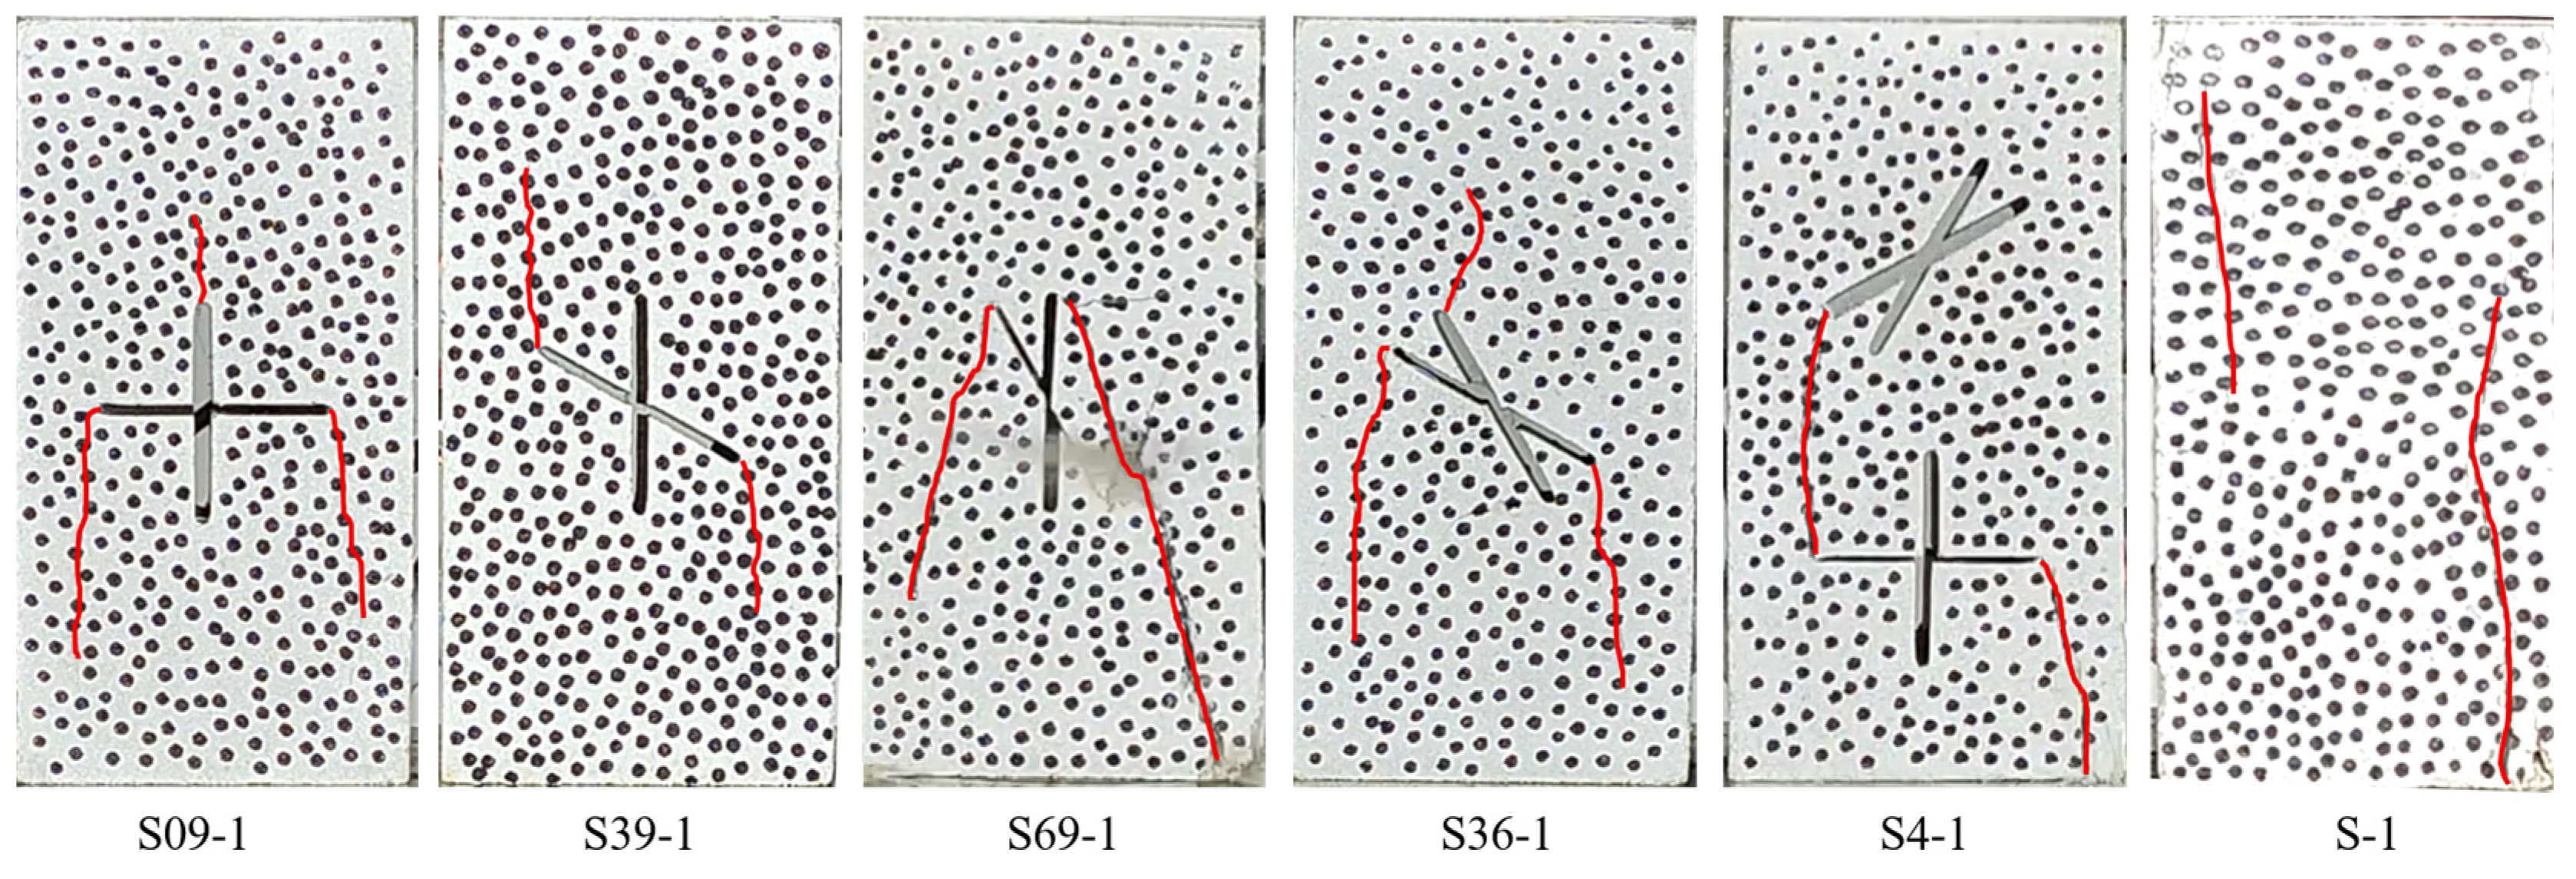
To further verify the microcrack fracture modes revealed by the RA–AF analysis, the macroscopic crack morphology of the failed specimens was compared (
Figure 11). In the fractured specimens, the main macroscopic cracks mostly initiated from the tips or adjacent regions of the prefabricated fractures and subsequently propagated toward the specimen boundaries, further indicating that the stress concentration at the prefabricated fracture tips exerts a significant control on crack initiation. Under different fracture configurations, relatively distinct near-axial splitting cracks were commonly observed, suggesting that tensile cracking remains the dominant mechanism in the failure process of fractured sandstone, which is consistent with the predominance of tensile AE events obtained from the RA–AF analysis. Meanwhile, with increasing fracture dip angle, some macroscopic cracks exhibited more pronounced oblique propagation, path deflection, and local coalescence, reflecting enhanced frictional sliding along the fracture surfaces and stronger tensile–shear mixed action. This is in good agreement with the overall increase in the proportion of shear AE events. In contrast, intact specimens mainly developed macroscopic splitting cracks along the loading direction, without showing directional crack initiation induced by artificial fractures. It should be emphasized that the macroscopic crack morphology after failure represents the final coalescence result, whereas the RA–AF parameters record microcrack activity throughout the entire loading process. Therefore, a strict one-to-one correspondence between the two cannot be established. Nevertheless, their consistency in terms of the dominant failure mechanism and the variation trend with fracture dip angle provides further macroscopic evidence for the identification of AE crack types.
4. Discussion
Intersecting-fissure geometry controlled both mechanical degradation and the temporal evolution of AE activity. The central 0–90° configuration produced the lowest peak strength and modulus, whereas the 60–90° configuration retained values close to intact sandstone. This orientation dependence agrees with previous experimental and numerical evidence that intersection angle and system orientation alter crack-initiation sites, stress redistribution, and coalescence paths [
17,
33]. The weak response of S09-1 is consistent with interrupted axial load transfer and interacting stress concentrations at the horizontal-fissure tips and central intersection. In S69-1, the steeper fissure closed more readily under compression, allowing friction and geometric interlocking to restore part of the load-transfer path.
The results also distinguish the effects of fissure orientation from those of fissure density and position. S36-1 and S4-1 had similar peak strengths, but S4-1 had a lower elastic modulus. Additional fissures can therefore increase distributed compliance without proportionally reducing peak load. Peak strength depends on whether local cracks organize into a through-going failure path, whereas modulus reflects the aggregate deformability of the defect population. This interpretation is consistent with studies showing that fissure geometry changes both the final fracture plane and the sequence of crack initiation [
29,
33]. However, the present tests did not resolve three-dimensional crack paths. Digital image correlation, X-ray computed tomography, or calibrated discrete-element simulations are needed to test the inferred stress-transfer mechanism [
23].
AE ring-down counts provide a temporal link between fissure activation and macroscopic weakening. Activity in S09-1 began while the bulk response still appeared stable, whereas S69-1 remained comparatively quiet until near peak stress. Inclination-dependent changes in the onset and stepped growth of AE counts have also been observed in pre-cracked sandstone [
34]. Multi-parameter studies of single-fissure sandstone similarly report rapid changes in cumulative AE measures near critical failure [
25]. Count-rate acceleration and changes in cumulative-count slope may therefore indicate damage transitions. Nevertheless, no single count burst should be treated as a universal threshold because coupling, acquisition settings, attenuation, and source-to-sensor distance affect AE counts.
Frequency and RA–AF analyses provide complementary, but not interchangeable, information. The intermediate- and high-frequency activity in S09-1 and S39-1 is compatible with extensive localized cracking during early loading, while later low-frequency activity may reflect larger crack interactions. Frequency cannot be uniquely mapped to crack size or mode because mineralogy, propagation path, resonance, and instrument bandwidth also affect the spectrum [
35]. The RA–AF results nevertheless provide a consistent internal comparison: tensile events dominated all fissured specimens, while the shear fraction increased from S09-1 to S69-1. This trend agrees with the expected shift from tip-induced tensile opening at low inclinations to closure, frictional slip, and interlocking at higher inclinations. Calibration studies likewise place tensile events preferentially in low-RA/high-AF regions and shear events in high-RA/low-AF regions [
27,
28,
36]. Because a universal RA–AF boundary has not been established, the reported proportions should be interpreted as configuration-dependent classifications for the present sensors and clustering procedure, not as absolute material constants.
The results of this study have certain engineering significance for damage assessment and structural health monitoring of rock masses containing intersecting fractures. In rock engineering such as tunnels, underground caverns, rock slopes, and mine pillars, natural fractures typically occur in combinations of different dip angles, and their geometric configurations can alter the stress concentration state near crack tips as well as the initiation, propagation, and coalescence processes of secondary cracks. The results presented in this paper show that different intersecting fracture configurations not only lead to changes in sandstone strength and failure mode, but they also exhibit markedly different AE ring counts, dominant frequency distributions, and RA–AF evolution characteristics. Therefore, the “fracture configuration–failure mode–AE response” relationship revealed in this study can provide an experimental basis for damage stage identification and instability precursor monitoring of rock masses containing complex fractures.
Although this study reveals the influence of different intersecting fracture configurations on the mechanical behavior and AE response of sandstone, certain limitations still remain. First, the intersecting fracture configurations in this study were idealized using artificially prefabricated fractures, and the combinations of fracture dip angles considered were relatively limited. In contrast, natural fractures in rock masses typically exhibit more complex roughness, aperture, persistence, and spatial combination patterns. Second, the experiments were conducted on laboratory-scale specimens under uniaxial monotonic compression, without considering actual engineering conditions such as confining pressure, cyclic loading, dynamic disturbance, and hydro-mechanical coupling. Therefore, the mechanical and AE characteristics obtained from the tests primarily reflect the fracture behavior under the current specimen size and loading conditions. Future research will further increase the number of parallel specimens and expand the range of fracture geometric parameters, and will consider the effects of fracture aperture, spacing, roughness, and persistence. Meanwhile, tests under different confining pressures, cyclic loading, and hydro-mechanical coupling conditions will be conducted. Furthermore, by integrating multi-source monitoring techniques such as AE source localization, digital image correlation (DIC), or CT, and by validating the findings through large-scale tests and field monitoring data, it is expected that more reliable methods for damage identification and instability early warning in fractured rock masses can be established.