1. Introduction
In the field of surface chemical technology, significant attention has been directed toward the electron emission from processed solid surfaces, commonly referred to as exoemission [
1,
2]. This type of emission originates from surface-specific defects and contamination layers rather than pristine (ideal) surfaces. Electron transfer on metallic surfaces with thin oxide layers plays a vital role in photocatalysis, photoelectrochemical processes, sensors, and the inactivation of viruses and bacteria. However, the temperature dependence of electron transfer behavior in various chemical environments remains poorly understood. When engineered materials are handled at industrial production sites after surface processing, various compounds—oxygen, water vapor, and other environmental components—adsorb onto the surface. Consequently, further efforts are required to develop sensitive monitoring technologies capable of tracking these dynamic surface and interface changes under practical operating conditions [
1].
Copper surfaces in particular are critical in various fields, including antibacterial/antiviral applications [
3,
4,
5,
6,
7,
8,
9,
10,
11,
12,
13,
14,
15,
16,
17,
18] and sensor technology [
19,
20,
21,
22]. Furthermore, the mechanisms underlying electron transfer on copper surfaces are central to studies on oxygen vacancies [
23,
24,
25,
26,
27,
28], photocatalysis [
29,
30,
31], corrosion and adsorption [
32,
33,
34,
35,
36,
37,
38,
39,
40,
41], and photoelectrochemical processes [
42,
43,
44,
45,
46]. In the present study, we focus on electronic defects formed within the Cu
2O/Cu matrix as the primary origin of the photoelectron emission (PE) observed in our experiments. Crucially, the inclusion of oxygen vacancies is justified in the title of this study because it is well-established that oxygen vacancies introduce discrete in-gap defect states in Cu
2O and modify the density of states near the Fermi level [
24]. Therefore, it is highly probable that the observed temperature-programmed photoelectron emission (TPPE) characteristics are modulated by these vacancy-derived configurations, acting as a governing electronic factor. In a subsequent study, we plan to examine the relationship between TPPE characteristics (apparent PE intensity and multi-step activation energy) and models of oxygen vacancies.
In a previous study [
2], we examined the TPPE data from two types of copper surfaces (Sample A, which was mechanically abraded in alcohols, water, or air, and Sample C, which was non-abraded, covered by a stable oxide layer, and only ultrasonically cleaned in the same liquids) by determining the temperature dependence (while heating and cooling in the range of 25–350 °C) of the total photoemitted electron count (
NT) for Samples A and C exposed to different environments (after pretreatment and immersion in alcohols or water). For both samples, the
NT values gradually increased with temperature, reached a maximum (
NTmax) at 250 °C (the temperature of maximum emission,
Tmax), and decreased thereafter. Notably, the two samples exhibited opposing trends regarding the influence of the liquid environment. For Sample A,
NTmax decreased in the order of H
2O > CH
3OH > C
2H
5OH > (CH
3)
2CHOH > C
3H
7OH, although the last alcohol yielded
Tmax = 100 °C, whereas Sample C followed the exact opposite order. This two-way TPPE behavior was attributed to acid–base interactions between the oxygen-rich surface overlayer and the adsorbed molecules.
Furthermore, our previous report [
2] confirmed that the emission intensity strongly correlates with the surface hydroxyl (−OH) groups before the TPPE measurement and with the orientation of the electric dipoles formed by organic molecules adsorbed on the −OH groups. After the measurement, only the O
2− component appears, and the
NT signal disappears. Although the detailed mechanism of the −OH group adsorbed at the surface was not clarified, it is hypothesized to behave as a radical with high electron affinity. This may allow it to attract electrons from the base metal via tunneling, subsequently triggering Auger emission. Hence, the PE stimulation spectra are thought to originate from this Auger emission process.
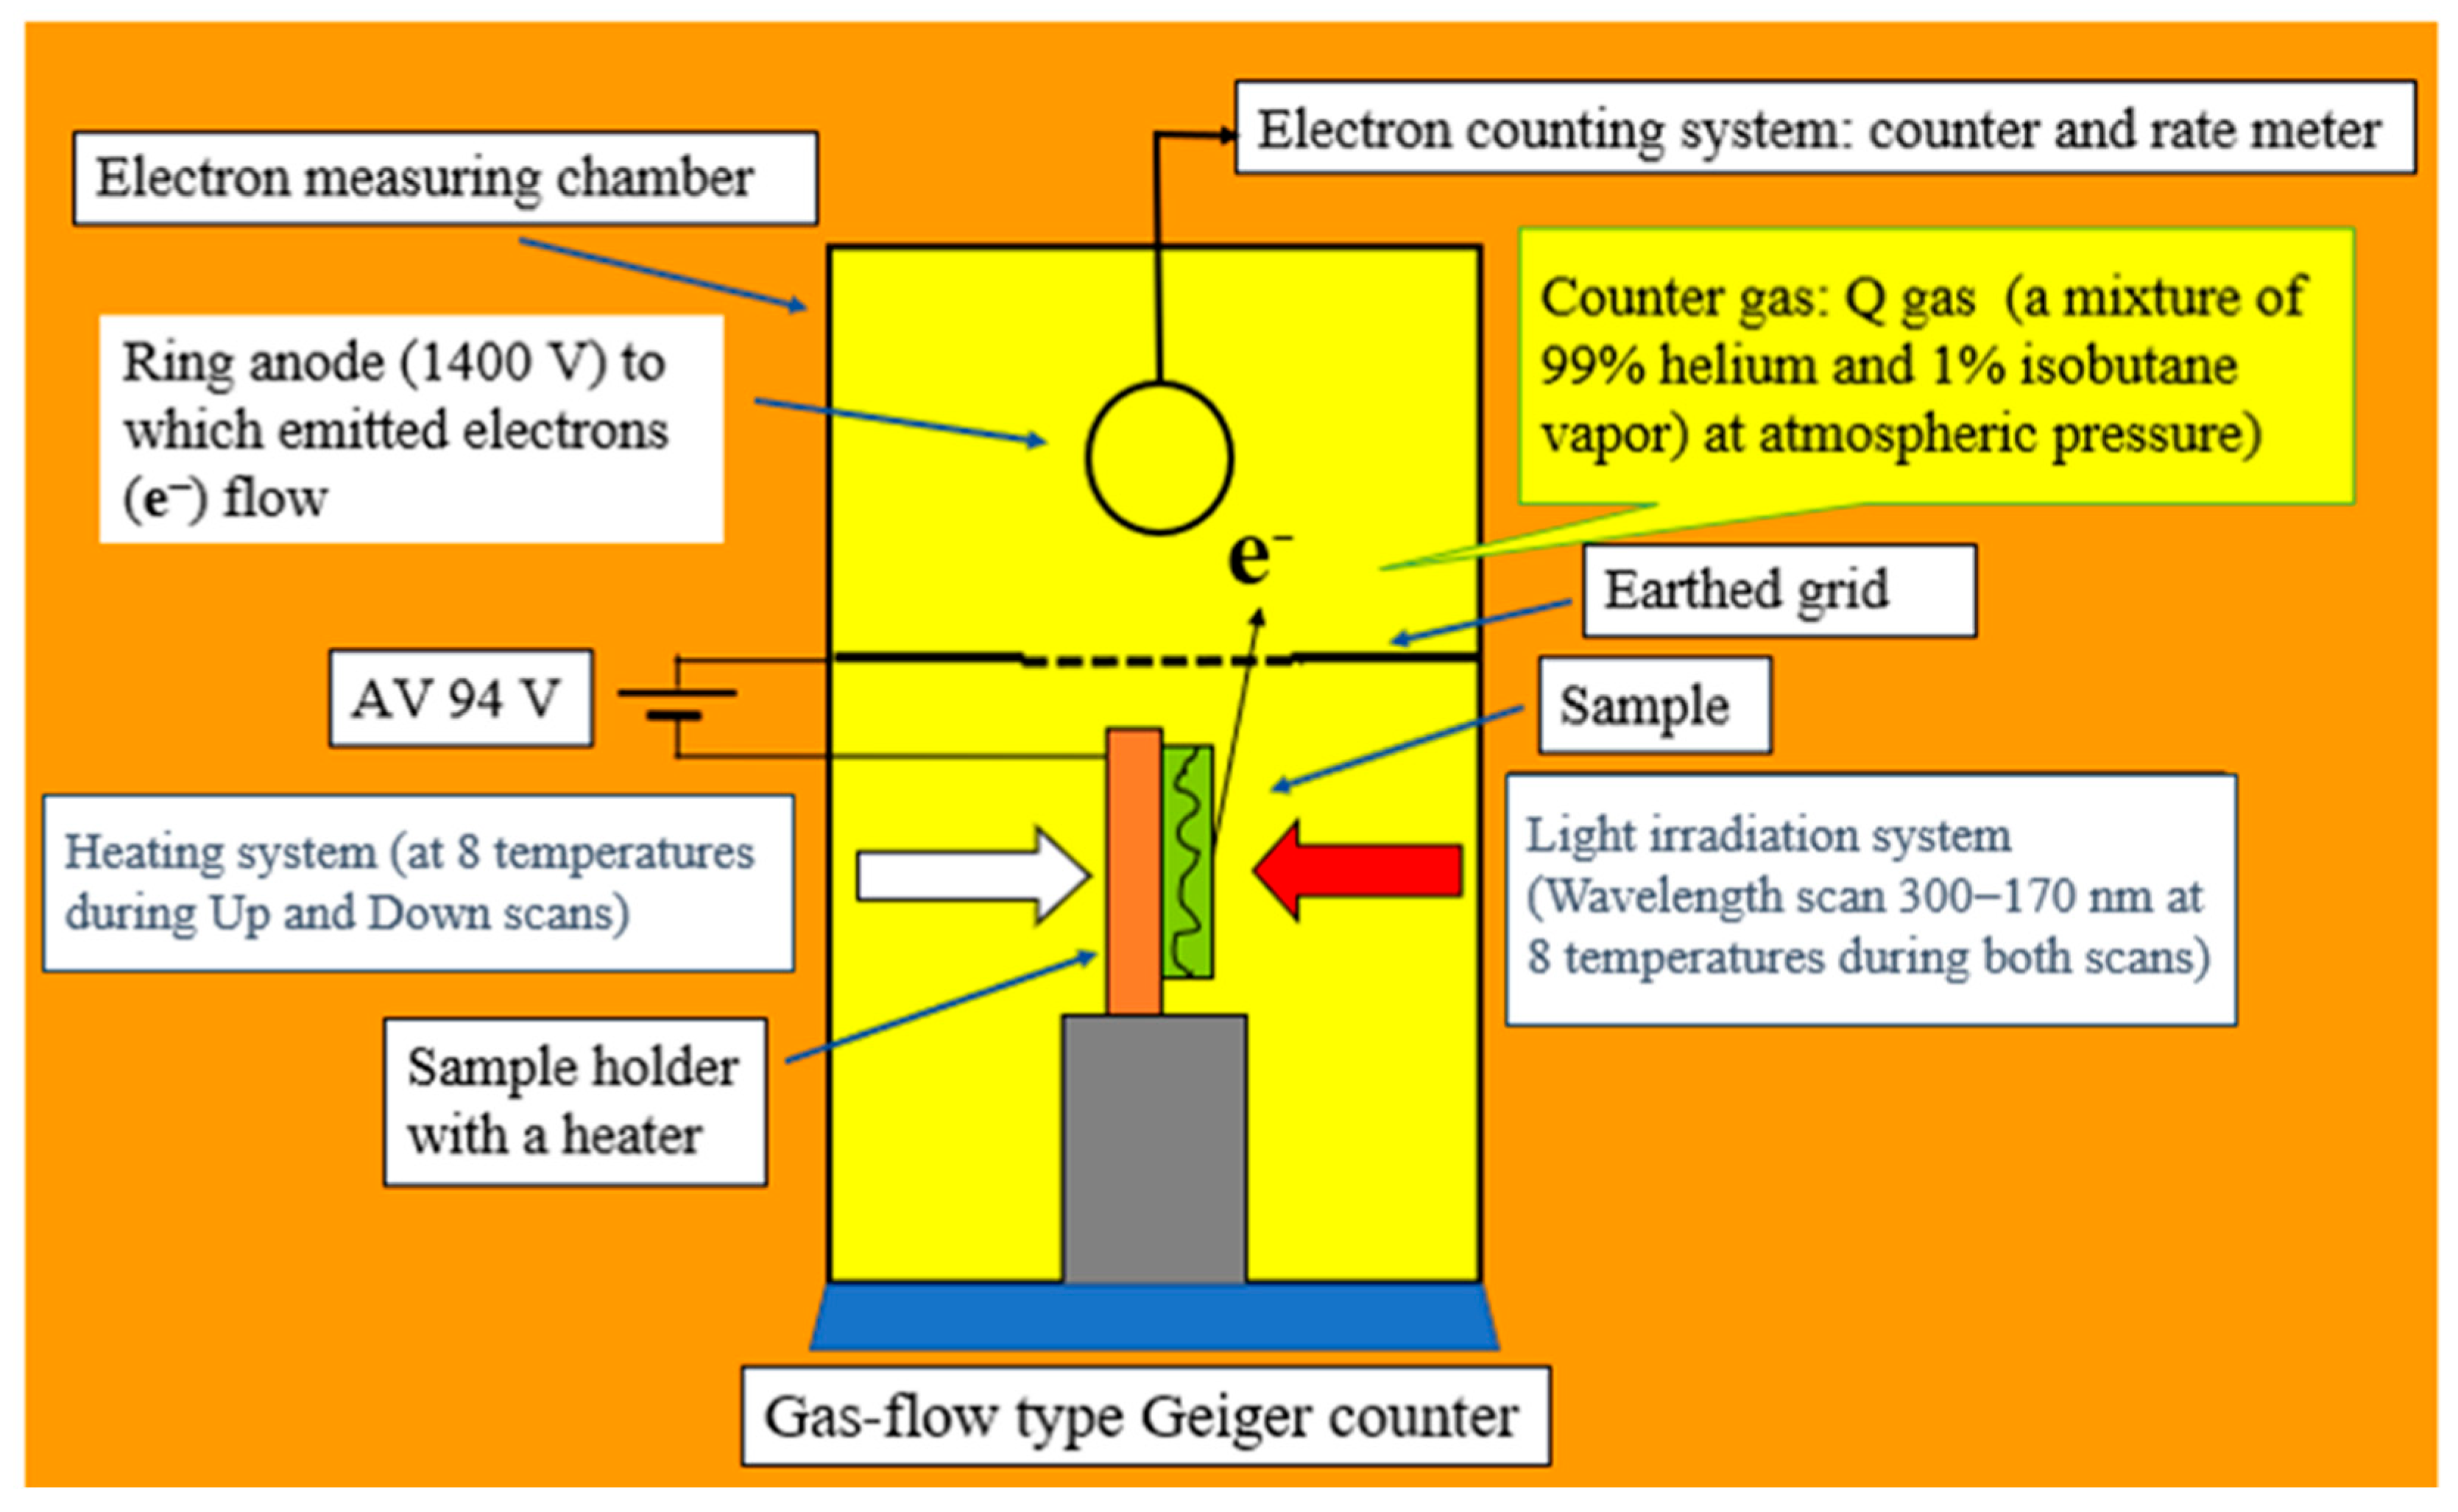
TPPE has proven to be a powerful method for examining how thin adsorbed films affect the electronic properties of metallic surfaces. Supported by X-ray photoelectron spectroscopy (XPS) data, we previously reported that the TPPE mechanism involves the partial transformation of –OH into oxide oxygen (Cu2O), accompanied by H2O desorption. We hypothesize that these –OH groups possess radical-like properties, attracting electrons from the base metal via tunneling, followed by Auger emission, which leads to PE under irradiation. Although the mechanism of TPPE remains unclear, this process is considered a key factor in increasing TPPE intensity.
The present understanding of TPPE focuses on several factors: (a) the polarity of –OH groups adsorbed on the metal surface; (b) the electron density of the oxygen in those groups, which is influenced by electric potential and light intensity; (c) the orientation of adsorbate molecules due to acid–base interactions; (d) the formation of electric dipoles; and (e) changes in the O 1s spectra before and after TPPE measurements. This study aims to investigate the transition from hydroxyl components or adsorbed oxygen to Cu2O in greater detail and to extend the analysis to metallic Cu surfaces with various organic adsorption layers, thereby further clarifying the electronic performance of Cu2O/Cu in practical applications.
To achieve these objectives and present a significant conceptual improvement over the previous publication [
2], this study expands the analysis to address the following key boundaries: (a) the reproducibility of emission profiles after distinct surface preparation pathways (mechanical abrasion, ultrasonic cleaning, and RF plasma pretreatments), followed by immersion in polar and nonpolar organic solvents; (b) the implementation of dynamic thermal scanning (heating and subsequent cooling cycles) coupled with optical profiling (wavelength scans) to measure and analyze the PE intensity from the surfaces, thus deriving the apparent activation energy and photoemission probability; (c) quantitative XPS O 1s deconvolution to map the real-time transformation between Cu
2O and Cu(OH)
2; and (d) the correlation between TPPE characteristics (
NT intensity and activation energy) and the chemical properties and the dielectric constant of adsorbed organic molecules, especially regarding acid–base interactions and surface redox reactions.
3. Results
3.1. PE Stimulation Spectra and Analysis
Figure S1a,b in the Supplementary Materials present the PE stimulation spectra (wavelength range of 300–170 nm) obtained at selected temperatures during heating (up scan, 25→350 °C) and subsequent cooling (down scan, 350→25 °C) for environments (3)–(9). Note that the recorded PE intensity includes the background count level.
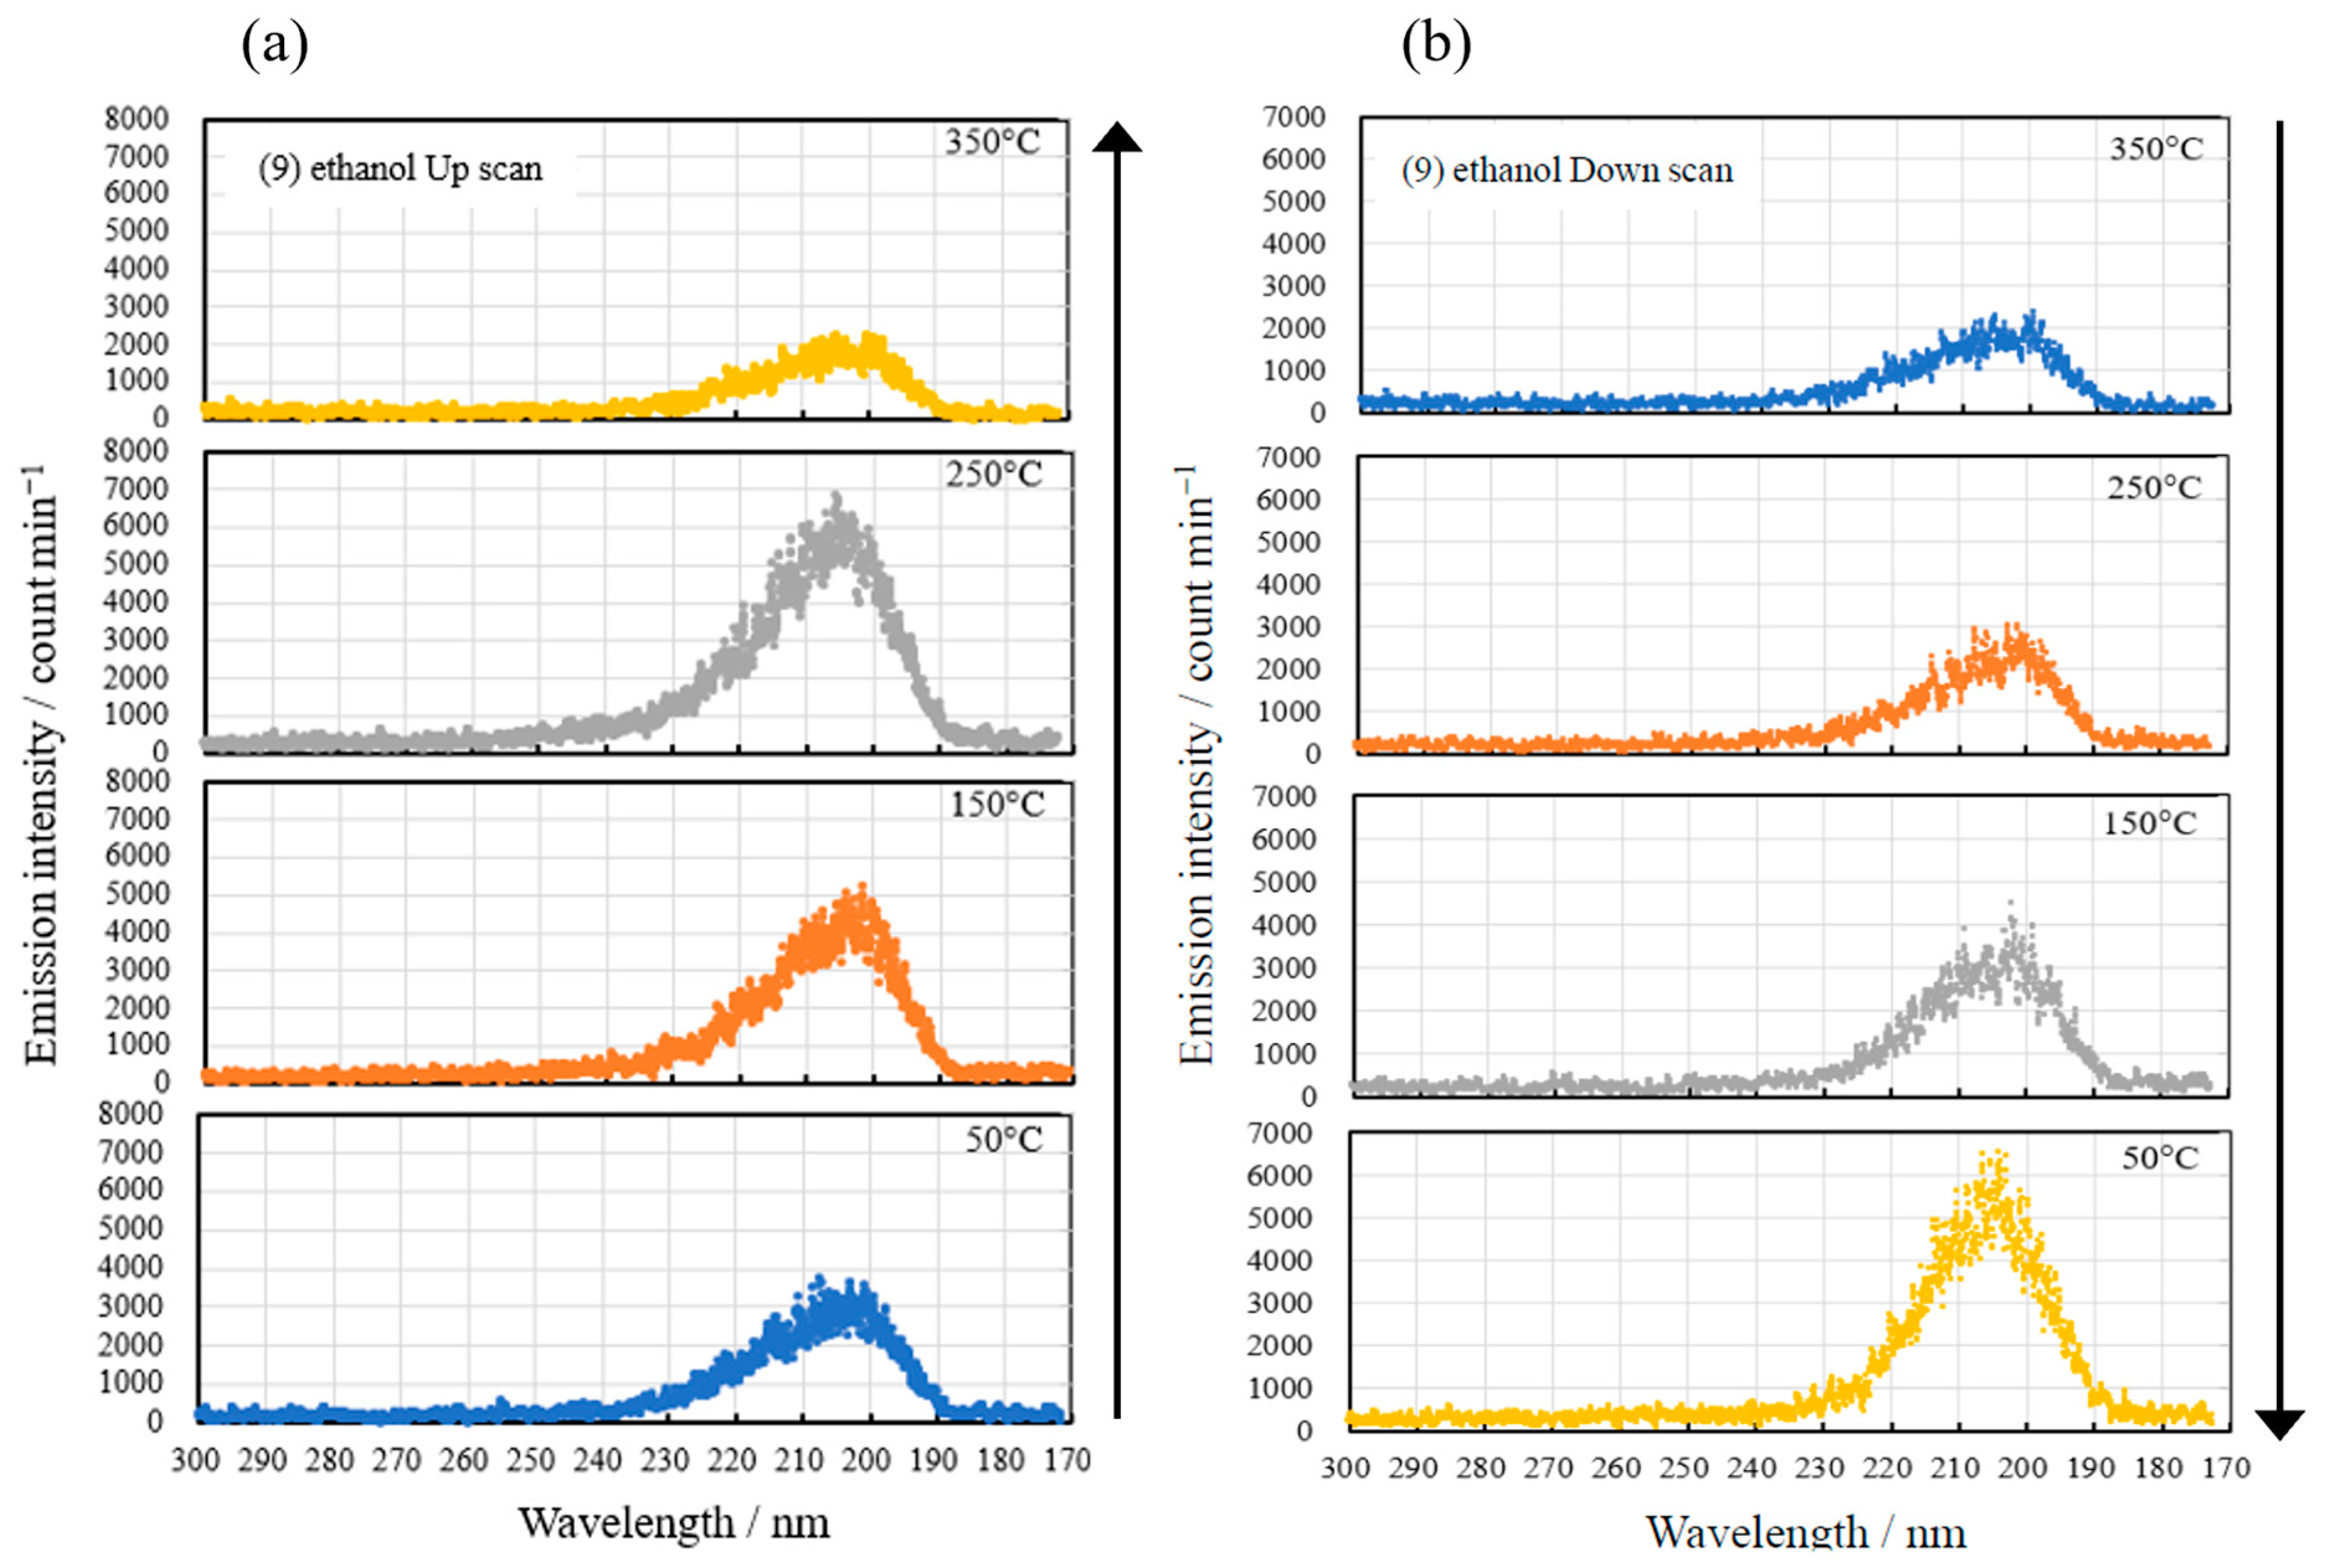
Figure 3 shows the data for environment (9).
Using (9) ethanol during the heating cycle as an example (
Figure 3a), the PE intensity progressively increases and then decreases with decreasing wavelength. This decline is due to the attenuation of UV light by air within the optical path. The emission peak consistently appears at approximately 205 nm. Furthermore, the emission intensity of the peak increases with temperature, reaching a maximum of 5.5 × 10
3 count min
−1 (
IWmax,Up) at the temperature of 250 °C (
TWmax), before decreasing at higher temperatures. Additionally, the peak exhibits a slight blueshift at 350 °C, compared with the peak wavelength at 50 °C. Conversely, during the cooling cycle (
Figure 3b), the PE intensity increases with decreasing temperature, reaching a maximum intensity of 5.0 × 10
3 count min
−1 (
IWmax,Down) at 50 °C. The peak initially appears between 200 and 210 nm and displays a slight redshift at 50 °C, compared with the peak wavelength at 350 °C.
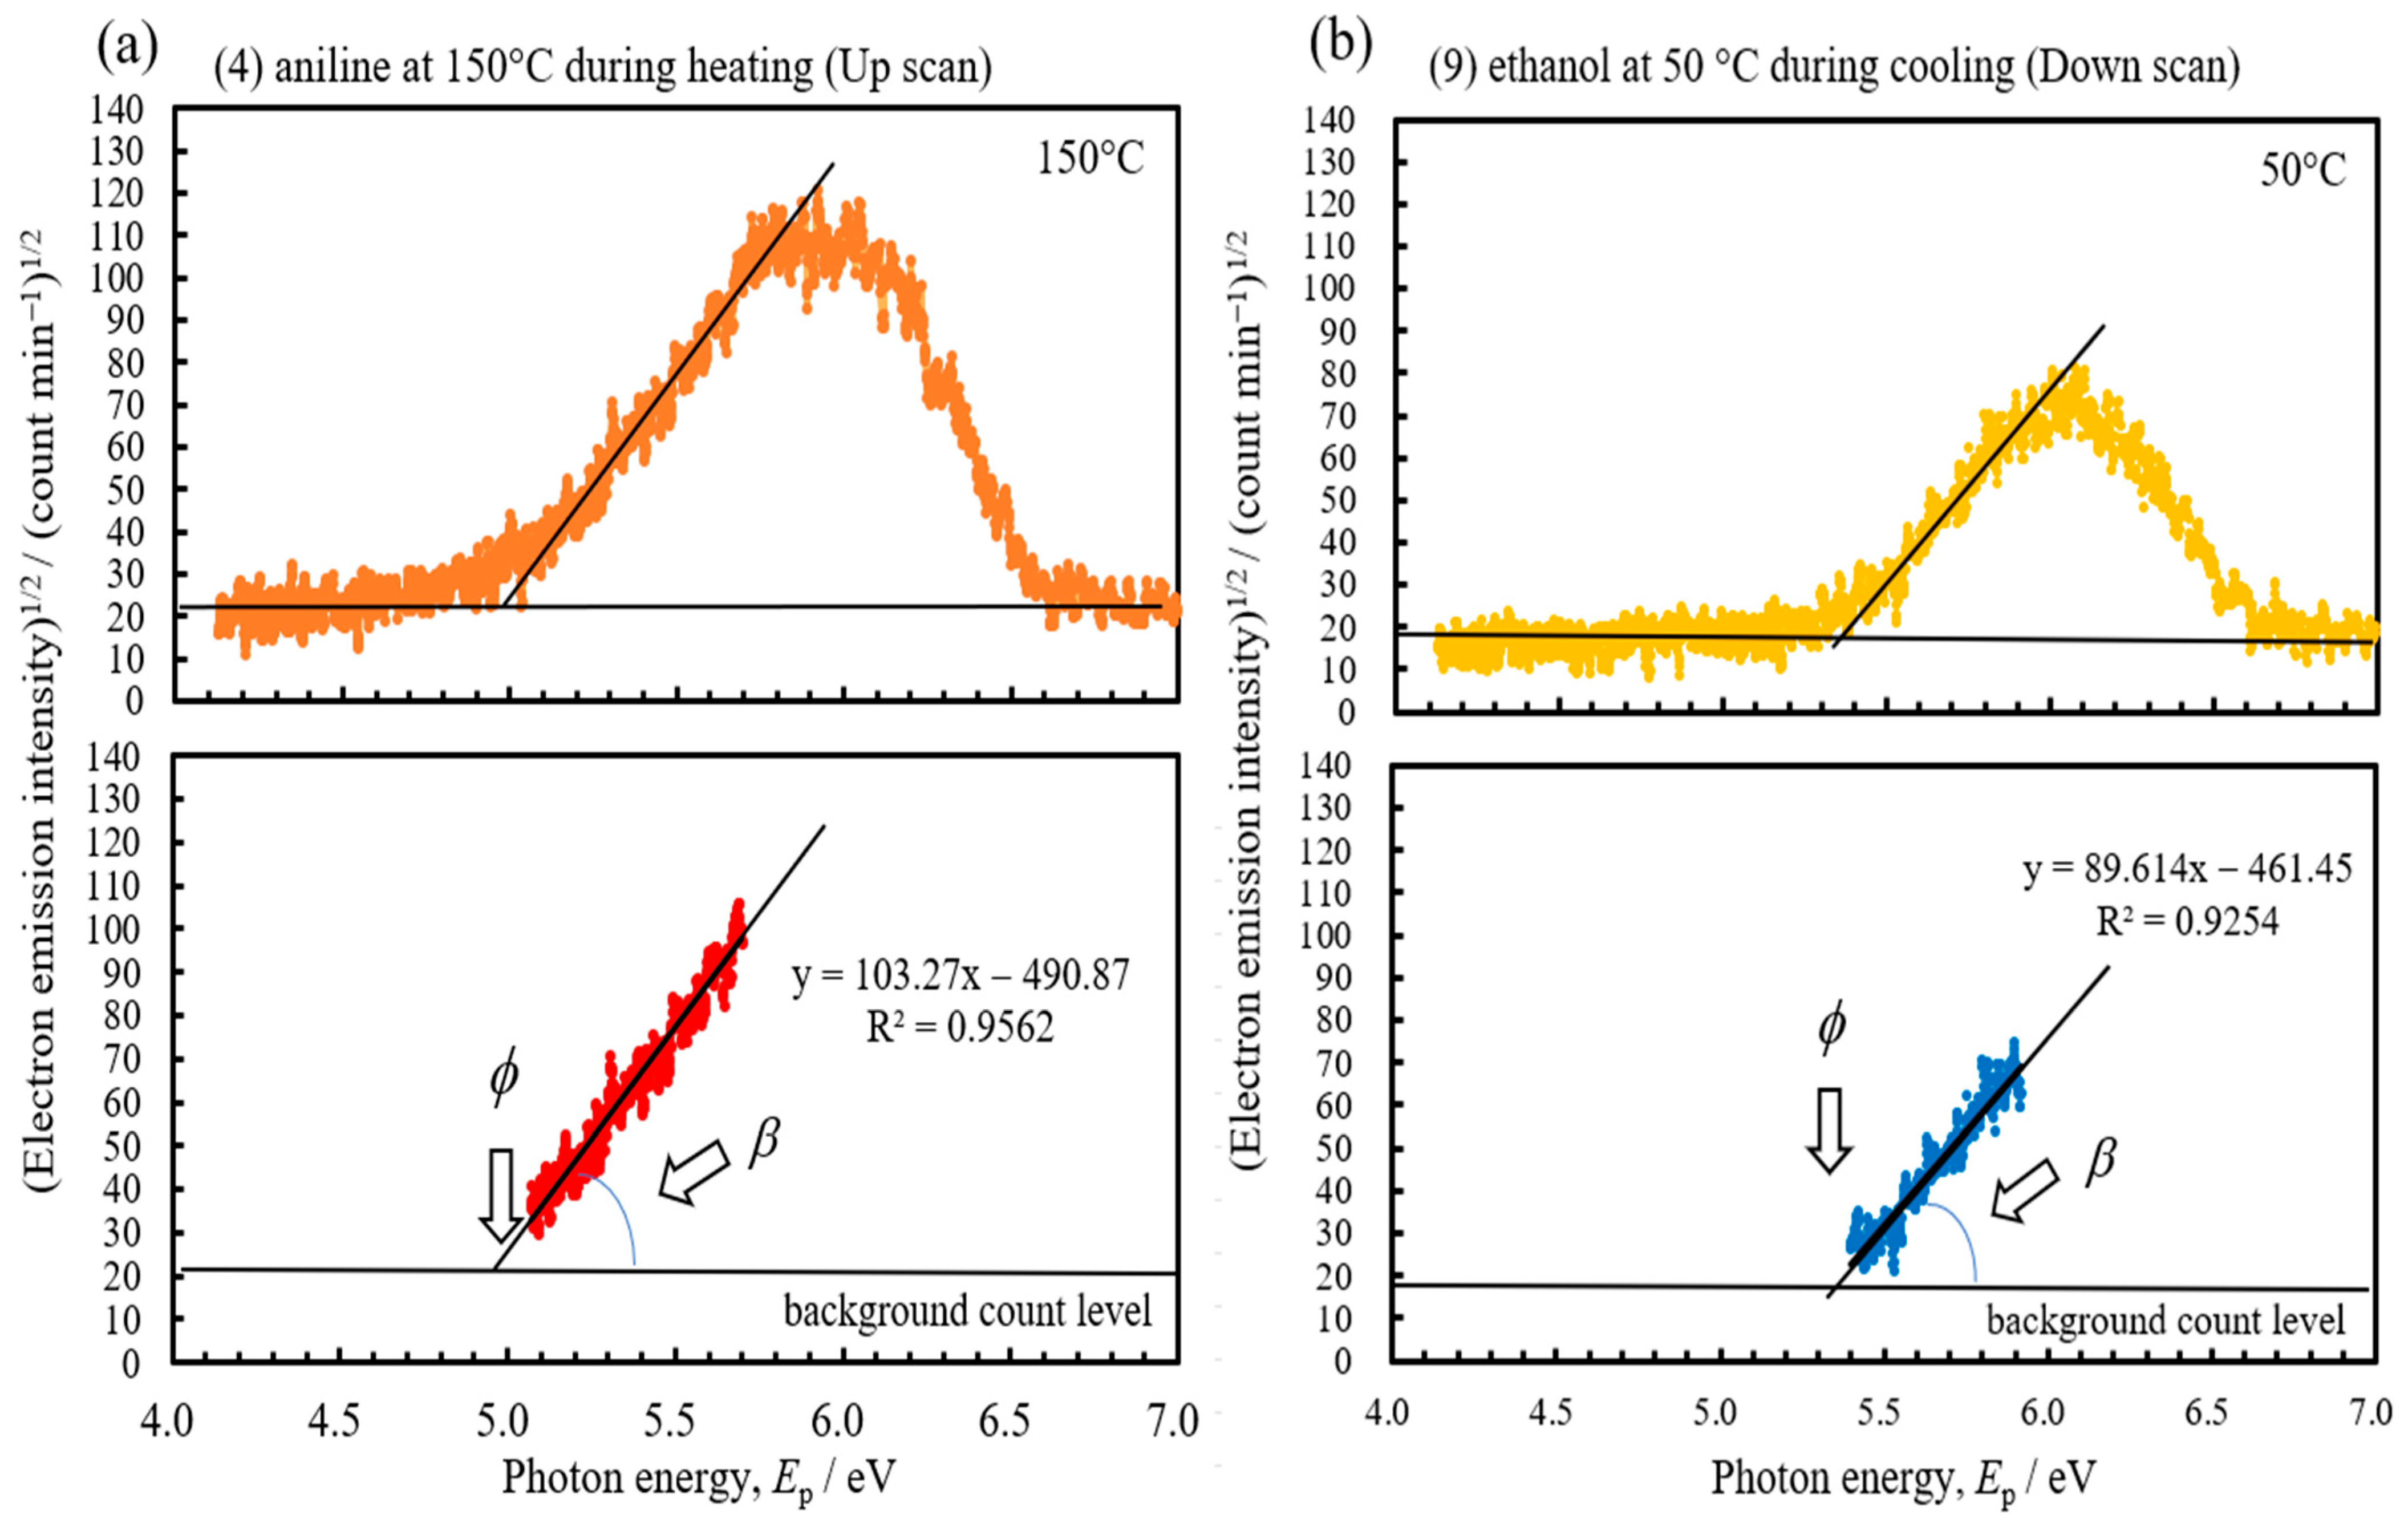
To obtain the TPPE characteristics, the square root of the PE intensity,
IW, was plotted against the incident photon energy,
Ep.
Figure 4 shows representative results for (4) aniline at 150 °C during heating and (9) ethanol at 50 °C during cooling.
Table 1 summarizes the resulting data—including the peak intensity (
IWmax), peak temperature (
TWmax), peak wavelength (
λWmax), peak photon energy (
ϕWmax),
f, and
b—for environments (3)–(9) during heating and cooling. An analysis of the PE stimulation spectra and their relationships with TPPE characteristics is described in
Section 3.7.
3.2. TPPE Plots and Reproducibility
Figure S2 in the Supplementary Materials shows the plots of
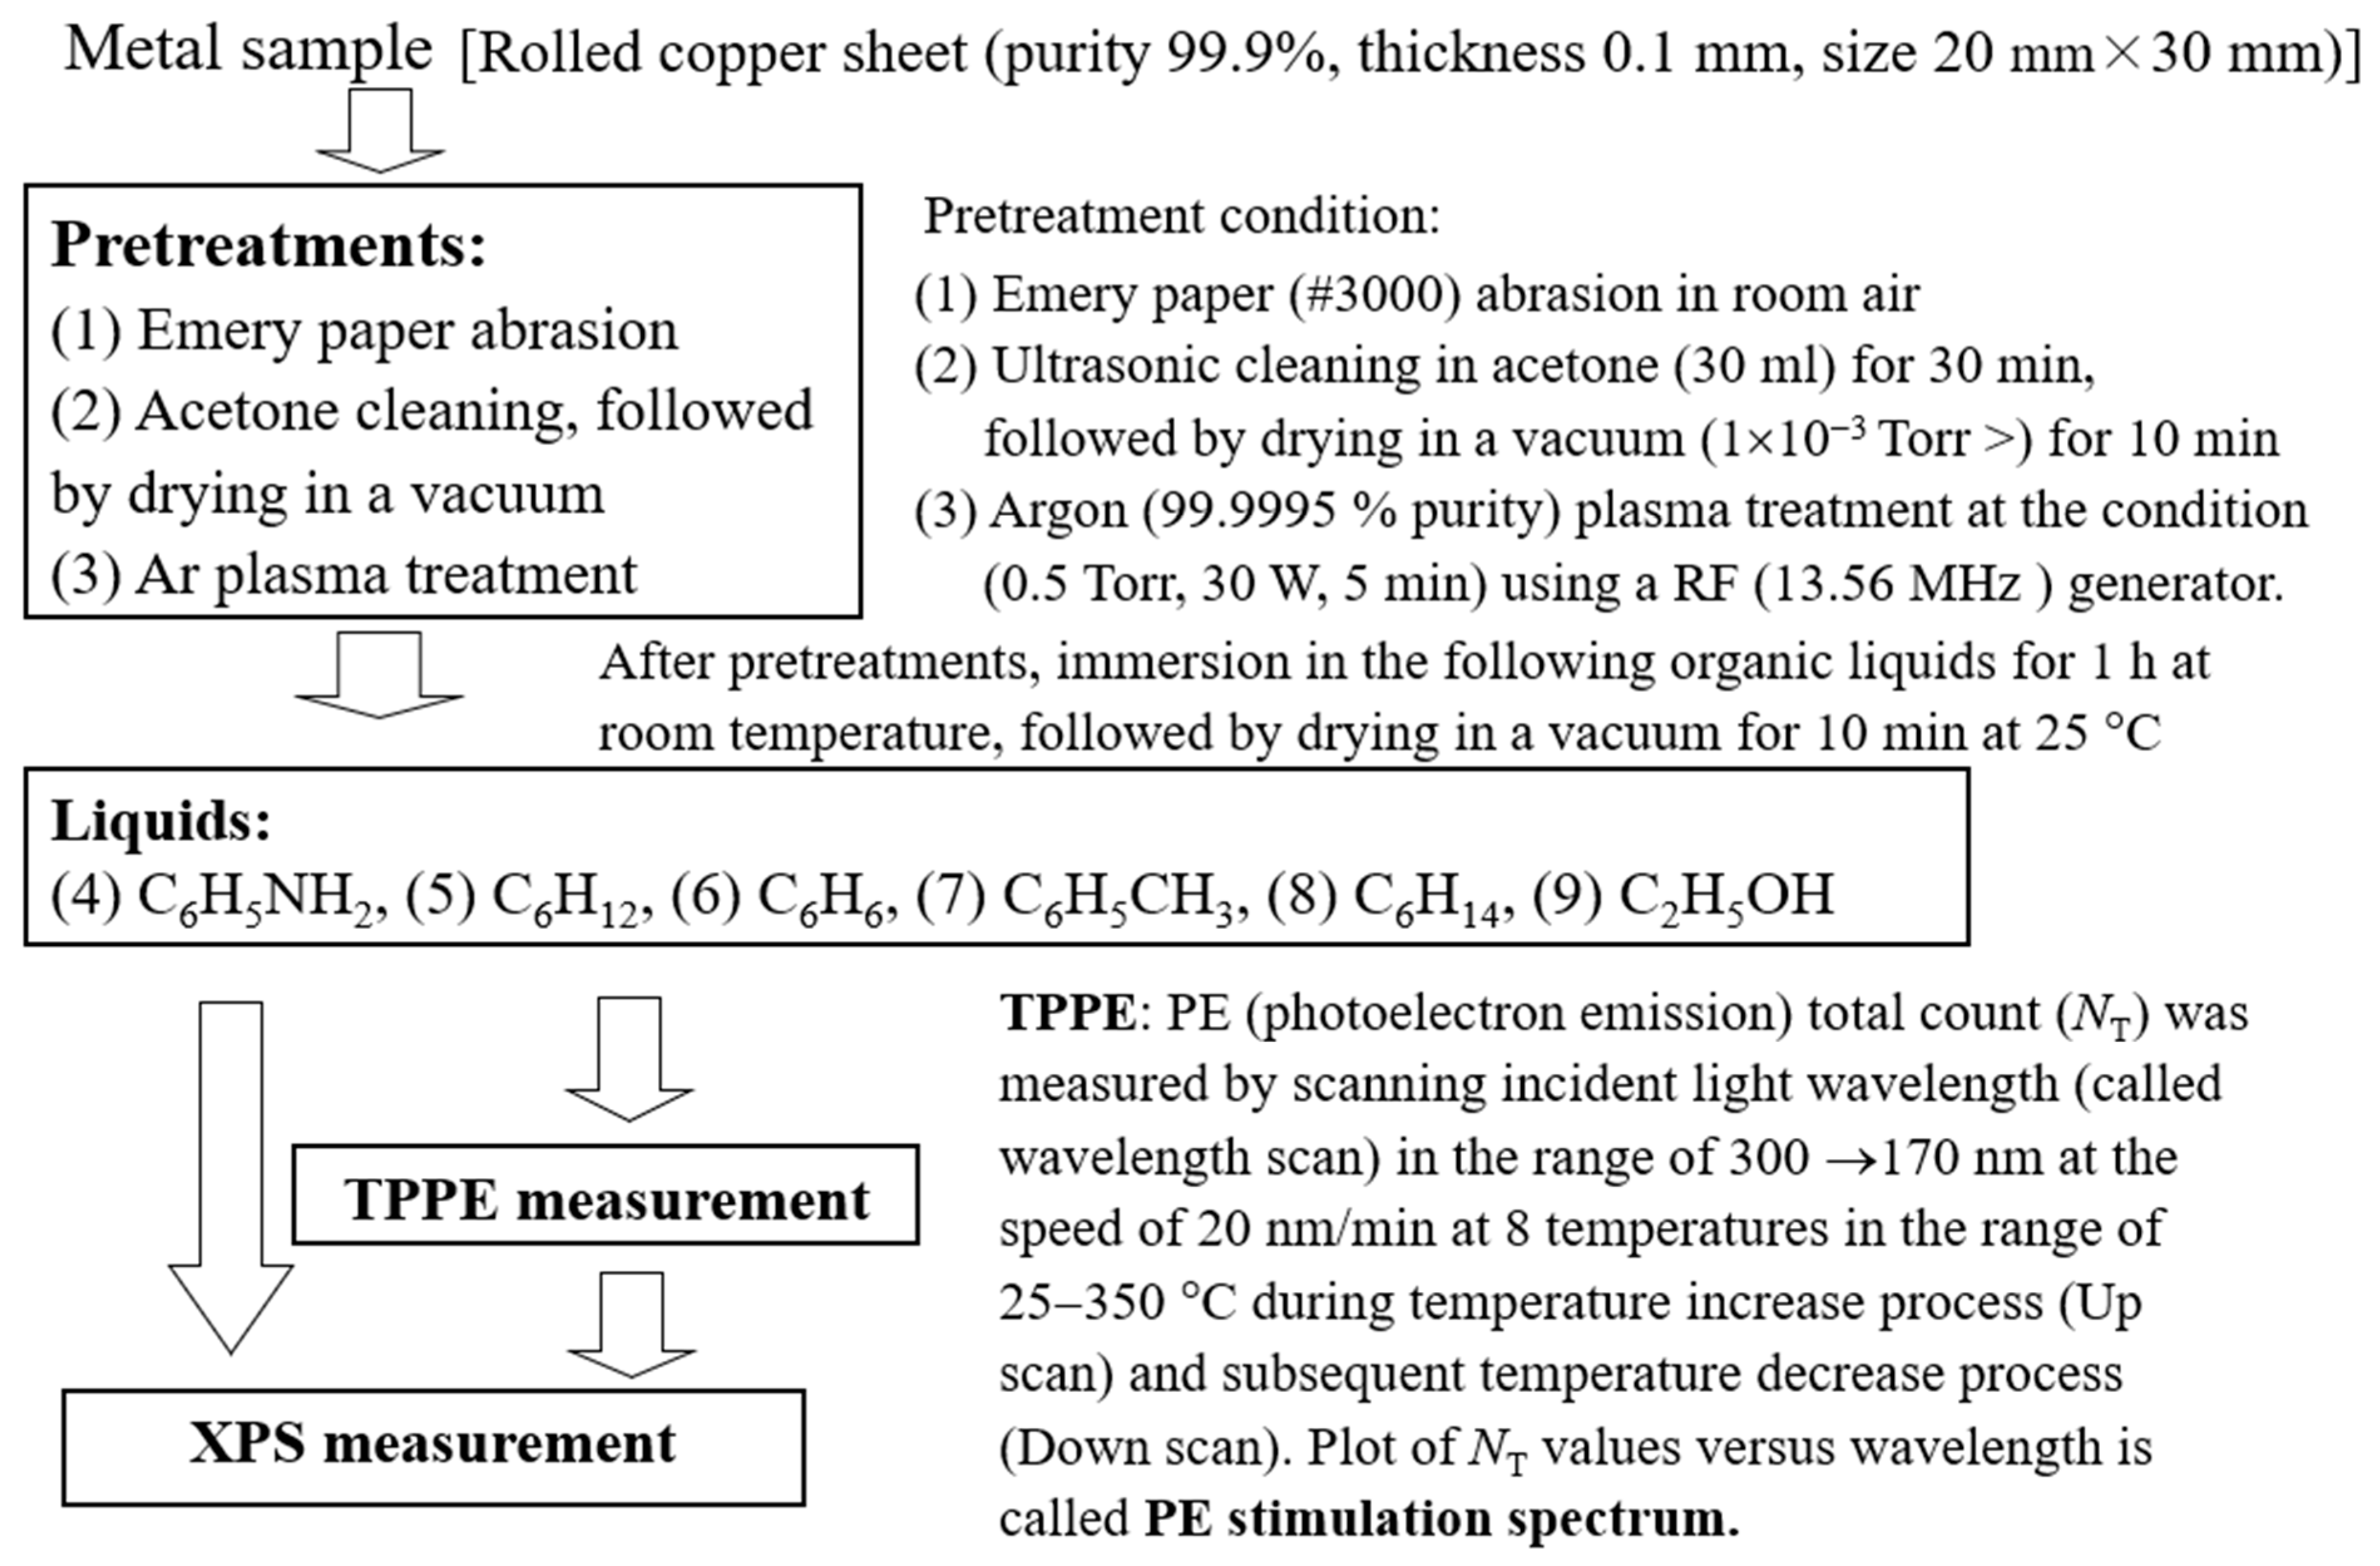
NT versus temperature during heating and cooling for all copper samples, referred to as the TPPE plots. To ensure reproducibility and data reliability, we carried out TPPE measurements for two or three samples in each environment: n = 3 for (1) emery paper abrasion, n = 2 for (2) acetone, n = 3 for (3) Ar plasma treatment, n = 3 for (4) aniline, n = 2 for (5) cyclohexane, n = 3 for (6) benzene, n = 3 for (7) toluene, n = 3 for (8) hexane, and n = 3 for (9) ethanol. The corrected
NT values were obtained by subtracting the natural background count (1000 counts).
Regarding the potential influence of brief ambient air exposure during sample transfer before XPS and TPPE measurements, we consider the benchmarks established in our prior work. Specifically, as documented in Figure 3(1) (H
2O after abrasion) and 3(6) (ambient air after abrasion) of the previous paper [
2], the
NT values recorded at 25 °C were 0.59 × 10
4 and 0.48 × 10
4 counts, respectively. Because these initial values are remarkably close, the electronic effect of short-term atmospheric adsorption during the sample transfer step is considered to be nearly identical to that of an intentionally introduced water film, even though the
NT profiles diverge as the temperature is subsequently increased. Furthermore, this ambient transfer window was kept identical and brief across all nine experimental conditions to ensure that any minor atmospheric contamination acts as a constant, uniform baseline rather than a variable error.
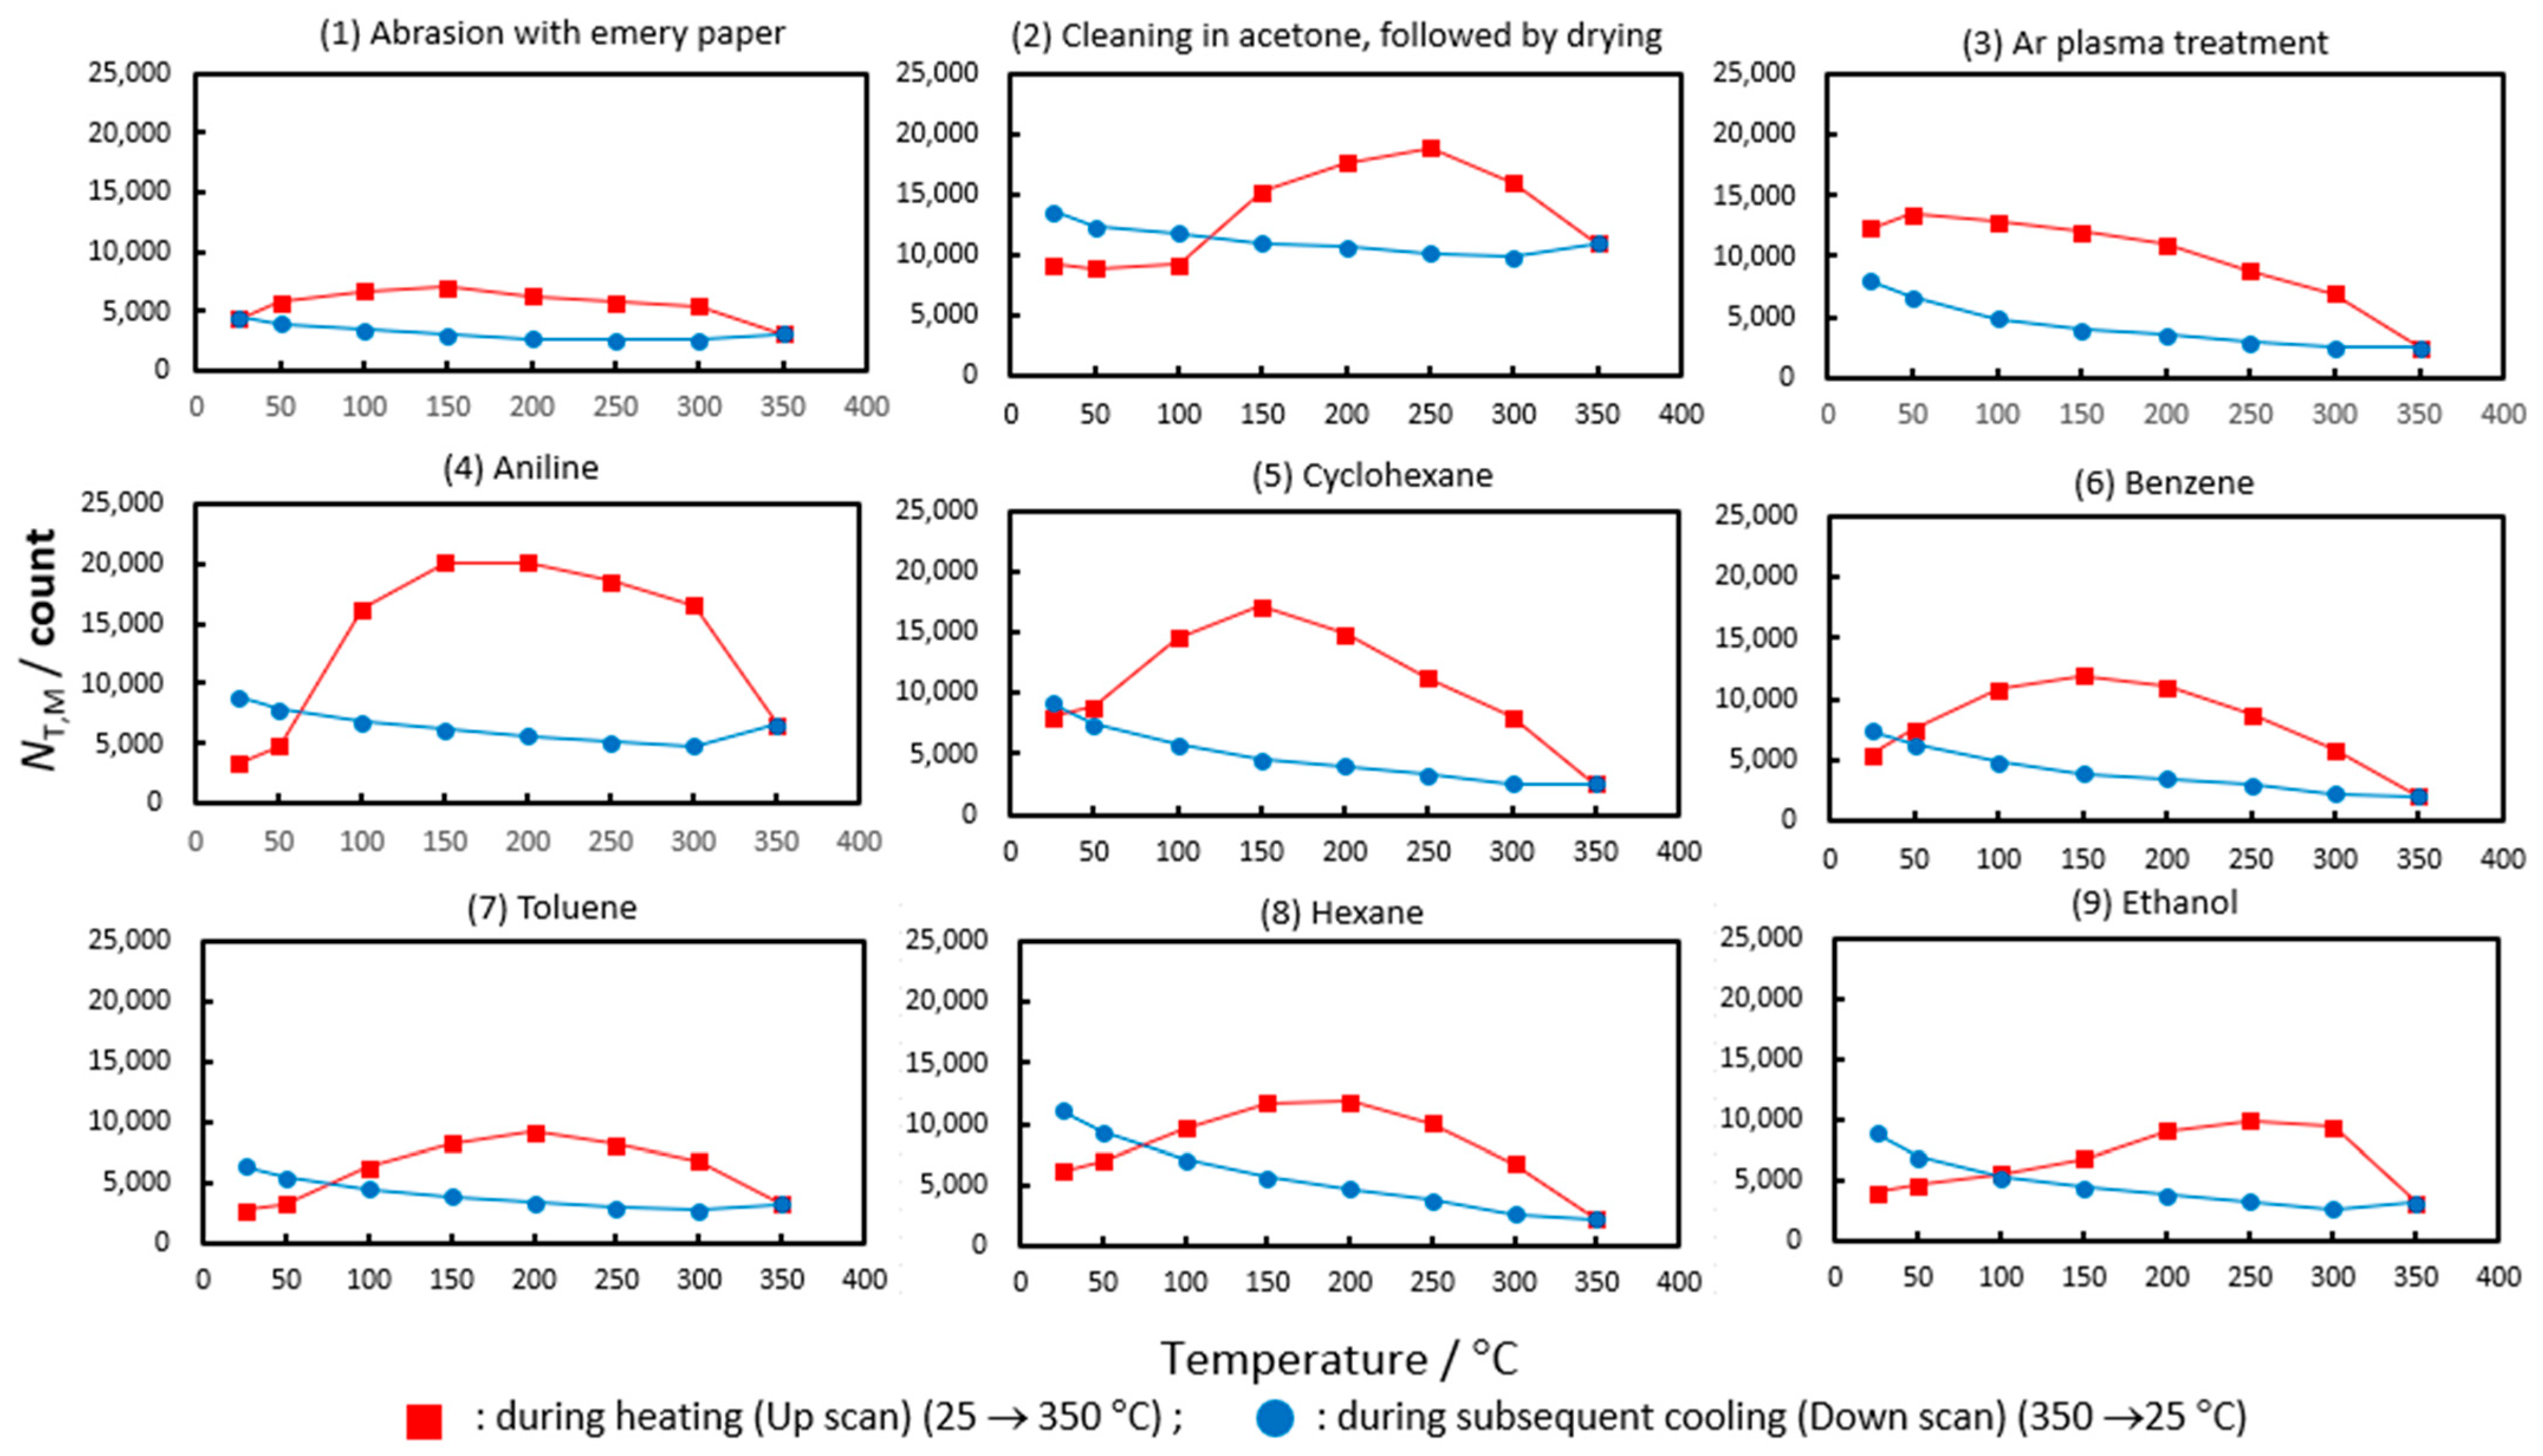
Distinct behaviors are observed in each environment during heating. Generally, NT remains low in the initial stage, increases with increasing temperature, reaches a maximum (NTmax) at a specific temperature (Tmax), and then decreases. Notably, samples subjected only to (1) emery paper abrasion show relatively low, temperature-independent NT values. In contrast, (3) Ar plasma treatment samples exhibit high NT values at low temperature, peaking at 50 °C and then gradually decreasing. Samples exposed to environments (2) and (4)–(9) produced broad, high-intensity peaks, with significantly varied NTmax values at Tmax. During the subsequent cooling cycle (down scan); however, the NT values increase gradually with decreasing temperature for all environments.
Table S1 in the Supplementary Materials summarizes the TPPE characteristics, including the sum of NT, NTmax, and Tmax during the heating cycle. Activation energies (ΔENT) and pre-exponential factors (A0,N,T) were derived from Arrhenius plots (lnNT vs. 1/T) based on Equation (1). In the heating cycle, these plots typically revealed two distinct linear regions (the first and second steps) in most environments, except for (2) and (9), which exhibited a single linear relationship. Cooling cycle plots consistently showed a single linear region. The reproducibility of the TPPE data was confirmed by determining the mean and standard deviation (SD) for each environment; SD values for the sum of NT ranged from 0.25 to 2.64, while SD for the first-step ΔENT (up scan) ranged from 0.026 to 0.091. The averaged characteristics for the mean NT values (NT,M) are further detailed in
Table S2.
3.3. Averaged TPPE and Arrhenius Plots
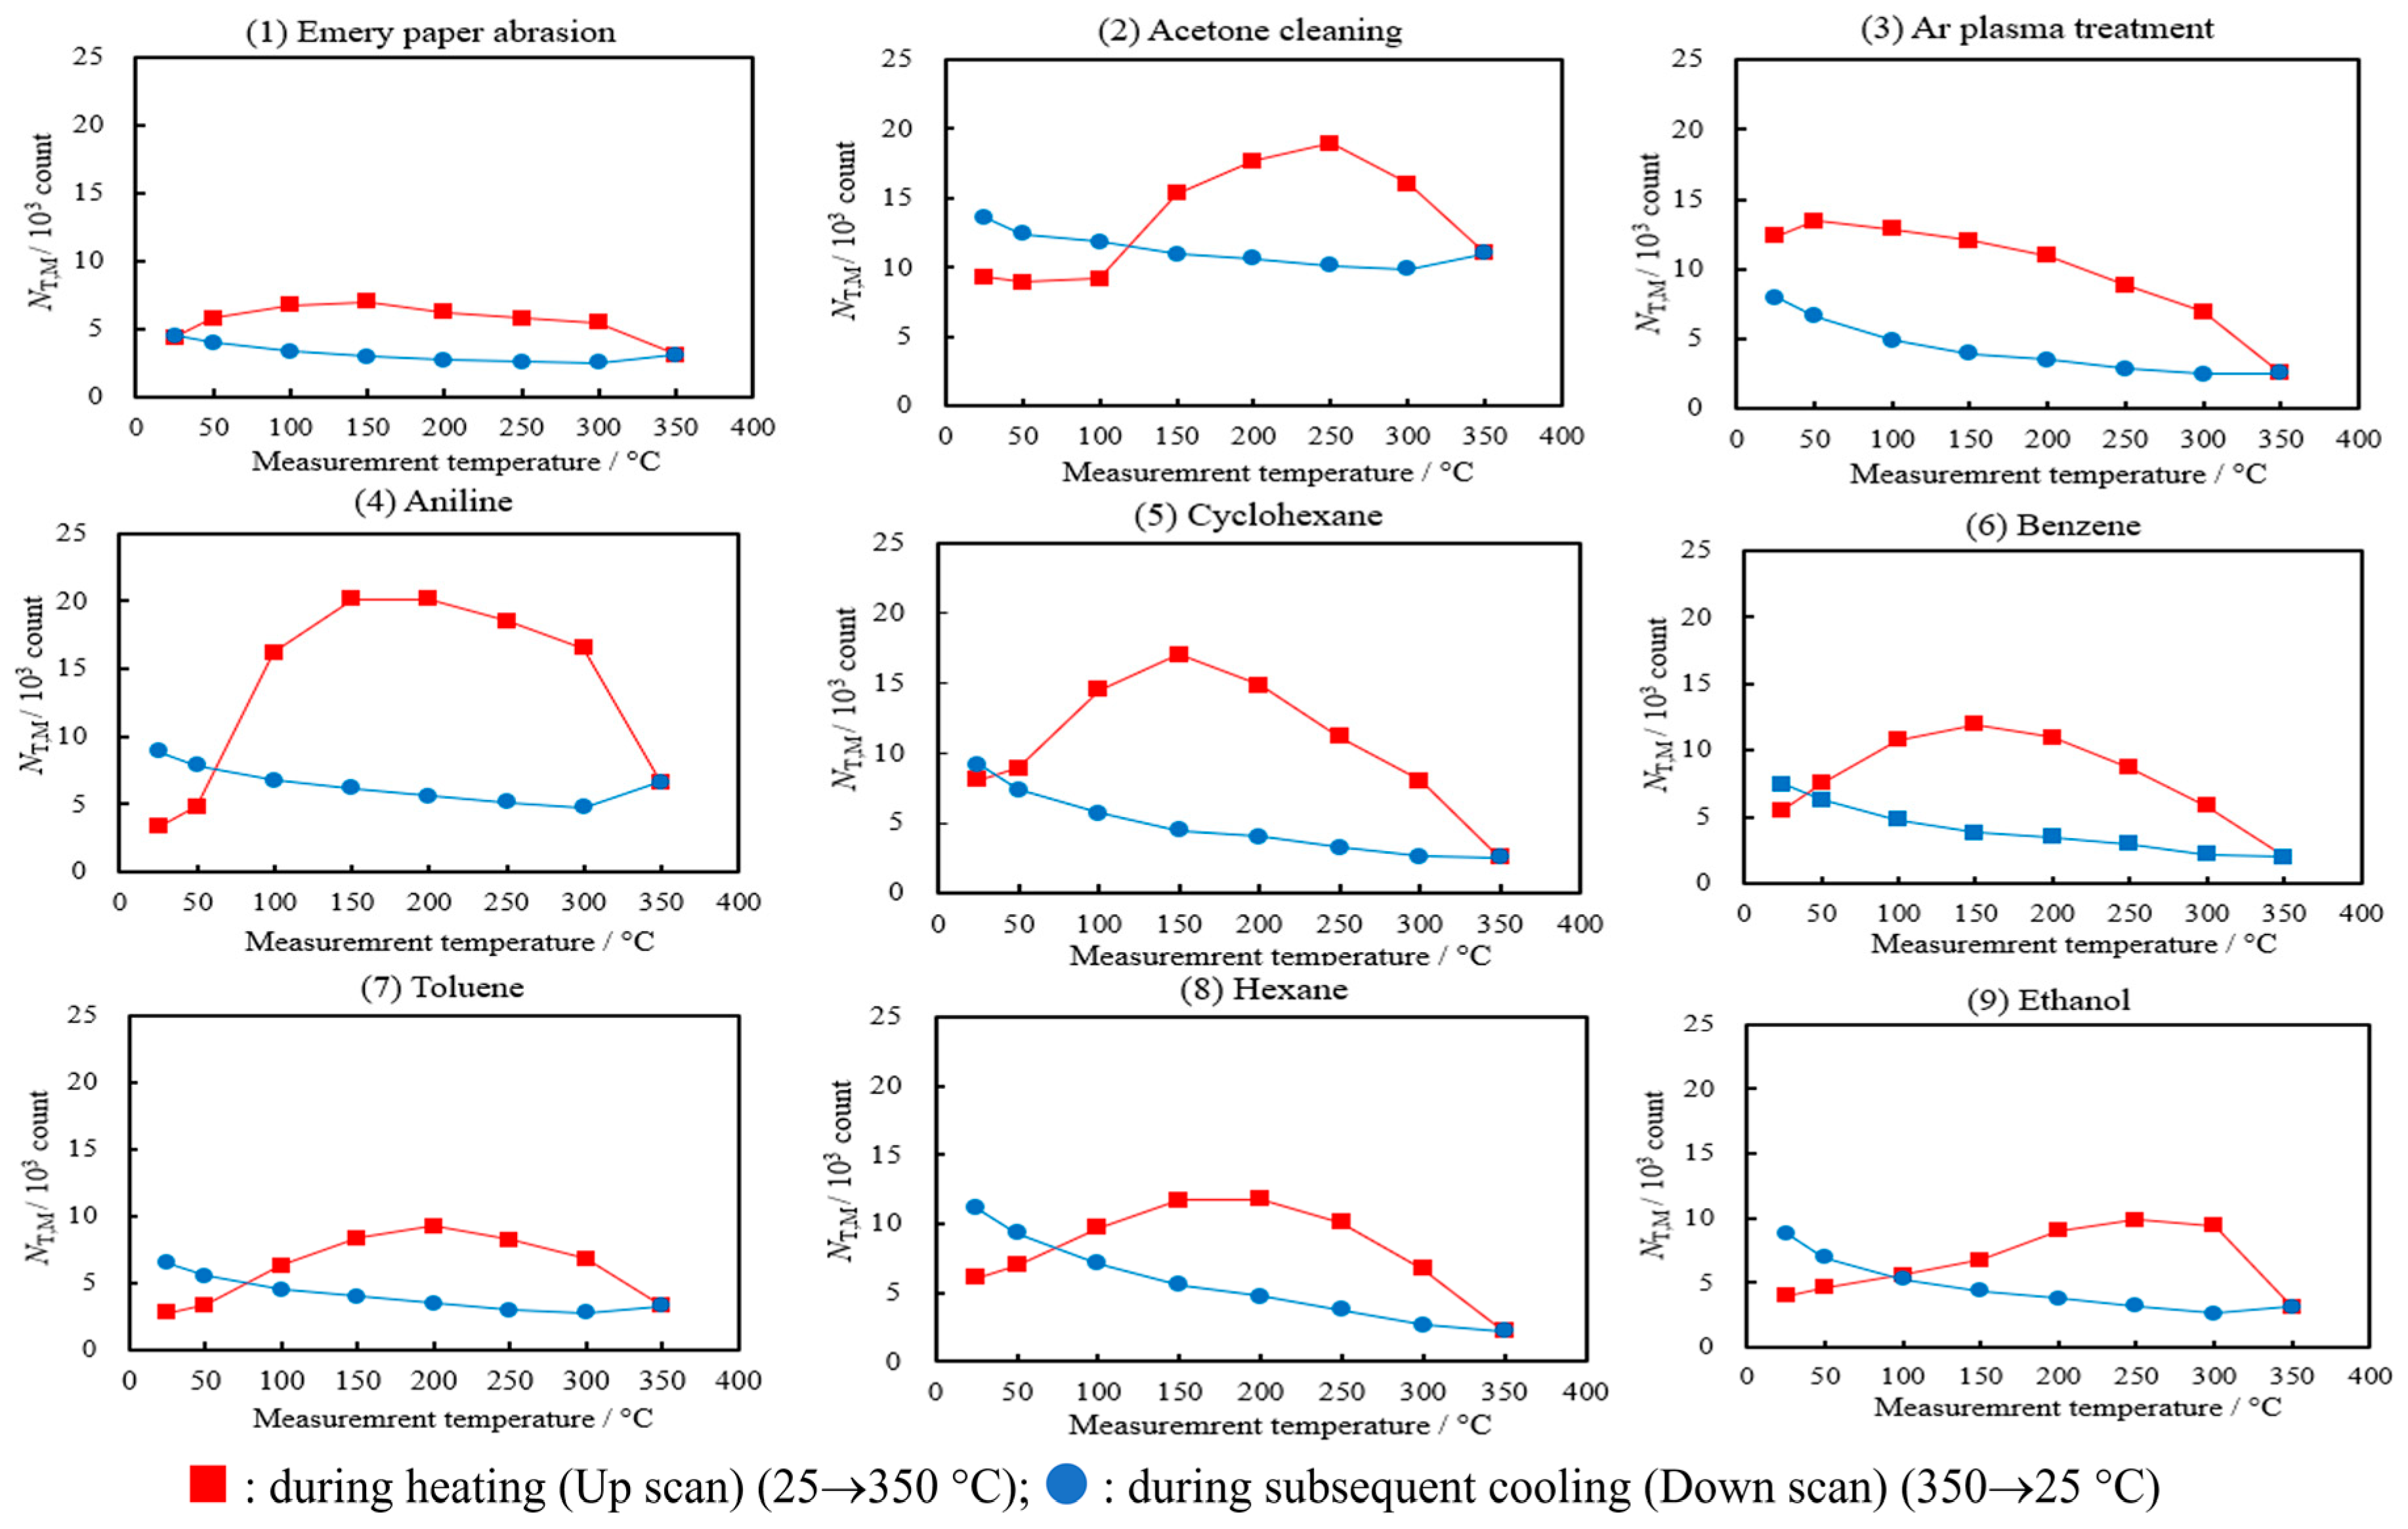
Figure 5 presents the averaged TPPE plots, showing the
NT,M values versus temperature during heating and cooling for all copper sample pretreatments and environments.
NT,M represents the mean
NT value recorded at each measurement temperature during heating (up scan: 25→350 °C) and subsequent cooling (down scan: 350→25 °C).
The TPPE characteristics are summarized as follows, according to the environment:
Pretreatments (1)–(3). For environment (1), NT,M remains nearly constant during both heating and cooling. For environment (2), NT,M initially remains constant during heating, but increases and reaches a broad maximum (NT,Mmax) at 250 °C (Tmax,M) before declining. For environment (3), NT,M remains high during heating at low temperatures, reaches a maximum (NT,Mmax) at 50 °C (Tmax,M), as the temperature rises, and then gradually decreases. For both (2) and (3), NT,M progressively increases with decreasing temperature during cooling.
Organic Solvents (4)–(7). During heating, NT,M is initially low, then increases to a maximum (NT,Mmax) at Tmax,M, and then declines. Notably, (4) C6H5NH2 exhibited a broad, high-intensity peak between 100 and 300 °C. This sustained emission is attributed to a strong acid–base reaction between the amino group (−NH2) and surface hydroxyls: C6H5NH2 + CuOH → C6H5NH3+ + Cu–O−, producing a strong surface dipole with the positive pole oriented outward.
Organic Solvents (8) and (9). These samples followed a similar heating trend. However, (9) C2H5OH produces the highest Tmax,M (approximately 250 °C), suggesting stronger bonding to the Cu surface than the other solvents. The hydroxyl group of the C2H5OH molecule is likely hydrogen-bonded to the oxygen atom of CuOH on the Cu surface, generating a surface dipole with the negative pole oriented outward.
All samples follow a similar trend during cooling.
NT,M gradually increases with decreasing temperature and reaches a maximum at 25 °C. The
NT,M intensities and D
ENT values shown in
Table S2 serve as the basis for subsequent discussion.
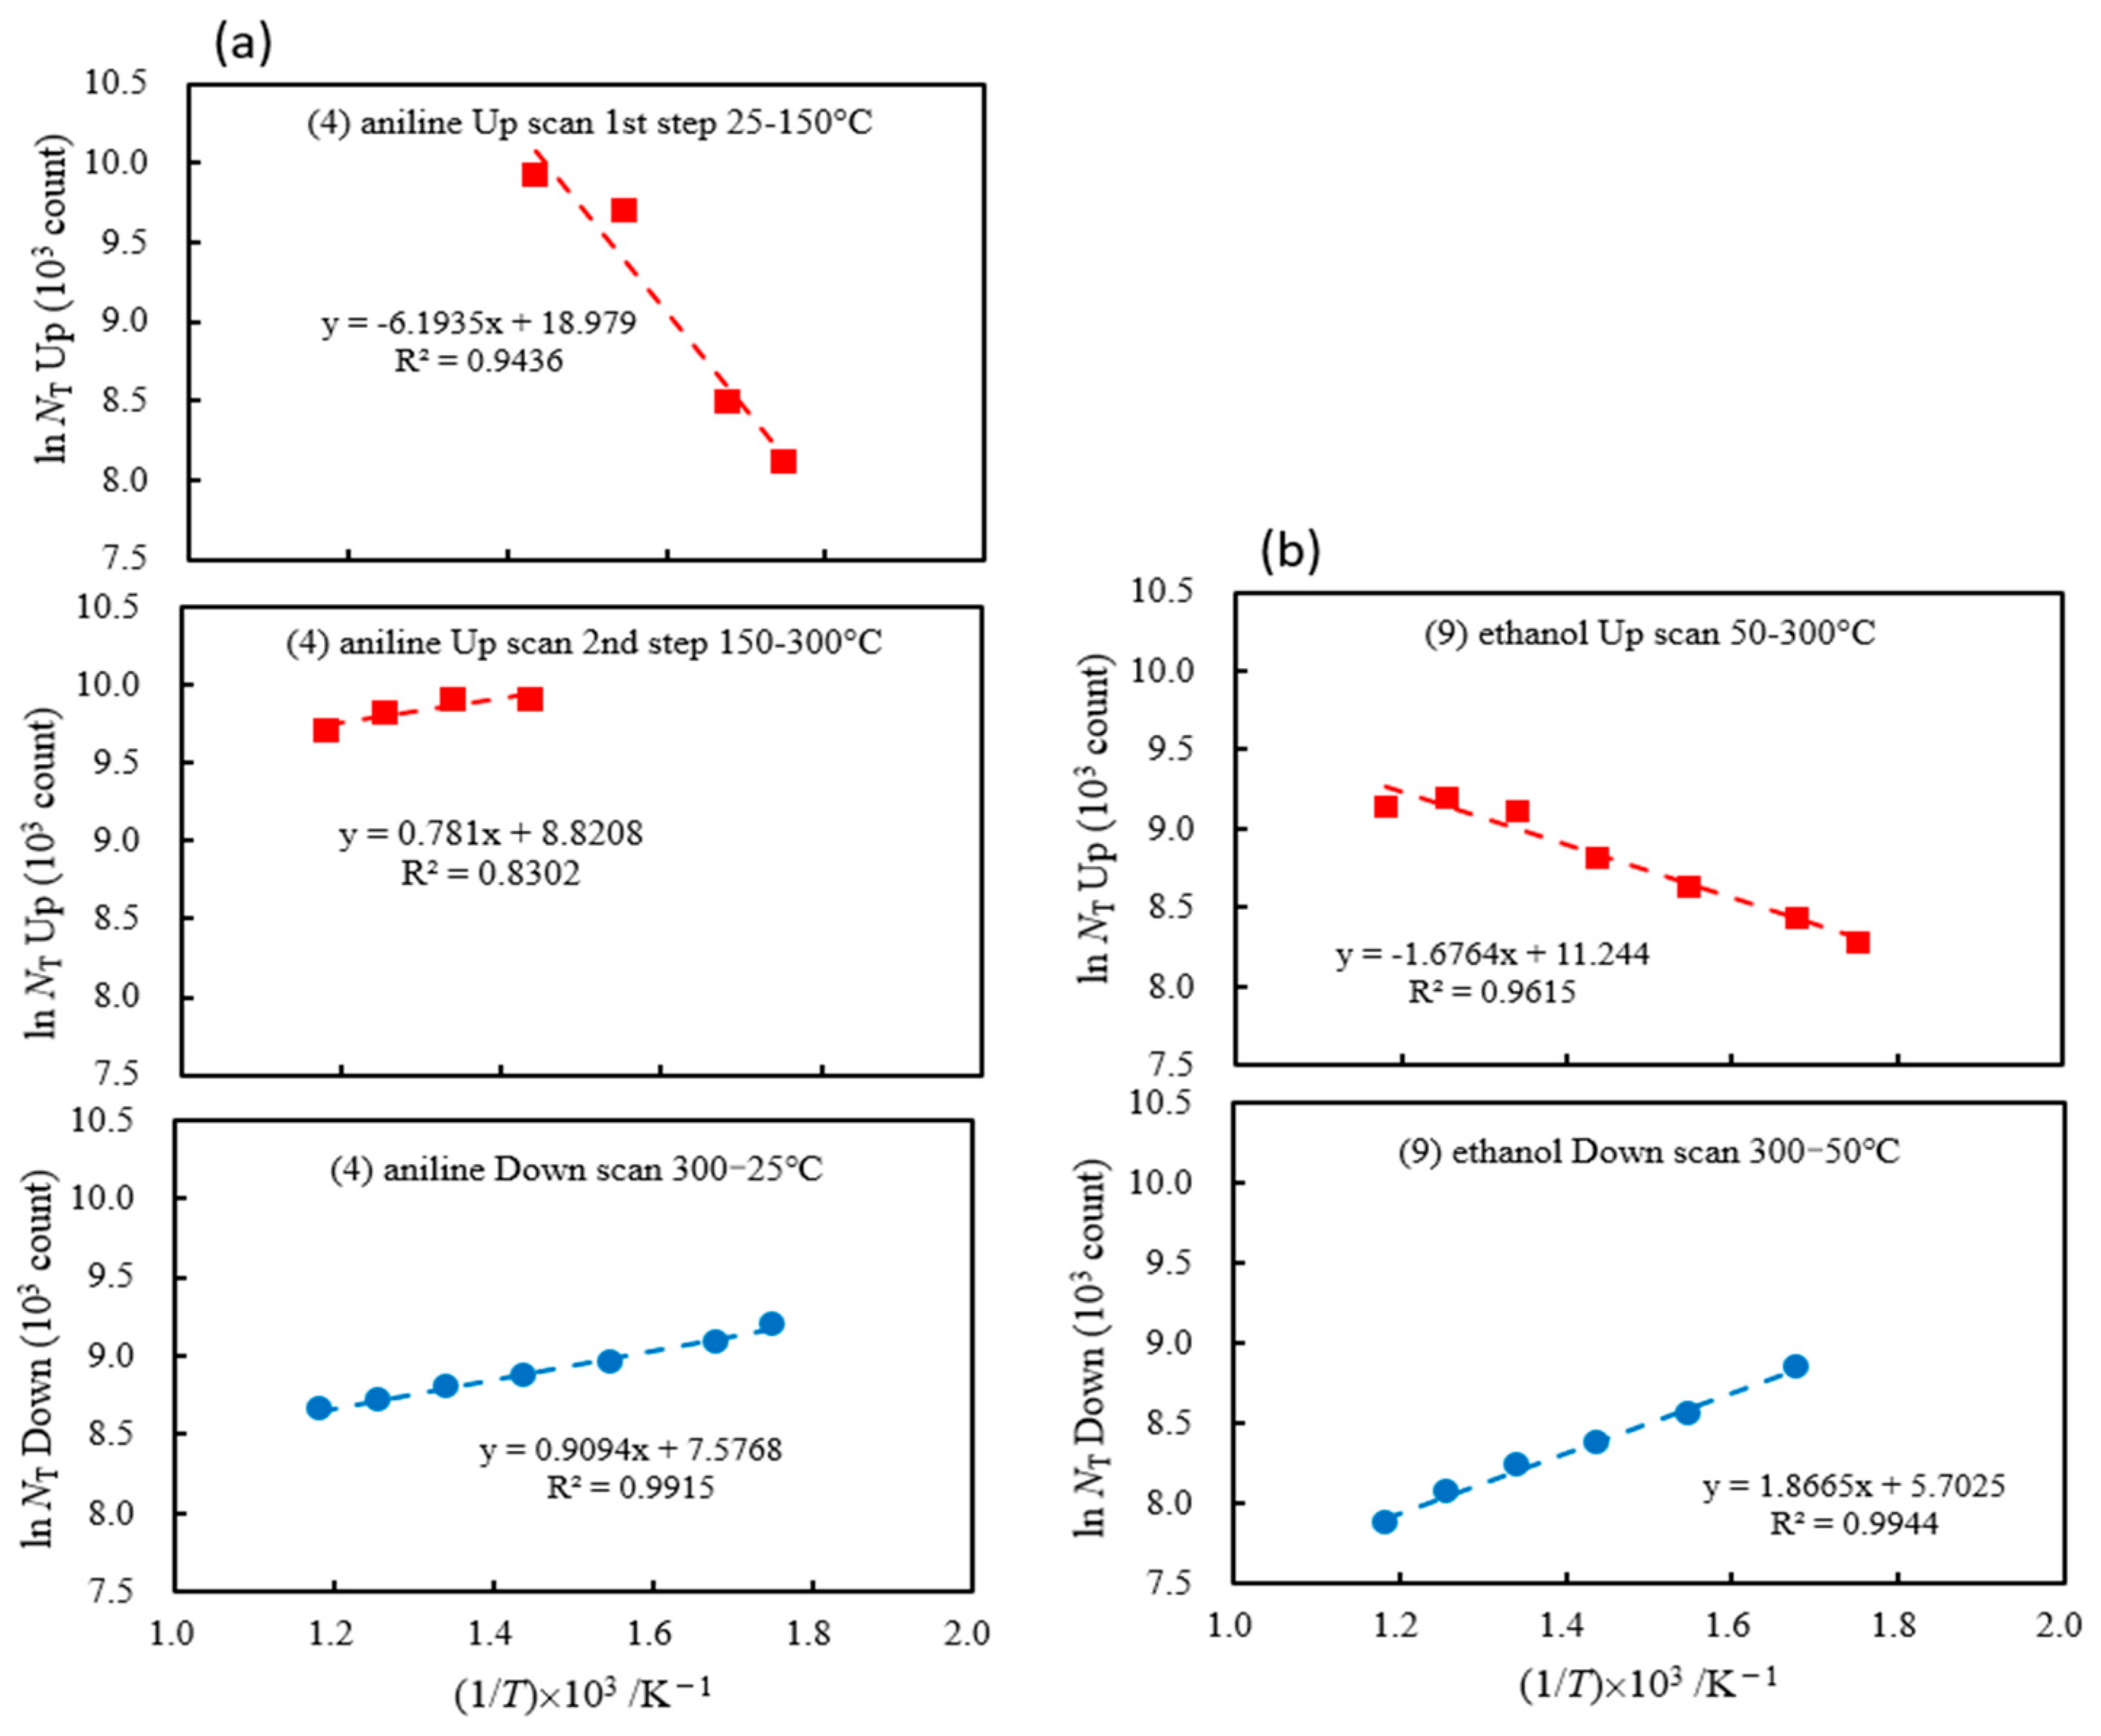
Figure 6 shows the Arrhenius plots (ln
NT,M vs. 1/
T) during heating (squares, shown in red) and cooling (circles, shown in blue) for environments (4) and (9).
Figure S3 shows the plots for the environments (1)–(3) and (5)–(8). For environments (1) and (3), and (5)–(8), the heating plots can clearly be divided into two stages (first and second steps) as the temperature rises. In contrast, environments (2) and (9) exhibit only a single stage during heating. During cooling, however, environments (1)–(9) all display consistent linear relationships over the temperature range. The bifurcation of the heating plots into two steps corresponds to the appearance of broad
NT,Mmax peaks in the TPPE plots (
Figure 5). These thermal characteristics are detailed in
Table S2.
3.4. XPS Spectra and O 1s Curve Resolution
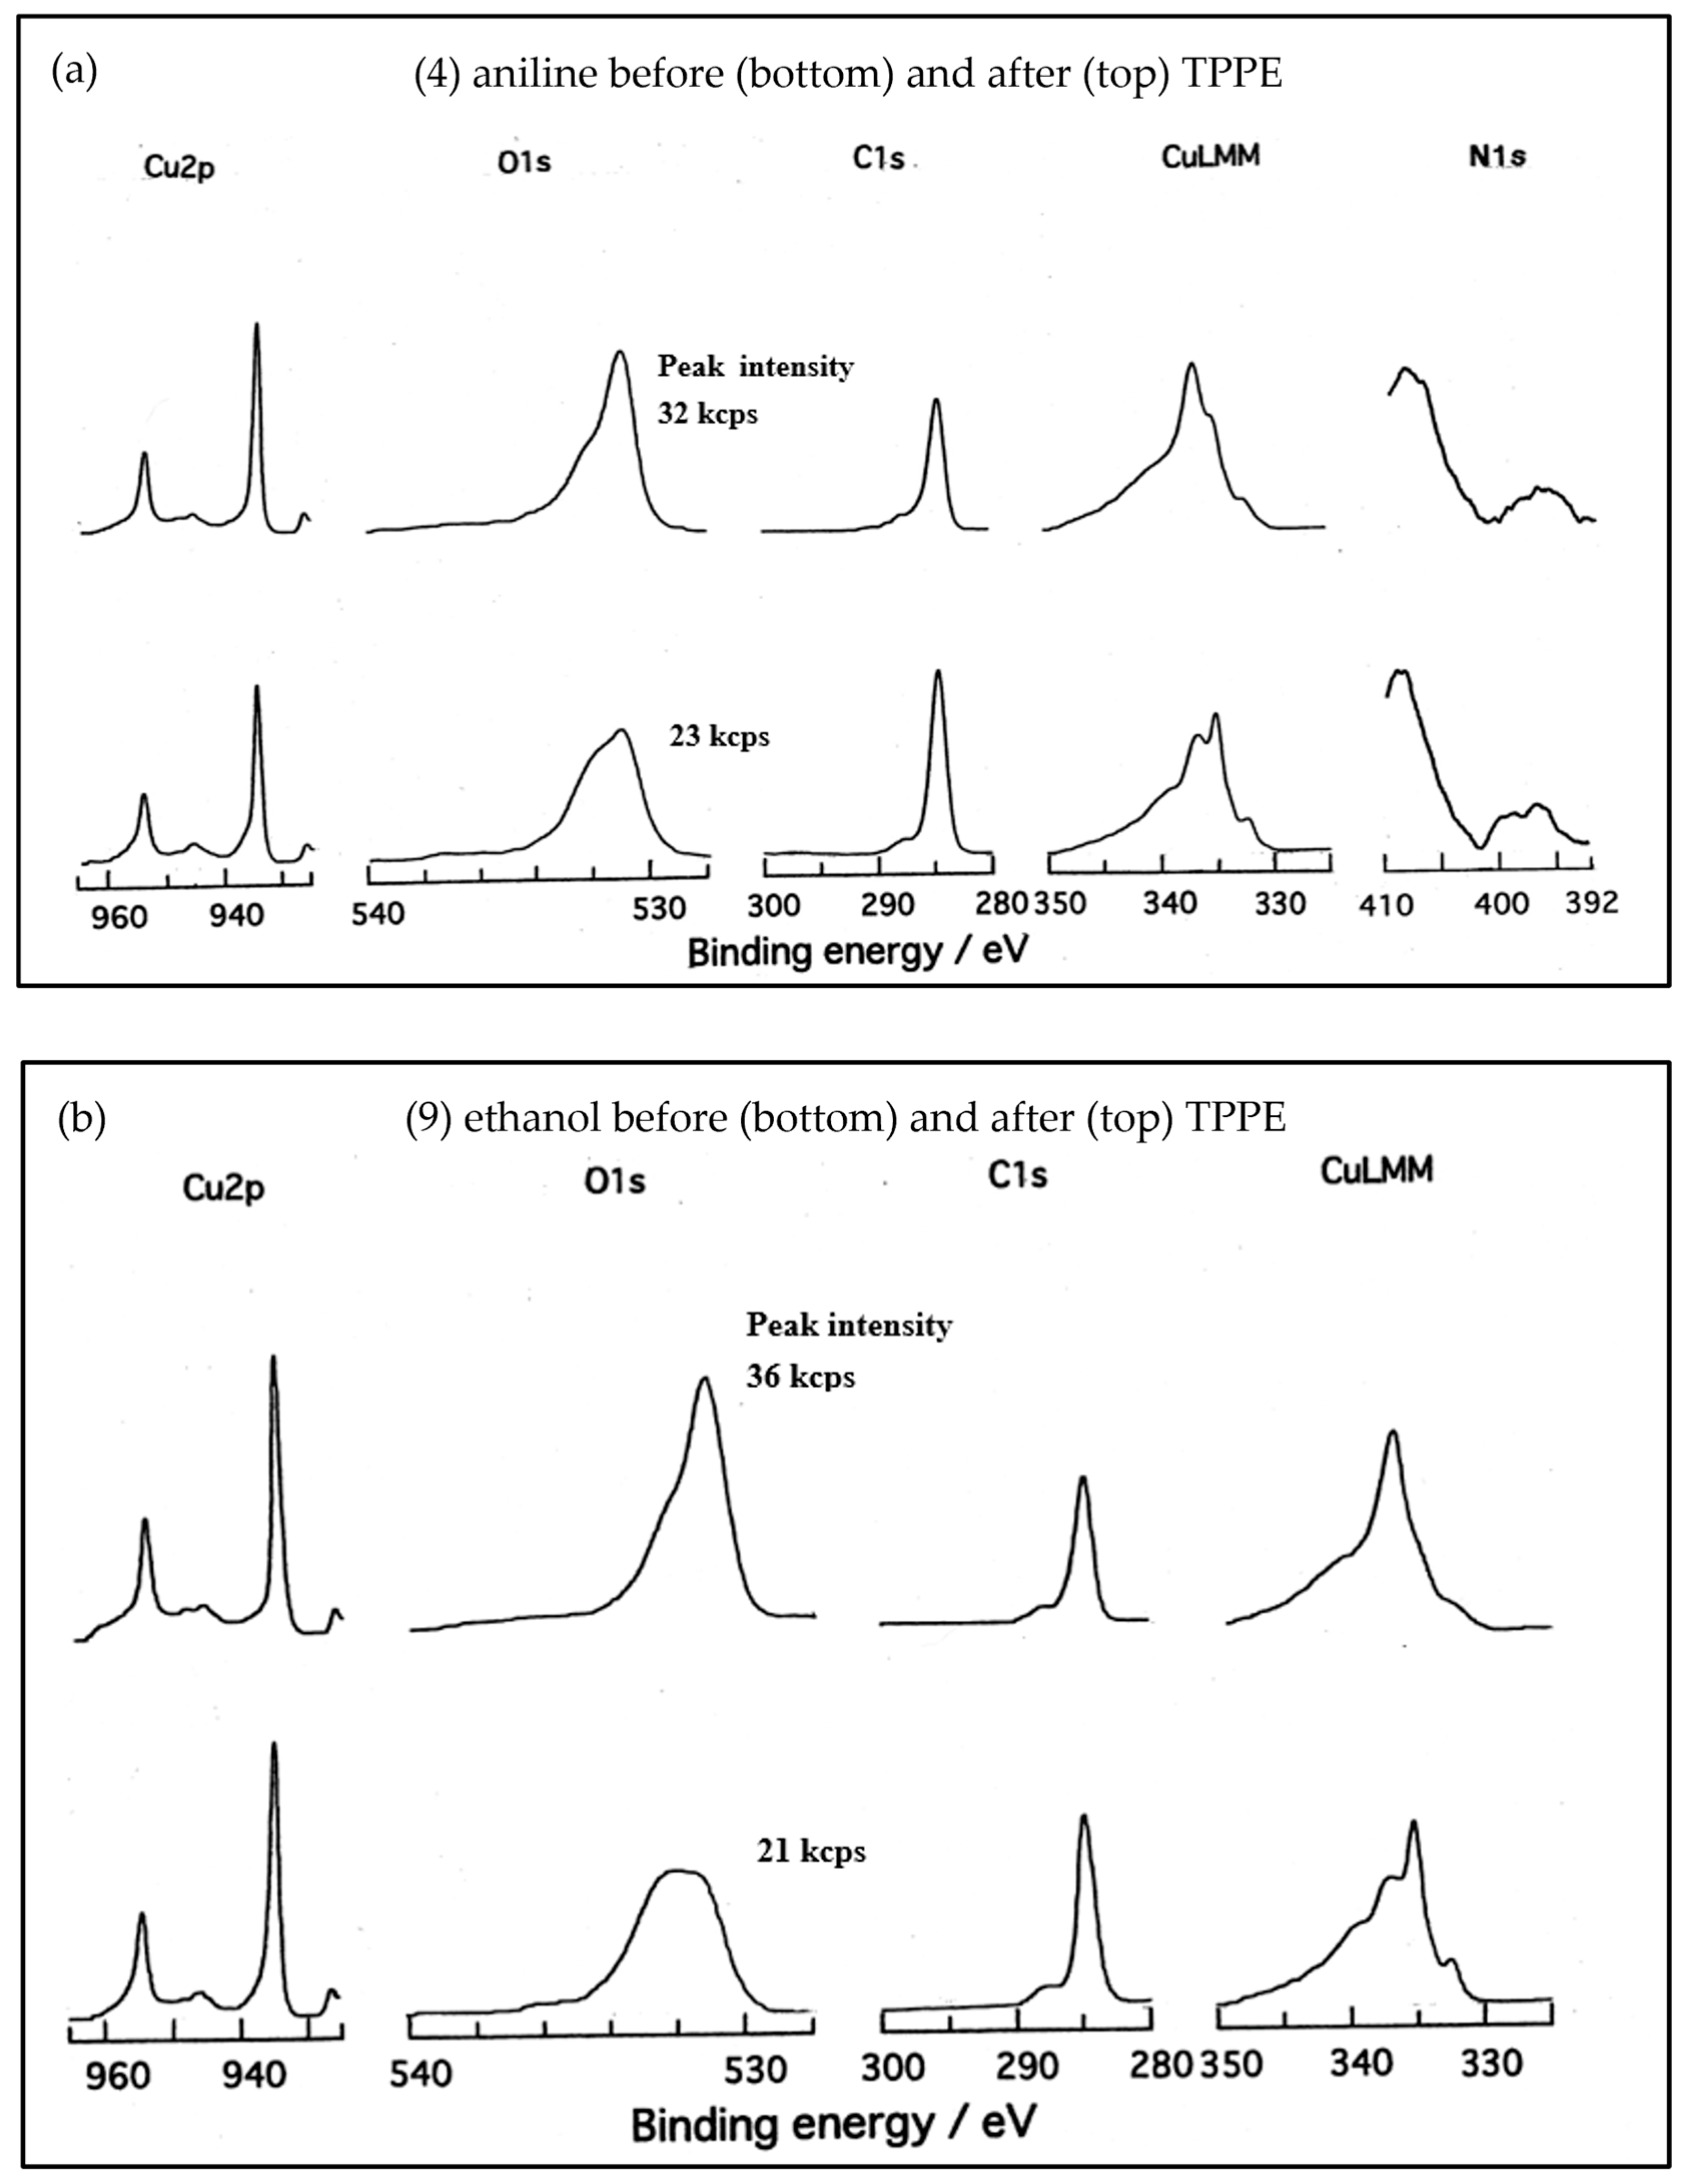
XPS spectra recorded before and after TPPE measurements are shown in
Figure S4 for environments (2), (3), (5), (6), (7), and (8) and in
Figure 7 for environments (4) and (9). Assignments for the copper and oxygen species are based on previous work [
54,
55,
56,
57,
58,
59,
60]. The binding energies for the oxidation states of copper are 932.5 eV (Cu
0 and Cu
+) and 933.5 eV (Cu
2+) for Cu 2p
3/2, and 335 eV (Cu
0) and 337 eV (Cu
+ and Cu
2+) for Cu
LMM. A characteristic shake-up satellite structure is observed 6–10 eV above the main Cu 2p peak in Cu
2+ compounds.
Regarding the O 1s region, the peak at 529.9 eV is assigned to lattice oxygen bonded to copper, and the peak at 532.5 eV is ascribed to adsorbed species, including OH, Cu(OH)
2, and H
2O [
58,
59]. Considering that the copper samples were exposed to air during transfer, these higher-binding-energy components are expected across all pretreated surfaces. According to a recent study [
60] on tarnished copper plates (C1220, Cu purity > 99.9%), the binding energies are 932.6 eV (Cu), 932.7 eV (Cu
2O), and 933.1 eV (CuO) for the Cu 2p peak; 943–948 eV (Cu
2O) and 940–945 eV (CuO) for the satellite peak; and 531.7 eV (Cu (OH)
2), 530.7 eV (Cu
2O), and 529.8 eV (CuO) for the O 1s peak.
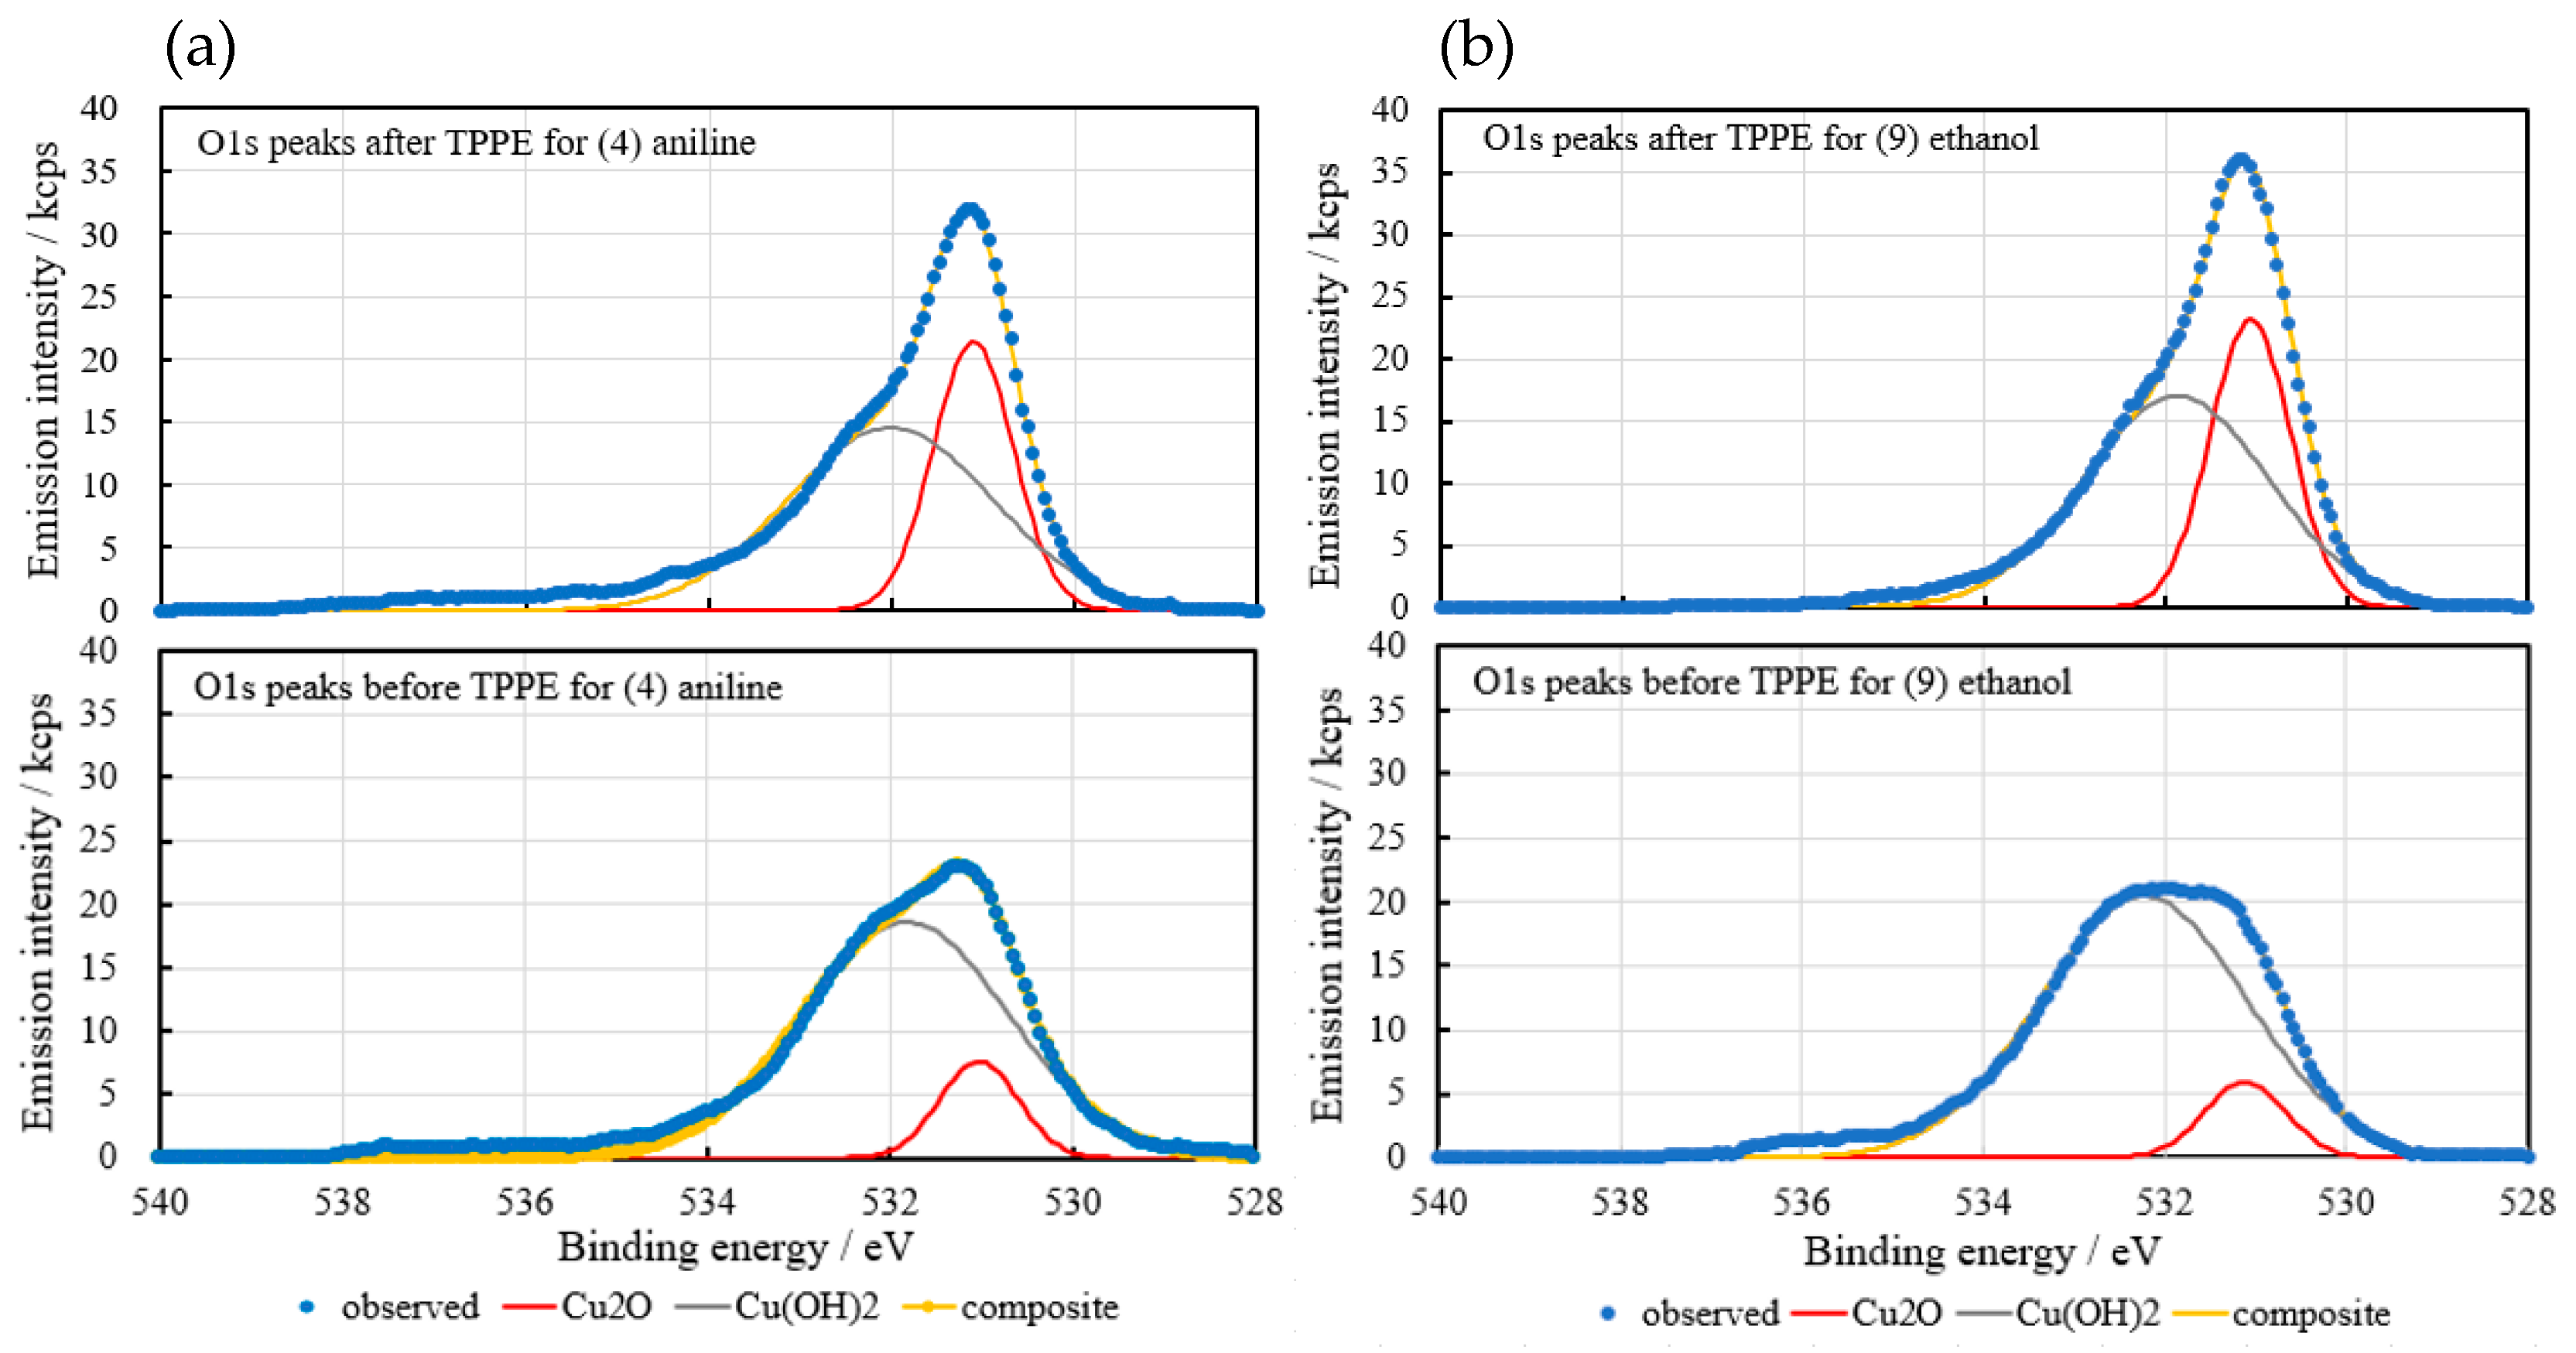
Detailed views of the O 1s spectra before and after TPPE are provided in
Figure S5 for environments (2), (3), (5), (6), (7), and (8) and in
Figure 8 for environments (4) and (9).
Table 2 quantifies the peak-height changes for both oxygen species in each environment.
The XPS spectra for each environment are summarized as follows:
(2) Acetone Cleaning. Before TPPE, the Cu
LMM spectrum shows peaks corresponding to both oxide Cu
2O (~337 eV) and metallic Cu (~335 eV) with weak intensities. The O 1s spectrum shows one distinct component, adsorbed oxygen (Cu (OH)
2) at ~532.5 eV. After TPPE, the metallic Cu peak decreases, whereas the Cu
2O peak increases. Correspondingly, the adsorbed oxygen signal diminishes, and the oxide oxygen (Cu
2O: 530.7 eV) becomes prominent. This change can be attributed to thermal oxidation, which correlates with the observed decrease in
NT,M beyond
Tmax,M (
Figure 5). After TPPE, the Cu 2p spectrum also shows the growth of peaks attributable to Cu
2O and CuO (~940–945 and ~934 eV, respectively). Moreover, high initial C 1s levels suggest that residual organic contamination is present after ultrasonic cleaning in acetone but decreases after TPPE.
(3) Ar Plasma Treatment. Before TPPE, the Cu
LMM spectrum exhibits both Cu
2O (~337 eV) and metallic Cu (~335 eV) features. The O 1s spectrum displays a mix of adsorbed oxygen (Cu(OH)
2: ~532 eV) and oxide oxygen (Cu
2O: ~531 eV). After TPPE, the metallic Cu peak in the Cu
LMM spectrum decreases, while the Cu
2O peak increases. Simultaneously, the adsorbed oxygen component in the O 1s spectrum diminishes, and the oxide oxygen component becomes more prominent. Although this change is due to an increase in temperature during TPPE measurement, the decrease in
NT,M beyond 50 °C (
Figure 5) is a distinctive feature of samples subjected to Ar plasma after ultrasonic cleaning. The Cu 2p spectrum also shows peaks attributable to Cu
2O (~940–945 eV) and CuO (~934 eV) before and after TPPE. The C 1s spectrum remains largely unchanged before and after TPPE, indicating minimal organic contamination.
(4) Aniline Adsorption. Metallic Cu remains observable even after TPPE, suggesting that the surface oxide overlayer is relatively thin. Before TPPE, the O 1s spectrum shows both adsorbed and oxide oxygen species, giving a slightly lower proportion of adsorbed oxygen than (8) hexane, (9) ethanol, and (7) toluene. Before TPPE, a distinct N 1s peak (~400 eV) from adsorbed aniline can be observed; after TPPE, the signal is reduced. The C 1s peak also decreases after TPPE, indicating aniline desorption.
(5) Cyclohexane and (6) Benzene Adsorption. Before TPPE, both environments show a significantly lower proportion of adsorbed oxygen than that observed for (8) hexane, (9) ethanol, and (7) toluene. After TPPE, surface oxidation is observed, and the C 1s peak slightly decreases, suggesting the desorption of organic molecules.
(7) Toluene Adsorption. Before TPPE, the adsorbed oxygen peak is higher than the oxide peak, and after TPPE, the oxide oxygen grows, similar to that for (4) aniline, (8) hexane, and (9) ethanol. CuLMM spectra confirm surface oxidation after TPPE, although metallic Cu remains slightly, and the C 1s peak decreases, indicating toluene desorption.
(8) Hexane and (9) Ethanol Adsorption. These environments exhibit higher intensities for adsorbed oxygen relative to oxide oxygen, similar to that of (7) toluene. This contrasts with the O 1s spectra observed for (5) cyclohexane, (6) benzene, and (4) aniline. In the case of ethanol, the CuLMM spectrum exhibits a relatively high metallic Cu peak before TPPE. After TPPE, both environments show characteristic surface oxidation and a decrease in C 1s levels, consistent with previous observations.
The O 1s spectra were deconvoluted into two primary components, adsorbed oxygen (Cu(OH)
2 and H
2O) and oxide oxygen (O
2− from Cu
2O), by fitting to Gaussian functions using the non-linear least-squares method in Microsoft Excel Solver, as previously described [
61]. These two primary components were selected for deconvolution because in the XPS O 1s measurement, a distinct, molecular H
2O component at the highest binding energy could not be unambiguously distinguished across all samples due to peak broadening and spectral overlap. Therefore, to maintain analytical consistency across all datasets, this molecularly adsorbed water component was systematically incorporated into the broader higher-binding-energy envelope assigned to the adsorbed oxygen/hydroxyl species. Note that the formation of a Cu(I)-OH
ad−H
2O
ad complex is considered essential for lowering the energy barrier of water dissociation [
37].
Figure 8 and
Figure S5 show the observed O 1s spectra alongside the curve-resolved components for environments (2)–(9) before and after TPPE. The averaged binding energies and peak heights for these components are listed in
Table 2.
On average, the O 1s peak of adsorbed oxygen (Cu(OH)
2) was located at 532.1 eV with a height of 50.6 before TPPE, shifting to 531.9 eV and 37.4 after TPPE, respectively. Conversely, the oxide oxygen (Cu
2O) peak shifted from 530.9 eV (height: 8.2) before TPPE to 531.0 eV (height: 21.5) after TPPE. These shifts confirm that TPPE, specifically the heating cycle, promotes the transformation of surface hydroxyls into lattice oxides. This chemical transition is likely responsible for the broad
NT,M peaks observed in the up scans and the subsequent increase in
NT,M during the down scans (
Figure 5). The binding energies of Cu(OH)
2 and Cu
2O remained relatively constant around the averages before and after TPPE.
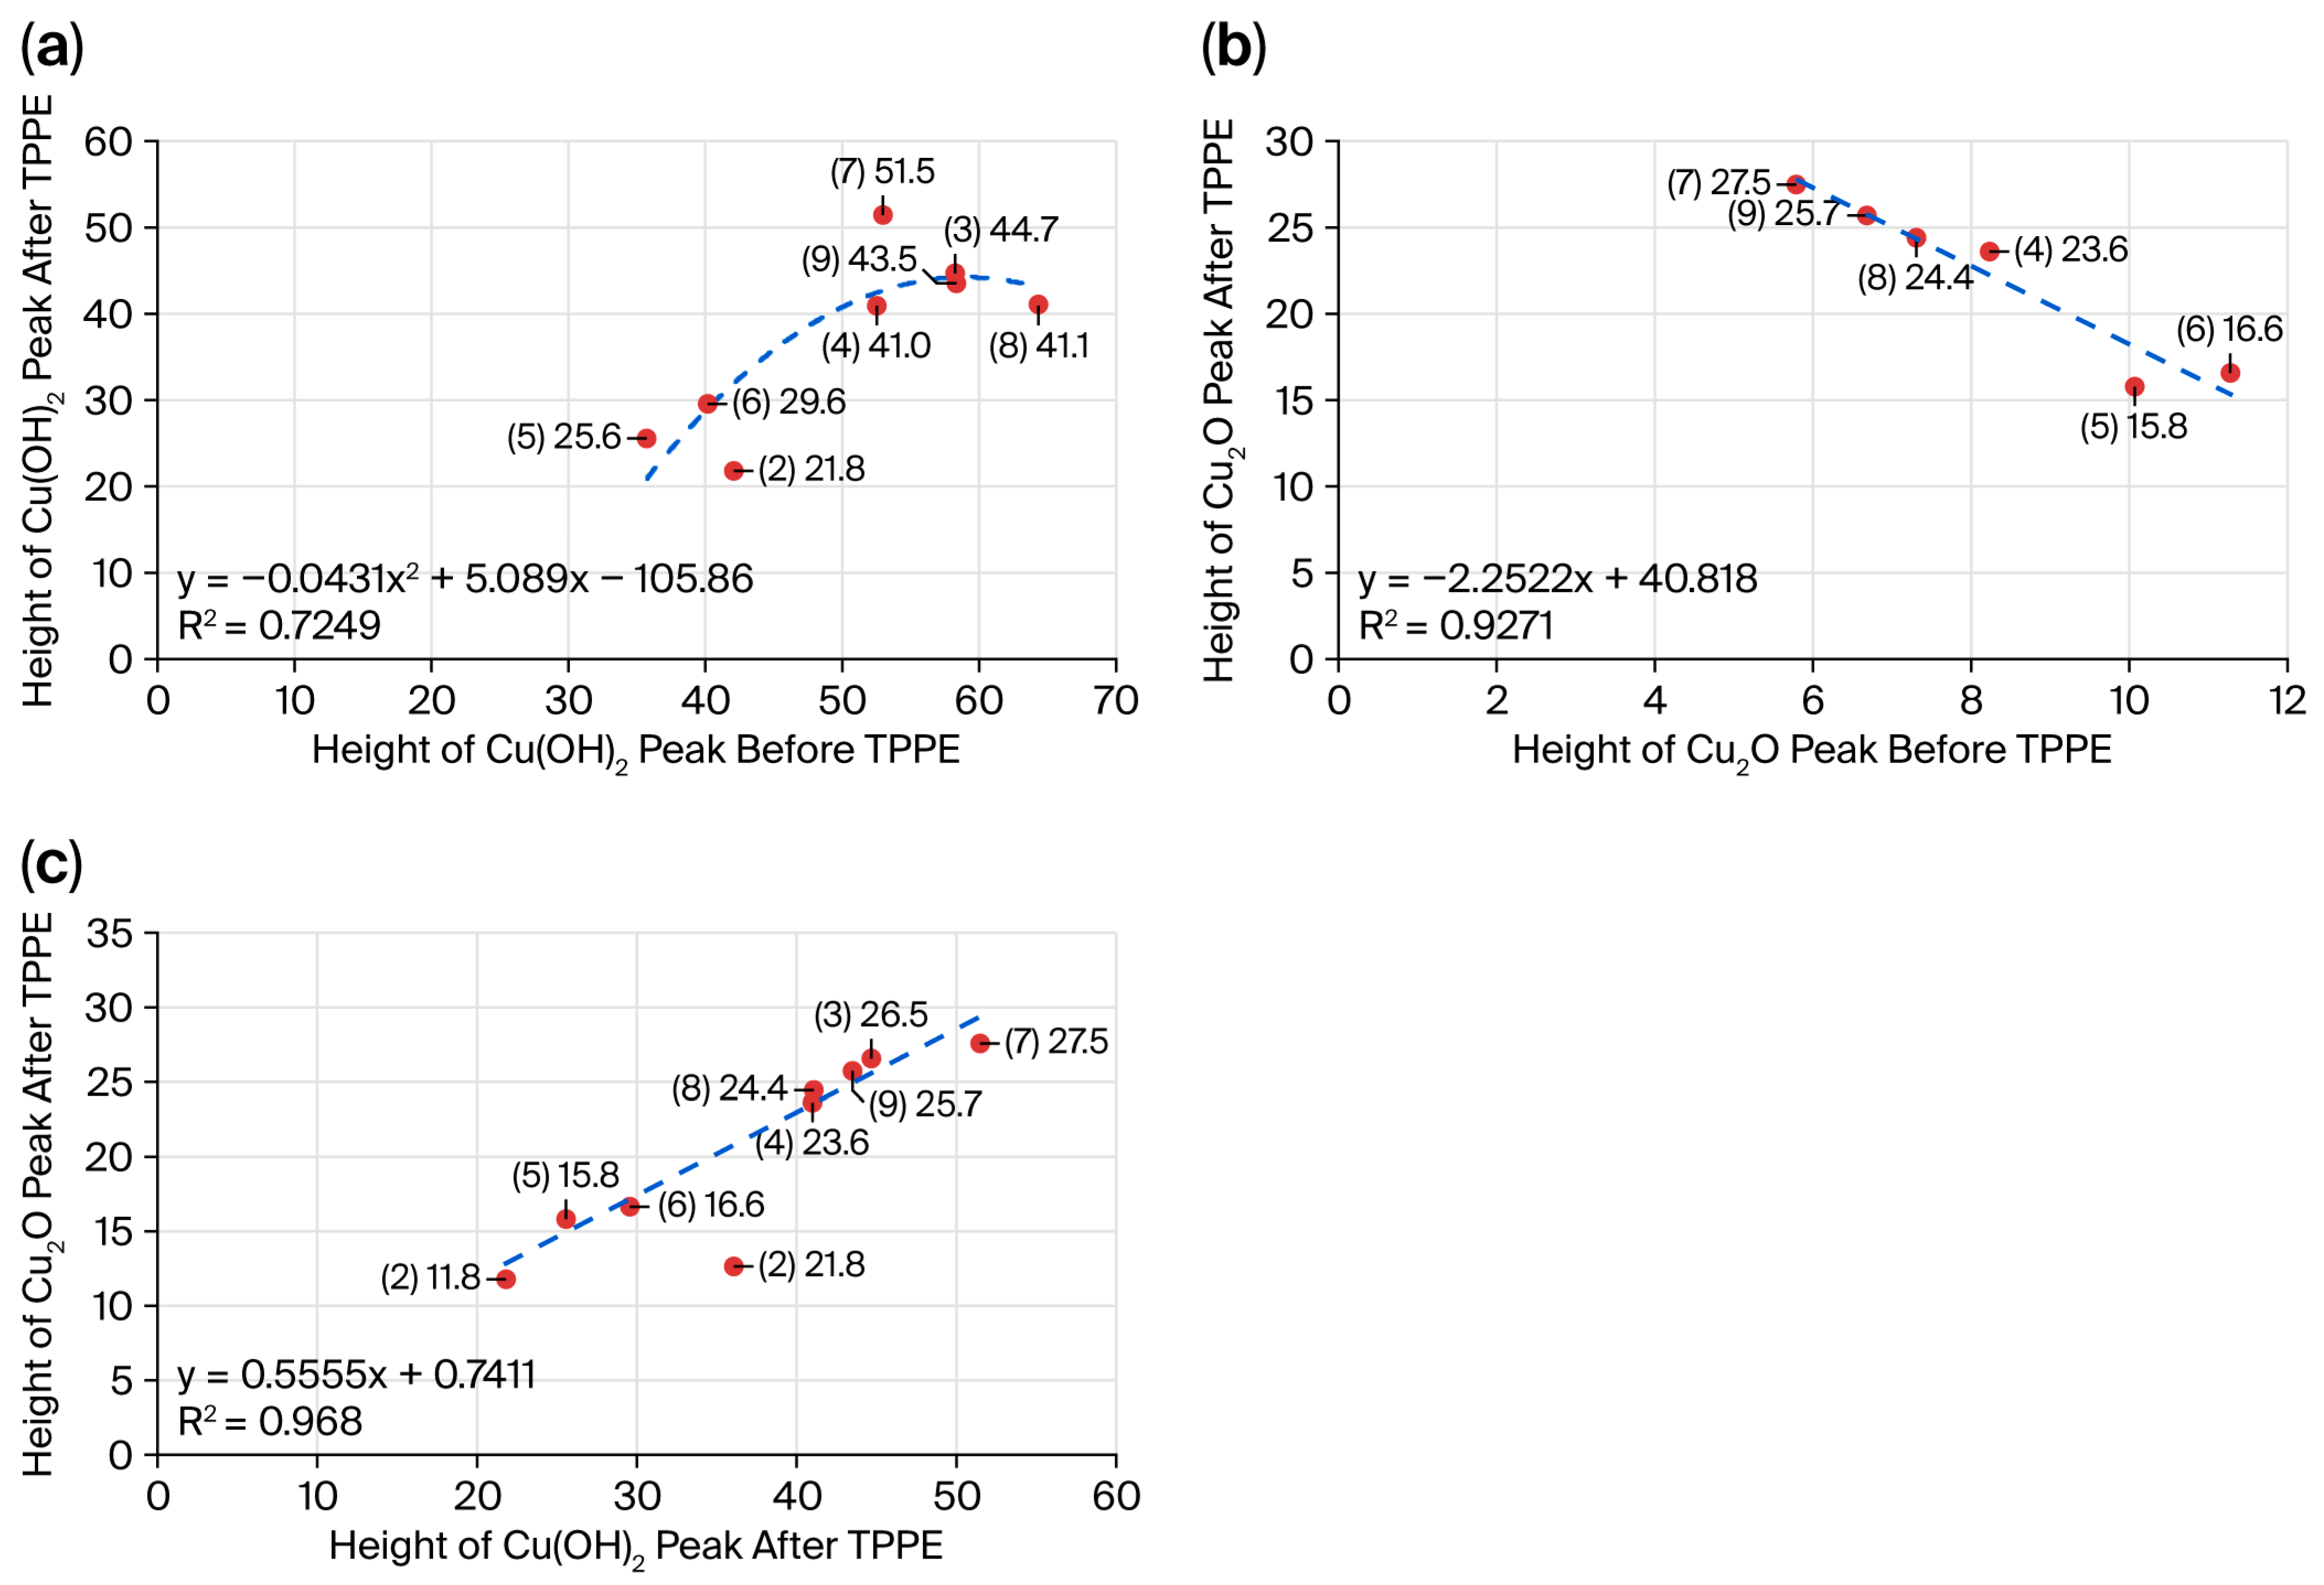
In our previous report [
2], it was unclear why this transition leads to an increase in PE intensity. Herein, to explore environment-specific effects, we examined the relative peak heights of Cu(OH)
2 and Cu
2O across environments (2)–(9), as shown in
Figure 9a–c.
Figure 9a shows that while the Cu(OH)
2 intensity generally decreases owing to the thermal desorption of H
2O and the growth of Cu
2O, a significant amount of adsorbed oxygen is still present or regenerated after TPPE.
Figure 9b reveals an inverse relationship; environments with lower initial Cu
2O levels exhibit a greater capacity for oxide growth during the measurement. Specifically,
Figure 9c shows that (7) toluene and (9) ethanol have a higher ability to enhance both Cu
2O and Cu(OH)
2 than (2) acetone, (5) cyclohexane, and (6) benzene.
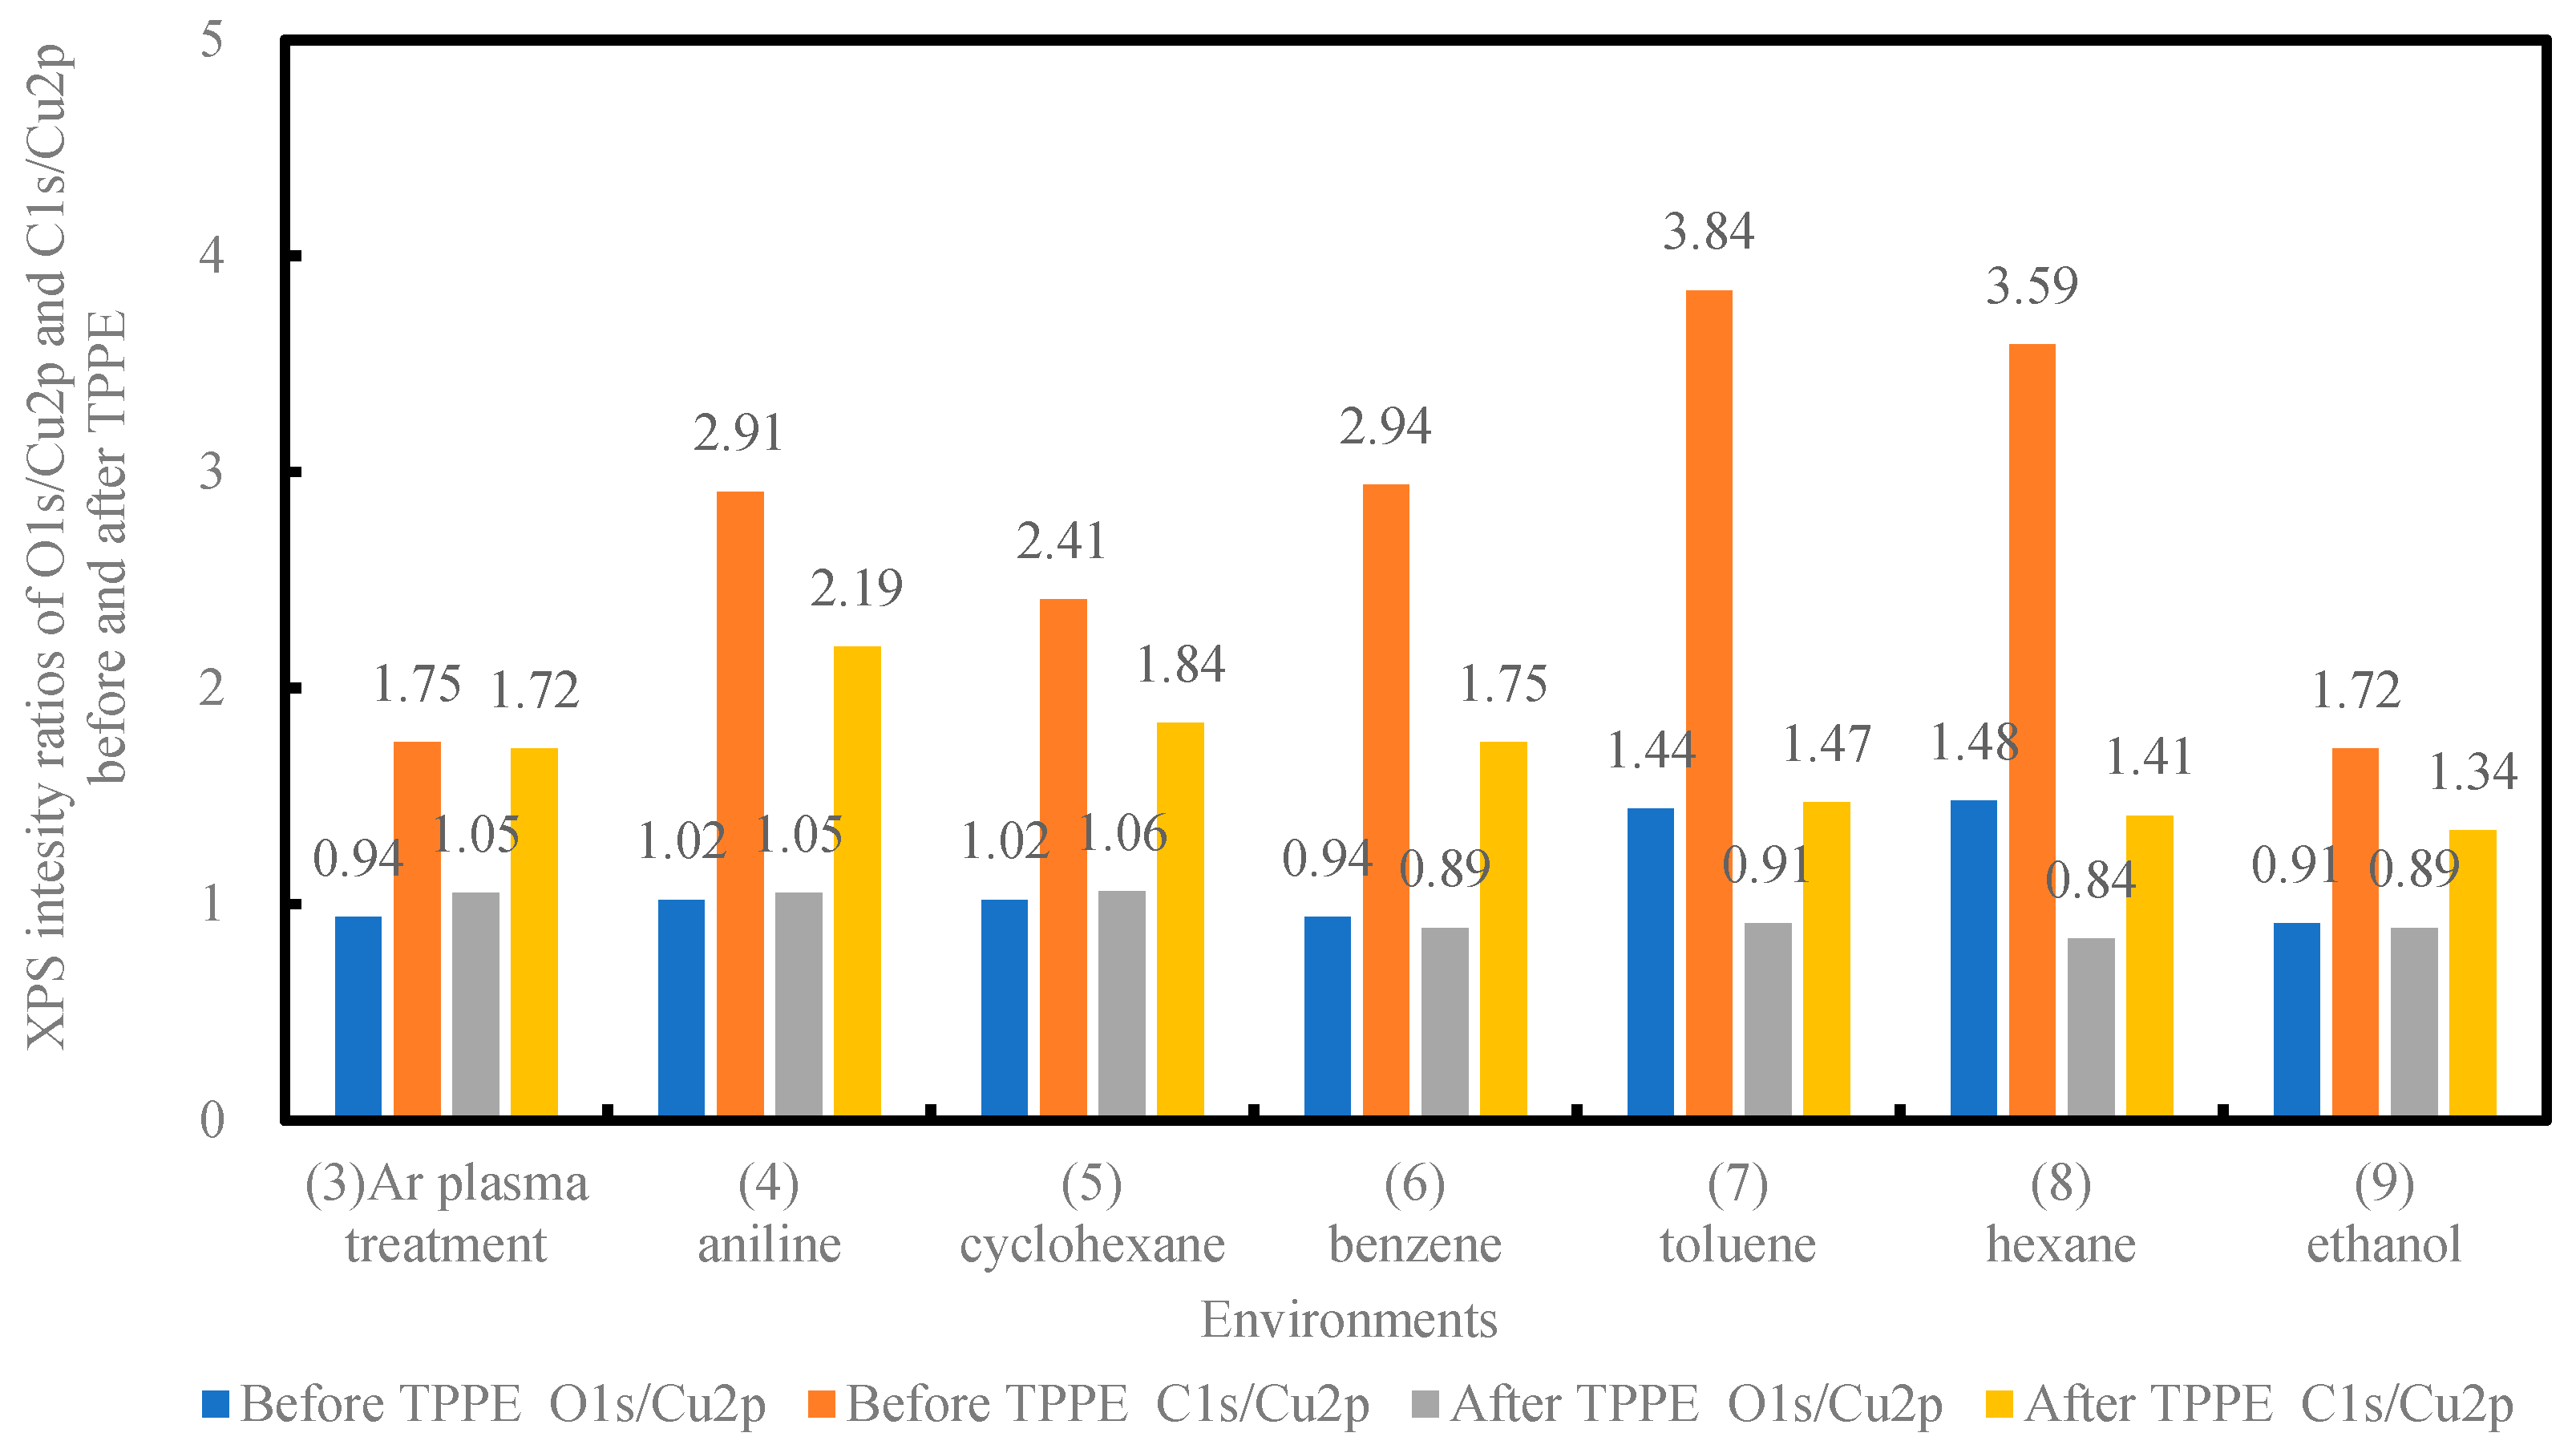
Finally, the surface compositions were analyzed via the O 1s/Cu 2p and C 1s/Cu 2p ratios before and after TPPE measurement for environments (3)–(9) (
Figure 10). Before TPPE, the C 1s/Cu 2p ratios are significantly higher in the organic environments than in (3) Ar plasma treatment, likely due to the high surface energy and activation after plasma exposure [
1]. After TPPE, the C 1s/Cu 2p ratios sharply decrease across all environments. This is attributed to the thermal desorption of adsorbed organic molecules, hydroxyl groups, and water, particularly in the cases of (7) toluene and (8) hexane.
3.5. Chemical Properties of the Different Environments
To elucidate the dependence of the TPPE characteristics (
NT,M intensity and PE energy barrier) for the Cu(OH)
x/CuO/Cu
2O/Cu surface on the chemical properties of the environment, we analyzed the molecules of the solvents used in this study. Following Huheey’s classification [
62], the species and compounds are categorized according to the hard and soft acid–base theory. This study involves borderline (Cu
2+) and soft (Cu
+, metallic Cu) acids, as well as hard (H
2O, OH
−, O
2−, ROH), borderline (C
6H
5NH
2), and soft (C
6H
6) bases. According to Pearson [
63], hard acids preferentially bind to hard bases, and soft acids to soft bases. Furthermore, hard acid–base interactions are predominantly electrostatic, whereas soft acid–base interactions are predominantly covalent.
Table 3 lists the chemical properties—
IE [
64],
AN [
65], and
ε/
ε0 [
52].
Pearson’s absolute hardness (defined as η = (IE − EA)/2) measures a species’ resistance to charge transfer or changes in electron density. In this work, η is not computed because experimental EA values are unavailable; instead, the trend in hardness is discussed based on the experimental IE. The absolute hardness trend based on IE (largest to smallest) is water—hardest > ethanol > hexane > cyclohexane > acetone > benzene > toluene > aniline—softest. This trend matches HSAB expectations: water is very hard, aliphatic alcohols and alkanes are hard, and aromatic and nitrogen-containing molecules are softer. Hard solvents (water, ethanol, and hexane) interact differently than softer ones (cyclohexane, acetone, benzene, toluene, and hexane). In HSAB terms, hard solvents generally have larger η, whereas borderline solvents (aniline) and soft solvents exhibit intermediate to smaller η values. AN quantifies a solvent’s propensity to accept electrons (Lewis acidity). Solvents with high AN (water and ethanol) act as strong electron acceptors from the oxygen lone pair of surface hydroxyl groups, owing to hydrogen bonding and polarity. Acetone has moderate acceptor ability because of its carbonyl group, whereas cyclohexane, benzene, toluene, and hexane are nonpolar or aromatic, resulting in negligible electron acceptor behavior.
The reciprocal dielectric constant (1/(
ε/
ε0)) serves as an inverse index of solvent polarity and electron screening capacity.
Figure S6a–c illustrates the complex relationships among
IE,
AN, and 1/(
ε/
ε0). For the polar compounds, 1/(
ε/
ε0) decreases with
IE and
AN, and for nonpolar groups, 1/(
ε/
ε0) increases with
IE. As shown in
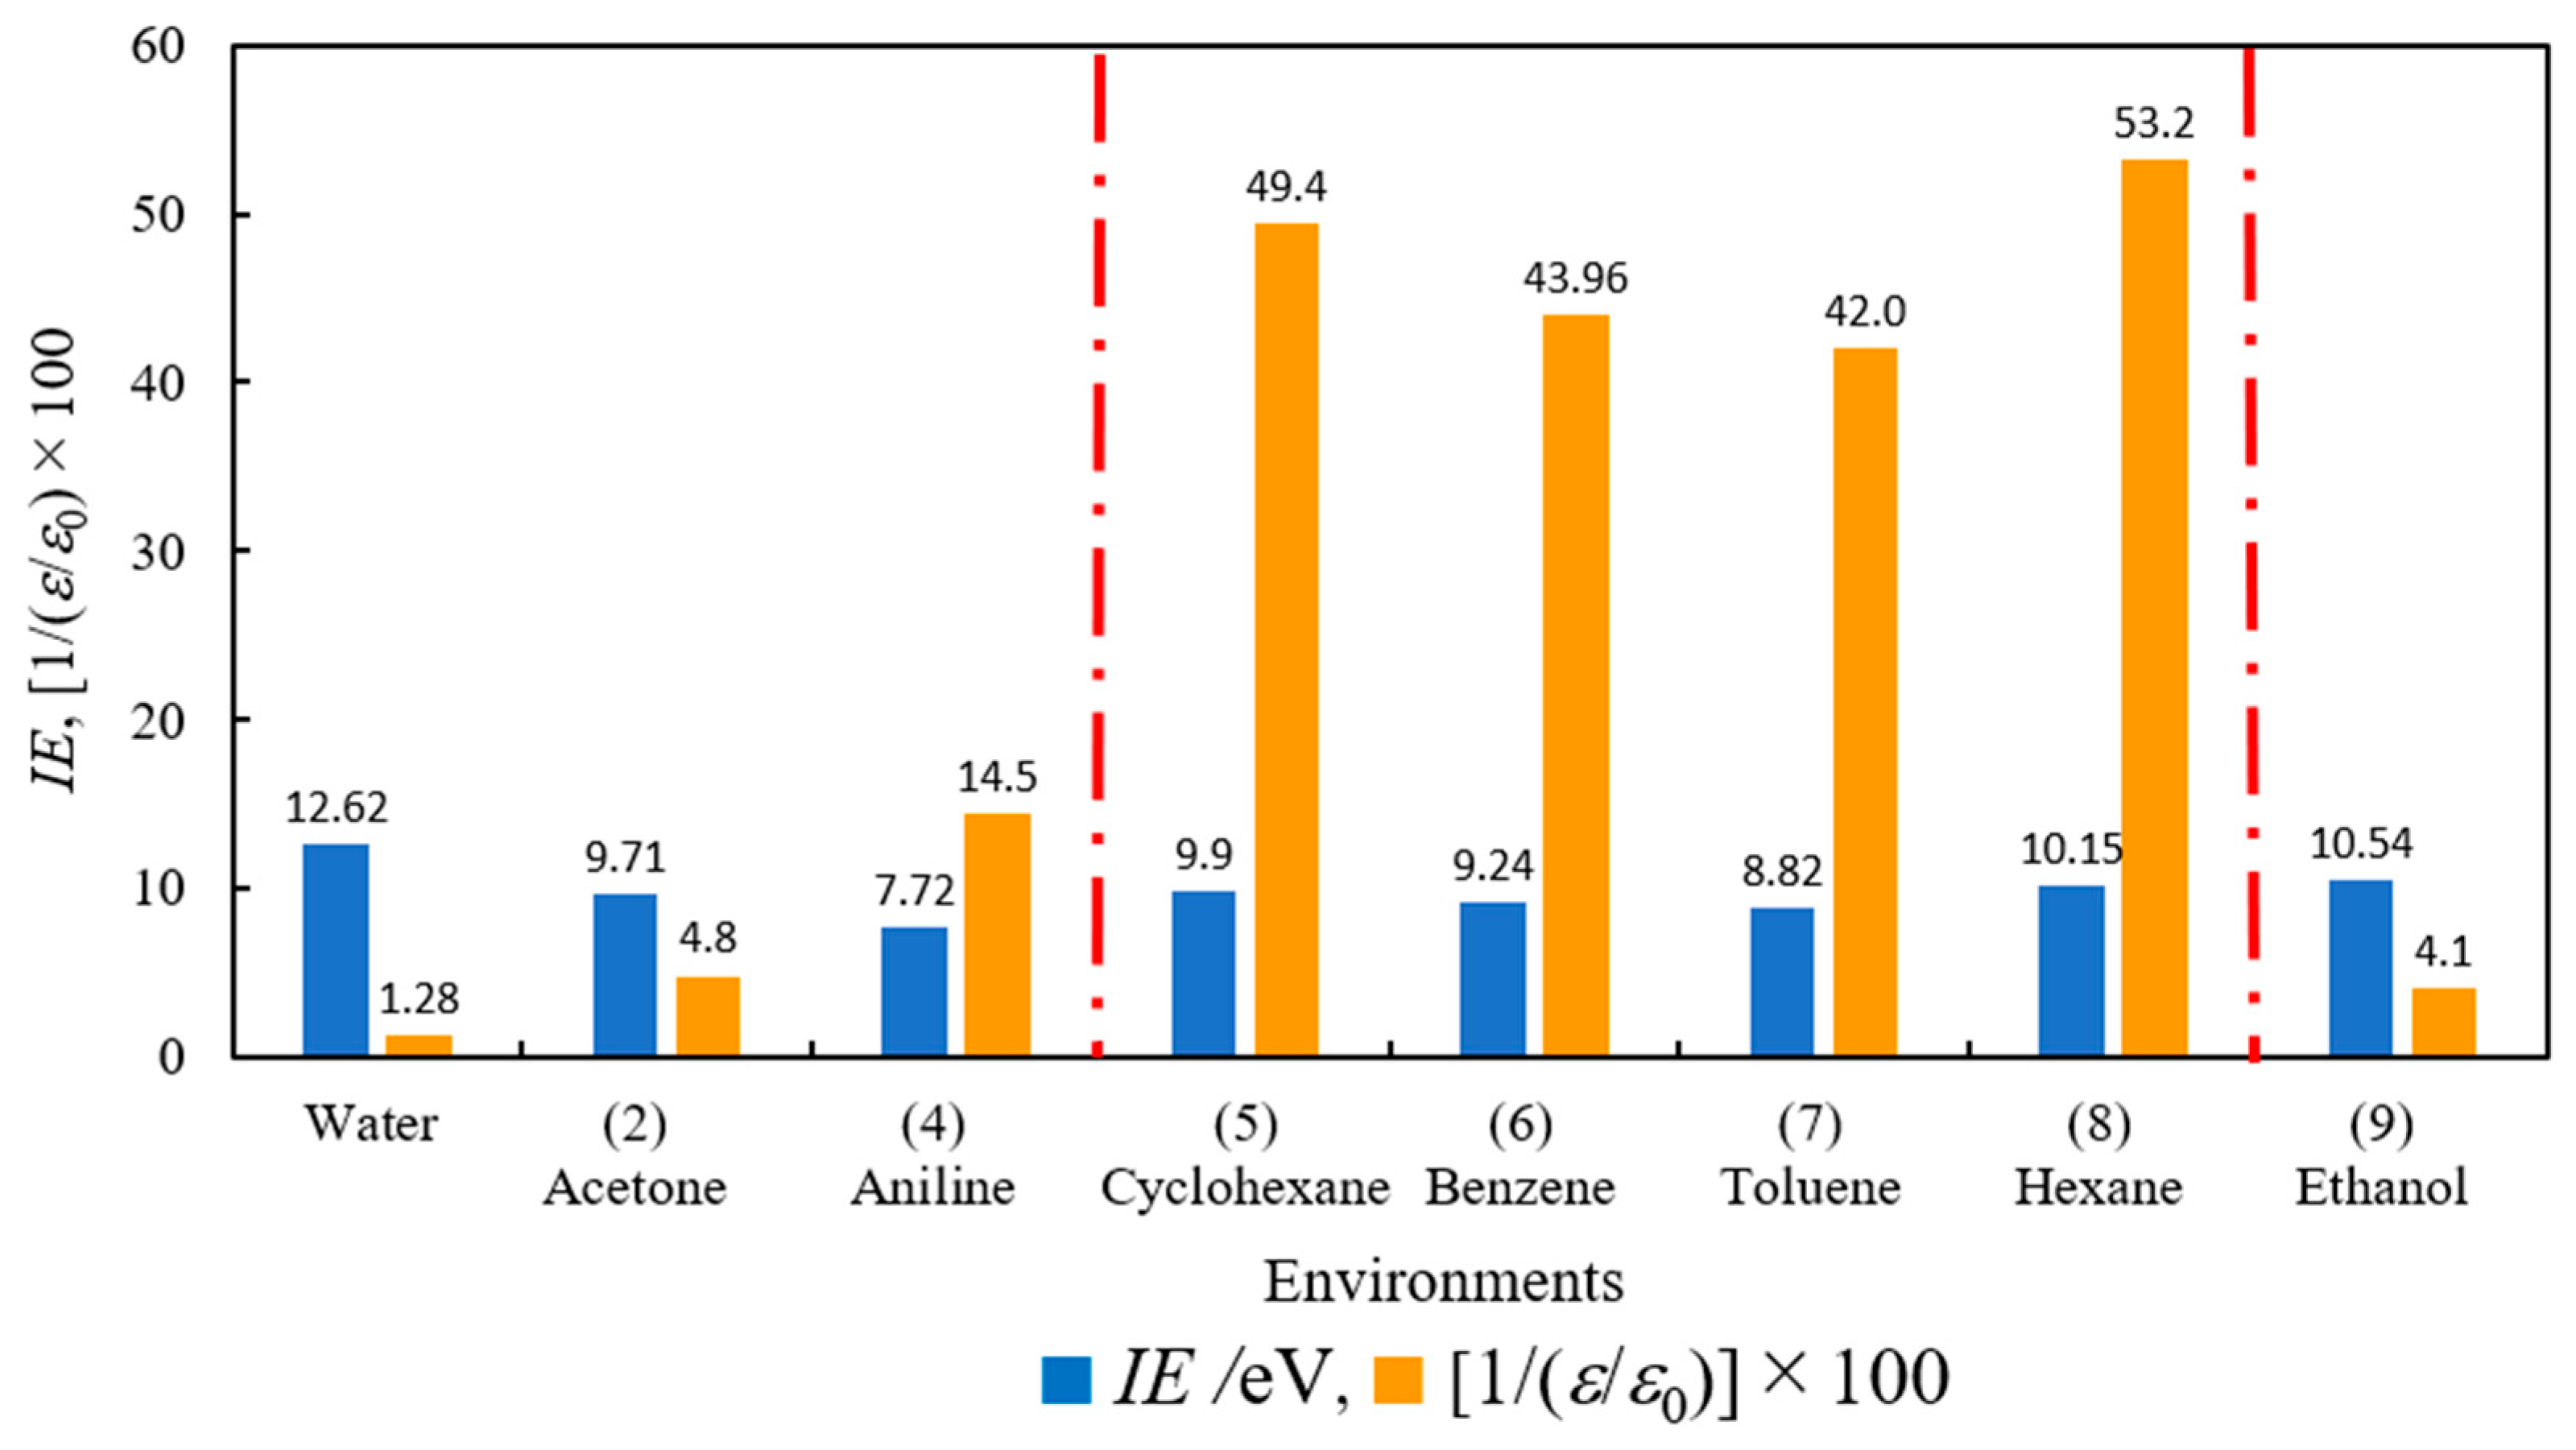
Figure 11, the solvents can be clearly separated into two groups: lower 1/(
ε/
ε0) with high polarity (water, ethanol, acetone, and aniline) and higher 1/(
ε/
ε0) with low polarity (hexane, cyclohexane, benzene, and toluene).
Generally, more polar solvents (high ε/ε0, low 1/(ε/ε0)) are expected to enhance surface polarization and screen charges more efficiently, thereby lowering the energy barrier for electron emission and increasing intensities or reducing photothresholds. Conversely, nonpolar solvents (low ε/ε0, high 1/(ε/ε0)) typically provide less charge screening, sometimes resulting in higher photothresholds or kinetic barriers. However, our TPPE data do not align with these standard predictions.
As previously reported [
2], the effects of
AN and 1/(
ε/
ε0) on the TPPE significantly vary depending on the initial state (treatment) of the metal surface (e.g., mechanically abraded vs. ultrasonically cleaned Cu surfaces). The Cu surfaces in the present experiment behave similarly to those in Sample C [
2], in which hard, high-
AN solvents (water, ethanol, and acetone) interact strongly with the thin oxide layer via hydrogen bonds and dipole interactions, thereby affecting the surface potential and PE. In contrast, soft, nonpolar solvents (cyclohexane, benzene, toluene, and hexane) primarily interact through van der Waals forces, inducing minimal changes in the surface properties.
To fully understand these variations and address the limitations of macroscopic descriptors, microscopic molecular properties—such as gas-phase molecular dipole moments, steric hindrance, and adsorption orientations—must be considered. While a bulk metric like the dielectric constant suggests a uniform electrostatic behavior within each group, the local surface dipole is ultimately dictated by the net orientation of the chemisorbed or physisorbed molecules on the Cu(OH)2/Cu2O matrix. For instance, aromatic bases such as benzene and toluene can adopt a flat or tilted orientation relative to the surface plane, depending on the presence of co-adsorbed species or surface defects. A flat alignment minimizes the normal component of the molecular dipole, offering localized charge screening without significantly decreasing the work function. Conversely, sterically unhindered aliphatic chains, such as hexane, interact strictly via weak, isotropic dispersion forces, creating a loose overlayer that fails to establish an ordered interfacial dipole array. This microscale disparity explains why macroscale dielectric correlations exhibit specific outliers: the geometry of the first adsorption monolayer alters the electron tunneling probability independently of the bulk solvent polarity. The detailed correlation between the TPPE characteristics and these chemical properties is discussed in the following section.
3.6. Correlation Analysis: TPPE Characteristics, Dielectric Constants, and Oxygen Species
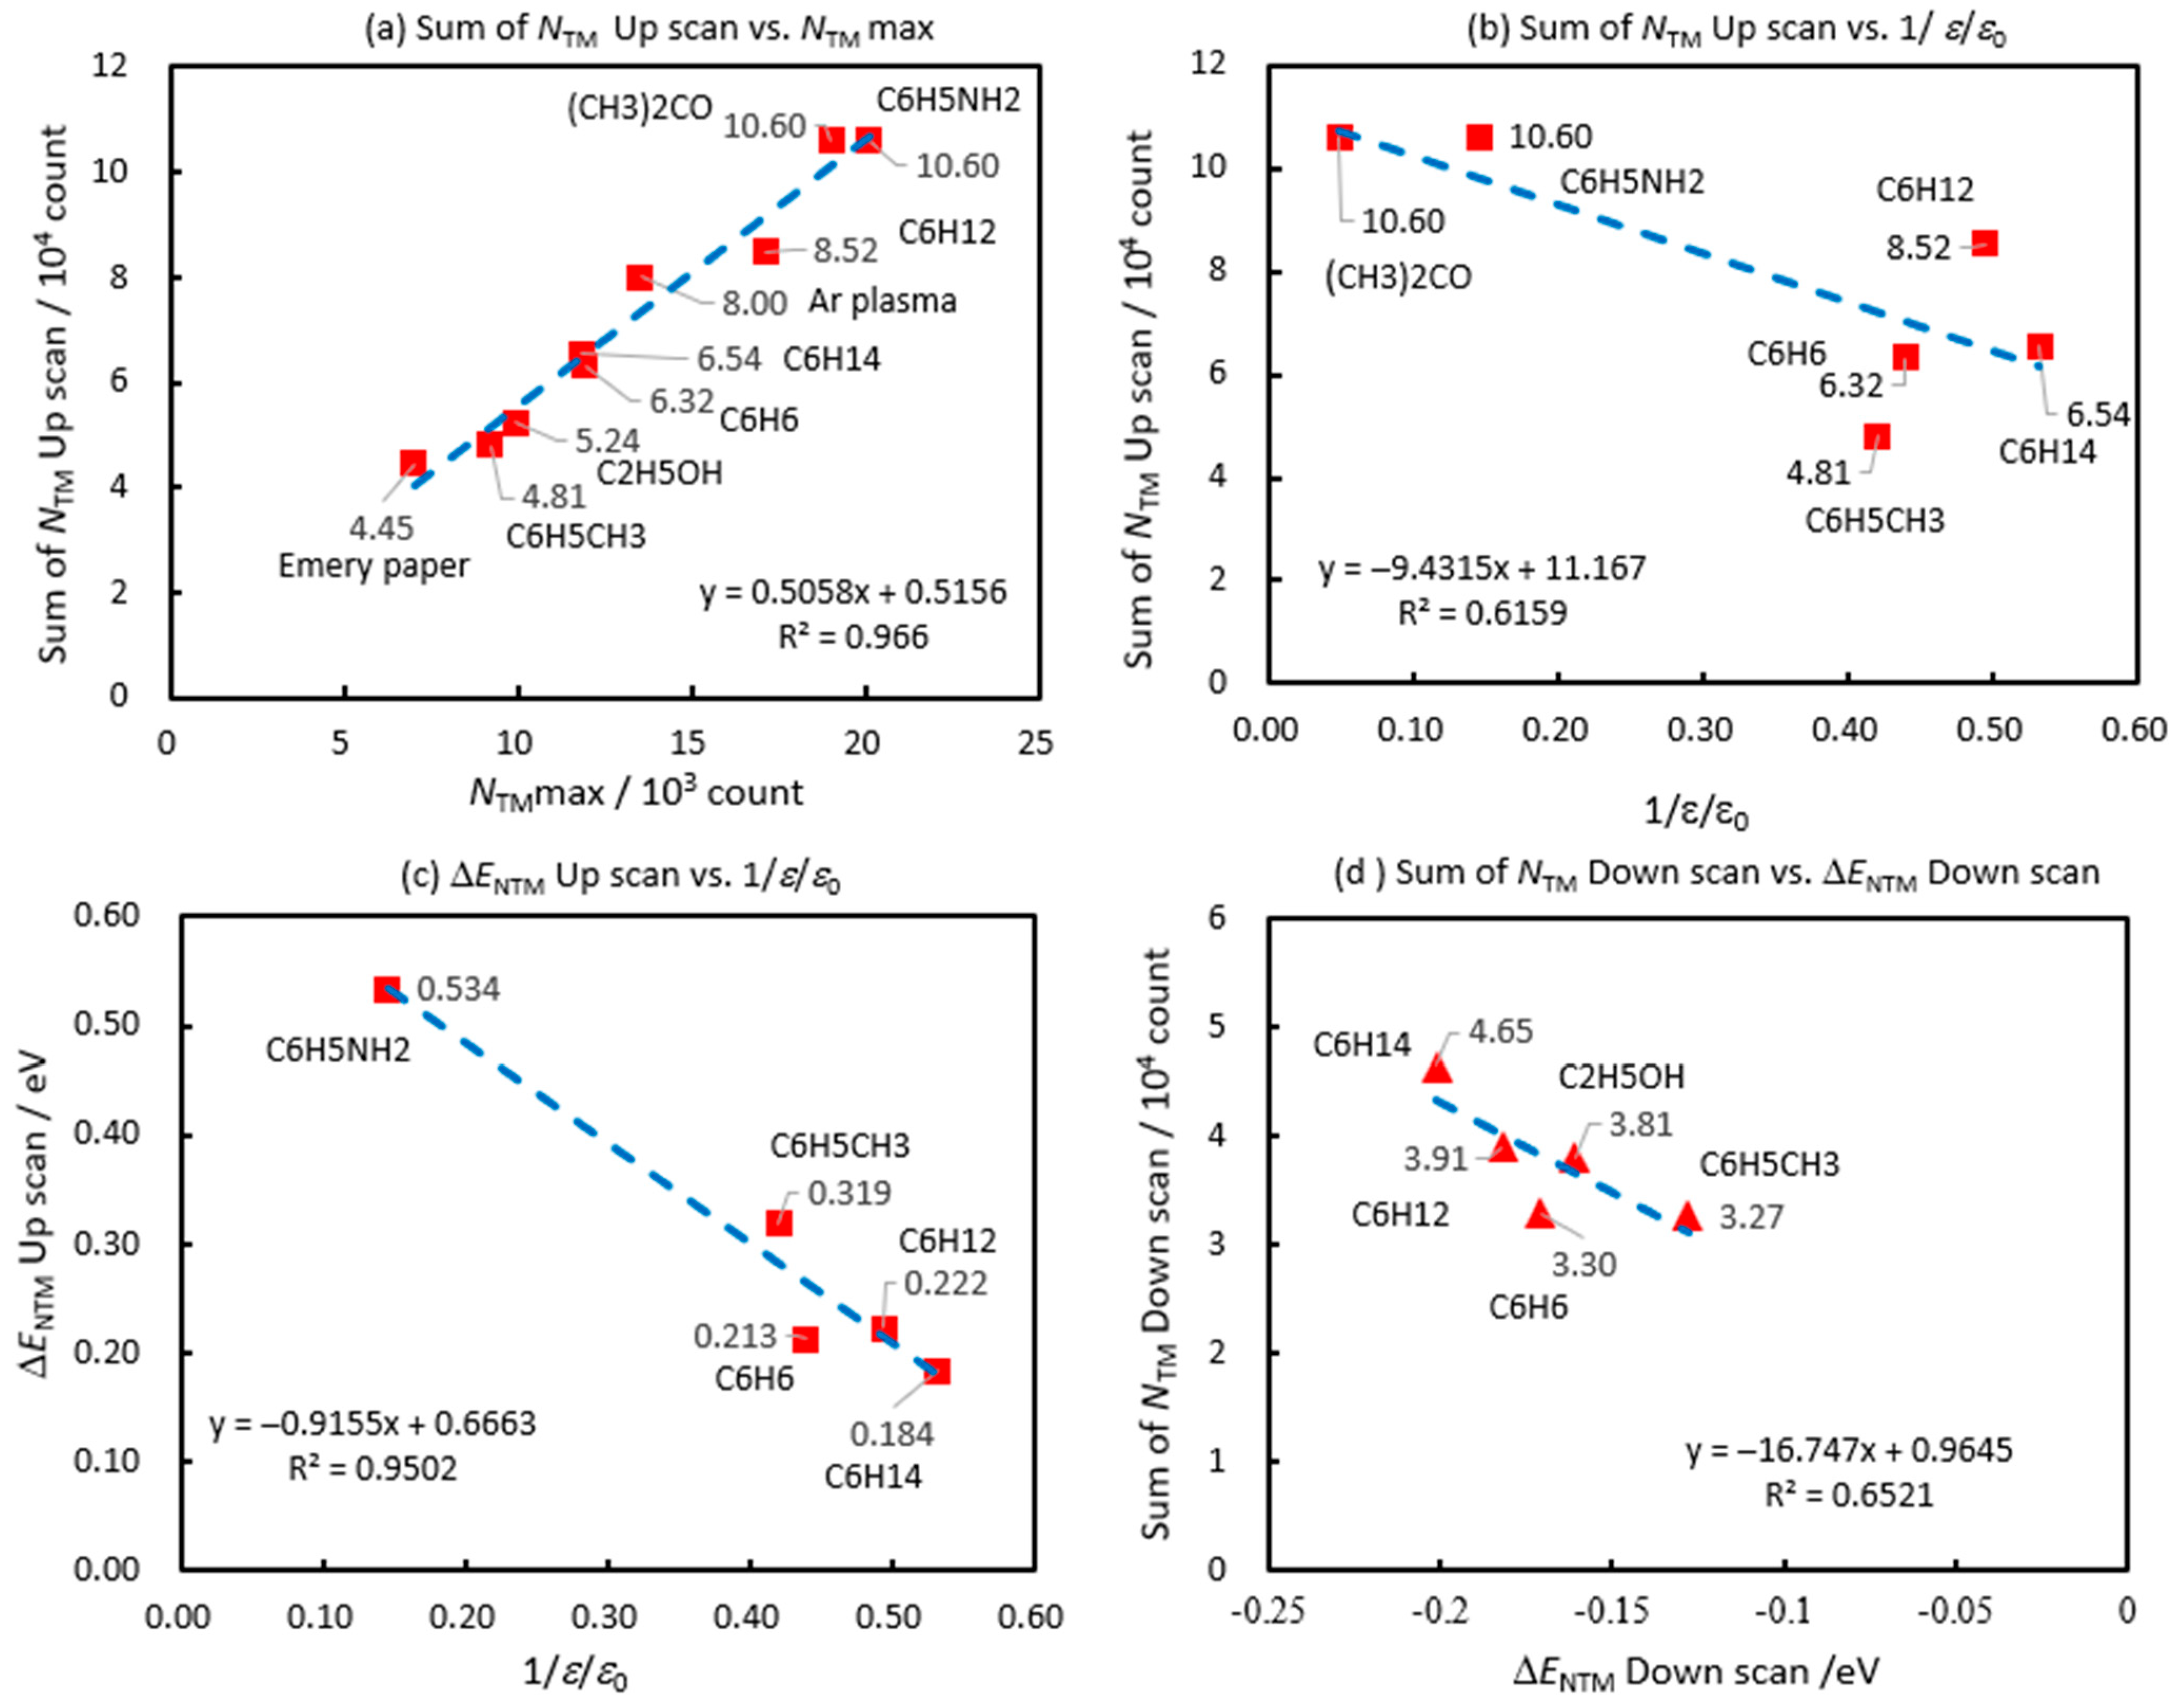
Figure 12a–d and
Figure S7e–l show the correlation between
NT,M and the energy barrier and pre-exponential factor obtained during heating and cooling, and further relates them to the dielectric constants of the solvents and the concentrations of surface oxygen species obtained from the Cu(OH)
2 and Cu
2O peak heights (
Table S2,
Table 2 and
Table 3). The nonpolar solvents (C
6H
14, C
6H
12, C
6H
6, and C
6H
5CH
3), which are distinguished by their values of
AN,
η, and 1/(
ε/
ε0), as shown in
Figure 11, are highlighted in yellow.
Total
NT,M vs.
NT,Mmax (Heating) (a). These values are greatly influenced by the solvent environment. The total
NT,M intensity increases linearly with
NT,Mmax during heating, suggesting that the overall PE yield can be estimated from the peak intensity. The decrease in the C 1s/Cu 2p ratios after TPPE across environments (4)–(9) shown in
Figure 10 follows the same order as the sum of
NT,M during heating in
Figure 12a.
Total NT,M vs. 1/(ε/ε0) (Heating) (b). The total NT,M generally increases as 1/(ε/ε0) decreases during heating. This indicates that higher solvent polarity (lower 1/(ε/ε0)) weakens the Coulomb field at the surface overlayer, thereby facilitating electron emission.
Δ
EN,T,M (First step, Heating) vs. 1/(
ε/
ε0) (c). Similar to the total intensity, the activation energy for the first step increases as 1/(
ε/
ε0) decreases. This inverse correlation shows that both the electron emission yield and the energy barrier tend to rise as the solvent’s dielectric constant increases, consistent with our previous findings for Sample A [
2].
Cooling Cycle Characteristics (d), (e). The total
NT,M increases as the negative activation energy becomes more negative during cooling. Furthermore, the absolute value of this negative activation energy decreases as 1/(
ε/
ε0) drops, exhibiting a similar trend to that described for the heating cycle in
Figure 12c.
Activation Energy Interdependence (f), (g). The negative ΔEN,T,M of the cooling cycle becomes smaller as ΔEN,T,M of the first-step heating cycle increases. Conversely, it becomes less negative as the second-step heating barrier decreases. However, the reason for this opposing dependence remains unclear.
Pre-exponential Factors (h), (i). During heating (first step), A0N,T,M increases gradually with increasing activation energy. We hypothesize that this is related to the adsorption strength of organic molecules on the Cu surface: more tightly bound molecules (higher ΔEN,T,M and A0N,T,M) are attached directly to the overlayer, whereas less strongly bound molecules occupy the outer layers. During cooling, A0N,T,M progressively increases as the negative ΔEN,T,M becomes less negative. Nonpolar hydrocarbon molecules appear to be less tightly bound, characterized by highly negative ΔEN,T,M and low A0N,T,M values.
Surfaces Species and NT,Mmax (j), (k). During heating, NT,Mmax increases as the peak heights of both Cu(OH)2 and Cu2O (measured after TPPE) decrease. Notably, the gradient for the Cu2O peak height is approximately twice that of the Cu(OH)2 peak after TPPE, suggesting that a reduction in Cu2O has a stronger effect on enhancing NT,M intensity during heating.
Cooling Cycle vs. Cu2O (l). Similarly, the total NT,M during cooling increases as the Cu2O peak height decreases after TPPE (excluding outliers: Ar plasma and benzene), confirming that Cu2O depletion significantly facilitates PE in both scan directions.
Figure S8a–i presents the comparison and correlation of the TPPE characteristics across environments (1)–(9).
The TPPE characteristics are summarized as follows:
NT,M Intensity and Peak Maxima. Across all environments, the NT,M intensity during heating is considerably higher than that during cooling. For (1) emery paper only, both the heating and cooling NT,M intensities are the lowest, but for (2) acetone cleaning, where rolled samples were used; both values are markedly higher. This finding can be attributed to carbon contamination, including acetone, on the surface. For (3) Ar plasma treatment, the heating-cycle NT,M intensity is much higher than that for (1) emery paper and comparable to those for the solvent-treated samples, despite the activated adsorption of oxygen species (H2O and O2) from the air by plasma exposure. However, the cooling-cycle intensity for (3) Ar plasma is significantly lower, which may be related to the desorption of these oxygen species. NT,M gradually decreases as the solvents change from (4) to (7), then increases for (8) and (9).
Δ
EN,T,M (Heating, First step). The energy barrier for (3) Ar plasma is slightly negative, whereas the other environments have positive values. Moreover, a paradoxical result is observed for (4) aniline, which exhibits both the highest energy barrier and the highest
NT,Mmax. This finding suggests that the PE involves electrons escaping from energetically demanding yet highly emissive surface states, which may be rationalized using a model involving surface–dipole interactions that modify the work function [
66]. For the nonpolar solvents (C
6H
12, C
6H
6, C
6H
5CH
3, and C
6H
14), the energy barrier becomes highest for C
6H
5CH
3 while
NT,Mmax is minimized, demonstrating a consistent inverse relationship between the barrier height and the PE intensity.
ΔEN,T,M (Heating, Second step). No second step is observed for environments (2) and (9). All other environments exhibit negative energy barrier values, and those for (3), (5), (6), (7), and (8) are much more negative than those for (1) and (4). Among the nonpolar solvents, as the magnitude of the first-step energy barrier increases, that of the second-step energy barrier tends to become less negative, reaching a minimum for (7) toluene.
ΔEN,T,M (Cooling). All environments exhibit large negative activation energies during cooling. This trend is similar to that of the second step during heating (except for environments (2) and (9)), although the magnitudes are smaller. ΔEN,T,M Down becomes extremely small for (4) aniline, despite having the highest first-step heating barrier. For the nonpolar solvents, (7) toluene shows the lowest negative barrier and the lowest NT,M during cooling, emphasizing the role of the energy barrier in controlling emission.
Next, the solvents are divided into two groups based on the reciprocal dielectric constant (
Figure 11). The first group ((4) aniline, (2) acetone, and (9) ethanol) has a lower reciprocal dielectric constant (higher polarity), and the second group ((8) hexane, (5) cyclohexane, (6) benzene, and (7) toluene) has a higher reciprocal dielectric constant (lower polarity). In the first group (
Figure S8f,g), 1/(
e/
e0) decreases as
NT,Mmax decreases during heating. During cooling, the magnitude of the negative barrier decreases in the order of (2) acetone > (4) aniline > (9) ethanol, and the total
NT,M decreases accordingly. Acetone appears to form the most surface electronic traps. In the second group (
Figure S8h,i), 1/(
e/
e0) decreases in the order of (8) hexane > (5) cyclohexane > (6) benzene > (7) toluene, while the first-step heating barrier increases. Meanwhile, the negative magnitudes of the second-step heating and cooling barriers decrease in the same order. For (5) cyclohexane, (6) benzene, and (7) toluene,
NT,Mmax and the total
NT,M correspond well with 1/(
e/
e0) and Δ
EN,T,M during heating. Hexane is an outlier because the intensity remains lower than expected. These findings collectively suggest that electron transfer to the surface can be controlled by the energy barriers imposed by specific adsorbate–surface interactions.
3.7. PE Stimulation Spectra and TPPE Characteristics
The relationships between the PE stimulation spectra and the TPPE characteristics for the different environments are displayed in
Figures S9a(a−h) and S9b.
Intensity vs. β (Heating) (a), (b). The total NT,M and IWmax all show a positive correlation with β. Because β is proportional to the PE probability (αA), these results confirm that β is a primary driver of PE intensity. Specifically, values for (4) aniline and (5) cyclohexane are significantly higher than those for (9) ethanol and (7) toluene.
Intensity vs. Photon Energy and Wavelength (Heating) (c), (d). A paradoxical phenomenon is observed:
IWmax decreases as the photon energy (
ϕWmax) increases, inverse to typical photoemission behavior. This decline in
IWmax may be related to an increase in electron density on surface oxygen species (Cu(OH)
2 and Cu
2O) at higher photon energies, which alters the interaction modes of adsorbed organic molecules [
67]. Notably, (7) toluene and (9) ethanol exhibit the lowest intensities at the highest photon energies (shortest wavelengths).
Cooling-Cycle Intensity vs. β (Cooling) (e), (f). Similar to the heating cycle, the cooling-cycle total NT,M and IWmax progressively increase with β. Hexane exhibits the highest intensity, whereas toluene and benzene exhibit the lowest.
Influence of Solvent Polarity (1/(
ε/
ε0)) (g). For the nonpolar solvents having higher 1/(
ε/
ε0),
IWmax increases with 1/(
ε/
ε0) during cooling. This correlates with the increasingly negative Δ
EN,T,M values (
Figure S8e). That is, lowering the energy barrier facilitates the transfer of photoelectrons through these solvents.
β Dependence and IE (h), (i). While β tends to decrease from environment (3) to (9) (although those for environments (5) and (8) are slightly higher) during heating, the dependence of β during cooling is closely related to the chemical properties of the solvents, namely the molecular IE. The solvents fall into two groups: a low IE group (aniline, toluene, and benzene) with lower β (cooling) values, and a high IE group (hexane, cyclohexane, and ethanol) with higher β (cooling) values.
The TPPE mechanism is linked to the electronic properties of Cu2O. As a p-type semiconductor, the band structure comprises holes in the valence band (VB), acceptor levels in the bandgap, and excited electrons in the conduction band (CB). Holes in the VB promote oxidation reactions by accepting electrons from adsorbed molecules. This helps cleave C–H and C–C bonds and is central to catalytic transformations like alcohol dehydrogenation (C2H5OH → CH3CHO + 2H+ +2e−) and oxygen formation from water (2H2O → O2 + 4H+ + 4e−). Electrons in the CB can participate in the reduction in water (2H2O + 2e− → H2 + 2OH−). In these processes, adsorbed molecules donate electrons to the holes, promoting further electron excitation in the CB. Thus, the more holes that are produced in the VB, the more electrons that can be excited. We hypothesize that this PE is accelerated during cooling. For the high IE group (hexane, cyclohexane, and ethanol), hole donation is slower than for the low IE group (aniline, toluene, and benzene).
Crucially, the trap states and charge-transfer pathways within this Cu
2O matrix are strongly governed by the specific charge states of its oxygen vacancies. In binary oxides, oxygen vacancies do not exist merely as static defects. However, they can transition between neutral, singly ionized, and doubly ionized electronic configurations, operating similarly to F-type color centers [
68]. Under the simultaneous influence of low-energy UV irradiation and thermal scanning used in our TPPE experiments, these vacancy states undergo dynamic shifts in their electronic structures. A neutral vacancy, or standard F-center, traps two electrons and introduces localized states deep within the bandgap. As the heating cycle (up scan) progresses, thermal activation and optical excitation drive the ionization of these neutral centers into singly ionized, paramagnetic states (F
+-centers) or fully ionized states, releasing delocalized electrons into the conduction band matrix.
This transient thermal ionization model provides an elegant electronic explanation for the observed variations in the photoemission probability factor (β). The generation of these intermediate, highly polarizable ionized vacancy centers effectively introduces a high density of shallow donor traps just below the conduction band edge, facilitating electron transport and temporarily lowering the kinetic barrier for electron extraction toward surface hydroxyl radicals. Conversely, during high-temperature oxidation steps or subsequent cooling cycles, the redistribution of these localized defect charges directly modifies the availability of reactive surface traps, influencing both the local work function and the baseline photoemission yields across different chemical environments.
3.8. Proposed Mechanism and Its Relation to Activation Energy
The mechanistic roles of Cu(OH)2 and Cu2O in TPPE are characterized in several key stages, including the formation of surface hydroxyl groups from adsorbed water films; the production of different –OH trap levels with high electron affinity depending on the environment; the attraction of electrons from the Cu base metal to these hydroxyl groups, leading to Auger emission; and the formation of surface dipoles via acid–base interactions, where the reciprocal dielectric constant significantly modulates the emission barrier. Furthermore, the process involves the growth of Cu2O during thermal cycling, as well as surface redox reactions facilitated by photogenerated holes in the VB and excited electrons in the CB of Cu2O. Finally, oxygen vacancies formed between the VB and CB appear to serve as essential mediators for electron transport.
To maintain scientific rigor, these interpretive pathways must be evaluated alongside alternative surface physical phenomena. Because TPPE measures a comprehensive, macroscopic electronic output from a complex composite film, the experimental signal represents a convolution of multiple competing processes. In addition to our proposed radical-tunneling model, local variations in the work function significantly influence the effective emission threshold. The adsorption of organic molecules establishes an electrostatic dipole layer that either opposes or assists the surface barrier, depending on molecular orientation. Concurrently, dynamic oxide growth at elevated temperatures changes the physical thickness of the tunneling barrier, while localized defect-assisted transport through the expanding Cu2O semiconductor matrix creates localized, high-conductivity pathways. Finally, low-energy photoelectron collection can be influenced by transient surface charging potentials across the less-conductive regions of the organic overlayer. While isolating these individual sub-processes experimentally within a single macroscopic measurement is challenging, our proposed framework aims to integrate these factors by analyzing their combined effects on the apparent activation energy and photoemission probability.
This multifactorial interpretation strongly complements recent advances in operando surface and interface characterization. Specifically, Tian et al. [
69] highlighted that in crystalline, thin-film architectures, interfacial charge transport is profoundly sensitive to defect-mediated pathways and specific structural surface reconstructions. Our observation of multi-stage activation energies provides a direct kinetic manifestation of these interface phenomena, demonstrating how the transition from surface hydroxyl states to highly polarizable p-type semiconductor domains creates transient donor traps that accelerate electron transport. Furthermore, this dynamic tuning of surface electronic states explains broader macroscopic applications, such as path-dependent virus inactivation. Glover et al. [
70] demonstrated that the rate of pathogen inactivation on high-touch copper surfaces is highly dependent on the surrounding chemical assay media, which alters oxidative surface release. Our TPPE results complement this materials science approach by uncovering the underlying electronic mechanism: the surrounding environment establishes distinct chemical dipoles and changes the surface potential array, directly modulating the availability of localized reactive electrons and surface species necessary for driving contact-mediated redox reactions.
Figure 13 outlines the temperature dependence of
NT,M (TPPE plot) for all environments. The adsorption states of water, oxygen species, and organic molecules change significantly with temperature and light irradiation. These changes strongly influence the observed PE and the associated activation energies. The TPPE plot can generally be divided into three parts. However, no second stage is observed for environments of (2) and (9): the first stage refers to the first step of heating (
NT,M increases to a maximum as temperature rises; positive activation energy), the second stage refers to the second step of heating (
NT,M declines after the peak; negative activation energy), and the third stage refers to cooling (
NT,M increases as temperature decreases; negative activation energy).
The following summary integrates the proposed mechanistic steps and experimental observations into a coherent description of how the copper surface overlayer transforms and facilitates Auger-type emission and redox reactions.
1. Initial State: Thick Adsorption Overlayer Before TPPE
Before TPPE measurements begin, the copper surface is covered by a relatively thick, heterogeneous adsorption layer comprising water molecules, surface hydroxyl groups (OH), oxides (Cu2O/CuO), and various organic molecules. These species accumulate naturally under ambient exposure and form a complex overlayer that significantly modifies the electronic properties of the Cu surface and creates a photothreshold distinct from the work function of clean metallic Cu.
2. Early Heating Stage: Desorption of Weakly Bound Species
Initial heating and irradiation trigger the desorption of weakly bound molecules, gradually thinning the overlayer and leaving a more stable, tightly bound film composed primarily of Cu(OH)2, Cu2O, and strongly adsorbed water or organic molecules. This thinning process alters the tunneling barrier for electrons, thereby modifying the PE intensity.
3. PE Through the Adsorption Layer
Even with the adsorption layer, PE from the underlying copper metal still occurs. This emission can be interpreted via two primary pathways: direct photoemission traversing the film and an Auger-type mechanism facilitated by surface hydroxyl radicals. These electrons must traverse the adsorption layer before escaping, meaning that the effective photothreshold is governed by the electronic properties and dipole characteristics of the adsorbed film.
4. Photogeneration of Charge Carriers in Cu2O
Light irradiation also excites electrons and holes within the Cu
2O surface layer:
The process creates mobile charge carriers that participate in subsequent surface reactions. Photogenerated holes (h+) are critical for oxidizing adsorbed water molecules, while electrons (e−) can contribute to PE or reduction reactions.
5. Role of Hydroxyl Radicals in PE
Photogenerated holes oxidize adsorbed water [
71]:
The resulting hydroxyl radical (∙OH) has a high electron affinity (1.83 eV). In the early stage of TPPE, electrons near the Fermi level of Cu can tunnel to these ∙OH species, producing PE via an Auger-type mechanism. This tunneling-assisted emission represents one of the primary pathways for PE at lower temperatures.
6. Surface Dipoles and Thermal Activation
As temperature increases, water and organic molecules adsorb onto the surface hydroxyl groups of Cu(OH)2, forming electric dipoles with their positive ends oriented outward. These dipoles modify the surface potential and influence electron tunneling. Meanwhile, oxygen vacancies in Cu2O become thermally activated, further affecting charge transport.
The PE intensity (NT,M signal) increases with temperature up to a maximum. Two mechanisms contribute:
Additionally, water adsorbed directly on Cu
2O undergoes reduction by photoexcited electrons [
72]:
and the resulting OH
− becomes a new adsorption site for organic molecules.
During the first heating step, electrons must overcome the energy barrier of the adsorption film, thereby making the activation energy positive.
It should be noted that oxygen vacancies are thermally activated in Cu
2O (for a review of oxygen vacancies, see ref. [
23]). Oxygen vacancies exhibit localized states just below the conduction band. These defect states possess high polarizability and strong affinity for polar molecules, making them preferential adsorption sites for H
2O, resulting in the formation of protonated surfaces. Crucially, this structural pathway contributes to the increase in
NT,M intensity during the first heating step.
7. High-Temperature Stage: Desorption and Oxidation Processes
The NT,M intensity reaches a maximum at Tmax,M. At higher temperatures (in the second heating step), water produced from Cu(OH)2 decomposition, as well as adsorbed organic molecules, gradually desorb, resulting in continuous depletion of the protonated surfaces generated via oxygen vacancies–H2O interactions, leading to a steady decline in PE intensity. Three main factors contribute to this behavior:
The loss of surface dipoles as organic molecules desorb.
The oxidation of water by photogenerated holes, which produces O2 and promotes CuO formation.
The thermal degradation of the active protonated surface layer that was generated from the interactions between oxygen vacancies and adsorbed water molecules.
This oxidation reaction reduces the Cu2O content, altering the electronic pathways for PE and resulting in negative activation energies for many environments (emery paper, Ar plasma, aniline, cyclohexane, benzene, toluene, and hexane). Acetone and ethanol, however, do not support negative activation energies, suggesting differences in adsorption strength or reaction pathways.
Because the formation of oxygen vacancies in Cu2O is thermally activated, vacancy generation alone cannot account for a decline in intensity at elevated temperatures. Instead, this high-temperature stage is governed by a kinetic competition where structural oxidation and dipole quenching dominate over vacancy activation, leading to the apparent negative activation energies observed during heating.
8. Post-Heating State at 350 °C
After heating to ~350 °C, organic molecules are essentially fully desorbed, but adsorbed water molecules remain. As the temperature decreases during cooling, the NT,M intensity gradually increases, yielding negative activation energies across all evaluated environments. This indicates that cooling enhances PE through mechanisms involving the reconstruction of protonated surfaces, as residual moisture interacts with oxygen vacancies and forms stable interfacial dipole arrays at lower temperatures.
9. Cooling: PE Enhancement at Lower Temperatures
During cooling, several processes enhance PE:
Stable water adsorption leads to the formation of hydroxyl groups that create local dipoles, facilitating electron emission, and protonation of the surface with oxygen vacancies promotes PE;
The oxidation of water by photogenerated holes proceeds via [
72]
donating electrons to Cu2O;
These electrons migrate through the thin film and contribute to PE at the surface. As a result, NT,M intensity increases during cooling, and the activation energy becomes negative.
Notably, the negative activation energy arises from competing parallel phenomena: (1) the exothermic re-adsorption of residual moisture forming structured, dipole-enhancing OH networks, and (2) temperature-dependent changes in the carrier density of the p-type Cu2O film, where lowered temperatures alter the mobility and lifetime of photoexcited holes. This multi-variable kinetic view deviates from the idea of a single photoredox step.