Systematic Review

Deep Learning and Computer Vision for Lettuce Growth Analysis in Vertical Farming over the Last 10 Years: A Systematic Review

by
Nathaniel Lloyd Jones
1,
Daniel Rocha
1,2,3 and
Vítor Carvalho
1,2,*
1
2Ai, School of Technology, Polytechnic University of Cávado and Ave, 4750-810 Barcelos, Portugal
2
Algoritmi Research Centre/LASI—Intelligent Systems Associated Laboratory, University of Minho, 4800-058 Guimarães, Portugal
3
INL—International Nanotechnology Laboratory, 4715-330 Braga, Portugal
*
Author to whom correspondence should be addressed.
Appl. Sci. 2026, 16(15), 7717; https://doi.org/10.3390/app16157717
Submission received: 12 June 2026 / Revised: 21 July 2026 / Accepted: 28 July 2026 / Published: 3 August 2026

Abstract

Vertical farming (VF) is a critical solution for sustainable urban agriculture; however, its economic viability remains constrained by high labour and energy costs. The integration of Artificial Intelligence (AI) and Computer Vision (CV) offers opportunities to automate monitoring and optimize environmental control. This systematic review synthesizes peer-reviewed research published between 2015 and 2026 on Deep Learning (DL) applications for lettuce (Lactuca sativa) cultivated in Controlled Environment Agriculture (CEA). Literature was retrieved from Google Scholar, Scopus, PubMed, Semantic Scholar, OpenAlex, and Web of Science, resulting in 34 eligible studies selected from an initial pool of 893 records. The analysis indicates that Convolutional Neural Networks (CNNs) and You Only Look Once (YOLO)-based object detection models are the most widely adopted architectures for non-invasive growth monitoring and disease detection, frequently reporting accuracy metrics exceeding 90%. In parallel, hybrid approaches that integrate AI with biophysical constraints are gaining attention for yield estimation and nutrient prediction tasks. Nevertheless, significant challenges remain, particularly concerning data availability and reproducibility, as 87% of the reviewed studies rely on private datasets. Overall, the findings underscore the need for standardized benchmarking datasets and computationally efficient, edge-deployable architectures to facilitate the transition from experimental prototypes to scalable commercial applications.

1. Introduction

1.1. Background and Motivation

VF and CEA have gained increasing attention as potential approaches to addressing global food security challenges, driven by the need to meet a projected 70% increase in global food demand by 2050 [1]. In addition to demographic growth, recent geopolitical disruptions, including the COVID-19 pandemic and the Russia–Ukraine conflict, have highlighted vulnerabilities in global supply chains and reinforced the importance of localized, resilient production systems [2].
Despite their promise, the economic sustainability of VF systems remains a significant challenge. Operational expenditures are dominated by labour and energy costs. For example, ref. [3] reported that in high-efficiency systems, labour-related intervention costs may reach €3.00/m2, substantially exceeding electricity costs (€0.46/m2). These findings suggest that automation is not only a technological advancement but may also be economically strategic.
AI has been proposed as a mechanism to improve resource-use efficiency in CEA systems. For instance, ref. [1] introduced the concept of “electricity productivity,” reporting values of 95.0 g/kWh under adaptive lighting strategies. Similarly, ref. [3] observed improvements in Water-Use Efficiency (WUE), from 22 g/L in static systems to 31g/L under AI-driven optimization. In economic terms, ref. [4] reported a return on investment of 104.56% for solar-integrated VF systems, while ref. [1] documented a 65% ROI under adaptive control scenarios. Collectively, these studies indicate the potential economic benefits of intelligent environmental management.

1.2. The Role of Lettuce as a Model Crop

Within the context of cultivated crops, lettuce serves as the primary model organism for indoor agricultural research, selected not merely for convenience but due to its specific biological and economic attributes. While Butterhead varieties dominate the literature because they represent the highest market share as of 2022 [2], contemporary research encompasses diverse cultivars including Romaine, ‘Flandry’ [5], and ‘Lugano’ [3].
Biologically, lettuce is an ideal candidate for CV benchmarking due to its high sensitivity to light spectra [1] and susceptibility to physiological disorders such as tip-burn [6]. These traits render it an optimal stress-test for environmental control algorithms. Furthermore, its “fragile and thick” canopy architecture [7] presents unique occlusion challenges for image processing, while its rapid growth cycle expedites high-frequency data collection [2].
Commercially, minute morphological differences can significantly dictate market value. As reported by [3], Class A heads are valued at €0.50 compared to €0.40 for Class B, illustrating how minor quality deviations may impact profitability at scale.

1.3. From Manual to Automated Phenotyping

Despite the suitability of lettuce, monitoring its growth remains a critical bottleneck. Traditional phenotyping methodologies are not only invasive but economically unsustainable. As previously established, labour costs constitute the primary financial burden within high-efficiency configurations, often exceeding energy expenditures. Beyond economic implications, manual inspection under red/blue LED lighting may introduce labelling inconsistencies due to spectral distortions [6].
Furthermore, destructive weighing protocols inherently preclude the ability to track individual growth trajectories longitudinally. As articulated by [2], direct physical handling during manual measurement may introduce physiological stress, potentially influencing growth outcomes. Because destructive sampling prevents continuous observation of a single specimen, researchers frequently rely on interpolated growth curves rather than strictly longitudinal data [3].
CV offers a non-contact alternative that enables continuous monitoring with minimal disturbance. With high-end GPU acceleration, reported inference times as low as 3 ms per image suggest the feasibility of real-time implementation in controlled environments.

1.4. The Shift to Deep Learning (2015–2026)

Over the past decade, research in automated plant phenotyping has progressively shifted from traditional Machine Learning (ML) approaches toward DL frameworks. Early ML methods, including Support Vector Machines (SVMs), relied heavily on manually engineered features, which often exhibited limited generalization across variable symptom scales and heterogeneous visual conditions [8].
In addition to feature-design constraints, computational performance limited the feasibility of real-time deployment. For example, ref. [9] reported inference times of up to 376.61 s per dataset for SVM-based models, compared to 7.00 s for neural network alternatives. Traditional image processing techniques also demonstrated reduced robustness under artificial lighting environments. Under red/blue LED illumination, ref. [6] observed that certain approaches failed to detect stress symptoms in specific scenarios, a limitation attributed to the difficulty of separating feature extraction from spectral distortions introduced by the lighting conditions.
DL architectures mitigated several of these constraints by enabling end-to-end feature extraction directly from raw image data. However, subsequent architectural development has evolved along two primary directions: computational efficiency and contextual representation.
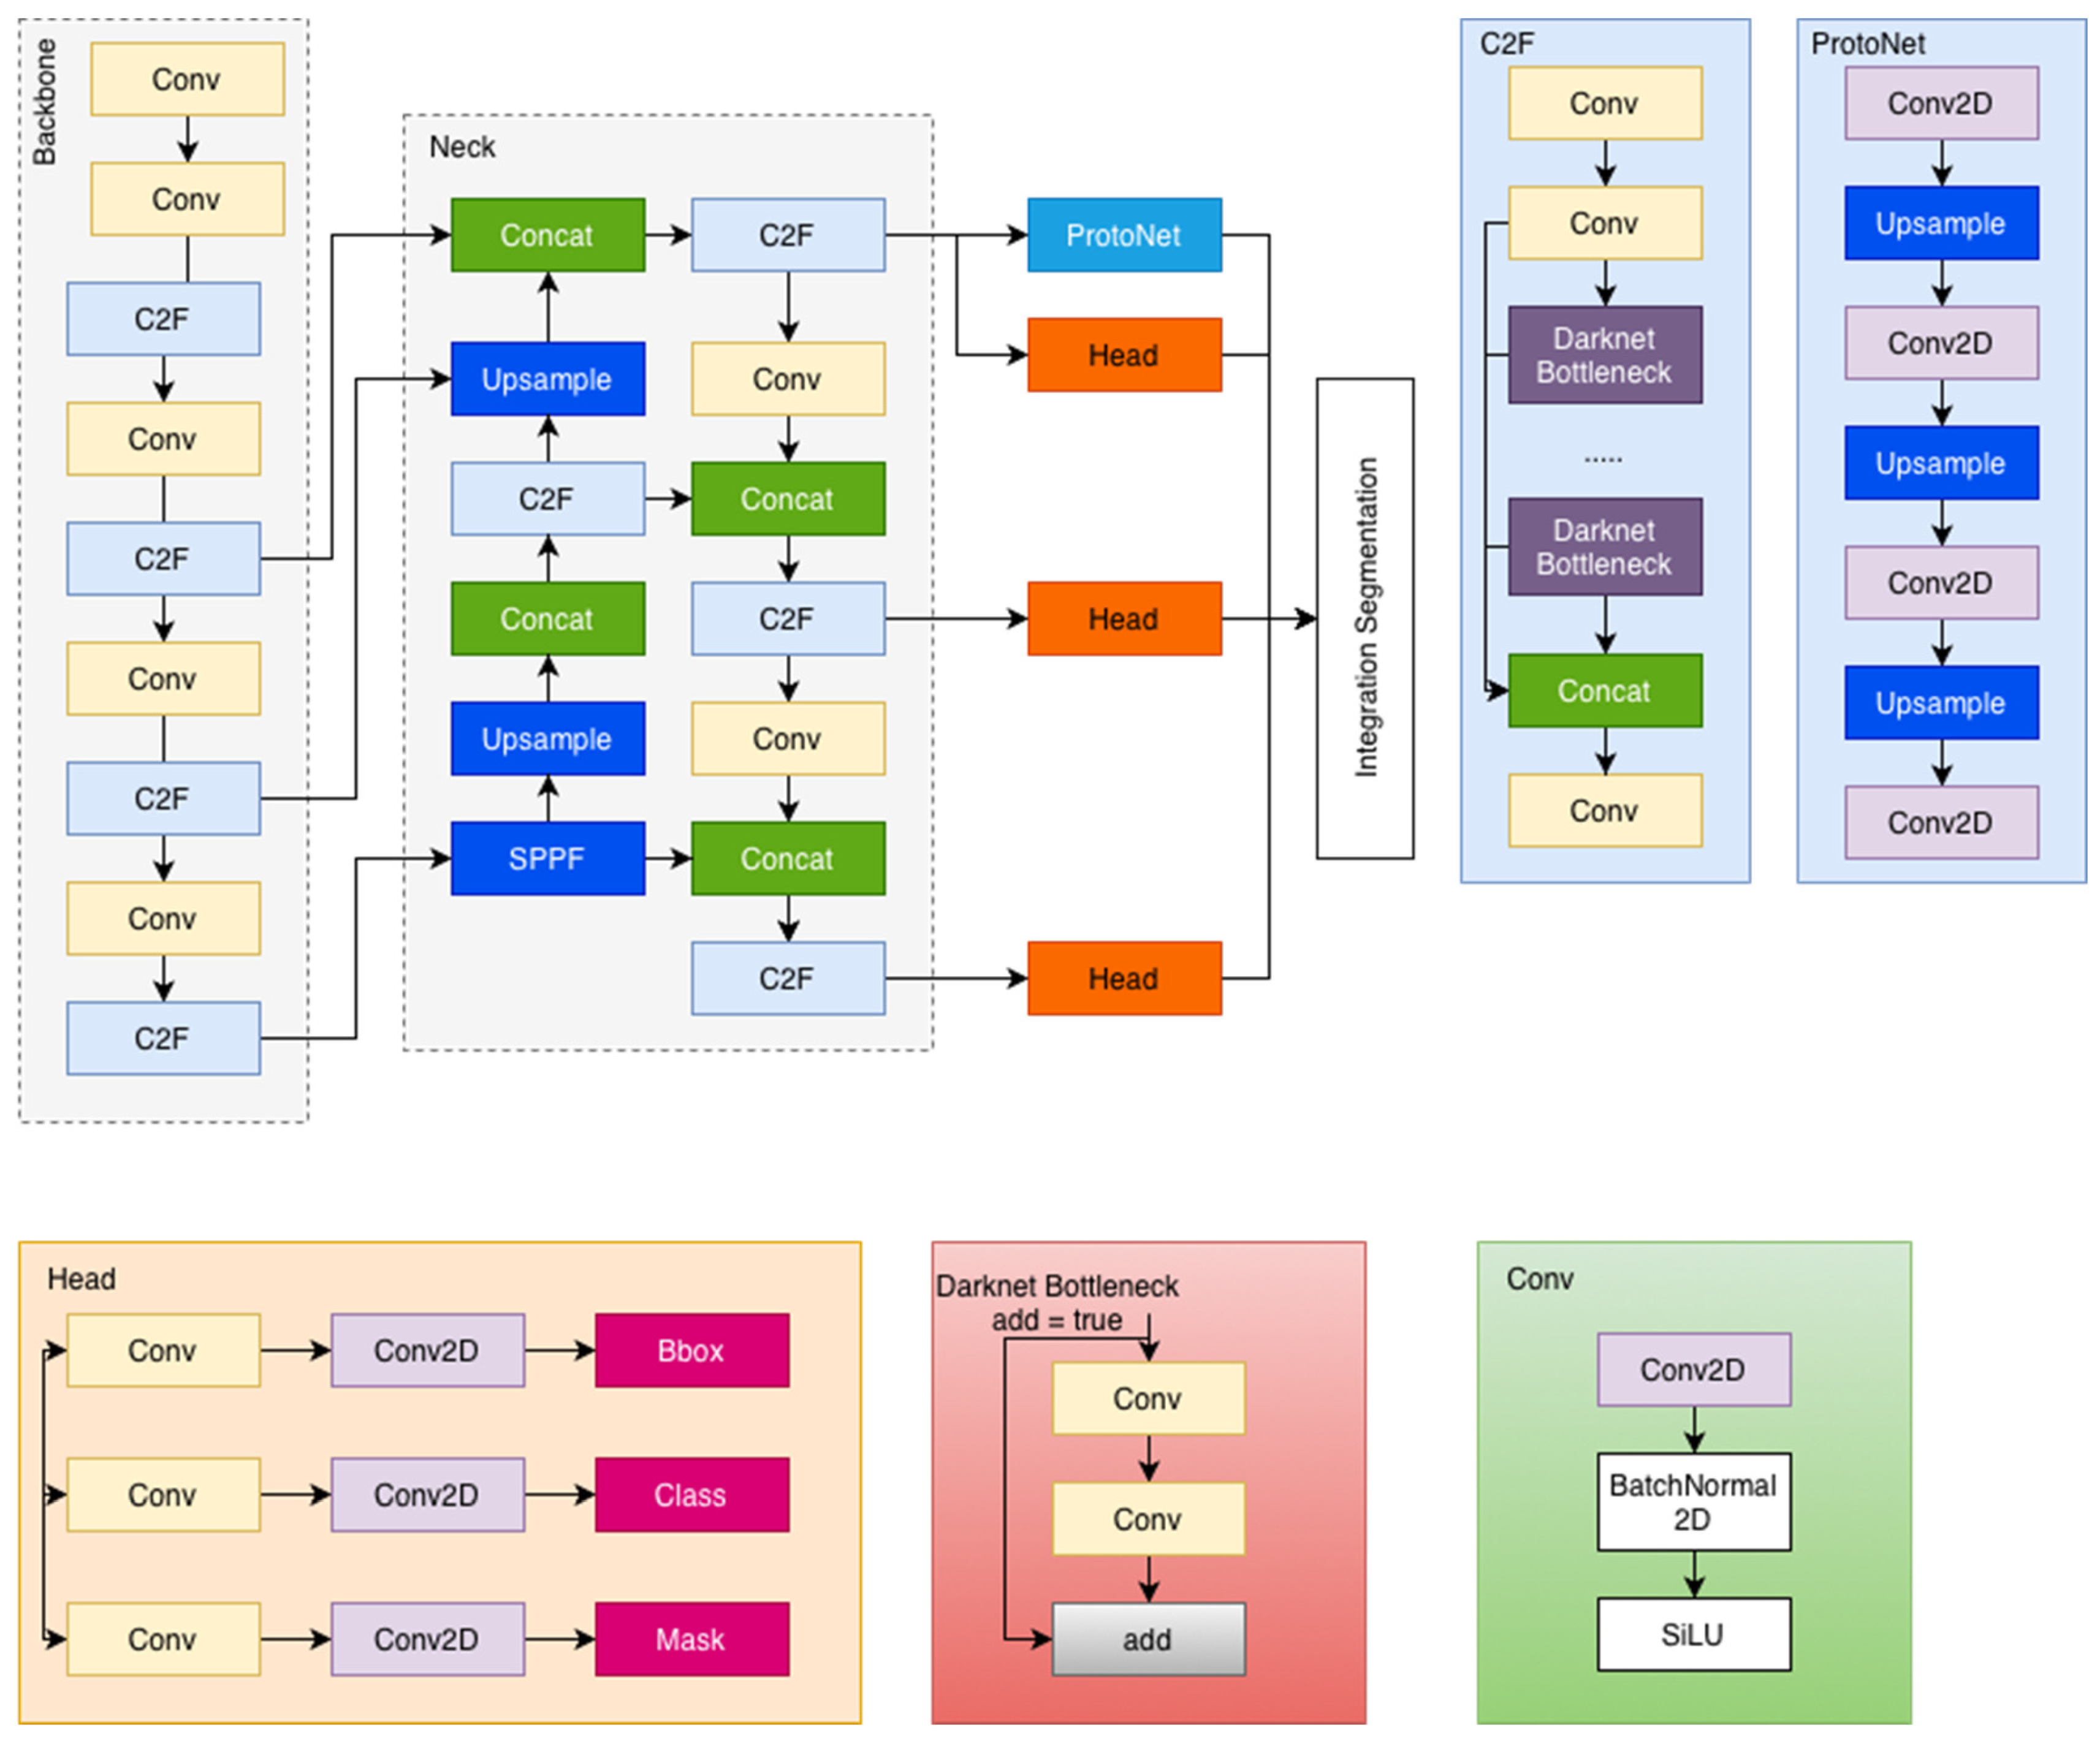
From a deployment perspective, model size and inference latency became critical factors. Although Faster R-CNN (region-based with CNNs) achieved high detection accuracy, its model size (1.2 GB) limited suitability for embedded systems [10]. In contrast, YOLO v7 achieved 97.2% mAP (mean average precision) with a substantially smaller footprint (11.7 MB), highlighting the trade-off between accuracy and portability. Further optimization for CPU-based inference was demonstrated by [11], who integrated a FasterNet backbone into YOLOv8, achieving inference speeds of approximately 40 ms. Most recently, the algorithmic landscape has continued to evolve, highlighting a rapid transition toward YOLOv11 variants for robust localization and advanced sequence-based regression models for yield forecasting. For example, integrations of Bayesian optimization with hybrid recurrent neural networks, specifically the BO-GRU-BiLSTM framework, have demonstrated exceptional precision in sequential harvest time prediction, achieving an R 2 of 0.826 and a Root Mean Square Error (RMSE) of 1.532 with an inference latency of merely 0.201 ms per sample [12]. Furthermore, recent architectures have successfully deployed two-stage pipelines combining real-time CNN biomass estimation with LSTM sequence forecasting to achieve R 2 values exceeding 99.5% [13]. Similarly, the UniTriRob model has emerged as a highly robust regression architecture for aeroponic yield forecasting, yielding an outstanding R 2 of 0.9783 and an RMSE of 0.469 by effectively mitigating heteroscedastic noise and sensor outliers [14]. While earlier studies predominantly feature YOLOv8 implementations, this reflects the standard academic publication timeline; the domain is currently actively shifting toward these more sophisticated temporal and robust regression frameworks.
Parallel research has explored architectures capable of capturing broader spatial dependencies. Vision Transformers (ViTs), introduced in this context by [15], aim to overcome the locality constraints of convolutional receptive fields through global attention mechanisms. These models have shown promising results in regression tasks such as biomass estimation, where long-range contextual information may be beneficial.
More recently (2024–2026), hybrid frameworks combining data-driven learning with biophysical modelling have gained increasing attention. While earlier studies incorporated multiple algorithmic components, newer approaches embed explicit physiological relationships within the predictive pipeline.
For example, ref. [16] coupled Random Forest regression with the Penman–Monteith equation to link morphological predictions with evapotranspiration dynamics. Such strategies aim to enhance interpretability and biological consistency within AI-driven systems, addressing concerns regarding the opacity of purely data-driven models.

1.5. Objectives and Contribution

Within the context of this systematic review, CEA is defined as a technology-driven approach to agricultural production that precisely regulates environmental parameters, including light spectrum, temperature, humidity, and CO2 concentration, to optimize crop growth and ensure sustainable intensification. VF is recognized as a highly specialized subset of CEA, characterized by the high-density cultivation of crops in vertically stacked layers, traditionally relying on closed-loop, fully artificial light plant factories (PFALs). While the core focus of this review remains strictly on DL and CV applications within these closed PFAL environments, a specific subset of high-tech greenhouse studies (e.g., [3,17]) operating under natural light has been intentionally included. The integration of these studies is methodologically justified, as they serve as an essential ‘natural light baseline.’ By establishing baseline cv performance metrics under solar illumination, this review can comparatively measure and isolate the specific spectral interference and feature distortion caused uniquely by artificial LED environments in PFAL systems. A complete categorization of all reviewed studies by their illumination environment (Group A: fully Artificial Light/PFAL vs. Group B: Natural Light/Greenhouse) is detailed in Appendix B (Appendix B.1.4).
This systematic review synthesizes 34 studies published between 2015 and 2026, focusing specifically on Artificial Intelligence-driven monitoring and control of lettuce cultivated in CEA systems. While several surveys address AI applications in agriculture more broadly, fewer studies provide a crop-specific and deployment-oriented analysis within indoor farming environments.
Previous assessments have indicated that only a limited proportion, 12%, of vision-based systems integrate real-time control loops or address constraints associated with edge deployment on low-power hardware [18]. Moreover, concerns regarding model interpretability and biological plausibility have been raised in the context of purely data-driven approaches [16]. These observations highlight the need for a structured evaluation of architectural trends, scalability considerations, and data-related limitations within this domain.
Accordingly, this review pursues three primary objectives:
  • Scalability and Deployment: To evaluate the transition from server-based prototypes to edge-deployable systems, including reported inference speeds and hardware constraints [11,18].
  • Architectural Evolution: To analyse emerging lightweight and hybrid frameworks, with particular attention to physics-informed approaches that integrate biophysical relationships into predictive pipelines [16].
  • Data and Generalization: To examine dataset characteristics, data availability, and augmentation strategies, including synthetic background generation, and to assess their implications for model robustness [15].
The remainder of this paper is structured as follows: Section 2 describes the materials and methods, including the PRISMA-based selection protocol. Section 3 presents the results categorized by architectural and hardware trends. Section 4 presents the comprehensive discussion and future research trajectories, Section 5 outlines the limitations of the review, and Section 6 provides concluding remarks.

2. Materials and Methods

This systematic review was conducted following the guidelines of the Preferred Reporting Items for Systematic Reviews and Meta-Analyses (PRISMA) 2020 statement. The review protocol focused on identifying, screening and synthesizing literature regarding the application of DL and CV in the monitoring and optimization of lettuce growth within VF and CEA.

2.1. Research Questions

To guide the systematic review and ensure alignment with the study’s goals, the following research questions (RQs) were defined:
  • RQ1: What are the primary CV and DL architectures used for lettuce monitoring in VF?
  • RQ2: What specific growth parameters (e.g., yield, disease, nutrient status) are most frequently analysed using these technologies?
  • RQ3: What are the current limitations and challenges in implementing these AI-driven systems in real-world production environments?

2.2. Search Strategy and Data Sources

A comprehensive literature search was performed in July 2026. The databases selected for this review included Google Scholar, Scopus, PubMed, Semantic Scholar, OpenAlex, and Web of Science (WoS). These sources were explicitly chosen to ensure coverage of both technical engineering repositories (IEEE Xplore, Scopus) and biological/agricultural archives (PubMed, WoS).
The search strategy employed a combination of keywords related to the crop (Lactuca sativa), the farming system (CEA, VF), and the technology (DL, CV). Boolean operators (“AND”, “OR”) were utilized to construct the search strings:
(“artificial intelligence” OR “machine learning” OR “deep learning” OR “computer vision”) AND (“vertical farming” OR “indoor farming” OR “hydroponics” OR “controlled environment agriculture” OR “CEA”) AND (lettuce OR lactuca).

2.3. Eligibility Criteria

Studies were selected based on specific inclusion and exclusion criteria to ensure the relevance and quality of the data.
Inclusion Criteria:
  • Timeframe: Articles published between 2015 and 2026. The year 2015 was selected as the inception point to capture the emergence of Deep Residual Networks (ResNet) and Faster R-CNN, which marked the critical paradigm shift from traditional manual feature extraction to end-to-end deep feature learning.
  • Language: Full-text articles published in English.
  • Document Type: Peer-reviewed journal articles, conference proceedings, and theses.
  • Topic: Studies explicitly applying AI/CV techniques to lettuce crops in controlled environments (hydroponics, aeroponics, vertical farms).
Exclusion Criteria:
  • Studies focused solely on open-field agriculture to isolate the impact of controlled environmental variables.
  • Research not involving lettuce or where lettuce was not the primary crop analysed.
  • Review articles, book chapters, technical reports, preprints, and white papers (to ensure peer-reviewed quality).
  • Qualitative Studies: Studies were excluded if they failed to report quantitative performance metrics (e.g., Accuracy, mAP, RMSE, R 2 , or Resource Efficiency) to ensure the reproducibility and comparative value of the results.

2.4. Study Selection and Data Extraction

The selection process followed the PRISMA flow framework. Initially, all retrieved records were imported into the Rayyan reference management tool, where duplicates were automatically identified and removed. The screening was conducted in two stages:
  • Title and Abstract Screening: Records were screened for relevance against the eligibility criteria. Irrelevant titles were discarded.
  • Full-Text Assessment: The full texts of the remaining articles were retrieved and examined in detail.
Data Extraction Protocol: Data were extracted using a standardized form capturing four key dimensions:
  • Bibliographic Scope: Publication year, study objective (e.g., localization vs. weight prediction), and specific crop cultivars.
  • Environmental Setup: Production system type (Greenhouse vs. Plant Factory), input modality (RGB vs. Depth), and lighting protocols.
  • Technical Implementation: Algorithm classification (e.g., Convolutional Neural Networks [CNNs], You Only Look Once [YOLO], Transformers), specific architecture names, and computational hardware (differentiating between Edge Devices like Raspberry Pi and Server-Grade GPUs).
  • Performance Metrics: Quantitative results ( R 2 , mAP), inference speed (ms/FPS), dataset characteristics (size and augmentation), and reported limitations regarding scalability and robustness.
  • Quality Assessment: The methodological quality of each study was assessed based on the reproducibility of its dataset (Public/Private), the definition of ground truth (Destructive/Non-destructive), and the rigorousness of validation metrics (e.g., use of a separate test set vs. simple training accuracy).

3. Results

3.1. Study Selection

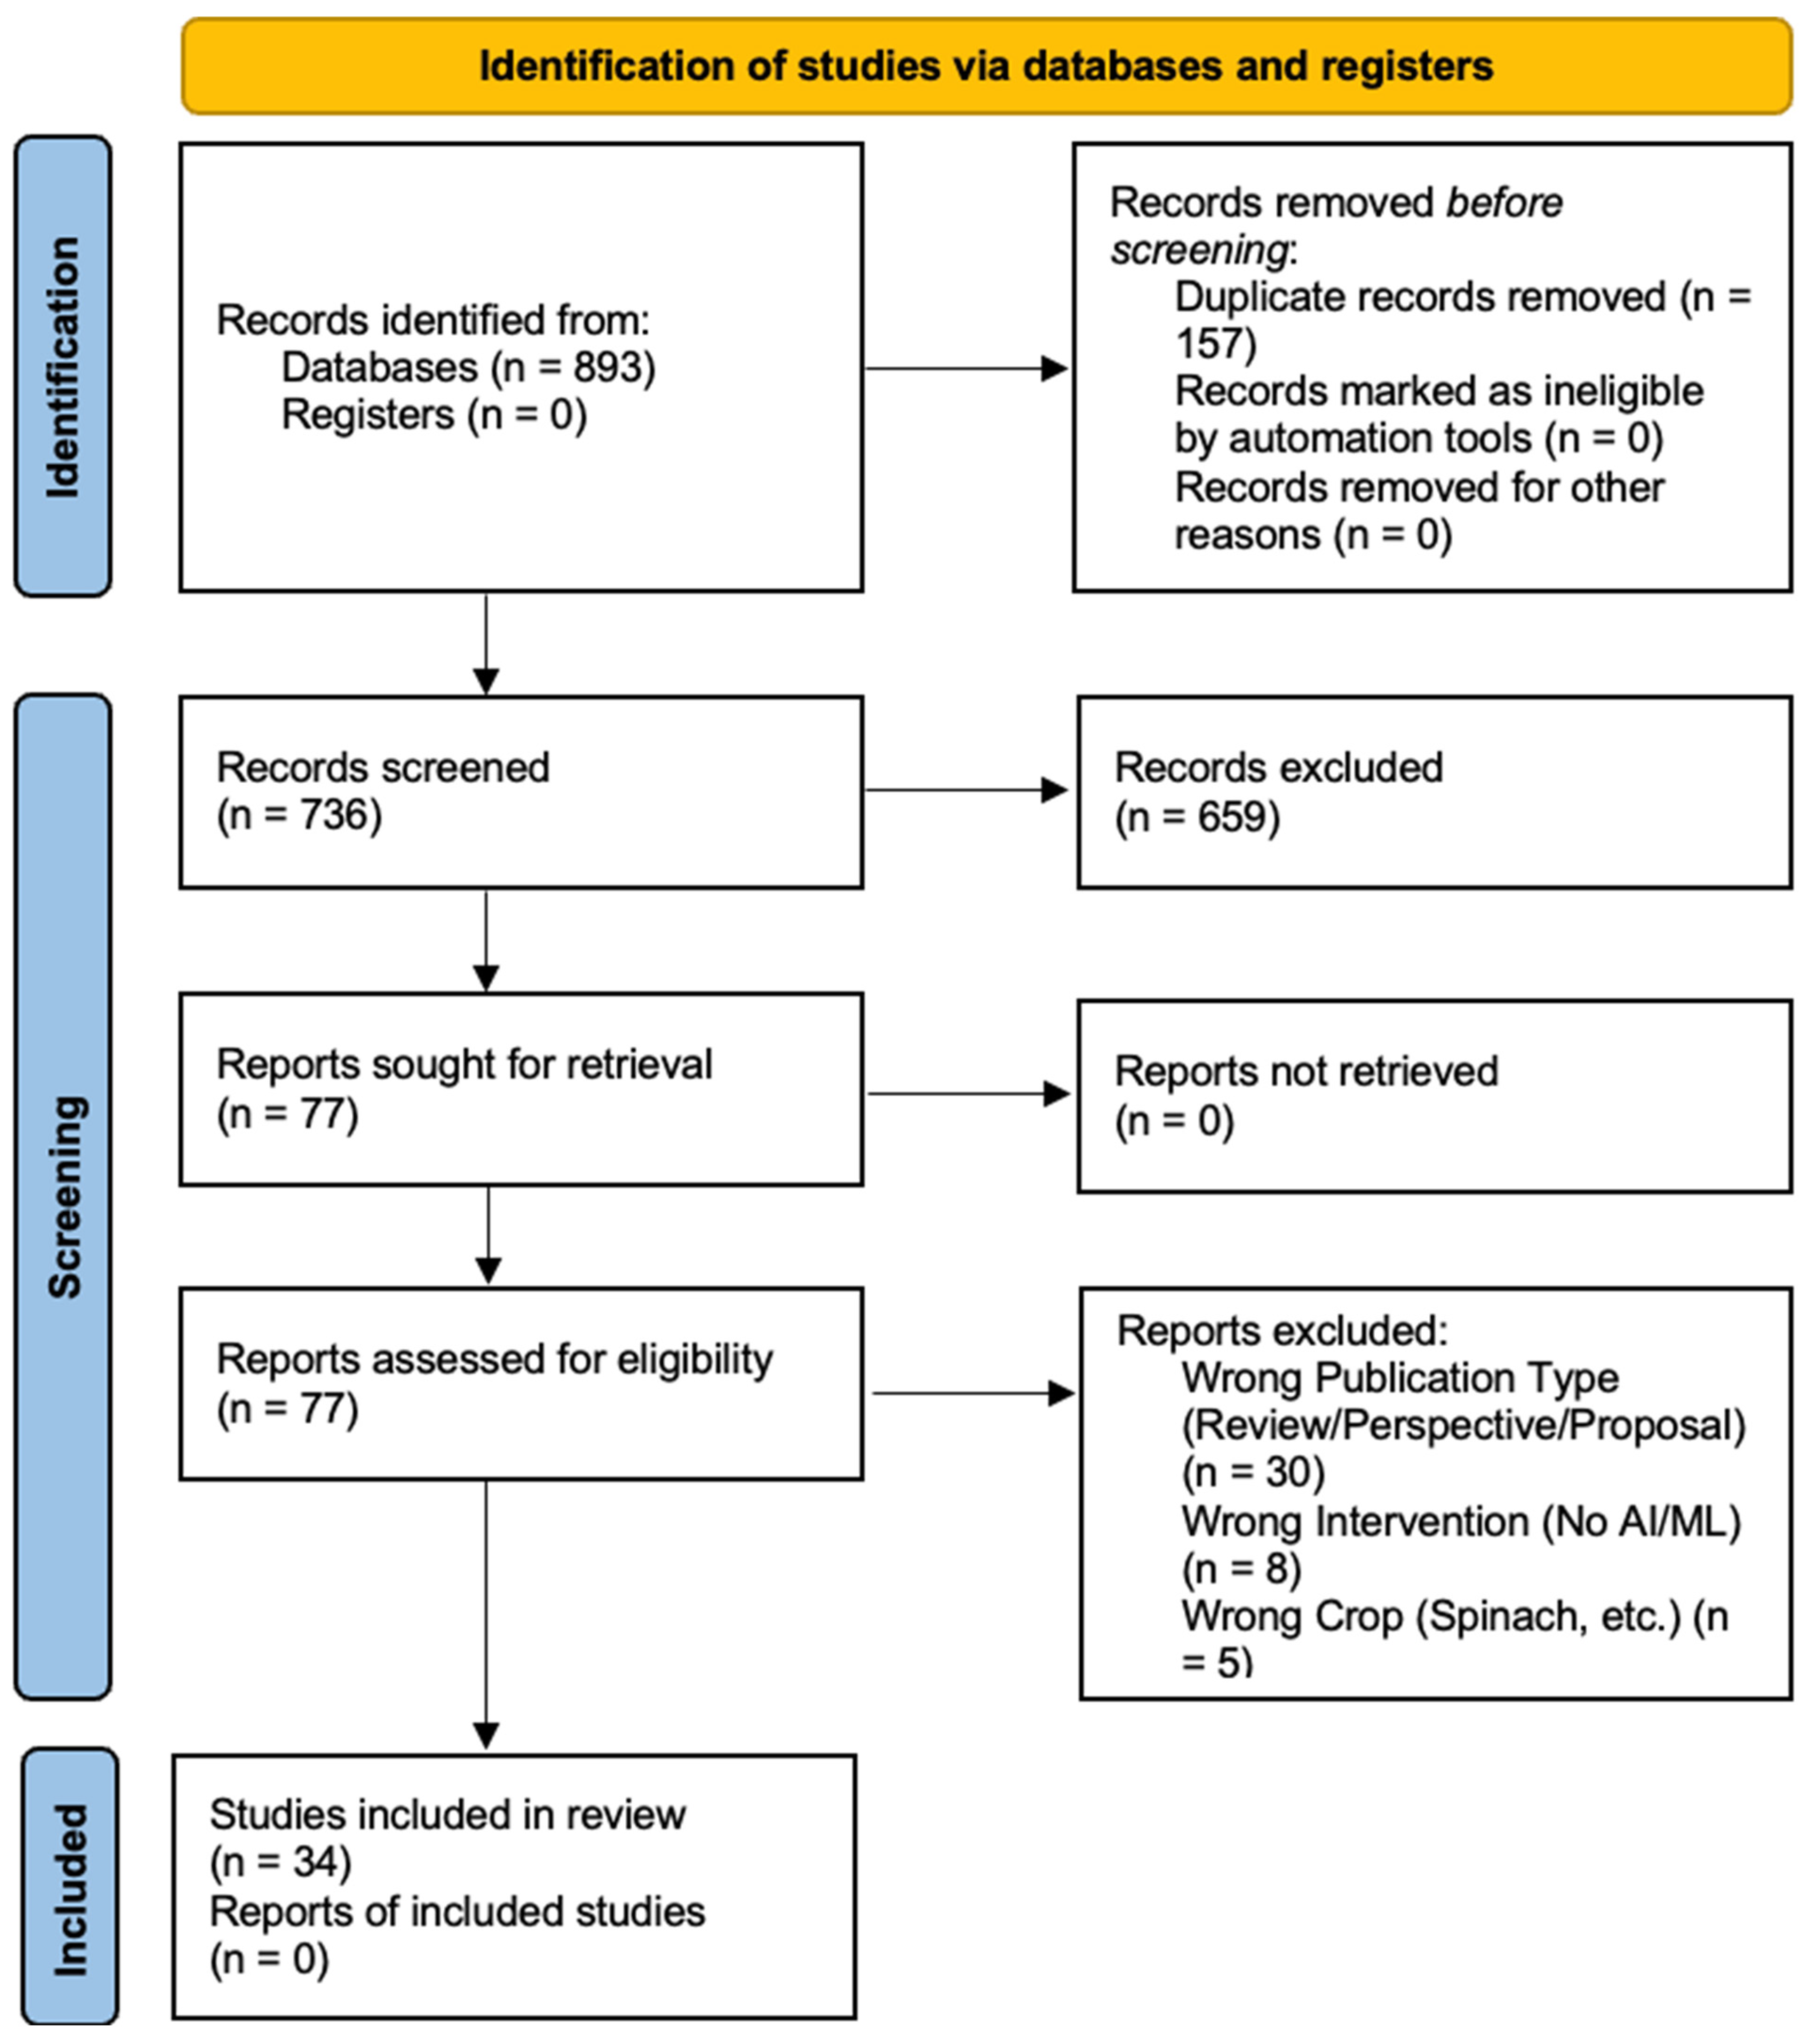
The search strategy yielded a total of 893 documents from the electronic databases. Initial screening using the Rayyan reference management tool identified 172 potential duplicates. Upon manual verification, 15 records were resolved as distinct studies and retained, while 157 were confirmed as duplicates and removed. This left 736 records for title and abstract screening. From these, 659 articles were excluded as they did not meet the eligibility criteria (e.g., wrong crop, open-field agriculture). A total of 77 full-text articles were assessed, with 43 being excluded for specific reasons (e.g., lack of quantitative metrics). Finally, 34 studies were included in this systematic review. The selection process is illustrated in Figure 1. Appendix A (Table A1) presents a summary of the included studies, detailing the crop, system type, AI algorithm, and key results. Furthermore, a comprehensive analysis of the general characteristics of these included studies—including annual publication trends, geographic and institutional distributions, publication venue quality, and production system breakdowns—is provided in Appendix B.
While the primary scope of this systematic review is centred on DL and CV architectures, the inclusion of select traditional ML regression models utilizing multivariable sensor data is methodologically imperative. Evaluating advanced deep neural networks in isolation limits the ability to determine their true computational and predictive efficacy. Traditional ML approaches serve as necessary performance baselines against which the robustness and accuracy of DL models can be rigorously compared. Specifically, the inclusion of advanced traditional frameworks, such as the Unified Tri-Robust (UniTriRob) regression model, provides a critical benchmark. The UniTriRob model effectively mitigates heteroscedastic noise, sensor outliers, and dataset imbalances inherent in aeroponic VF, achieving an exceptional R 2 of 0.9783. Benchmarking DL architectures against such highly optimized, noise-resistant traditional models ensures a comprehensive evaluation of whether the increased computational cost of DL is justified by proportional gains in predictive reliability within real-world agricultural deployments.

3.2. Growth Monitoring and Yield Estimation

The reviewed literature reveals a clear technological hierarchy in biomass estimation, moving from simple regression to spatial DL.

3.2.1. Architectural Comparison: Speed vs. Spatial Awareness

Standard Multi-Layer Perceptrons (MLPs) offer computational speed but struggle with spatial complexity. Ref. [2] demonstrated that while an MLP was nine times faster than a CNN, it suffered a significant accuracy drop. To address this trade-off in feature selection, ref. [19] successfully employed a Hybrid Tree–Fuzzy–Rough Set model to filter optimal vision descriptors before feeding them into decision support systems. However, for precision tasks, CNNs remain the standard. Ref. [2] utilized a ResNet18 architecture to predict fresh weight with an RMSE of 8.06 g. Crucially, this high accuracy relied on a “horizontally mobile” camera system, a controlled setup that [15] criticized for lacking generalizability.

3.2.2. The Necessity of Depth for Canopy Occlusion

A critical finding across multiple studies is the failure of 2D RGB sensors once the plant canopy closes. Ref. [3] provided definitive statistical evidence, showing that 2D coverage percentage correlated poorly with actual fresh weight ( r = 0.5392 ) once leaves began to overlap. In contrast, 3D volume calculated from depth sensors maintained a strong correlation ( r = 0.8975 ), proving that depth data is essential for monitoring late-stage growth. Similarly, ref. [20] reported that their RGB-D model achieved a low Mean Absolute Percentage Error (MAPE) of 7.3%, effectively solving the occlusion problem that blinded 2D models. However, hardware reliability remains a bottleneck; ref. [2] reported catastrophic failure of the RealSense D405 sensor due to humidity corrosion after just three weeks, while [20] noted that specular reflections on wet leaves caused significant data artifacts.

3.2.3. Destructive vs. Non-Destructive Validation

Despite the goal of non-invasive monitoring, model validation remains paradoxically destructive. All major yield studies [2,3,15] relied on harvesting and weighing plants to establish ground truth. Ref. [15] explicitly admitted that this “destructive investigation” limited their dataset size and prevented the tracking of individual plant growth curves. Ref. [3] further noted that this forces researchers to rely on linear interpolation rather than real continuous data, highlighting a methodological flaw that only “Physics-Informed” hybrid models [16], which infer mass from transpiration rates, attempt to circumvent.

3.3. Environmental Control and Resource Optimization

A significant portion of the literature applied AI not merely for monitoring, but to actively close the control loop, optimizing the “Energy–Yield” nexus through diverse hardware strategies.

3.3.1. Quantifiable Efficiency and ROI

The review identifies a shift from theoretical optimization to quantifiable economic gains. Ref. [1] demonstrated that an adaptive lighting framework could achieve an “electricity productivity” of 95.0 g/kWh. Even higher returns were reported by the Bernardo research group, who sequentially optimized solar-sharing systems using fuzzy logic [21], culminating in a 2024 study that achieved a massive ROI of 104.56% [4]. Similarly, ref. [22] utilized Artificial Neural Networks (ANNs) to optimize the interaction between photovoltaic shading and VF facades, achieving a prediction accuracy of 88% for energy self-sufficiency. Prior to these adaptive systems, ref. [23] established baseline environmental setpoints, but [24] demonstrated that AI-driven spectral optimization could surpass these baselines, improving WUE to 31 g/L.

3.3.2. Control Logic: Edge Microcontrollers vs. Industrial PLCs

Hardware implementation reflects a bifurcation based on cost versus robustness. For low-cost deployment, ref. [4] utilized Fuzzy Logic on Arduino and ESP8266 microcontrollers. Fuzzy Logic was selected specifically as a lightweight “expert system” capable of simulating complex environmental rules without the computational overhead of DL. In contrast, ref. [25] prioritized industrial standardization, employing an OMRON NX1P2 PLC. The preference for industrial robustness was so strong that even when input ports were insufficient, they utilized an ESP32 solely as a bridge rather than replacing the PLC, emphasizing the “Industrial IoT” requirement for standardized Structured Text programming over minimizing hardware costs.

3.3.3. Biophysical Constraints vs. Architectural Optimization

Beyond pure DL, “Hybrid” models have emerged to address two distinct limitations: interpretability and efficiency. The first class integrates biophysical constraints to solve the “Black Box” problem: ref. [16] pioneered a system coupling Random Forest with the Penman-Monteith equation to dynamically scale water usage. By anchoring predictions in established laws of evapotranspiration, this prevents the model from generating biologically impossible values. The second class utilizes nature-inspired meta-heuristics for architectural optimization: ref. [9] employed a Gravitational Search Algorithm (GSA) to tune an RNN, while [7] introduced a Chimp-Optimized EfficientNet. Unlike biophysical models which constrain outputs, these use physics metaphors to navigate the hyperparameter search space more efficiently than standard grid-search methods.

3.4. Hardware Implementation and Computational Complexity

The reviewed studies demonstrate a clear bifurcation in hardware strategies, categorized into low-cost edge solutions for real-time monitoring and high-performance server solutions for complex model training.

3.4.1. Imaging Sensors and Reliability

While standard RGB cameras remain ubiquitous, specialized sensors face reliability challenges in humid VF environments. For depth estimation, the Intel RealSense series (D415, D435) is the industry standard [20], yet it is not infallible. Ref. [2] reported the catastrophic failure of a RealSense D405 sensor due to humidity-induced corrosion after only three weeks in a plant factory. Furthermore, ref. [20] noted that while RGB-D sensors solve occlusion, they suffer from “missing pixels” caused by specular reflections on wet leaf surfaces, necessitating robust preprocessing pipelines.

3.4.2. Hardware Constraints and Tiered Inference Benchmarks

The deployment of DL architectures in CEA is fundamentally constrained by the computational limitations of edge hardware. To accurately isolate the impact of algorithmic efficiency from raw computing power, inference benchmarks must be strictly categorized by their deployment hardware tiers.
Server-Grade Infrastructure: When deployed on high-performance local GPU workstations or costly cloud-based computational resources, architectures can achieve near-instantaneous speeds. For instance, ref. [2] quantified this on powerful hardware, finding that a simple Multi-Layer Perceptron (MLP) achieved an inference time of 3 ms, significantly outpacing a ResNet18 CNN at 26 ms. While these absolute speeds are ideal for high-speed conveyor systems, they rely on computational resources that are often economically and physically unfeasible for distributed edge deployment within plant factories.
Edge and Low-Power Deployment: Translating complex networks to edge devices or standard CPUs introduces severe inference bottlenecks. On these constrained tiers, architectural optimization that prioritizes the minimization of Giga Floating Point Operations per Second (GFLOPs) becomes the primary driver of speed. For example, on low-power hardware, ref. [8] demonstrated that ShuffleNet achieved an inference speed of 80.89 ms, drastically outperforming comparable lightweight models like SqueezeNet (238.22 ms). This efficiency is not driven by server power, but by Pointwise Group Convolutions and Channel Shuffling, which reduce the requirement to merely 0.04 GFLOPs per image. Similarly, ref. [11] optimized a YOLOv8n-seg architecture specifically for CPU-based inference by integrating a FasterNet backbone utilizing Partial Convolutions (P-Conv), reducing computational loads from 11.97 GFLOPs to 5.96 GFLOPs and cutting inference latency by 26%. By grouping these metrics, it becomes evident that while MLPs offer the highest absolute speed on servers, structurally optimized architectures like ShuffleNet and FasterNet-YOLO are imperative for viable edge-CV deployment.

3.4.3. Robotic Integration and Structural Optimization

Moving beyond monitoring, recent work integrates vision with actuation. Ref. [26] engineered a custom 4-DOF manipulator using specific Denavit–Hartenberg parameters to navigate hydroponic racks, while [17] implemented a low-cost linear robotic rail using Raspberry Pi. Crucially, hardware innovation extends to the physical facility itself; ref. [5] utilized parametric modelling and genetic algorithms to optimize the stereoscopic frame design, reducing shading and maximizing natural light uniformity. Finally, ref. [25] bridged the gap to industrial standards by deploying a fuzzy logic control system directly onto an OMRON NX1P2 PLC.

3.5. Dataset Characteristics and Training Strategies

A critical analysis reveals that the field is stifled by a reliance on siloed, private data. As detailed in Table 1, 87% of the reviewed studies utilized private datasets unavailable to the broader research community. Only four studies [1,3,7,20] provided open access or GitHub.com repositories, a fragmentation that [6] explicitly identified as a “primary barrier” to progress, noting that “no public datasets are found for diseases or stress analyses in indoor environments”.

3.5.1. Synthetic Data Augmentation Strategies

To overcome this bottleneck, researchers have moved beyond simple geometric augmentation to fully synthetic data generation. Ref. [15] utilized the Rembg library and OpenCV to “cut and paste” lettuce plants onto new backgrounds, expanding their dataset 9-fold (from 161 to 1224 images). This synthetic expansion allowed their Vision Transformer to achieve an R 2 of 0.89 despite the limited initial sample size. Similarly, ref. [27] introduced “Glass Noise” augmentation using the Albumentations library, mathematically simulating the visual distortion caused by wet grow pipes and greenhouse glazing to ensure model robustness in reflective aquaponic environments.

3.5.2. Transfer Learning and Pre-Training

Given the small size of agricultural datasets, Transfer Learning is universally adopted. Most architectures were initialized with weights pre-trained on ImageNet [20] or COCO [6]. However, the domain gap remains significant; ref. [10] noted that general-purpose features (edges/blobs) transfer well, but specific physiological markers like “tip-burn” require extensive fine-tuning. Ref. [28] addressed this by replacing the final softmax classification layers of pre-trained networks with regression heads, effectively repurposing the “knowledge” of 1000 ImageNet classes for specific morphological prediction. Table 1 summarizes the characteristics of these datasets, highlighting the disparity in size and the heavy reliance on private data.
Table 1. Detailed characteristics of datasets utilized in the reviewed studies, highlighting the prevalence of private data and augmentation strategies.
ReferenceSizeRes.AugmentationAccess
[29]8007 ImgsN/ARotation, Trans., Reflection, ScalePrivate
[20]3888 (RGB) + 3888 (D)848   × 480Rotation, Brightness, ContrastPublic (GitHub)
[6]2333640   × 640Brightness, Flip, RotationPrivate
[26]2150100   × 100Rotated, Shifted, FlippedPrivate
[10]1124 (Orig)/2040 (Aug)3000   × 4000Rotation, FlippingPrivate
[15]161 (Orig)/1224 (Aug)3024   × 3024Synthetic Backgrounds (Rembg)Private
[11]80 (Base)/880 (Final)1280   × 800Shadow, Blur, Persp., FlipPrivate
[8]8251640   × 3648Flip, Rot, Bright, ContrastPrivate
[27]520N/AFlip, Rot, Glass noisePrivate
[30]447224   × 224Not listedPrivate
[2]3763280   × 2464Random FlipPrivate
[28]300299   × 299N/APrivate
[7]208640   × 640None listedPublic (Kaggle)
[3]Time-seriesD415None listedPublic (DOI)
[1]Real-timeN/ALighting Sim (+/−50 Bright)Public (GitHub)

3.6. Algorithmic Performance and Hybrid Architectures

A comparative analysis reveals a distinct performance hierarchy where architectural choices are driven by the specific trade-off between floating-point operations (FLOPs) and feature complexity. To facilitate rigorous cross-study comparisons and ensure reproducibility within the domain of agricultural CV, establishing a standardized reporting matrix is critical. This review emphasizes a universal framework tailored to specific analytical tasks: Mean Average Precision at an Intersection over Union of 0.5 (mAP@0.5) is the primary standard for localization, segmentation, and disease detection tasks; the Coefficient of Determination ( R 2 ) and RMSE are essential to evaluate biomass, height, and yield regression models [13,14]; and GFLOPs alongside Frames Per Second provide crucial benchmarks for the computational efficiency and latency of models intended for edge computing deployments [31].

3.6.1. Efficiency Mechanisms in Lightweight Architectures

In the domain of resource-constrained inference, ref. [8] established that ShuffleNet (80.89 ms) was approximately three times faster than SqueezeNet (238.22 ms) despite having a larger parameter count (1.37 M vs. 1.24 M). The study attributes this counter-intuitive result to the massive reduction in calculation volume: ShuffleNet required only 0.04 GFLOPs per image compared to SqueezeNet’s 0.35 GFLOPs. This efficiency is driven by the use of Pointwise Group Convolutions combined with Channel Shuffling, which allows for information exchange across channels without the heavy computational cost of dense convolutions.
Similarly, ref. [11] optimized YOLOv8n-seg by integrating a FasterNet backbone The key innovation was the utilization of P-Conv, illustrated in Figure 2, which apply convolution to only a subset of input channels while leaving the rest untouched. Combined with a cumulative-sum channel growth strategy ( + 16 channels/block) rather than exponential growth ( 2 n ), this reduced the model’s load from 11.97 GFLOPs to 5.96 GFLOPs, increasing mAP to 99.5% while cutting inference time by 26%.

3.6.2. Physics-Informed Hybrid Frameworks

Beyond pure DL, a sophisticated class of “Hybrid” models has emerged to enforce biophysical consistency. Ref. [16] pioneered a system where Random Forest is used not as a final predictor, but to estimate intermediate biological parameters, specifically Total Leaf Area (T-LA), which determines the Canopy Cover (CC). This data-driven output is then coupled with the physics-based Penman–Monteith equation to calculate plant-specific evapotranspiration ( E T c p ):
E T c p = ( E T 0 × K c ) × C C
where E T 0 is the reference evapotranspiration and K c is the crop coefficient. This allows the model to dynamically scale water usage based on real-time morphology rather than static constants.
Taking a meta-heuristic approach, ref. [9] employed a GSA to optimize a Recurrent Neural Network. In this architecture, the “position” of mass agents in the search space maps directly to the neuron counts ( N 1 , N 2 , N 3 ) of the hidden layers. The resulting optimized topology achieved 93.61% accuracy for nitrate prediction, drastically outperforming standard SVM models (46%) by effectively navigating the search space for structural hyperparameters.

3.7. Disease and Stress Detection

A substantial subset of the reviewed literature focused on the early identification of physiological stress and pathogen infection. However, the results reveal a critical dependency on lighting conditions and symptom severity.

3.7.1. Spectral Limitations in RGB Imaging

Detecting necrosis under the red/blue LED lighting common in plant factories remains a significant failure mode. Ref. [6] evaluated object detection models on “tip-burn” (calcium deficiency) datasets trained directly on purple-tinted images without white-balancing. The study found that standard YOLOv4 failed catastrophically, achieving zero detections in some test cases because the necrotic brown spots lost contrast against the dark, purple-lit healthy tissue.
In contrast, YOLOv5 achieved a mAP of 82.8%. The authors attributed this not to data augmentation, but to auto-learning bounding box anchors, which allowed the model to adaptively learn the optimal anchor sizes for small necrotic spots, unlike the fixed anchors of v4. Nevertheless, false positives remained high due to spectral noise. Higher accuracies reported by others, such as [30] (93.3% with MobileNetV2), must be interpreted with caution; their dataset utilized flash photography that artificially restored green colour fidelity, avoiding the “purple blindness” problem inherent in passive monitoring.

3.7.2. Nutrient Deficiency Differentiation

Regarding specific nutrient imbalances, ref. [8] achieved >99% accuracy using ShuffleNet. However, a deep analysis of the confusion matrix reveals that calcium (-Ca) deficiency was the easiest to detect (100% accuracy) because its symptom, namely inner leaf tip-burn or rotting of the growth point, is morphologically distinct.
In contrast, potassium (-K) and magnesium (-Mg) were the hardest to distinguish, as Grad-CAM visualization showed the models struggled to localize specific interveinal chlorosis patterns, often looking at the whole plant instead. Crucially, the authors admitted a selection bias: images were collected only after plants showed “obvious deficiency symptoms”, bypassing the critical challenge of early-stage diagnosis where symptoms are ambiguous.

3.7.3. Edge Diagnostics Limitations

While detection is accurate on servers, edge deployment faces hardware bottlenecks. Ref. [32] implemented a health classification system on a Raspberry Pi 4, achieving 90% accuracy. However, the study noted that performance was “limited by microprocessor speed,” suggesting that while the Pi 4 is sufficient for static “stop-and-stare” diagnostics, it lacks the frame rate required for high-speed robotic scanning systems, validating the need for the lighter architectures (like ShuffleNet) identified in Section 3.7.

4. Discussion

4.1. The Challenge of Data Scarcity and Generalization

A critical finding of this review is the systemic lack of large-scale, public datasets for VF. Unlike general CV domains backed by massive libraries (e.g., COCO, ImageNet), researchers in CEA are frequently forced to generate custom datasets, leading to extreme disparities in data volume.
The Data Volume Gap: The review reveals a significant divide in dataset magnitude. On the upper end, ref. [29] utilized the largest reported dataset of 8007 images for disease classification. In stark contrast, valid experimental studies operated with minimal data; [33] developed a decision support system using only 90 distinct images, while [11] relied on a base set of just 80 images to validate an instance segmentation model. This reliance on micro-datasets raises concerns about the statistical robustness of reported high accuracies (often > 95 % ) when models are exposed to unseen variability.
Synthetic Augmentation as a Necessity: To bridge this gap, reliance on synthetic data has evolved beyond simple geometric transformations. Ref. [15] increased their training set 9-fold by using OpenCV to synthetically replace image backgrounds, helping the model generalize to different environments. Furthermore, ref. [6] explicitly recommended Generative Adversarial Networks as a necessary tool to simulate stress conditions (like tip-burn) that are difficult to induce biologically in controlled crops.

The Destructive Validation Paradox in Temporal Modelling

While the primary operational advantage of CV is continuous, non-invasive monitoring, a fundamental methodological flaw persists within the reviewed literature: ground-truth biomass values for model validation are predominantly acquired via destructive sampling [2,3,15]. Destructive weighing makes it impossible to obtain true continuous time-series data from an individual plant, meaning long-term temporal validation for growth prediction models relies heavily on linear interpolation between disparate samples [3]. This reliance introduces a severe vulnerability into the temporal robustness of sequence-based models.
To reduce reliance on destructive single-plant sampling and break this validation bottleneck, future experimental designs must adopt rigorous statistical proxies. Techniques such as batch-averaging across highly controlled sub-populations or employing leave-one-out cross-validation frameworks can statistically approximate continuous individual growth trajectories without sacrificing the physical specimen. Furthermore, the integration of advanced non-destructive sensor modalities presents a pathway to invert biomass metrics mathematically. By deploying LiDAR to capture high-resolution 3D volumetric point clouds, or utilizing multispectral cameras to correlate specific spectral reflectance indices with cellular density and water weight, researchers can establish reliable, proxy-based ground truths that circumvent the need for physical harvesting entirely.

4.2. The Influence of Light Spectrum and Canopy Occlusion on Model Generalization

The transition from laboratory prototypes to commercial vertical farms faces significant physical hurdles, specifically spectral interference and canopy occlusion, that pure algorithmic improvements cannot solve.
The Spectral Gap: The physical illumination characteristics of the cultivation environment fundamentally dictate the efficacy of CV models, revealing a sharp divergence in the visual processing challenges faced by Group A (PFAL) and Group B (Greenhouse) systems.
In fully artificial light systems (Group A), DL models must contend with a severe “Spectral Gap”. PFALs predominantly utilize specific red/blue LED spectra to maximize photosynthetic efficiency, which artificially distorts the natural chromaticity of the plant canopy. This creates a purplish-magenta visual environment that heavily masks critical physiological anomalies. Standard RGB-trained object detection architectures suffer catastrophic domain shift under these spectral conditions. For instance, ref. [6] demonstrated that standard YOLO models (specifically YOLOv4) failed entirely, achieving zero detections for tip-burn necrosis under red/blue LEDs, because the necrotic brown spots lost all visual contrast against the dark, purple-lit healthy foliage. Consequently, detecting diseases or stress in Group A necessitates either the physical introduction of white LEDs to normalize the spectrum, or the transformation of images into robust colour spaces (e.g., HSV) to decouple chromaticity from the distorted illumination intensity.
Conversely, CV deployed in natural-light greenhouse environments (Group B) is unencumbered by artificial purplish-magenta colour casts but is constrained by variable solar illumination and dynamic structural shadowing. Greenhouse models must process images subjected to diurnal fluctuations in the Daily Light Integral (DLI) and shifting sun angles. As highlighted by [5,17], structural elements like multi-layer stereoscopic cultivation frames cast deep, uneven shadows on lower canopy layers. This high-contrast, variable illumination complicates image segmentation and requires highly robust feature extraction to prevent over-segmentation or occlusion errors caused by the dynamic interplay of direct sunlight and structural shadows. Thus, comparing the two modalities confirms that while greenhouse systems require CV models resilient to variable luminosity and high-contrast shadowing, PFAL systems demand architectures mathematically robust against intense chromatic distortion and spectral masking.
Biological Feature Alteration: This issue extends beyond simple colour casts. Ref. [34] demonstrated that specific artificial light spectra induce physiological changes, such as the production of flavonoids, which alter the physical texture of the leaf. Consequently, texture-based features learned from sunlight-grown lettuce are mathematically distinct from those of LED-grown lettuce. This implies that “Domain Adaptation” is not just about colour normalization; it requires retraining models on datasets that capture these unique morphological phenotypes.
The Occlusion Barrier: As lettuce plants mature, overlapping leaves prevent top-down cameras from capturing the full canopy, leading to underestimations of biomass. Ref. [17] highlighted this as a critical limitation, noting that top-view images fail when the foliage of neighbouring plants overlaps. While RGB-D sensors helped maintain height measurement accuracy in dense canopies [11], they could not fully reconstruct the hidden biomass volume. Consequently, ref. [10] explicitly proposed the integration of side-view imaging to capture features hidden from the overhead perspective, while [17] suggested image stitching to create panoramic views of the entire grow bed.

4.3. Hardware Realities: Durability and Edge Bottlenecks

A clear dichotomy exists between the high accuracies reported in server-based research and the realities of deployment in harsh, humid environments.
The Inference Bottleneck: Studies utilizing high-end workstations (e.g., NVIDIA RTX 3090) consistently report R 2 > 0.95 [2]. However, when deploying to edge devices, performance bottlenecks emerge. Ref. [32] noted that standard CNNs struggled with the computational load on a Raspberry Pi 4. To resolve this, the field is shifting toward architectural efficiency. Ref. [11] demonstrated that replacing the standard YOLO backbone with FasterNet reduced the model’s load from 11.9 GFLOPs to 5.9 GFLOPs, proving that future CEA automation lies in architectures designed to minimize FLOPs.
Durability and IP Ratings: A frequently overlooked challenge is the harsh operating environment. High humidity and nutrient mists pose significant risks to standard consumer-grade electronics. As noted in Section 3.3.2, the rapid corrosion of consumer-grade depth sensors underscores the necessity for IP-rated hardware in commercial deployment. While [3] successfully utilized Intel RealSense sensors for short-term data collection, long-term viability requires industrial-grade protection to survive wash-down conditions.

4.4. Future Directions: Unified and Physics-Informed Systems

The reviewed literature highlights a critical gap: while individual models exist for weight prediction, disease detection, and nutrient analysis, they rarely exist as a unified system.
Physics-Informed Architectures: Pure data-driven DL is reaching a plateau. The next generation of agricultural intelligence must be physics-informed. As demonstrated by [9,16], hybrid models that embed immutable biological laws, such as evapotranspiration equations or Newtonian optimization, into the AI pipeline offer a solution to the generalization crisis, ensuring reliability even when training data is limited.
Standardized Benchmarks and Edge Integration: To resolve the data scarcity crisis, the field requires a systemic intervention parallel to the “ImageNet” moment in general CV. While we propose the establishment of “LettuceNet”, a standardized, multi-spectral public repository specifically annotated for physiological disorders under varying LED spectra, immediate technical countermeasures are equally critical. Rather than relying solely on the slow aggregation of public data, future implementations must aggressively adopt Semi-Supervised Learning and Domain Adaptation. By leveraging massive general datasets (e.g., ImageNet or COCO) for transfer learning, a strategy already demonstrating foundational efficacy in agricultural models [6,20], systems can establish robust feature extraction parameters before applying Unsupervised Domain Adaptation to align these generalized features with the specific, purplish-magenta visual domain of plant factories. Furthermore, pseudo-labelling techniques within SSL frameworks can utilize the vast streams of unlabelled video data generated by automated monitoring rails, artificially scaling dataset utility without the prohibitive labor cost of manual annotation. Ultimately, integrating these data-sparsity mitigations with unified, lightweight edge architectures will bridge the divide between isolated algorithmic success and practical, on-farm decision support.

5. Limitations of the Review

While this systematic review followed PRISMA 2020 guidelines, certain limitations exist. First, the restriction to English-language publications introduces a linguistic bias; given that 66% of the included studies originated from Asia (Section 3.2), the exclusion of Chinese and Japanese literature likely omits significant commercial advancements in the PFAL sector. Second, the exclusion of grey literature to ensure peer-reviewed quality may overlook proprietary innovations currently deployed by industry leaders (e.g., Plenty, AeroFarms) that have not yet reached academic journals. Finally, the rapid velocity of DL research presents a temporal challenge; architectures analysed as state-of-the-art during the search period (e.g., YOLOv8) are already being superseded by newer iterations (e.g., YOLO11), necessitating continuous updates to algorithmic benchmarks.

6. Conclusions

Notwithstanding the limitations regarding language bias and rapid algorithmic evolution, the analysis of the selected 34 studies clarifies the trajectory of AI in VF, identifying a critical pivot from passive monitoring to active, physics-informed control.
Addressing RQ1 (architectures), the field is undergoing a bifurcation. While ViT and heavy CNNs dominate server-side research for their high spatial accuracy ( R 2 > 0.95 ), academic prototypes are aggressively shifting toward lightweight architectures. Mechanisms like P-Conv (FasterNet) and Channel Shuffling (ShuffleNet) have emerged as the academic standard for edge computing, enabling a 26% increase in inference speed to support real-time actuation on low-power devices.
Regarding RQ2 (parameters), yield estimation and “tip-burn” detection remain the primary targets. However, a major reliability gap exists due to the “Spectral Gap”, the inability of standard RGB models to generalize under the red/blue LED lighting common in commercial facilities. As evidenced by the failure of YOLOv4 in purple-lit environments, future parameters must be monitored using spectrally agnostic features or depth-based sensors to survive the domain shift from lab to farm.
Finally, for RQ3 (challenges), the “Data Scarcity Crisis” is the central bottleneck, with 87% of datasets remaining private. This fragmentation forces researchers to rely on synthetic augmentation (GANs) and prevents the establishment of universal benchmarks. Consequently, the review concludes that the next paradigm must move toward biophysically constrained AI, hybrid systems that anchor DL predictions to immutable biological laws (e.g., evapotranspiration), thereby providing the robustness required to transition from experimental prototypes to commercial production.

Author Contributions

Conceptualization, N.L.J., D.R. and V.C.; methodology, N.L.J., D.R. and V.C.; software, N.L.J., D.R. and V.C.; validation, N.L.J., D.R. and V.C.; formal analysis, N.L.J., D.R. and V.C.; investigation, N.L.J., D.R. and V.C.; resources, N.L.J., D.R. and V.C.; data curation, N.L.J., D.R. and V.C.; writing—original draft preparation, N.L.J., D.R. and V.C.; writing—review and editing, N.L.J., D.R. and V.C.; visualization, N.L.J., D.R. and V.C.; supervision, D.R. and V.C.; project administration, D.R. and V.C.; funding acquisition, D.R. and V.C. All authors have read and agreed to the published version of the manuscript.

Funding

This paper was funded by national funds and FCT/MCTES (PIDDAC), through the Foundation for Science and Technology, I. P. (FCT) under the scope of the project UID/05549/2025 (https://doi.org/10.54499/UID/05549/2025) and LASI-LA/P/0104/2020 (https://doi.org/10.54499/LA/P/0050/2020).

Data Availability Statement

No new data were created or analyzed in this study. Data sharing is not applicable to this article.

Conflicts of Interest

The authors declare no conflicts of interest.

Appendix A

Table A1. Summary of included studies (N = 34) detailing crop, system type, AI algorithm, and key results.
ReferenceCropSystemAI AlgorithmInput DataTargetKey ResultLimitations/Future WorkDeployment Hardware (Edge/Cloud)
[1]LettuceIndoor FarmCloud IoTEnv sensorsEnergy eff.20% Eff.Dark lighting conditions caused over-segmentation due to sensor noise.Cloud
[2]ButterheadPlant FactoryCNNRGB (Linear)Weight pred. R 2 = 0.95Data acquisition limited to partial crop shapes; needs full coverage.Cloud
[3]LettuceGreenhouseDeepLabv3+RGB-DSpacingMAE = 22 gCoverage metric fails as spacing decision parameter in late growth stages.Cloud
[4]LettuceHydroponicsFuzzy LogicPPFD/DLIGrowth mon. R 2 = 0.98Lacks integrated nutrient management and microbiological testing.Edge
[5]LettuceFrameGenetic AlgoStruct. dataFrame optim.ValidatedVariability in plant responses to light qualities was not fully considered.
[6]LettuceIndoor FarmYOLOv5RGB (LEDs)Tip-burn84.1% mAPYOLOv4 failed (0 detections) under red/blue LED due to colour shift.Cloud
[7]LettuceHydroponicsEfficientNetRGB ImagesAbnormal leaf99.4% AccConstraints with insufficient feature extraction and overlapping patterns.Cloud
[8]ButterheadPlant FactoryShuffleNetRGB (Colour)Deficiency ID99.9% Acc.Tested on artificially controlled data; likely poor performance in real farms.Cloud
[9]LettuceAquaponicsHybrid GSA-RNNRGB + SensorsNPK pred.93.6% Acc.SVM models required significantly high inference times compared to RNN.
[10]LettuceHydroponicsYOLOv7RGB (Phone)Seedling defect97.2% mAPDataset imbalance led to lowest accuracy under white light conditions.Cloud
[11]LettuceHydroponicsYOLOv8n-segRGB-DHeight meas.94.3% AccColour-based crop segmentation is susceptible to light environment changes.Cloud
[12]LettucePlant FactoryBO-GRU-BiLSTM (Bayesian-Optimized Hybrid RNN)Time-series crop growth metrics (height, leaf count, projected area) & environmental data (light, temp, humidity, CO2)Harvest time prediction R 2 = 0.826 ± 0.029, RMSE = 1.532, MAE = 1.278. Inference latency of 0.201 ms/sample.Conducted in a single controlled environment. Future work requires cross-environment validation and integration of multispectral/root-zone modalities.Cloud
[13]LettuceIndoor Vertical FarmingTwo-Stage Pipeline: CNN (Stage 1) + XGBoost/LSTM (Stage 2)Hourly top-down RGB images & aggregate environmental dataReal-time biomass prediction & Yield forecastingStage 1 (CNN): = 99.56%, RMSE = 3.65 g. Stage 2 Forecast: = 95.10% (XGBoost), 94.31% (LSTM); RMSE = 6.63 g and 6.71 g, respectively.Low variability in environmental data restricted model performance differentiation. Depth data from RealSense D405 was too inconsistent and had to be excluded.Cloud
[14]LettuceAeroponic Vertical FarmingUniTriRob (Robust ML Regression Model)Multivariable sensor data (pH, TDS, temp, EC, turbidity, humidity, light intensity, growth)Yield prediction/Biomass forecasting R 2 = 97.8386%, MAE = 0.46. Successfully mitigated outliers and heteroskedastic errors compared to standard models (e.g., SVR).Data sourced exclusively from a single controlled aeroponic setup. Future work must publish the dataset to enhance reproducibility and test cross-system viability.Cloud
[15]LettuceIndoor FarmVision Transf.RGB + SensorsGrowth pred.SFW R 2 = 0.96RGB cannot sense mineral/water content changes (weight underestimation).Cloud
[16]ButterheadAeroponicsRandom ForestEnv sensorsBiomass pred. R 2 = 0.94Physics models struggle with calibration; ML models act as black boxes.Edge
[17]LettuceGreenhouseDCNNTop-view RGBLocalizationF1 = 0.986Top-view images fail when foliage of neighbouring plants overlaps.Edge
[18]Plants/FishAquaponics3D CNN-LSTMMultispectralStress detect.95.1% Acc.Validated only in controlled envs; lacks variable light/humidity testing.Edge
[27]RomaineAquaponicsHSV Segm.RGB ImagesChlorosis ID95% AccSystem needs extension to complex backgrounds and multiple crops.Cloud
[20]LettuceHydroponicsResNet50RGB-DBiomass mon.7.3% ErrorModel fails when centre plant is smaller than neighbours due to occlusion.Cloud
[25]Red OakVertical FarmANFIS + CNNLight/ECGrowth param.Error 0.49Average testing error remains around 0.59 despite optimization.Edge
[30]LettucePlant FactoryMobileNetV2RGB ImagesTipburn class.93.3% Acc.Slightly lower precision reported for Inception V3 model architecture.Cloud
[19]LettuceHydroponicsANN (Backprop)Vision feat.Decision supp.Low ErrorSelecting a single representative decision tree from ensemble is future work.Cloud
[34]RomaineVertical FarmMLPTexture feat.Leaf discrim.98.75% Acc.Study limited to indoor controlled envs; natural light impact not assessed.Cloud
[24]LettuceIndoor CEAHybrid ANNReflect/PARPhotosynth.22% YieldDataset constrained by 10-week cycle; rare perturbations underrepresented.Edge
[29]LettuceAeroponicsFine-tuned CNNRGB ImagesDisease ID95.6% Acc.Constraints with insufficient feature extraction and overlapping patterns.Edge
[21]LettuceVertical HydroFuzzy LogicDLI/PPFDSmart light R 2 = 0.99Needs microbiological analysis of leaf shelf-life.
[22]LettuceVertical FarmANN (MLP)DLI/SoilDry weight R 2 = 0.63Prediction model currently only applicable in regions close to the equator.Cloud
[23]ButterheadHydroponicsANN + GAIoT sensorsEnv optim.Low RMSESome inaccuracies reported in datasets and fitness scores.
[26]LettuceVertical FarmMobileNetV2RGB (Robot)Harvest/Disease81.5% Acc.Needs expansion to include environmental control and more disease types.
[28]LettuceAquaponicsDarkNet-53Morph feat.Descriptor pred. R 2 = 0.97Regularization techniques (dropout/batch norm) needed to improve fitting.Cloud
[31]Tomato, Potato, Pepper-bellSmart AgricultureConv-7 DCNN with modified ParNet attention layerPublic Kaggle dataset (augmented RGB leaf images)Leaf disease classification99.18% Accuracy, 99.17% Precision, AUC = 1. High throughput (112.49 FPS, 18.34 s inference, 13.98 GFLOPs).Requires large training datasets and high computational power. Generalizability to real-time, unstructured field lighting remains to be fully evaluated.Cloud
[32]RomaineHydroponicsCNNRGB (RPi)Health class.90% Acc.Performance limited by microprocessor speed and camera module quality.Edge
[33]LettuceHydroponicsTree-FuzzyVision feat.Growth stage91.9% TPRReliance on specific manual feature extraction limits generalizability.Cloud

Appendix B

Appendix B.1. General Characteristics of Included Studies

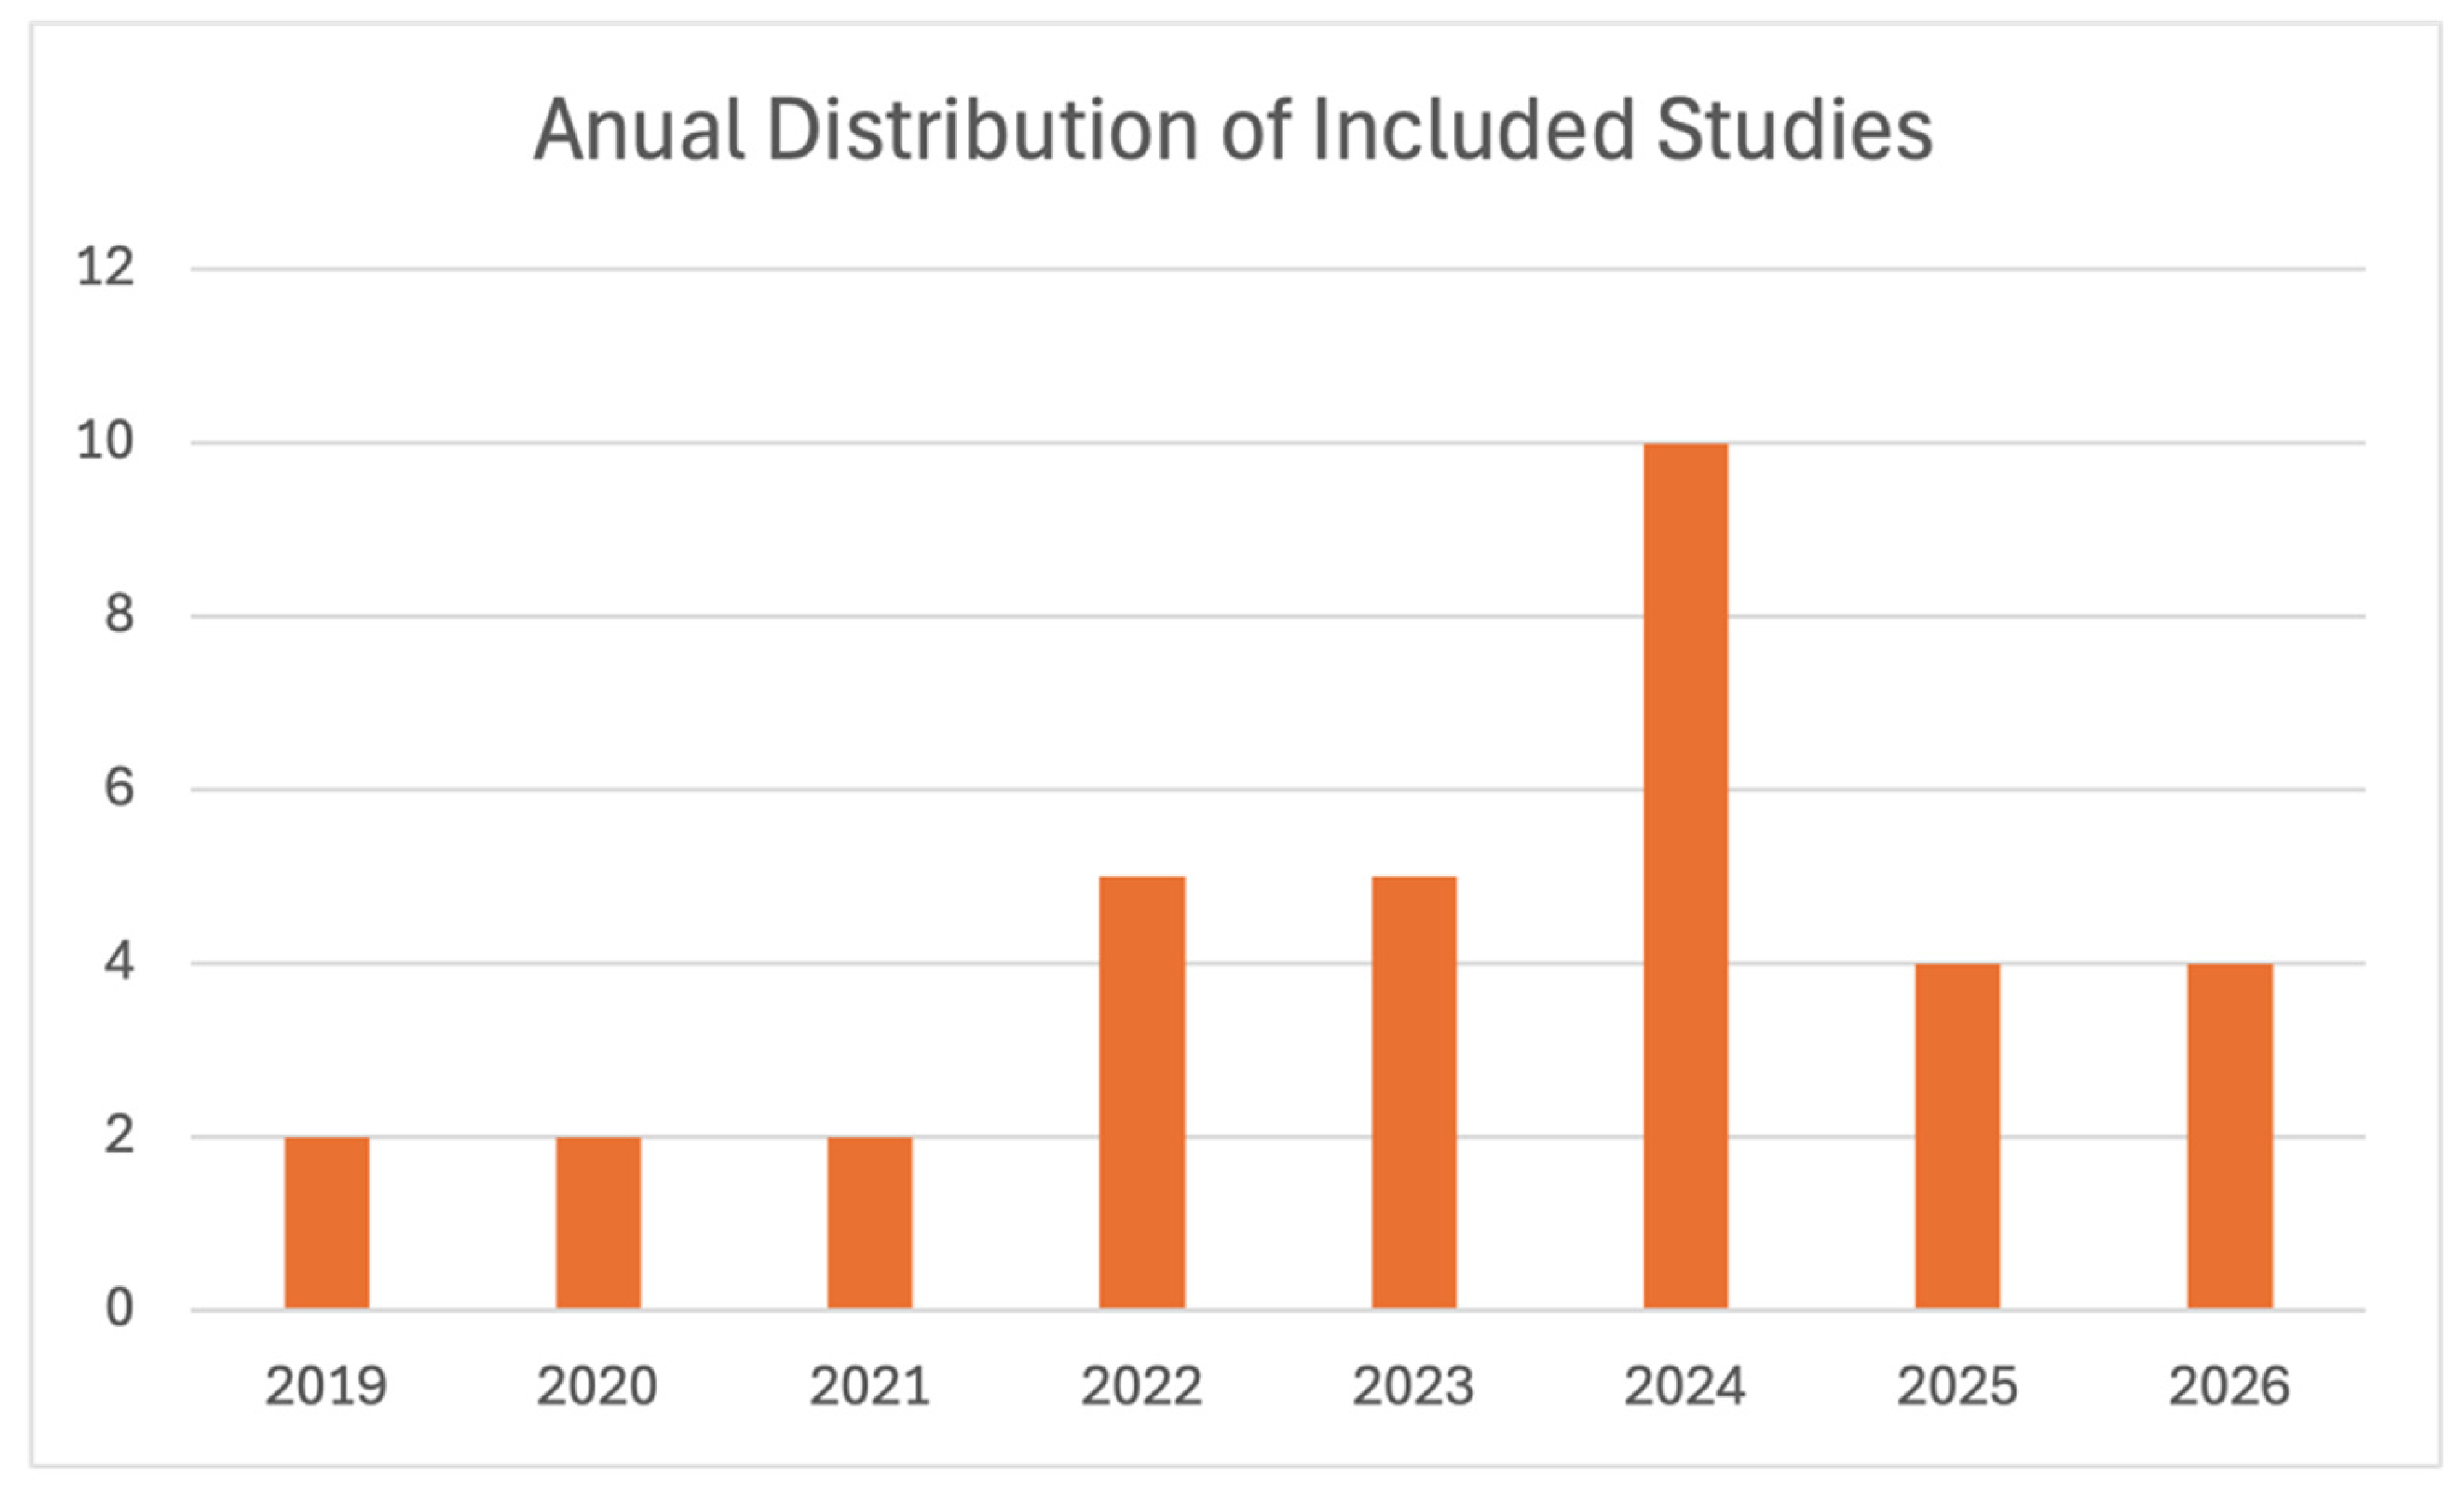
The 34 included studies span the period from 2019 to 2026, illustrating a rapid acceleration in research interest; notably, over 70% of the selected papers were published after 2021. Figure A1 illustrates this annual distribution, highlighting the sharp increase in publications from 2022 onwards.
Figure A1. Annual distribution of the 34 included studies (2019–2026), highlighting the significant acceleration of research interest in AI-based lettuce monitoring from 2022 onwards.
Applsci 16 07717 g0a1

Appendix B.1.1. Geographic and Institutional Distribution

The analysis reveals a distinct geographical concentration, with Asia accounting for 66% of the included studies. This dominance is driven by East Asian nations, specifically South Korea’s [2,15], China’s [11] and Japan’s [6], where research overwhelmingly focuses on “Plant Factory” (PFAL) systems utilizing artificial lighting. In contrast, European studies (e.g., the Netherlands [3], Greece [17]) centre on high-tech greenhouse environments, reflecting regional differences in agricultural infrastructure. Institutional analysis identifies De La Salle University (the Philippines) and the University of Tsukuba (Japan) as primary research hubs, contributing multiple studies on machine vision and physiological disorder detection, respectively. Furthermore, Wageningen University & Research (WUR) serves as a leading European hub for agricultural artificial intelligence; their publicly available, high-fidelity datasets, such as those generated during the international Autonomous Greenhouse Challenge, provide foundational benchmarks for the development, training, and validation of European CEA vision algorithms.

Appendix B.1.2. Publication Venues and Quality

The literature demonstrates a high level of maturity, with 67% of studies published in peer-reviewed journals and 33% in conference proceedings. High-impact open access journals dominate the field, with Agriculture, Sensors, and Frontiers in Plant Science accounting for 30% of the total output. The inclusion of recent articles in Q1 journals such as Scientific Reports [6] validates the methodological rigor of the reviewed body of work.

Appendix B.1.3. Production Systems and Technological Overview

Regarding cultivation systems, hydroponics remains the standard ( N = 25 ), significantly outpacing aquaponics ( N = 4 ) and aeroponics ( N = 3 ). Although [18] evaluates a combined plant and fish aquaponic environment, its algorithmic approach is highly relevant and directly transferable to pure hydroponic lettuce cultivation. The study proposes an AquaVision architecture utilizing few-shot learning to optimize general agricultural parameters and monitor critical water quality metrics, such as pH, dissolved oxygen, and ammonia [18]. This vision-based methodology translates seamlessly to isolated hydroponic or aeroponic lettuce setups, where early-stage physiological stress monitoring remains a primary operational challenge. Crucially for CV, 74% of studies utilized artificial LED lighting, often in red/blue spectra, which noted creates a “purplish grey” visual environment that complicates feature extraction. According to [3,5], only 27% of studies addressed natural light or greenhouse settings, highlighting a potential gap in datasets that account for variable solar illumination.
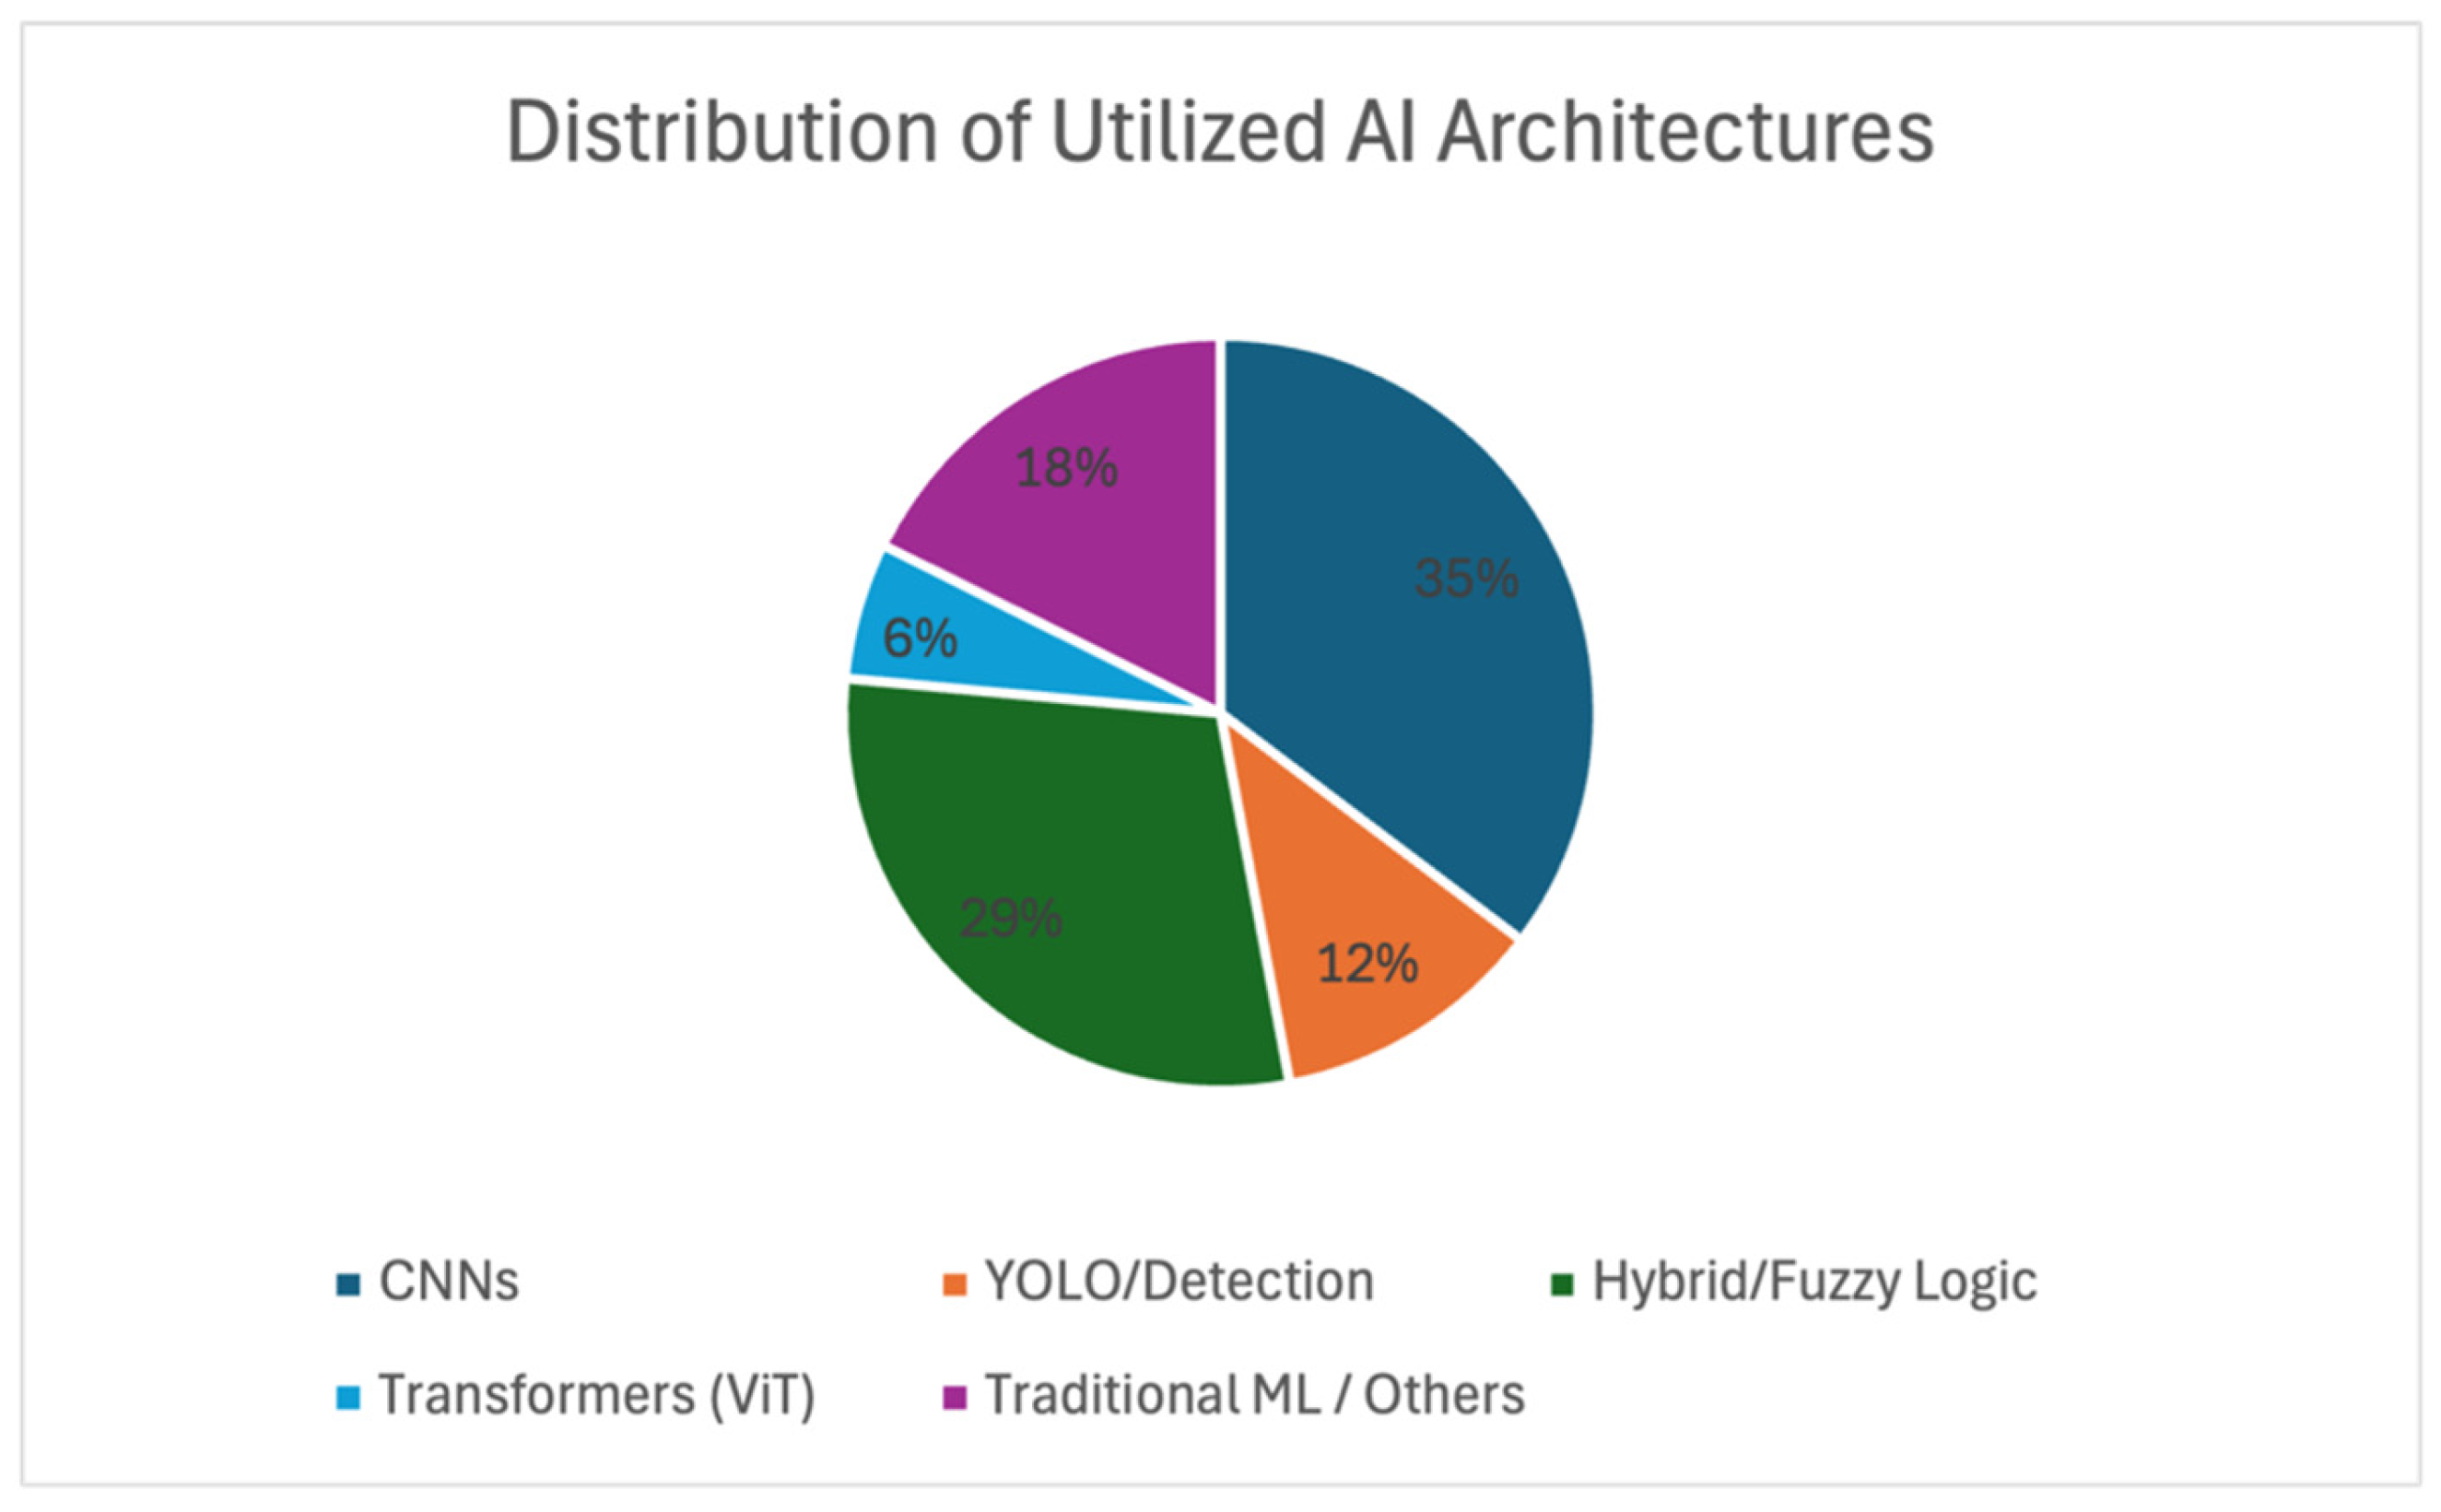
Finally, as illustrated in Figure A2, the algorithmic landscape is dominated by CNNs, though recent years show a diversifying trend toward Hybrid and Object Detection architectures.
Figure A2. Distribution of AI architectures employed across the reviewed studies. CNNs remain the dominant approach (37%), followed by Hybrid/Fuzzy Logic systems (29%) and Object Detection models (12%).
Applsci 16 07717 g0a2

Appendix B.1.4. Literature Categorization by Illumination Environment

To ensure the validity of conclusions regarding spectral interference and model generalization, the included literature has been strictly categorized into two comparative groups based on their cultivation environments and lighting modalities:
Group A: Fully Artificial Light/Plant Factories (PFALs).
Studies conducted in indoor farms, vertical farms, or closed-type plant factories relying entirely on LED or fluorescent artificial lighting [1,2,6,8,9,10,11,13,15,16,18,19,20,24,25,27,29,30,34].
Group B: Natural Light/Greenhouses.
Studies conducted in high-tech greenhouses or stereoscopic cultivation frames utilizing natural solar radiation, supplemented by solar-sharing or dynamic smart lighting [3,4,5,17,21].

References

  1. Kharraz, N.; Revoly, A.; Szabó, I. IoT-Based Adaptive Lighting Framework for Optimizing Energy Efficiency and Crop Yield in Indoor Farming. J. Sens. Actuator Netw. 2025, 14, 59. [Google Scholar] [CrossRef]
  2. Kim, J.S.G.; Moon, S.; Park, J.; Kim, T.; Chung, S. Development of a machine vision-based weight prediction system of butterhead lettuce (Lactuca sativa L.) using deep learning models for industrial plant factory. Front. Plant Sci. 2024, 15, 1365266. [Google Scholar] [CrossRef] [PubMed]
  3. Petropoulou, A.S.; van Marrewijk, B.; de Zwart, F.; Elings, A.; Bijlaard, M.; van Daalen, T.; Jansen, G.; Hemming, S. Lettuce Production in Intelligent Greenhouses—3D Imaging and Computer Vision for Plant Spacing Decisions. Sensors 2023, 23, 2929. [Google Scholar] [CrossRef] [PubMed]
  4. Bernardo, M.S. A Novel Approach of Growing High-Valued Crops (Lactuca sativa) Optimizing Solar-Sharing Smart Illumination Technology Consuming Renewable Energy to Address SDGs. In Proceedings of the 2024 IEEE International Conference on Agrosystem Engineering, Technology and Applications: Integrating Smart Farming and Food Security for a Sustainable Future, AGRETA 2024; Institute of Electrical and Electronics Engineers Inc.: New York, NY, USA, 2024; pp. 33–41. [Google Scholar] [CrossRef]
  5. Jia, D.; Zheng, W.; Wei, X.; Guo, W.; Zhao, Q.; Gao, G. Parametric Design and Genetic Algorithm Optimization of a Natural Light Stereoscopic Cultivation Frame. Agriculture 2024, 14, 84. [Google Scholar] [CrossRef]
  6. Hamidon, M.H.; Ahamed, T. Detection of Tip-Burn Stress on Lettuce Grown in an Indoor Environment Using Deep Learning Algorithms. Sensors 2022, 22, 7251. [Google Scholar] [CrossRef] [PubMed]
  7. Bhamare, A.; Upadhyaya, V.; Bansal, P. Optimized Hydroponic System for Predicting Abnormal Lettuce Leaf using AI Techniques. In Proceedings of the 2024 3rd International Conference on Automation, Computing and Renewable Systems (ICACRS); Institute of Electrical and Electronics Engineers Inc.: New York, NY, USA, 2024; pp. 1428–1433. [Google Scholar] [CrossRef]
  8. Lu, J.; Peng, K.; Wang, Q.; Sun, C. Lettuce Plant Trace-Element-Deficiency Symptom Identification via Machine Vision Methods. Agriculture 2023, 13, 1614. [Google Scholar] [CrossRef]
  9. Concepcion, R.; Dadios, E.; Cuello, J.; Bandala, A.; Sybingco, E.; Vicerra, R.R. Determination of aquaponic water macronutrient concentrations based on Lactuca sativa leaf photosynthetic signatures using hybrid gravitational search and recurrent neural network. Walailak J. Sci. Technol. 2021, 18, 18273. [Google Scholar] [CrossRef]
  10. Hamidon, M.H.; Ahamed, T. Detection of Defective Lettuce Seedlings Grown in an Indoor Environment under Different Lighting Conditions Using Deep Learning Algorithms. Sensors 2023, 23, 5790. [Google Scholar] [CrossRef] [PubMed]
  11. Zhao, Y.; Zhang, X.; Sun, J.; Yu, T.; Cai, Z.; Zhang, Z.; Mao, H. Low-Cost Lettuce Height Measurement Based on Depth Vision and Lightweight Instance Segmentation Model. Agriculture 2024, 14, 1596. [Google Scholar] [CrossRef]
  12. Wang, K.; Zhang, X.; Yin, X.; Wang, H.; Cui, S.; Li, H.; Zhang, Q.; Nan, Y.; Zhang, T. A Novel Bayesian-Optimized Hybrid Recurrent Neural Networks for Predicting Lettuce Harvest Time in Controlled-Environment Agriculture. IEEE Sens. J. 2026, 26, 8581–8590. [Google Scholar] [CrossRef]
  13. Syed, S.; Ahamed, M.S.; Karimzadeh, S.; Omwange, K. Real-Time Lettuce Biomass Forecasting in Indoor Vertical Farming Using Machine Learning Framework. J. ASABE 2026, 69, 105–118. [Google Scholar] [CrossRef]
  14. Rajendiran, G.; Rethnaraj, J.; Zade, S.; Guttula, R.; Pandey, K.K. UniTriRob: A robust machine learning regression model for predicting lettuce yields in aeroponic vertical farming. Sci. Rep. 2026, 16, 15791. [Google Scholar] [CrossRef] [PubMed]
  15. Choi, W.J.; Jang, S.H.; Moon, T.; Seo, K.S.; Choi, D.S.; Oh, M.M. Continuous Growth Monitoring and Prediction with 1D Convolutional Neural Network Using Generated Data with Vision Transformer. Plants 2024, 13, 3110. [Google Scholar] [CrossRef] [PubMed]
  16. Fasciolo, B.; Grasso, N.; Bruno, G.; Chiabert, P. Hybrid machine learning and physics-based model for estimating lettuce (Lactuca sativa) growth and resource consumption in aeroponic systems. Sci. Rep. 2025, 15, 23063. [Google Scholar] [CrossRef] [PubMed]
  17. Kamarianakis, Z.; Perdikakis, S.; Daliakopoulos, I.N.; Papadimitriou, D.M.; Panagiotakis, S. Design and Implementation of a Low-Cost, Linear Robotic Camera System, Targeting Greenhouse Plant Growth Monitoring. Future Internet 2024, 16, 145. [Google Scholar] [CrossRef]
  18. Malik, H.; Hassan, M.; Muhammad, G.; Naz, N.S.; Akhtar, M.; Baloch, M.A. Aquaponics Automation Using Computer Vision. South. J. Comput. Sci. 2025, 1, 11–19. [Google Scholar]
  19. Tepkasetkul, N.; Kittichokwattana, T.; Rattanarueang, N.; Saadi, M.; Pimpin, A.; Phanomchoeng, G. Exploring the Best Environmental Conditions for the Growth of Butterhead Lettuce in a Closed System. In Proceedings of the 2019 IEEE International Conference on Cybernetics and Intelligent Systems (CIS) and IEEE Conference on Robotics, Automation and Mechatronics (RAM); IEEE: New York, NY, USA, 2019. [Google Scholar] [CrossRef]
  20. Buxbaum, N.; Lieth, J.H.; Earles, M. Non-destructive Plant Biomass Monitoring with High Spatio-Temporal Resolution via Proximal RGB-D Imagery and End-to-End Deep Learning. Front. Plant Sci. 2022, 13, 758818. [Google Scholar] [CrossRef] [PubMed]
  21. Abbasi, R.; Martinez, P.; Ahmad, R. Automated Visual Identification of Foliage Chlorosis in Lettuce Grown in Aquaponic Systems. Agriculture 2023, 13, 615. [Google Scholar] [CrossRef]
  22. Lauguico, S.; Concepcion, R.; Tobias, R.R.; Alejandrino, J.; De Guia, J.; Guillermo, M.; Sybingco, E.; Dadios, E. Machine Vision-Based Prediction of Lettuce Phytomorphological Descriptors using Deep Learning Networks. In Proceedings of the 2020 IEEE 12th International Conference on Humanoid, Nanotechnology, Information Technology, Communication and Control, Environment, and Management (HNICEM); Institute of Electrical and Electronics Engineers Inc.: New York, NY, USA, 2020. [Google Scholar] [CrossRef]
  23. Rajendiran, G.; Rethnaraj, J.; Malaisamy, J. Enhanced CNN Model for Lettuce Disease Identification in Indoor Aeroponic Vertical Farming Systems. In Proceedings of the 4th International Conference on Sustainable Expert Systems (ICSES); Institute of Electrical and Electronics Engineers Inc.: New York, NY, USA, 2024; pp. 1407–1412. [Google Scholar] [CrossRef]
  24. Chookaew, S.; Howimanporn, S. Implementing Predictive Analytics to Optimize Parameter for Automation Vertical Farming Using Deep Learning. Int. J. Mech. Eng. Robot. Res. 2025, 14, 262–275. [Google Scholar] [CrossRef]
  25. Bernardo, M.S. DLI and PPFD throughput of Solar and AI-Based Smart Lighting Apply on Illumination Stratums. In Proceedings of the 2023 IEEE 11th Conference on Systems, Process and Control (ICSPC); Institute of Electrical and Electronics Engineers Inc.: New York, NY, USA, 2023; pp. 171–176. [Google Scholar] [CrossRef]
  26. Kumaratenna, K.P.S.; Cho, Y.Y. Detection of Tipburn Stress on Lettuce Grown in a Plant Factory using Artificial Intelligence (AI) Models. Hortic. Sci. Technol. 2024, 42, 711–724. [Google Scholar] [CrossRef]
  27. Loresco, J.M.P.; Gerhard, P.T.; Dadios, E. Hybrid Tree-Fuzzy-Rough Set Decision Support for Determining Plant Growth Using Vision-Based Descriptors. In Proceedings of the 2019 6th NAFOSTED Conference on Information and Computer Science (NICS); IEEE: New York, NY, USA, 2019. [Google Scholar] [CrossRef]
  28. Rathor, A.S.; Choudhury, S.; Sharma, A.; Pachauri, R.K.; Shah, G.; Fatema, N.; Malik, H.; Sharma, V.S.; Kumar, S. DeepGreen: A real-time deep learning system for smart agriculture monitoring. Sci. Rep. 2026, 16, 17825. [Google Scholar] [CrossRef] [PubMed]
  29. Jayasekara, C.; Banneka, S.; Pasindu, G.; Udawaththa, Y.; Wellalage, S.; Abeygunawardhane, P.K.W. Automated Crop Harvesting, Growth Monitoring and Disease Detection System for Vertical Farming Greenhouse. In Proceedings of the 2021 3rd International Conference on Advancements in Computing (ICAC); Institute of Electrical and Electronics Engineers Inc.: New York, NY, USA, 2021; pp. 228–233. [Google Scholar] [CrossRef]
  30. Hao, W.; Tablada, A.; Shi, X.; Wang, L.; Meng, X. Efficiency Analysis of the Photovoltaic Shading and Vertical Farming System by Employing the Artificial Neural Network (ANN) Method. Buildings 2024, 14, 94. [Google Scholar] [CrossRef]
  31. Desiderio, J.M.H.; Tenorio, A.J.F.; Manlises, C.O. Health Classification System of Romaine Lettuce Plants in Hydroponic Setup Using Convolutional Neural Networks (CNN). In Proceedings of the 4th IEEE International Conference on Artificial Intelligence in Engineering and Technology (IICAIET); Institute of Electrical and Electronics Engineers Inc.: New York, NY, USA, 2022. [Google Scholar] [CrossRef]
  32. Loresco, J.M.P.; Dadios, E. Vision-Based Lettuce Growth Stage Decision Support System Using Artificial Neural Networks. Int. J. Mach. Learn. Comput. 2020, 10, 534–541. [Google Scholar] [CrossRef]
  33. Matysiak, B.; Ropelewska, E.; Wrzodak, A.; Kowalski, A.; Kaniszewski, S. Yield and Quality of Romaine Lettuce at Different Daily Light Integral in an Indoor Controlled Environment. Agronomy 2022, 12, 1026. [Google Scholar] [CrossRef]
  34. Olasehinde, A.A.; Blessing, A.O.; Adelagun, A.A.; Obiora, S. Multi-layered modeling of photosynthetic efficiency under spectral light regimes in AI-optimized indoor agronomic systems. Int. J. Sci. Res. Arch. 2022, 6, 367–385. [Google Scholar] [CrossRef]
Figure 1. PRISMA 2020 flow diagram illustrating the selection process of the included studies.
Applsci 16 07717 g001
Figure 2. Schematic comparison of Standard Convolution vs. Partial Convolution (P-Conv). While standard convolution (top) applies filters to all input channels simultaneously ( c × k × k ), P-Conv (bottom) applies filters only to a subset of channels ( c p ), leaving the remaining channels ( c c p ) untouched. This “T-shaped” computation significantly reduces Floating Point Operations (FLOPs) and memory access, optimizing the model for edge deployment, adapted from Zhao et al. (2024) [11].
Applsci 16 07717 g002
Disclaimer/Publisher’s Note: The statements, opinions and data contained in all publications are solely those of the individual author(s) and contributor(s) and not of MDPI and/or the editor(s). MDPI and/or the editor(s) disclaim responsibility for any injury to people or property resulting from any ideas, methods, instructions or products referred to in the content.