2.3. Research Methods
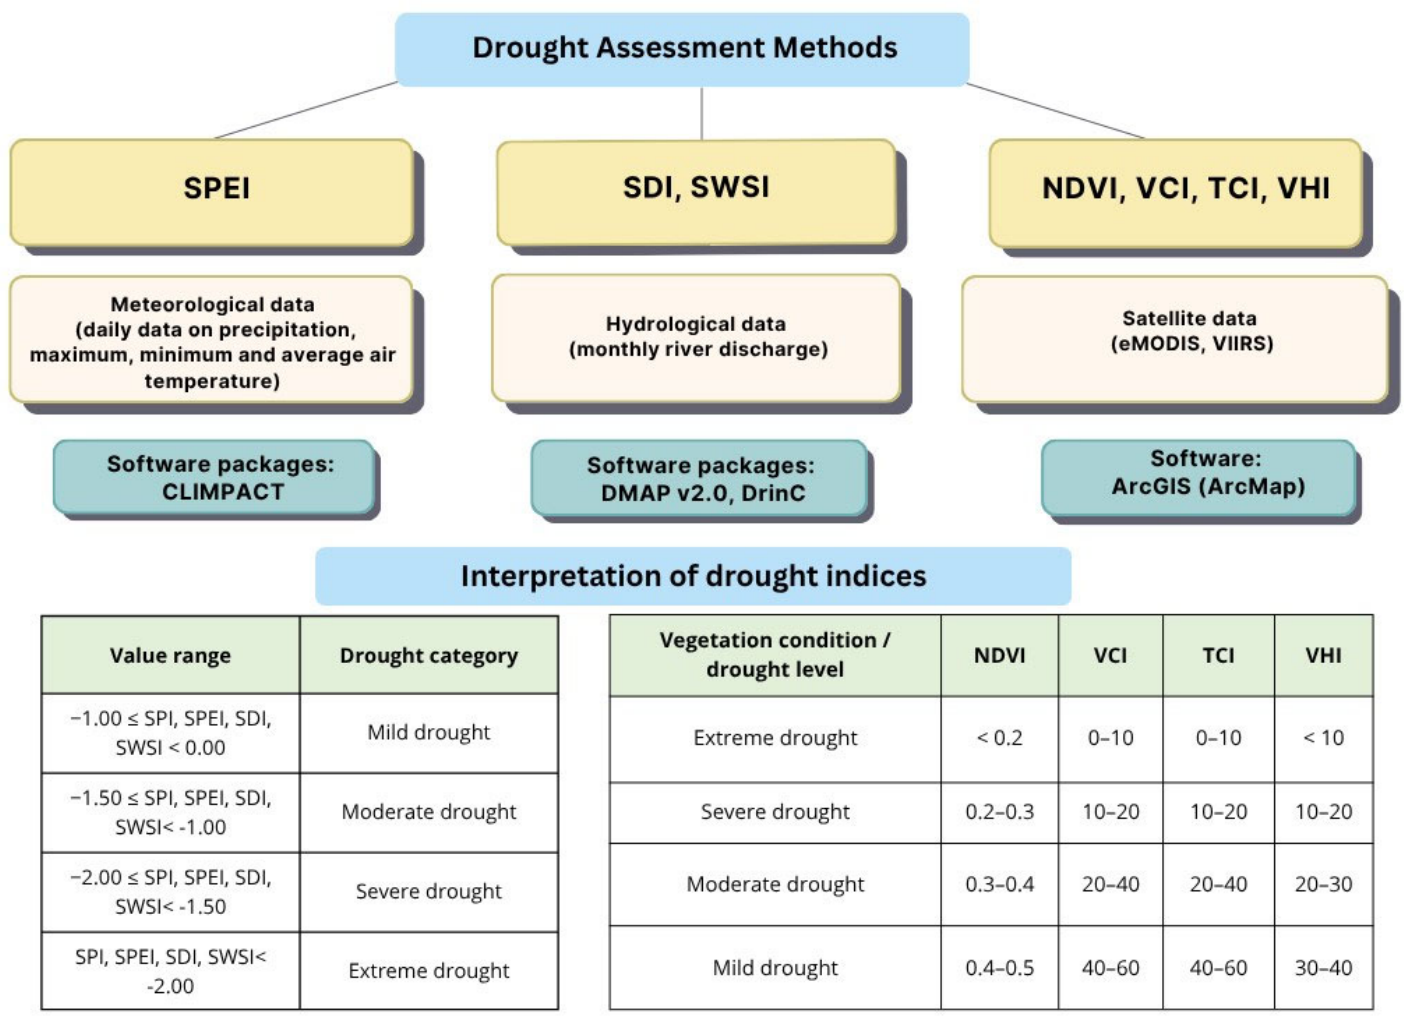
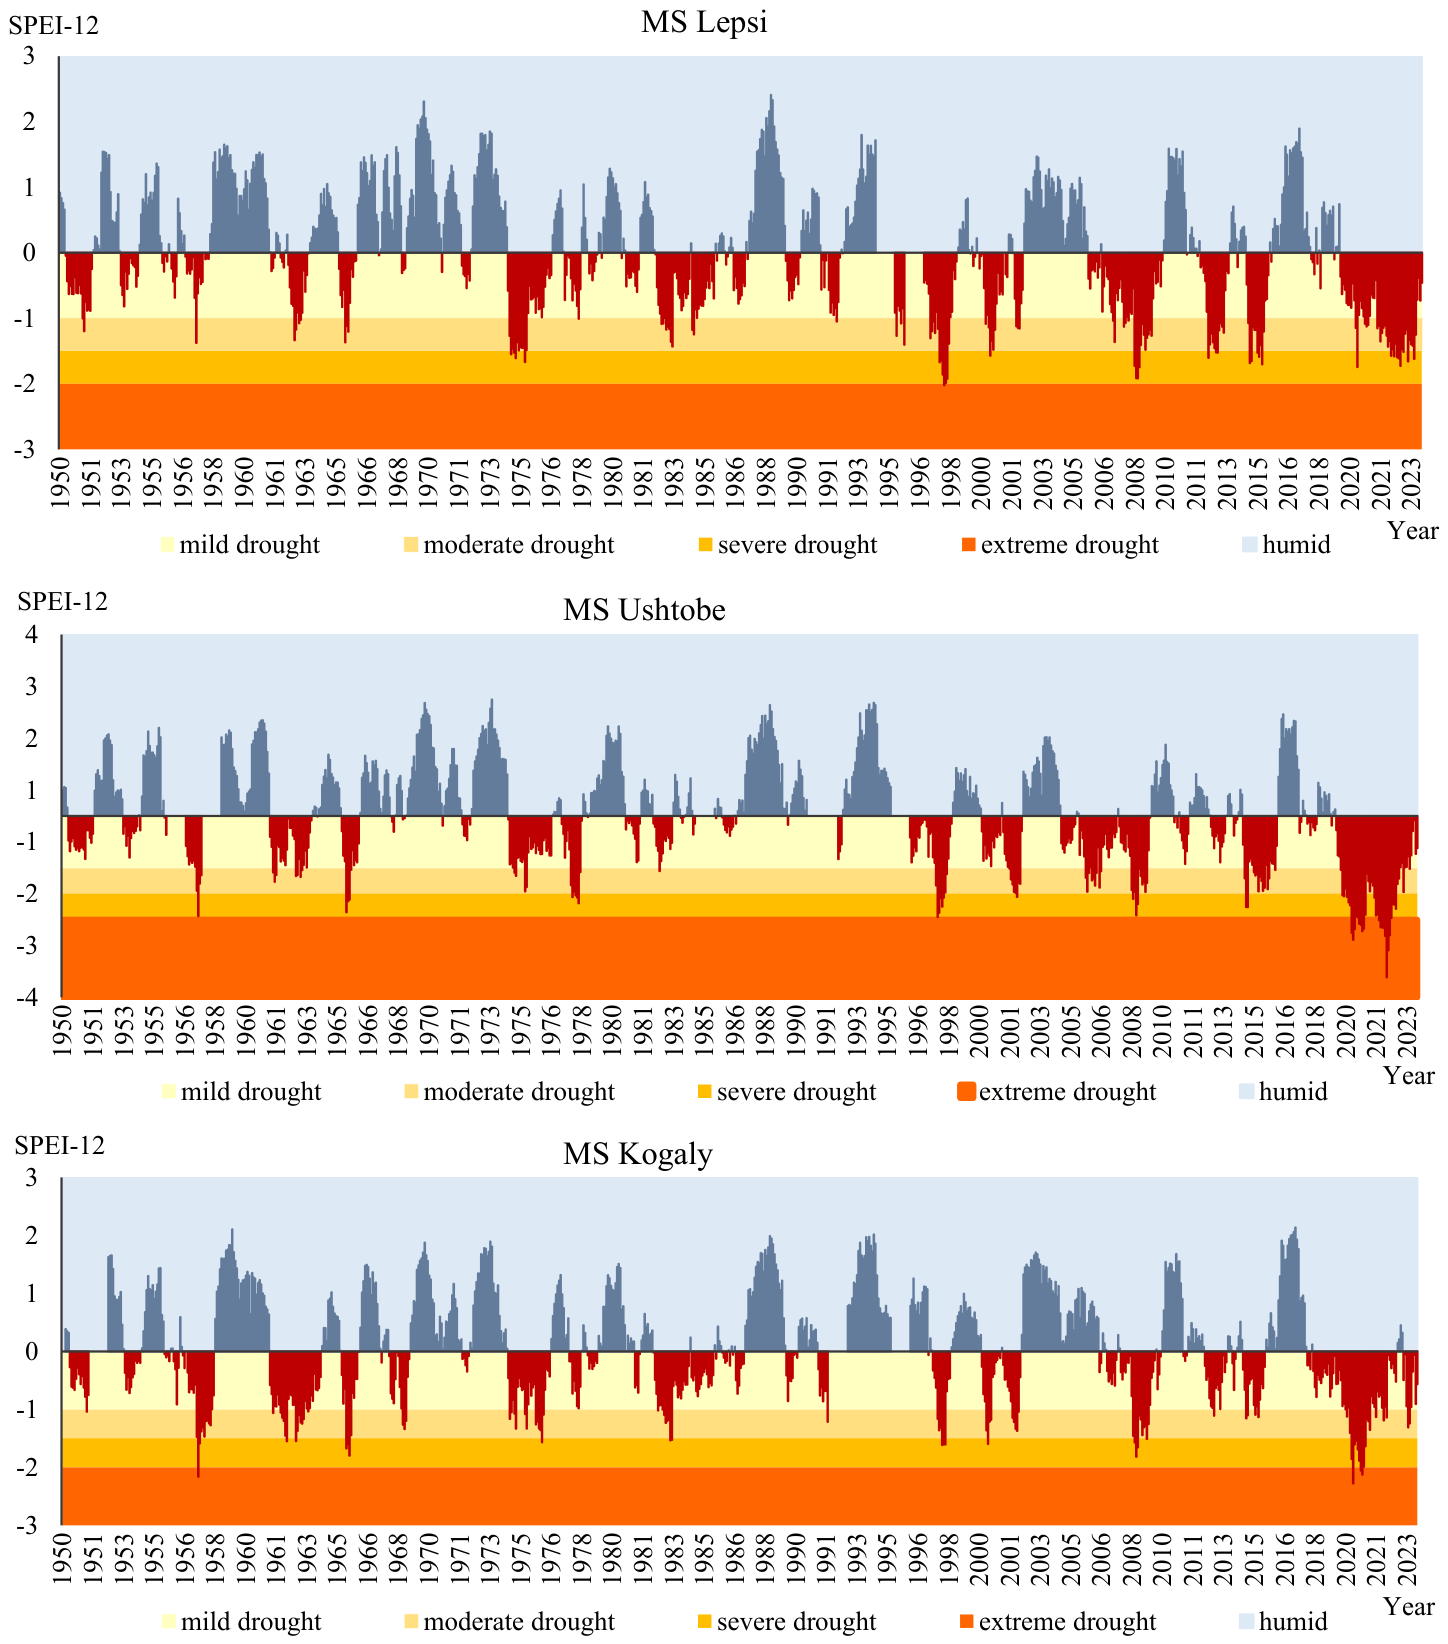
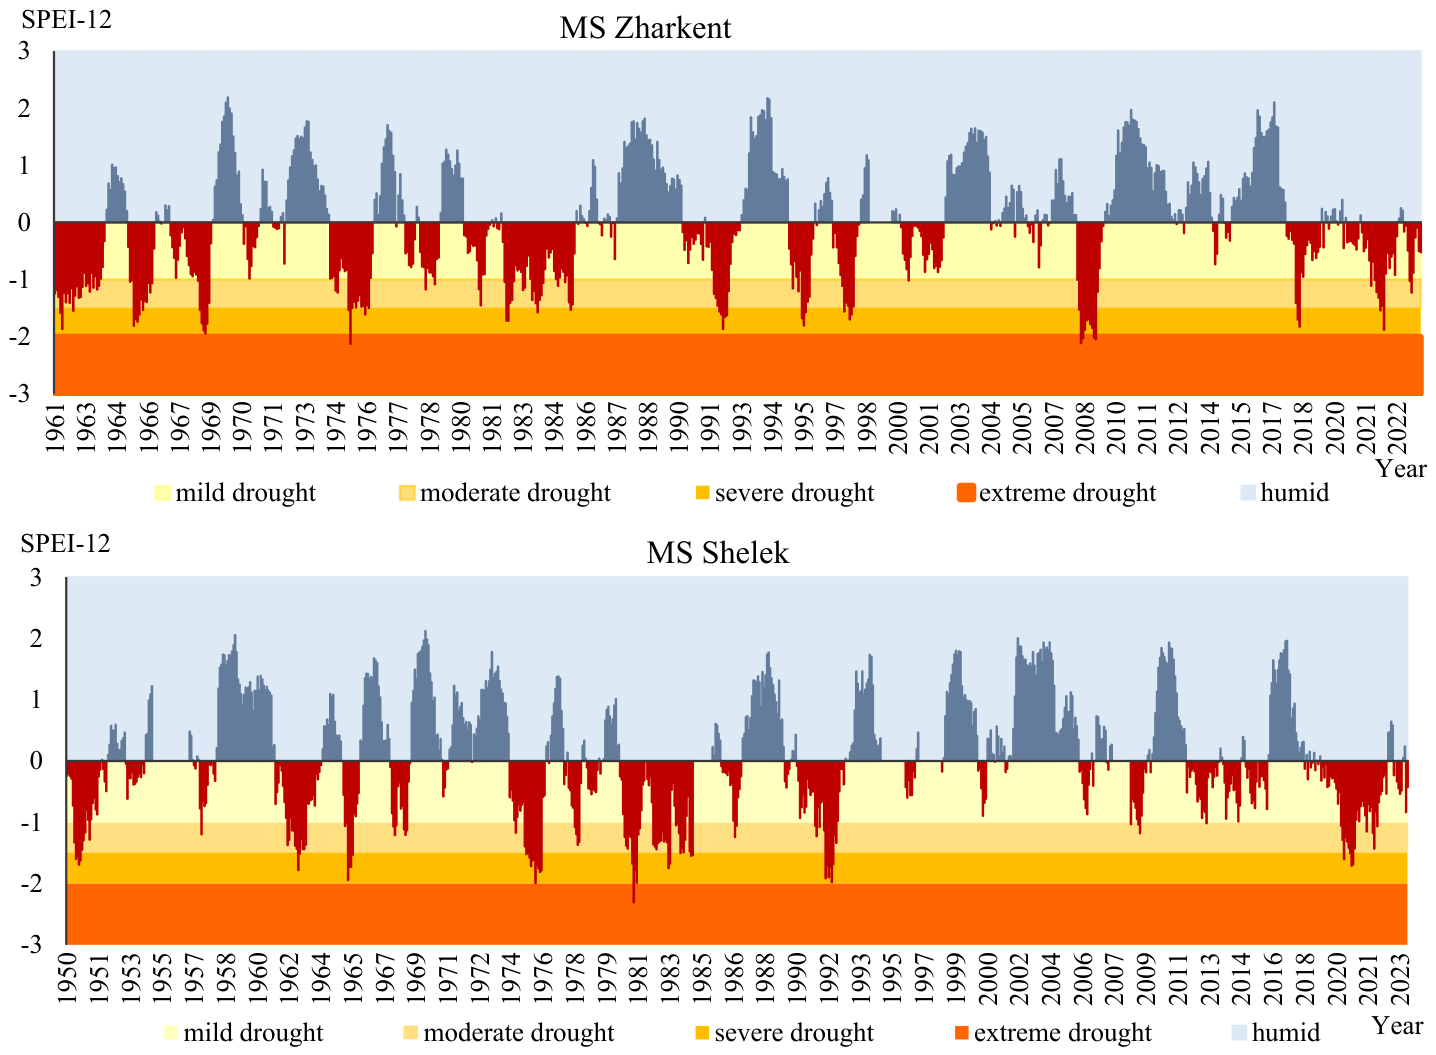
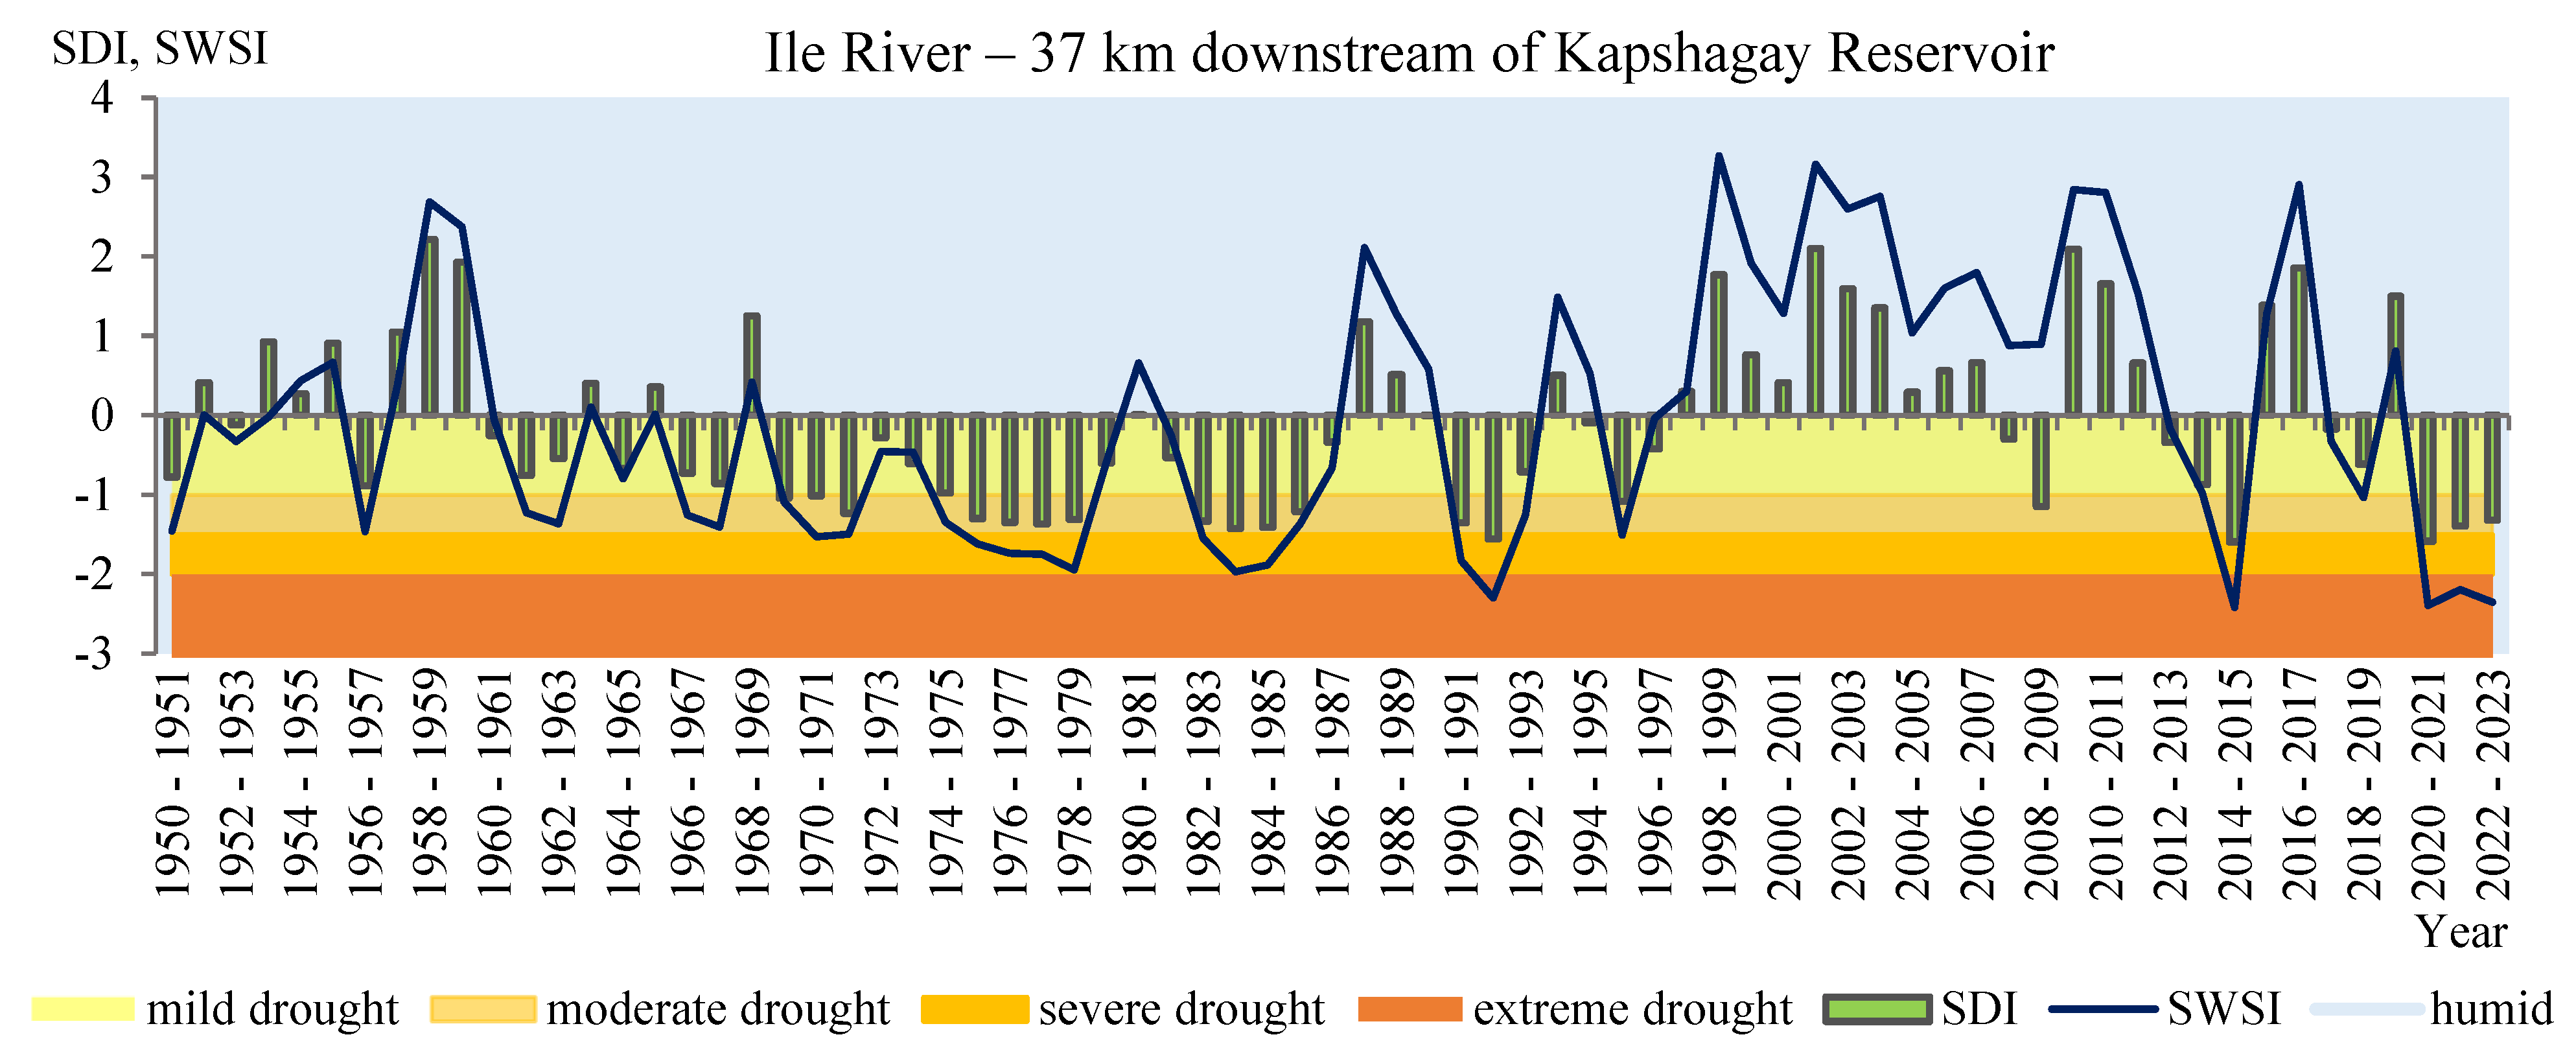
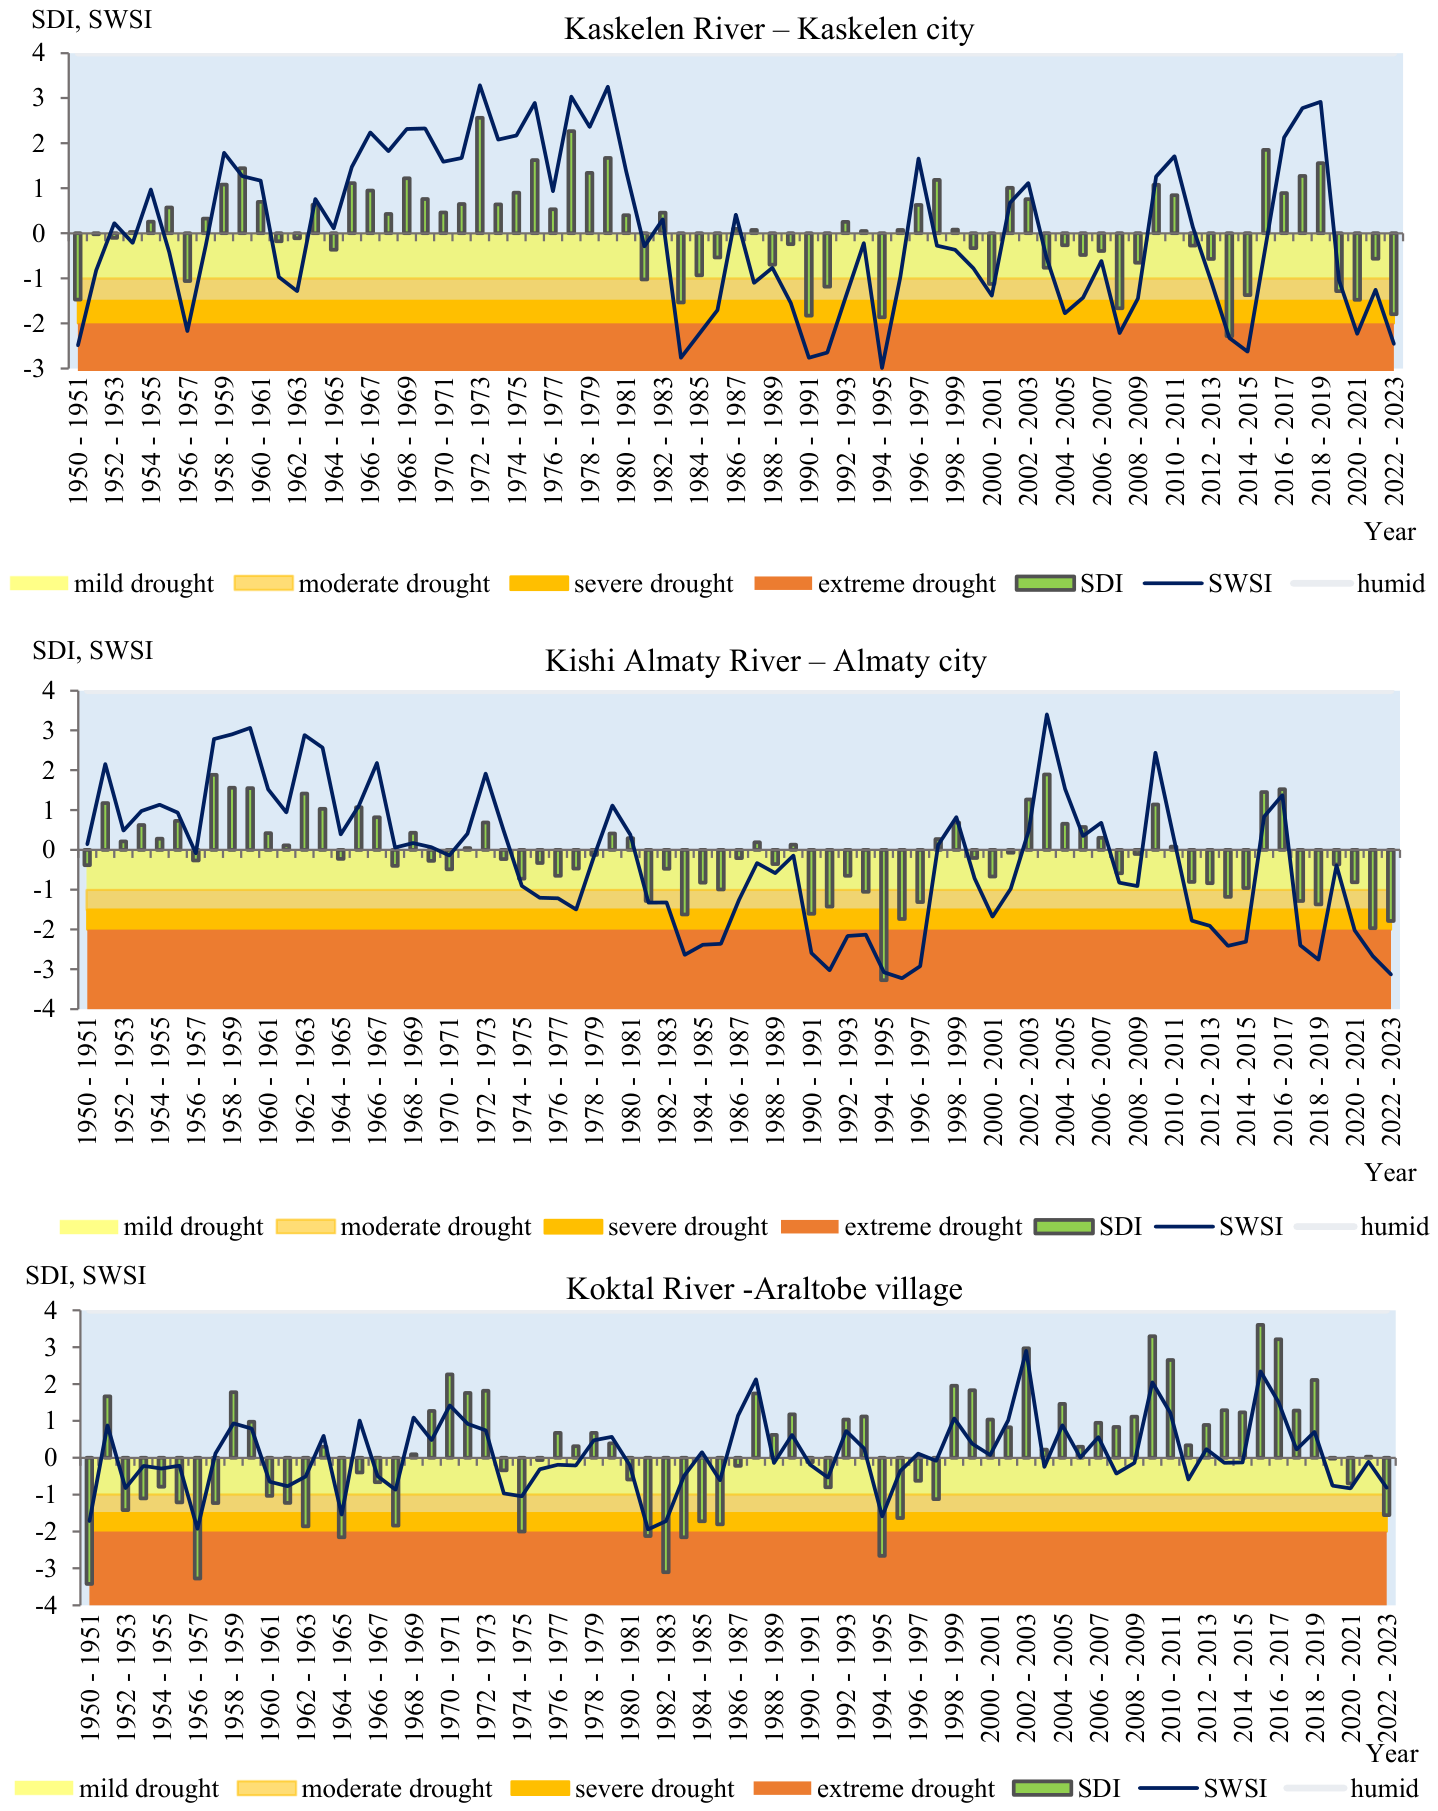
The drought assessment in the Balkhash–Alakolwater management basin was conducted based on an integrated analysis of climatic, hydrological, and satellite drought indices. This approach allows for the consideration of various aspects of aridity formation, including meteorological, hydrological, and ecological processes (
Figure 3).
The drought classification criteria presented in
Figure 3 were adopted from the original methodologies and widely accepted classification schemes reported in the scientific literature. The classification thresholds for the SPEI, SDI, and SWSI indices were adopted from the approaches proposed by [
29,
30,
31], respectively. The classification of the satellite-derived indices VCI, TCI, and VHI is based on the methodology developed by [
33,
41], which has been widely applied for drought monitoring and vegetation condition assessment using remote sensing data. The NDVI threshold values were adopted in accordance with the recommendations of [
32,
42], which describe the assessment of vegetation condition and the identification of drought conditions based on satellite observations.
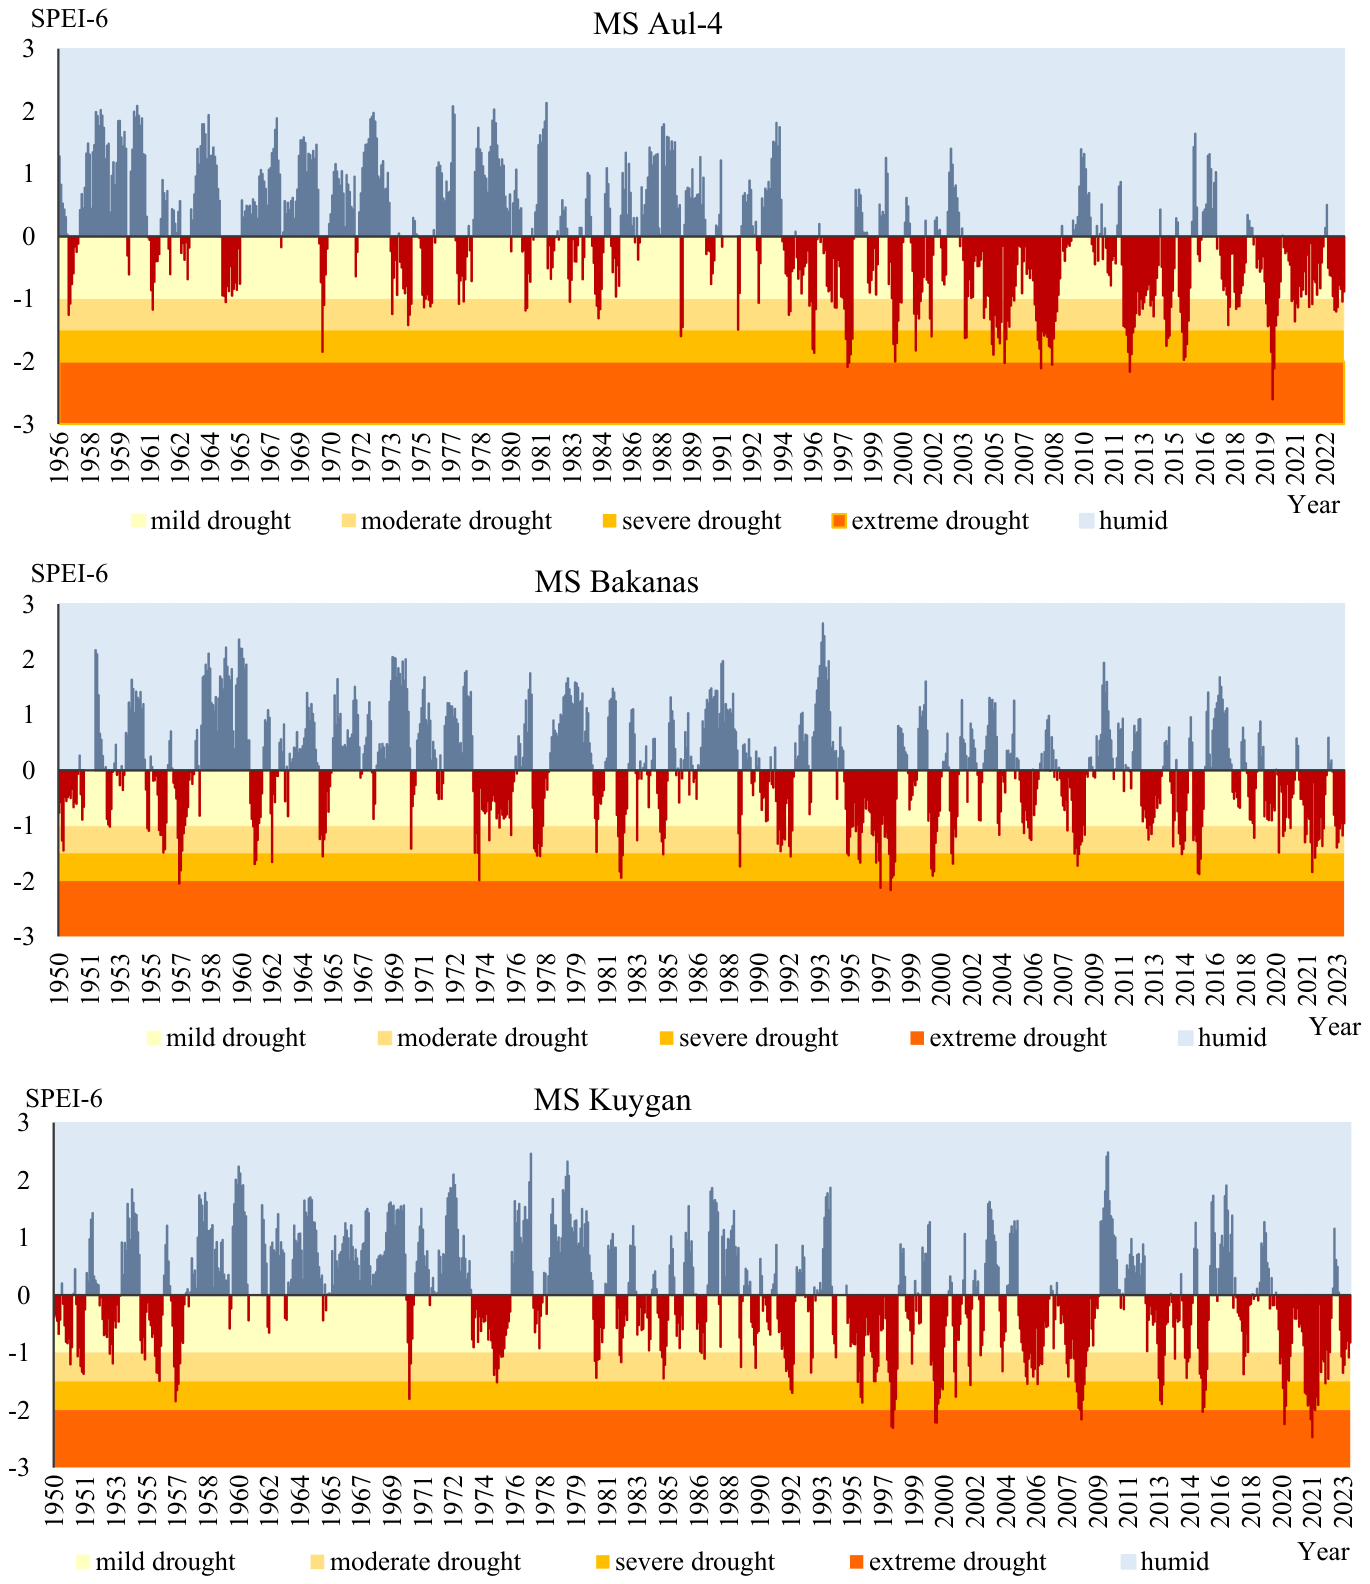
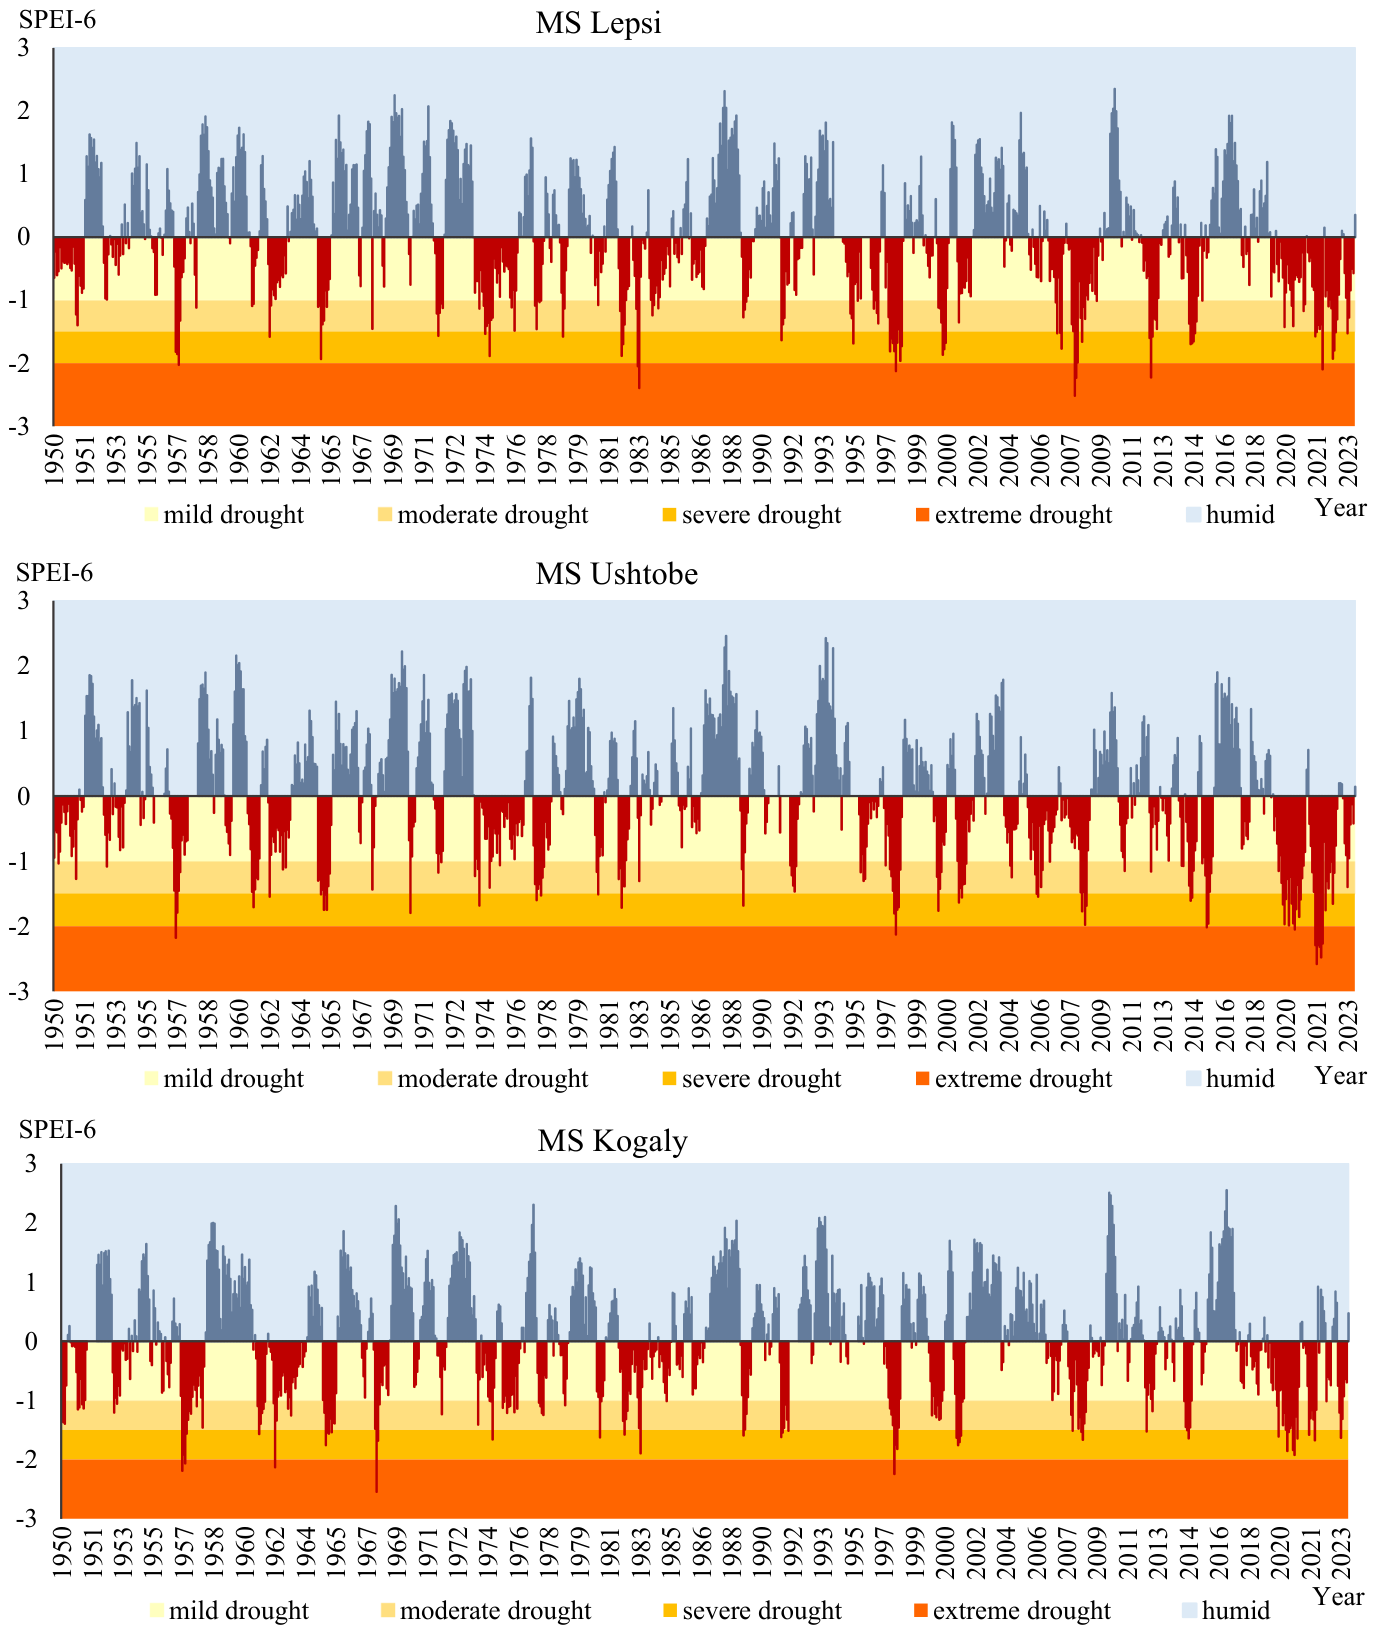
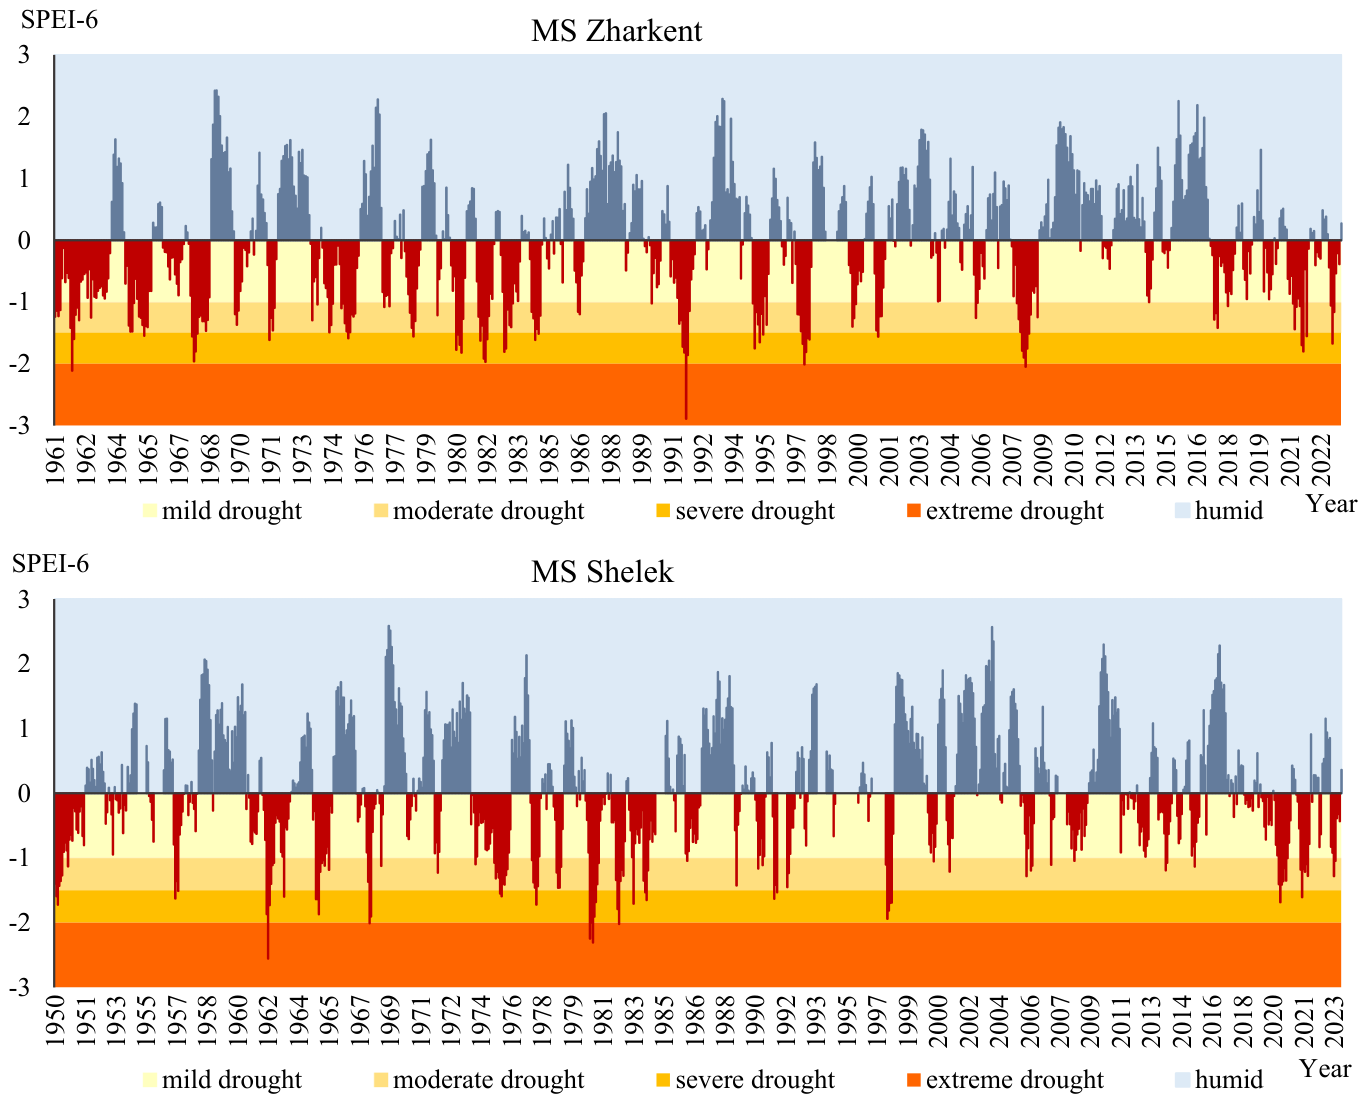
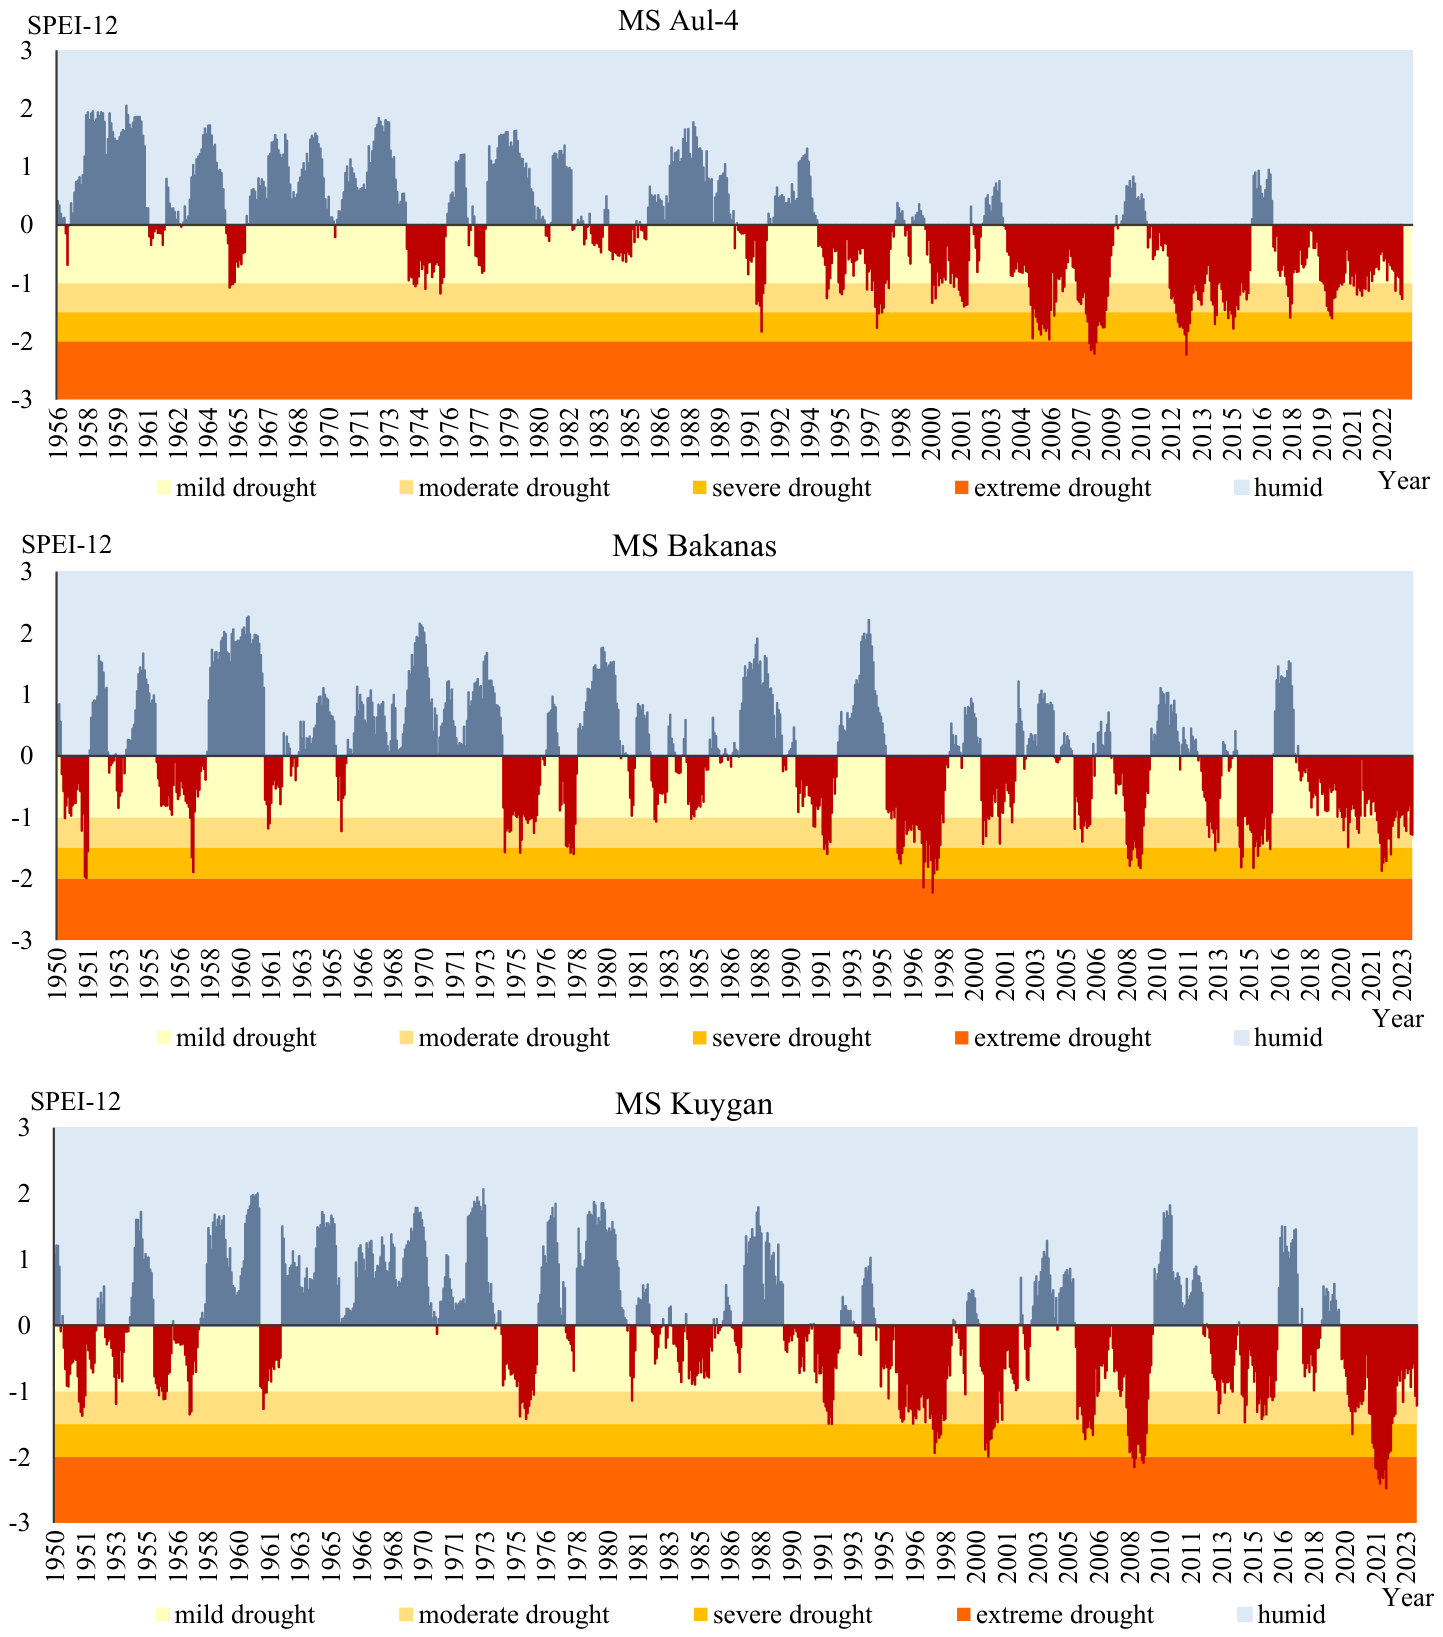
Standardized Precipitation Evapotranspiration Index (SPEI). Among the recent approaches designed to identify climatic droughts, the SPEI stands out. This index is based on the calculation of daily precipitation and air temperature time series (maximum and minimum air temperature). The procedure for determining the index value fully follows the calculation procedure for the SPI, but in addition to precipitation, surface temperature is also taken into account.
The proposed SPEI is calculated using a procedure similar to that of the SPI. However, instead of precipitation, the calculation of SPEI in formula (2) utilizes the differences (D) between monthly precipitation totals (R) and potential evapotranspiration (PET):
where i is the ordinal number of the calculated month.
The SPEI was calculated using the Climpact web application following the methodology of Vicente-Serrano et al. [
29]. The index is based on the climatic water balance (P − PET), where potential evapotranspiration (PET) was estimated from maximum and minimum air temperature data, taking geographical latitude into account [
43]. The climatic water balance was standardized using a three-parameter log-logistic probability distribution, while the entire available observation period (1950–2023) was used as the reference period.
Streamflow Drought Index (SDI). The SDI, developed by Nalbantis and Tsakiris [
30], is widely used to assess hydrological drought at different time scales. In this study, the SDI was calculated from monthly river discharge observations obtained at hydrological gauging stations. Using monthly river discharge data (V
km), the SDI can be calculated for different reference periods within the hydrological year using the following equation:
where i = 1, 2; …, and k = 1, 2, 3, 4. V
km and S
k are the mean and standard deviation of the cumulative river runoff volumes for the baseline period k. k = 1 for October–December, k = 2 for October–March, k = 3 for October–June and k = 4 for October–September. In this study, the hydrological year was defined from October to September in accordance with the original methodology proposed by Nalbantis and Tsakiris [
30], ensuring that the complete annual runoff cycle was represented within a single hydrological year.
Surface Water Supply Index (SWSI). To assess surface water availability, the SWSI was used as an integrated indicator that accounts for the combined influence of the main components of the basin water balance [
31]. In its original formulation, the SWSI can be calculated using standardized values of river discharge, precipitation, snow water equivalent (SWE), and reservoir storage, depending on the hydrological characteristics of the basin and the availability of input data.
In the present study, the SWSI was calculated using monthly river discharge and precipitation data. Snow water equivalent (SWE) and Kapshagay Reservoir storage were not included in the calculations because continuous and homogeneous observation records were unavailable for the entire study period (1950–2023). Nevertheless, the effects of snowmelt and reservoir regulation are indirectly represented through the observed river discharge, which integrates the dominant hydrological processes controlling water resource formation within the basin.
Although both the SDI and SWSI are hydrological drought indices, they describe different aspects of hydrological variability. The SDI is based exclusively on river discharge data and is designed to identify streamflow anomalies associated with the development of hydrological drought in river systems. In contrast, the SWSI characterizes the overall availability of surface water resources within a basin by integrating river discharge with other components of the water balance, the composition of which depends on the hydrological characteristics of the basin and the availability of input data. The combined use of the SDI and SWSI makes it possible to distinguish between streamflow deficits and the overall status of surface water availability, thereby providing a more comprehensive assessment of hydrological drought conditions in the Balkhash–Alakol Basin.
Normalized Difference Vegetation Index (NDVI). The NDVI was used to characterize vegetation conditions. This index reflects the ratio between radiation absorption in the red band and reflection in the near-infrared band of the spectrum, enabling the assessment of changes in vegetation density and productivity under moisture-deficit conditions [
32,
33]. Land Surface Temperature (LST) was used to characterize the thermal conditions of the land surface and the energy balance of the land–atmosphere system.
The raw satellite NDVI and LST data were converted to physical values using standard scaling factors:
where DN is the digital value of the pixel.
The scaling coefficients used to convert the Digital Number (DN) values into physical values of the NDVI and LST were adopted according to the official specifications of the corresponding satellite products. For NDVI, the standard scaling factor of 0.0001 was applied to convert the digital values into dimensionless index values, consistent with the official NASA MODIS Vegetation Index product specifications [
44]. For LST, the standard scaling factor of 0.02 was used, followed by conversion from Kelvin to degrees Celsius by subtracting 273.15, consistent with the USGS EROS eMODIS/eVIIRS product documentation [
37]. The use of these scaling coefficients ensures accurate derivation of the physical variables required for subsequent calculation of the VCI, TCI, and VHI indices [
33,
41].
After conversion to physical values, only NDVI values representing actual vegetation conditions were retained for further analysis. To minimize the influence of noise and non-vegetated surfaces, only NDVI values within the range of 0.05–0.85 were included. Pixels with NDVI values < 0.05, corresponding to water bodies, bare soils, or noise effects, and NDVI values > 0.85, representing potential anomalies, were excluded from further calculations.
Consequently, the VHI analysis primarily represents areas with detectable vegetation cover rather than completely barren surfaces. Nevertheless, naturally sparse vegetation in arid and semi-arid environments may also exhibit persistently low VHI values. Therefore, low VHI values were interpreted as indicators of vegetation stress rather than direct evidence of ecosystem degradation or chronic drought. Land-cover stratification was beyond the scope of the present study but represents an important direction for future research to further improve the interpretation of VHI patterns.
LST was converted from digital values to degrees Celsius following the standard procedure described above, after which a filter of permissible temperature values corresponding to the actual climatic conditions of the study area was applied. For LST, a physically permissible surface temperature range of −40…+60 °C was used; values outside this range were considered anomalous and excluded from the analysis.
Calculation of Drought Indices (VCI, TCI and VHI). To quantitatively evaluate the degree of moisture and temperature stress on the vegetation cover in the Balkhash–Alakolwater management basin, the methodology proposed by A. Kogan [
33] was used. This methodology is based on the normalization of vegetation and thermal parameters relative to their long-term extreme values.
The Vegetation Condition Index (VCI), which characterizes the degree of vegetation stress, was calculated using the formula:
where NDVI
i is the NDVI value at the current time (year), and NDVI
min and NDVI
max are the long-term minimum and maximum NDVI values determined for each pixel over the corresponding observation period.
The Temperature Condition Index (TCI), reflecting the degree of temperature stress on vegetation, was determined as follows:
where LST
i is the land surface temperature value at the current time, and LST
min and LST
max are the long-term minimum and maximum LST values for each pixel.
The integral Vegetation Health Index (VHI), which combines the effects of moisture and temperature stress, was calculated as a weighted combination of the VCI and TCI indices with equal weighting coefficients (0.5 and 0.5), following the original formulation of Kogan [
33,
41]:
In this study, the VHI was calculated using the original formulation proposed by Kogan [
33,
41], in which the VCI and the TCI are assigned equal weighting coefficients (0.5 and 0.5). This formulation represents the standard VHI methodology and has been extensively applied in satellite-based drought monitoring and vegetation health assessment studies.
Although several studies have explored the possibility of adjusting the weighting coefficients according to regional climatic and environmental conditions, no universally accepted methodology currently exists for determining region-specific weights for arid environments such as those of Central Asia. Moreover, the application of alternative weighting schemes requires comprehensive regional calibration and independent validation, which would reduce the comparability of results across different studies.
Therefore, the original VHI formulation with equal weighting coefficients for the VCI and TCI components was adopted in this study. This approach ensures methodological consistency, facilitates direct comparison with previous international studies, and follows the internationally accepted standard methodology for VHI-based drought assessment [
33,
41].
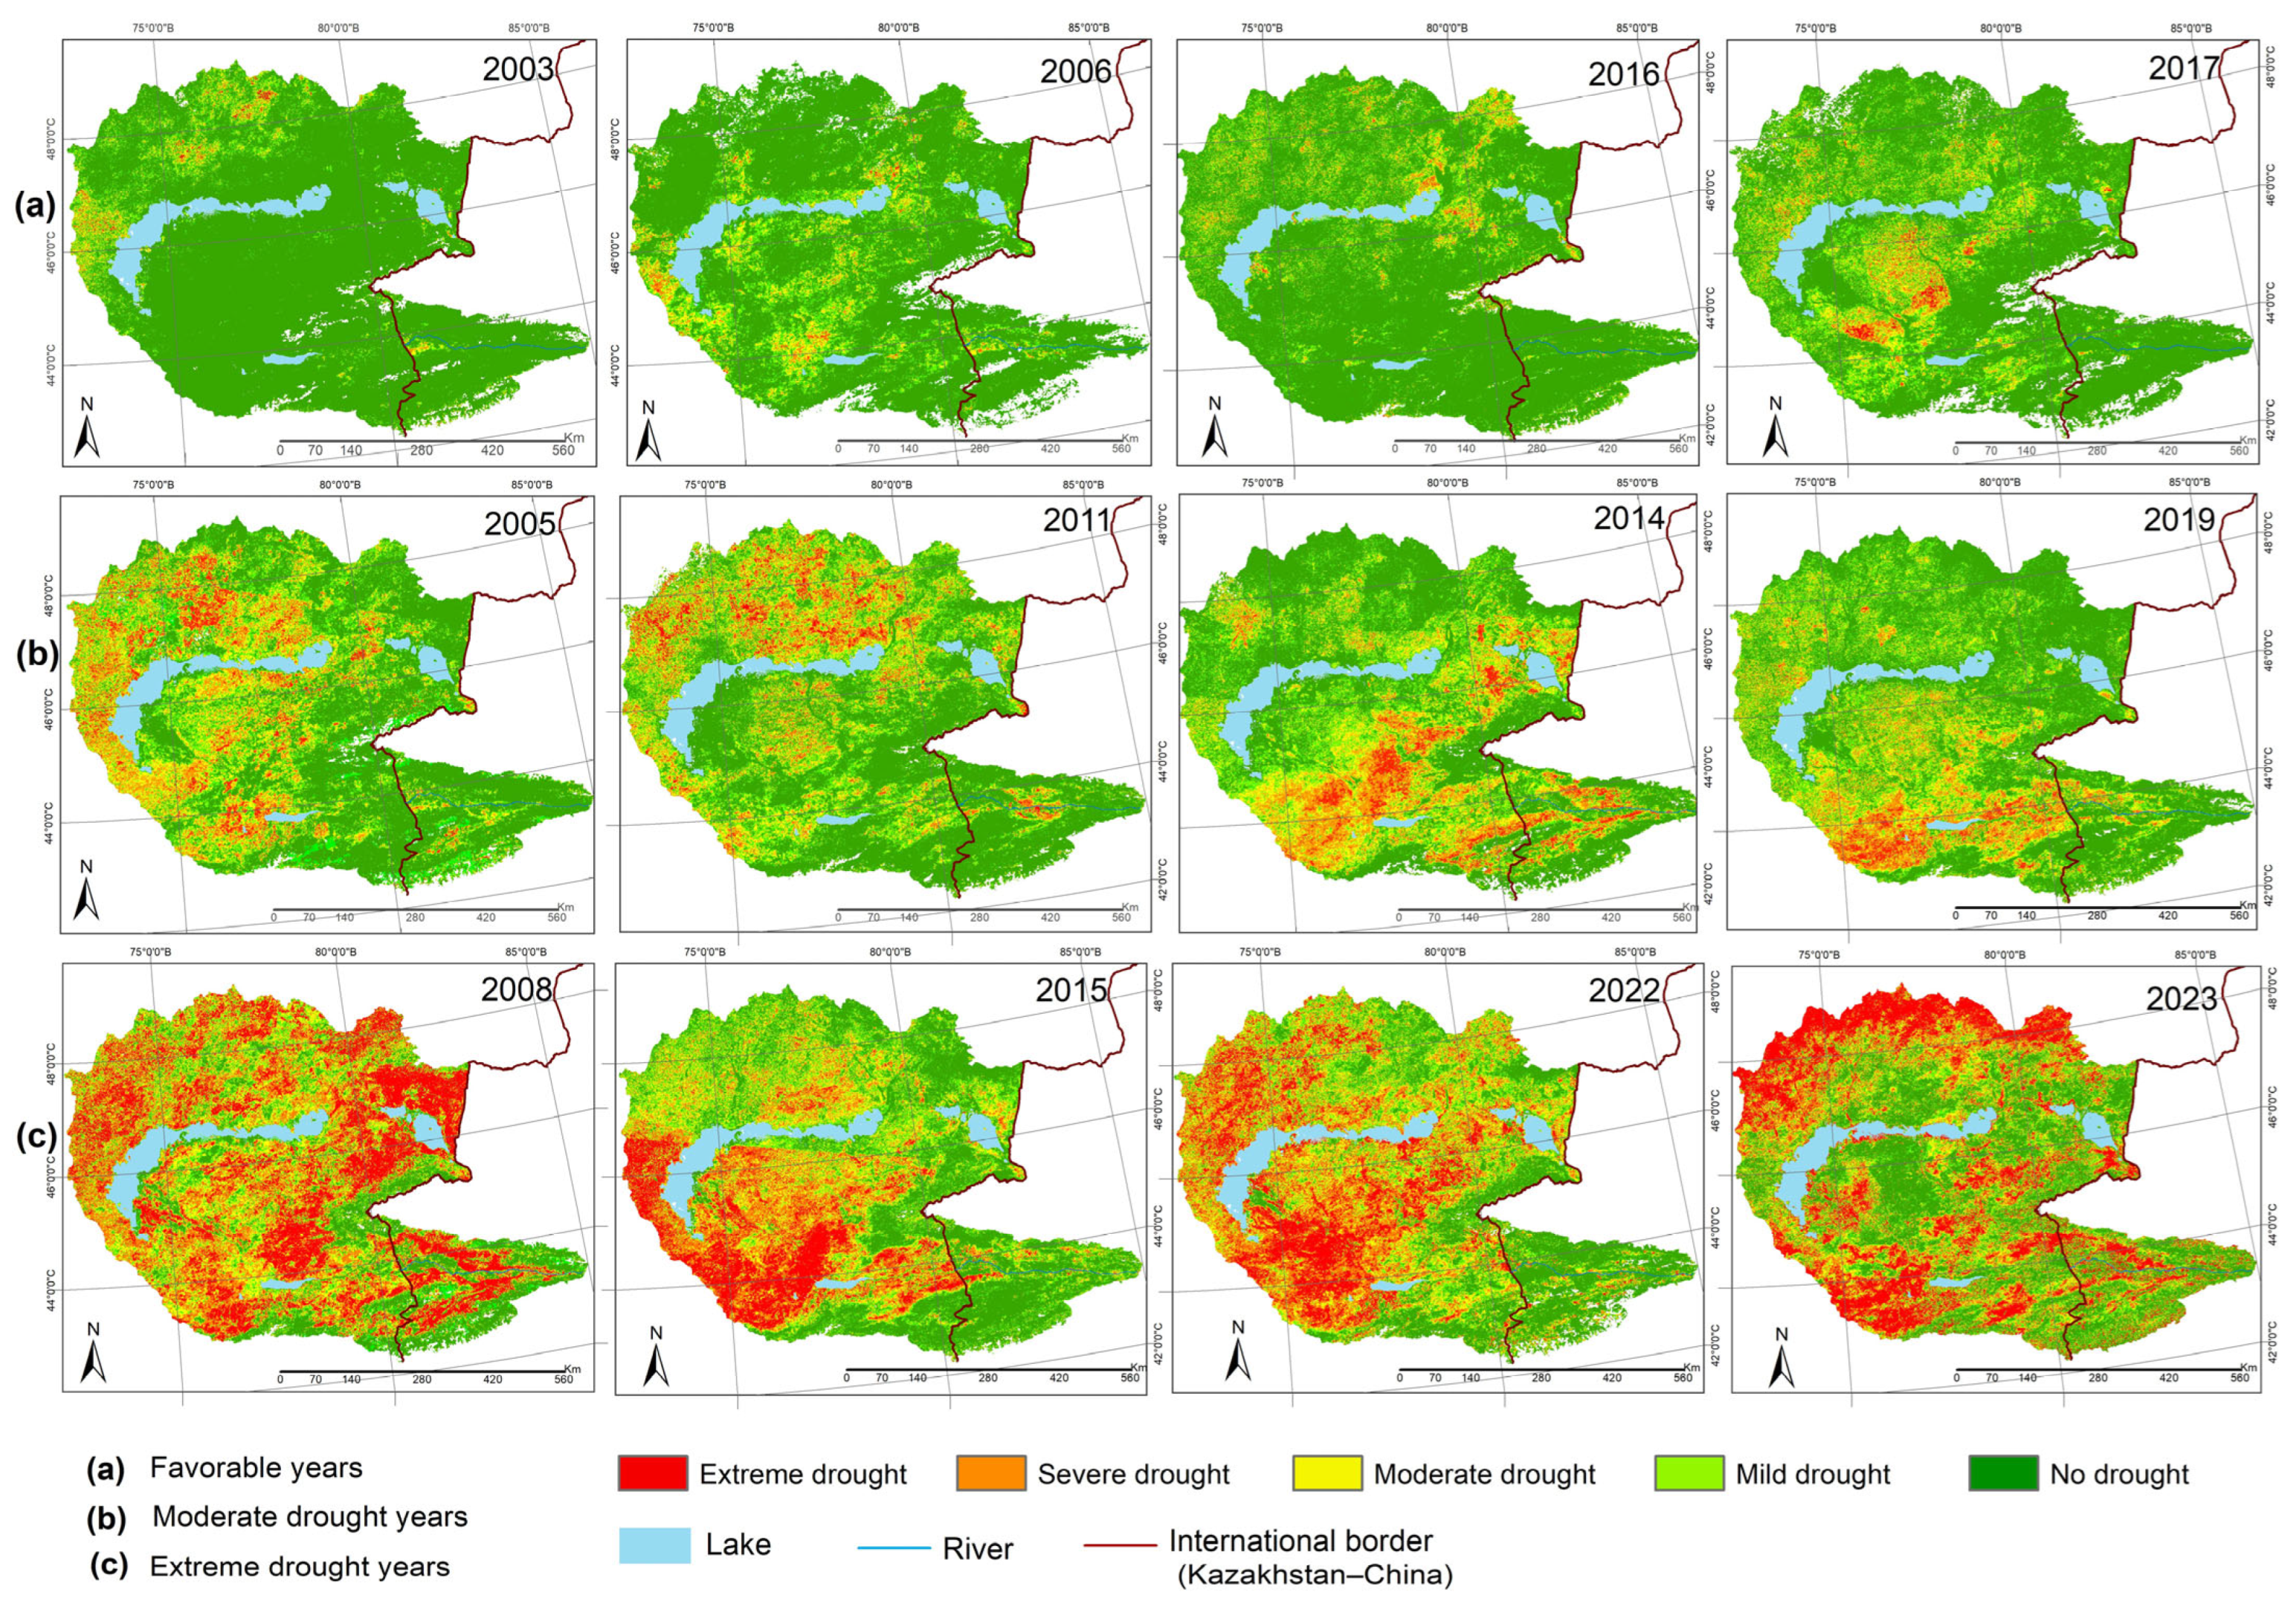
To ensure the consistency of the long-term satellite time series, all datasets were harmonized to a common spatial resolution (1 km), map projection, and coordinate reference system prior to analysis. The spatial resolution of the eVIIRS data was resampled to match that of the eMODIS data (1 km) using the bilinear interpolation method. Furthermore, all satellite datasets underwent identical preprocessing procedures, including quality control and the exclusion of invalid observations, to ensure temporal consistency between the two satellite products. As a result, a unified VHI time series covering the 2002–2023 period was generated and used to analyze the interannual dynamics of drought conditions.
The VHI threshold values (<10, 10–20, 20–30, 30–40, and >40) were adopted according to the classical classification proposed by Kogan [
33,
41], which has been widely applied in satellite-based drought monitoring studies. This classification categorizes vegetation drought severity into five levels, ranging from extreme drought to the absence of drought conditions. The threshold values were not calibrated specifically for the study area but were adopted to maintain methodological consistency and ensure the comparability of the results with previous VHI-based drought assessments [
33,
41].
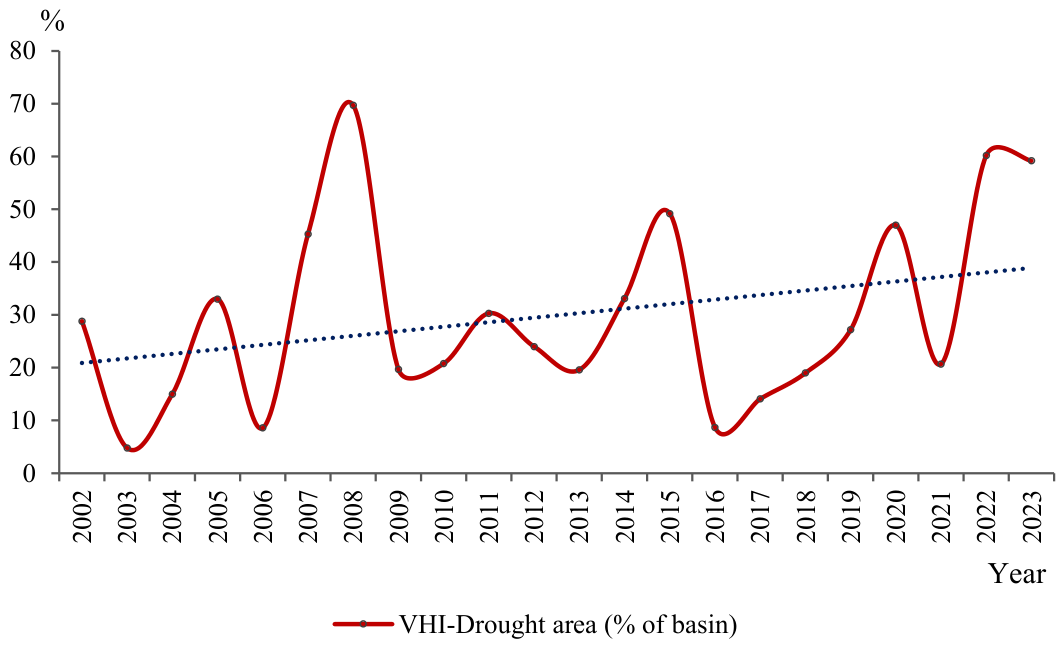
The area of drought-affected territories for each year was calculated as the ratio of the total area of pixels satisfying the condition VHI < 30 to the total valid area of the basin:
where A(VHI
i < 30) is the total area of pixels with VHI < 30 in the i-th year, and A
valid is the total valid area of the basin.
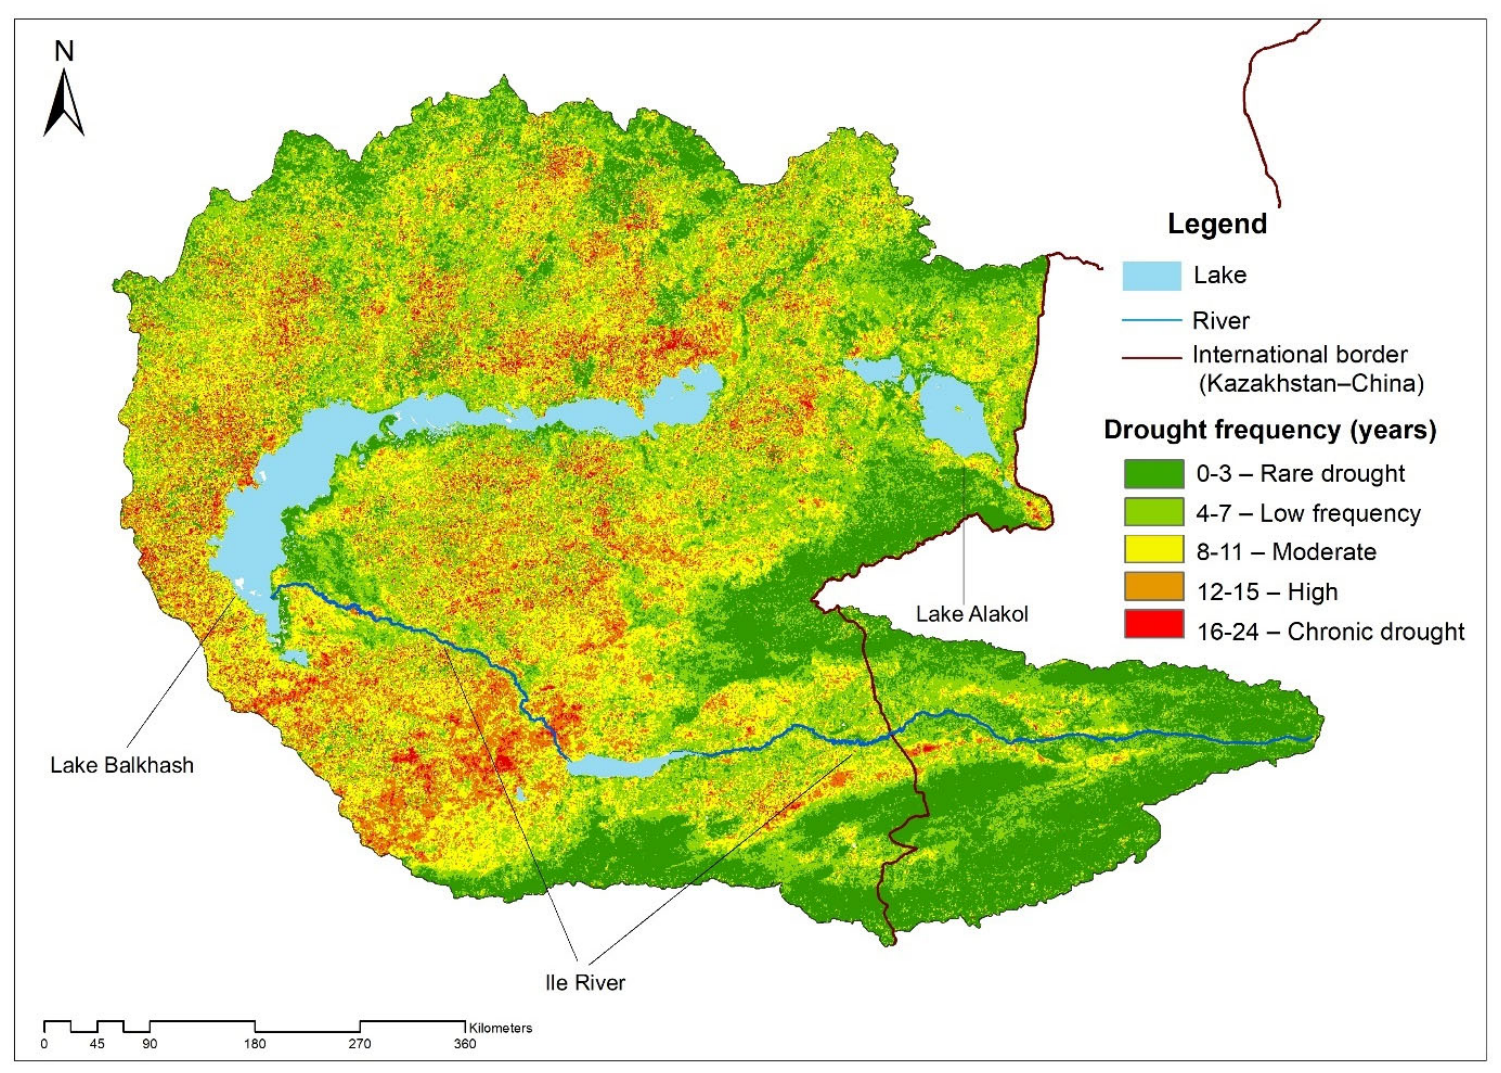
To evaluate the spatial stability and recurrence of drought conditions, the drought frequency was calculated for each pixel as the number of years during which a VHI value < 30 was recorded:
where F is the drought frequency for a given pixel; N is the total number of observation years; VHI
i is the VHI value in the i-th year; and I is the indicator function, which takes the value of 1 if the condition is met (VHI
i < 30) and 0 otherwise.
Based on the resulting drought frequency map, the basin territory was classified by climate risk levels (low, moderate, high, and chronic aridity), which allowed the identification of zones with sustained recurrence of drought conditions and persistent vegetation stress. Additionally, long-term average VHI values were calculated to identify the background vulnerability of the territory and spatial patterns of climate stress distribution.
All calculations for area and drought frequency were performed in ArcGIS (ArcMap) 10.8 (Esri Inc., Redlands, CA, USA) using spatial analysis tools.
Long-Term Spatial Change Analysis of VHI.
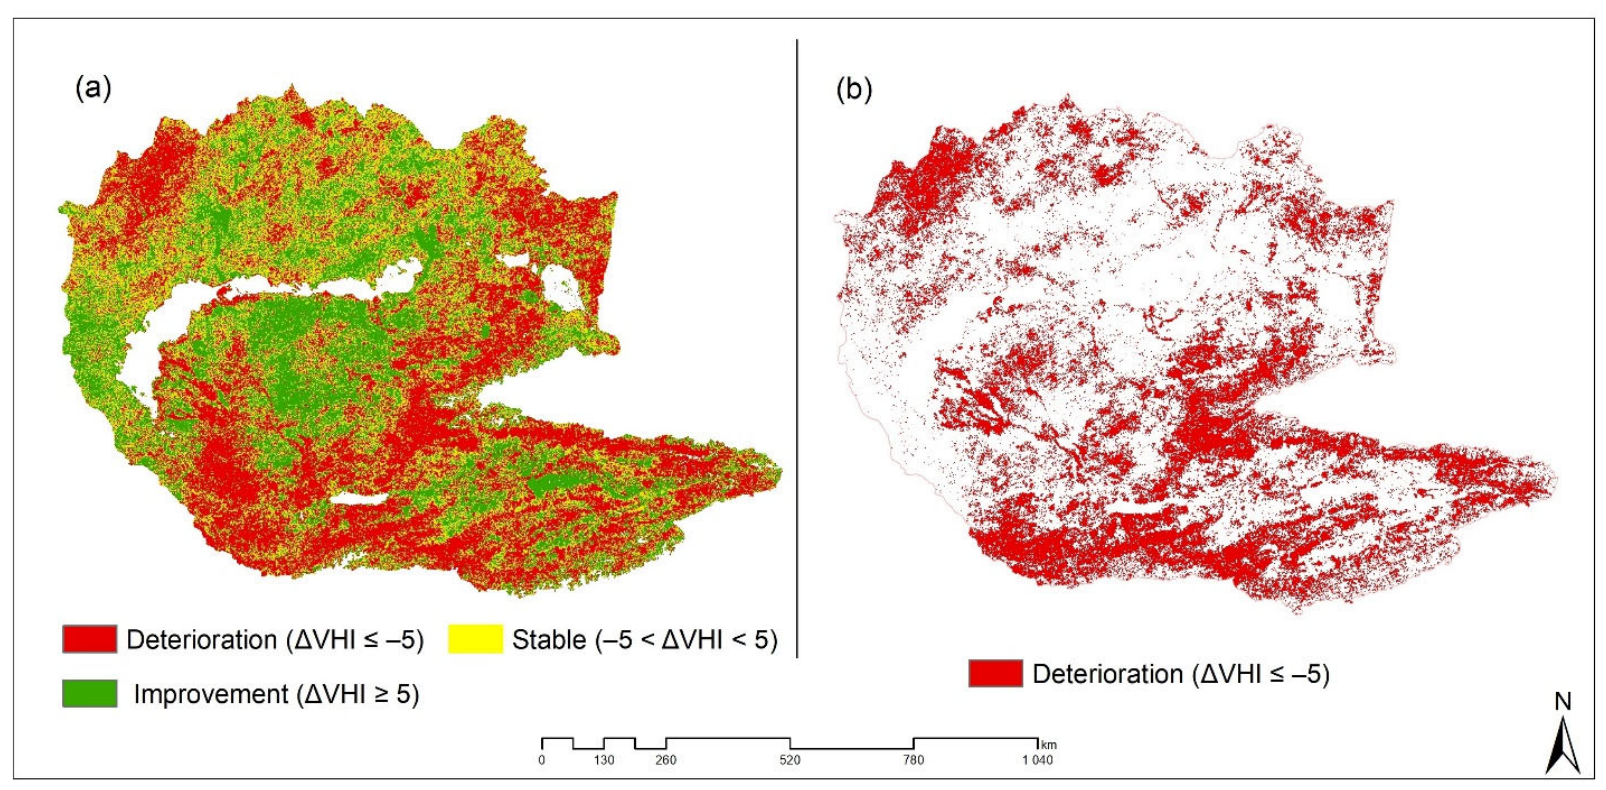
To identify long-term spatial changes in vegetation condition, a spatial change analysis of the VHI was performed by comparing two representative periods: the baseline period (2002–2010) and the recent period (2016–2023).
Average long-term VHI values were calculated for each period. Subsequently, a difference map of changes was constructed using the formula:
The threshold of ΔVHI = ±5 was adopted as an empirical classification criterion to distinguish areas with noticeable improvement or deterioration in vegetation condition between the two study periods. This threshold was used for descriptive classification purposes and does not represent a statistical significance threshold.
The resulting difference raster reflects the direction and magnitude of changes in the state of the vegetation cover.
To interpret the results, a threshold classification of changes was applied:
ΔVHI ≤ −5—pronounced deterioration of vegetation status;
−5 <ΔVHI <5—relative stability;
ΔVHI ≥ 5—pronounced improvement.
To exclude insignificant interannual fluctuations, only spatially significant changes in vegetation status, where the absolute change in the index exceeded the ΔVHI ≥ 5 threshold, were further identified. This approach minimizes the influence of random interannual variability and highlights stable spatial trends in aridity changes. Based on the resulting classification, a map of spatial changes in the state of the vegetation cover was constructed.
Additionally, the areas and proportions of the territory for each change class were calculated by summing the number of pixels in the corresponding category and normalizing them to the total valid area of the basin.
Statistical Methods for Trend Analysis. To identify statistically significant trends and evaluate their temporal structure in hydrometeorological data series, the Mann–Kendall test was used, representing a non-parametric method widely applied for the analysis of monotonic trends in time series [
45,
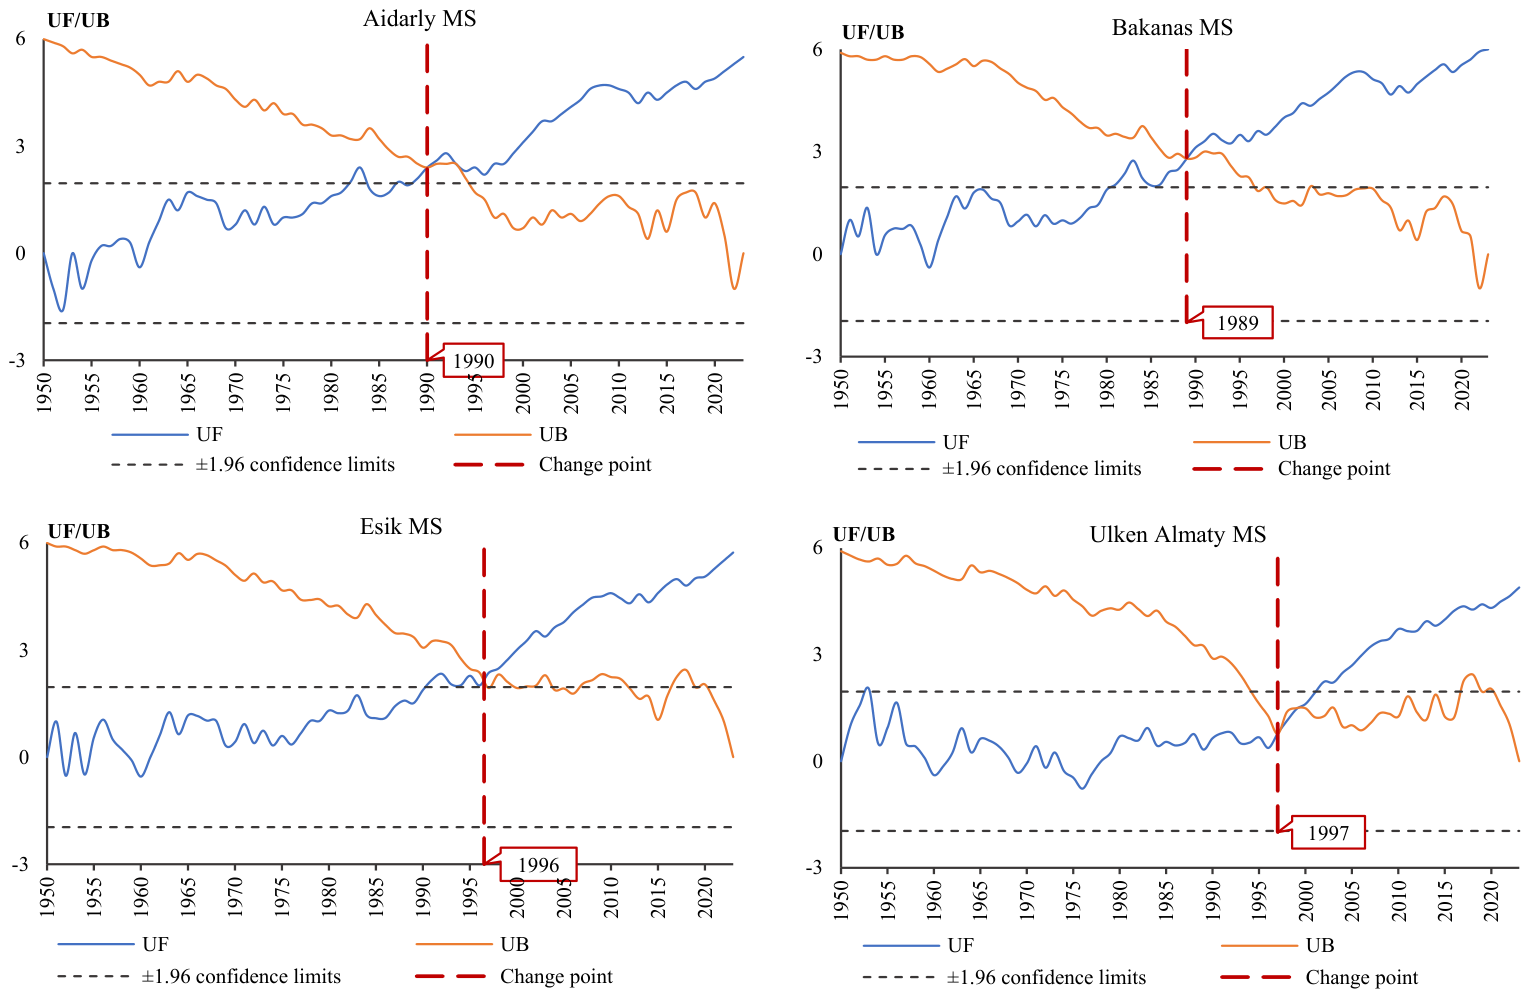
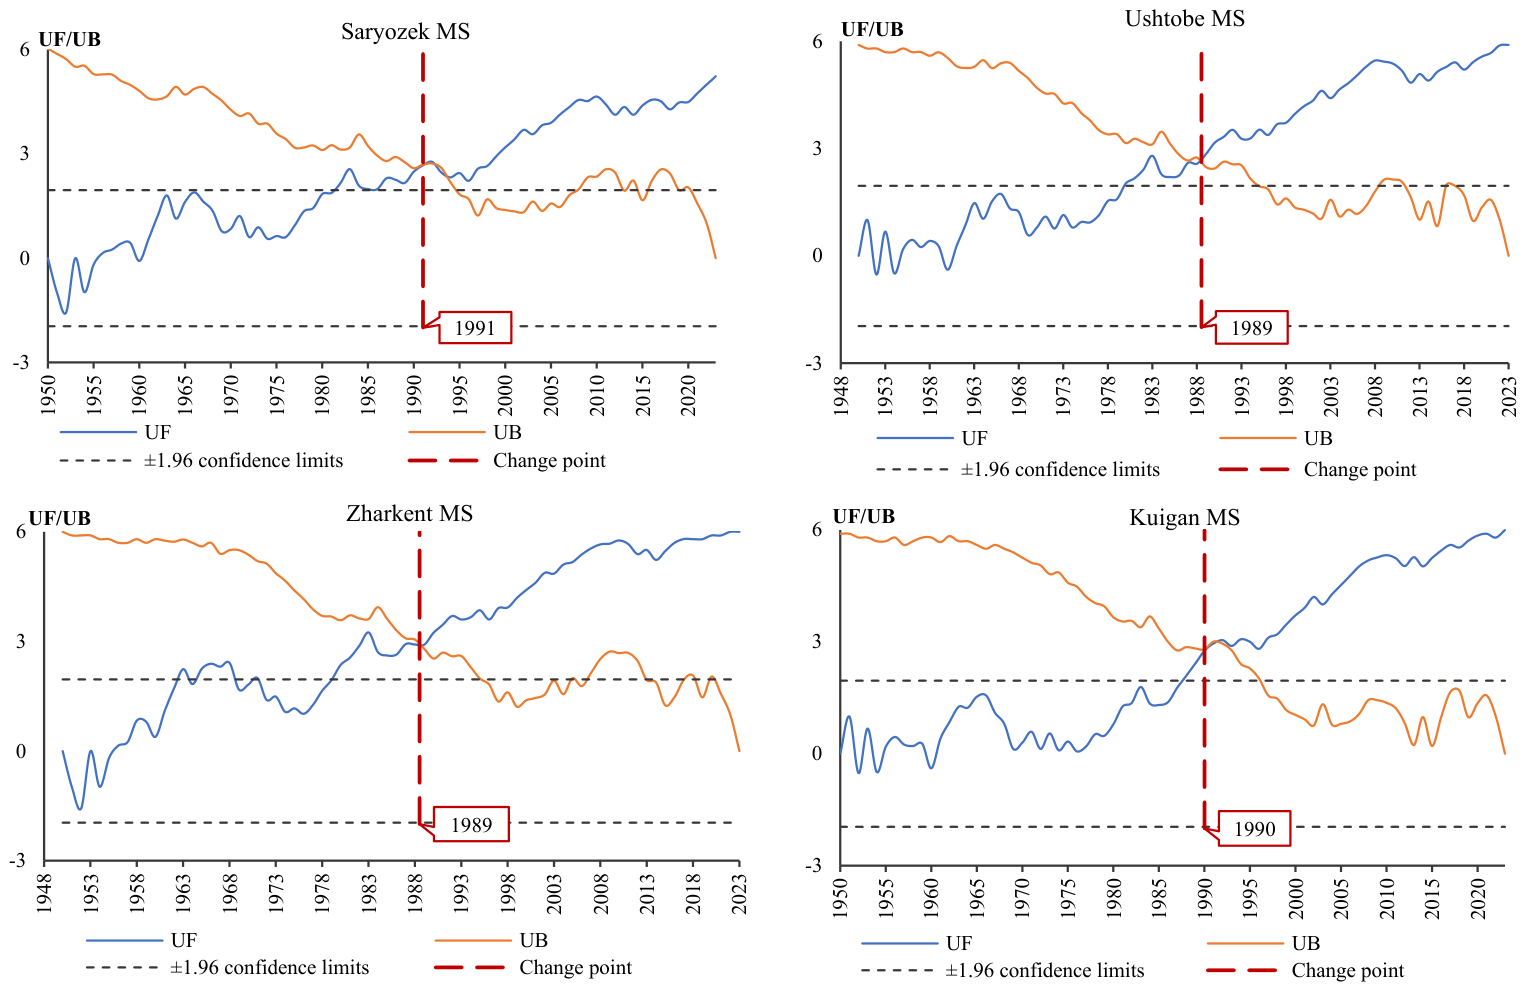
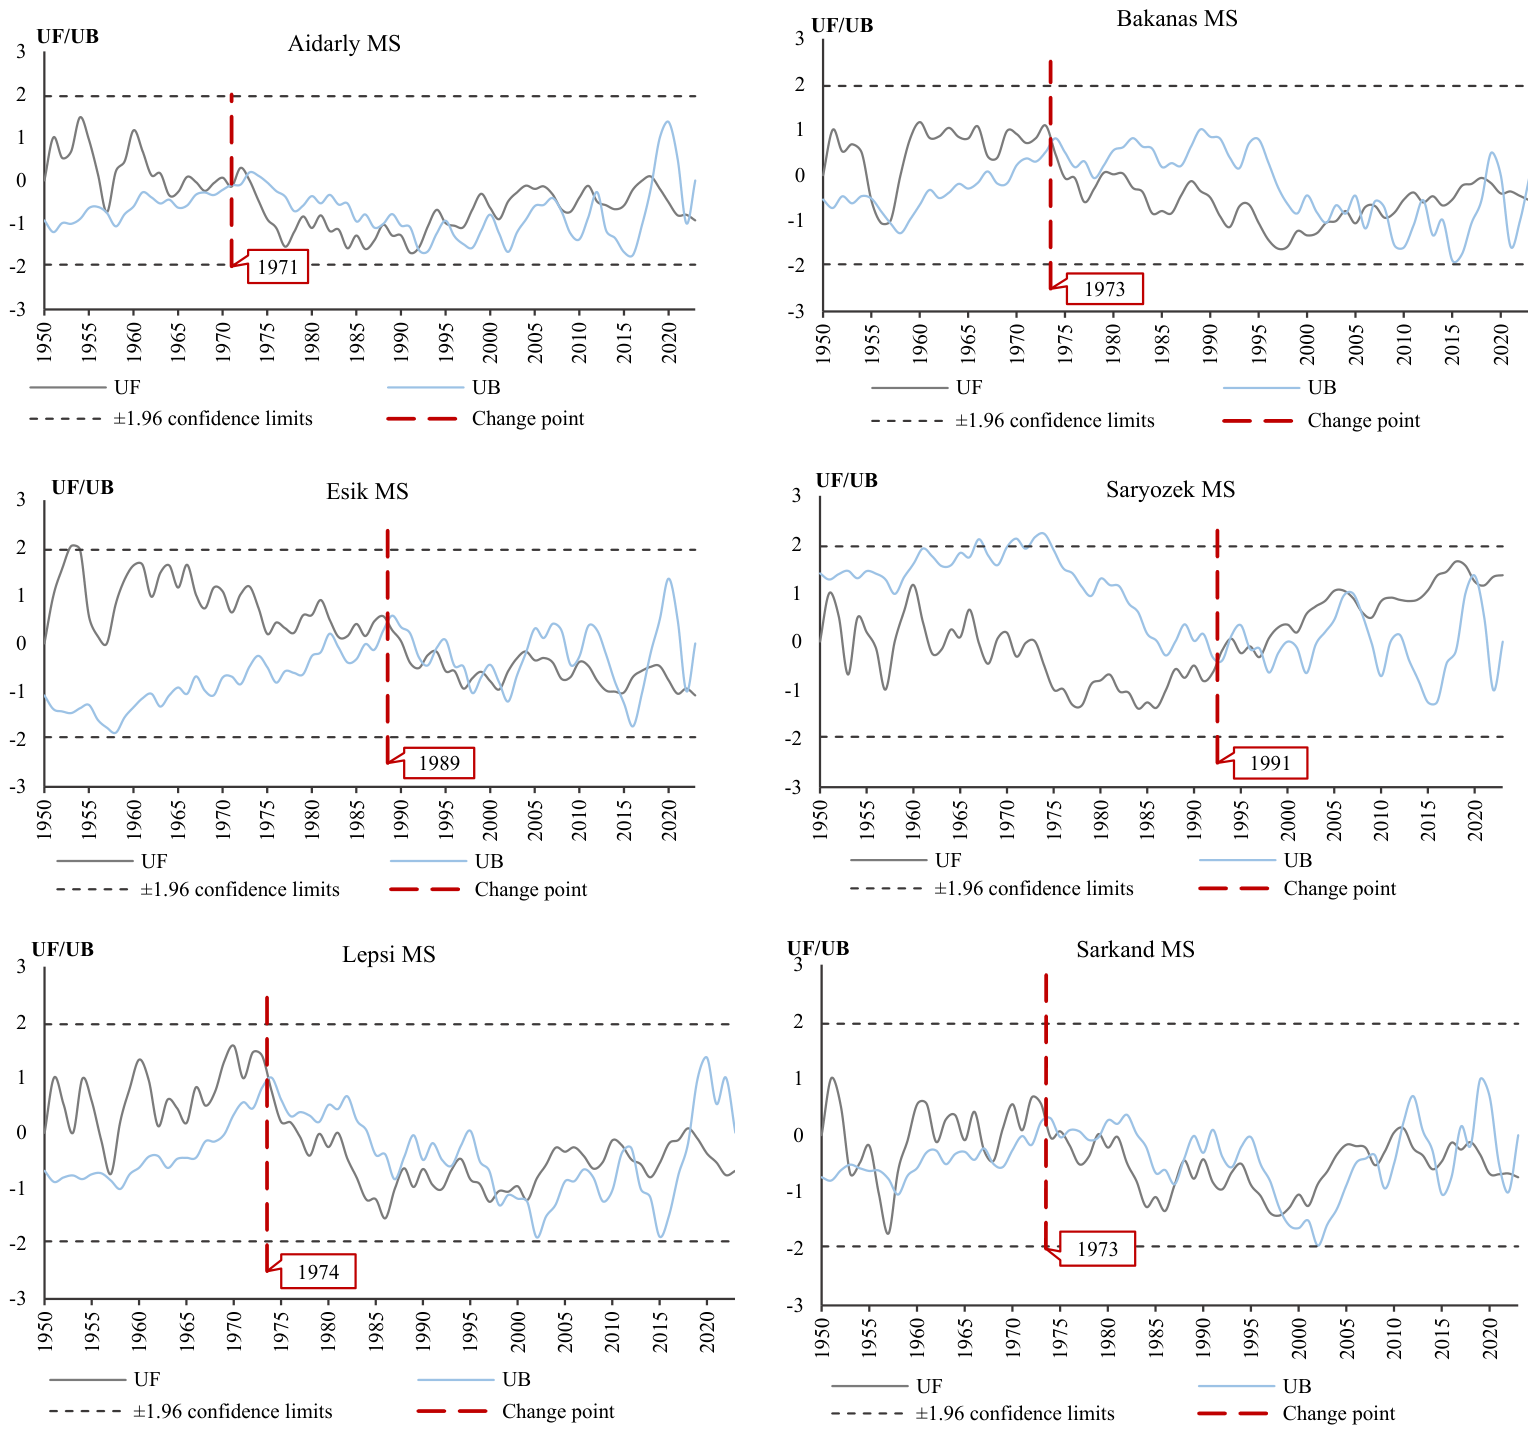
46]. To determine potential regime shift points, a sequential Mann–Kendall test based on the analysis of the forward sequential statistic (UF) and the backward sequential statistic (UB) was applied, allowing the identification of structural changes in the time series [
47].
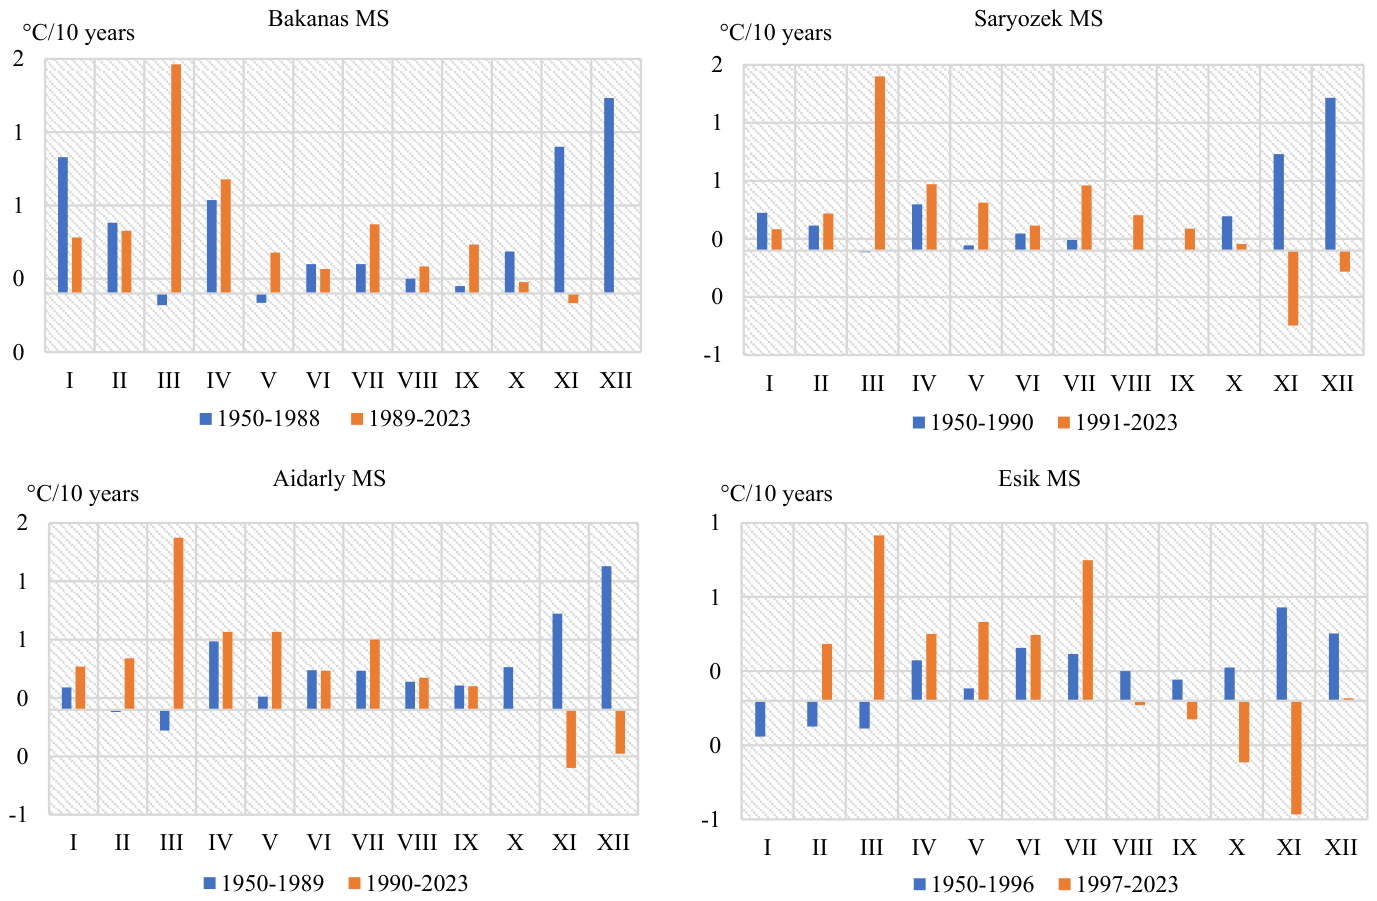
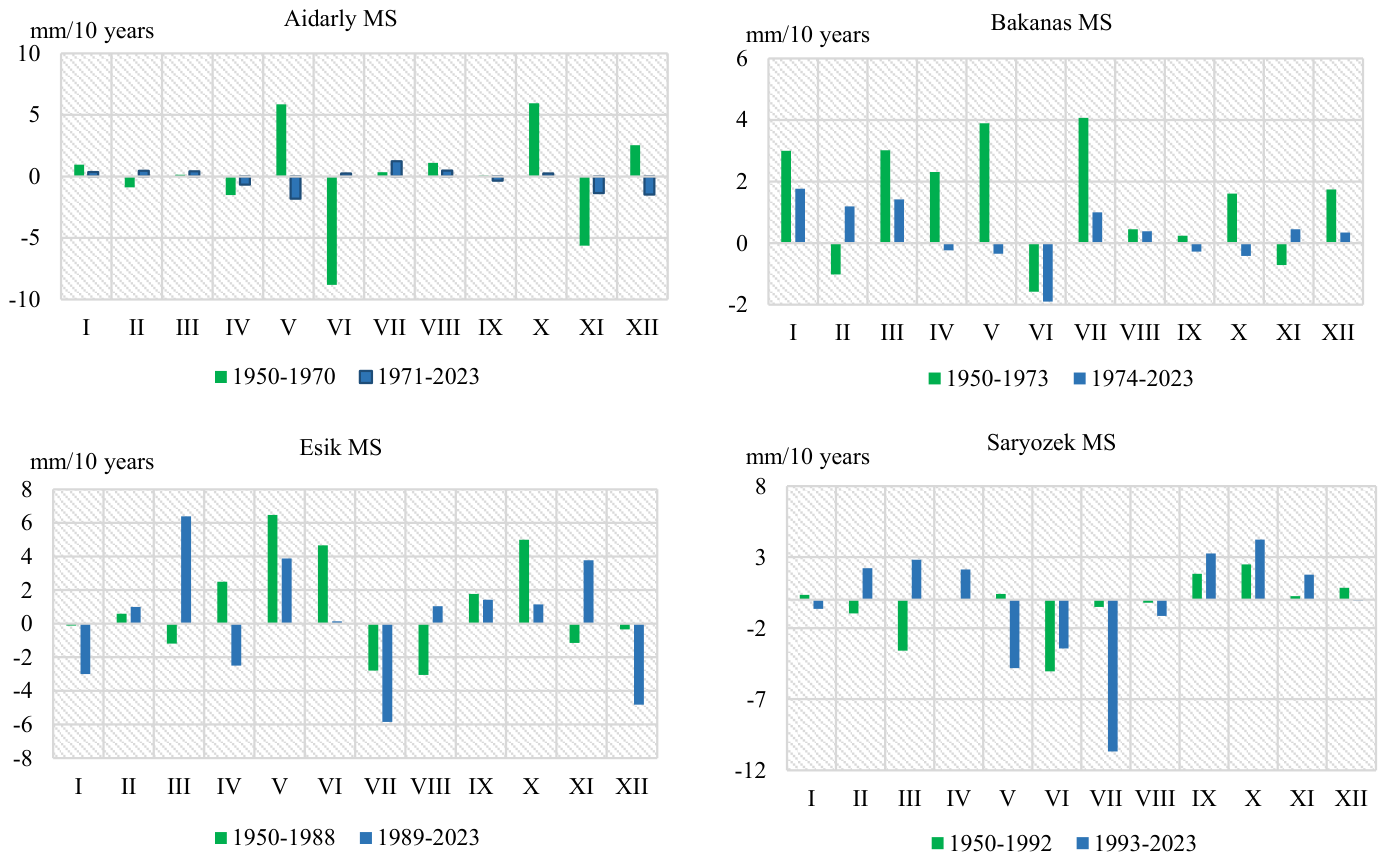
To quantitatively evaluate the trend magnitude, Sen’s slope estimator was applied, which allows for determining the rate of change in the parameter over time and remains robust against outliers and non-normality of data distribution [
48].
Pettitt’s test was used to identify structural change points in drought index time series. Pettitt’s test is a nonparametric rank-based method developed by Pettitt [
49] for detecting a single change point (structural break) in a time series. The test identifies statistically significant shifts in the median of a series, which may indicate changes in the drought regime associated with climatic variability or anthropogenic influences. A major advantage of the method is that it does not require the data to follow a specific probability distribution and is highly sensitive to changes in the central tendency, making it particularly suitable for hydrological time series, which often violate the assumption of homogeneity. The test is based on rank statistics and evaluates the null hypothesis of no change point against the alternative hypothesis that a significant shift in the median has occurred at an unknown point in the time series [
49].




 ,
,