Article

MS-YOLO: A Satellite Remote Sensing Image Power Tower Detection Algorithm Based on Multi-Scale Feature Extraction and Small Object Enhancement

1
Yanzhao Electric Power Laboratory, North China Electric Power University, Baoding 071003, China
2
Department of Electronic and Communication Engineering, North China Electric Power University, Baoding 071003, China
3
Hebei Key Laboratory of Power Internet of Things Technology, North China Electric Power University, Baoding 071003, China
4
Hebei Engineering Research Center of Intelligent Technology for Power Internet of Things, North China Electric Power University, Baoding 071003, China
*
Author to whom correspondence should be addressed.
Appl. Sci. 2026, 16(15), 7462; https://doi.org/10.3390/app16157462 (registering DOI)
Submission received: 24 June 2026 / Revised: 22 July 2026 / Accepted: 24 July 2026 / Published: 26 July 2026
(This article belongs to the Special Issue AI in Object Detection—2nd Edition)

Abstract

Satellite remote sensing has become a vital data source for monitoring power infrastructure. As critical infrastructure supporting power line operations, the monitoring and maintenance of power towers have become core elements in ensuring grid reliability. However, power tower detection in satellite remote sensing imagery remains challenging because of the substantial scale differences between distribution and transmission towers, the weak feature representation of small objects, and interference from complex backgrounds. To address these challenges, this paper proposes MS-YOLO, a power tower detection algorithm for satellite remote sensing imagery based on multi-scale feature extraction and small object enhancement. First, the poly kernel inception bottleneck (PKI_Bottleneck) module is introduced into the YOLOv9 backbone, enhancing the extraction of scale-diverse features and contextual cues while limiting interference from complex backgrounds. Second, the dual-branch semantic-spatial synergy attention (DSSA) module is introduced. By decoupling deep semantic and shallow spatial information, it effectively preserves small object features while suppressing environmental noise, enhancing the perception capability for small tower objects. Finally, a dynamic focal-weighted intersection over union (DFW-IoU) loss function is introduced to optimize the balance between easy and difficult samples, compelling the model to prioritize small objects and challenging samples during gradient updates. Experimental results demonstrate that MS-YOLO achieves mAP50 values of 79.1% and 95.7% on the two datasets used in this paper, representing improvements of 4.1% and 3.4% over baseline model. These results validate the effectiveness of the improved model for power tower detection in complex remote sensing scenarios.

1. Introduction

In the process of constructing the new power system to achieve efficient integration of clean energy, transmission lines have become increasingly vital as the hubs for energy transfer. As critical infrastructure supporting line operations, the spatial distribution and health status of power towers directly impact grid safety inspections, disaster assessments, and intelligent operations and maintenance [1]. Consequently, the monitoring and maintenance of power towers have become central to ensuring grid reliability. However, traditional manual inspections and drone operations are often constrained by geographical conditions, suffering from low efficiency, high costs, and difficulties in achieving comprehensive, round-the-clock coverage across the entire grid. Concurrently, with the continuous development of high-resolution Earth observation technologies, satellite remote sensing is progressively emerging as an effective supplementary method for macro-level monitoring of power facilities, owing to its significant advantages of wide-area coverage, high acquisition efficiency, and strong repeat observation capabilities [2]. In particular, sub-meter spatial resolution imagery provided by satellites such as Google Earth [3], Gaofen-series [4], and WorldView series [5,6,7] overcomes the limitations of ground-based perspectives, offering unprecedented data support and opportunities for large-scale, high-frequency automated monitoring of power transmission towers.
Recently, the rapid development of deep learning technologies has propelled breakthrough progress in the field of object detection within remote sensing images, finding widespread application in downstream tasks such as the inspection of critical power infrastructure, including electricity pylons. Presently, mainstream algorithms for detecting power infrastructure objects are generally divided into two-stage detection models, exemplified by the R-CNN series [8], and one-stage detection models represented by the YOLO series [9,10,11]. In comparison, the YOLO series, with its end-to-end architecture and relatively high inference efficiency, better meets the stringent real-time and efficiency demands of remote sensing scenarios. Consequently, this series of algorithms has been widely applied to general remote sensing object detection tasks such as vehicles, buildings, and airports, but is also extensively applied in various power infrastructure inspection scenarios [12,13]. Regarding detection tasks for power infrastructure, such as transmission towers, numerous scholars have conducted extensive research. Yang et al. [14] used the Adaboost algorithm and the lightweight MobileNetV3 network to build a model improving the condition recognition of power transmission towers in remote sensing imagery. Ming et al. [15] employed data augmentation techniques to generate simulated power tower samples, integrating these with the YOLOv4 framework to achieve automated detection of power towers. Zha et al. [16] developed a dark-channel image enhancement algorithm to detect power towers, incorporating mobile inverted bottleneck convolutions and deformable convolutions to detect power towers in remote sensing images. Lu et al. [17] integrated deep learning with quantum neural network technology, proposing a lightweight quantum-enhanced object detection framework to detect obstructions in power tower bases. Huang et al. [18] proposed a lightweight model named DLR-YOLO for multi-scenario remote sensing images to identify power towers, which leverages dynamic low-rank training to achieve high detection accuracy while markedly decreasing the parameter scale and computational burden.
Although current approaches have achieved significant results in specific scenarios, the identification of power towers using satellite remote sensing images still faces severe challenges caused by significant scale differences and the sparse distribution of small object features. First, the vast variation in object scale is a key factor that limits detection accuracy. Transmission towers are structurally complex and massive, whilst distribution towers are minuscule; the disparity in their pixel proportions within a single remote sensing image is stark, making it difficult to account for features at a single scale. Furthermore, due to factors such as shooting altitude, angle and terrain undulations, towers of the same type may appear at vastly different scales within remote sensing images, resulting in a pronounced multi-scale distribution. Second, distribution towers and other small-scale targets account for only a limited number of pixels in large-scene remote sensing images. They have weak feature expression capabilities and are easily affected by background objects (such as vegetation, buildings, and roads), leading to frequent false and missed detections. In addition, complex background issues such as variations in illumination, occlusion, and background noise are common in satellite remote sensing images, further increasing the difficulty of detecting power towers.
Therefore, to address the inherent limitations in multi-scale feature extraction and small object optimization mentioned above, this paper proposes MS-YOLO which is a power tower detection algorithm for satellite remote sensing images based on multi-scale feature extraction and small object enhancement. The key contributions of this paper are presented as follows.
1.
This paper proposes MS-YOLO for power tower detection in satellite remote sensing images and incorporates the PKI_Bottleneck module to address the multi-scale challenge. The contribution of this work lies in integrating the adopted PKIBlock with a residual detail-preservation path and the dynamic feature fusion (DFF) module, and embedding the resulting bottleneck into the RepNCSPELAN4 stages of the YOLOv9 backbone. This design preserves fine geometric information while introducing multi-scale contextual representations.
2.
To overcome the challenge of small objects such as distribution towers having a low proportion of pixels and being susceptible to interference from complex backgrounds, this paper proposes the dual-branch semantic-spatial synergy attention (DSSA) module, which significantly enhances the perception ability for small object power towers. This module employs a dual-branch architecture to decouple deep semantic information from shallow spatial information, thereby preventing feature confusion. Through deep synergy between spatial details and semantic information, it enhances the network’s localization accuracy and recognition robustness for minute objects.
3.
This paper proposes a dynamic focal-weighted IoU (DFW-IoU) loss function that addresses the issues of low weighting for small targets during training and sample imbalance between easy and difficult cases, thus improving detection performance. The loss incorporates dynamically adjusted hyperparameters based on the training stage, a scale-sensitive weighting term based on the target area, and a dynamic focal modulation factor. This mechanism encourages the model to place greater emphasis on small-scale targets and reliable samples during training.
The subsequent sections of this paper are organized as follows. The related work is described in Section 2. Section 3 proposes the architecture of the improved model, detailing the structure and principles of the enhanced modules. Section 4 focuses specifically on the experimental design and analysis of the results. Section 5 summarizes the achievements of this research and outlines future research directions in light of the limitations of the study.

2. Related Work

This section primarily reviews research progress on multi-scale feature extraction techniques and object detection loss functions related to power tower inspection.

2.1. Multi-Scale Feature Extraction in Remote Sensing Images

Feature fusion plays an essential role in mitigating scale variation problems in remote sensing imagery. The FPN offered an effective framework for integrating features across multiple scales. Subsequently, PANet [19] enhances the propagation of localization information by introducing bottom-up paths, while BiFPN [20] optimized feature flow efficiency through a weighted bidirectional fusion mechanism. Additionally, researchers have extended the receptive field using large-kernel convolutions to extract multi-scale features, exemplified by SKNet [21], SCNet [22], and LSK-Net [23], which incorporate large-kernel convolutions and the spatial selection mechanism. However, large-kernel convolution may introduce excessive background interference, which can adversely affect the precise localization of small objects. Conversely, dilated convolutions may unintentionally miss fine-grained local details, which may result in overly sparse feature representations. Therefore, the PKINet [24] avoids relying on large-kernel or dilated convolutions to expand the receptive field. Instead, it captures multi-scale texture features by arranging different-sized dilation-free, depthwise separable convolution kernels in parallel, then adaptively fuses these features along the channel dimension to gather local contextual information. Meanwhile, PKINet adopts the CAA module to model long-range contextual dependencies. By complementing each other, these two modules support adaptive representation learning from local details and global context, thereby enhancing remote sensing object detection performance.
In downstream tasks relevant to this paper, multi-scale feature extraction methods have been widely applied. Zha et al. [25] proposed a group-deformable convolution-based bidirectional feature pyramid network (GD-BiFPN) and applied it to remote sensing object detection for transmission towers. Its feature extraction network, built upon GDConv, performs weighted feature fusion of multi-scale feature maps through upsampling and max-pooling operations, thereby obtaining richer feature representations. Fu et al. [26] also developed a feature fusion framework for constructing hierarchical multi-scale feature representations. Through the top-down path, shallow features are enhanced by deep semantic information, whereas the bottom-up path incorporates shallow details into deeper feature maps. By fusing features across different layers, the network obtains robust representations for multi-scale object detection. Zhu et al. [27] proposed TPH-YOLOv5, in which the conventional YOLOv5 detection heads were replaced with Transformer-based prediction heads to better handle scale variations in drone aerial images. Zhang et al. [28] introduced a CAD-Net to model both local and global contextual information by exploring the relationships between objects and the overall scene, as well as their associations with surrounding objects or features. Shi et al. [29] proposed the LSKF-YOLO to detect power towers in remote sensing imagery. By introducing a large spatial selective kernel mechanism and an attention-based feature fusion module, it enlarges the receptive field to capture richer contextual cues while strengthening the model’s feature representation capacity. Yan et al. [30] expanded the model’s receptive field using the large separable kernel attention, providing richer feature details for utility tower localization. Xu et al. [31] used image super-resolution to sharpen power towers in remote sensing images, and then performed tower detection using SCOPE-YOLO, which effectively reduced the number of small missed objects, but greatly increased the computational load on the model. Although these approaches partially mitigate the scale issue, they remain insufficient in balancing the structural integrity of large objects with the preservation of fine-grained features in small objects.

2.2. Loss Functions in Object Detection

Within the object detection domain, the loss function defines the discrepancy between model predictions and ground truth values, directly influencing the model’s optimization direction and ultimate performance. During the recent period, the evolution of loss functions in object detection has shown a trend from simple geometric distance metrics toward complex IoU variants and distribution alignment approaches, with the evolution of the YOLO series models being particularly representative. In early versions of the YOLO series (e.g., YOLOv1), bounding box regression primarily relied on mean squared error (MSE) to directly optimize center coordinates and dimensions. However, this approach neglected the geometric integrity of the bounding box as a whole and lacked robustness for objects of varying scales. Subsequently, the introduction of IoU Loss unified evaluation metrics and loss functions. However, it encountered vanishing gradient issues when prediction and ground truth boxes do not overlap. To address this, Rezatofighi et al. [32] proposed Generalized IoU (GIoU), resolving the non-differentiability problem by introducing the minimum bounding rectangle as a penalty term. Building upon this, to further enhance convergence speed and resolve the limitations of GIoU degenerating into IoU Loss, Zheng et al. successively proposed DIoU [33] and CIoU [34], incorporating center point distance and aspect ratio consistency, respectively. Among these, CIoU has been widely adopted in YOLOv4 and subsequent versions due to its comprehensive nature.
Recent research has further investigated the potential of geometric constraints and sample quality distribution. Gevorgyan et al. [35] proposed SCYLLA-IoU (SIoU), which innovatively introduced an Angle Cost to accelerate network convergence by reducing regression degrees of freedom. Tong et al. [36] introduced Wise-IoU (WIoU), featuring a dynamic non-monotonic focusing mechanism that dynamically allocates gradient gains based on outlier scores to optimize sample quality. Ma et al. [37] proposed MPDIoU loss, which regresses the most fundamental geometric properties of bounding box regression. It achieves alignment by minimizing the direct distance between two key pairs. Zhang et al. [38] introduced Shape-IoU, which improves bounding box regression by formulating the loss based on the intrinsic shape and scale characteristics of the bounding box. Liu et al. [39] proposed Powerful-IoU to address inappropriate penalty terms in existing IoU-based loss functions. By integrating target-size-sensitive penalty terms with anchor-quality-based gradient modulation functions, it achieves faster convergence than conventional IoU-based loss functions. For power tower detection tasks, most studies employ either the default detection model loss function or previously proposed losses. Examples include the Wise-IoU loss used in references [17] and the MPDIoU loss used in references [29]. These approaches lack task-specific loss function refinements tailored to the task’s characteristics.
However, existing loss functions often struggle to specifically address the issues of underweighting small object samples and imbalanced distribution of easy and difficult samples during dynamic training. This is particularly evident in the task of detecting power towers in remote sensing imagery, where small-object towers are easily overlooked. Therefore, designing a loss function that dynamically balances sample weights and focuses on small objects is crucial for improving detection performance.

3. Proposed Method

The YOLO-based detectors have been extensively used in industrial inspection scenarios because they provide an effective balance between detection accuracy and inference efficiency, making them representative lightweight object detection frameworks. However, power pylons in remote sensing imagery typically manifest as minute skeletal structures and occupy a negligible proportion of pixels with sparse textures. They are highly vulnerable to interference from complex backgrounds, such as mountain ranges and vegetation, causing traditional CNN to readily lose critical features during the downsampling process. However, YOLOv9 [40] distinguishes itself from other YOLO variants by incorporating auxiliary reversible branches within its architecture. This facilitates the generation of reliable gradient flows, enabling deep networks to preserve the original detail information of the input images. This mechanism ensures the model can accurately capture easily missed sparse small objects even within deep feature maps. Given these advantages, YOLOv9 is adopted as the baseline in this study.
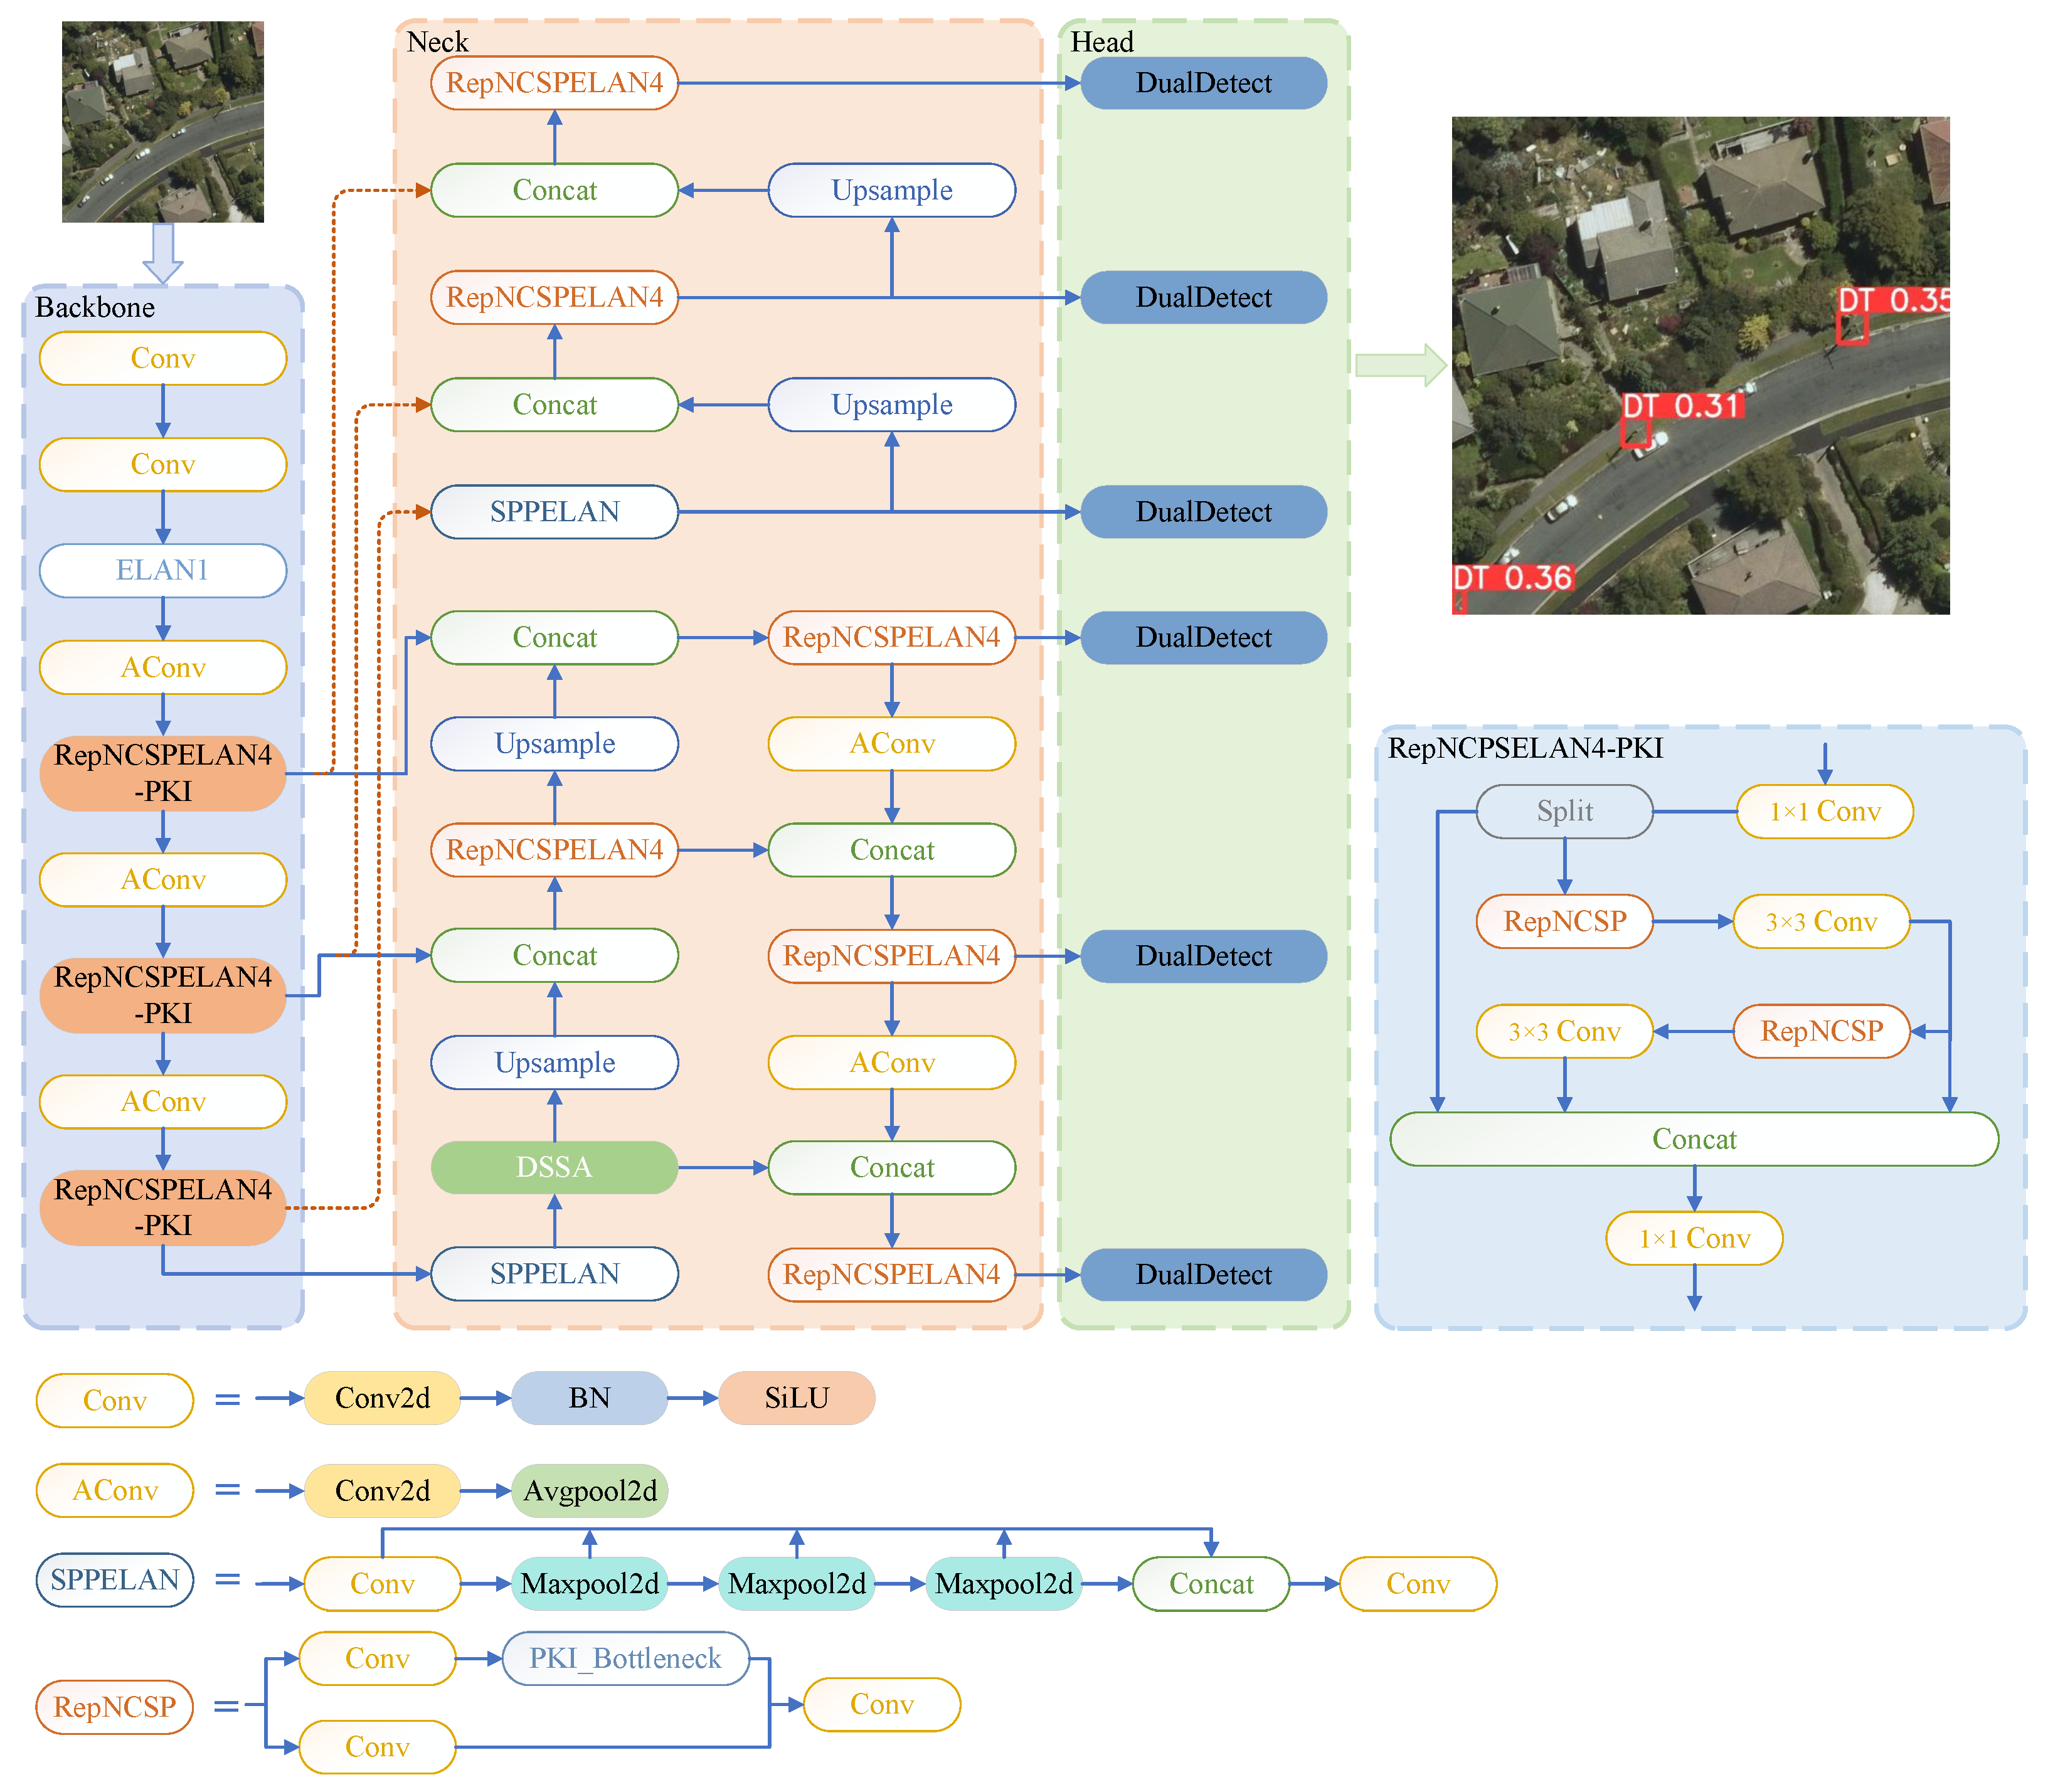
In this study, YOLOv9s is further optimized for power tower detection in satellite remote sensing imagery. The improved network is termed MS-YOLO. The model architecture is illustrated in Figure 1. The PKI_Bottleneck module is inserted into the backbone’s RepNCSPELAN4 layer to enhance the model’s multi-scale feature extraction abilities while better utilizing contextual information. Secondly, a DSSA module is inserted after the backbone, embedding shallow spatial positional information into deep semantic features. This multi-level feature interaction and fusion improves the model’s perception of small objects. Finally, the DFW-IoU loss function assigns greater gradient-update weights to small objects during training, allowing the model to focus small power-tower targets more effectively.
MS-YOLO is not constructed by arbitrarily stacking independent modules. Its architecture follows the sequential requirements of feature representation, feature refinement, and localization optimization in power tower detection. Specifically, the large scale difference between distribution and transmission towers first requires the backbone to capture contextual information under different receptive fields. Therefore, PKI_Bottleneck is introduced into the backbone to enrich multi-scale representations while retaining the original detail features through a residual path. However, multi-scale contextual enhancement may also amplify responses from roads, buildings, vegetation, and tower shadows. DSSA is consequently placed after the backbone to recalibrate the enhanced features, preserve spatially sensitive responses, and suppress irrelevant background activations. Finally, improved feature representations alone cannot guarantee accurate bounding-box regression for extremely small towers because their contribution to the conventional regression loss remains limited. DFW-IoU therefore operates at the optimization level to assign stronger and dynamically adjusted regression gradients to small and difficult samples. Accordingly, the three components address different but consecutive stages of the detection pipeline. PKI_Bottleneck improves what information is extracted, DSSA determines which information should be emphasized, and DFW-IoU controls how the detector is optimized. Their complementary roles form the methodological basis of the proposed MS-YOLO.

3.1. Poly Kernel Inception Bottleneck Module

Power towers exhibit significant scale variations in remote sensing imagery. Specifically, large transmission towers feature complex structures and substantial dimensions, whereas distribution towers are comparatively smaller, rendering single-scale features inadequate for comprehensive detection. To address the multi-scale challenge in detecting power towers within remote sensing imagery, this paper enhances the model’s backbone by incorporating the PKI_Bottleneck module. This modification improves the model’s ability to extract multi-scale features of power towers within complex backgrounds.
It should be clarified that the PKIBlock used in this study originates from PKINet [24]. Therefore, the parallel depth-wise convolutions and the contextual attention mechanism within the original PKIBlock are not claimed as methodological innovations of this work. Directly replacing the original YOLOv9 bottleneck with PKIBlock, however, may cause incompatibility between the multi-scale contextual features generated by PKIBlock and the detailed features propagated through the YOLOv9 backbone. To address this issue, this study constructs a task-specific PKI_Bottleneck by combining PKIBlock with a residual branch and the dynamic feature fusion module. The novelty therefore lies in the structural adaptation of PKIBlock to RepNCSPELAN4 and in the selective backbone placement designed for power tower detection, rather than in the original PKIBlock itself.
The primary structure within the PKI_Bottleneck module is the poly kernel inception block (PKIBlock). Previous approaches have expanded the receptive field of models through large convolutional kernels or dilated convolutions. Nevertheless, large kernel convolutions may incorporate irrelevant background responses, potentially compromising the accurate detection of small objects. While dilated convolutions effectively broaden the receptive fields, their discontinuous sampling pattern may reduce the preservation of fine local details and produce relatively sparse feature representations. Unlike these receptive-field expansion strategies, PKIBlock adopts several parallel depth-wise convolution branches with different kernel sizes and does not rely on dilation. This design allows dense texture patterns to be captured under multiple receptive-field ranges, thereby enhancing the model’s capacity to cope with scale diversity and complex contextual cues in remote sensing scenes. Furthermore, the CAA mechanism is embedded to model long-range dependencies, complementing local texture extraction with broader contextual awareness.
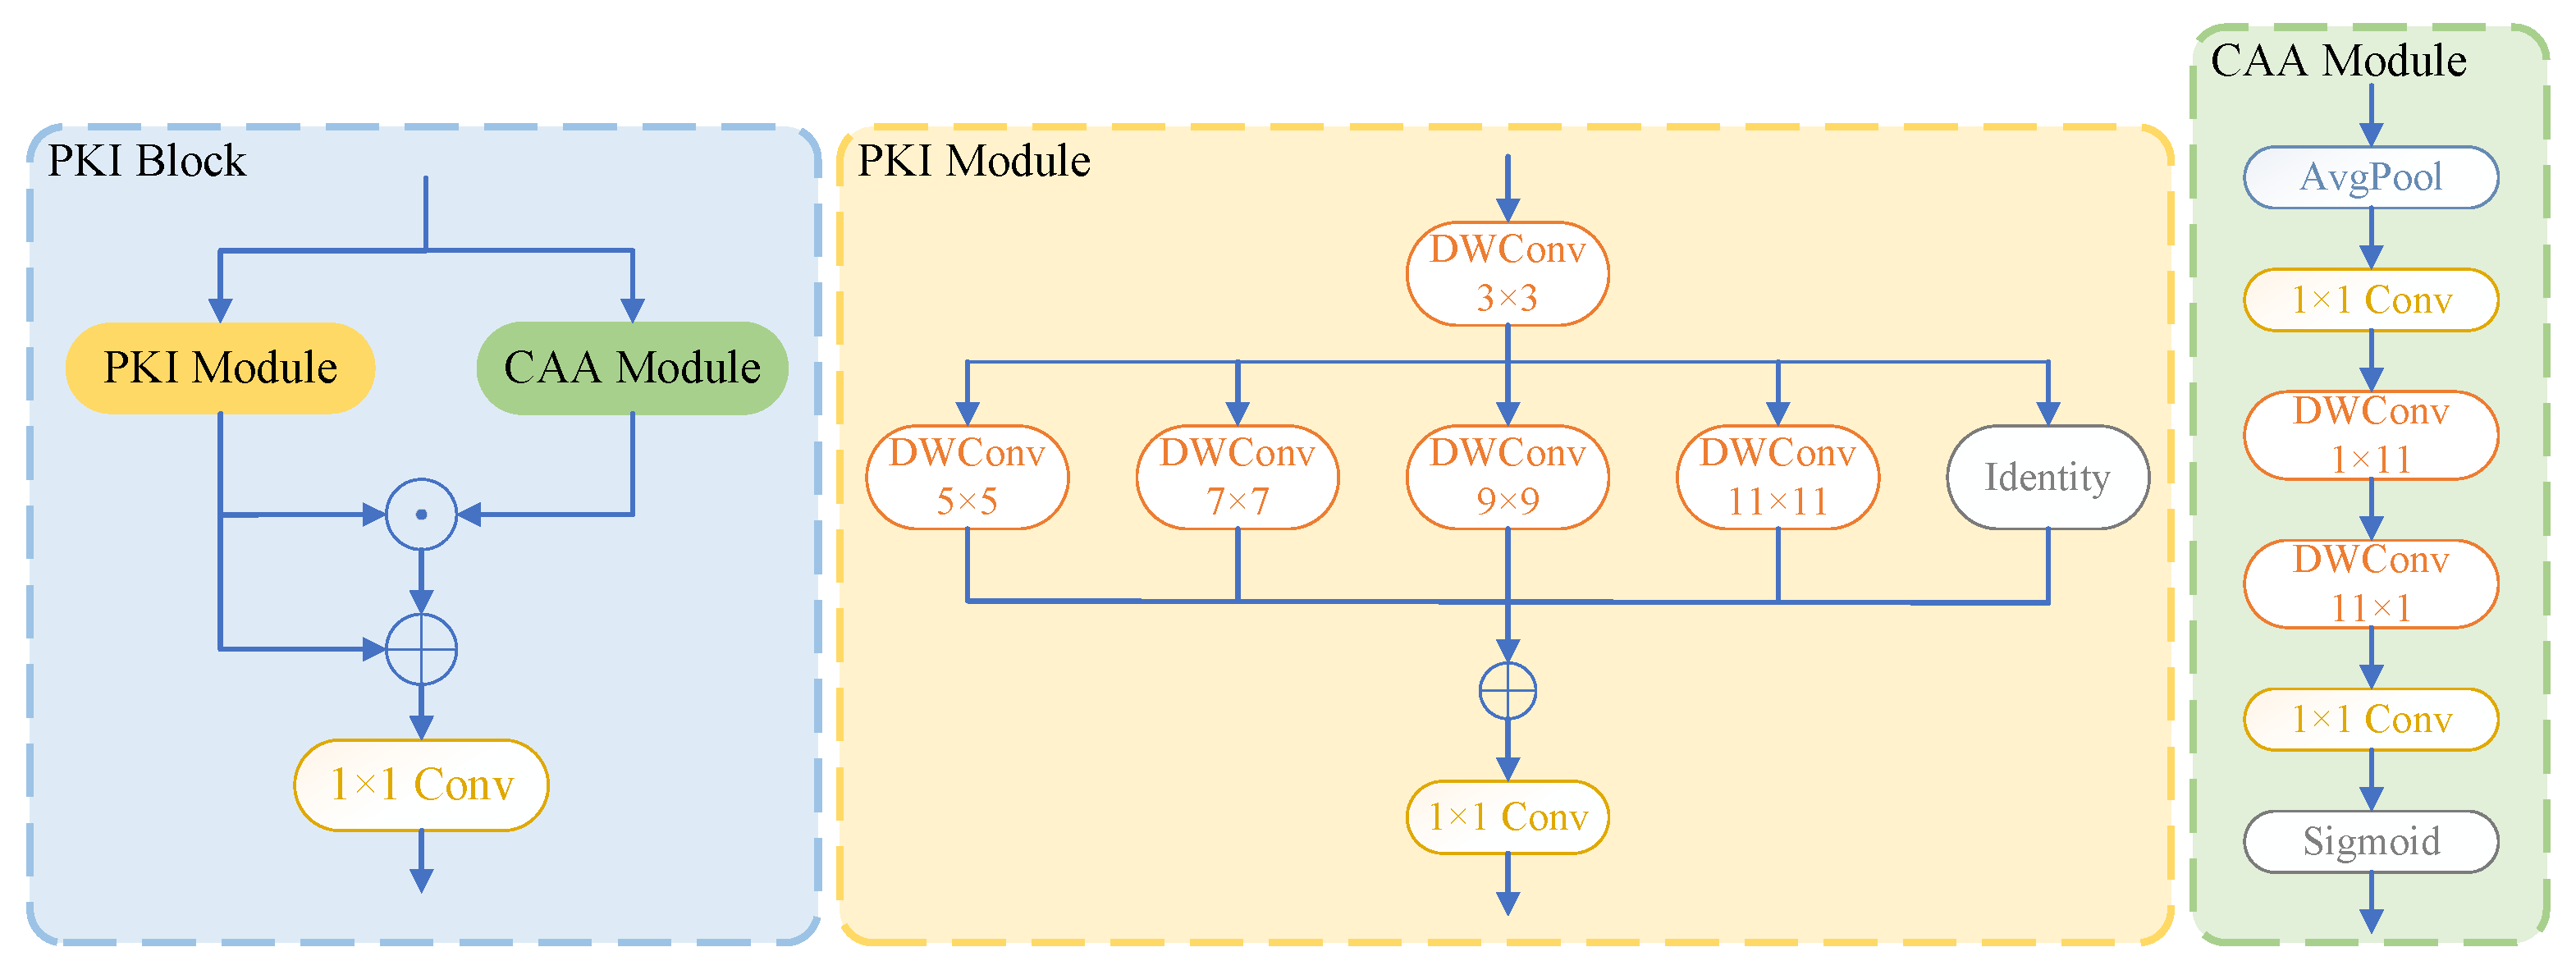
As illustrated in Figure 2, PKIBlock consists mainly of two branches, namely the CAA module and the PKI module. The PKI Module adopts an inception-like architecture, first employing a small 3 × 3 convolution to capture elementary local texture features. Subsequently, it utilizes four depth-wise convolutions of different sizes (5 × 5, 7 × 7, 9 × 9, 11 × 11) without dilation in parallel to extract contextual representations under different receptive-field ranges. This approach avoids the issues of excessive background noise introduced by large kernels or overly sparse features caused by dilated convolutions. These multi-scale features are subsequently fused through a 1 × 1 convolution to integrate information across different scales. In parallel, the CAA is employed to model long-range contextual dependencies and further enhance global context perception. It first acquires foundational context through global average pooling, then employs one-dimensional strip convolution along the vertical and horizontal axes to capture correlations between distant pixels. The sigmoid function generates attention weights to enhance feature representations in central regions. Finally, the multiscale local features extracted by PKIBlock synergize with the long-range contextual cues captured by the CAA module. This enables PKIBlock to adaptively fuse local details with global context, significantly enhancing its detection capability for objects with substantial scale variations in power towers within remote sensing images.
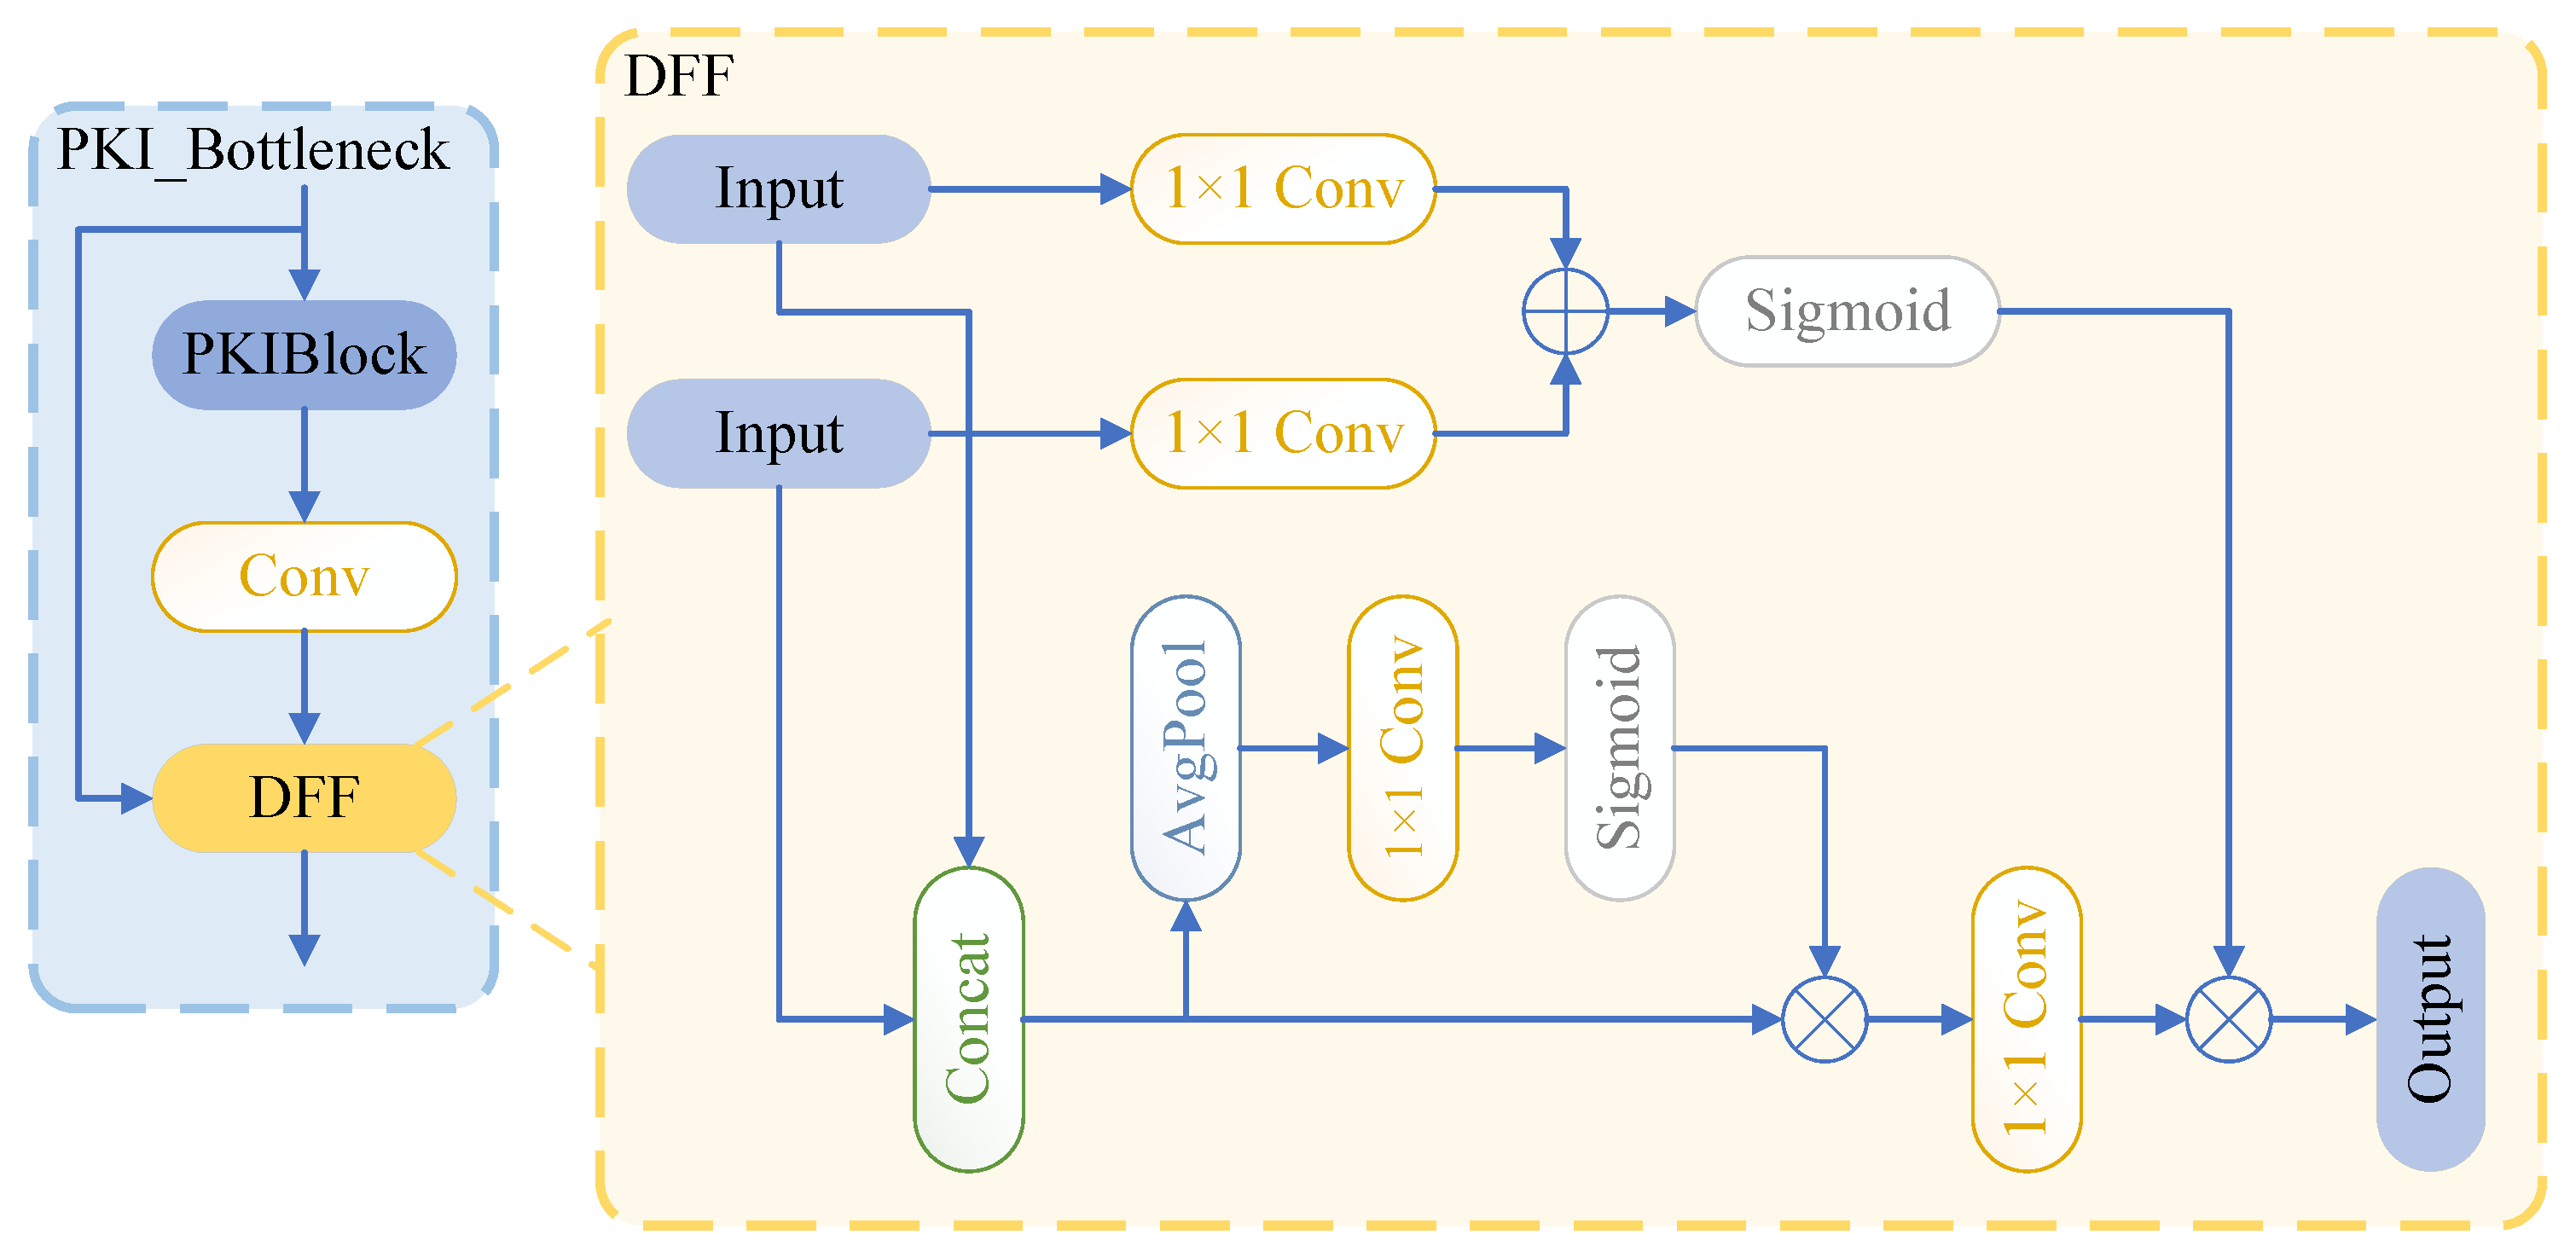
Although PKIBlock is capable of effectively capturing multi-scale dense textures, introducing it directly into the deep architecture of YOLOv9 often leads to semantic mismatches and feature conflicts between deep abstract semantic information and shallow fine geometric details. To address this structural incompatibility, this paper does not directly incorporate the PKIBlock. Instead, by introducing residual connections, it combines the PKIBlock, 3 × 3 convolution, and DFF module [41] to construct the PKI_Bottleneck module, as illustrated in Figure 3. Unlike potential feature conflicts or information loss caused by simple element-wise summation in traditional models, the core concept of the DFF module is to introduce a nonlinear, content-based weight generation mechanism. It typically begins by spatially aligning deep features rich in semantic information with shallow features containing fine geometric details. Subsequently, it utilizes a specific convolution branch to predict a spatially position-sensitive weight map, which is then normalized via a sigmoid function. This process enables the model to dynamically learn and assign fusion ratios across different feature layers for each pixel location in the image. Consequently, it adaptively enhances the response of effective features while suppressing background noise in target regions. Ultimately, this pixel-level adaptive weighted fusion generates feature representations with stronger semantic content and more precise localization.
The introduction of the DFF module within the PKI_Bottleneck architecture enables adaptive weighting of multi-scale semantic features extracted by PKIBlock and the raw details of residual paths. This approach not only effectively resolves potential feature conflicts or information loss caused by simple element-wise summation but also enhances target region features while suppressing background noise. Consequently, it ensures efficient integration and precise transmission of deep contextual information and shallow geometric details in complex scenes.

3.2. Dual-Branch Semantic-Spatial Synergy Attention

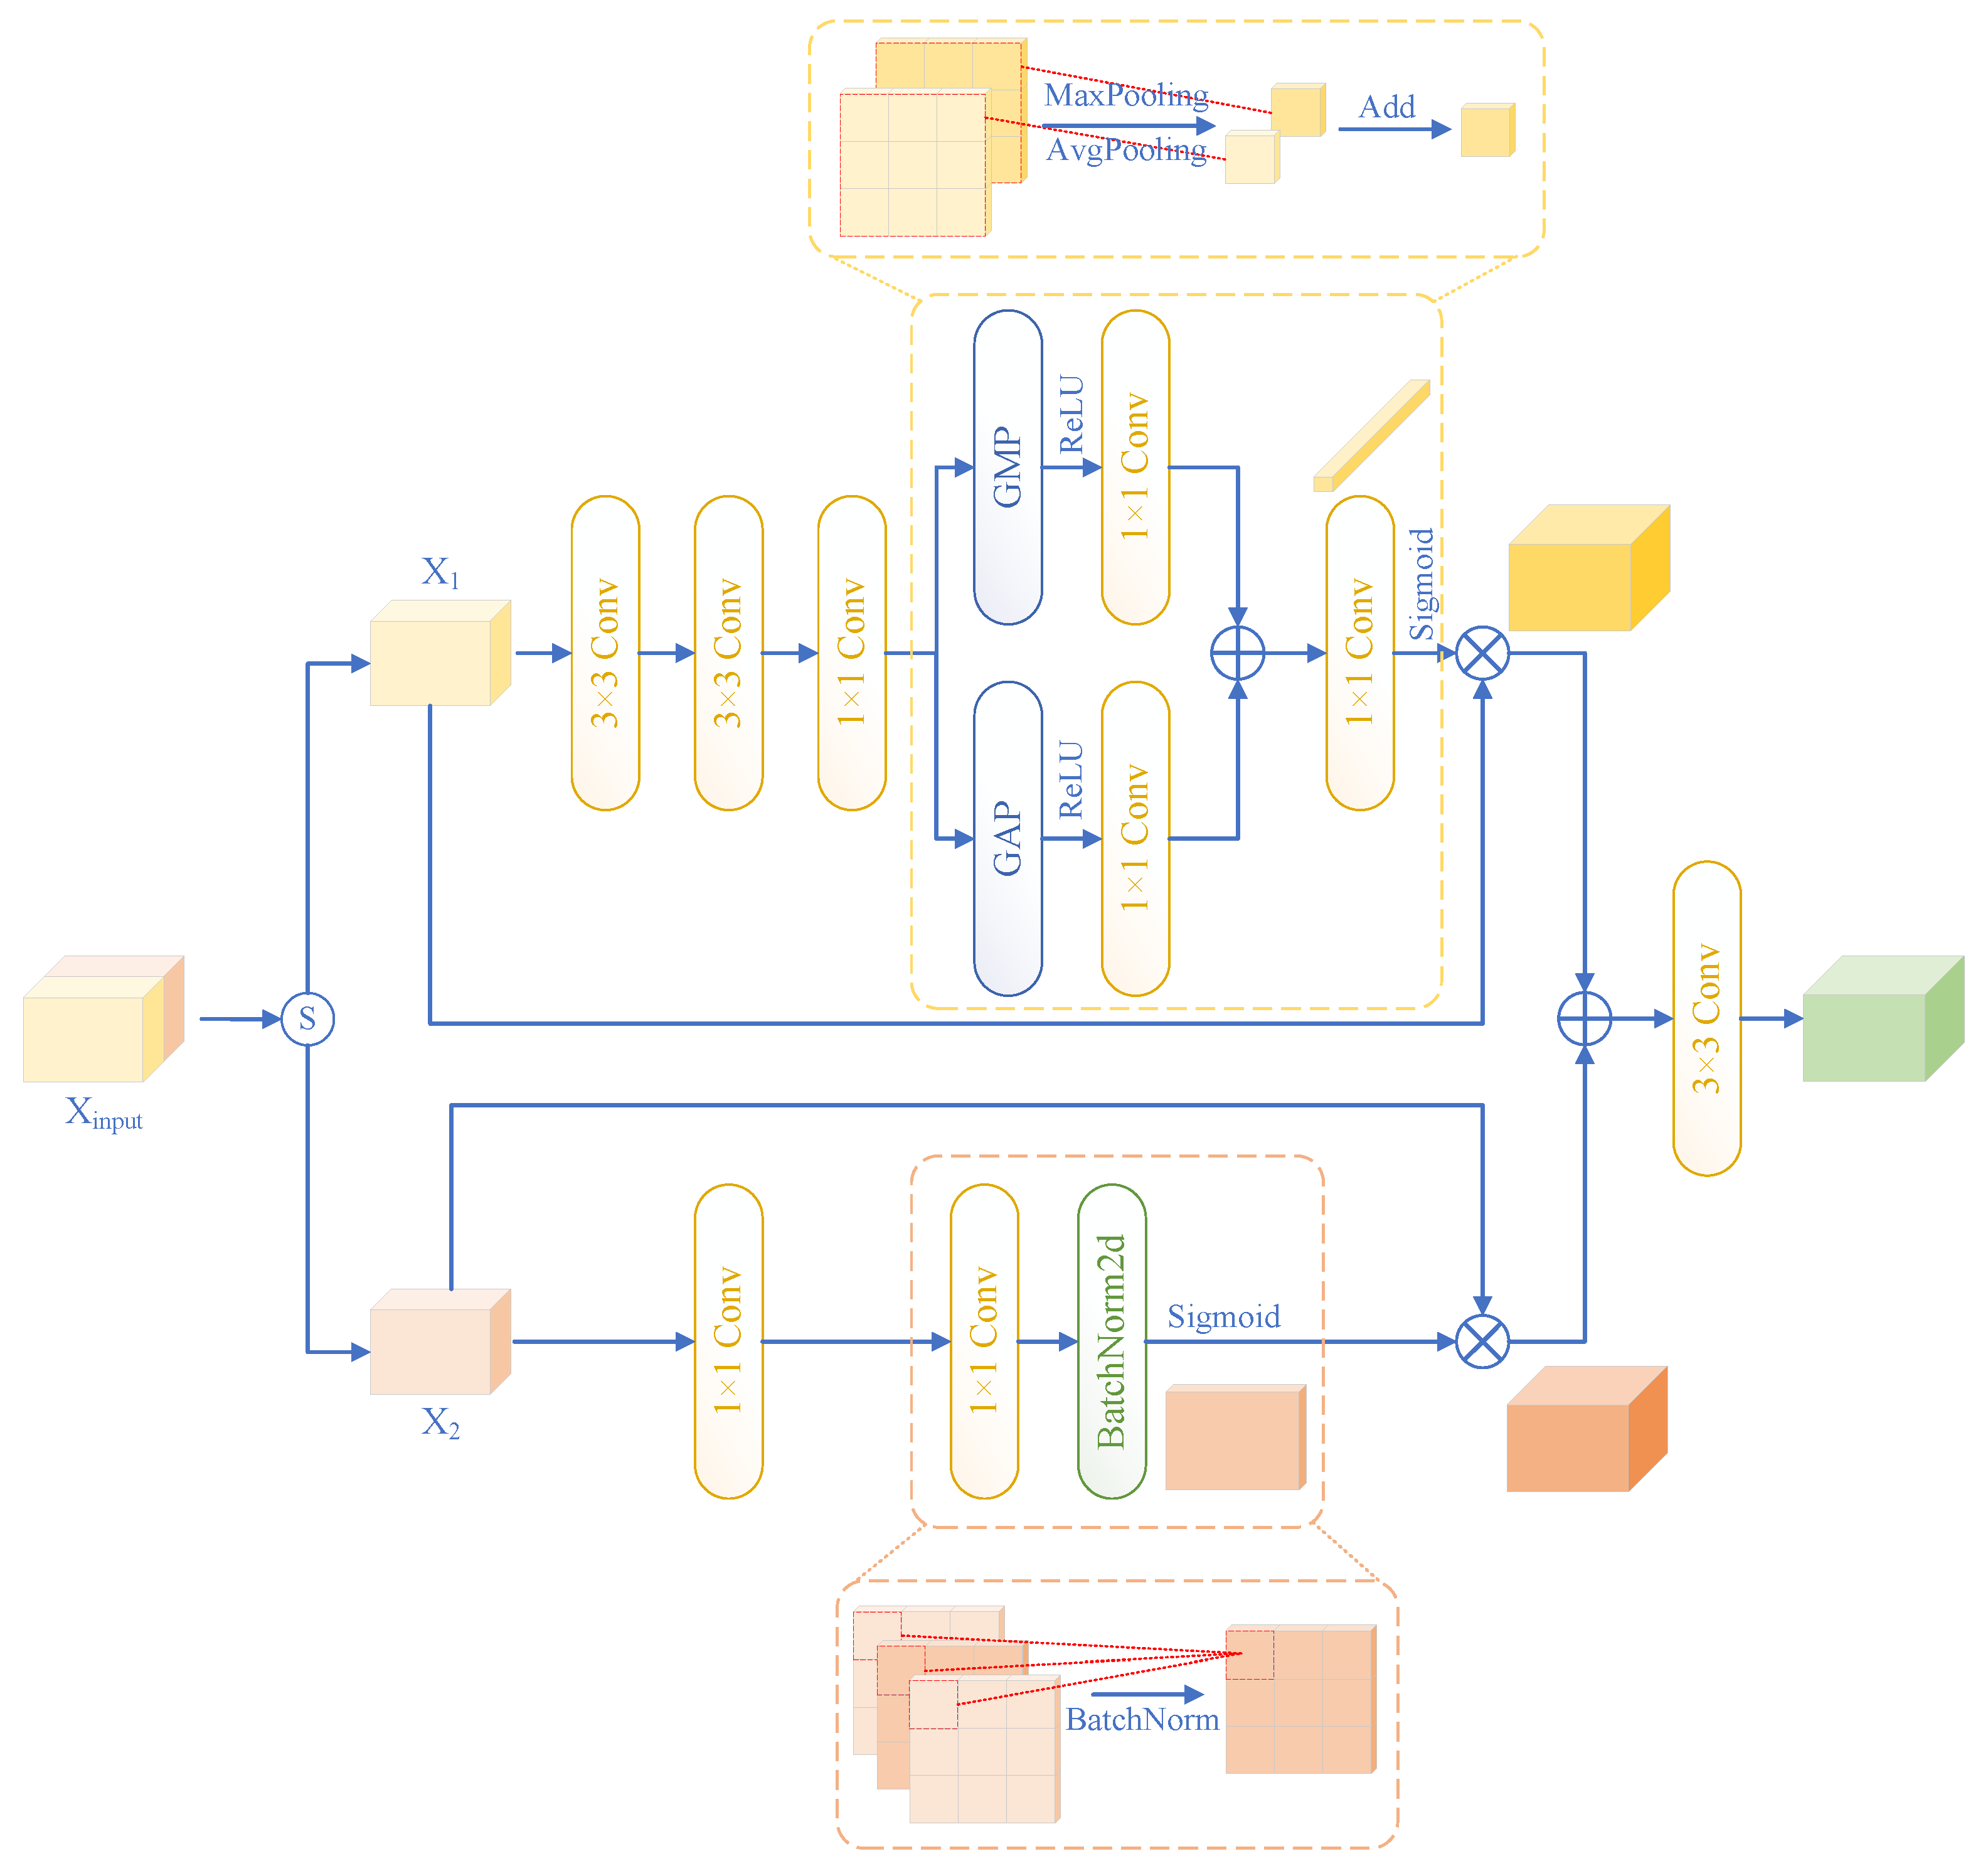
To address the challenge of feature perception in remote sensing images, where power tower objects are minuscule and background interference is intense, this paper proposes a dual-branch semantic-spatial synergy attention module. Designed to improve the model’s ability to capture small-scale objects and strengthen its feature representation capabilities, the structure is shown in Figure 4. It should be clarified that DSSA is not intended to redefine the general concept of spatial-channel attention. Its contribution lies in a task-specific parallel feature-decoupling structure designed for small and sparsely represented power towers. Unlike SE, which performs only global channel recalibration, and CBAM, which sequentially applies channel and spatial attention to the same feature tensor, DSSA separates the input feature into two channel groups and processes them independently. This design avoids forcing spatial-detail enhancement and semantic-response recalibration to operate on the same feature stream.
In the DSSA module, the input feature ( X i n p u t ) is first split into two independent branches, each responsible for carrying shallow spatial information and deep semantic information. This splitting operation effectively decouples feature processing at different levels, preventing mutual interference between semantic abstraction and spatial details within a single path. This enables better integration of multi-level visual cues, laying the foundation for subsequent precise detection.
During the feature interaction phase, the DSSA module uses differentiated convolution strategies for different information streams. For branches containing low-level spatial information, the module utilizes standard 3 × 3 convolutions to extract richer local texture and shape features through their receptive fields while fully leveraging inter-channel correlations. Meanwhile, branches that carry high-level semantic information undergo pointwise convolution processing. The introduction of pointwise convolution not only significantly reduces computational redundancy but, more critically, avoids information loss caused by excessive downsampling. This ensures the complete preservation of shallow spatial positional information, which is crucial for detecting small objects. Subsequently, each branch generates corresponding channel attention weights and spatial attention masks through their respective pass-through and spatial paths, and then multiply them element-wise with the corresponding segmented feature maps to adaptively recalibrate the feature responses.
Finally, the two streams of attention-enhanced features are fused through element-wise addition and pass through a 3 × 3 convolution to produce the final feature representation. This design enables the DSSA module to achieve deep synergy between spatial details and semantic information while preserving small-target representations in deeper network stages. In the power tower detection task, this mechanism significantly enhances the saliency of tower structures against complex backgrounds while suppressing irrelevant environmental noise. Consequently, it substantially enhances the model’s localization accuracy and recognition robustness for minute power towers across multi-scale scenes.

3.3. Dynamic Focal-Weighted IoU Loss

To address the issue of insufficient localization accuracy caused by low regression weights during backpropagation due to the small proportion of power tower objects in remote sensing imagery, this paper proposes the DFW-IoU loss function. It aims to optimize the gradient allocation mechanism during the regression process of the bounding box. While traditional IoU loss and its variants (e.g., CIoU, SIoU) account for geometric factors like overlap area, center distance, and aspect ratio, they often treat samples of all scales equally during training. This may cause networks to overfit large objects while neglecting small power towers and may prevent them from effectively distinguishing between easy and challenging samples. To address this, DFW-IoU retains CIoU’s geometric advantages while innovatively introducing a scale-sensitive weighting term based on target area and a Focal modulation term based on regression quality.
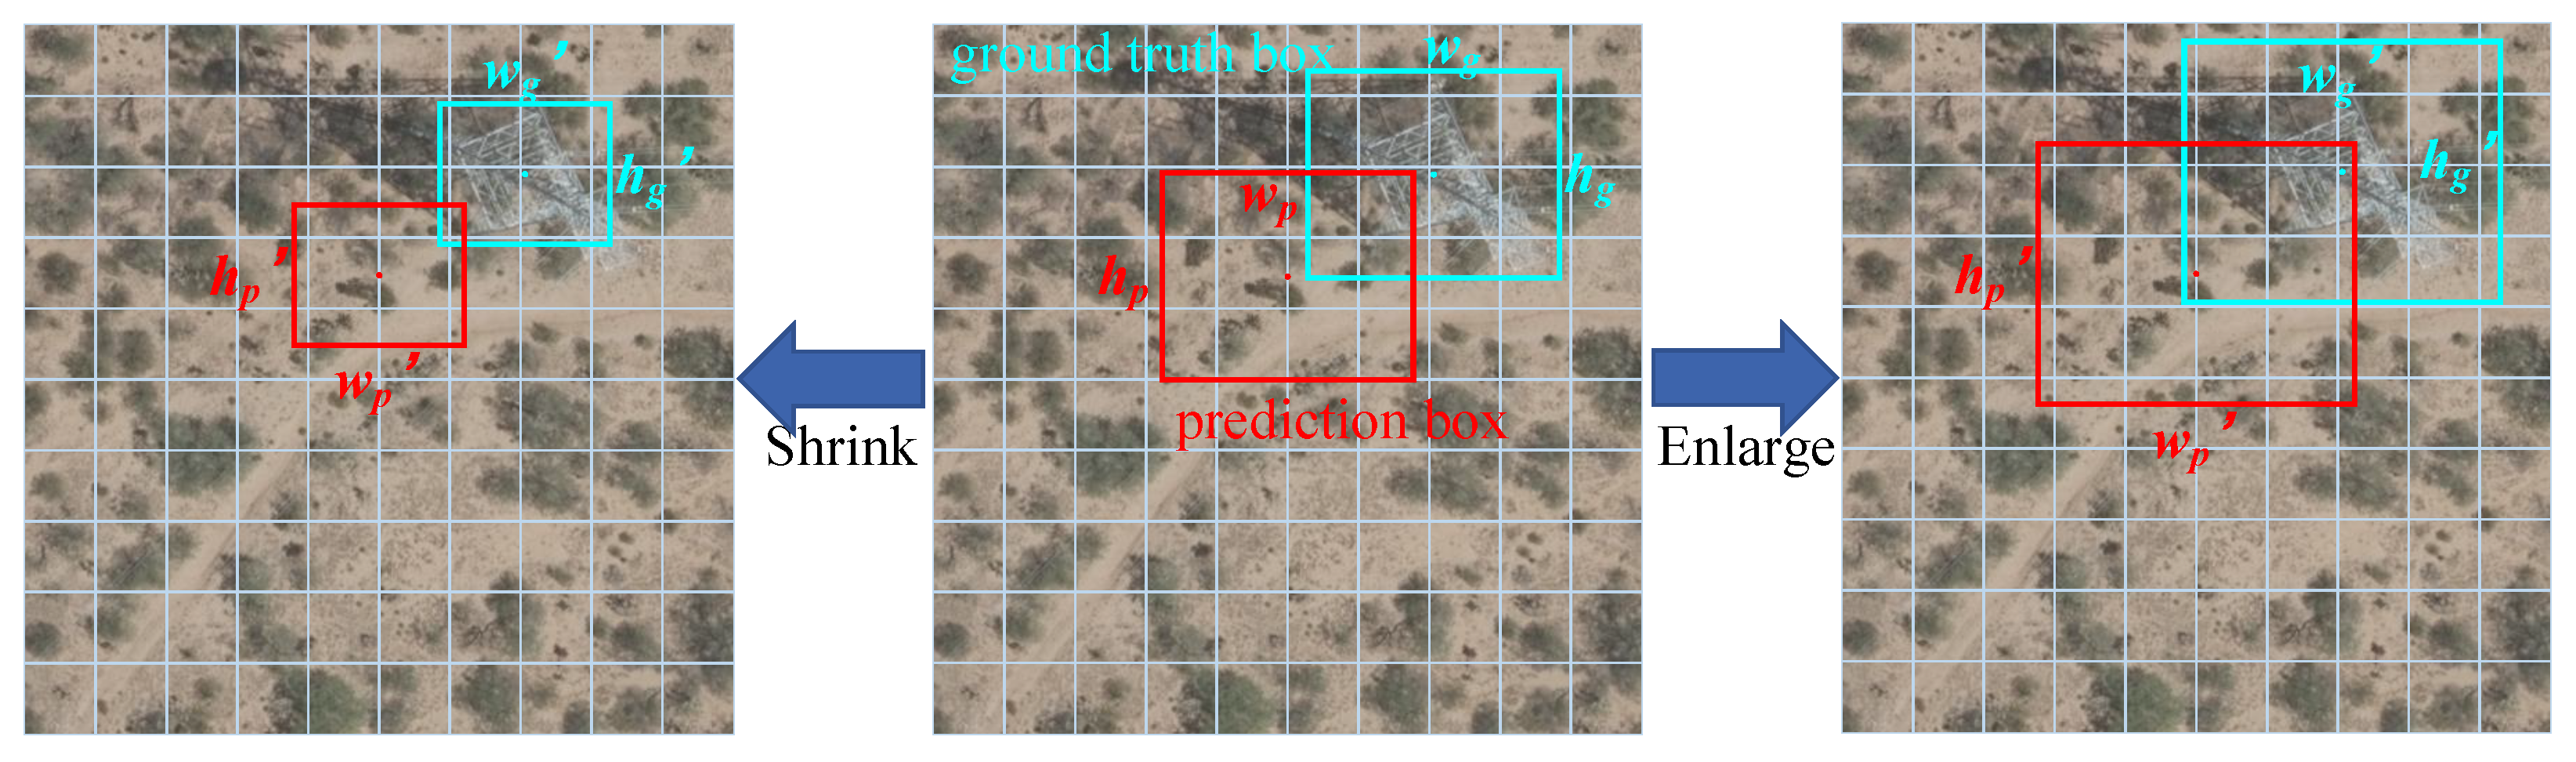
Specifically, the DFW-IoU loss introduces a dynamic hyperparameter r that is epoch-dependent. Its value gradually decreases linearly with each training epoch, while the height and width of the bounding box also change accordingly. The formula is as follows:
r ( e ) = 0.005 · e + 2 , e [ 0 , 300 ] w p = w p · r ( e ) , h p = h p · r ( e ) w g = w g · r ( e ) , h g = h g · r ( e )
where e represents the model training epoch, w g and h g represent the width and height of the ground truth box, w p and h p represent the width and height of the prediction box. In the initial phase, r > 1 , causing the bounding boxes to be enlarged. The model focuses on numerous but lower-quality positive samples to accelerate convergence. As training progresses, r gradually decreases below 1, causing the bounding boxes to shrink, as shown in Figure 5. This mechanism aims to reduce the IoU value and amplify the bounding box regression loss for high-quality predictions with high IoU values, thereby granting them greater weight in gradient updates. Conversely, shrinking bounding boxes for low-quality predictions with near-zero IoU values has negligible impact on their IoU. Conversely, enlarging the bounding box produces the opposite effect. Consequently, the model’s attention progressively shifts toward high-quality samples, thereby enhancing the final detection accuracy.
To address the issue of small objects receiving disproportionately low weighting in loss calculations, DFW-IoU first defines a nonlinear area compensation weight w s c a l e . This weight is inversely proportional to the actual area of the target bounding box, with the aim of forcing the network to assign greater gradient responses to small-scale objects during backpropagation. This scale weight is defined as:
w s c a l e = 4 w g · h g + ε 1 2
where ε is an extremely small number that prevents the denominator from becoming zero. This term ensures that the smaller objects receive greater weight in gradient updates, while smoothing out the sharp fluctuations caused by area changes through a square root transformation. It also significantly enhances the regression weights for small power towers. Second, to reduce the imbalance between easy and difficult samples, the loss function uses a dynamic modulation mechanism similar to focal loss. By calculating the IoU value between the prediction bounding box and its corresponding ground truth box, the focal modulation factor w f o c a l is defined as follows:
w f o c a l = ( 1 I o U ) 2
When the prediction box overlaps minimally with the ground truth box (i.e., difficult samples), w f o c a l approaches 1, preserving the loss value. Conversely, when the IoU is high (i.e., easy samples), the weight rapidly decays, thereby directing the model to focus on optimizing the bounding boxes that are challenging to align. Therefore, it primarily emphasizes samples that remain difficult at the current training stage rather than directly increasing the weight of high-quality predictions.
Additionally, to further strengthen geometric constraints, DFW-IoU explicitly incorporates an auxiliary penalty term d c e n t e r based on normalized center distance during computation. This term constrains center position accuracy and is defined as the ratio of the squared Euclidean distance between the prediction box center ( x p , y p ) and the ground truth box center ( x g , y g ) to the square of the ground truth box dimensions. The calculation formula is as follows:
d c e n t e r = x p x g 2 + y p y g 2 w g 2 + h g 2 + ε
Finally, the proposed DFW-IoU loss, denoted by L D F W , combines the CIoU loss with the scale-sensitive weight, focal modulation factor, and center-distance penalty. This design not only achieves pixel-level adaptive hard instance detection and scale rebalancing through w s c a l e and w f o c a l , but also further accelerates the convergence of prediction boxes toward ground truth boxes through d c e n t e r . Its calculation formula is as follows:
L D F W = w s c a l e · w f o c a l · ( L C I o U + 0.25 · d c e n t e r )
Through this multidimensional dynamic weighting strategy, DFW-IoU effectively improves the model’s ability to detect small power towers in complex backgrounds, significantly improving detection robustness while maintaining localization accuracy.

4. Experimental Results and Analysis

This section evaluates the detection capability of MS-YOLO for power tower identification in satellite remote sensing imagery through experimental analysis. We first describe the datasets used, followed by the experimental setup and parameters, as well as the selection of evaluation metrics. Next, we compare MS-YOLO with other mainstream detection methods, including robustness experiments and visualization experiments. Finally, this paper conducts ablation experiments to analyze the impact of individual modules, thereby validating the effectiveness of the proposed method.

4.1. Datasets and Training

Two datasets were employed in the experiments to comprehensively evaluate the effectiveness of the improved model. These two datasets are the Satellite Remote Sensing Power Tower Dataset (SRSPTD) [29] and the Gao Fen Tower Dataset (GFTD) [30].
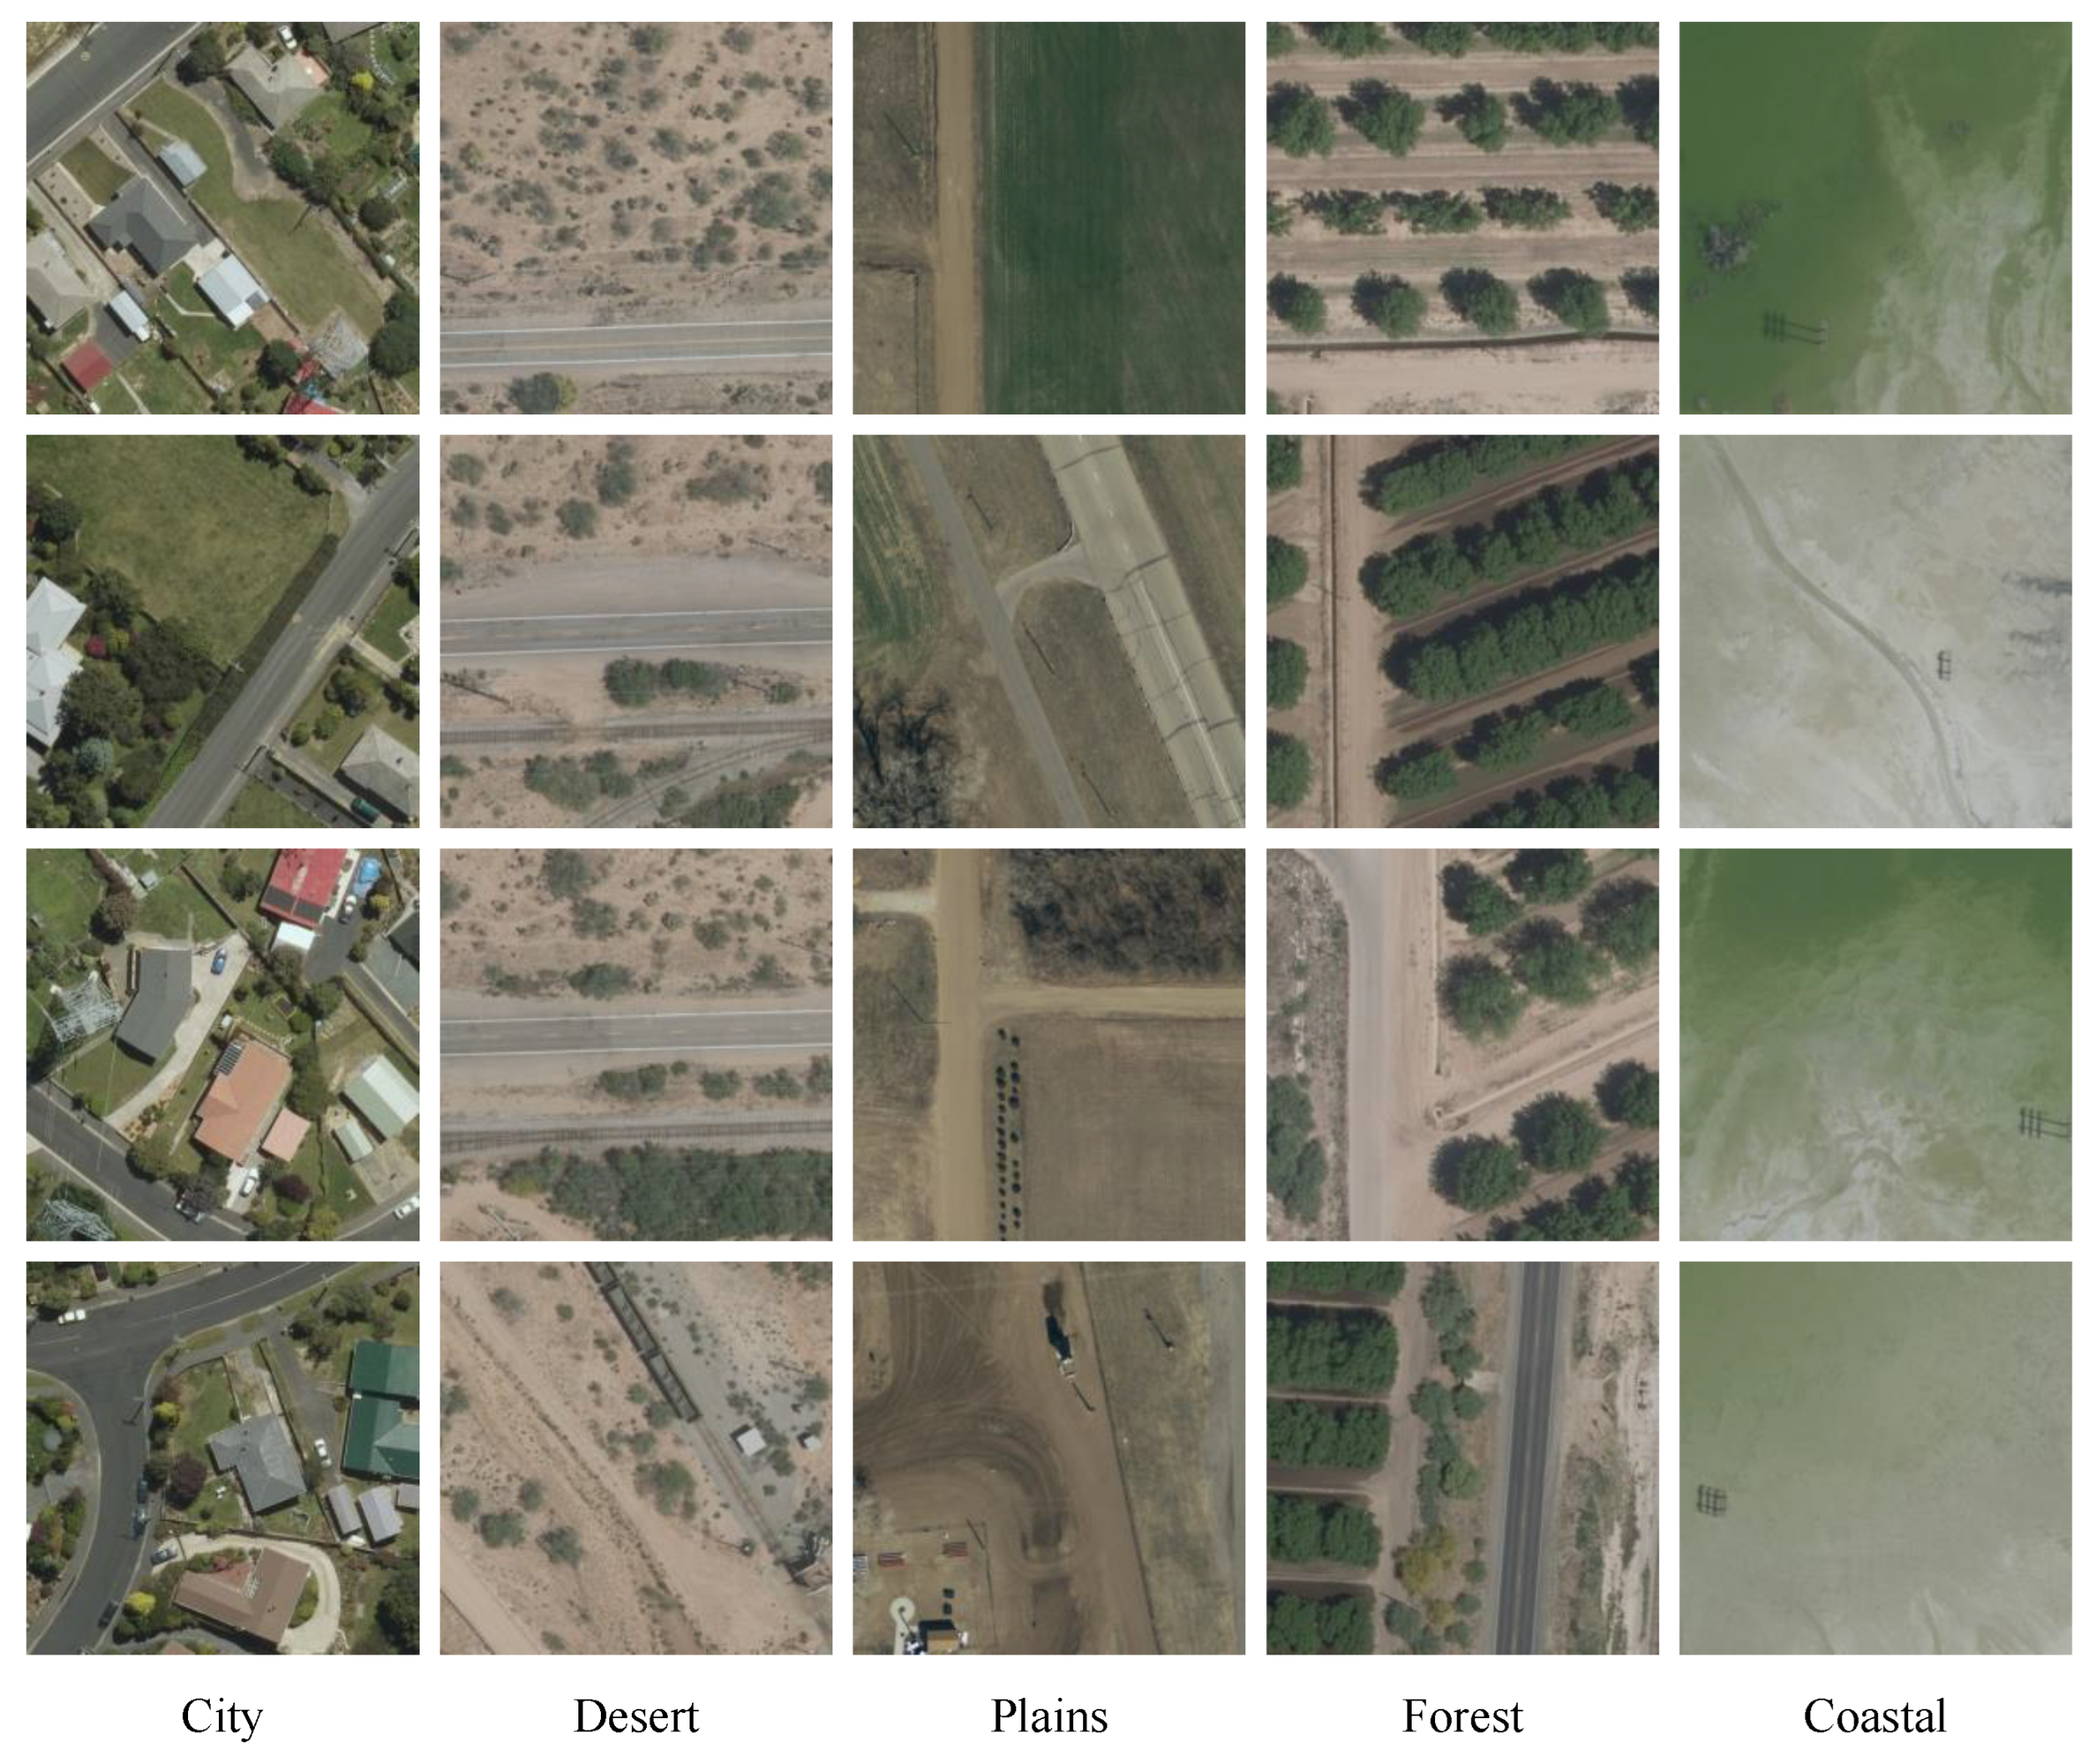
The SRSPTD dataset originates from images of distribution and transmission towers collected through the Bass Connections Project at Duke University. This dataset features extensive coverage, encompassing six representative regions: Arizona, Connecticut, Kansas, and North Carolina in the United States, as well as Tauranga and Dunedin in New Zealand. In terms of geographic and environmental characteristics, this dataset is highly diverse, covering four types of landform: desert, plain, forest, and coastal areas. It also spans three different population density regions: urban, suburban, and rural. Through preprocessing steps including filtering, cropping, and re-annotation, a satellite remote sensing power tower dataset comprising 2740 samples was ultimately constructed. The dataset contains two categories: distribution towers (DT) and transmission towers (TT), strictly divided in an 8:1:1 ratio. As shown in Figure 6, the dataset contains power tower samples collected from different terrain backgrounds and population-density settings.
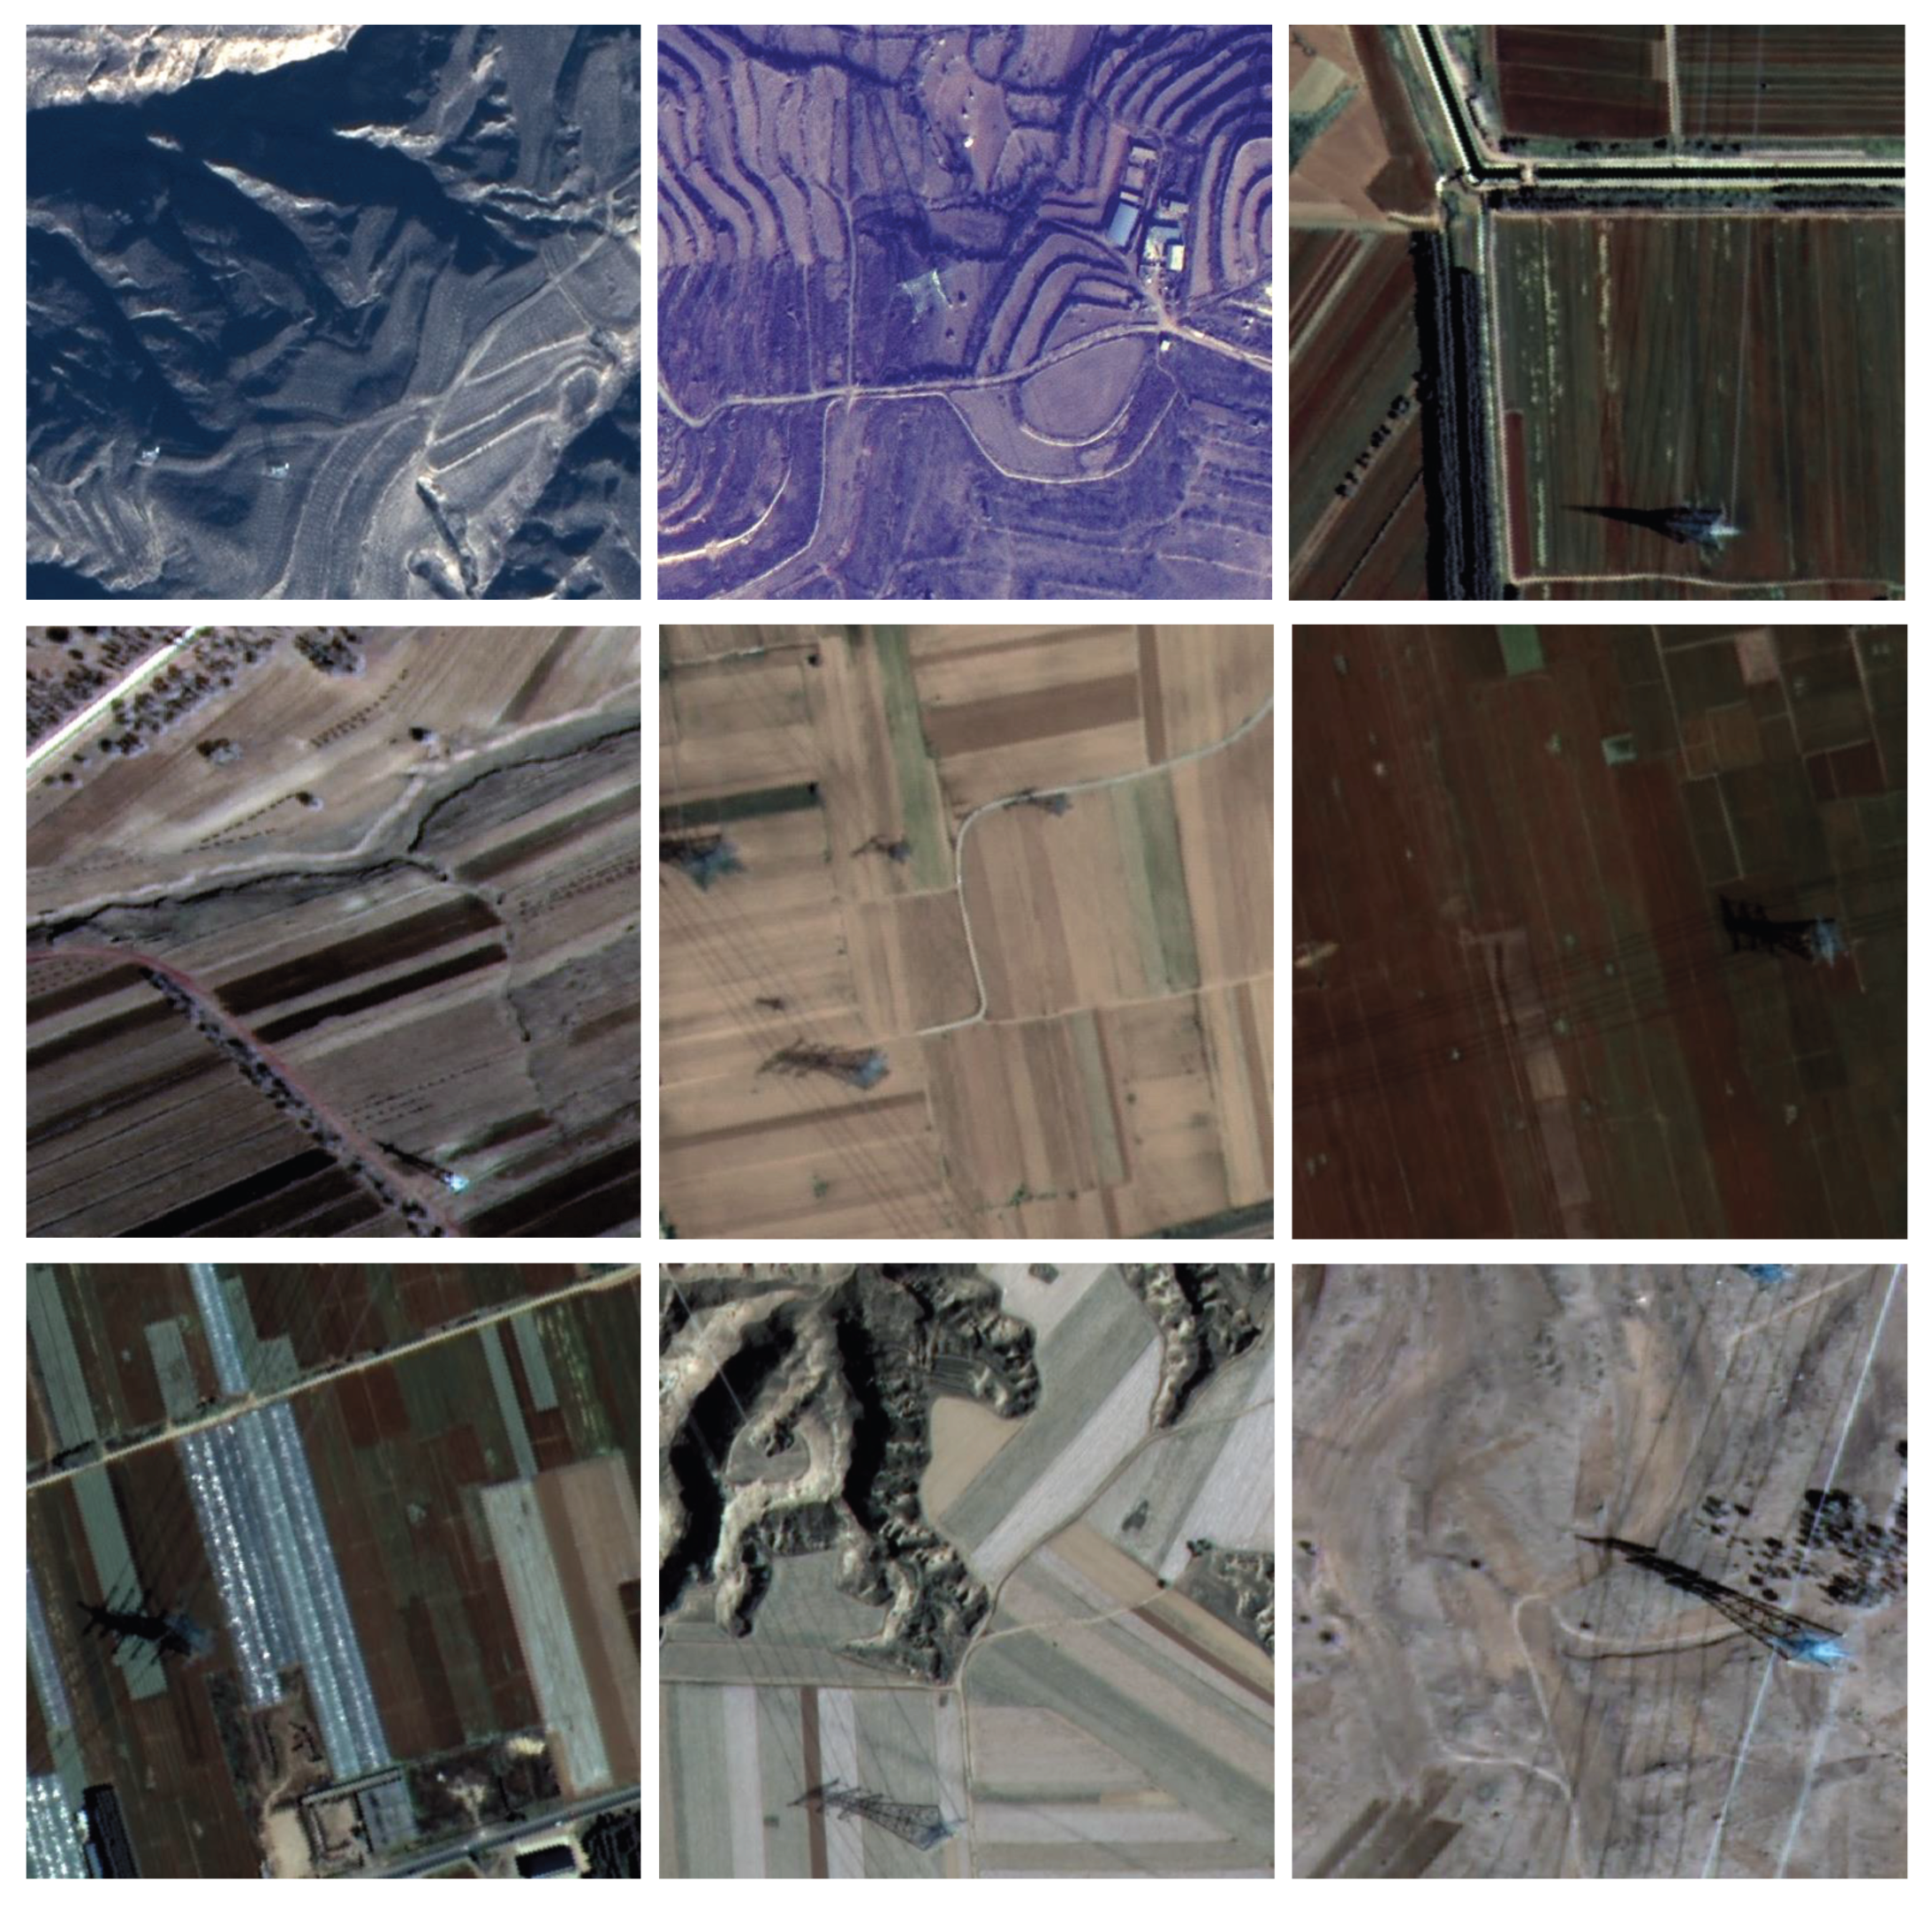
The GFTD dataset was constructed using satellite remote sensing images acquired by the GF-2 and GF-7 satellites. The selected images mainly cover three high-voltage transmission corridors, as illustrated in Figure 7. The imagery was collected across the four seasons of 2023 and 2024 and includes six representative scene types: urban areas, coastal regions, deserts, plains, forests, and mountainous areas. Through the fusion of multispectral images with a spatial resolution of 4 m and panchromatic images with a spatial resolution of 1 m, 1-m-resolution images were generated and further cropped into patches of 512 × 512 pixels. Since the shadows of power towers usually present clear geometric characteristics that are strongly correlated with the tower structures, the resulting label should therefore be interpreted as a tower–shadow composite target rather than a tower-body-only target. A total of 3000 images were collected and subsequently allocated to the training, validation, and testing sets at proportions of 70%, 20%, and 10%, respectively.
It should be noted that the original large-scale satellite images were divided into non-overlapping square patches using regular grid partitioning rather than overlapping sliding-window cropping. Therefore, different patches do not share pixel regions, and each annotated tower instance is retained in only one patch. Exact duplicate images and duplicated tower instances were also checked across the training, validation, and test subsets. The resulting patches were randomly allocated according to the 8:1:1 ratio for SRSPTD and the 7:2:1 ratio for GFTD.
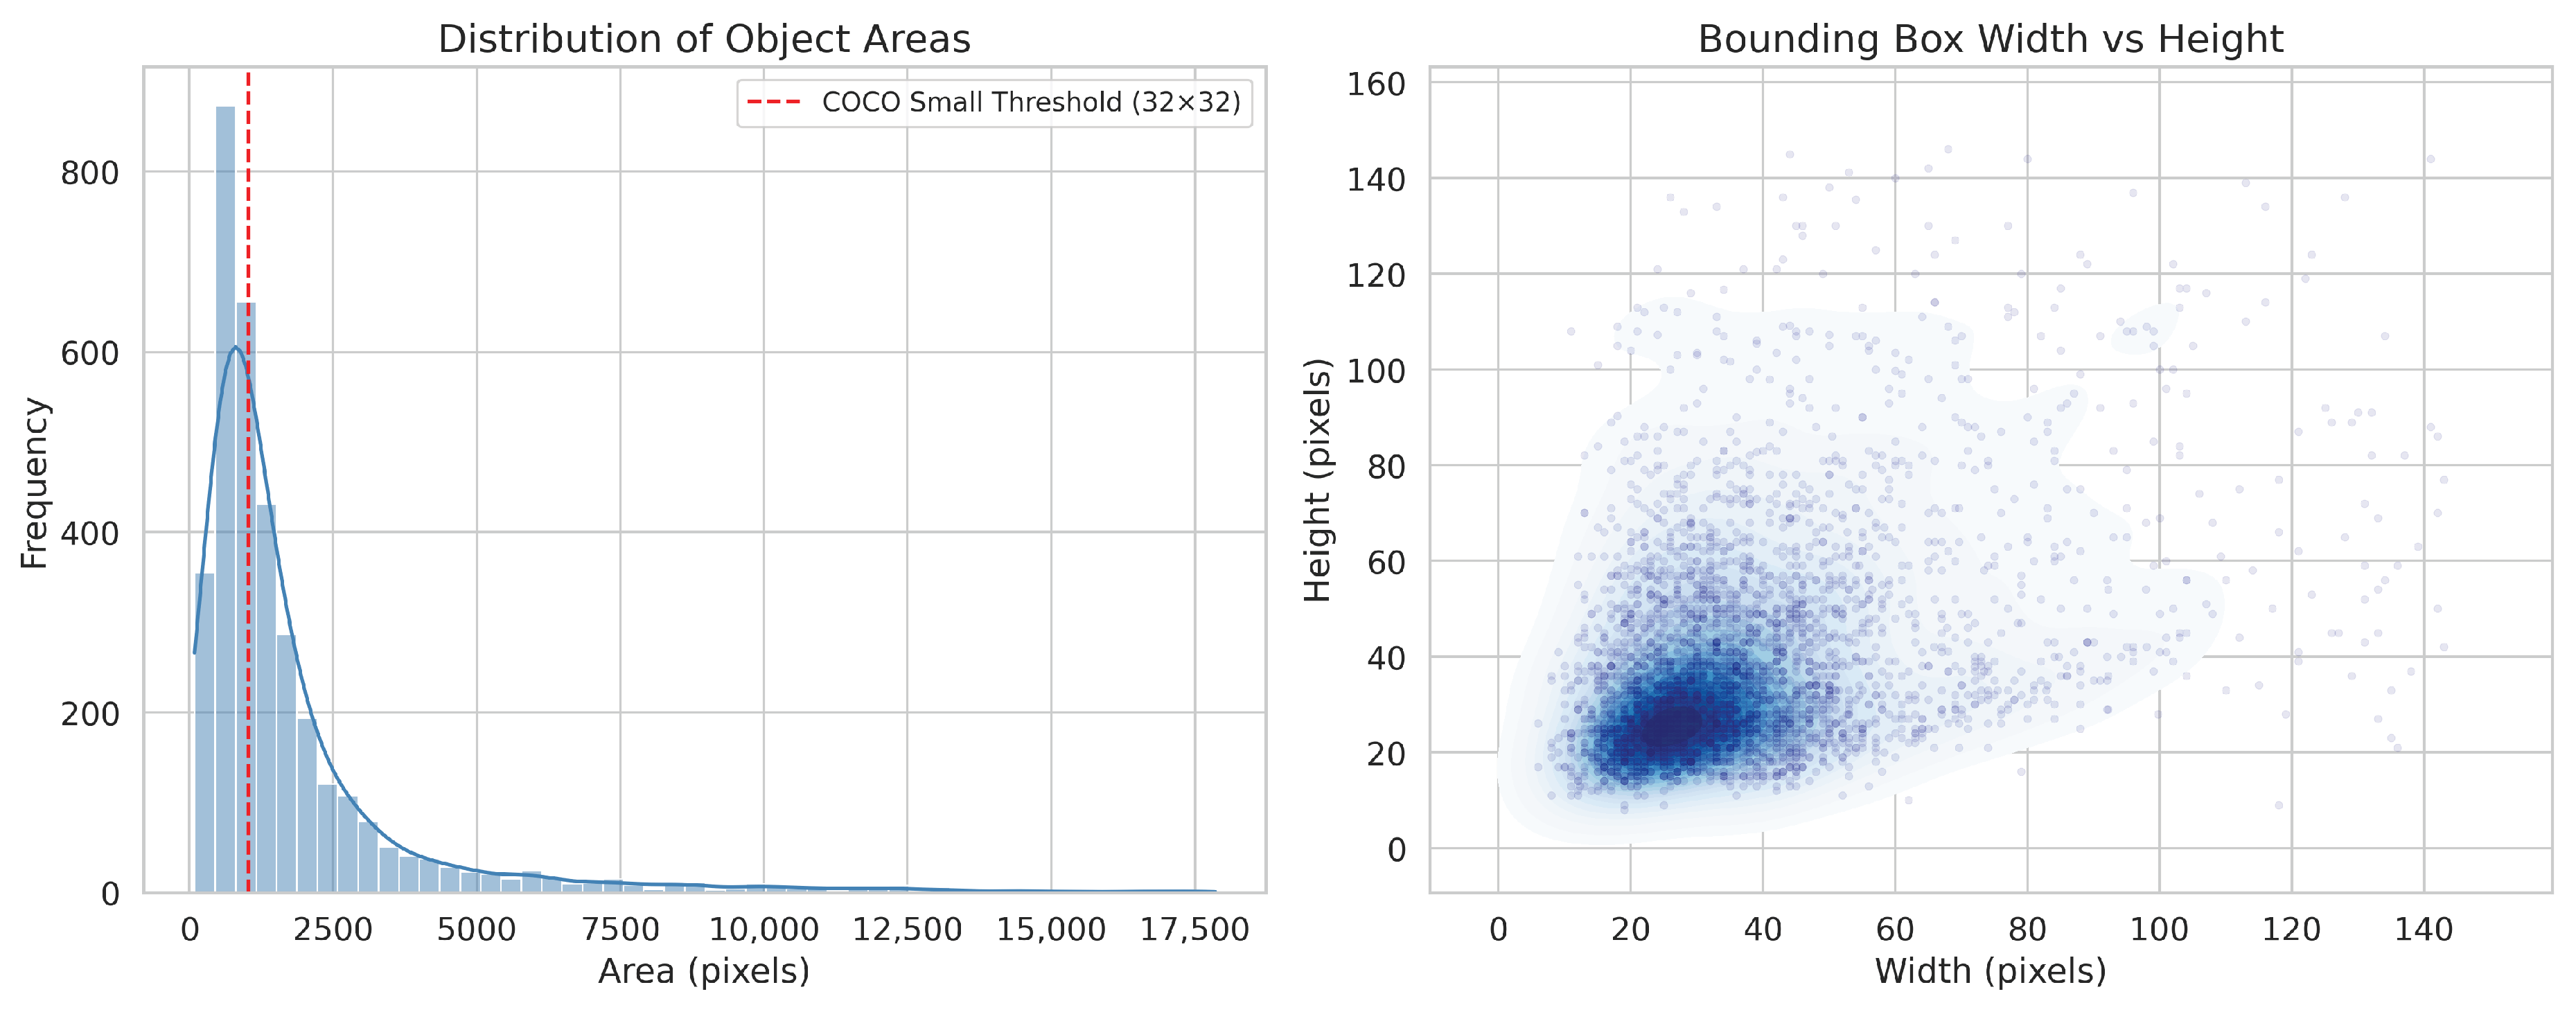
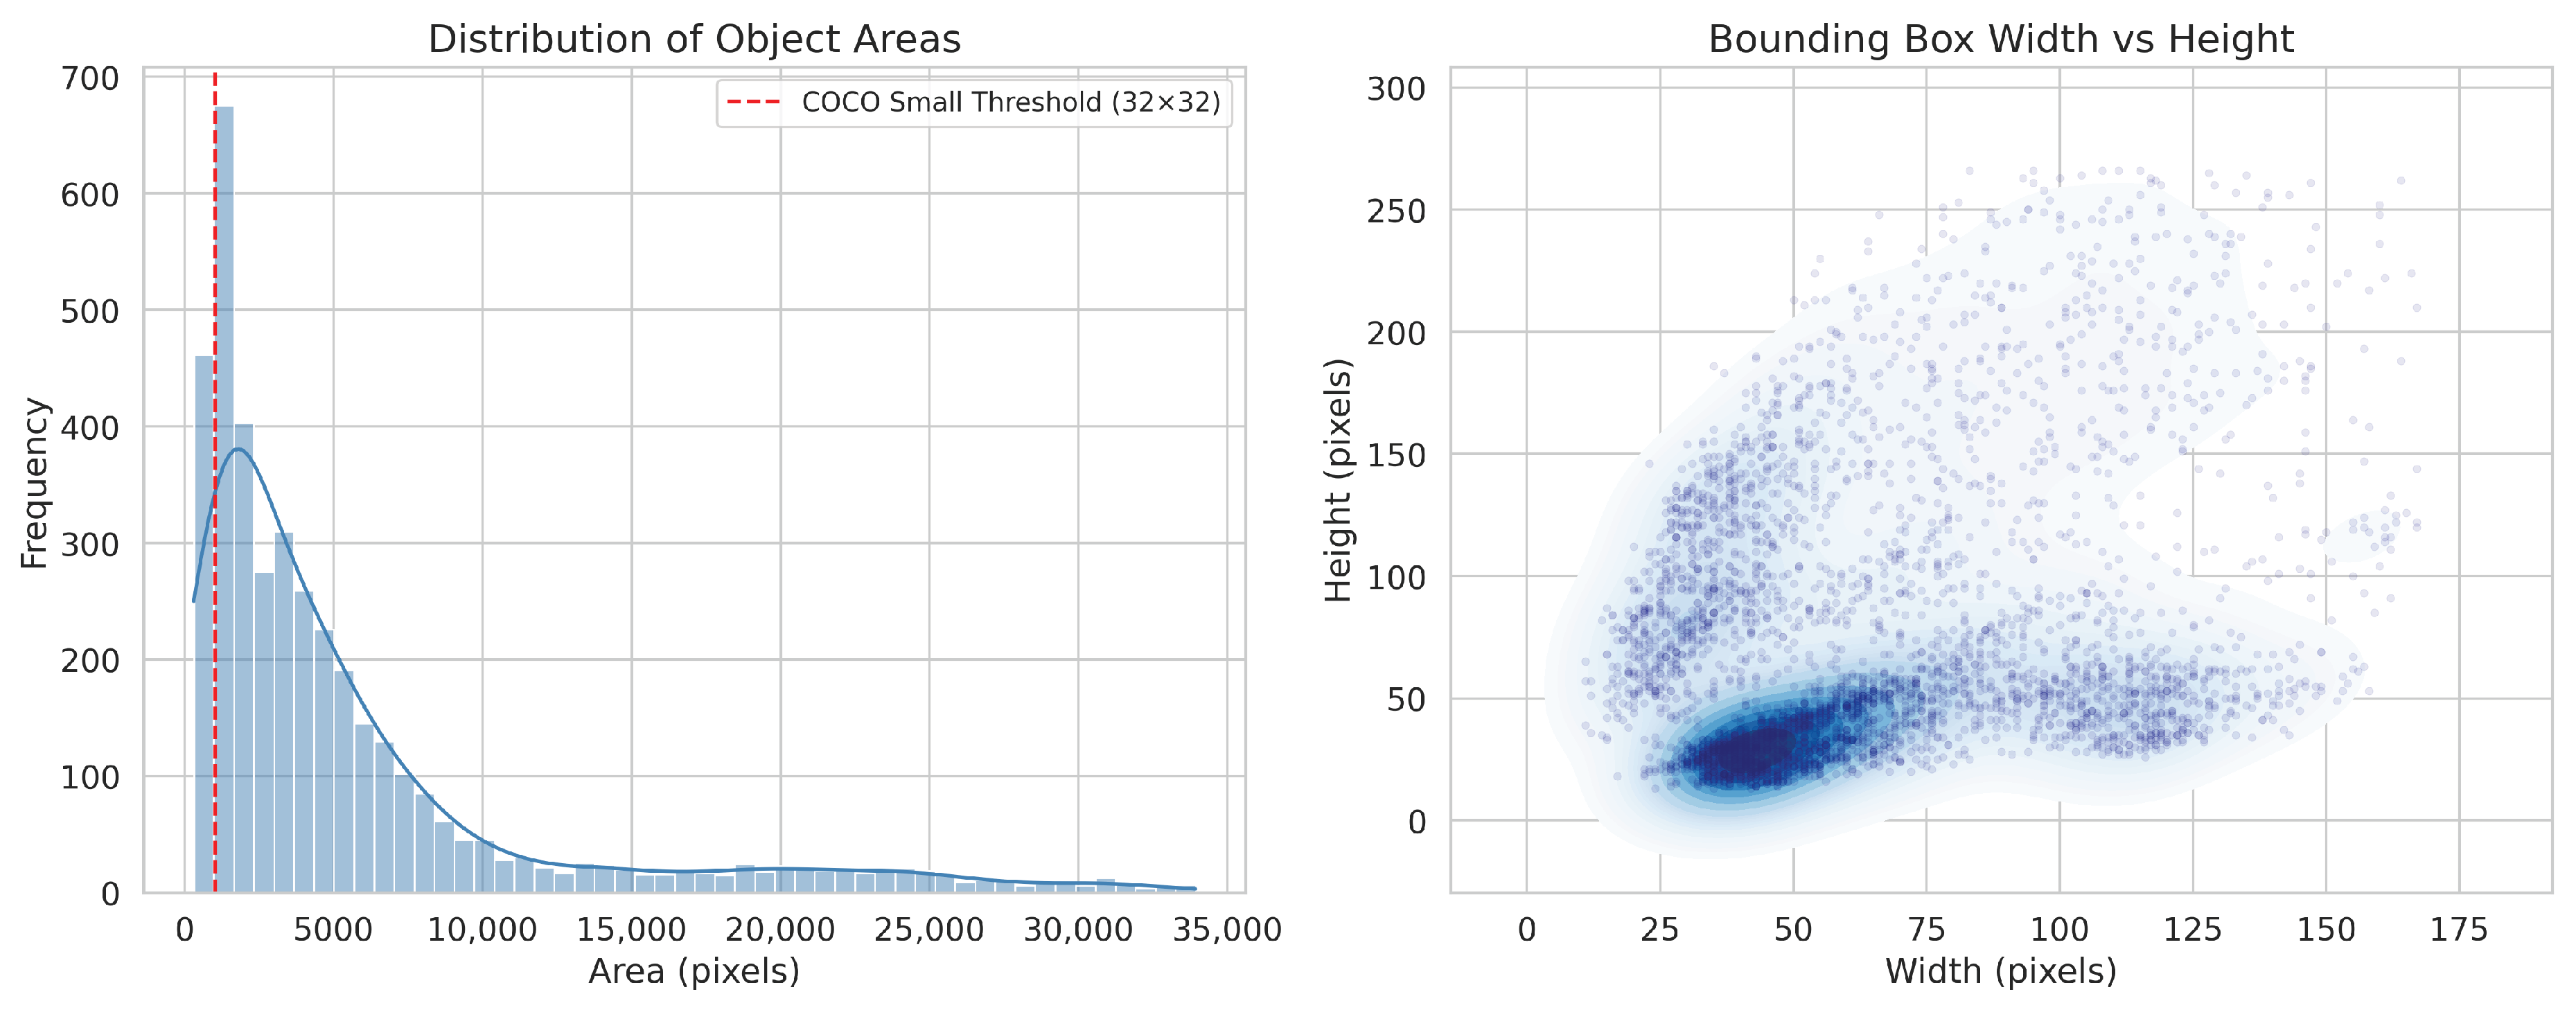
To quantitatively illustrate the characteristics and inherent challenges of the power tower dataset used in the experiments, this paper presents a statistical analysis of the object bounding box dimensions, as shown in Figure 8 and Figure 9. These figures illustrate the distribution of object areas for the SRSPTD and GFTD datasets, as well as the joint distribution of the width and height of the bounding box. For the SRSPTD dataset, the object area distribution exhibits a pronounced long-tail distribution, with a large number of instances concentrated below or near the small object threshold (32 × 32 pixels). This confirms the widespread presence of distribution towers and their tiny skeletal structures. Concurrently, the joint distribution of bounding box dimensions reveals a dense cluster tightly localized within an extremely small region (width < 40 pixels, height < 40 pixels), whilst scattered points extend up to a height of 140 pixels, highlighting significant scale variations among objects. In contrast, the GFTD dataset exhibits more dispersed, but equally challenging, geometric characteristics. It exhibits a broader and more ramified scatter topology, which not only indicates the presence of intense scale fluctuations, but also reflects diverse aspect ratios. In summary, statistical evidence strongly supports the necessity of the proposed model in this paper. The prevalence of minute features in both SRSPTD and GFTD necessitates enhanced small-object localization capabilities, whilst the vast scale range validates the urgency of establishing a multi-scale feature extraction mechanism.
During the training, all input images for the models are resized to 640 × 640 to ensure fairness in the experiments. The number of training epochs is set to 300. The optimizer is SGD. The batch size is set to 24. The momentum is set to 0.937. The experiments employed a dynamic learning-rate scheduling strategy, where the maximum learning rate and weight decay were set to 0.01 and 0.0005, respectively. Mixup and Mosaic were employed as data augmentation algorithms in model training. The detailed test run environment is shown in Table 1.

4.2. Evaluation Metrics

To provide a quantitative assessment of the improved model for power tower detection in remote sensing images, mean average precision (mAP) is adopted as the primary indicator of detection accuracy. In addition, the parameters (Params) and GFLOPs are employed to measure model complexity, since both storage requirements and computational cost are closely related to the practical deployment efficiency of the detector. The computation of mAP is based on Precision (P) and Recall (R). Specifically, Precision reflects the proportion of correctly detected power tower objects among all predicted results, whereas Recall indicates the capability of the model to identify all ground truth power towers. These metrics are calculated as follows:
P = T P T P + F P
R = T P T P + F N
where TP denotes the number of positive samples that are correctly classified as positive, FP indicates the number of negative samples that are mistakenly predicted as positive, and FN refers to the number of positive samples that are incorrectly classified as negative. AP measures the detection accuracy for a given category and is defined as follows:
A P = 0 1 P ( R ) d R
As an overall evaluation metric, mAP is obtained by averaging the AP of all annotated classes. A larger mAP score reflects stronger overall detection capability of the model. The corresponding calculation is defined as:
m A P = 1 N i = 1 N A P i
where N denotes the total number of power tower classes contained in the dataset. The mAP50 metric indicates the mean AP obtained at an IoU threshold of 0.5. In addition to mAP50, this study reports mAP50-95 to evaluate bounding-box localization performance under stricter IoU criteria. Specifically, mAP50-95 is obtained by averaging the mAP values calculated at IoU thresholds ranging from 0.50 to 0.95 with an interval of 0.05. Compared with mAP50, this metric provides a more comprehensive assessment of both object recognition and localization accuracy.

4.3. Comparison with Other Models

To evaluate the performance of the proposed method in satellite-based power tower detection, representative object detectors were first evaluated on the SRSPTD dataset. The compared methods include the two-stage detector Faster R-CNN, several one-stage YOLO-based models, and DETR series detection frameworks. The quantitative results obtained on the SRSPTD dataset are presented in Table 2, followed by the corresponding analysis.
1.
For the task investigated in this study, one-stage detectors from the YOLO series provide a more favorable balance than two-stage algorithms and DETR-based methods, particularly in terms of detection precision, parameter efficiency, and computational cost. This is mainly because two-stage detectors decompose the detection pipeline into sequential processes, where candidate regions are first generated and then further classified and localized. In contrast, one-stage detection models eliminate the candidate proposal stage, transforming the object detection problem into a single end-to-end regression task. This enables simultaneous object classification and localization within a single network and generally provides higher inference efficiency. Consequently, two-stage models suffer from reduced real-time performance and increased parameter counts and computational demands. DETR-series models employ Transformer-based architectures for feature extraction, resulting in substantially more parameters than the one-stage YOLO series, which utilizes convolutions for feature extraction.
2.
Within the YOLO series of algorithms, the detection accuracy does not show an upward trend with each new version but instead exhibits significant fluctuations. Among them, YOLOv10 [42], YOLOv11 [10], and YOLOv12 [11] demonstrate relatively poor detection accuracy. This phenomenon may be related to the task at hand, as the model structures of some versions are not well-suited for detecting power towers in remote sensing images. Therefore, selecting an appropriate model as the baseline for this task is essential. As shown in Table 2, among the lightweight YOLO variants considered during baseline selection, YOLOv9s achieves an mAP50 of 75.0% with only 9.8 M parameters. It provides a favorable balance between detection accuracy, computational complexity, and architectural modifiability. Therefore, selecting YOLOv9s as the baseline for this study is feasible.
3.
In the table, LSKF-YOLO [29] and YOLOv9-GDV [43] are specialized models for detecting power towers in remote sensing images, demonstrating significantly higher detection accuracy than other baseline models. However, these baseline models still exhibit low average precision for small-sized objects (DT) on the SRSPTD dataset. The improved model further optimizes for this issue, achieving the highest detection accuracy of 74.0% for small objects DT. Simultaneously, MS-YOLO obtains the mAP50 of 79.1% and the mAP50-95 of 41.9% on the SRSPTD dataset, indicating superior comprehensive performance compared with the other evaluated models.
It should be noted that LSKF-YOLO and YOLOv9-GDV are previous power-tower detection models developed by our research group and were evaluated using their original internal project implementations. The common dataset partitions, input resolution, training settings, and evaluation protocol described above were retained whenever applicable. However, the complete source code and configuration files used for LSKF-YOLO and YOLOv9-GDV have not been publicly released. Therefore, although these methods provide highly relevant task-specific comparisons, their results are not fully independently reproducible.
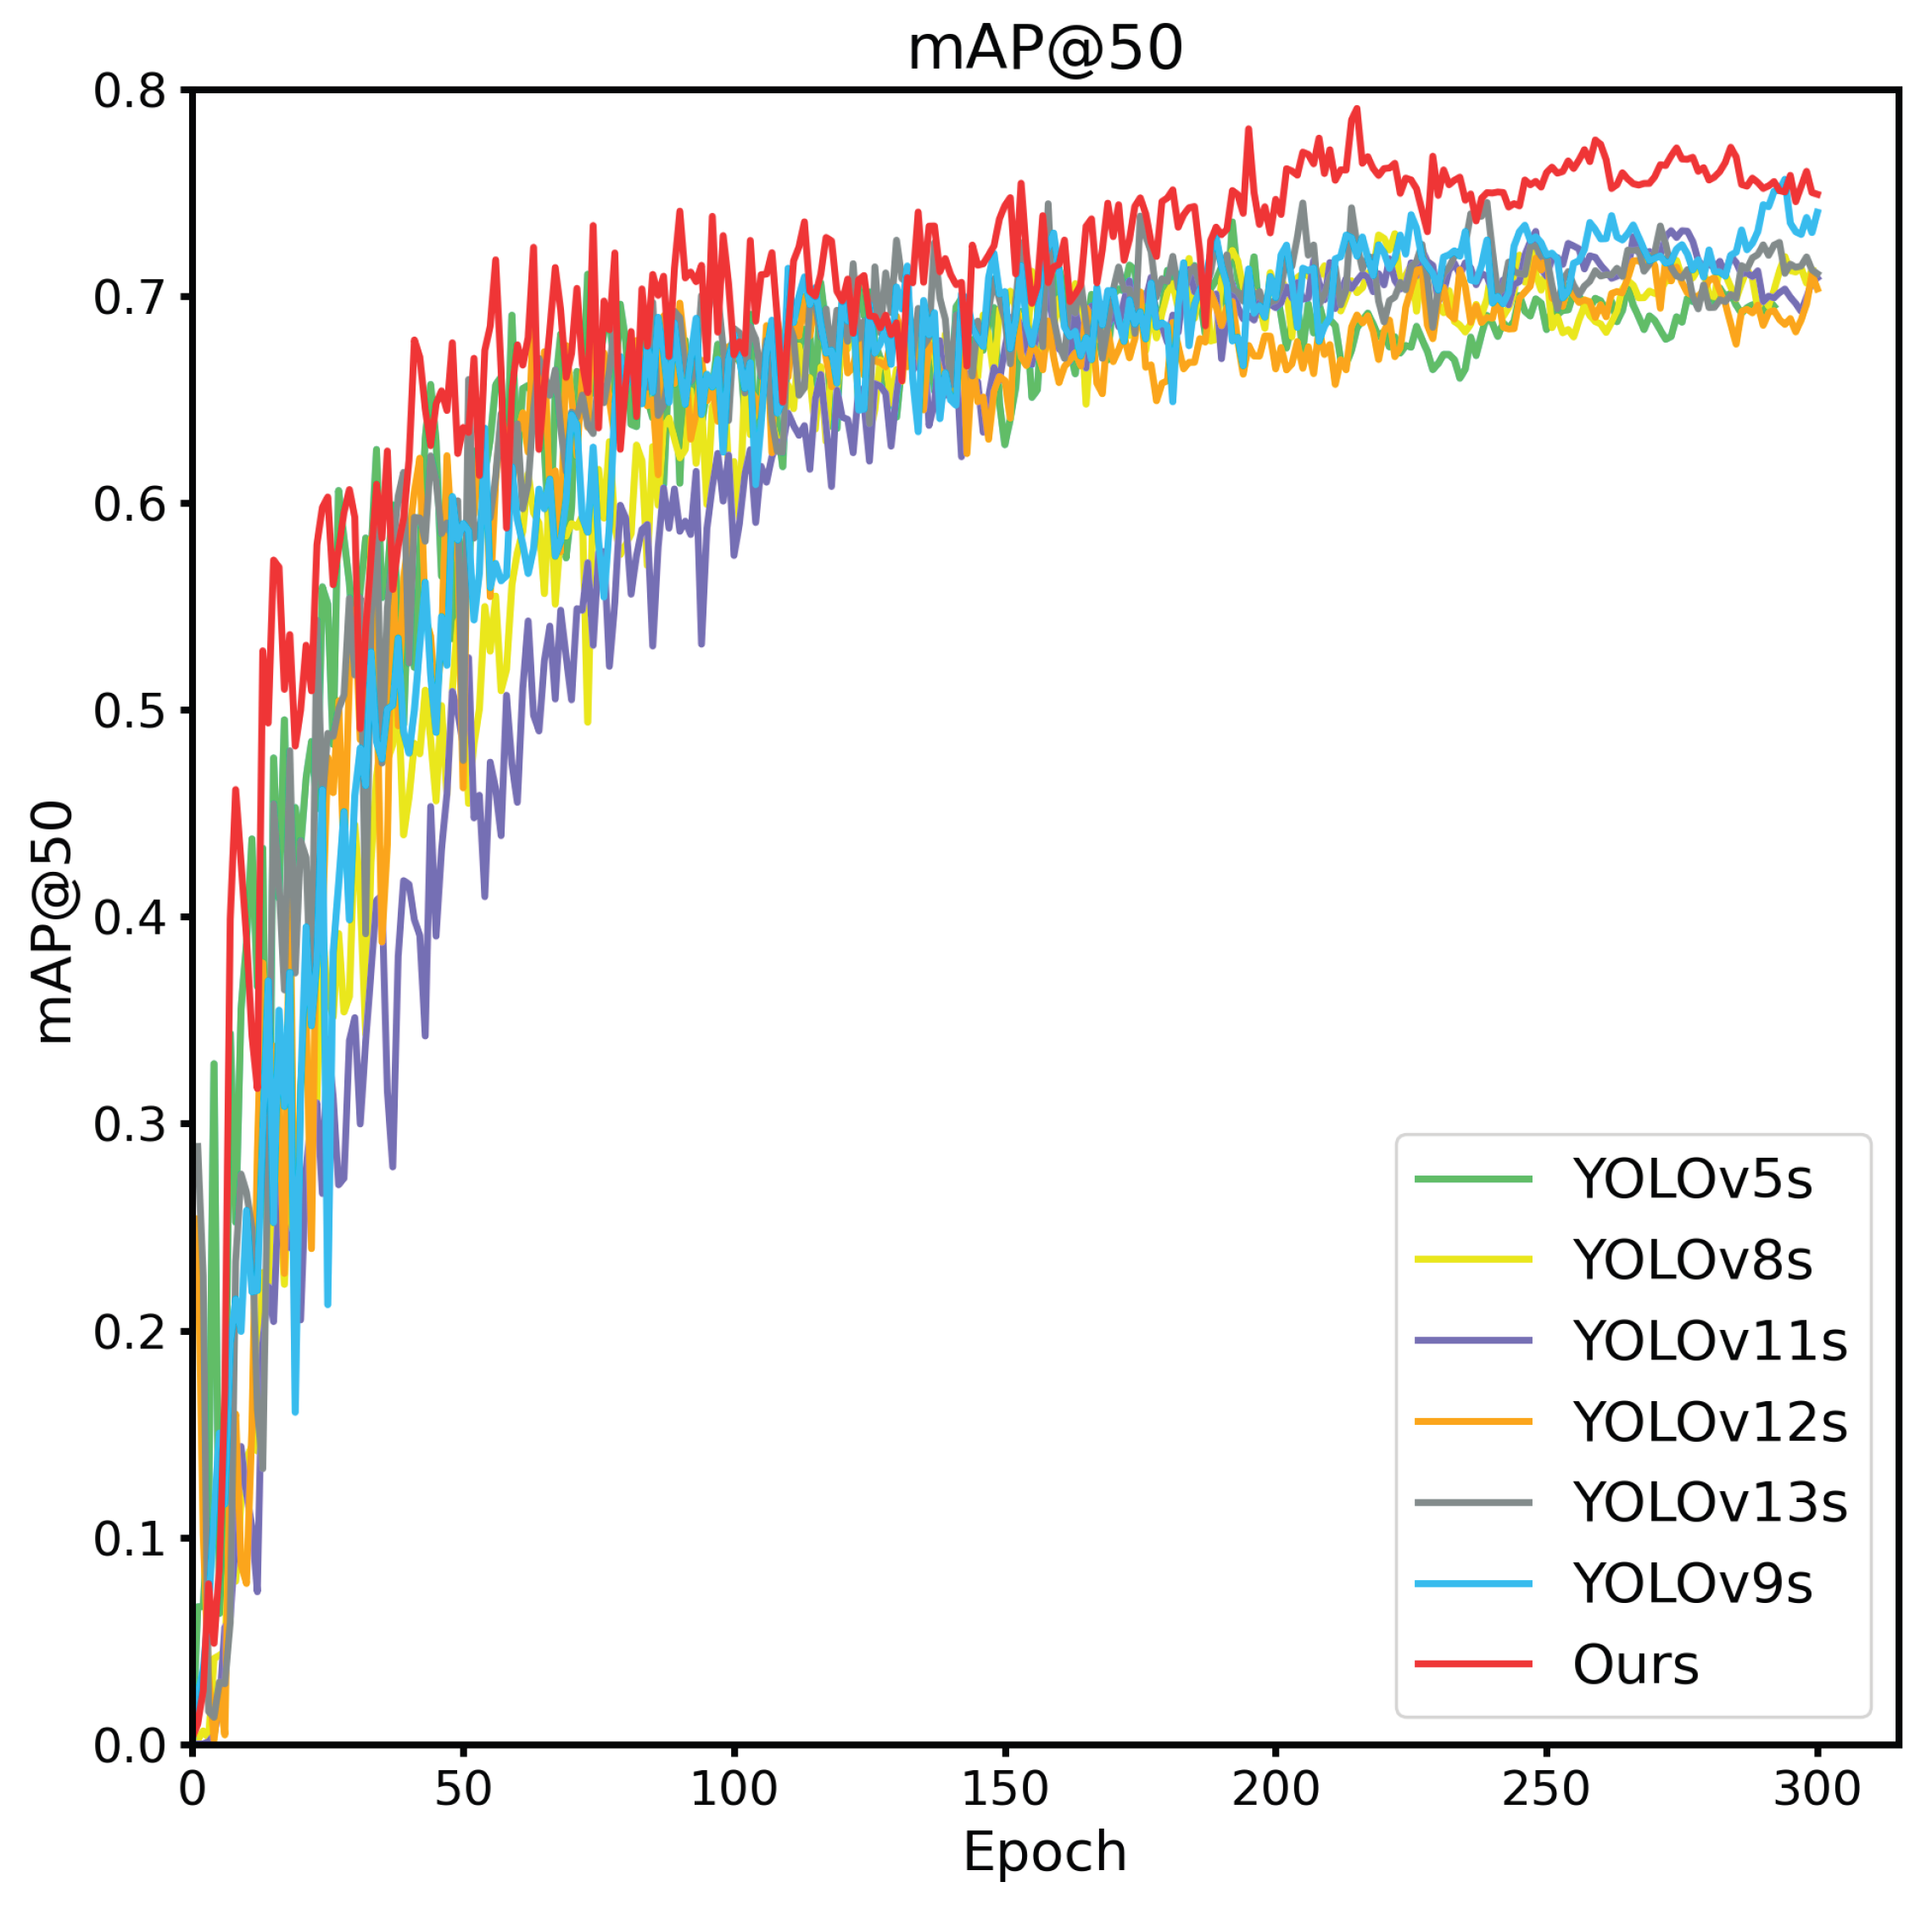
Figure 10 illustrates the mAP50 curve of MS-YOLO compared to other YOLO variants during training on the SRSPTD dataset. The training curves show that MS-YOLO achieves a higher mAP50 than the evaluated YOLO variants under the current experimental settings. Its mAP50 reaches the highest observed value at approximately 210 epochs and remains relatively stable during the subsequent training stage.

4.4. Additional Dataset Evaluation and Robustness Experiments

4.4.1. Additional Evaluation on the GFTD Dataset

To further evaluate the performance of MS-YOLO on an additional dataset, additional comparative experiments were performed using the GFTD dataset. The quantitative results of the evaluated detection methods are reported in Table 3.
Experimental results show that MS-YOLO exhibits better detection performance than other detection models in this experiment in complex scenes, with an mAP50 of 95.7%. Compared to YOLOv9s, the improved algorithm achieves a 3.4% increase in detection accuracy. Furthermore, MS-YOLO maintains a significant advantage over existing general-purpose object detection models. Although models like YOLOv11s and YOLOv12s achieve high accuracies (92.7% and 92.1%, respectively), our method still outperforms them by 3.0% and 3.6%. Furthermore, when compared against advanced algorithms specifically designed for utility tower detection, MS-YOLO also performs excellently. Its mAP50 is 2.8% higher than LSKF-YOLO and 1.1% higher than YOLOv9-GDV.
In summary, MS-YOLO not only performs well on the SRSPTD dataset on the SRSPTD dataset but also maintains leading detection accuracy on the more complex GFTD dataset. These results provide additional evidence that the feature fusion module and attention mechanism designed in this paper can effectively suppress background noise interference, and the algorithm also has a certain generalization ability in the GFTD dataset across different scenes.
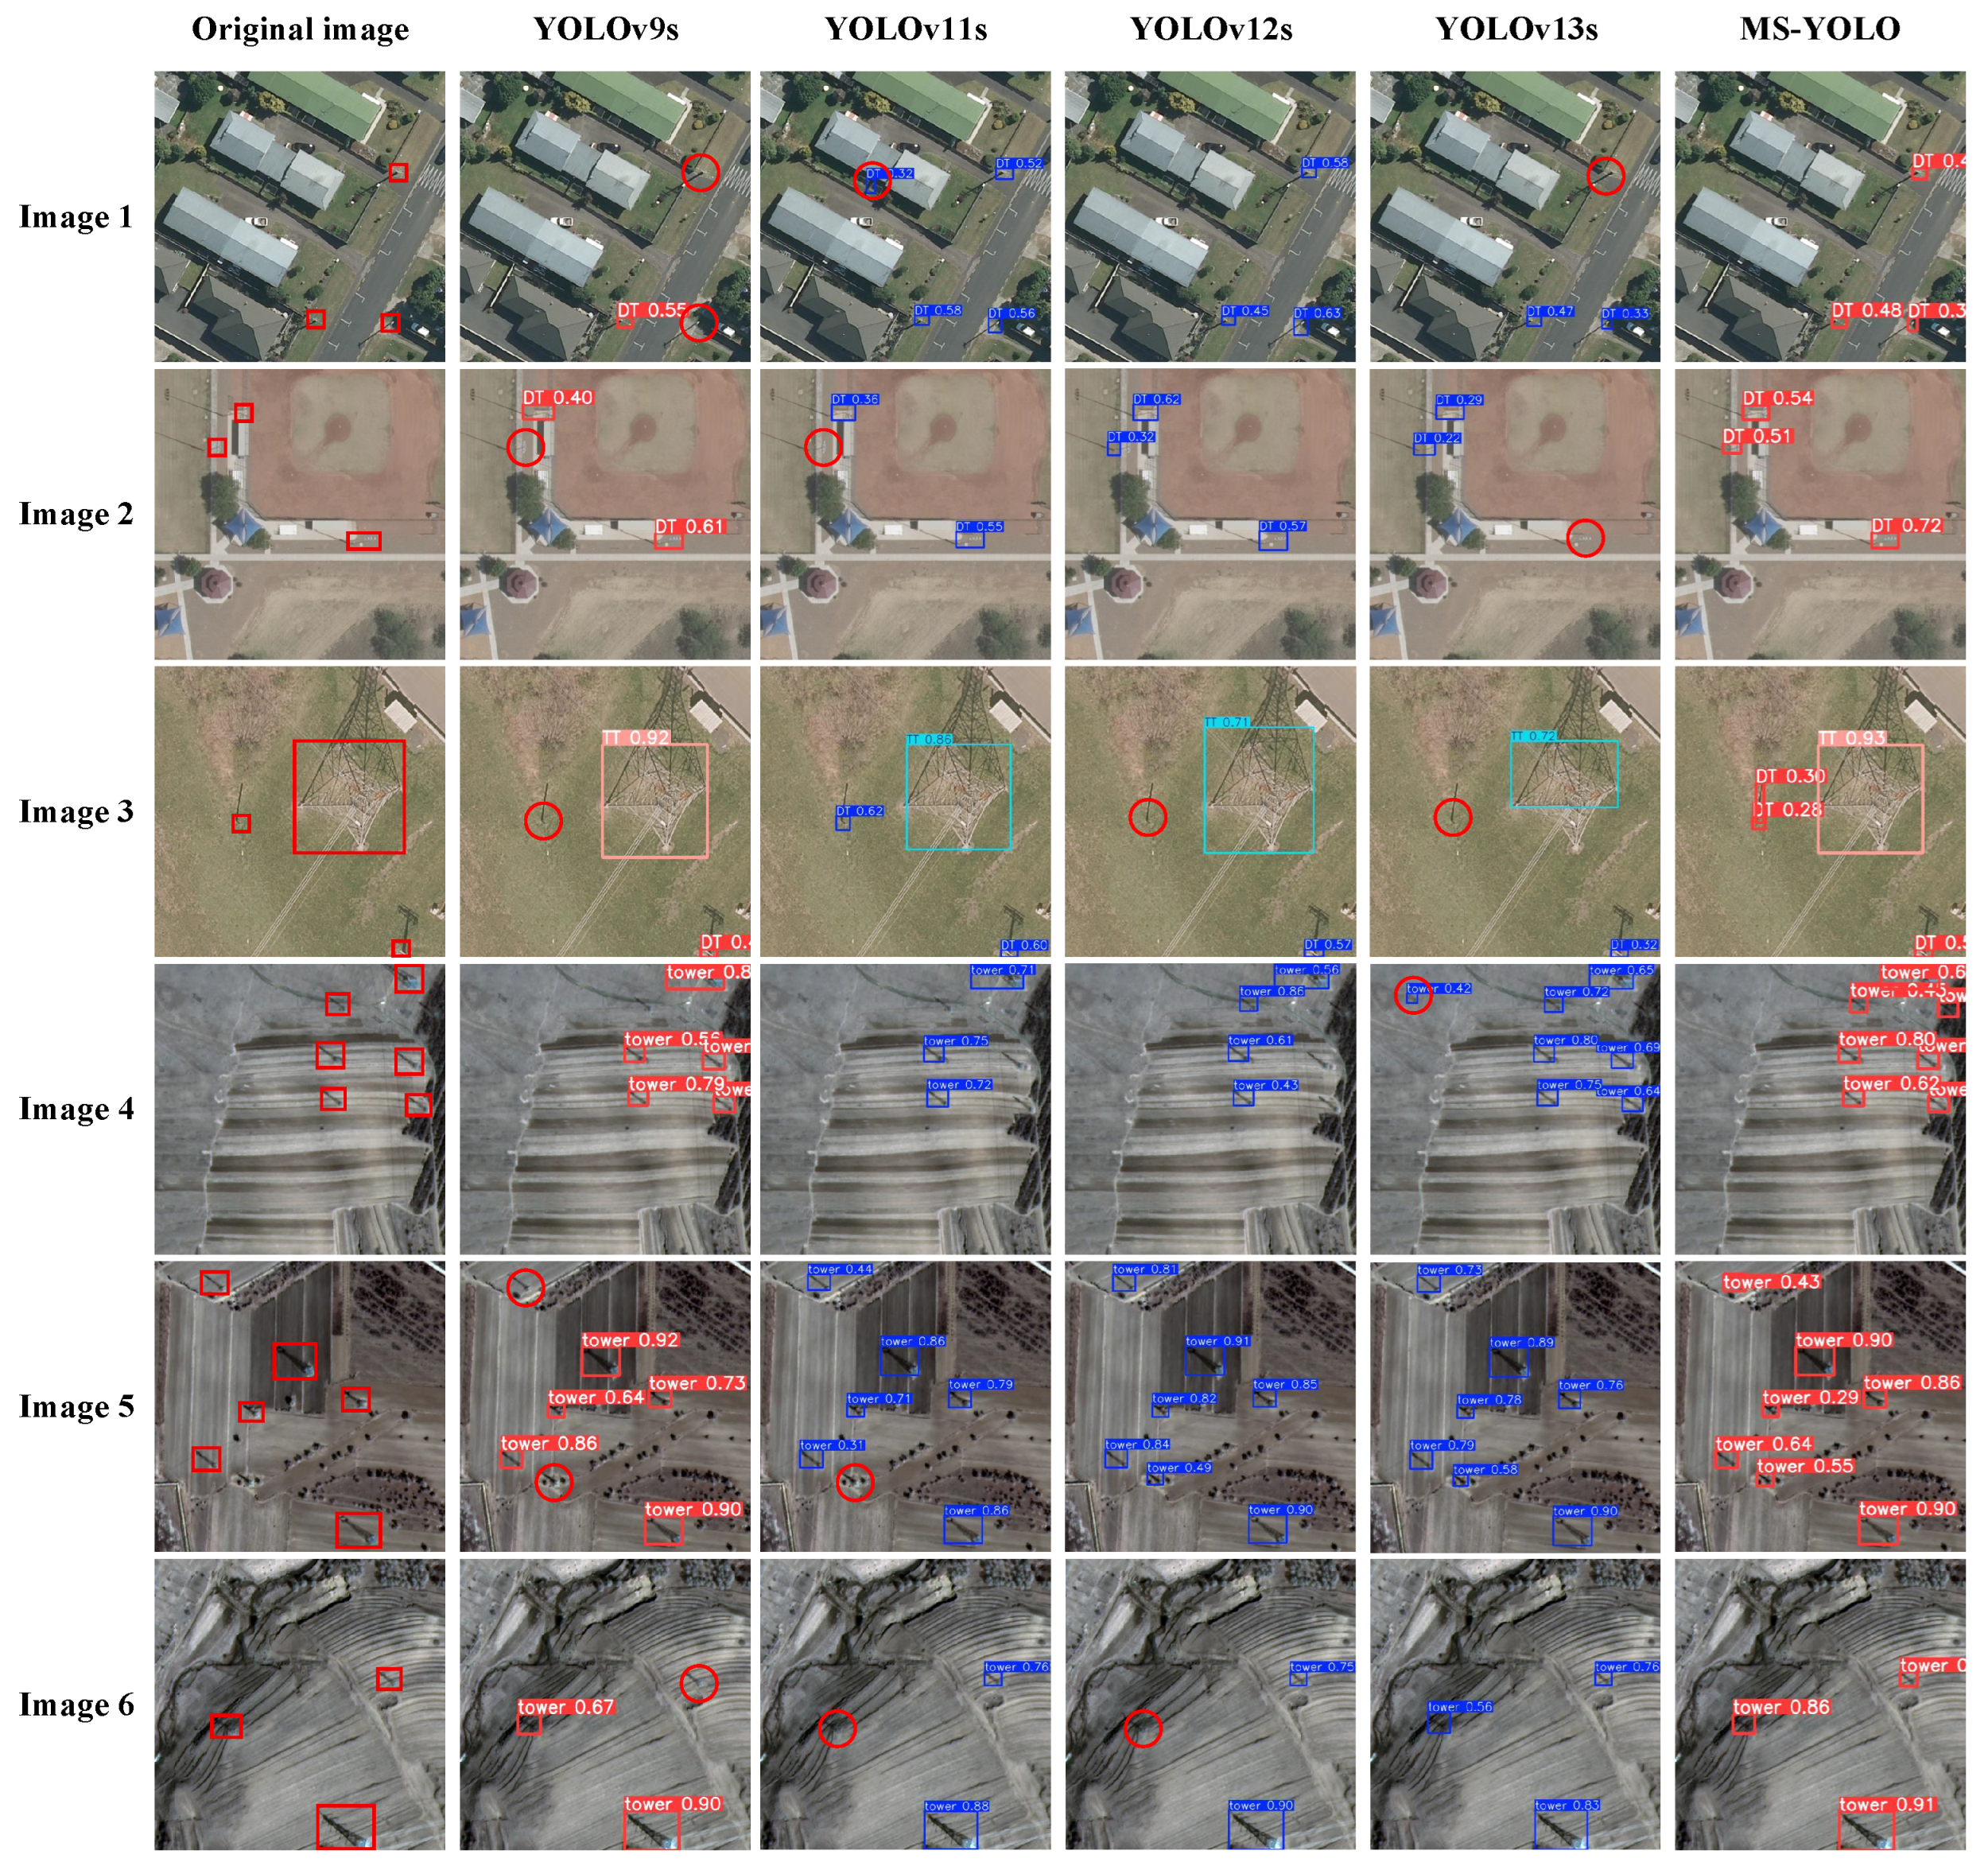
Additionally, this paper visualizes the detection results of YOLOv9s (baseline), YOLOv11s, YOLOv12s, YOLOv13s [44], and MS-YOLO (improved model) on the SRSPTD and GFTD datasets, as shown in Figure 11. Column 1 displays the original images, while columns 2 through 5 sequentially present detection result visualizations for YOLOv9s, YOLOv11s, YOLOv12s, YOLOv13s, and MS-YOLO. The top three rows originate from the SRSPTD dataset, and the bottom three rows from the GFTD dataset. Both false positives and false negatives in the visualizations are marked with red circles. Image 1 and Image 2 showcase the DT category (small objects) on the SRSPTD dataset, which is highly susceptible to background interference. Both YOLOv9s, YOLOv11s, and YOLOv13s exhibit false positives or false negatives in both images. However, the improved model correctly detects the corresponding targets in the illustrated examples. Image 3 demonstrates the simultaneous presence of large-object TT categories and small-object DT categories within the SRSPTD dataset. The improved model successfully detects both categories with vastly differing scales within the same image, whereas YOLOv9s, YOLOv12s, and YOLOv13s exhibit false negatives. Images 4 through 6 similarly demonstrate multi-scale and small-object scenarios involving towers on the GFTD dataset, with Images 4 and 5 additionally presenting densely distributed power towers. Based on detection visualization results, MS-YOLO effectively reduces false negatives or false positives observed in other YOLO variants within the GFTD dataset. This outcome validates the improved model’s ability to prevent detection failures and misclassifications, confirming the effectiveness of improvement.

4.4.2. Robustness Evaluation Under Synthetic Fog Conditions

To evaluate the robustness of the detection models under degraded imaging conditions, synthetic fog was added to the original test images using the atmospheric scattering model. The classical atmospheric scattering model was employed to generate synthetic fog from the original test images. The foggy image is formulated as:
I ( x ) = J ( x ) t ( x ) + A 1 t ( x ) ,
where I ( x ) and J ( x ) denote the synthesized foggy image and the original clear image at pixel x, respectively, A represents the global atmospheric light, and t ( x ) denotes the medium transmission. The transmission map is calculated as:
t ( x ) = exp β d ( x ) ,
where d ( x ) is the normalized pseudo-depth map and β is the atmospheric scattering coefficient controlling the fog density. A larger value of d(x) results in lower transmission and stronger fog interference, thereby weakening the contrast, edge, and texture information of power towers. In this study, different values of β were used to construct light-, medium-, and heavy-fog test sets, while the original object annotations remained unchanged. Three fog-density levels were considered, with the scattering coefficient β set to 0.5, 1.0, and 1.5 for light, medium, and heavy fog, respectively. The original annotations were retained because the fog-generation process did not change the geometric positions of the objects. Neither YOLOv9s nor MS-YOLO was retrained or fine-tuned using foggy images, allowing the experiment to evaluate their zero-shot robustness to unseen image degradation. All models were evaluated using the same input resolution, confidence threshold, and evaluation protocol.
As shown in Table 4, the detection performance of both YOLOv9s and MS-YOLO gradually decreases as the fog density increases, indicating that fog weakens the edge, texture, and contrast information of power towers. The mAP50 of YOLOv9s decreases from 75.0% under clear conditions to 68.1% under heavy fog, corresponding to a reduction of 6.9 percentage points. In comparison, the mAP50 of MS-YOLO decreases from 79.1% to 73.5%, with a smaller reduction of 5.6%. Under light, medium, and heavy fog, MS-YOLO outperforms YOLOv9s in mAP50 by 3.9%, 4.9% and 5.4%, respectively, demonstrating that its advantage becomes more evident as the fog density increases. For small distribution towers, MS-YOLO achieves AP values of 71.0%, 68.2%, and 64.4% under the three fog levels, consistently exceeding the corresponding results of YOLOv9s. This suggests that the proposed multi-scale feature extraction and small-object enhancement strategies preserve more discriminative information when object features are attenuated by fog. MS-YOLO also maintains a clear advantage in transmission-tower detection. Notably, the TT AP under light and medium fog is slightly higher than that under clear conditions, which may be related to the suppression of some complex background textures by synthetic fog; however, this phenomenon requires further verification using real foggy imagery. Although MS-YOLO consistently achieves higher mAP50-95 than the baseline, its value decreases from 41.9% to 37.3% under heavy fog, indicating that severe fog still affects precise bounding-box localization at stricter IoU thresholds. Overall, these results demonstrate that MS-YOLO exhibits improved robustness over YOLOv9s under controlled synthetic fog degradation on the SRSPTD dataset. However, the experiment does not comprehensively represent naturally occurring adverse weather, and further validation using real foggy, cloudy, and low-illumination satellite imagery remains necessary.

4.5. Ablation Experiment

Ablation experiments were conducted on the SRSPTD dataset to examine the contribution of each proposed module to the final detection results. The corresponding outcomes are reported in Table 5. The hyperparameter settings in the ablation experiments were identical to those in previous experiments. In Table 5, “√” indicates that the component was included in the model, while “×” indicates that the component was excluded.
As shown in Table 5, incorporating the PKI_Bottleneck module into YOLOv9s improves the mAP50 by 2.2% and 1.9% for the DT and TT categories respectively compared to the baseline, indicating enhanced multi-scale feature extraction abilities. Secondly, while the introduction of the DSSA module in YOLOv9s did not produce significant improvements in detection accuracy for TT, it increased mAP50 for the small object category DT by 3.5%. This experimental result demonstrates that the DSSA module effectively improves the model’s recognition capabilities for small objects. Finally, training YOLOv9s with the DFW-IoU loss improves AP value for both categories, with a relatively higher gain observed for the small object category DT. This indicates that incorporating DFW-IoU loss makes the model more sensitive to small object recognition. Subsequently, pairing each component in various combinations further enhanced detection accuracy. When all three components were applied together to YOLOv9s, the model achieved the best overall performance among the evaluated ablation configurations. Furthermore, as evidenced by the FPS metrics, the improved model continues to meet real-time requirements on the evaluated RTX 4090 platform.
To provide a more intuitive efficiency comparison, the inference latency was derived from the measured FPS as:
Latency = 1000 / FPS
Under the same RTX 4090 evaluation environment, YOLOv9s achieves an average latency of approximately 3.51 ms per image, whereas MS-YOLO requires approximately 4.61 ms per image. Thus, MS-YOLO introduces an additional latency of approximately 1.10 ms while improving both mAP50 and mAP50-95 by 4.1%. Since FPS and latency are reciprocal under identical measurement conditions, the two metrics describe the same inference-time behavior from different perspectives.
The parameter-storage footprint can also be estimated from the parameter count. Under FP32 precision, the model weights of YOLOv9s and MS-YOLO require approximately 39.2 MB and 48.0 MB, respectively, while FP16 storage reduces these values by approximately half. However, the peak GPU memory consumption cannot be uniquely determined from Params and GFLOPs because it also depends on intermediate activations, batch size, numerical precision, framework implementation, operator workspace, and memory-allocation strategy. Therefore, Params and GFLOPs are retained as hardware-independent indicators of model complexity. The reported latency and FPS were measured on a desktop RTX 4090 GPU and do not directly represent performance on resource-constrained edge devices.
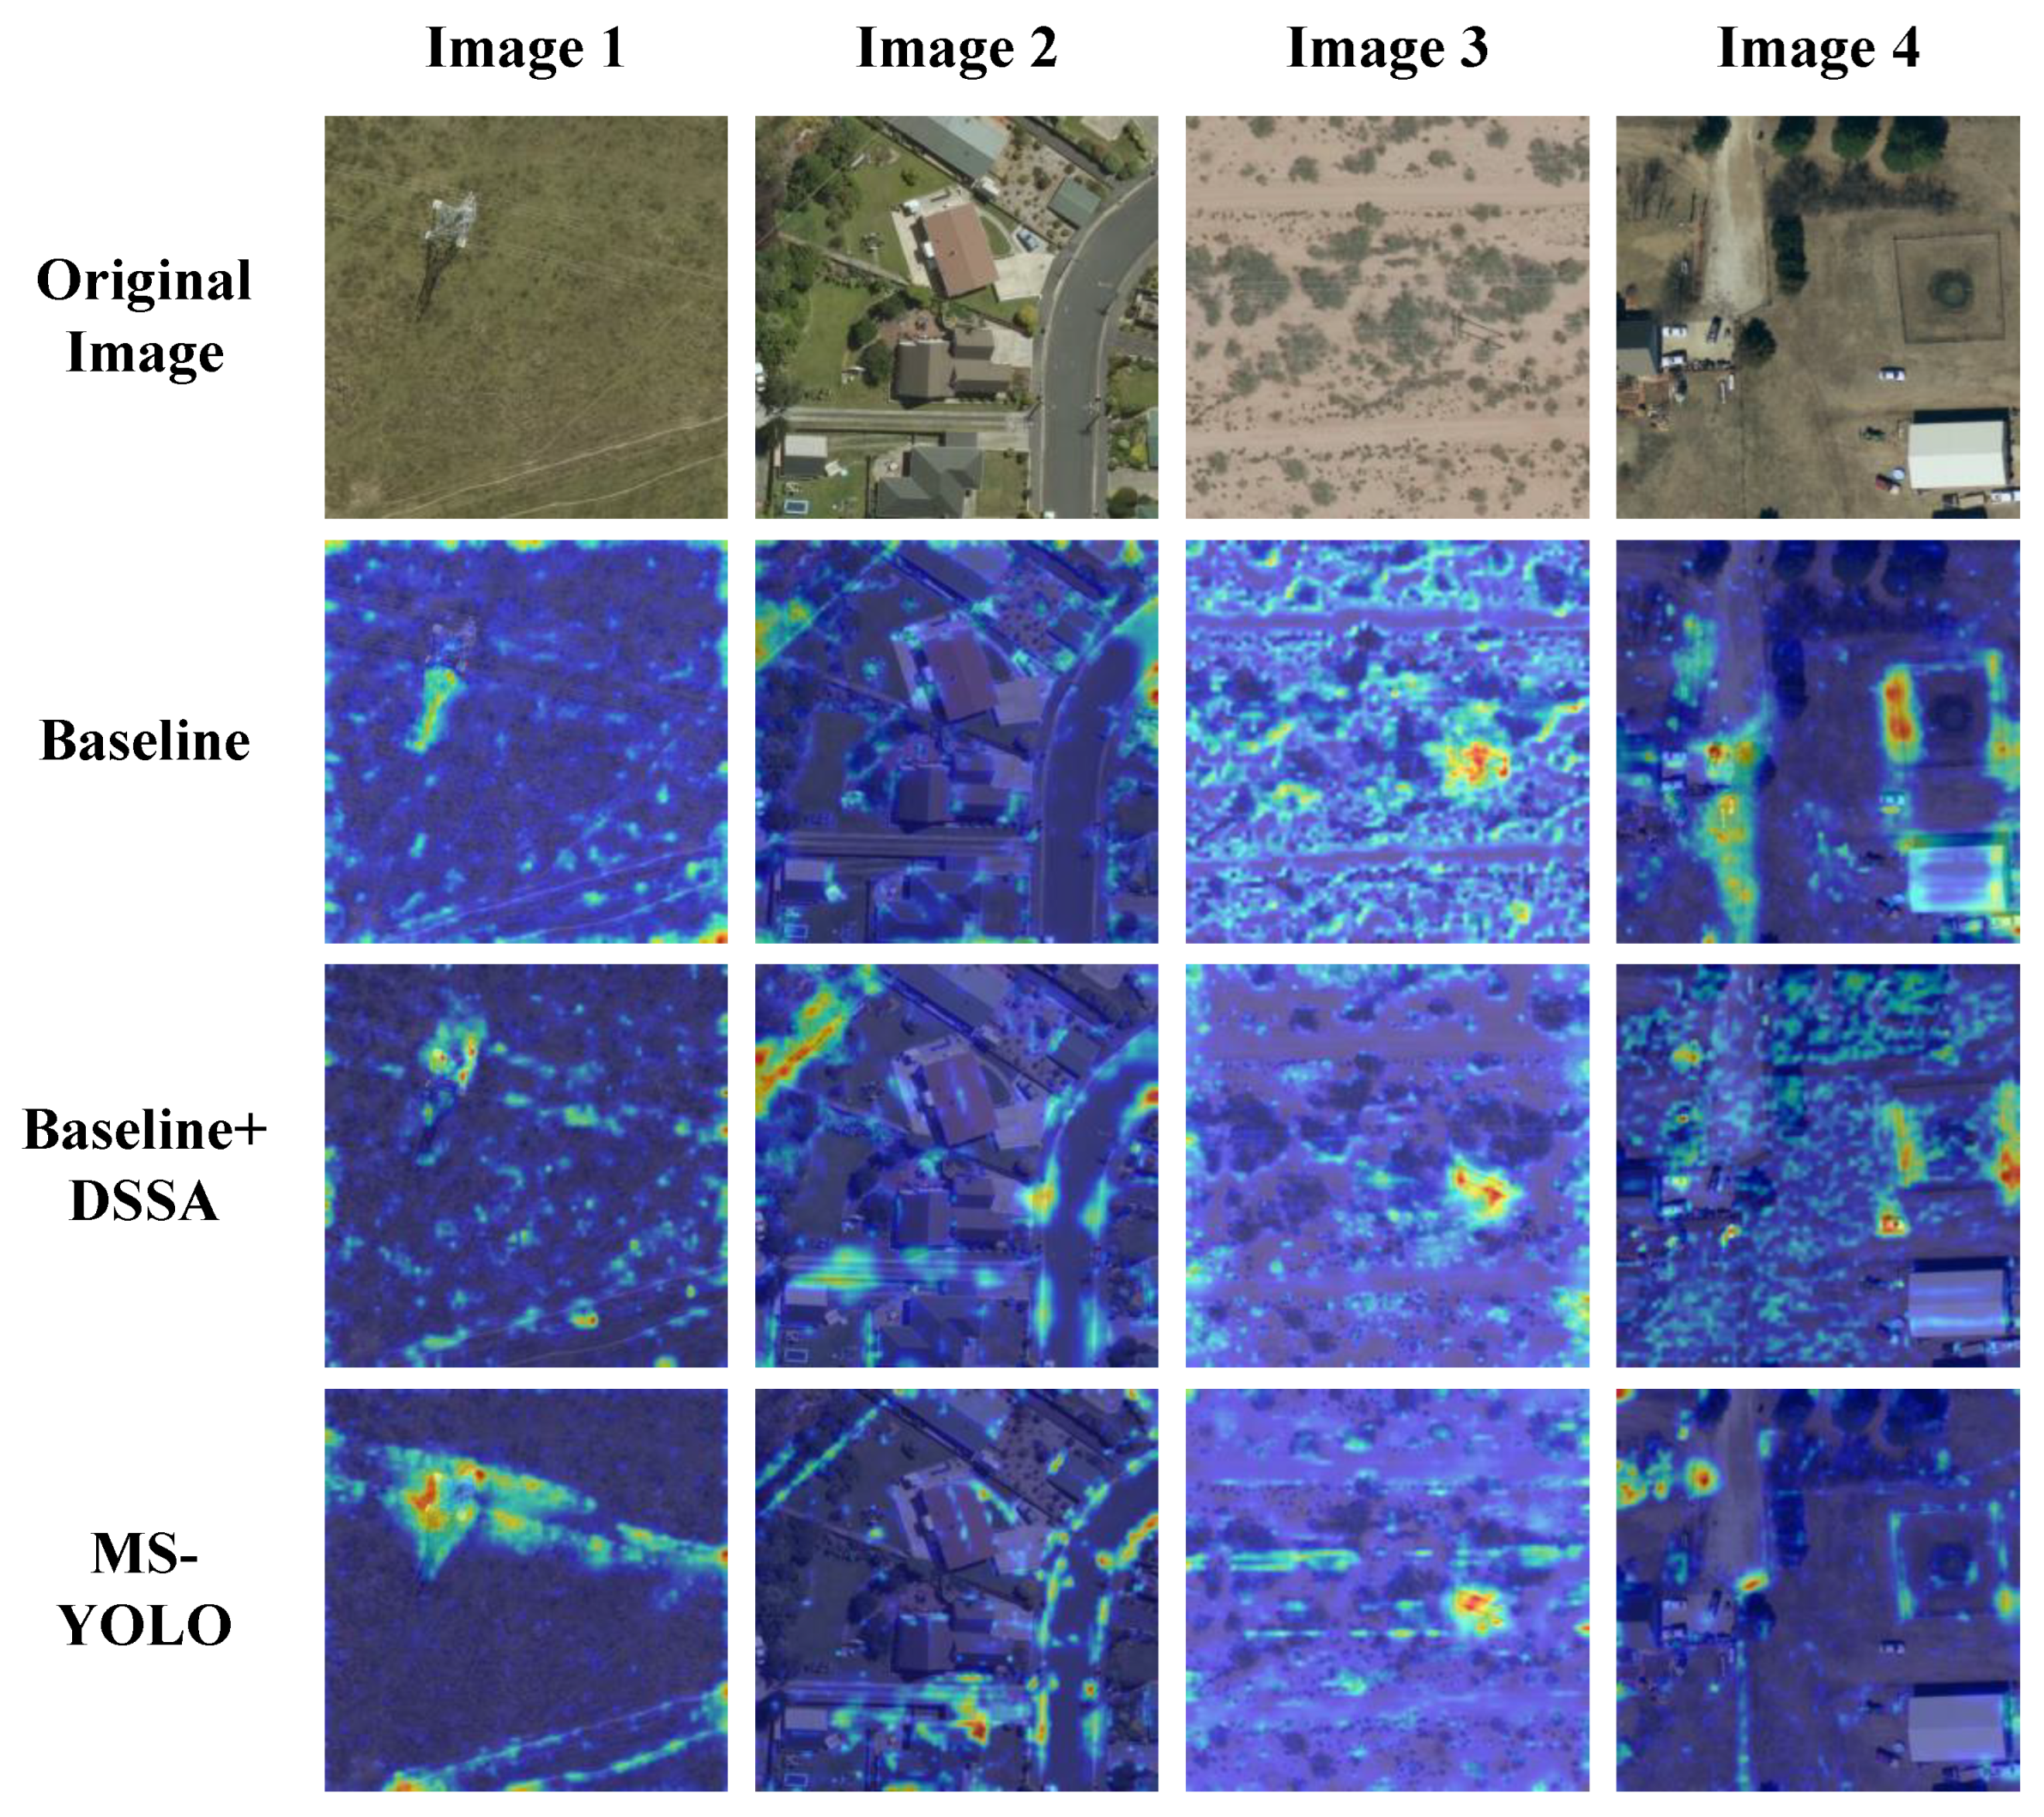
In this paper, Grad-CAM is employed to analyze the interpretability of the proposed model. Figure 12 presents the heatmaps generated by the YOLOv9s baseline, the baseline equipped only with DSSA, and the complete MS-YOLO on the SRSPTD dataset. Compared with YOLOv9s, the baseline + DSSA model generally produces more target-centered and concentrated responses, indicating that DSSA helps suppress irrelevant background activations while enhancing spatial and semantic features associated with power towers. For example, in Images 1 and 3, the high-response regions of baseline + DSSA are more closely aligned with the tower locations than those of the baseline. Nevertheless, residual responses to roads, buildings, and surrounding textures remain visible in Images 2 and 4, suggesting that DSSA alone cannot fully eliminate complex background interference. In contrast, MS-YOLO generates more compact and discriminative activation regions around the distribution and transmission towers while further reducing responses from vegetation, roads, and building structures. The progressive change from the baseline to baseline + DSSA and then to MS-YOLO indicates that DSSA improves target-focused feature recalibration, whereas its combination with PKI_Bottleneck further strengthens multi-scale contextual representation and target localization. These qualitative results show that the two modules effectively guide the model to focus on critical power tower features. This improves the model’s interference resistance and localization accuracy in complex remote sensing scenarios.
This paper also validates the rationality of inserting the PKI_Bottleneck module exclusively into the backbone portion of the model. Table 6 compares the performance of the RepNCPSELAN4 model with PKI_Bottleneck modules inserted only in the backbone versus throughout the entire model. The experimental results indicate that incorporating only the PKI_Bottleneck module into the backbone improves the detection performance of the model while also decreasing both the parameter size and computational cost. This confirms the validity of this approach.
Additionally, the effects of different attention modules on detection performance were further analyzed through comparative experiments, including a baseline model without attention and models incorporating attention modules such as SE, CBAM, LSKA, FCM, HFP, and DSSA, to identify the optimal attention mechanism. To ensure a fair comparison, all attention modules were inserted at the same position after the backbone and were trained using identical hyperparameters. As shown in Table 7, DSSA improves the baseline mAP50 from 75.0% to 76.8%, achieving the highest overall mAP50 among the compared attention mechanisms. It should be noted that SCSA achieves the highest AP for distribution towers at 74.0%, slightly exceeding the 73.2% obtained by DSSA. However, its AP for transmission towers decreases to 78.1%. In contrast, DSSA obtains AP values of 73.2% and 80.4% for distribution and transmission towers, respectively, providing a more balanced improvement across the two categories. Therefore, the experimental results do not indicate that DSSA is universally superior in every metric, but demonstrate that its task-specific parallel design achieves the best overall mAP50 on the evaluated dataset.
To further investigate the contribution of each component in DFW-IoU, a fine-grained ablation experiment was conducted using the original CIoU loss as the baseline. Specifically, the scale-sensitive weight, focal modulation term, dynamic bounding-box scaling schedule, and normalized center-distance penalty were individually incorporated into CIoU, while all other model structures and training settings were kept unchanged. The complete DFW-IoU, which integrates all four components, was also evaluated. As shown in Table 8, the four components of DFW-IoU exhibit different effects on bounding-box regression. Introducing only the dynamic scaling schedule r ( e ) improves DT, TT, mAP50, and mAP50-95 to 71.2%, 81.4%, 76.3%, and 38.5%, respectively, indicating that progressively adjusting the regression constraints is beneficial for model optimization. The scale-sensitive weight produces the highest standalone DT among the weighting terms, reaching 71.7%, which confirms its effectiveness in strengthening the supervision of small distribution towers. However, its mAP50-95 decreases to 34.1%, suggesting that scale compensation alone may overemphasize small samples and weaken localization under stricter IoU thresholds. The focal modulation term achieves an mAP50 of 76.5% and an mAP50-95 of 38.5%, demonstrating its effectiveness in emphasizing difficult samples. The center-distance penalty increases TT to 82.6% and mAP50 to 76.7%, although center alignment alone does not consistently improve high-IoU localization accuracy. Finally, the complete DFW-IoU achieves the best overall performance, with DT, mAP50, and mAP50-95 reaching 72.7%, 77.1%, and 40.8%, respectively. These results indicate that the four components provide complementary effects in small-object weighting, difficult-sample emphasis, dynamic optimization, and center-position alignment.
Table 9 compares DFW-IoU with several representative IoU-based bounding-box regression losses under identical experimental settings. Wise-IoU improves TT from 80.3% to 82.7%, but reduces DT to 68.9%, indicating that its sample-quality focusing mechanism provides limited improvement for small distribution towers. MPDIoU increases DT to 72.3% and mAP50-95 to 38.8%, whereas its TT and mAP50 decrease to 77.5% and 74.9%, respectively. Shape-IoU achieves the highest TT of 84.1%, but its DT decreases to 67.7%, showing an evident performance imbalance between the two categories. In comparison, DFW-IoU achieves the best DT, mAP50, and mAP50-95 values of 72.7%, 77.1%, and 40.8%, respectively, while maintaining a competitive TT of 81.4%. Compared with the original CIoU loss, these metrics are improved by 3.0%, 2.1%, and 3.0%, respectively. Although DFW-IoU does not obtain the highest AP for transmission towers, it provides the most balanced overall performance and demonstrates stronger localization accuracy under stricter IoU thresholds. This result indicates that the joint use of dynamic scaling, scale-sensitive weighting, focal modulation, and center-distance supervision is particularly effective for improving the regression of small and difficult power tower targets.


5. Conclusions

This paper aims to mitigate the major challenges associated with power tower detection in satellite remote sensing images, including substantial scale discrepancies among objects, indistinct features of small objects, and low regression weights. It proposes an algorithm for detecting power towers in satellite remote sensing images based on multi-scale feature extraction and small object enhancement. Through multiple comparative and ablation experiments on the SRSPTD and GFTD datasets, the following conclusions are drawn.
1.
To address the significant scale variation in power towers, this paper integrates the PKI_Bottleneck into the backbone. This module uses multiple convolutional kernels of different sizes to perform feature extraction in parallel and combines this with a context-based attention mechanism, thereby effectively enhancing the model’s ability to capture multi-scale contextual cues. Experimental results show that incorporating this module improves mAP50 by 2.2% for distribution towers (DT) and 1.9% for transmission towers (TT) on the SRSPTD dataset, validating its effectiveness in addressing scale discrepancies.
2.
To address the issue that small object towers are easily missed in complex backgrounds, this paper proposes the dual-branch semantic-spatial synergy attention. By decoupling deep semantic information from shallow spatial details, this module improves the detection performance for small-scale objects while suppressing background noise. Experimental results demonstrate that the incorporation of DSSA improves mAP50 for the small object category (DT) by 3.5%, substantially enhancing feature representation for minute skeletal structures.
3.
To address the issue of low regression weights for small objects on the dataset, the DFW-IoU loss function is proposed in this paper. By incorporating a dynamic focus modulation factor and a scale-sensitive weighting term based on the target area, this loss function guides the model to assign greater importance to small-scale objects and hard samples during optimization. Ultimately, MS-YOLO achieved mAP50 scores of 79.1% and 95.7% on the SRSPTD and GFTD datasets, respectively, exceeding the baseline by 4.1% and 3.4%. These results indicate that the proposed method achieves notable accuracy gains while preserving real-time detection capability.
Despite its competitive performance, MS-YOLO still has several limitations. Its generalization across datasets, regions, sensors, and image resolutions has not been fully verified because experiments were limited to the standard splits of SRSPTD and GFTD. Although the synthetic fog experiment demonstrates improved robustness over the baseline, severe degradation, real adverse weather, occlusion, and extremely small targets still affect detection and localization accuracy. In addition, PKI_Bottleneck and DSSA introduce extra computational cost, and the reported 217 FPS and 4.61 ms latency on an RTX 4090 do not directly reflect performance on edge devices. The hyperparameters of DFW-IoU are also empirically fixed, and their sensitivity requires further investigation. The current results were obtained under a controlled experimental setup using the same dataset split. Most of the experimental results in this study are based on a single experiment, and the statistical variability under different random seeds has not yet been evaluated. Therefore, the reported performance differences should be interpreted as point estimates under the current controlled experimental settings rather than as evidence of statistical significance. Although the improvements are consistent across datasets, metrics, ablation settings, and synthetic fog conditions, formal statistical significance cannot be claimed. And the current datasets were randomly divided at the non-overlapping image-patch level rather than using scene-wise or geographically independent partitions. Although duplicate images, overlapping pixels, and duplicated tower instances were excluded, neighboring patches may still share similar spatial and background characteristics, potentially leading to optimistic performance estimates. Future work will focus on constructing larger cross-region and cross-sensor datasets, incorporating real adverse-weather and multimodal imagery, investigating model compression and embedded-platform deployment, and conducting repeated experiments with different random seeds to report the mean, standard deviation, and confidence intervals.

Author Contributions

Conceptualization, K.Z. and Y.C.; methodology, Y.C.; software, Y.C.; validation, Y.C., J.L. and L.X.; formal analysis, J.X.; investigation, J.L.; resources, C.S.; data curation, K.Z.; writing—original draft preparation, K.Z.; writing—review and editing, C.S.; visualization, X.D.; supervision, C.S.; project administration, K.Z.; funding acquisition, C.S. All authors have read and agreed to the published version of the manuscript.

Funding

This paper was supported in part by the National Natural Science Foundation of China (NSFC) under Grant 62206095 and Grant 62506129; Hebei Provincial Natural Science Foundation Beijing Tianjin Hebei Basic Research Cooperation Special Project under Grant F2024502017; Central Guidance Fund Project for Local Scientific and Technological Development of Hebei Province under Grant 264Z2101G; and in part by the Fundamental Research Funds for the Central Universities under Grant 2024MS117 and Grant 2023JG002.

Data Availability Statement

The Satellite Remote Sensing Power Tower Dataset (SRSPTD) is publicly accessible at https://github.com/ZX815/LSKF-YOLO/tree/main accessed on 22 June 2026. However, the Gao Fen Tower Dataset (GFTD), compiled by North China Institute of Aerospace Engineering, is a proprietary dataset and thus not publicly available due to data sharing restrictions.

Conflicts of Interest

The authors declare no conflicts of interest.

References

  1. Haroun, F.M.E.; Deros, S.N.M.; Din, N.M. Detection and Monitoring of Power Line Corridor From Satellite Imagery Using RetinaNet and K-Mean Clustering. IEEE Access 2021, 9, 116720–116730. [Google Scholar] [CrossRef]
  2. Zhang, X.; Zhang, T.; Wang, G.; Zhu, P.; Tang, X.; Jia, X.; Jiao, L. Remote Sensing Object Detection Meets Deep Learning: A metareview of challenges and advances. IEEE Geosci. Remote Sens. Mag. 2023, 11, 8–44. [Google Scholar] [CrossRef]
  3. Gorelick, N.; Hancher, M.; Dixon, M.; Ilyushchenko, S.; Thau, D.; Moore, R. Google Earth Engine: Planetary-scale geospatial analysis for everyone. Remote Sens. Environ. 2017, 202, 18–27. [Google Scholar] [CrossRef]
  4. Lam, D.; Kuzma, R.; McGee, K.; Dooley, S.; Laielli, M.; Klaric, M.; Bulatov, Y.; McCord, B. xview: Objects in context in overhead imagery. arXiv 2018, arXiv:1802.07856. [Google Scholar]
  5. Li, Z.; Shen, H.; Li, H.; Xia, G.; Gamba, P.; Zhang, L. Multi-feature combined cloud and cloud shadow detection in GaoFen-1 wide field of view imagery. Remote Sens. Environ. 2017, 191, 342–358. [Google Scholar] [CrossRef]
  6. Zhang, S.; Wu, R.; Xu, K.; Wang, J.; Sun, W. R-CNN-based ship detection from high resolution remote sensing imagery. Remote Sens. 2019, 11, 631. [Google Scholar] [CrossRef]
  7. Wang, Y.; Wang, C.; Zhang, H.; Dong, Y.; Wei, S. Automatic ship detection based on RetinaNet using multi-resolution Gaofen-3 imagery. Remote Sens. 2019, 11, 531. [Google Scholar] [CrossRef]
  8. Ren, S.; He, K.; Girshick, R.; Sun, J. Faster R-CNN: Towards Real-Time Object Detection with Region Proposal Networks. IEEE Trans. Pattern Anal. Mach. Intell. 2017, 39, 1137–1149. [Google Scholar] [CrossRef] [PubMed]
  9. Wang, C.Y.; Bochkovskiy, A.; Liao, H.Y.M. YOLOv7: Trainable Bag-of-Freebies Sets New State-of-the-Art for Real-Time Object Detectors. In Proceedings of the 2023 IEEE/CVF Conference on Computer Vision and Pattern Recognition (CVPR); IEEE: New York, NY, USA, 2023; pp. 7464–7475. [Google Scholar] [CrossRef]
  10. Jocher, G.; Qiu, J.; Chaurasia, A. Ultralytics YOLOv11. 2024. Available online: https://github.com/ultralytics/ultralytics (accessed on 22 June 2026).
  11. Tian, Y.; Ye, Q.; Doermann, D. YOLOv12: Attention-centric real-time object detectors. arXiv 2025, arXiv:2502.12524. [Google Scholar]
  12. He, M.; Qin, L.; Deng, X.; Liu, Q.; Liu, K. Bolt-YOLO: Research on an Algorithm Framework for Detecting Bolt Defects in Transmission Lines. IEEE Trans. Power Deliv. 2025, 40, 1718–1729. [Google Scholar] [CrossRef]
  13. He, M.; Qin, L.; Deng, X.; Liu, K. MFI-YOLO: Multi-Fault Insulator Detection Based on an Improved YOLOv8. IEEE Trans. Power Deliv. 2024, 39, 168–179. [Google Scholar] [CrossRef]
  14. Yang, H.; Wang, S.; Chen, Y.; Yan, Z.; Cheng, Y.; Wang, T.; Wei, R. Improving power transmission tower state recognition in remote sensing images using cooperative Adaboost-MobileNet. Remote Sens. Lett. 2023, 14, 124–134. [Google Scholar] [CrossRef]
  15. Ming, F.; Xiaomin, S.; Ran, H.; Guochao, Q.; Hao, G.; Gang, W.; Chao, X.; Chongbin, X.; Liang, L. Research on Automatic Detection Algorithm of Power Tower Using High Resolution Remote Sensing Satellite Image. Spacecr. Recovery Remote Sens. 2021, 42, 118–126. [Google Scholar] [CrossRef]
  16. Zha, W.; Hu, L.; Duan, C.; Li, Y. Semi-supervised learning-based satellite remote sensing object detection method for power transmission towers. Energy Rep. 2023, 9, 15–27. [Google Scholar] [CrossRef]
  17. Lu, Q.; Lin, Y.; Yin, L. Quantum-enhanced deep lightweight object detection model for power tower base occlusion detection. Eng. Appl. Artif. Intell. 2025, 160, 111972. [Google Scholar] [CrossRef]
  18. Huang, S.; Lin, C.; Peng, J.; Pan, Y. DLR-YOLO: Dynamic low-rank training for a lightweight power tower object detection network in multi-scenario remote sensing images. Adv. Eng. Inform. 2026, 72, 104463. [Google Scholar] [CrossRef]
  19. Liu, S.; Qi, L.; Qin, H.; Shi, J.; Jia, J. Path Aggregation Network for Instance Segmentation. In Proceedings of the 2018 IEEE/CVF Conference on Computer Vision and Pattern Recognition; IEEE: New York, NY, USA, 2018; pp. 8759–8768. [Google Scholar] [CrossRef]
  20. Tan, M.; Pang, R.; Le, Q.V. EfficientDet: Scalable and Efficient Object Detection. In Proceedings of the 2020 IEEE/CVF Conference on Computer Vision and Pattern Recognition (CVPR); IEEE: New York, NY, USA, 2020; pp. 10778–10787. [Google Scholar] [CrossRef]
  21. Li, X.; Wang, W.; Hu, X.; Yang, J. Selective Kernel Networks. In Proceedings of the 2019 IEEE/CVF Conference on Computer Vision and Pattern Recognition (CVPR); IEEE: New York, NY, USA, 2019; pp. 510–519. [Google Scholar] [CrossRef]
  22. Liu, J.J.; Hou, Q.; Cheng, M.M.; Wang, C.; Feng, J. Improving Convolutional Networks With Self-Calibrated Convolutions. In Proceedings of the 2020 IEEE/CVF Conference on Computer Vision and Pattern Recognition (CVPR); IEEE: New York, NY, USA, 2020; pp. 10093–10102. [Google Scholar] [CrossRef]
  23. Li, Y.; Hou, Q.; Zheng, Z.; Cheng, M.M.; Yang, J.; Li, X. Large Selective Kernel Network for Remote Sensing Object Detection. In Proceedings of the 2023 IEEE/CVF International Conference on Computer Vision (ICCV); IEEE: New York, NY, USA, 2023; pp. 16748–16759. [Google Scholar] [CrossRef]
  24. Cai, X.; Lai, Q.; Wang, Y.; Wang, W.; Sun, Z.; Yao, Y. Poly Kernel Inception Network for Remote Sensing Detection. In Proceedings of the IEEE/CVF Conference on Computer Vision and Pattern Recognition (CVPR), Seattle, WA, USA, 16–22 June 2024; pp. 27706–27716. [Google Scholar]
  25. Zha, W.; Hu, L.; Sun, Y.; Li, Y. ENGD-BiFPN: A remote sensing object detection model based on grouped deformable convolution for power transmission towers. Multimed. Tools Appl. 2023, 82, 45585–45604. [Google Scholar] [CrossRef]
  26. Fu, K.; Chang, Z.; Zhang, Y.; Xu, G.; Zhang, K.; Sun, X. Rotation-aware and multi-scale convolutional neural network for object detection in remote sensing images. Isprs J. Photogramm. Remote Sens. 2020, 161, 294–308. [Google Scholar] [CrossRef]
  27. Zhu, X.; Lyu, S.; Wang, X.; Zhao, Q. TPH-YOLOv5: Improved YOLOv5 Based on Transformer Prediction Head for Object Detection on Drone-captured Scenarios. In Proceedings of the 2021 IEEE/CVF International Conference on Computer Vision Workshops (ICCVW); IEEE: New York, NY, USA, 2021; pp. 2778–2788. [Google Scholar] [CrossRef]
  28. Zhang, G.; Lu, S.; Zhang, W. CAD-Net: A Context-Aware Detection Network for Objects in Remote Sensing Imagery. IEEE Trans. Geosci. Remote Sens. 2019, 57, 10015–10024. [Google Scholar] [CrossRef]
  29. Shi, C.; Zheng, X.; Zhao, Z.; Zhang, K.; Su, Z.; Lu, Q. LSKF-YOLO: Large Selective Kernel Feature Fusion Network for Power Tower Detection in High-Resolution Satellite Remote Sensing Images. IEEE Trans. Geosci. Remote Sens. 2024, 62, 1–16. [Google Scholar] [CrossRef]
  30. Yan, X.; Li, Z.; Zhai, Y.; Liu, K.; Zhang, K.; Zhao, Z. LSKAFF-YOLO: Large Separable Kernel Attentional Feature Fusion Network for Transmission Tower Detection in High-Resolution Satellite Remote Sensing Images. IEEE J. Sel. Top. Appl. Earth Obs. Remote Sens. 2025, 18, 19208–19222. [Google Scholar] [CrossRef]
  31. Xu, D.; Wang, H.; Li, S.; Ge, Y.; Yang, Y.; Su, C.; Zhao, Z.; Wang, S. SCOPE-YOLO: An Integrated Super-Resolution and Detection Framework for Power Transmission Tower Monitoring in Remote Sensing Imagery. Remote Sens. 2026, 18, 534. [Google Scholar] [CrossRef]
  32. Rezatofighi, H.; Tsoi, N.; Gwak, J.; Sadeghian, A.; Reid, I.; Savarese, S. Generalized Intersection Over Union: A Metric and a Loss for Bounding Box Regression. In Proceedings of the 2019 IEEE/CVF Conference on Computer Vision and Pattern Recognition (CVPR); IEEE: New York, NY, USA, 2019; pp. 658–666. [Google Scholar] [CrossRef]
  33. Zheng, Z.; Wang, P.; Liu, W.; Li, J.; Ye, R.; Ren, D. Distance-IoU loss: Faster and better learning for bounding box regression. In Proceedings of the AAAI Conference on Artificial Intelligence, New York, NY, USA, 7–12 February 2020; Volume 34, pp. 12993–13000. [Google Scholar]
  34. Zheng, Z.; Wang, P.; Ren, D.; Liu, W.; Ye, R.; Hu, Q.; Zuo, W. Enhancing Geometric Factors in Model Learning and Inference for Object Detection and Instance Segmentation. IEEE Trans. Cybern. 2022, 52, 8574–8586. [Google Scholar] [CrossRef] [PubMed]
  35. Gevorgyan, Z. SIoU loss: More powerful learning for bounding box regression. arXiv 2022, arXiv:2205.12740. [Google Scholar]
  36. Tong, Z.; Chen, Y.; Xu, Z.; Yu, R. Wise-IoU: Bounding box regression loss with dynamic focusing mechanism. arXiv 2023, arXiv:2301.10051. [Google Scholar]
  37. Ma, S.; Xu, Y. Mpdiou: A loss for efficient and accurate bounding box regression. arXiv 2023, arXiv:2307.07662. [Google Scholar]
  38. Zhang, H.; Zhang, S. Shape-iou: More accurate metric considering bounding box shape and scale. arXiv 2023, arXiv:2312.17663. [Google Scholar]
  39. Liu, C.; Wang, K.; Li, Q.; Zhao, F.; Zhao, K.; Ma, H. Powerful-IoU: More straightforward and faster bounding box regression loss with a nonmonotonic focusing mechanism. Neural Netw. 2024, 170, 276–284. [Google Scholar] [CrossRef] [PubMed]
  40. Wang, C.Y.; Yeh, I.H.; Mark Liao, H.Y. YOLOv9: Learning What You Want to Learn Using Programmable Gradient Information. In Proceedings of the European Conference on Computer Vision (ECCV); Springer Nature: Cham, Switzerland, 2024; pp. 1–21. [Google Scholar]
  41. Yang, J.; Qiu, P.; Zhang, Y.; Marcus, D.S.; Sotiras, A. D-Net: Dynamic large kernel with dynamic feature fusion for volumetric medical image segmentation. Biomed. Signal Process. Control 2026, 113, 108837. [Google Scholar] [CrossRef]
  42. Wang, A.; Chen, H.; Liu, L.; Chen, K.; Lin, Z.; Han, J.; Ding, G. YOLOv10: Real-Time End-to-End Object Detection. In Proceedings of the Advances in Neural Information Processing Systems; Globerson, A., Mackey, L., Belgrave, D., Fan, A., Paquet, U., Tomczak, J., Zhang, C., Eds.; Curran Associates, Inc.: Red Hook, NY, USA, 2024; Volume 37, pp. 107984–108011. [Google Scholar] [CrossRef]
  43. Zhang, K.; Zhang, N.; Shi, C.; Lu, Q.; Zheng, X.; Cao, Y.; Zhang, X.; Yang, J. YOLOv9-GDV: A Power Pylon Detection Model for Remote Sensing Images. Remote Sens. 2025, 17, 2229. [Google Scholar] [CrossRef]
  44. Lei, M.; Li, S.; Wu, Y.; Hu, H.; Zhou, Y.; Zheng, X.; Ding, G.; Du, S.; Wu, Z.; Gao, Y. YOLOv13: Real-Time Object Detection with Hypergraph-Enhanced Adaptive Visual Perception. arXiv 2025, arXiv:2506.17733. [Google Scholar]
  45. Hu, J.; Shen, L.; Sun, G. Squeeze-and-Excitation Networks. In Proceedings of the 2018 IEEE/CVF Conference on Computer Vision and Pattern Recognition; IEEE: New York, NY, USA, 2018; pp. 7132–7141. [Google Scholar] [CrossRef]
  46. Woo, S.; Park, J.; Lee, J.Y.; Kweon, I.S. Cbam: Convolutional block attention module. In Proceedings of the European Conference on Computer Vision (ECCV); IEEE: New York, NY, USA, 2018; pp. 3–19. [Google Scholar]
  47. Lau, K.W.; Po, L.M.; Rehman, Y.A.U. Large separable kernel attention: Rethinking the large kernel attention design in cnn. Expert Syst. Appl. 2024, 236, 121352. [Google Scholar] [CrossRef]
  48. Si, Y.; Xu, H.; Zhu, X.; Zhang, W.; Dong, Y.; Chen, Y.; Li, H. SCSA: Exploring the synergistic effects between spatial and channel attention. Neurocomputing 2025, 634, 129866. [Google Scholar] [CrossRef]
  49. Lu, W.; Chen, S.B.; Li, H.D.; Shu, Q.L.; Ding, C.H.; Tang, J.; Luo, B. LEGNet: A Lightweight Edge-Gaussian Network for Low-Quality Remote Sensing Image Object Detection. In Proceedings of the IEEE/CVF International Conference on Computer Vision (ICCV) Workshops; IEEE: New York, NY, USA, 2025; pp. 2844–2853. [Google Scholar]
  50. Xiao, Y.; Xu, T.; Xin, Y.; Li, J. FBRT-YOLO: Faster and Better for Real-Time Aerial Image Detection. Proc. AAAI Conf. Artif. Intell. 2025, 39, 8673–8681. [Google Scholar] [CrossRef]
  51. Yun, S.; Ro, Y. SHViT: Single-Head Vision Transformer with Memory Efficient Macro Design. In Proceedings of the IEEE/CVF Conference on Computer Vision and Pattern Recognition (CVPR); IEEE: New York, NY, USA, 2024; pp. 5756–5767. [Google Scholar]
Figure 1. The architecture of the MS-YOLO model. The PKI_Bottleneck module is introduced into the RepNCSPELAN4 backbone to improve the model’s multi-scale feature extraction ability. The DSSA is inserted after the backbone to improve the model’s perception of small objects. The DFW-IoU loss replaces the original CIoU loss, increasing the weight of small objects in gradient updates to focus more on detecting small objects within power towers.
Applsci 16 07462 g001
Figure 2. The architecture of PKIBlock module.
Applsci 16 07462 g002
Figure 3. The architecture of PKI_Bottleneck.
Applsci 16 07462 g003
Figure 4. The architecture of DSSA module.
Applsci 16 07462 g004
Figure 5. Bounding box scaling in DFW-IoU loss.
Applsci 16 07462 g005
Figure 6. Sample images from the SRSPTD dataset.
Applsci 16 07462 g006
Figure 7. Sample images from the GFTD dataset.
Applsci 16 07462 g007
Figure 8. The distribution map and a width-height scatter plot of the object regions in the SRSPTD dataset.
Applsci 16 07462 g008
Figure 9. The distribution map and a width-height scatter plot of the object regions in the GFTD dataset.
Applsci 16 07462 g009
Figure 10. The mAP50 change curves of MS-YOLO and other YOLO models during training on the SRSPTD dataset.
Applsci 16 07462 g010
Figure 11. Sample detection results from YOLOv9s, YOLOv11s, YOLOv12s, YOLOv13s, and MS-YOLO.
Applsci 16 07462 g011
Figure 12. Grad-CAM heatmaps of YOLOv9s, YOLOv9s+DSSA, and MS-YOLO for transmission and distribution towers.
Applsci 16 07462 g012
Table 1. Experimental environment and hardware configuration.
ParameterConfiguration
CPUAMD EPYC 7453
GPUNVIDIA GeForce RTX 4090 24 G
Running SystemUbuntu 20.04.4
Random Access Memory251 G
CUDA Version12.0
Programming LanguagePython 3.8.20
Deep Learning FrameworkPyTorch 1.10.1
Table 2. Comparative detection performance of different models on the SRSPTD dataset.
ModelDT/%TT/%mAP50/%mAP50-95/%Params/MGFLOPs
Faster R-CNN57.671.864.729.228.3473.2
Deformable-DETR64.268.966.627.840.2173.3
RT-DETR58.270.864.519.932.8108.0
RetinaNet57.383.472.234.780.277.6
RT-DETRv467.775.671.738.730.691.0
RF-DETR71.282.276.739.1126.0438.4
YOLOv5s67.180.173.637.57.016.2
YOLOv7-tiny69.776.373.033.112.3155.5
YOLOv8s71.174.272.635.511.128.6
YOLOv9s69.780.375.037.89.839.6
YOLOv10s66.670.868.733.67.221.6
YOLOv11s67.478.673.037.09.421.5
YOLOv12s70.373.671.936.09.119.6
YOLOv13s66.882.374.537.79.021.0
YOLO26s70.376.973.638.611.428.6
YOLOvE-11s67.078.272.638.410.021.5
LSKF-YOLO69.583.776.639.623.218.5
YOLOv9-GDV70.683.977.340.512.640.6
MS-YOLO74.084.179.141.912.041.9
Table 3. Comparative detection performance of different models on the GFTD dataset.
ModelmAP50/%Params/MGFLOPs
Faster R-CNN73.228.3473.2
Deformable-DETR90.440.2173.3
RetinaNet80.280.277.6
YOLOv5s86.87.016.2
YOLOv7-tiny85.512.3155.5
YOLOv8s87.611.128.6
YOLOv9s92.39.839.6
YOLOv10s91.67.221.6
YOLOv11s92.79.421.5
YOLOv12s92.19.119.6
YOLOv13s89.59.021.0
LSKF-YOLO92.923.218.5
YOLOv9-GDV94.612.640.6
MS-YOLO95.712.041.9
Table 4. Robustness comparison under different synthetic fog conditions.
ModelConditionDT/%TT/%mAP50/%mAP50-95/%
YOLOv9sClear69.780.375.037.8
Light fog69.679.674.637.3
Medium fog65.978.172.036.6
Heavy fog60.076.268.136.0
MS-YOLOClear74.084.179.141.9
Light fog71.086.178.541.4
Medium fog68.285.776.940.1
Heavy fog64.482.573.537.3
Table 5. Results of ablation experiment.
PKI_BottleneckDSSADFW-IoUDT/%TT/%mAP50/%Params/MGFLOPsFPS
×××69.780.375.09.839.6285
××71.982.277.110.140.3250
××73.280.476.811.741.1238
××72.781.477.19.839.6285
×73.882.778.212.041.9217
×73.182.877.910.140.3227
×72.084.378.211.741.1222
74.084.179.112.041.9217
Table 6. Comparison of results between inserting only in the backbone and inserting throughout the entire model.
ModelDT/%TT/%mAP50-95/%mAP50/%Params/MGFLOPs
baseline69.780.337.875.09.839.6
entire model69.983.139.576.510.740.8
backbone portion71.982.241.977.110.140.3
Table 7. Comparative results of different attention modules in networks.
Attention ModuleDT/%TT/%mAP50/%
baseline69.780.375.0
SE [45]71.780.676.2
CBAM [46]69.182.375.7
LSKA [47]70.980.175.5
SCSA [48]74.078.176.1
LEG [49]70.379.674.9
FCM [50]71.980.576.2
SHSA [51]71.378.775.0
DSSA73.280.476.8
Table 8. Fine-grained ablation experiment of different components in DFW-IoU.
r(e)wscalewfocaldcenterDT/%TT/%mAP50/%mAP50-95/%
69.780.375.037.8
71.281.476.338.5
71.780.476.234.1
71.381.776.538.5
70.882.676.736.9
72.781.477.140.8
Note: “√” indicates that the corresponding component is included, whereas “–” indicates that the component is not included.
Table 9. Comparison of different IoU-based bounding-box regression losses on the SRSPTD dataset.
Loss FunctionDT/%TT/%mAP50/%mAP50-95/%
CIoU (baseline)69.780.375.037.8
Wise-IoU [36]68.982.775.838.2
MPD-IoU [37]72.377.574.938.8
Shape-IoU [38]67.784.175.939.5
DFW-IoU72.781.477.140.8
Disclaimer/Publisher’s Note: The statements, opinions and data contained in all publications are solely those of the individual author(s) and contributor(s) and not of MDPI and/or the editor(s). MDPI and/or the editor(s) disclaim responsibility for any injury to people or property resulting from any ideas, methods, instructions or products referred to in the content.