1. Introduction
Tunneling method, recognized for its high level of mechanization, safety, reliability, and excellent construction efficiency, has become the predominant technique in urban rail transit construction [
1,
2,
3]. Among various shield types, the earth pressure balance (EPB) shield has been extensively employed in diverse tunneling projects across China, owing to its advantages such as a small footprint, wide applicability across different ground conditions, and environmental friendliness [
4,
5,
6]. During EPB shield tunneling, the appropriate setting of the chamber pressure is crucial for ensuring face stability and preventing hazards like ground deformation and surface settlement [
7,
8]. Improper chamber pressure settings can readily lead to engineering incidents such as ground heave or surface collapse, endangering public safety and property [
9,
10,
11,
12].
In recent years, extensive studies have been conducted on chamber pressure control, tunneling parameter optimization, and ground response prediction in EPB shield tunneling. These studies have mainly investigated this issue through mechanism-based analysis, numerical simulation, and data-driven prediction [
13,
14,
15]. Data-driven and machine-learning methods are useful for identifying correlations among tunneling parameters, chamber pressure, and ground deformation, and they have improved the prediction of chamber pressure or settlement under specific project conditions [
16,
17]. However, their interpretability and transferability are often affected by data quality, feature selection, geological variability, and project-specific construction conditions. Mechanism-based theoretical models, especially those based on soil mechanical equilibrium and volume conservation, have also been widely used to describe the relationship between chamber pressure and tunneling parameters [
18,
19]. These models provide clear physical interpretation and are convenient for engineering application, especially for identifying the directional influence of tunneling speed, cutterhead operation, and muck discharge on chamber pressure. However, most of them simplify chamber pressure control into a static or quasi-static balance problem, making it difficult to fully represent the dynamic disturbance caused by cutterhead rotation and squeezing action [
20,
21]. In addition, the influence of soil conditioning on muck flowability and rheological behavior is often simplified [
22,
23,
24].
Continuum-based numerical methods, such as the Finite Element Method (FEM) and the Finite Difference Method (FDM), have been widely used to describe stress redistribution, ground deformation, and surface settlement during shield tunneling [
25,
26,
27]. These methods are suitable for modelling large-scale ground response, but they generally treat soil as a continuous medium and therefore have limitations in reproducing particle-scale processes during EPB tunneling, such as soil cutting by the cutterhead, muck accumulation in the chamber, and discharge through the screw conveyor. In contrast, the Discrete Element Method (DEM) can explicitly capture particle movement, muck flow, and local contact behavior inside the chamber, making it suitable for analyzing the spatial evolution of chamber pressure [
28,
29,
30]. However, DEM alone is restricted by computational efficiency and model scale, making it difficult to simulate large-scale ground deformation and surface settlement using only discrete particles. Therefore, FDM–DEM coupling provides an effective continuum–discrete modelling strategy, in which the FDM component describes the ground-scale deformation response, while the DEM component captures the chamber-scale muck movement and contact behavior. This allows chamber pressure evolution and ground settlement response to be analyzed within a unified numerical framework.
Although previous theoretical and numerical studies have provided important foundations for understanding chamber pressure control, tunneling parameter effects, muck movement, and settlement response in EPB shield tunneling, several scientific issues still require further clarification. First, the influence mechanism of tunneling parameters on chamber pressure remains insufficiently explained when soil conditioning and cutterhead squeezing are considered simultaneously [
31,
32]. Second, the macro–micro parameter calibration of conditioned soil still needs to be strengthened to improve the quantitative reliability of coupled simulations [
33,
34]. Third, the effect of chamber pressure variation on surface settlement in clay strata requires further investigation, especially under different tunneling speeds, cutterhead speeds, and screw conveyor speeds. These issues provide the motivation for the theoretical and numerical investigation in this study [
35].
To address these issues, this study establishes a theoretical mechanistic model for EPB tunneling that incorporates both soil conditioning and the cutterhead squeezing effect. The model is derived from soil deformation behavior and physico-mechanical equilibrium relationships during shield excavation, thereby identifying the main operational parameters affecting chamber pressure. Based on the Jinan Metro Line 6 project, macro–micro parameter calibration for unconditioned and foam-conditioned soil was conducted using triaxial tests and slump tests. A three-dimensional FDM–DEM coupled model was then developed to simulate the continuous process of shield excavation and muck discharge. On this basis, the influence mechanisms of tunneling speed, cutterhead speed, and screw conveyor speed on chamber pressure and surface settlement in clay strata were systematically investigated. Rather than treating these tasks as independent objectives, this study follows a sequential research process in which theoretical analysis determines the main tunneling parameters affecting chamber pressure, laboratory calibration provides macro–micro parameters for the coupled numerical model, and FDM–DEM simulation further reveals the effects of these parameters on chamber pressure and surface settlement.
2. Analysis of the Tunneling Mechanism for Earth Pressure Balance Shields
During the tunneling process of an earth pressure balance shield, the chamber pressure is influenced by various operating parameters. This study investigates these influences through theoretical derivations based on the physico-mechanical equilibrium of the excavation process [
36]. It identifies the key factors affecting chamber pressure and elucidates its control mechanism, thereby providing a theoretical foundation for subsequent numerical simulation studies.
2.1. Soil Deformation
2.1.1. Magnitude of Soil Deformation Induced by Shield Tunneling
During the shield tunneling process, the volume of natural soil excavated often exceeds or falls short of the volume of soil discharged by the screw conveyor. This means there exists a discrepancy between the volume displaced by the shield’s advance and the volume of natural soil discharged. This relationship can be expressed by the following formula:
In the formula, Vin is the volume displaced by the shield advance; Vout is the volume of natural soil discharged by the screw conveyor; and Vp is the volume of soil compressed ahead of the shield.
Soil conditioning is often required during shield tunneling. Considering that the foam component in the conditioning agent may dissipate during mixing, and assuming the weight of the discharged natural soil and the total weight of the added conditioning agent are
Gout and
Gadd, respectively, the effective muck discharge ratio
ke can then be defined as follows:
In the formula,
Gsc represents the total weight of soil discharged by the screw conveyor;
denotes the unit weight of the conditioned soil; and
Vsc stands for the volume of soil discharged by the screw conveyor within time
, which is calculated as follows:
In the formula,
represents the muck discharge efficiency;
A denotes the effective contact area of the screw conveyor;
ds indicates the pitch between the screw blades;
ns is the rotational speed of the screw conveyor;
r1 and
r2 represent the inner diameter of the screw conveyor and the inner diameter of its internal rotating shaft, respectively. The volume of natural soil discharged by the screw conveyor can therefore be expressed as:
In the formula, Gout represents the weight of natural soil discharged by the screw conveyor; denotes the unit weight of the natural soil.
Assuming the shield machine’s tunneling speed is
v and the cutterhead diameter is
D, the volume to be excavated by the shield machine within time
can be expressed as:
Based on the principle of volume balance between excavation and discharge [
37], the volume of soil compressed forward by the shield can be expressed as:
Dividing both sides of Equation (7) by the cutterhead area allows for the determination of the advancement amount
caused by imbalance during the earth pressure balance shield tunneling process:
2.1.2. Soil Deformation Induced by Cutterhead Squeezing Effect
During the shield tunneling process, the cutterhead panel exerts a certain squeezing action on the soil ahead [
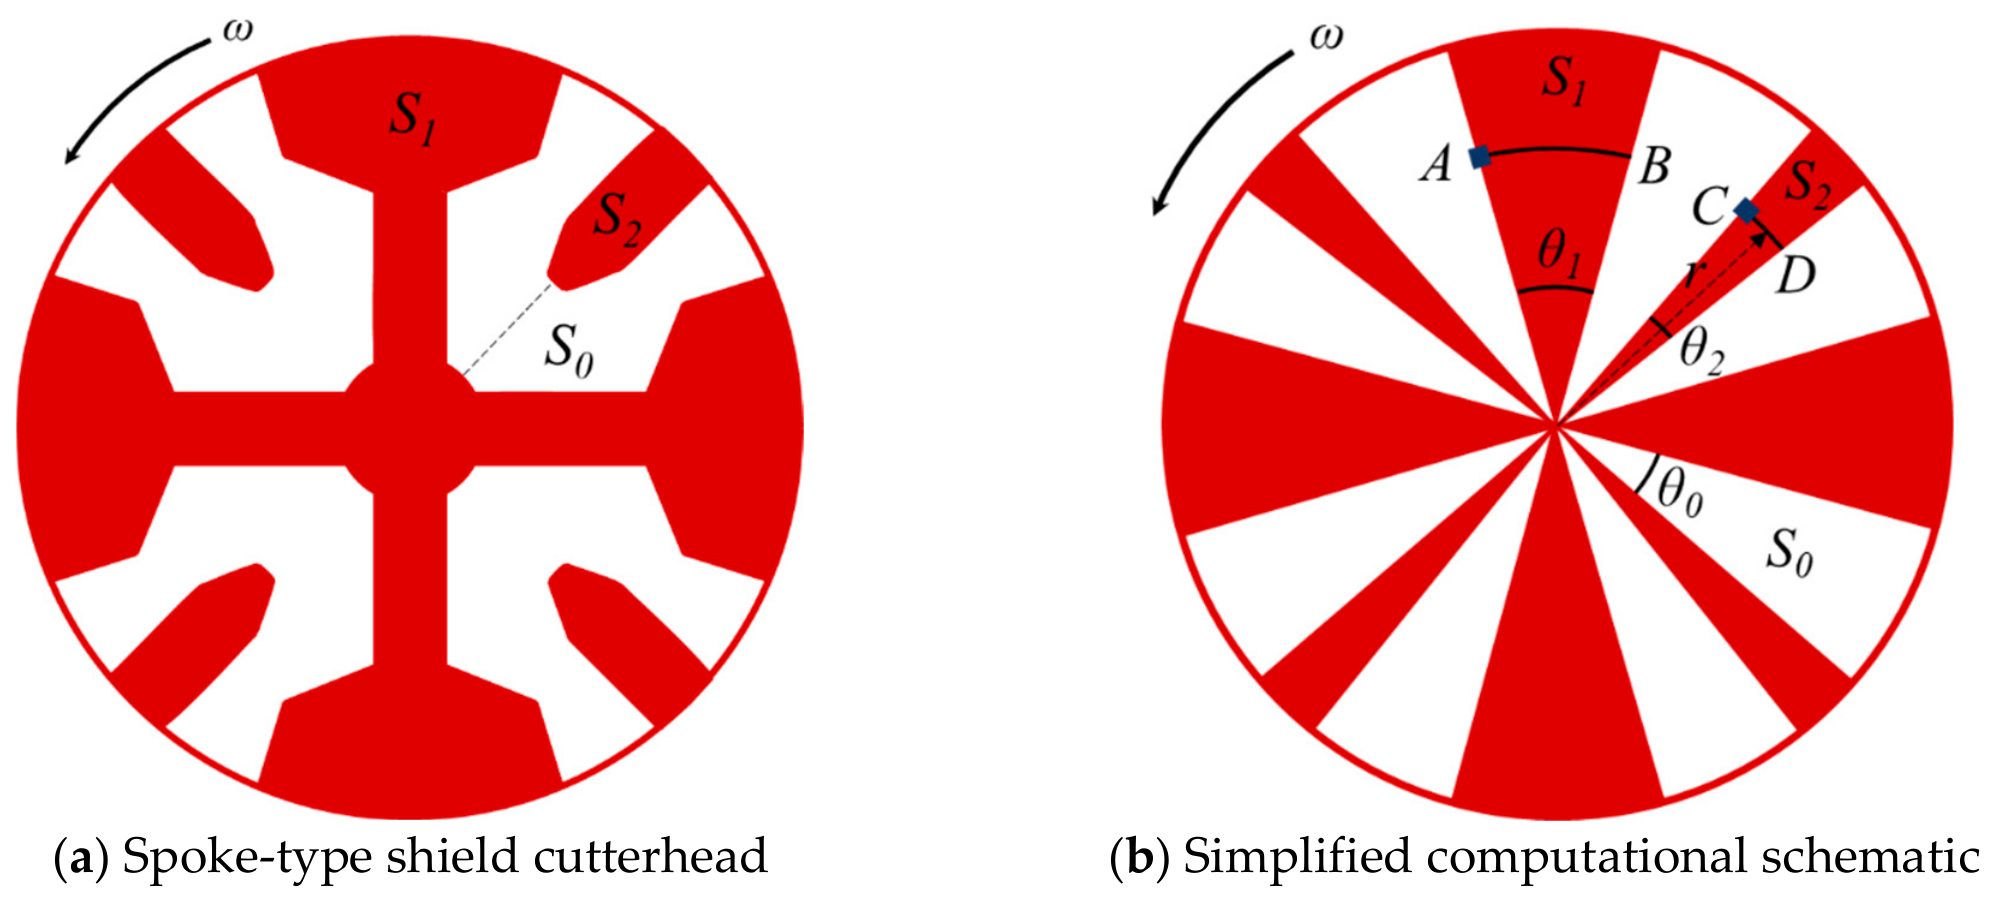
38]. The soil deformation caused by this squeezing effect of the shield is explained below using a spoke-type cutterhead as an example.
To facilitate calculation, the spoke-type cutterhead was simplified while retaining the main opening characteristics that control soil compression in front of the cutterhead. The schematic diagram of the spoke-type shield cutterhead and its simplified version are shown in
Figure 1; therefore, the derived compression term is mainly applicable to spoke-type cutterheads with similar opening characteristics.
Taking a soil element at a distance
r from the center on the cutterhead panel as an example, when the cutterhead rotates at an angular velocity
ω, the soil element begins to be compressed from point
A on the arc. After passing through arc
with radius
r, the opening of the cutterhead panel arrives, and the soil element falls into the excavation chamber. Assuming both the shield’s forward advancing speed
v and the cutterhead’s rotational angular velocity
ω remain constant, the duration of compression experienced by the soil in front of the wider spokes on the cutterhead panel is
, and the maximum compression amount can be expressed as:
where
v is the shield’s tunneling speed in mm/min, and
ω is the cutterhead’s rotational speed in rpm. Similarly, the maximum compression of the soil in front of the smaller spokes on the shield cutterhead panel can be obtained as:
For ease of analysis, the scenario is unfolded along a circumference at a distance
r from the center, as shown in
Figure 2. In the figure, the vertical dimension of the triangular segments represents the soil compression, while the horizontal straight segments correspond to the cutterhead openings.
The compression amount of the soil ahead at a circumferential distance
r from the center of the cutterhead is given by:
where
k1 and
k2 represent the number of wide spokes and small spokes, respectively.
By integrating the compressed soil volume within the range
dr ahead of the annular section along the radius, the total volume
C of soil compressed in front of the cutterhead panel during shield advancement can be obtained as:
The cutterhead openings do not compress the soil ahead. The average compression deformation of the ground induced by shield advancement can be calculated using the following formula:
According to Equation (13), the compression deformation
induced by the cutterhead squeezing effect during the shield’s forward advance over time period
can be obtained as:
Based on the above analysis, the soil deformation ahead of the shield is influenced by two factors: the over-excavation or under-excavation caused by unbalanced tunneling, and the inherent cutterhead squeezing effect. Thus, the total compression deformation
of the soil ahead induced by the shield can be calculated as:
2.2. Mechanical Equilibrium
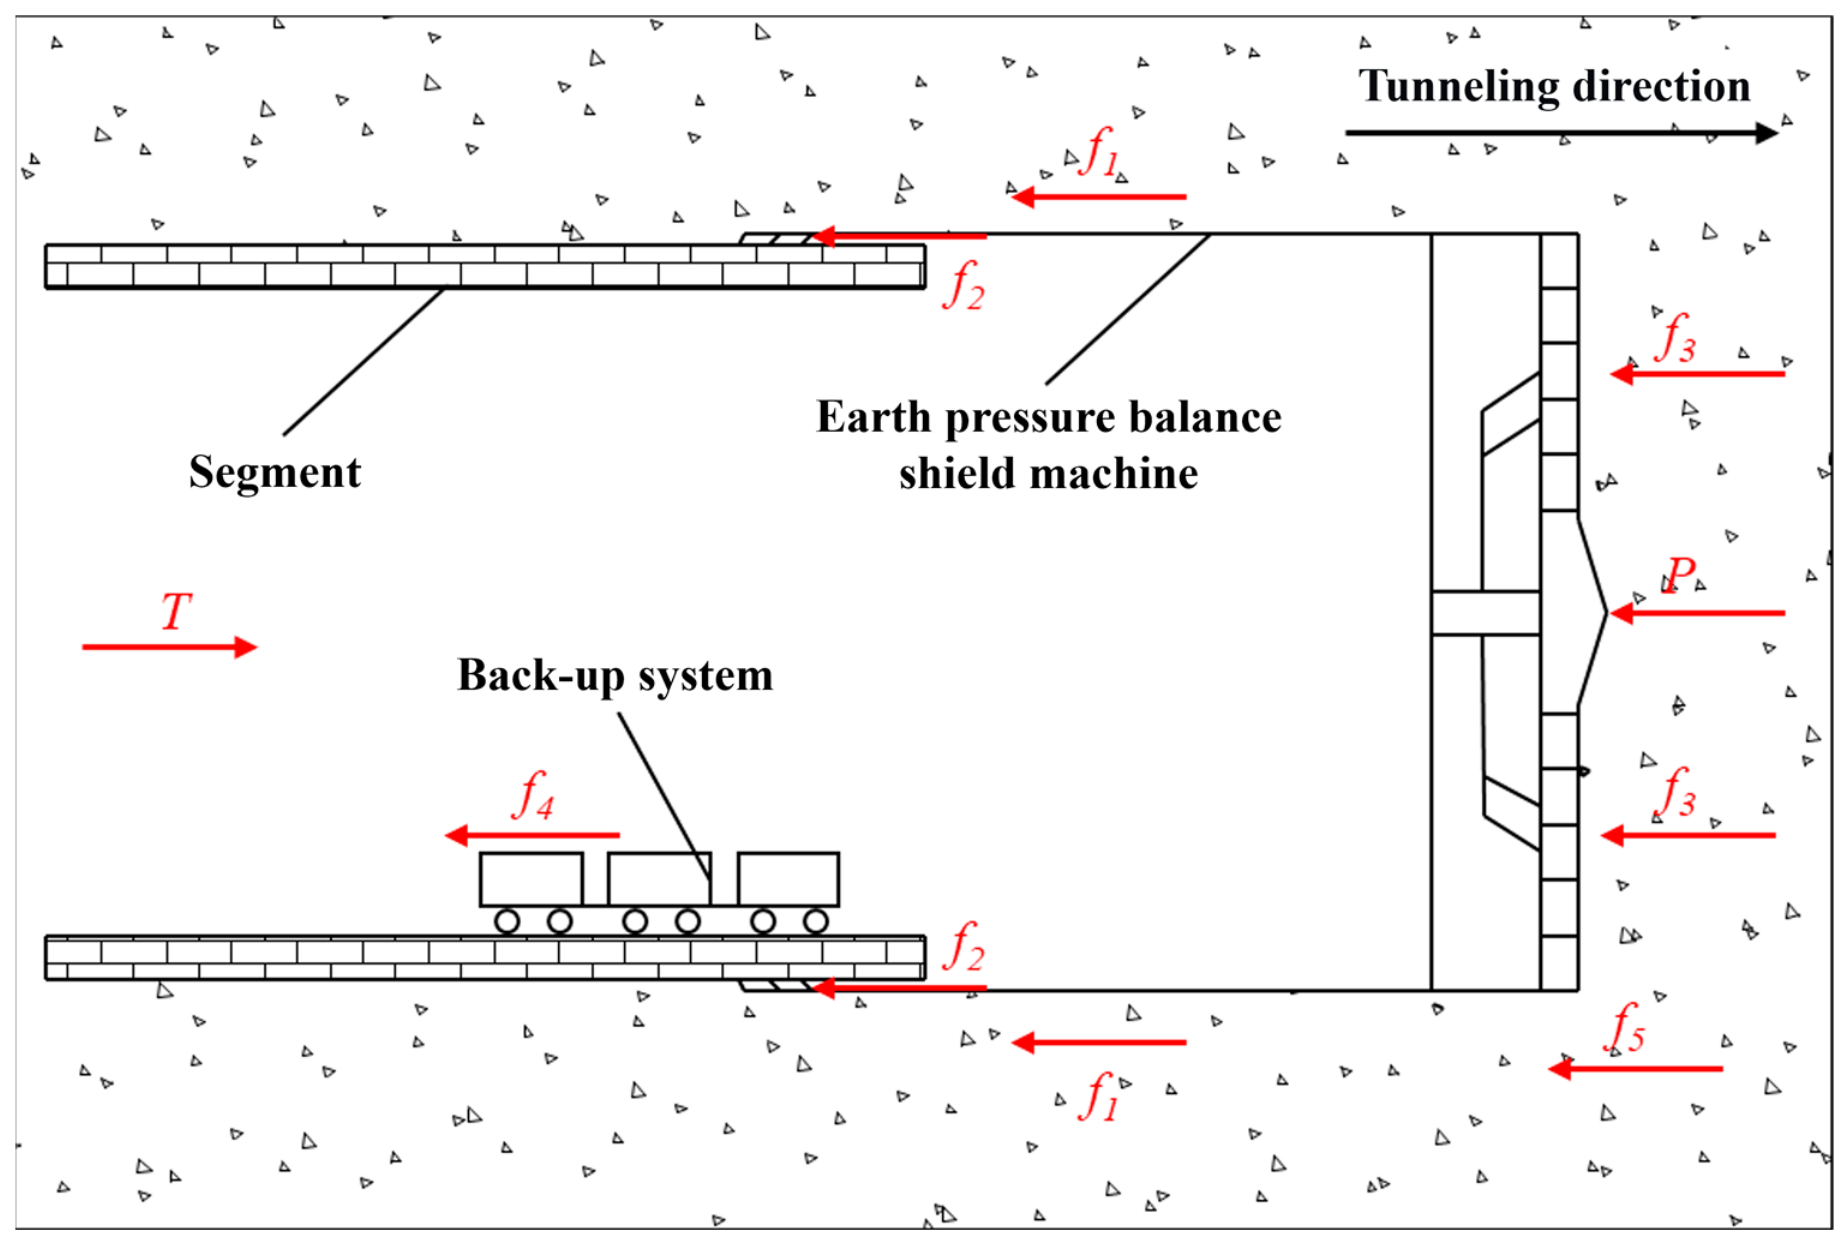
During normal shield tunneling, the thrust force is provided by hydraulic cylinders. Throughout the advancement process, the cutterhead is subjected to the squeezing pressure from the soil at the excavation face, while the shield shell experiences frictional forces from the surrounding ground. The following derivation is based on the mechanical equilibrium and volume balance relationships during EPB shield tunneling, with reference to previous theoretical studies on chamber pressure and tunneling parameter relationships [
39]. Thus, the mechanical equilibrium equation during tunneling can be expressed as follows:
In the equation,
T is the total thrust of the shield,
f is the total resistance during advancement, P is the contact pressure between the shield and the soil at the excavation face,
m is the total mass of the shield machine, and
a is the acceleration of the shield tunneling. Here, the total resistance
f includes the frictional resistance
f1 between the shield shell and the surrounding ground, the frictional resistance
f2 between the shield tail and the segments, the resistance
f3 from the cutting edge ring penetrating into the ground, the traction resistance
f4 of the backup system trolley, and the additional resistance
f5 due to shield attitude adjustment. The force distribution on the shield is illustrated in
Figure 3.
Under stable EPB shield tunneling in the studied silty clay stratum, the shield advances at a relatively low speed; therefore, inertial effects are neglected, and the tunneling process is approximated as quasi-static uniform motion:
Assuming the actual chamber pressure behind the cutterhead panel is
p, the relationship between the chamber pressure and the support pressure at the excavation face can be expressed as follows:
where α is the chamber-pressure transfer coefficient, representing the effective pressure transfer from the chamber behind the cutterhead to the excavation face. It is mainly related to the cutterhead opening ratio and opening configuration, and its effective value should be determined according to project-specific shield and ground conditions.
Combining the relationship between the support pressure at the shield excavation face and the chamber pressure in Equation (18), we obtain:
When shield tunneling involves over-excavation or under-excavation, the support force at the excavation face can be expressed as the static lateral earth pressure increased or decreased by
, namely:
where
P0 is the at-rest earth pressure of the soil at the excavation face.
To establish the relationship between deformation and pressure variation, the concept of an equivalent stiffness K is introduced to describe the deformation resistance of the soil ahead of the excavation face. Here,
denotes the total compression deformation of the soil ahead rather than a strain; accordingly, K acts as an equivalent deformation–pressure conversion coefficient with a dimension of pressure per unit length. It reflects the combined effect of soil compressibility and boundary restraint near the excavation face, rather than a universal material constant. The relationship between the pressure difference caused by the deformation of the soil ahead and the total compression deformation of the soil can be expressed as:
Combining Equations (15), (18) and (24), the following expression can be derived:
Furthermore, based on the existing research analyzing the relationship between shield cutterhead torque and the product of chamber pressure and cutterhead speed, the expression is as follows:
where
M is the cutterhead torque;
Kce is a parameter related to the cutterhead type and soil properties;
p is the measured chamber pressure; and
ω is the cutterhead speed. Substituting the above equation into Equation (22) yields the relationship between the cutterhead speed, screw conveyor speed, and tunneling speed.
Based on the comprehensive formulation presented above, the chamber pressure of the shield is correlated with key tunneling parameters, including the cutterhead speed, tunneling speed, and screw conveyor speed. It should be noted that the equivalent stiffness K and the pressure transfer coefficient α should be determined according to project-specific conditions rather than regarded as universal constants. In general, K can be estimated from the compression modulus or constrained modulus of the soil and further corrected through numerical back-analysis; α can be preliminarily evaluated according to the cutterhead configuration and calibrated using field chamber-pressure monitoring data. Therefore, when the model is applied to other soil strata or shield machines, these two coefficients should be recalibrated according to the corresponding geological conditions, shield configuration, and monitoring data.
Compared with existing calculation methods based mainly on static earth-pressure equilibrium or excavation–discharge volume balance, the present formulation further separates two pressure-related mechanisms: the excavation–discharge balance associated with the conditioned muck state and the cutterhead-induced compression associated with cutterhead geometry and operation. This distinction clarifies that soil conditioning mainly affects the pressure-transfer condition by changing the discharge behavior of muck, whereas cutterhead-induced compression provides a direct additional compression contribution to chamber pressure. Their relative influence is therefore dependent on the soil condition, shield configuration, and operating parameters rather than a fixed proportion. The derived parameter relationships are then used to guide the subsequent discrete–continuum coupled analysis under different tunneling conditions. To further clarify the contribution of different mechanisms to chamber-pressure variation, a mechanism contribution analysis was conducted based on the proposed theoretical formulation, as summarized in
Table 1.
3. FDM-DEM Coupled Simulation of Shield Tunneling
3.1. Project Overview
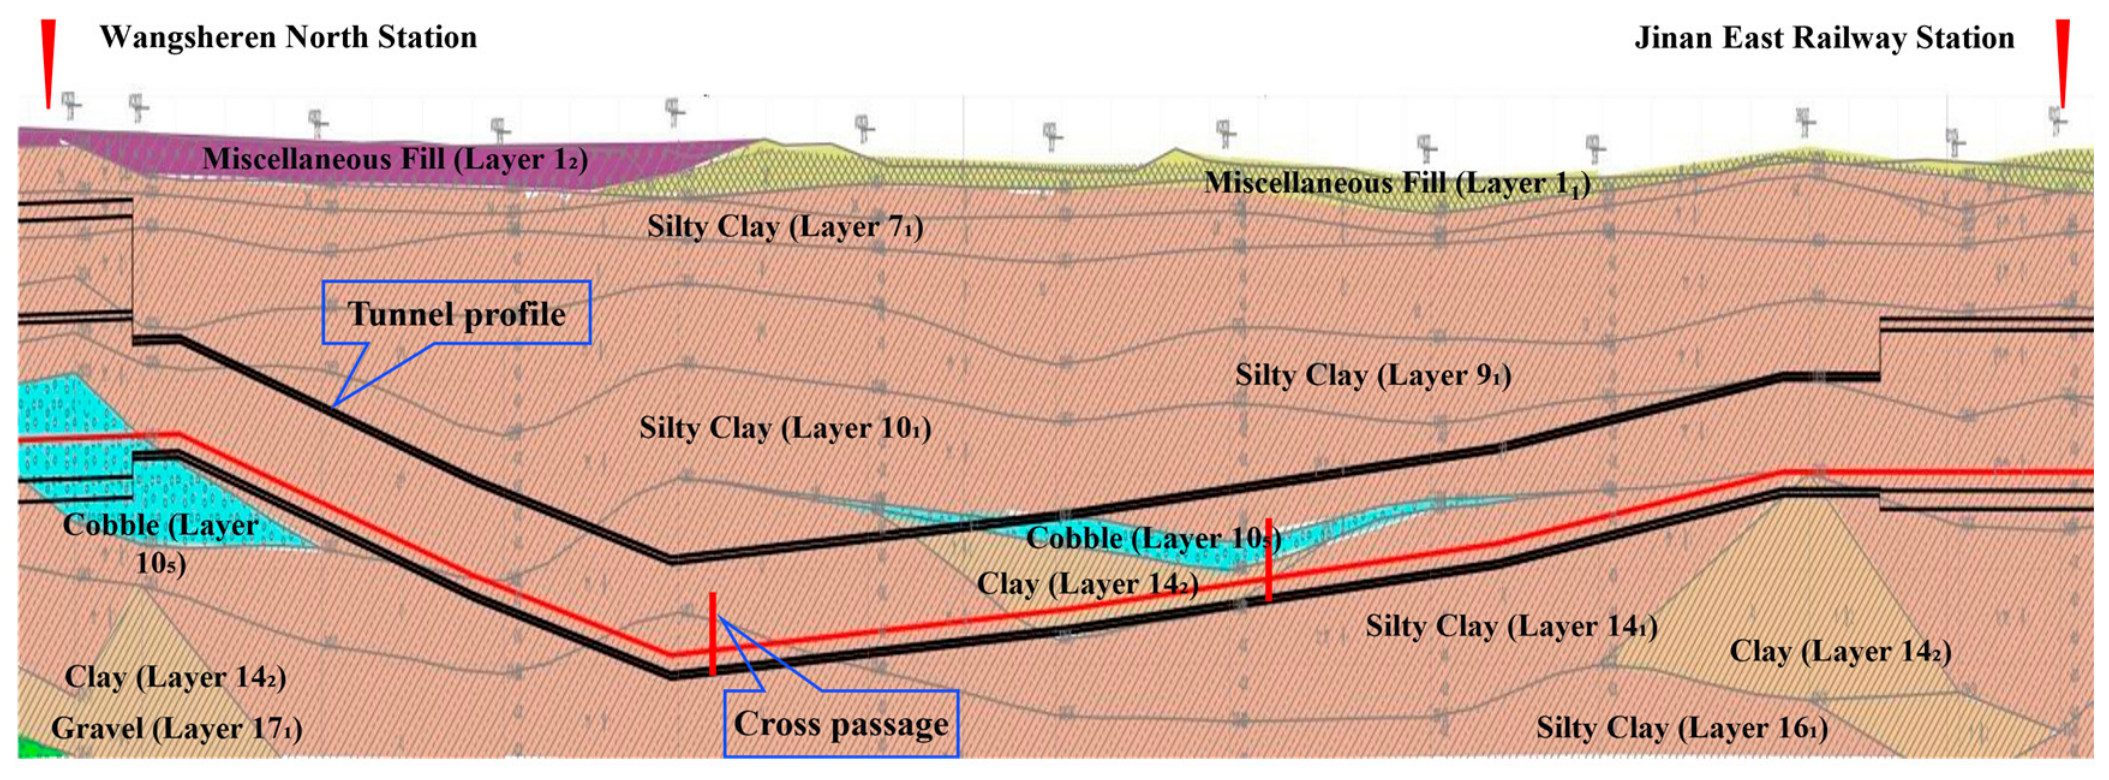
This study is conducted based on the construction of the Wangsheren North Station to Jinan East Station section of Jinan Metro Line 6. The section has a total length of 1725.235 m and is constructed using a spoke-type earth pressure balance shield with a diameter of 6.68 m. According to the geological survey data, no faults are distributed in the near-field area along the studied section. A simplified geological profile of the section is shown in
Figure 4, indicating that the shield primarily traverses through strata consisting of miscellaneous fill and silty clay. Since silty clay is the dominant stratum along the studied section, it is taken as the representative ground condition in the subsequent coupled numerical analysis.
3.2. Parameter Calibration
To establish an FDM–DEM coupled model with representative soil behavior for the studied stratum, macroscopic parameter calibration of the soil is essential [
40,
41]. Both triaxial tests and slump tests were employed to evaluate the macroscopic properties of untreated remolded soil and conditioned soil, respectively. These tests were subsequently simulated using the PFC3D software (version 6.0).
3.2.1. Parameter Calibration for Untreated Soil
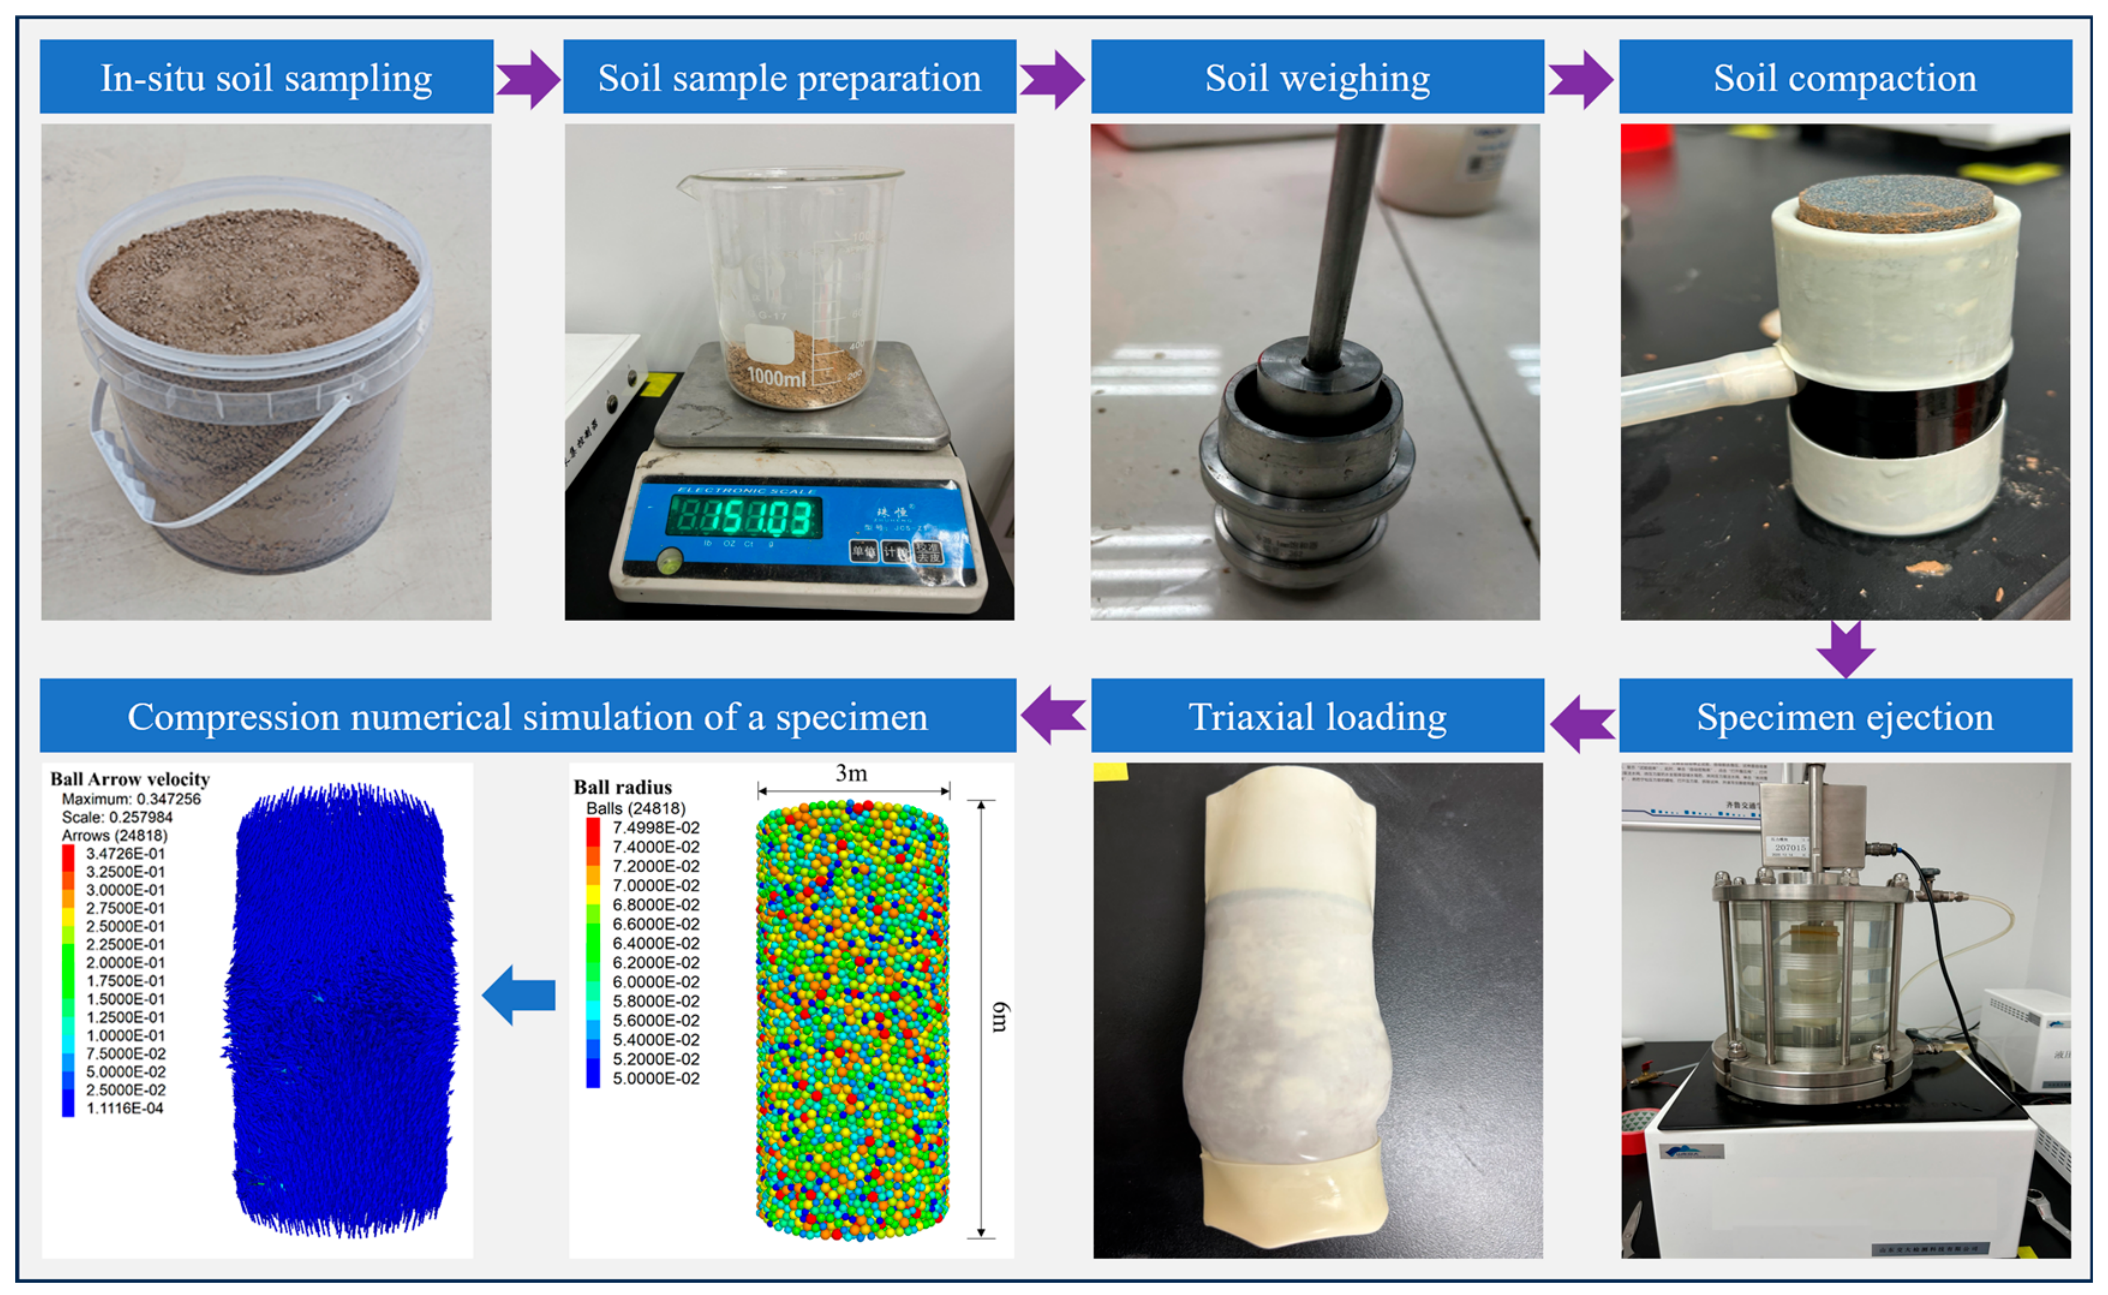
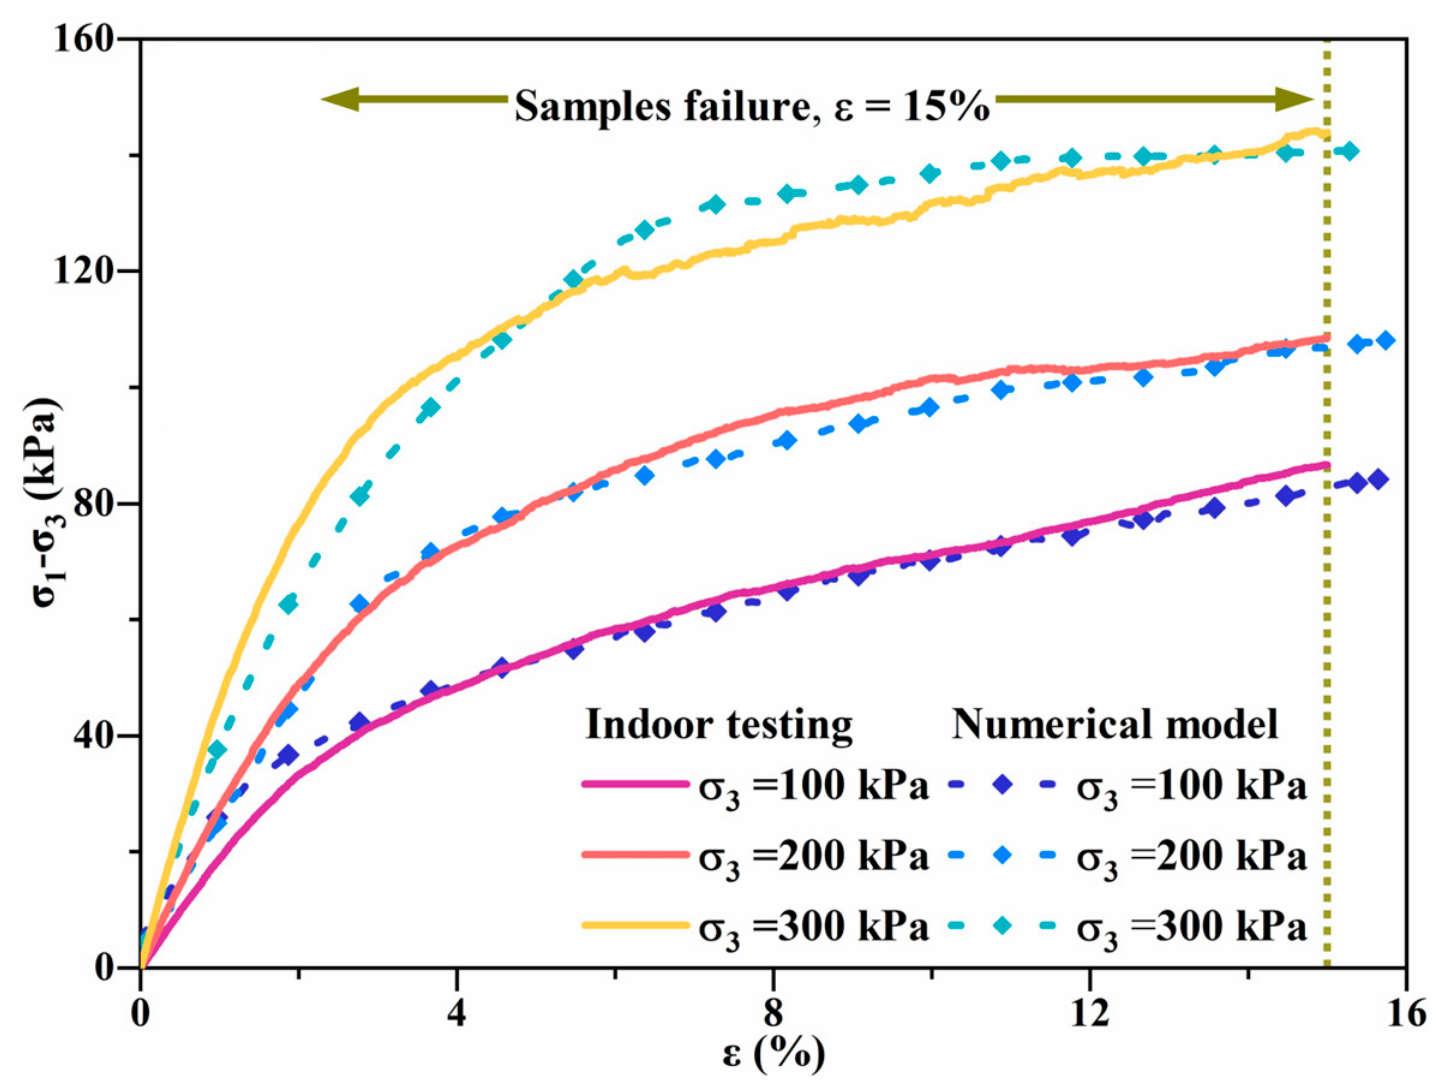
The untreated soil, sourced from the construction site, is silty clay. Unconsolidated undrained (UU) triaxial tests were conducted. The specimens exhibited a strain-hardening failure mode, with the failure strain determined as 15%. To balance computational cost and the representation of macroscopic soil behavior, a cylindrical numerical model with a diameter of 3 m and a height of 6 m was established, with particle radii ranging from 0.1 to 0.15 m. The same particle-size setting was used in the subsequent DEM simulations to maintain a consistent particle-scale representation among different working conditions. A linear contact bond model was adopted to simulate the behavior of the cohesive soil, and confining pressure was applied via a wall servo mechanism. The triaxial test simulation process is illustrated in
Figure 5.
The triaxial test results are presented in
Figure 6. A comparison between the stress–strain curves obtained from the numerical simulations and the laboratory tests under three different confining pressures shows no significant discrepancy between the peak stresses of the numerical specimens and those measured in the laboratory tests. This indicates that the calibrated parameters can reproduce the main stress–strain characteristics of the tested silty clay.
3.2.2. Parameter Calibration for Conditioned Soil
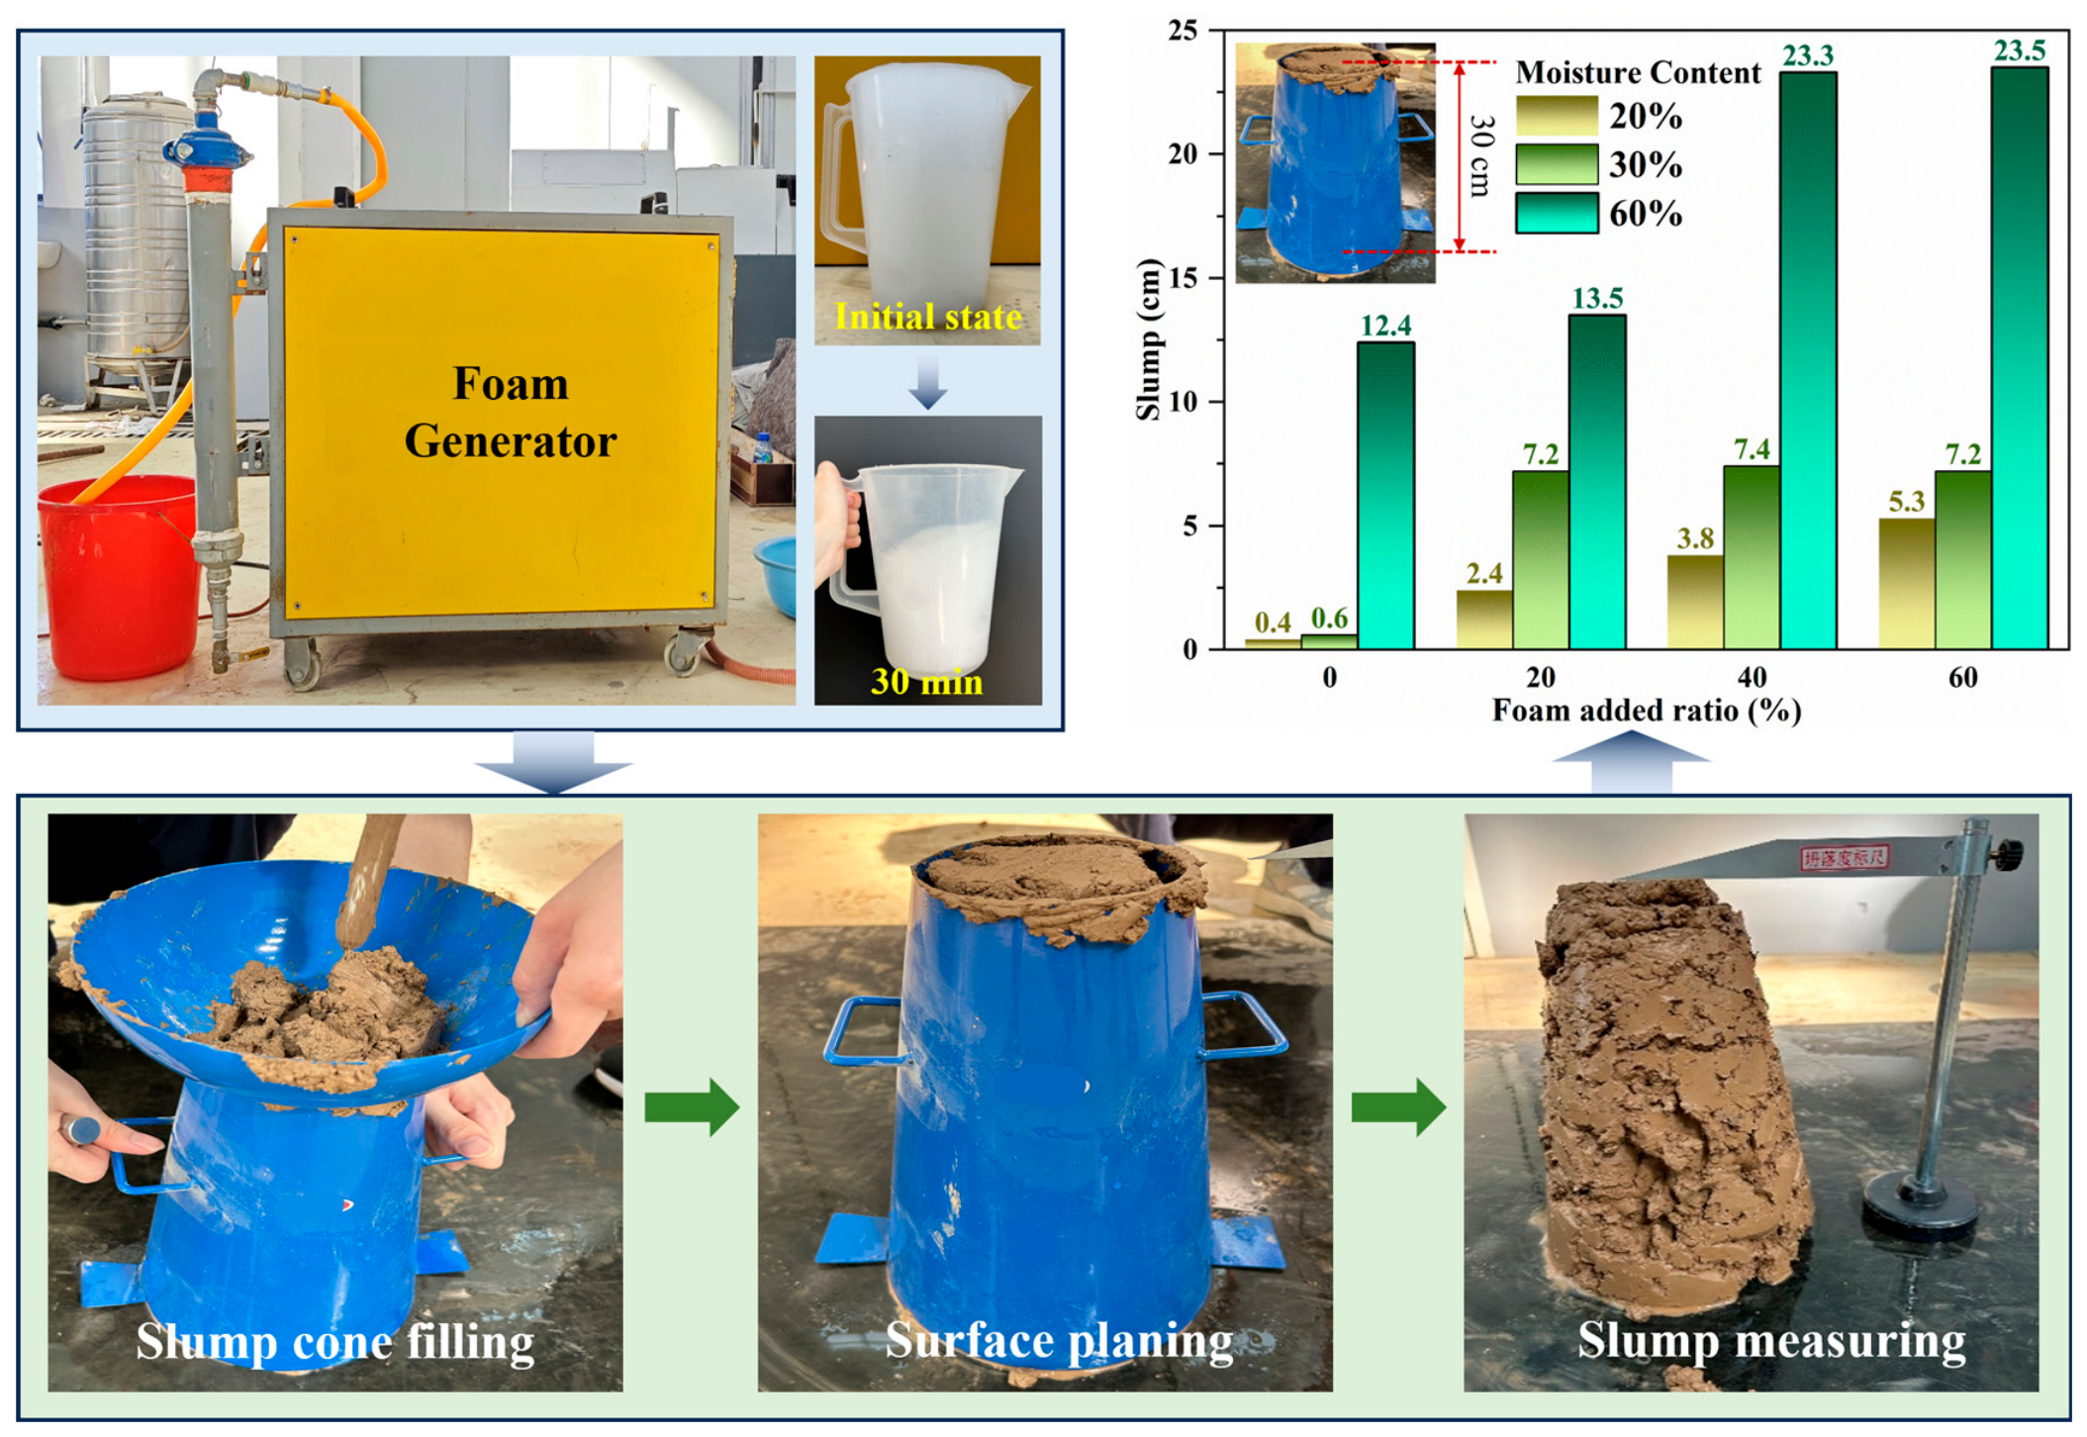
To enhance the muck’s flowability and pressure control performance, a foam agent was used for soil conditioning. Through slump tests, the improvement effects under a total of 12 scenarios—combining different foam injection ratios (0%, 20%, 40%, 60%) and initial water contents (20%, 30%, 60%)—were systematically investigated. The slump test setup is shown in
Figure 7. The results demonstrate that the initial water content significantly influences the improvement effect. When the water content ranged from 20% to 30%, the increase in slump height was limited. However, when the water content reached 60%, the slump height increased markedly with a higher foam injection ratio. This indicates that foam can effectively act as a lubricant and improve the muck’s flow-plasticity only when the water content is sufficiently high. Based on these preliminary slump test results, the conditioning mode with 60% water content and a 20% foam injection ratio was selected for the subsequent numerical calibration. This mode was chosen because the low-water-content cases did not provide sufficient improvement in flowability, whereas the 60% water content allowed the foam to exert a clear conditioning effect. Among the tested cases with 60% water content, the 20% foam injection ratio was adopted as a representative condition that achieved adequate flowability with a relatively low foam dosage, rather than simply maximizing the slump value.
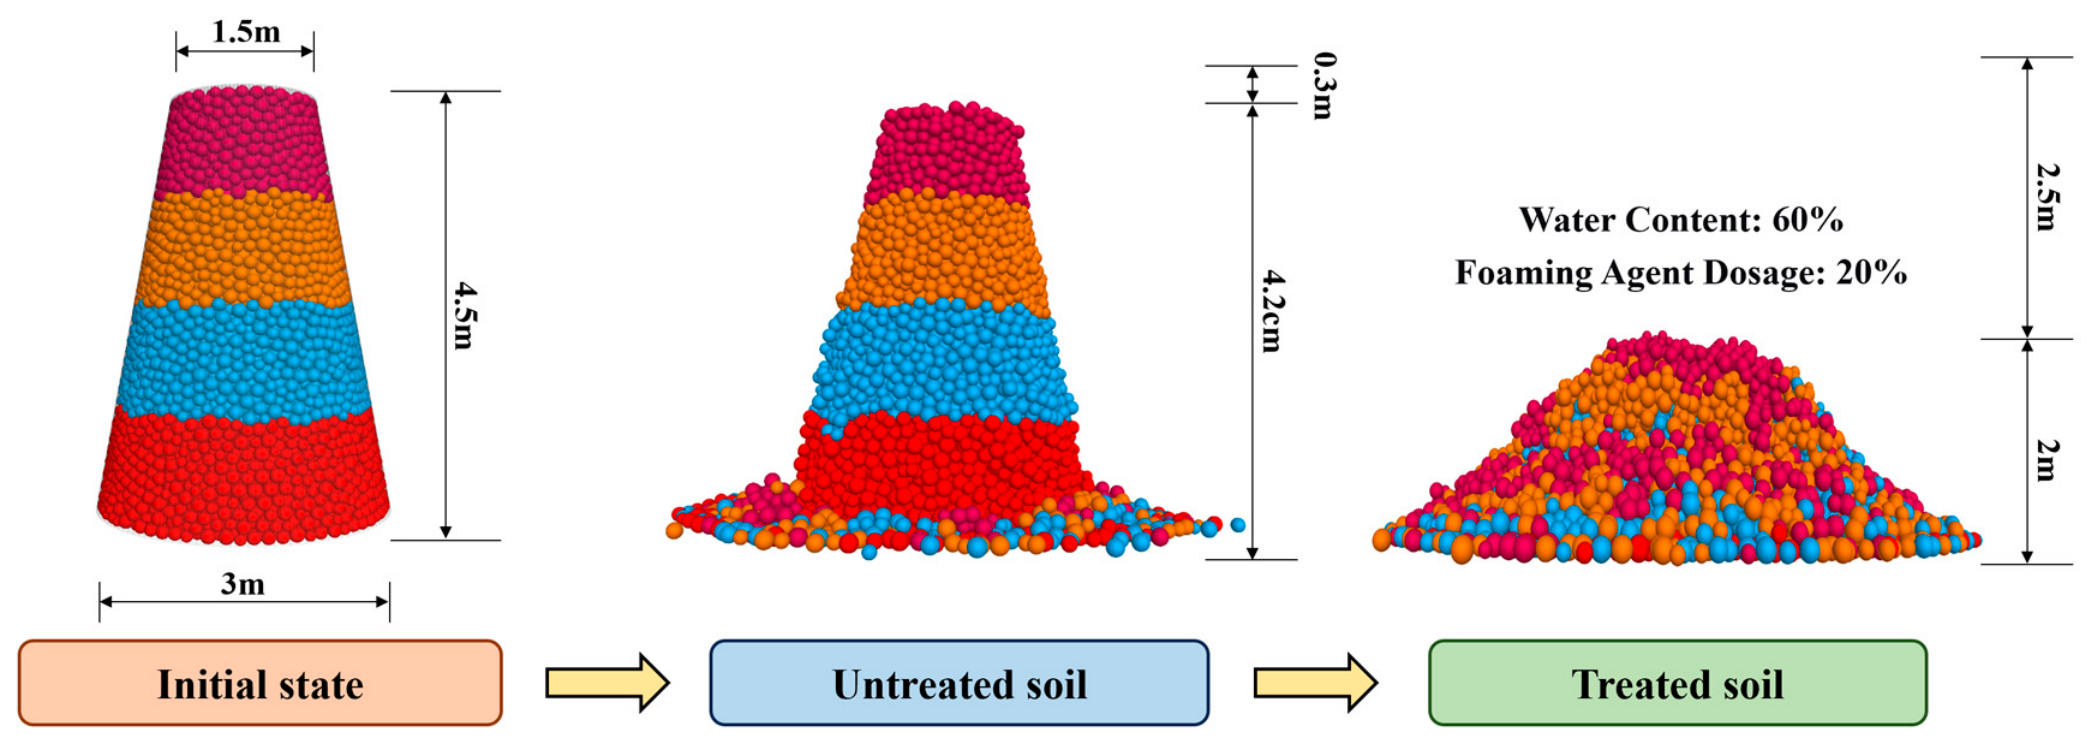
The numerical slump test model was scaled up by a factor of 15 to reduce the influence of coarse particle size on DEM calibration [
42]. The cylinder had a height of 4.5 m, with top and bottom diameters of 1.5 m and 3.0 m, respectively, ensuring a ratio of model dimension to maximum particle size greater than 10. The scaled model was used to calibrate the normalized macroscopic slump response of the conditioned muck, rather than to reproduce the absolute self-weight stress state of the standard laboratory cone. Therefore, the target slump height was set to one-third to one-half of the cone height, namely 1.5–2.25 m.
Figure 8 compares two representative scenarios: the untreated soil achieved a mere 6.7% slump height (relative to the cylinder height), whereas the conditioned soil with 60% water content and a 20% foam injection ratio attained a slump height of 2.5 m (55.6% of the cylinder height). This result indicates that the selected conditioning mode provides sufficient flowability for muck discharge while avoiding an unnecessarily high foam dosage, thereby supporting its use in the subsequent parameter calibration. In this study, the slump test is mainly used to calibrate the flow-plasticity-related behavior of the conditioned muck, which is directly associated with muck discharge and chamber-pressure transfer in the subsequent tunneling simulations. The calibrated parameters are therefore intended to provide a representative conditioned-muck state for comparative analysis under different tunneling parameters.
3.3. FDM-DEM Coupling Principle and Contact Model
The discrete element-continuum medium coupling method serves as an effective technique for simulating the shield tunneling process, providing a theoretical basis for construction design [
43]. Its core principle lies in simulating the continuum region using the finite difference method and the discrete particle region using the discrete element method, while enabling bidirectional transfer and synchronous updating of mechanical information at the interface [
44]. The key to simulating particle flow is the accurate description of the contact mechanical behavior between spheres, clusters, and walls, whereby the macroscopic mechanical response of the medium is reflected through these local interactions.
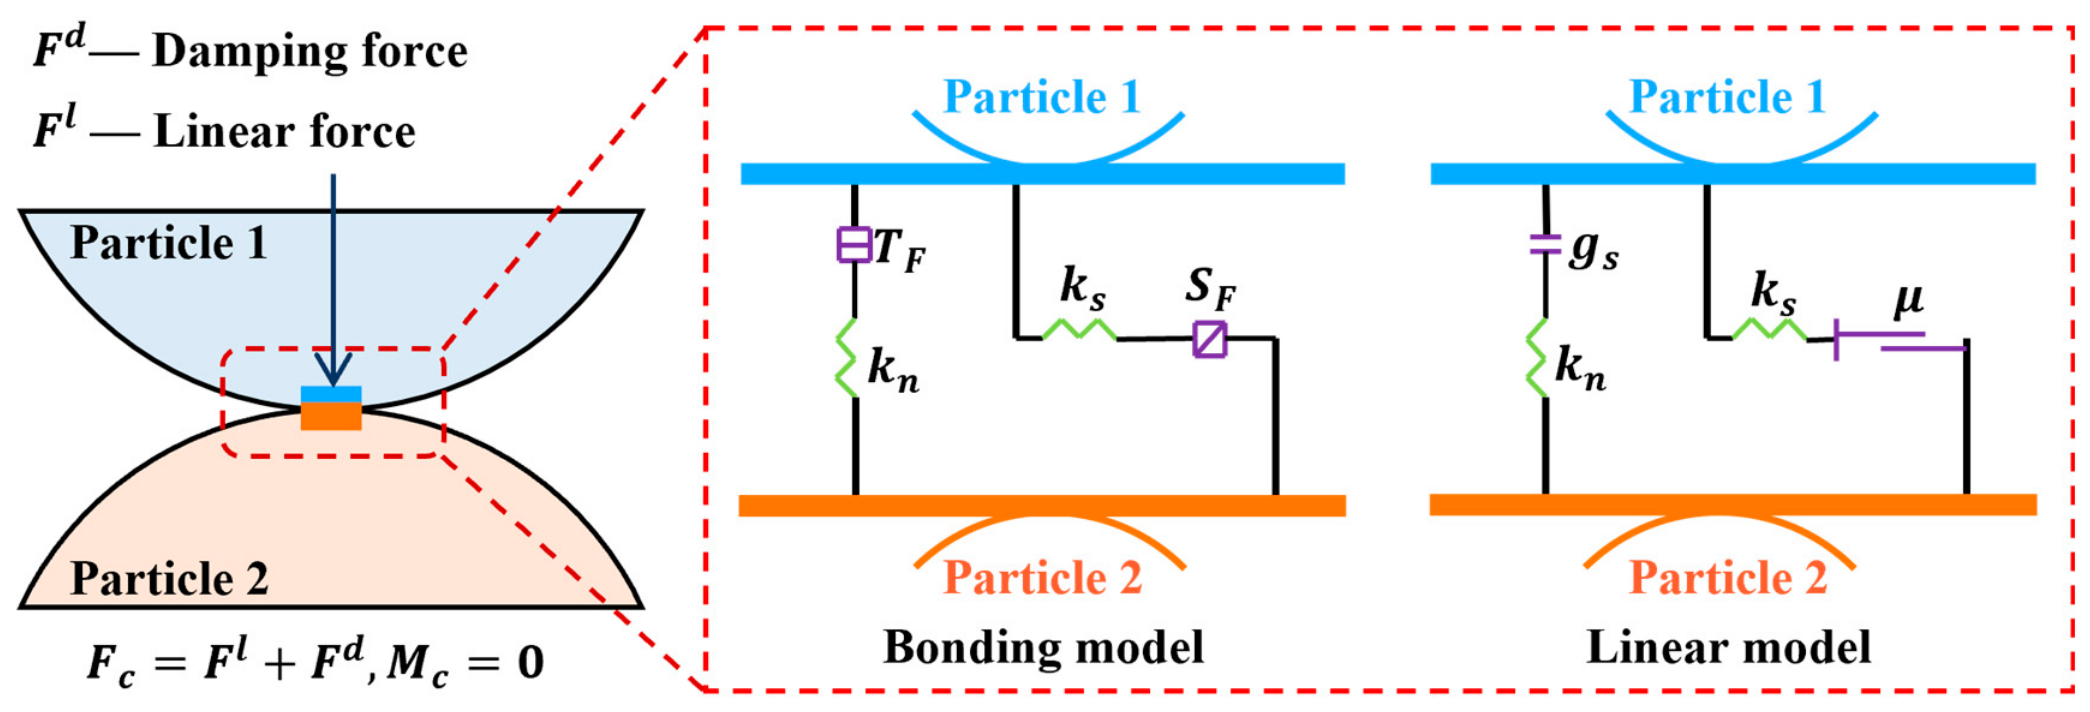
This study employs the linear contact bonding model, as shown in
Figure 9. This model incorporates normal and tangential springs at the contact points, capable of transmitting tensile and shear forces [
45]. While the bond exists, the contact interface exhibits linear elastic behavior without relative sliding. Upon bond failure, the model reverts to a linear contact model with friction, allowing sliding. With the calibrated microparameters, the linear contact bonding model is used to represent the dominant bonded–frictional response of the tested silty clay and conditioned muck during shield excavation. For the conditioned muck, the macroscopic influence of foam addition and water-content variation on cohesion, lubrication-related flowability, and slump behavior is incorporated through the calibrated contact parameters and the slump-test response. This treatment is consistent with the objective of comparing chamber-pressure and settlement responses under different tunneling parameters.
To balance simulation accuracy with computational efficiency, this study employs coupled calculations between PFC3D (version 6.0) and FLAC3D (version 6.0). Among the various coupling methods supported by PFC3D, the wall-zone coupling method was selected. This method utilizes walls covering the surfaces of finite elements to facilitate interaction between particles and the continuum.
3.4. Model Establishment
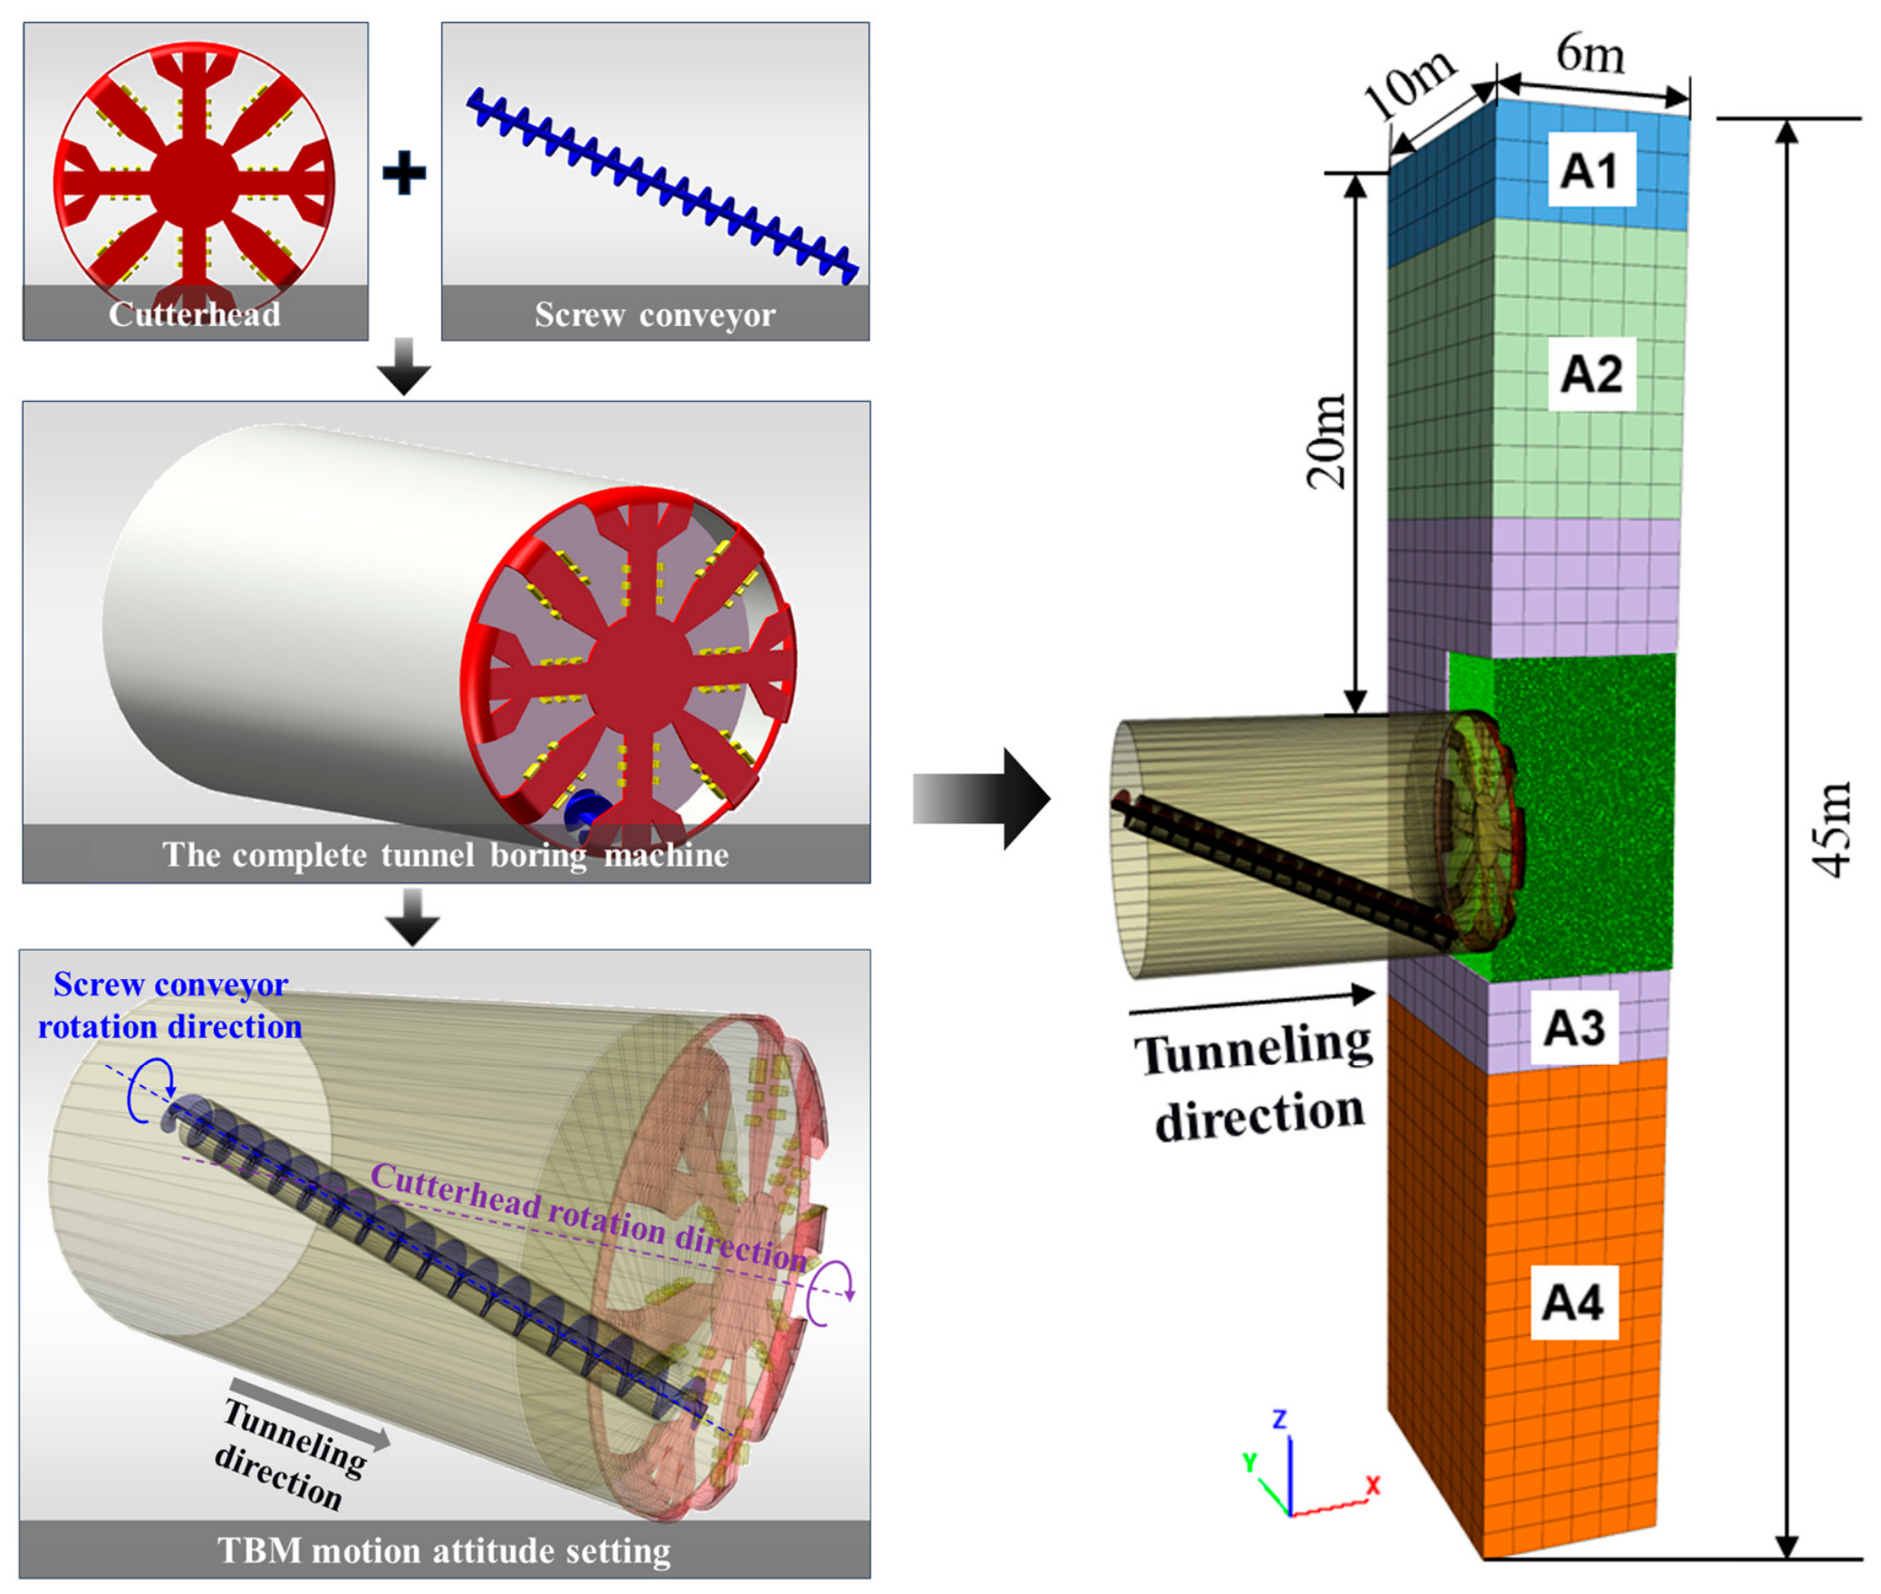
The shield machine model parameters are derived from the earth pressure balance shield used in the left line of the Wangsheren North Station to Jinan East Station section of Jinan Metro Line 6, so that the numerical model follows a fixed project-specific shield configuration. This shield features a spoke-type cutterhead with a diameter of 6680 mm and an opening ratio of approximately 40%, which was kept unchanged in the subsequent analyses of operational-parameter effects. The shield shell length is 8389 mm, and the screw conveyor has an inclination angle of 22.5°. SolidWorks (version 2022) was used to create the geometric models of key components, such as the cutterhead, excavation chamber, and screw conveyor. These components were imported into PFC3D piecemeal, and walls were generated based on their geometry to represent the shield machine in the numerical model. The entire shield model was assigned a forward translational motion, while the cutterhead was set to rotate about the shield’s central axis, and the screw conveyor was set to rotate about its own axis.
Based on the field survey data from the section, the heights of the various strata in the finite element model were determined, and a discrete–continuum coupled numerical model was established. The model has a height of 45 m, with strata divided from top to bottom into four layers: miscellaneous fill and three types of silty clay. The silty clay layer labeled A3, with a total thickness of 17.5 m, serves as the primary coupled region in the model. A hollow rectangular region measuring 10 m × 8 m × 6 m was established within the shield’s influence zone and filled with DEM particles. The shield machine in the model is buried at a depth of 20 m, with the center of the cutterhead face coinciding with the center of the DEM-filled zone. The boundary conditions for the continuum elements include normal displacement constraints on the four lateral sides and a fixed vertical constraint at the bottom, while the top surface is set as a free surface. For the DEM part, fixed rigid walls constrain the particle assembly on all sides, coupled with the continuum element boundaries using the wall-zone coupling method. The finite-element discretization and DEM particle-size settings were kept unchanged for all working conditions, so that the calculated differences in chamber pressure and surface settlement could be compared under the same numerical discretization framework. All four soil layers in the finite element section employ the Mohr-Coulomb constitutive model. This model was selected to represent the overall strength and deformation response of the surrounding ground using the available site investigation parameters, while maintaining a consistent constitutive framework for comparing different tunneling parameter conditions. Since this study focuses on the relative effects of tunneling parameters on chamber pressure and surface settlement, rather than on detailed stress-path-dependent stiffness evolution, the Mohr–Coulomb model is considered suitable for the present coupled parametric analysis. When the model is applied to other soil types or strata with markedly different strength and stiffness characteristics, the corresponding constitutive parameters should be determined according to project-specific laboratory or field data. A schematic diagram of the 3D coupled numerical model is shown in
Figure 10, and the specific parameter settings for each layer are listed in
Table 2.
4. Analysis of the Influence of Different Tunneling Parameters on Chamber Pressure
Following the preceding analytical derivation, tunneling speed, screw conveyor speed, and cutterhead speed were selected as the main variables for the FDM–DEM parametric study, and different working conditions were established using the control variable method to analyze their effects on chamber pressure and surface settlement. Accordingly, the numerical results are interpreted mainly as comparative responses among different tunneling parameter conditions under the same calibrated model framework. Since a certain volume of muck is reserved within the chamber during tunneling to maintain face stability, particles corresponding to a 75% muck fill ratio were generated inside the shield chamber prior to the start of simulation. During continuous shield advancement, chamber pressure results were recorded at 10 s, 50 s, 100 s, and 200 s to capture the initial response, intermediate redistribution, and later quasi-stable distribution of chamber pressure.
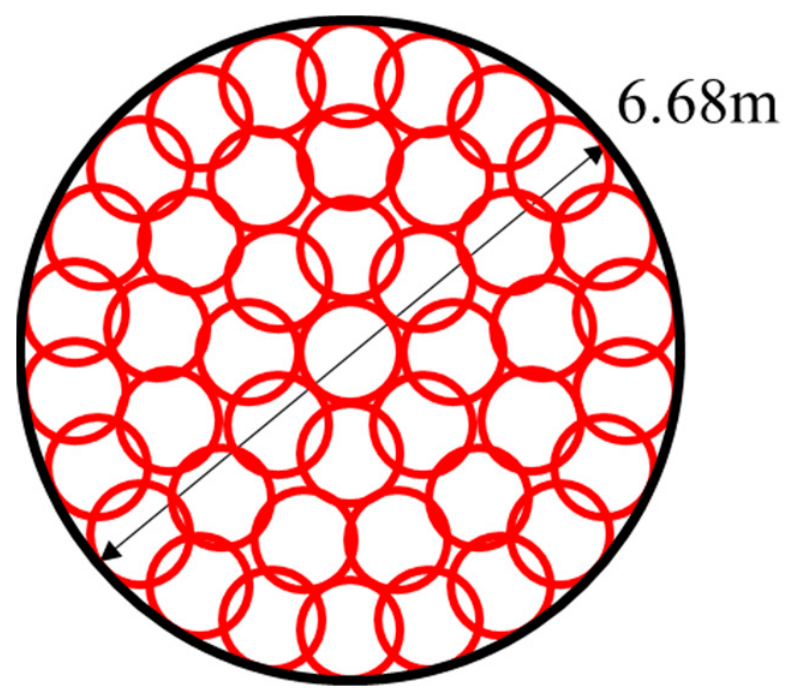
In the PFC3D program, interactions between particles involve only micro-scale contact parameters, making it impossible to directly obtain the pressure distribution within the chamber. To study the pressure distribution within a specific region, the program incorporates “Measure” spheres, which calculate the average stress of particles enclosed within them via integration. This study uniformly arranged “Measure” spheres with a diameter of 1 m within the shield excavation diameter, as shown in
Figure 11. A Fish function was programmed to iterate through all Measure spheres after the shield had advanced a certain distance, thereby acquiring pressure data from inside the chamber. The selected diameter provides a local spatial average of particle stresses, reducing contact-scale fluctuations while preserving the main regional differences in chamber pressure; the same measurement configuration was used in all working conditions to ensure consistency in pressure extraction.
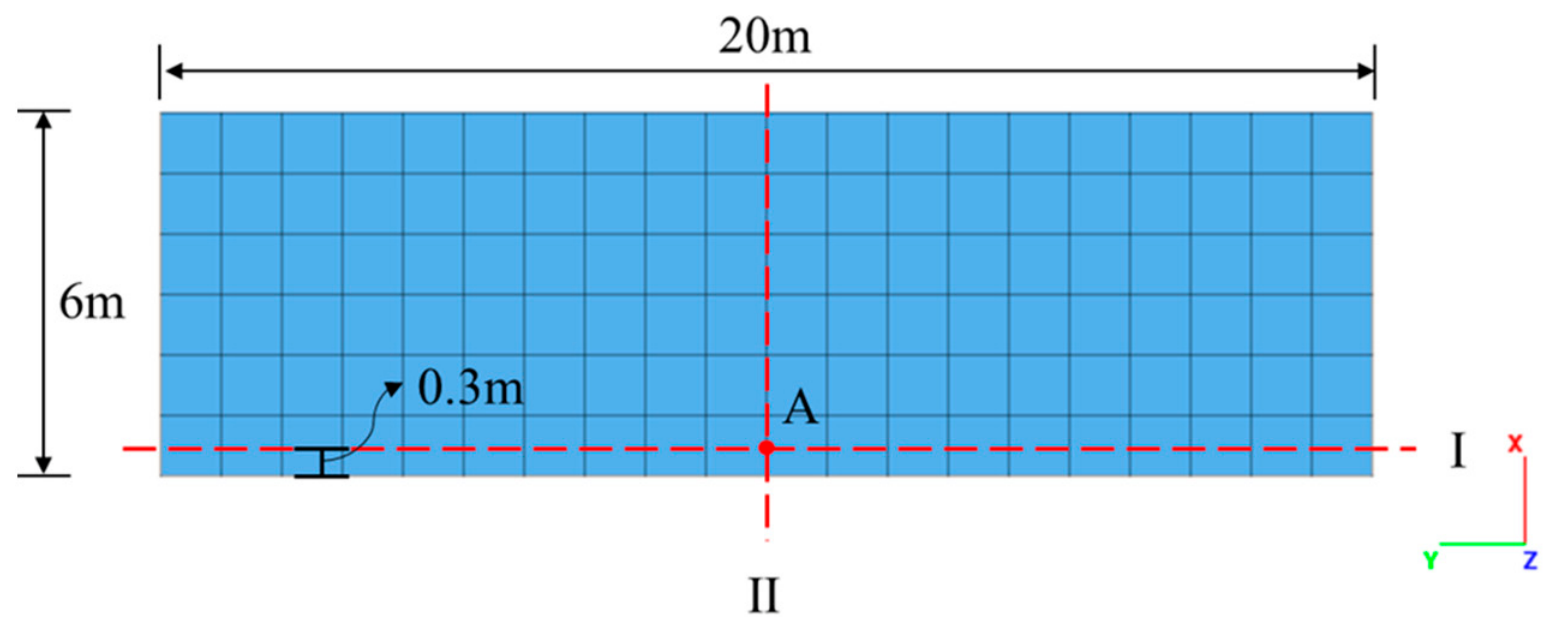
Furthermore, to analyze how chamber pressure fluctuations affect settlement in the overlying strata, fluctuations which are caused by changes in shield tunneling parameters, two monitoring lines were established at the discrete–continuum coupling interface above the shield machine. Monitoring Line I is perpendicular to the tunneling direction, while Monitoring Line II runs parallel to and aligned with the shield machine’s axis. The specific layout of these monitoring lines is shown in
Figure 12.
4.1. Analysis of the Influence of Tunneling Speed on Chamber Pressure
Based on the actual field conditions of the Jinan Metro project, the shield tunneling speed was set to 60 mm/min, 80 mm/min, and 100 mm/min, respectively. The settings of the other shield tunneling parameters during the advance are presented in
Table 3.
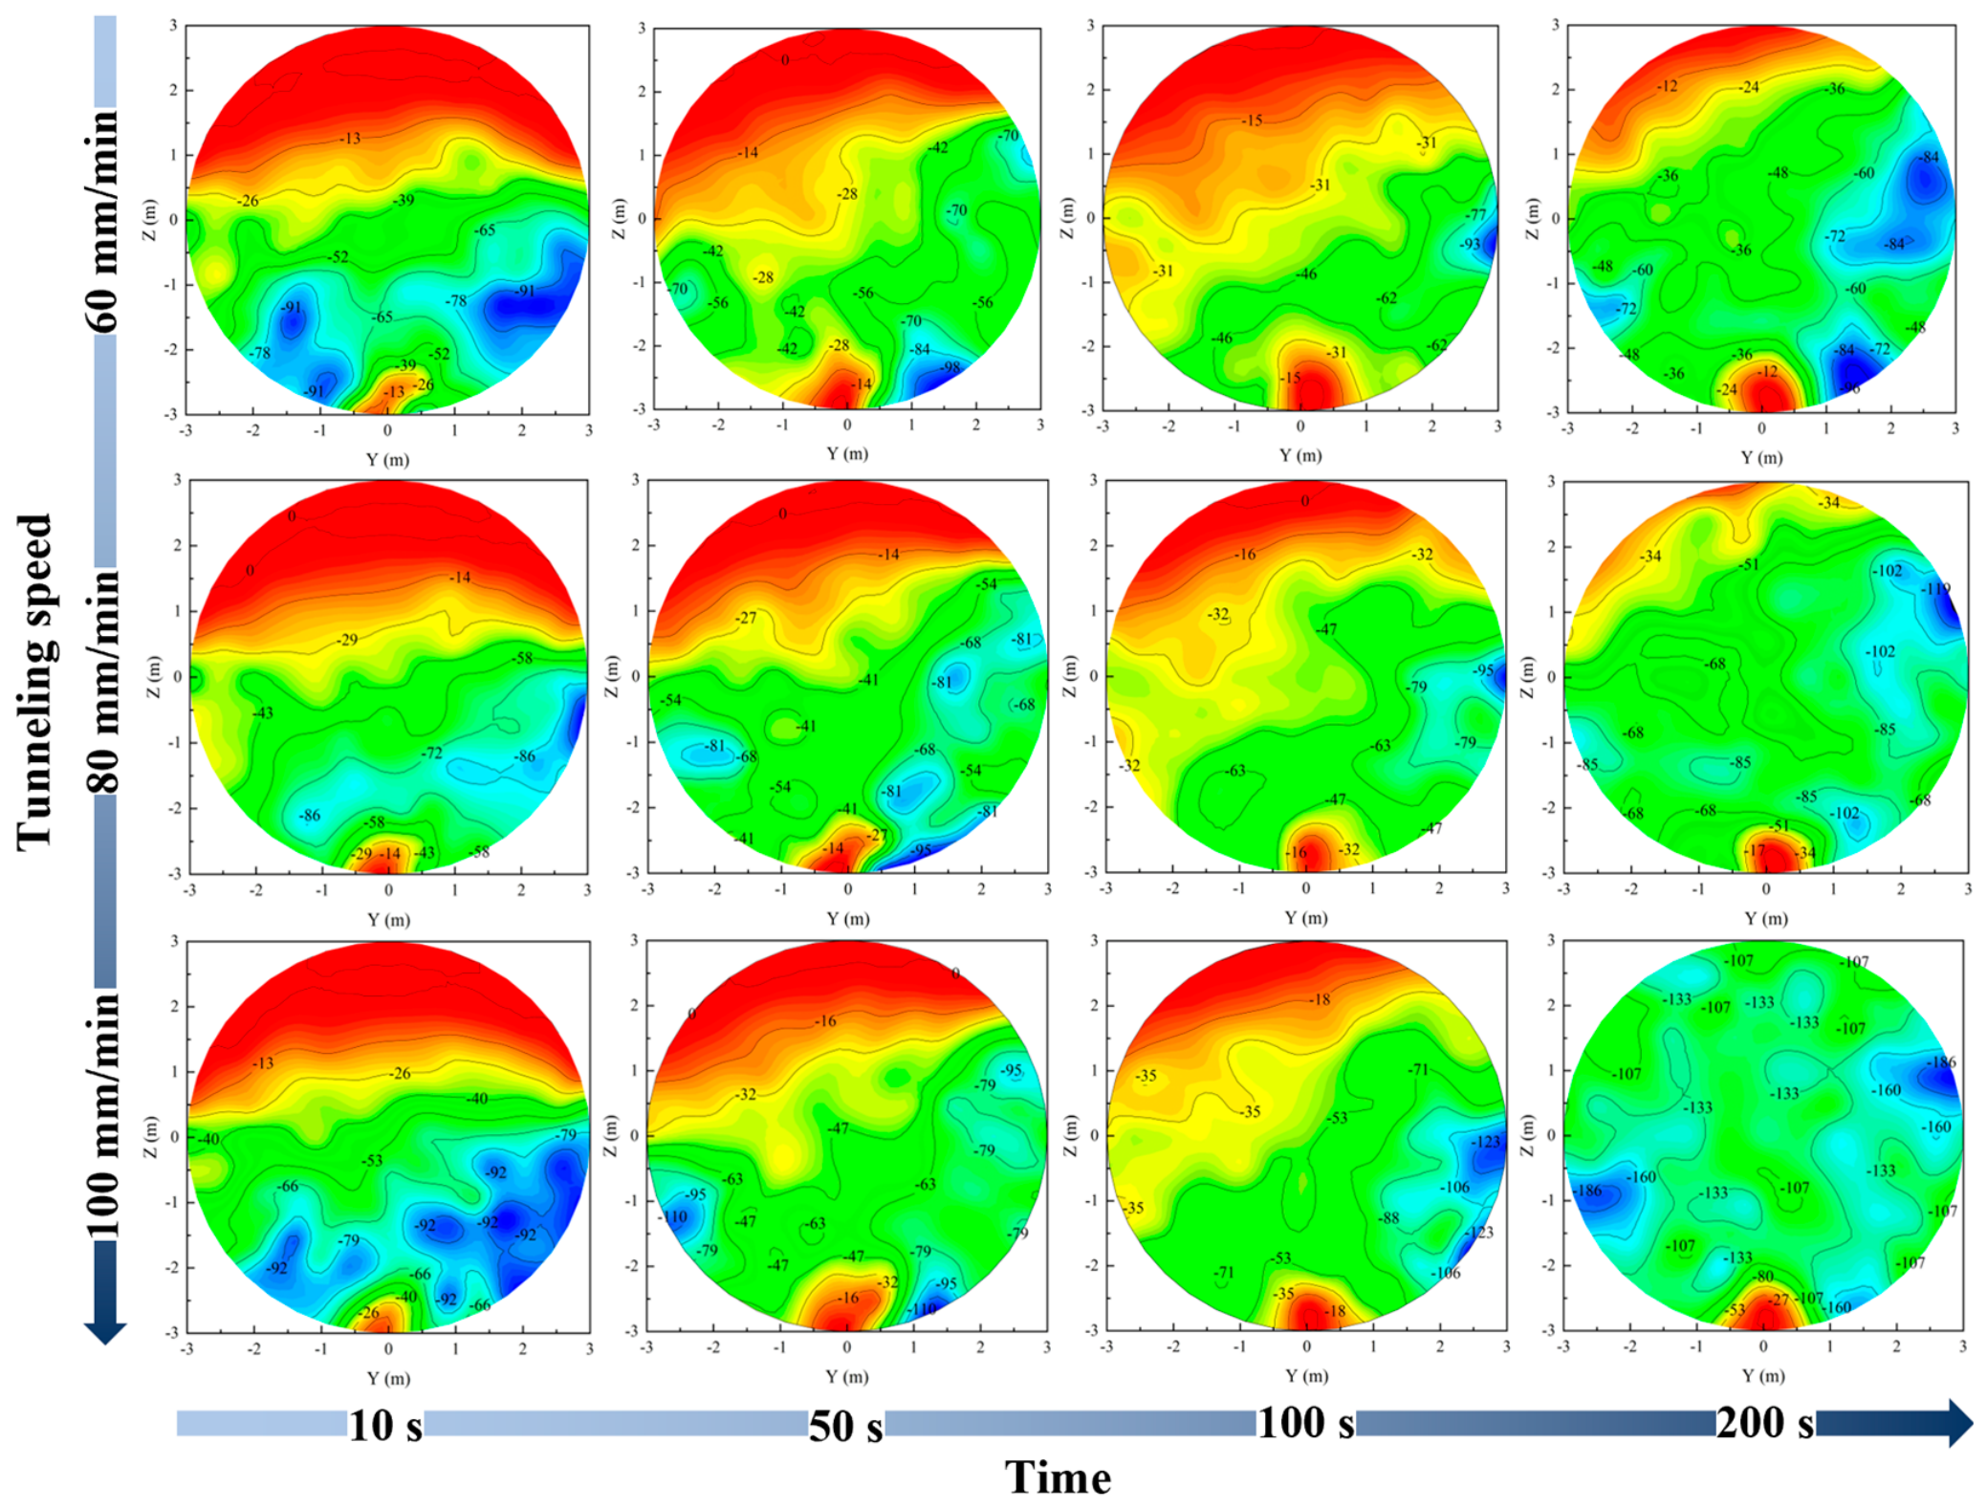
Figure 13 shows the variation in chamber pressure at different times under various tunneling speeds. Analysis reveals that at 10 s, as the shield begins to discharge muck through the screw conveyor, the pressure change from top to bottom is relatively uniform due to the short excavation duration. The chamber pressure distribution is approximately symmetrical laterally. By 50 s, the chamber pressure nephogram shows an offset of approximately 30 degrees counterclockwise. This is caused by the rotation of the shield cutterhead cutting the front soil, which imparts rotational inertia to the soil particles entering the chamber, leading to the displacement of the muck inside. Furthermore, due to the muck discharge action of the screw conveyor, a near-semicircular area of sharp pressure drop appears in the central bottom part of the chamber pressure nephogram. During the process from 10 to 200 s, the area with zero pressure in the upper part continuously decreases, indicating that the muck fill ratio inside the chamber increases progressively with shield advancement. Simultaneously, localized zones of elevated pressure appear near the chamber sidewalls, resulting from localized bonding of the muck within the chamber.
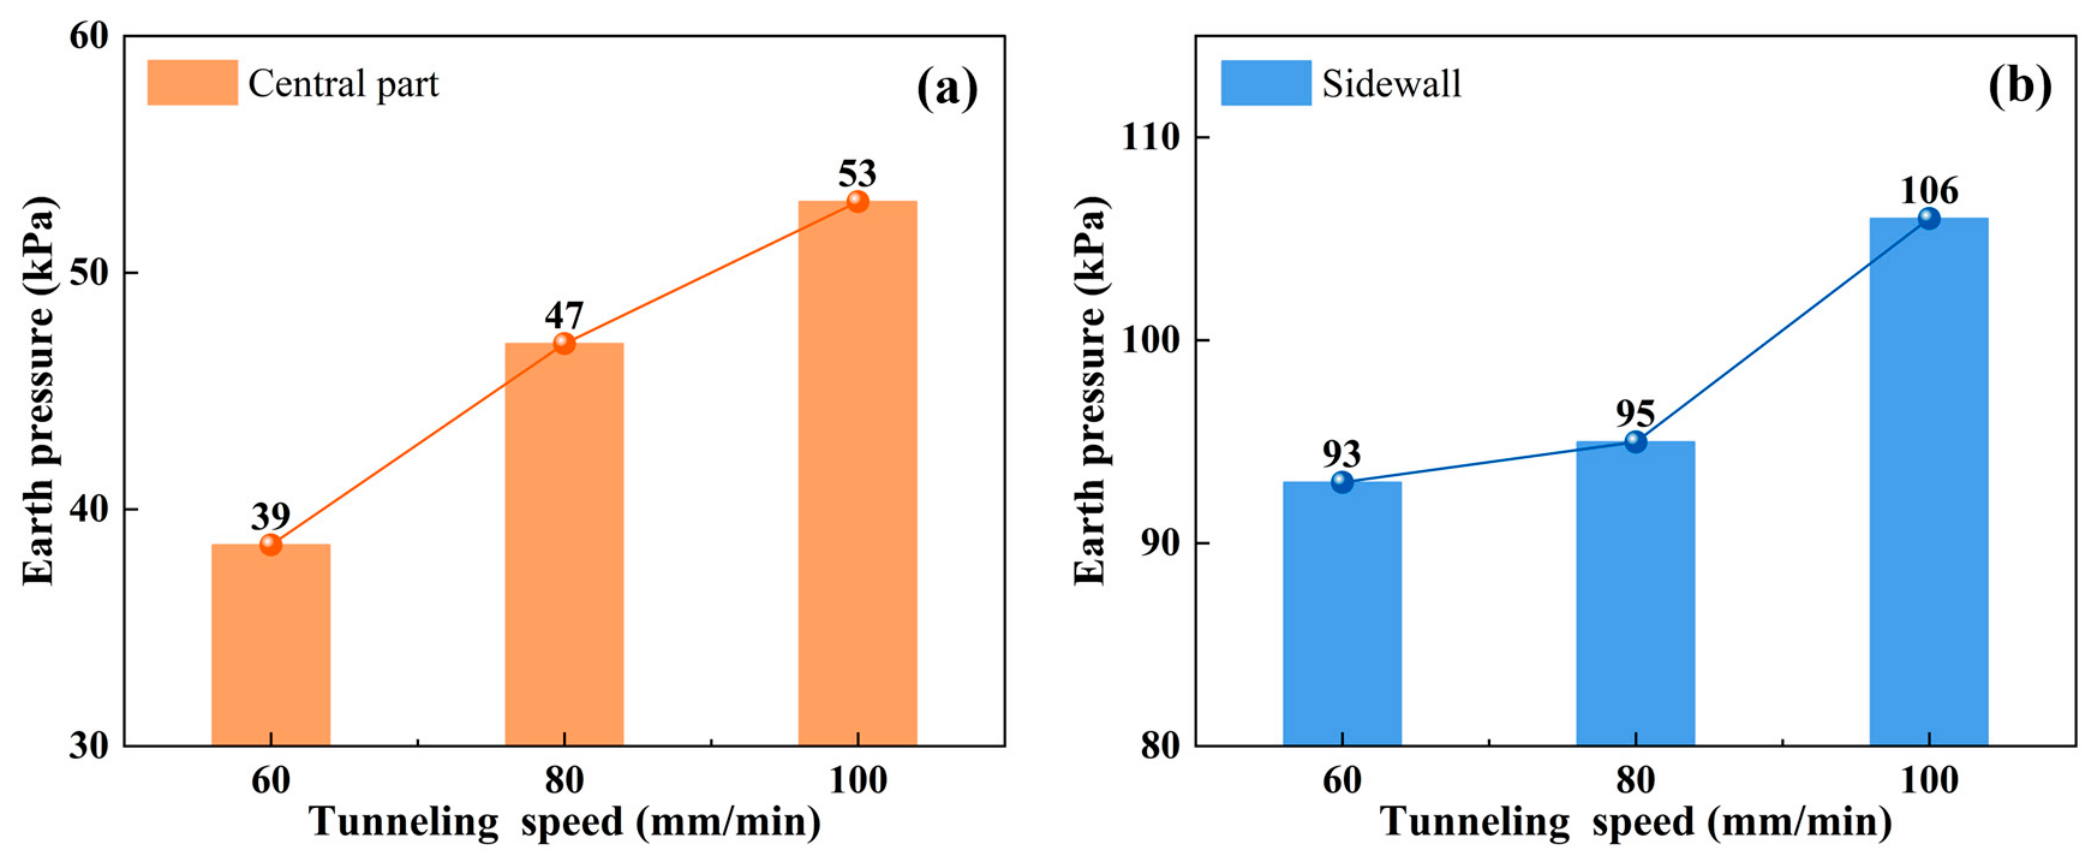
As the tunneling speed increases, both the muck fill ratio and the overall chamber pressure also increase, and the localized bonding near the chamber sidewalls becomes more pronounced. Taking the chamber pressure at 100 s as an example, when the tunneling speed increases from 60 mm/min to 100 mm/min, the pressure in the central part of the chamber increases by 37.7%, and the pressure at the chamber sidewall increases by 14.0%. The magnitude of this increase remains relatively stable, as shown in
Figure 14. This occurs because the tunneling speed is directly related to the volume of soil excavated by the shield. When the screw conveyor speed and cutterhead speed remain constant, a higher tunneling speed leads to more soil being cut and entering the chamber by the cutterhead, consequently causing the chamber pressure to rise continuously.
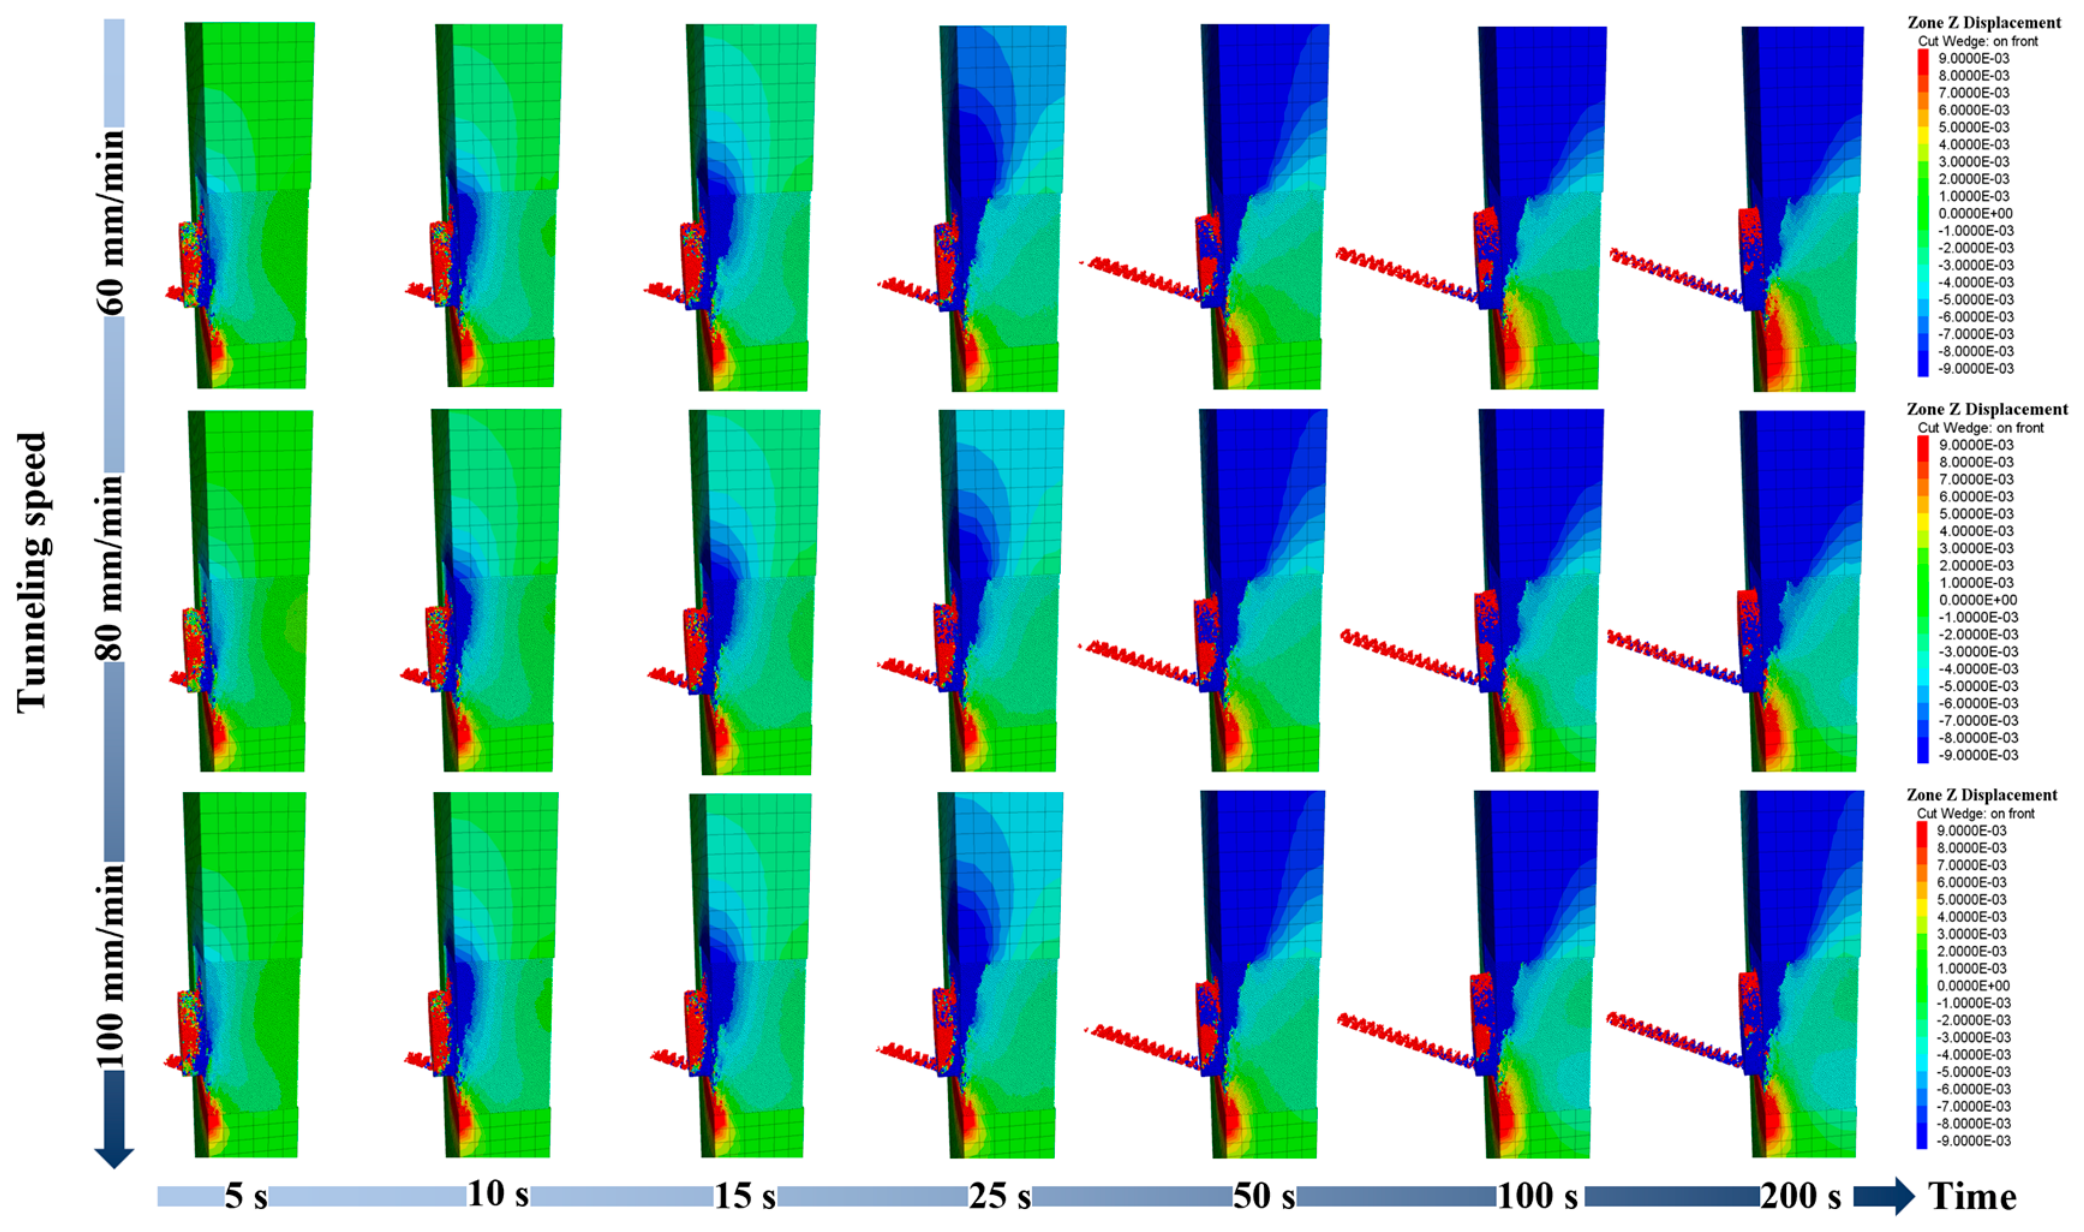
Simulations of the shield tunneling process under three different working conditions also yielded computational results for ground and particle displacements at various tunneling speeds, as detailed in
Figure 15. To analyze the disturbance to particles under different tunneling speeds, the upper limit for particle displacement in the nephogram was set to 9 mm.
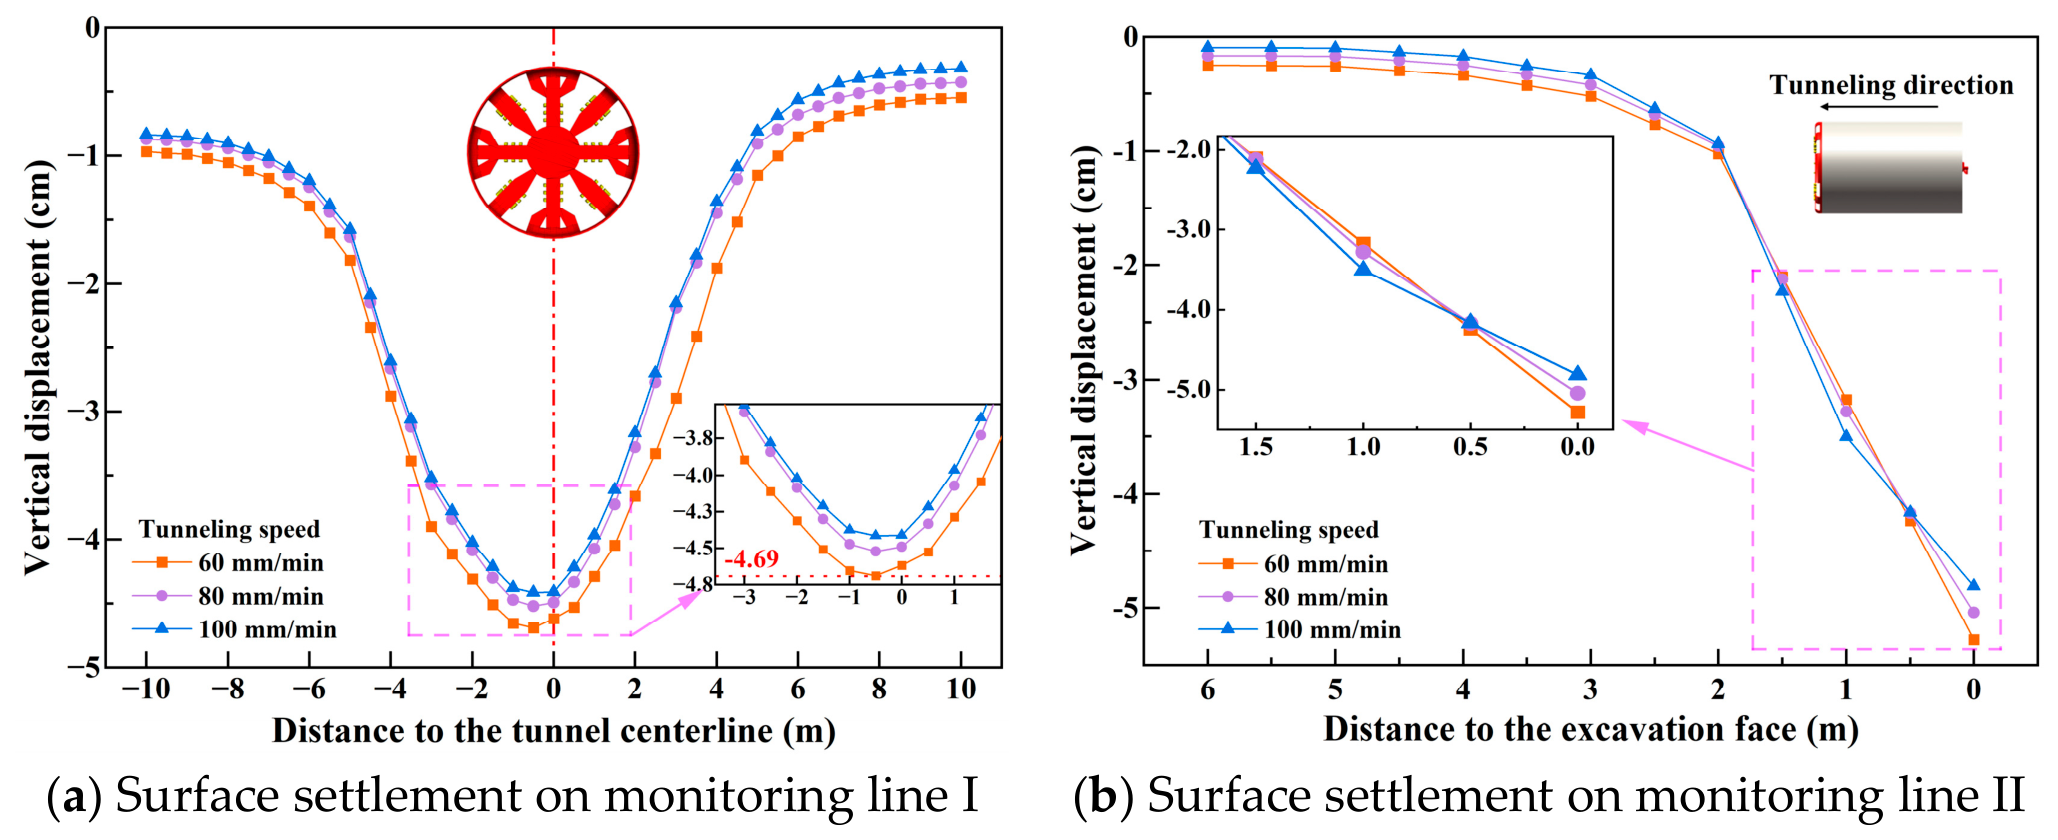
Figure 15 indicates that the settlement trough initially expands rapidly within a short period. After 50 s, its shape becomes relatively stable, although the ground displacement above and below the shield continues to increase slightly. To further investigate the influence of tunneling speed on ground disturbance, the vertical displacements at monitoring points along Lines I and II were obtained when the shield had advanced 0.3 m. The surface settlement trough curves for different tunneling speeds were then plotted, as shown in
Figure 16.
From
Figure 16a, it can be observed that the center of the settlement trough is offset to the left relative to the shield’s central axis, with the settlement value on the right side significantly smaller than that on the left. This asymmetry is attributed to the constant rotational direction of the shield cutterhead during tunneling. The soil on the left side is subjected to a downward frictional force due to the cutterhead rotation, resulting in greater settlement, while the opposite effect occurs on the right side. Comparing the settlement trough curves for different tunneling speeds reveals that as the tunneling speed increases, the width of the settlement trough slightly narrows, and the maximum settlement value decreases correspondingly. Analysis of
Figure 16b shows that areas closer to the excavation face experience greater ground disturbance from shield tunneling. Specifically, a higher tunneling speed leads to increased surface settlement near the excavation face. Conversely, in areas farther from the excavation face, a higher tunneling speed results in reduced surface settlement. Combined with the analysis of chamber pressure, this suggests that the increase in tunneling speed raises the earth pressure within the chamber and enhances the support provided to the excavation face. Under the investigated parameter range, the enhanced support effect reduces the overall settlement trough width and maximum settlement, although local disturbance near the excavation face may still increase.
4.2. Analysis of the Influence of Screw Conveyor Speed on Chamber Pressure
Based on the actual working conditions of Jinan Metro, the screw conveyor speed was set to 10 rpm, 15 rpm, and 20 rpm, respectively. The settings of the other shield tunneling parameters are listed in
Table 4.
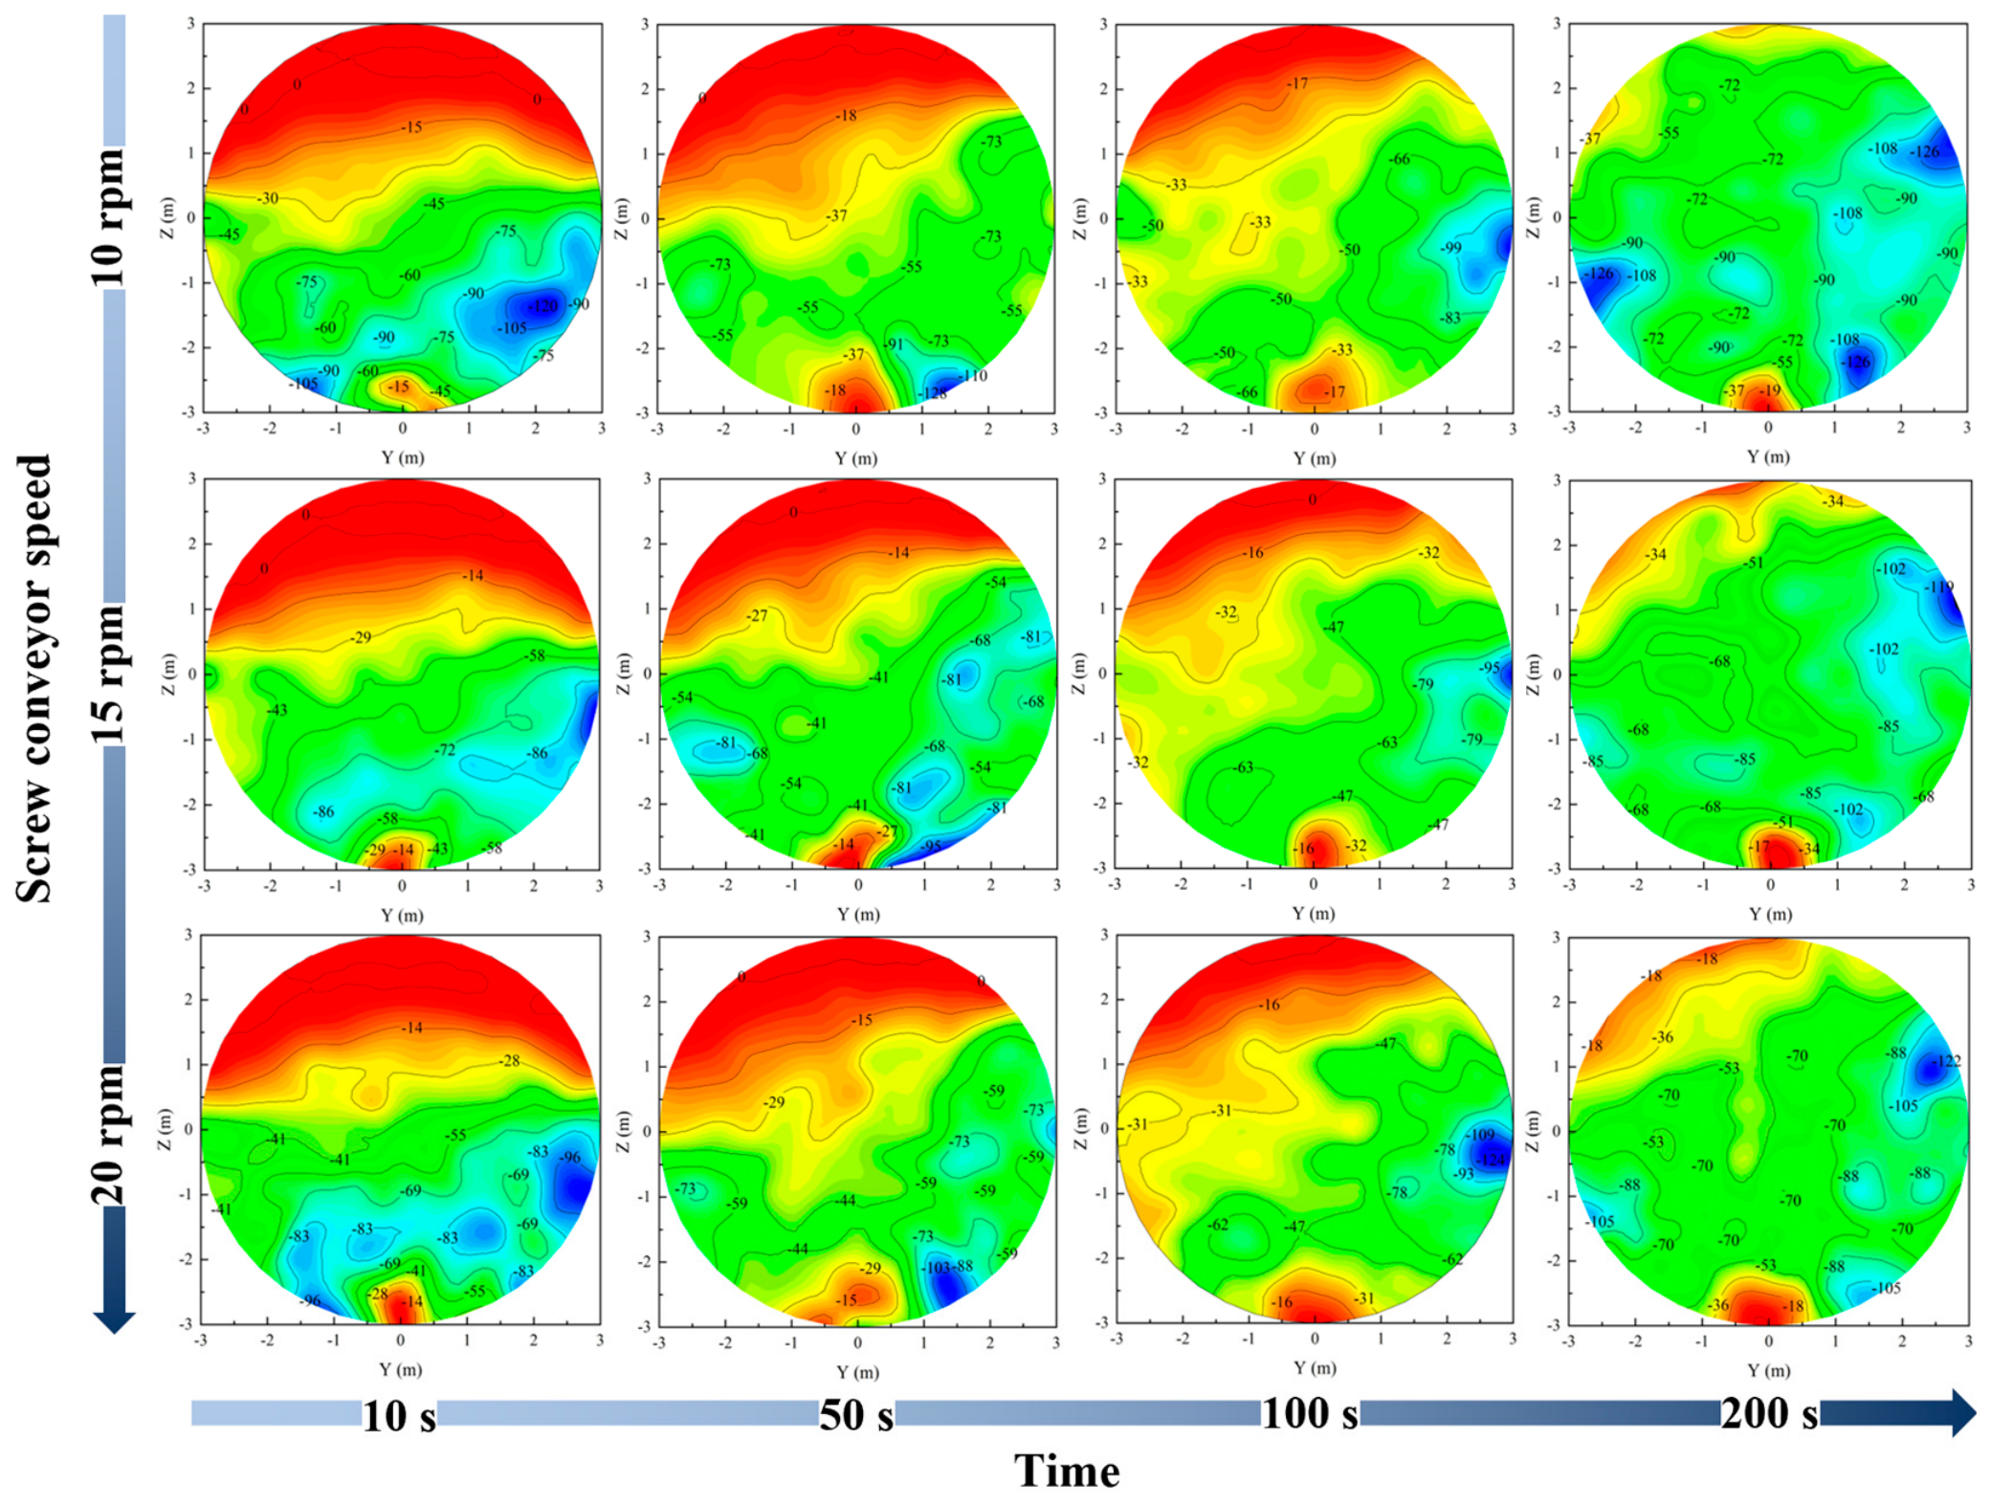
Figure 17 illustrates the chamber pressure variations at different times under various screw conveyor speeds. Since the screw conveyor is directly responsible for muck discharge from the chamber, an increase in its rotation speed slows the filling rate of the chamber. At a screw conveyor speed of 10 rpm, the chamber approaches a full condition by 100 s of tunneling, whereas at 20 rpm, the full condition begins only after 200 s.
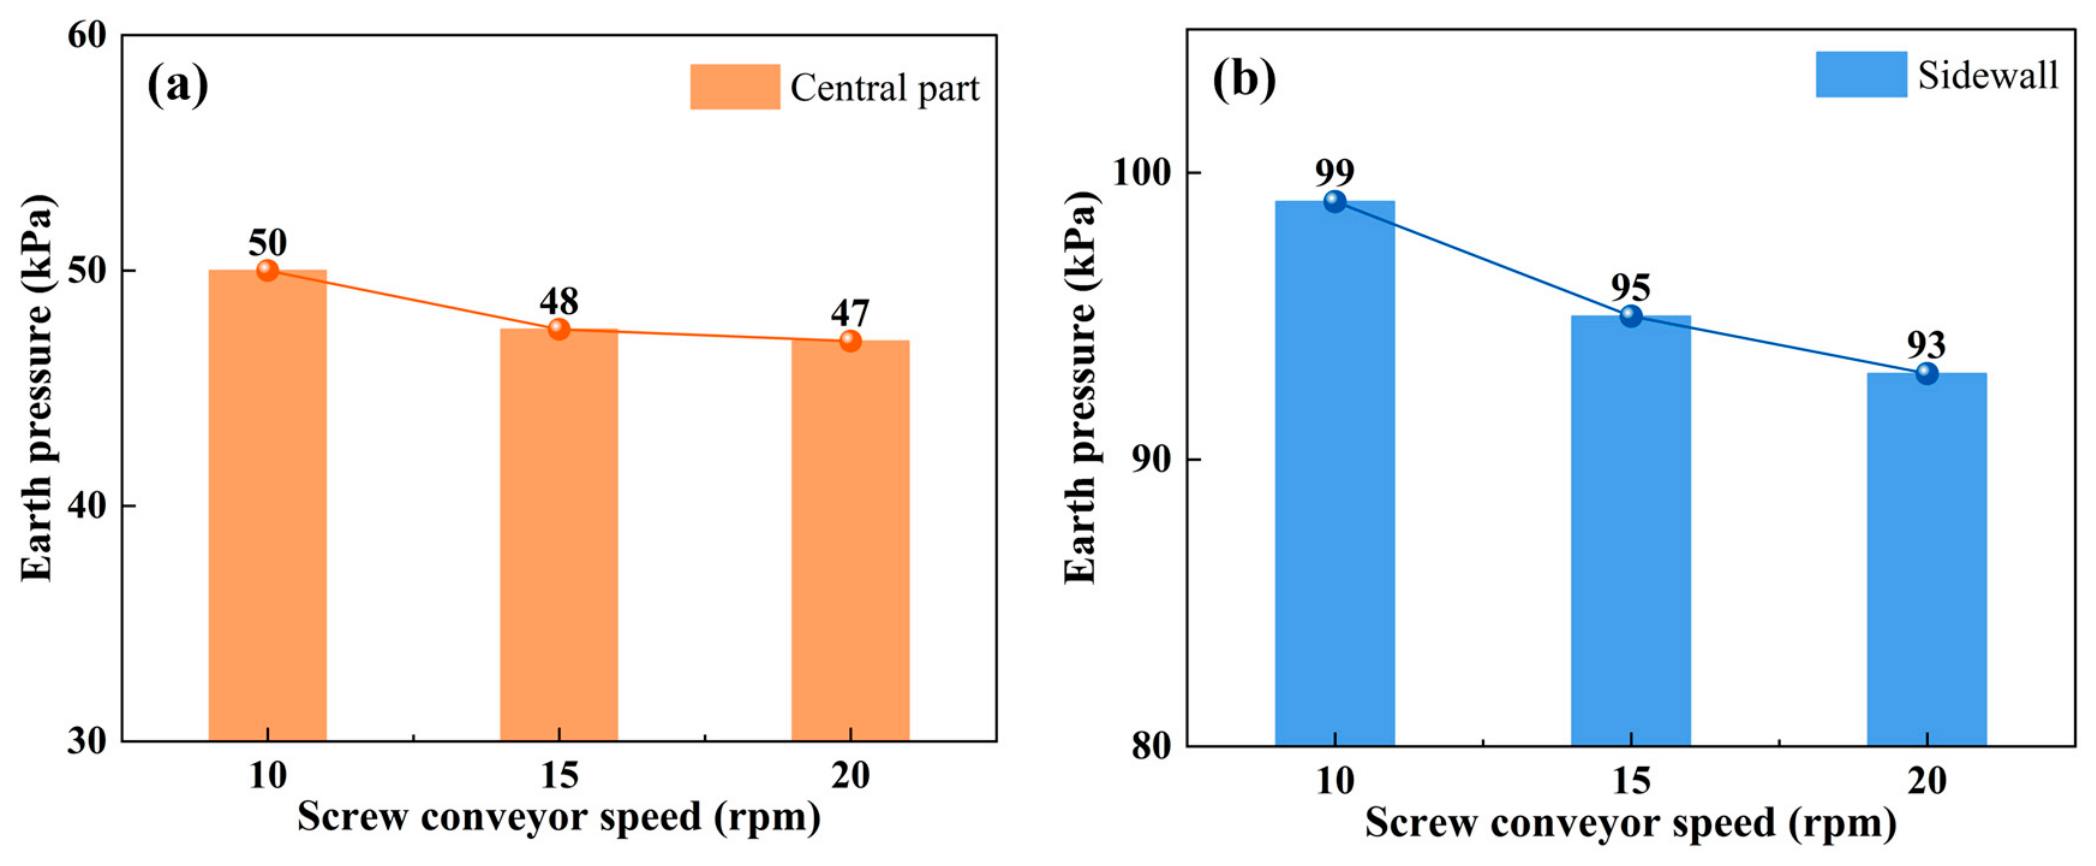
The chamber pressure exhibits an approximately negative correlation with the screw conveyor speed. Taking the chamber pressure at 100 s as an example, when the screw conveyor speed increases from 10 rpm to 20 rpm, the pressure at the chamber sidewall decreases by 6.1%, and the pressure in the central part of the chamber decreases by 6.0%, with the rate of decrease showing a moderating trend, as shown in
Figure 18. This occurs because a higher screw conveyor speed accelerates muck discharge, thereby reducing the pressure inside the chamber. However, since the tunneling speed and cutterhead speed remain unchanged, the increased screw conveyor speed does not lead to a continuous increase in the muck discharge volume, resulting in the observed deceleration of the pressure reduction trend. Concurrently, the increase in screw conveyor speed reduces the cohesive behavior of the soil near the sidewalls, enhancing the overall flowability of the muck within the chamber.
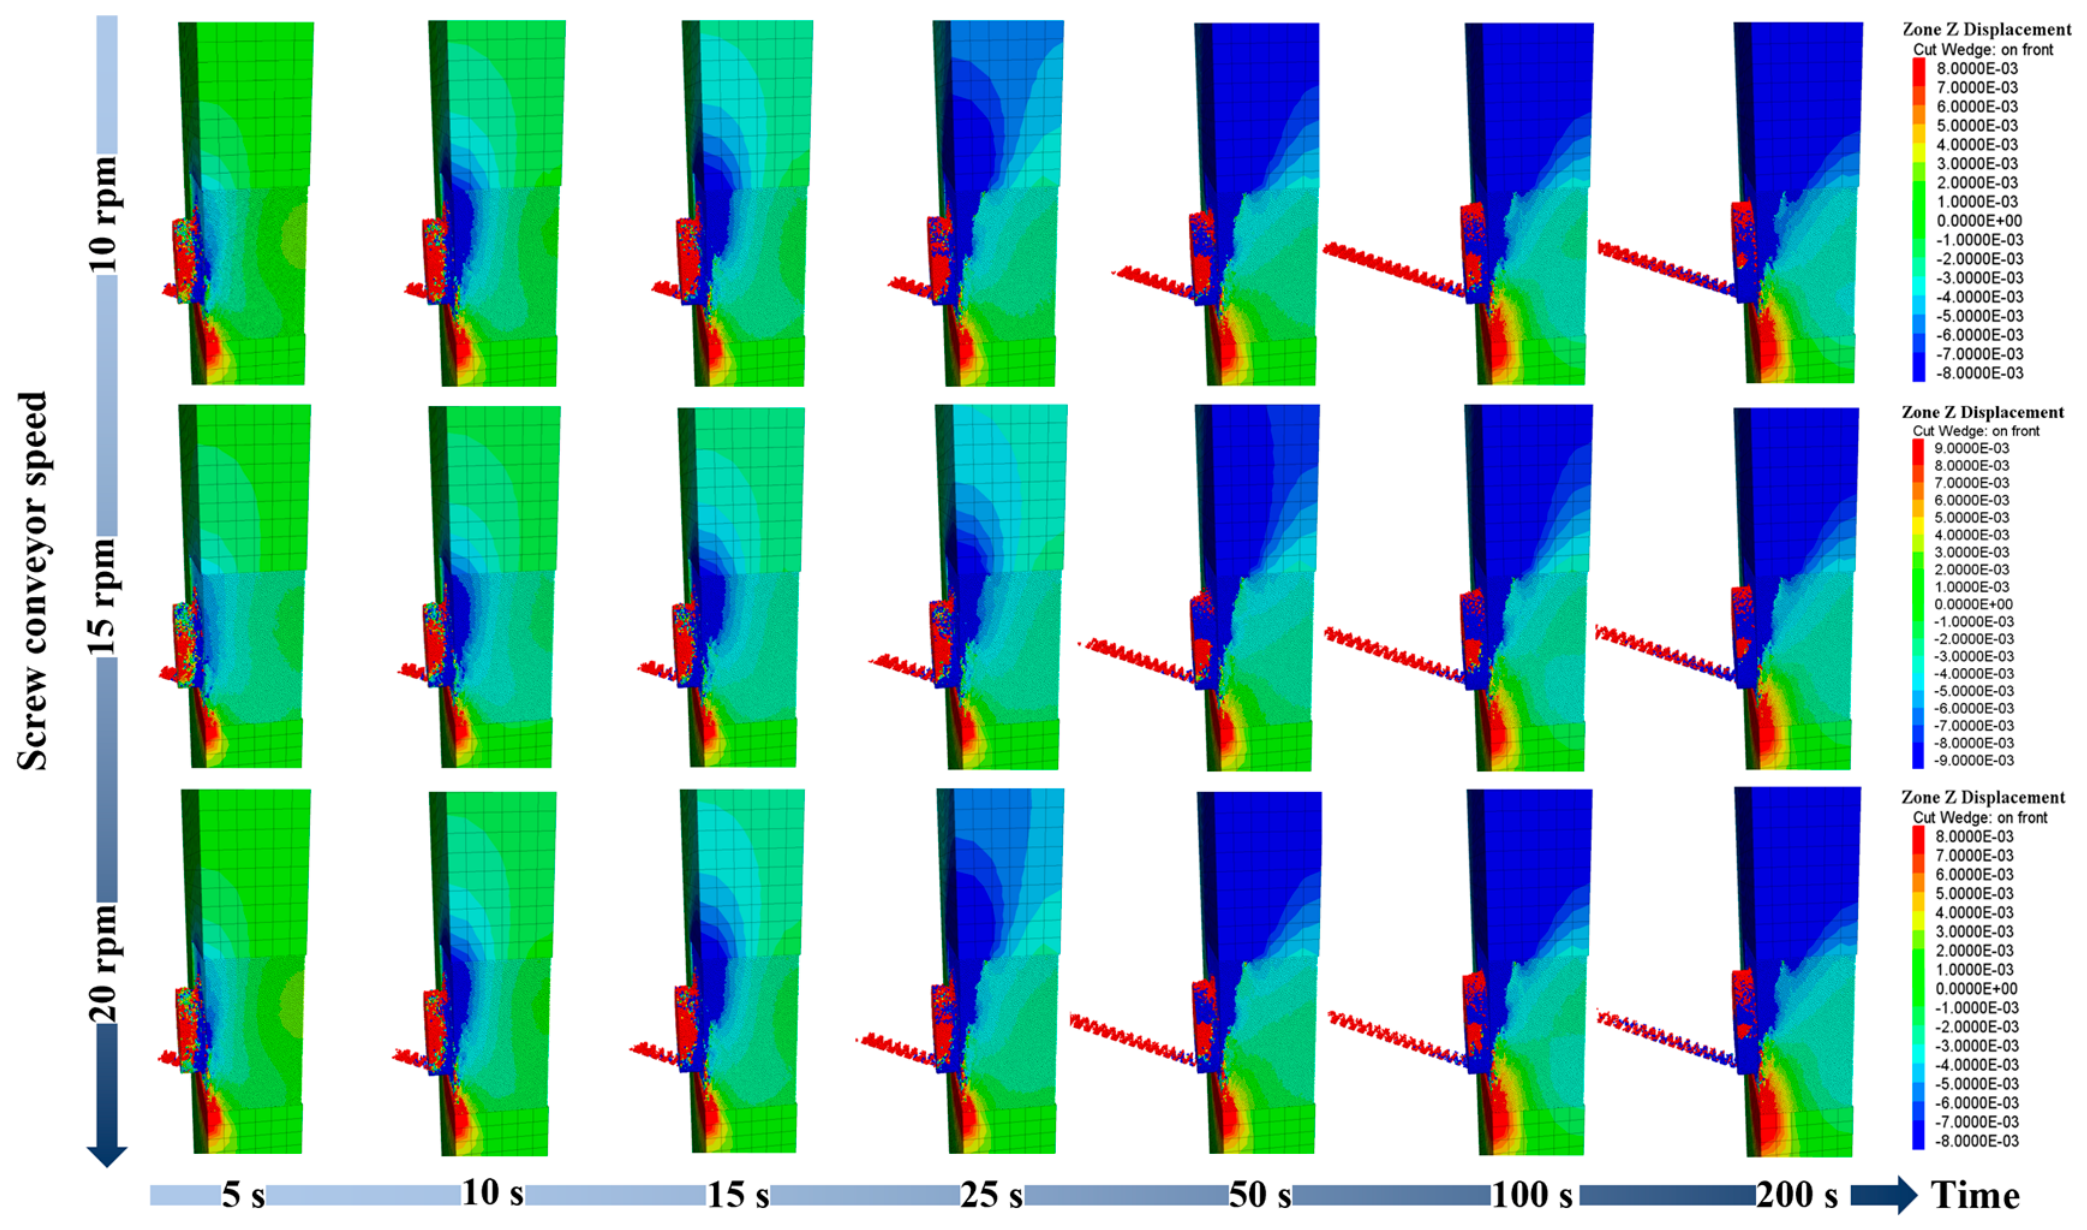
The computed ground and particle displacements under different screw conveyor speeds are presented in
Figure 19.
Figure 19 demonstrates that as the screw conveyor speed increases, the muck discharge rate significantly rises. The amount of muck discharged at 25 s with a screw conveyor speed of 20 rpm is comparable to that at 50 s with a speed of 10 rpm. This further explains the phenomenon of decreasing chamber pressure with increasing screw conveyor speed.
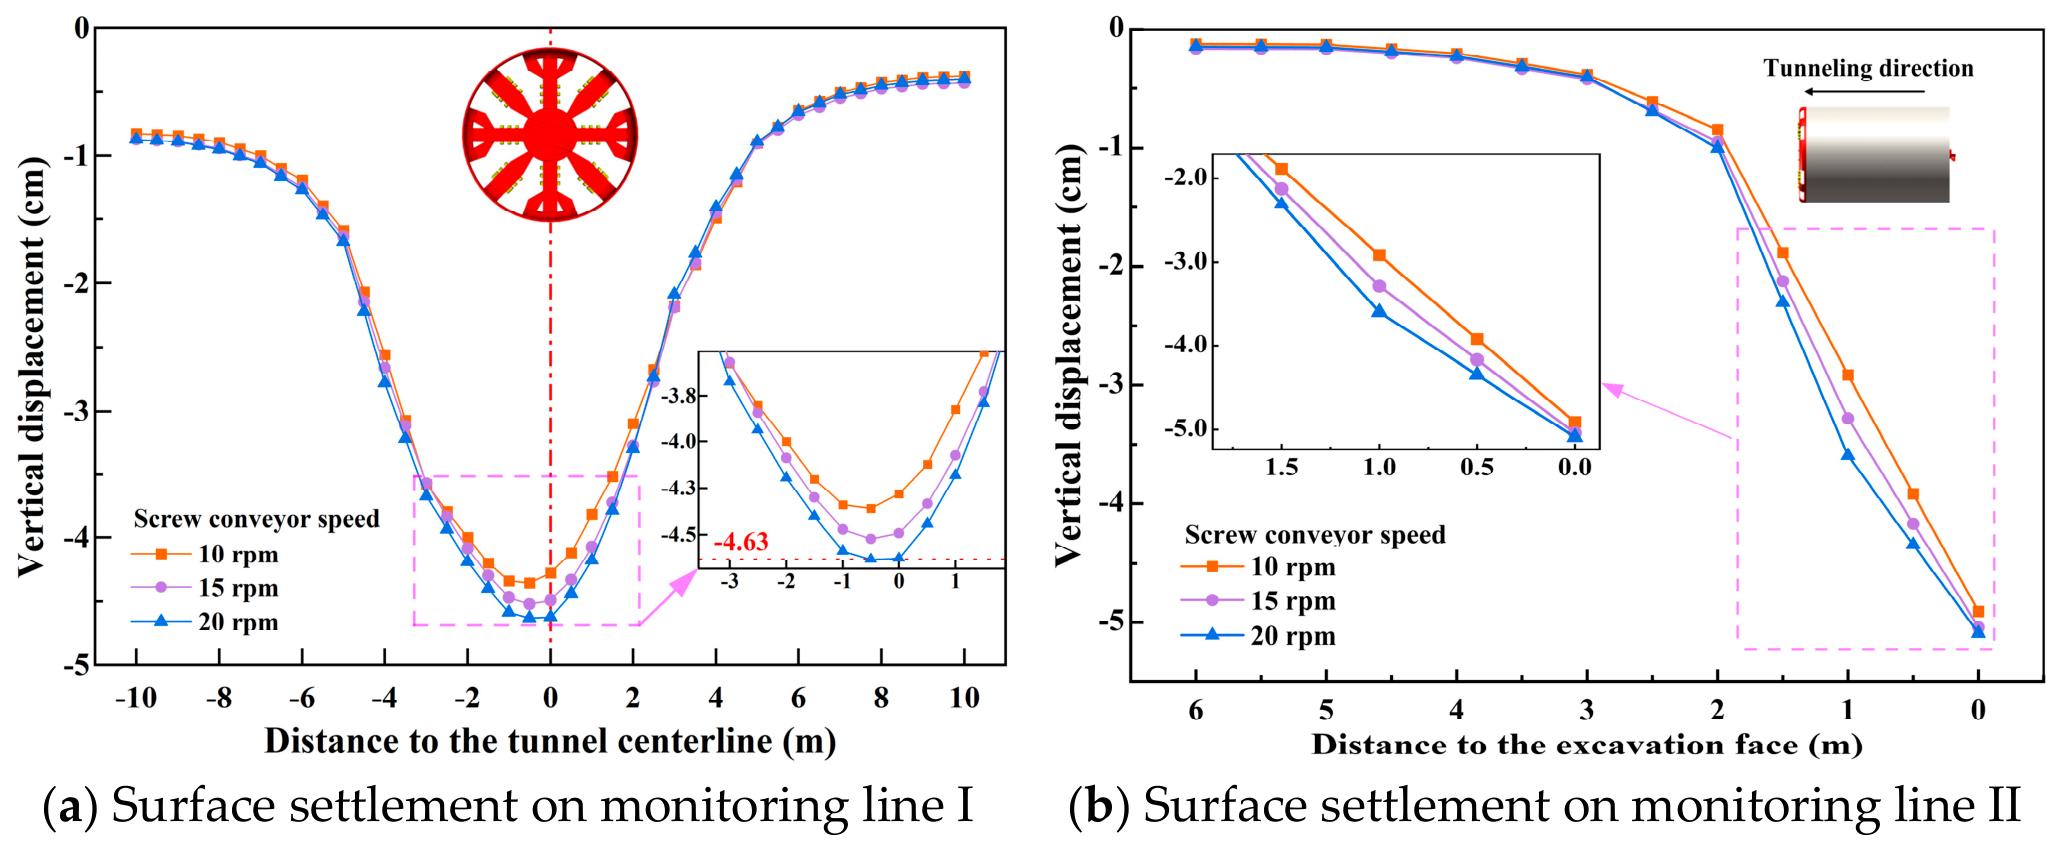
To further analyze the impact of different screw conveyor speeds on the ground ahead, the surface settlement trough curves for various screw conveyor speeds were plotted, as shown in
Figure 20.
Analysis of
Figure 20a indicates that the screw conveyor speed has little influence on the width of the settlement trough or the settlement values on either side of the shield body. Regarding the maximum settlement, an increase in the screw conveyor speed significantly increases the surface settlement directly above the shield machine but has a minor effect on the surface settlement on both sides of the excavation face. From
Figure 20b, it can be seen that the influence range of the screw conveyor speed on the disturbance to the ground ahead is limited, barely affecting surface settlement beyond 3 m from the excavation face. Within the disturbed zone, the surface settlement increases with the screw conveyor speed, indicating a generally positive correlation between the screw conveyor speed and the surface settlement.
4.3. Analysis of the Influence of Cutterhead Speed on Chamber Pressure
Based on the actual working conditions of Jinan Metro, the cutterhead speed was set to 1 rpm, 2 rpm, and 3 rpm, respectively. The settings of the other shield tunneling parameters during the advance are presented in
Table 5.
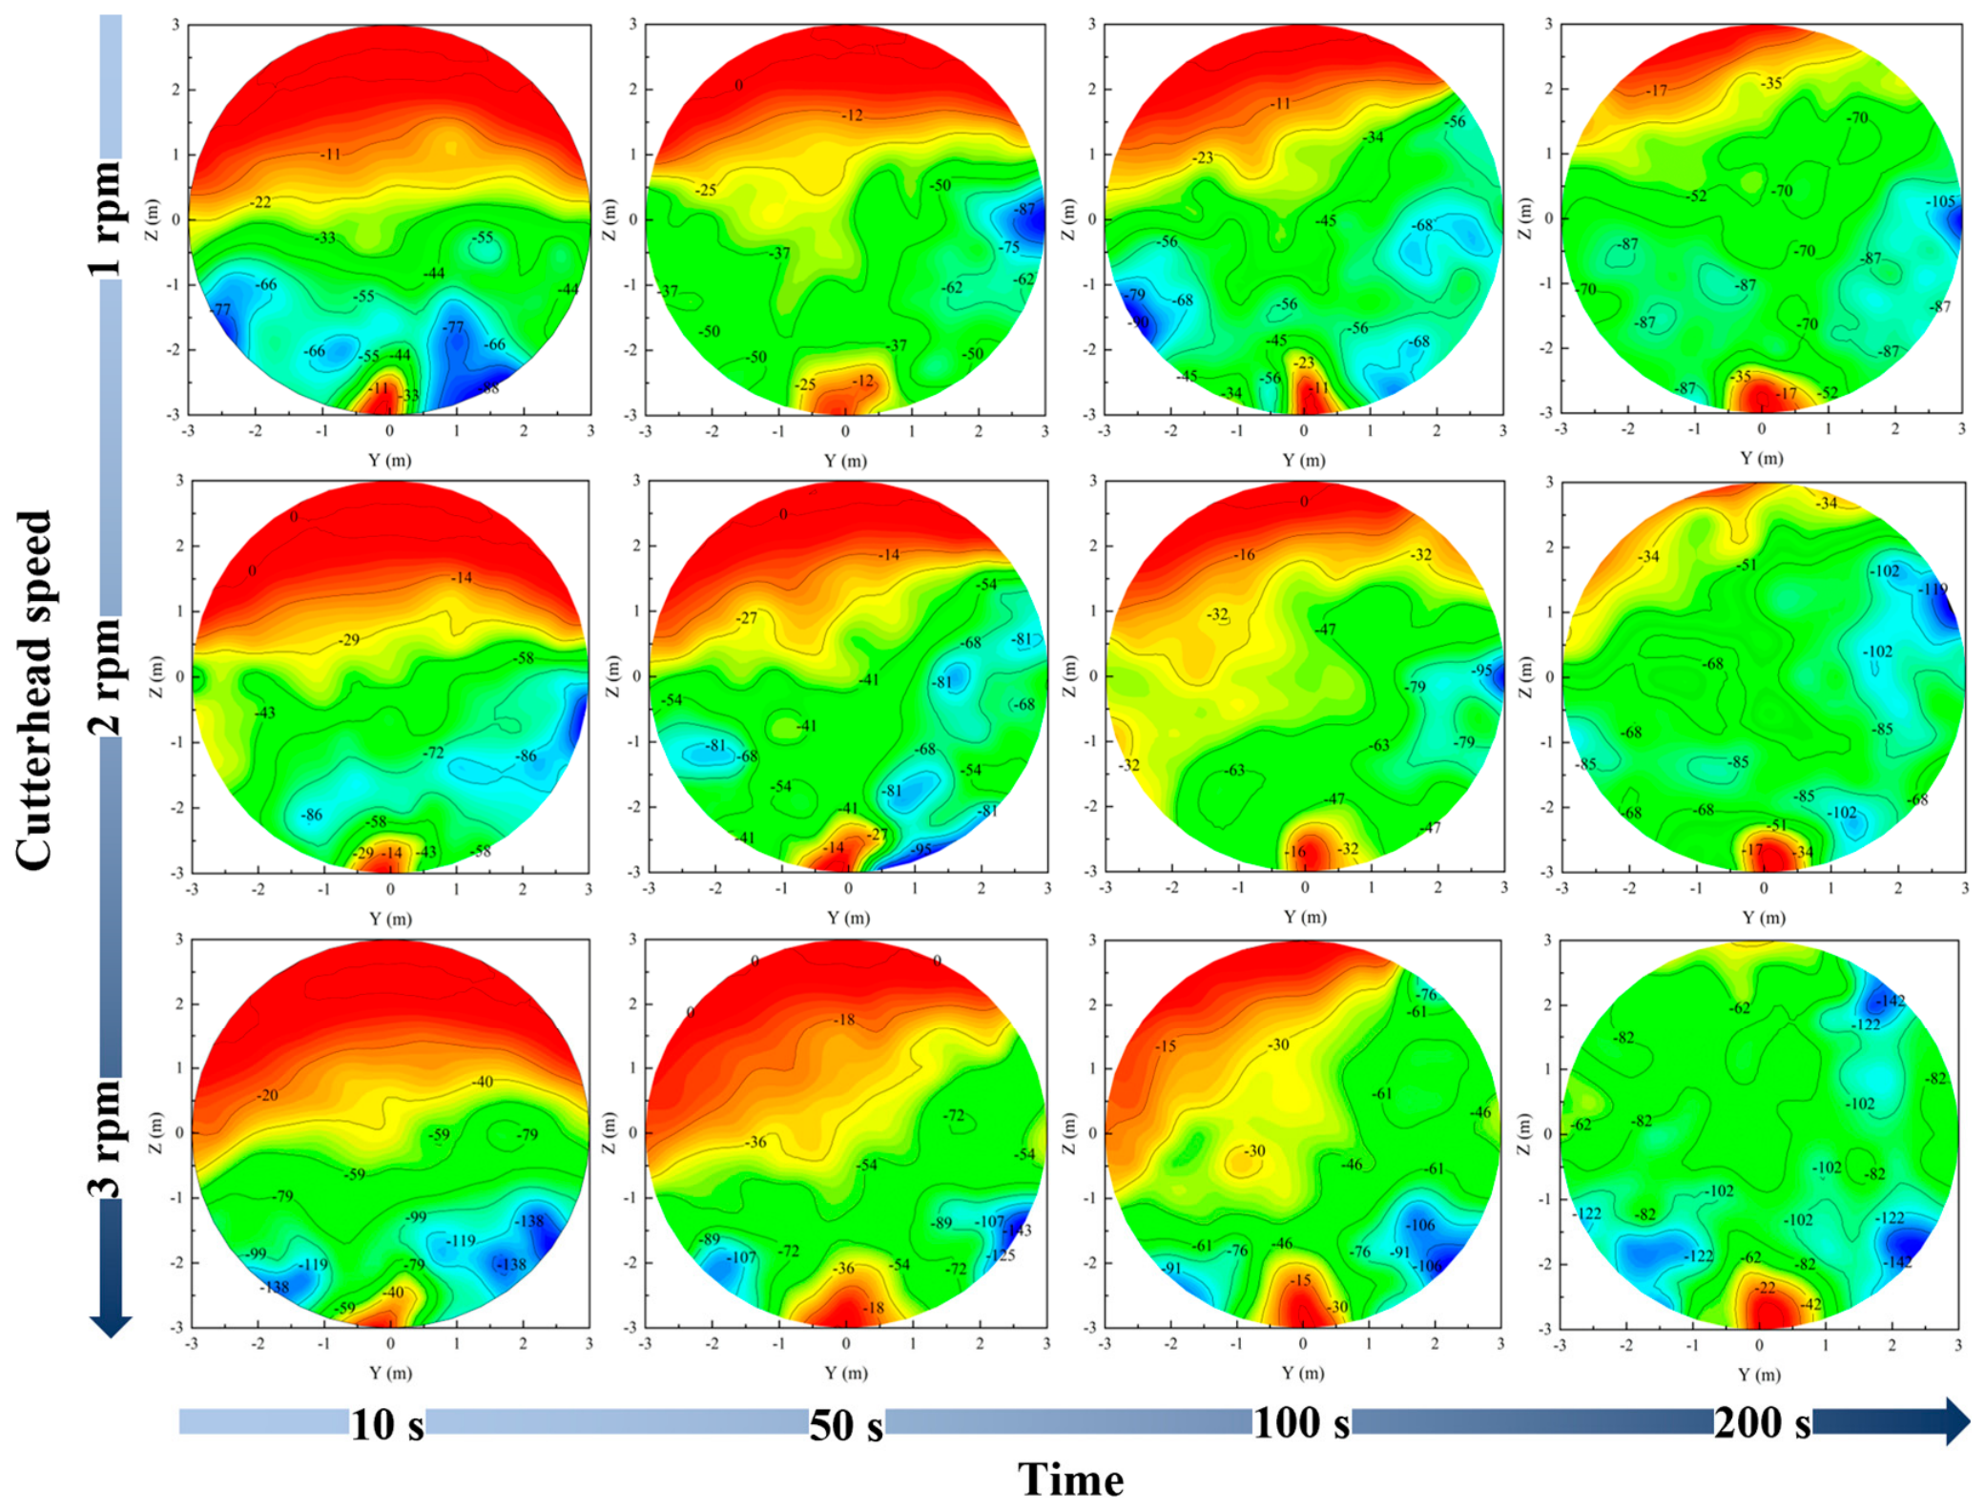
Figure 21 shows the chamber pressure variations at different times under the three cutterhead speeds. The chamber pressure distributions at 100 s reveal that at cutterhead speeds of 1 rpm, 2 rpm, and 3 rpm, the corresponding pressure offsets are approximately 20°, 30°, and 45°, respectively. As the cutterhead speed increases, the overall offset of the chamber pressure nephogram also increases. This indicates that the cutterhead speed influences the distribution pattern of the chamber pressure, which subsequently affects surface settlement.
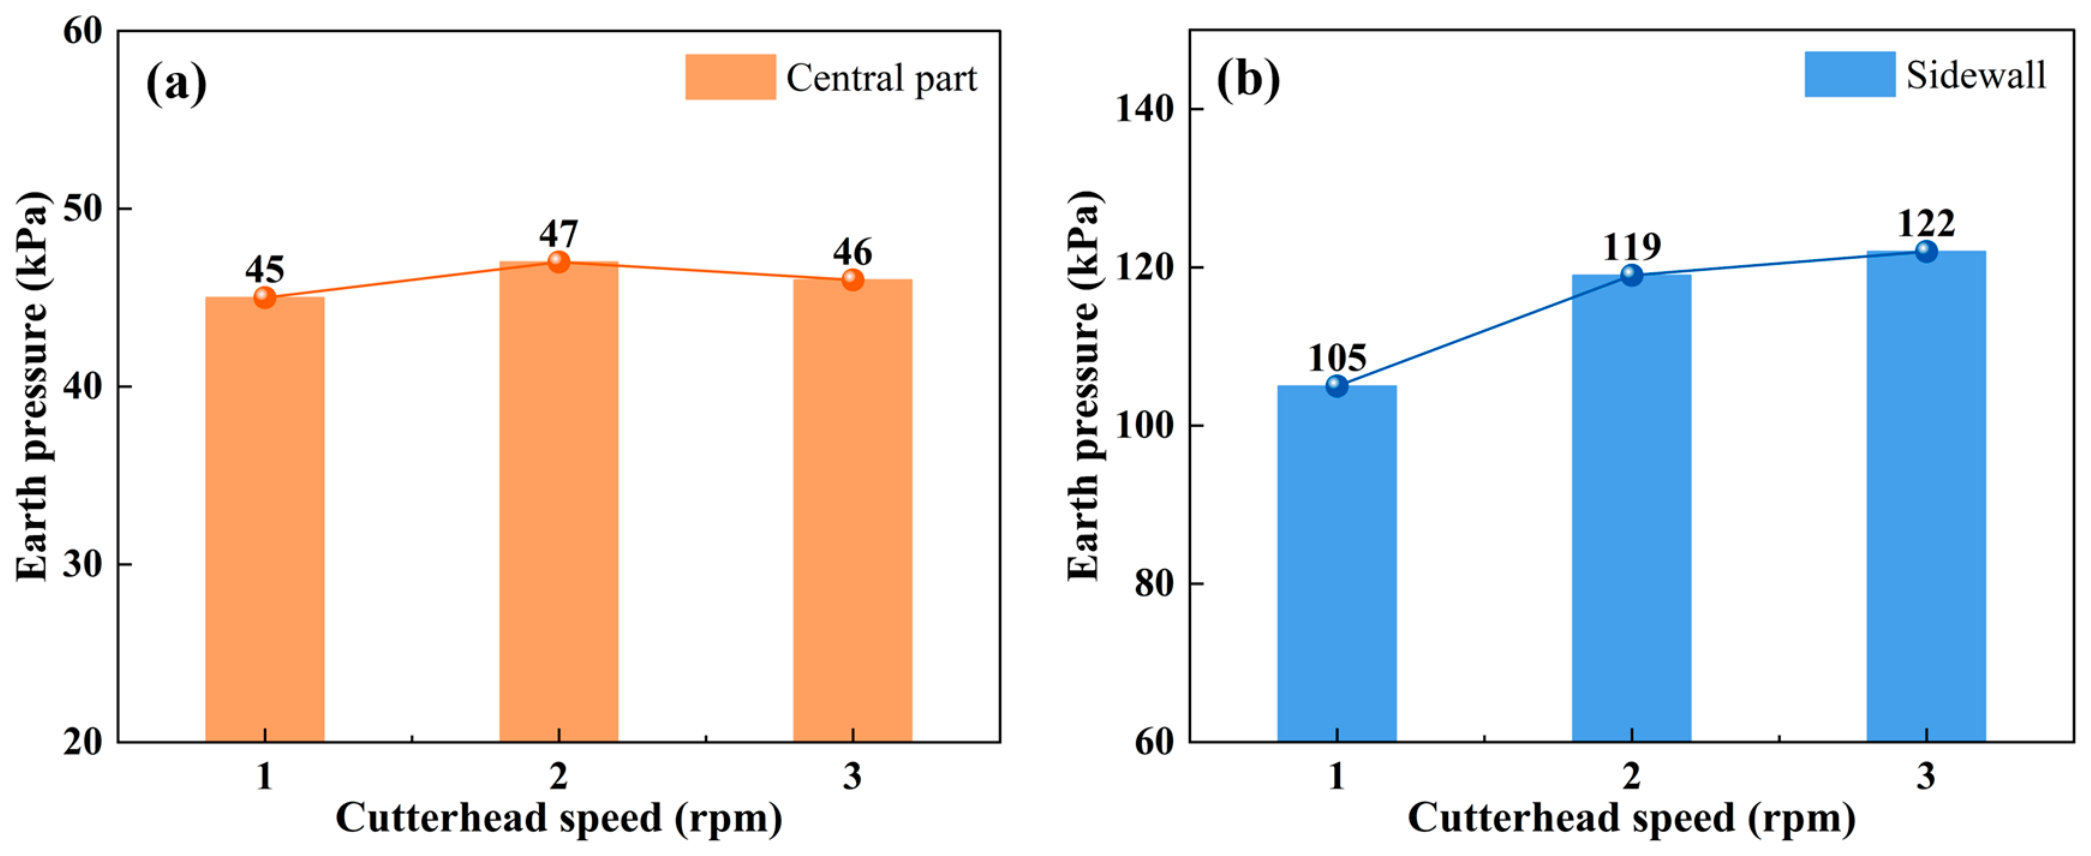
Analysis of the chamber pressure under different cutterhead speeds at 100 s of tunneling shows that when the cutterhead speed increases from 1 rpm to 3 rpm, the pressure at the chamber sidewall increases by 16.2%, whereas the pressure in the central part of the chamber increases by only 2.2%. This occurs because, at a constant tunneling speed, a continuous increase in cutterhead speed may lead to an idling phenomenon, where the volume of soil cut into the chamber does not increase significantly. Consequently, the rise in central chamber pressure is limited. However, the increased cutterhead speed makes the soil more prone to adhere to the chamber sidewalls, resulting in a notable pressure increase there, as shown in
Figure 22.
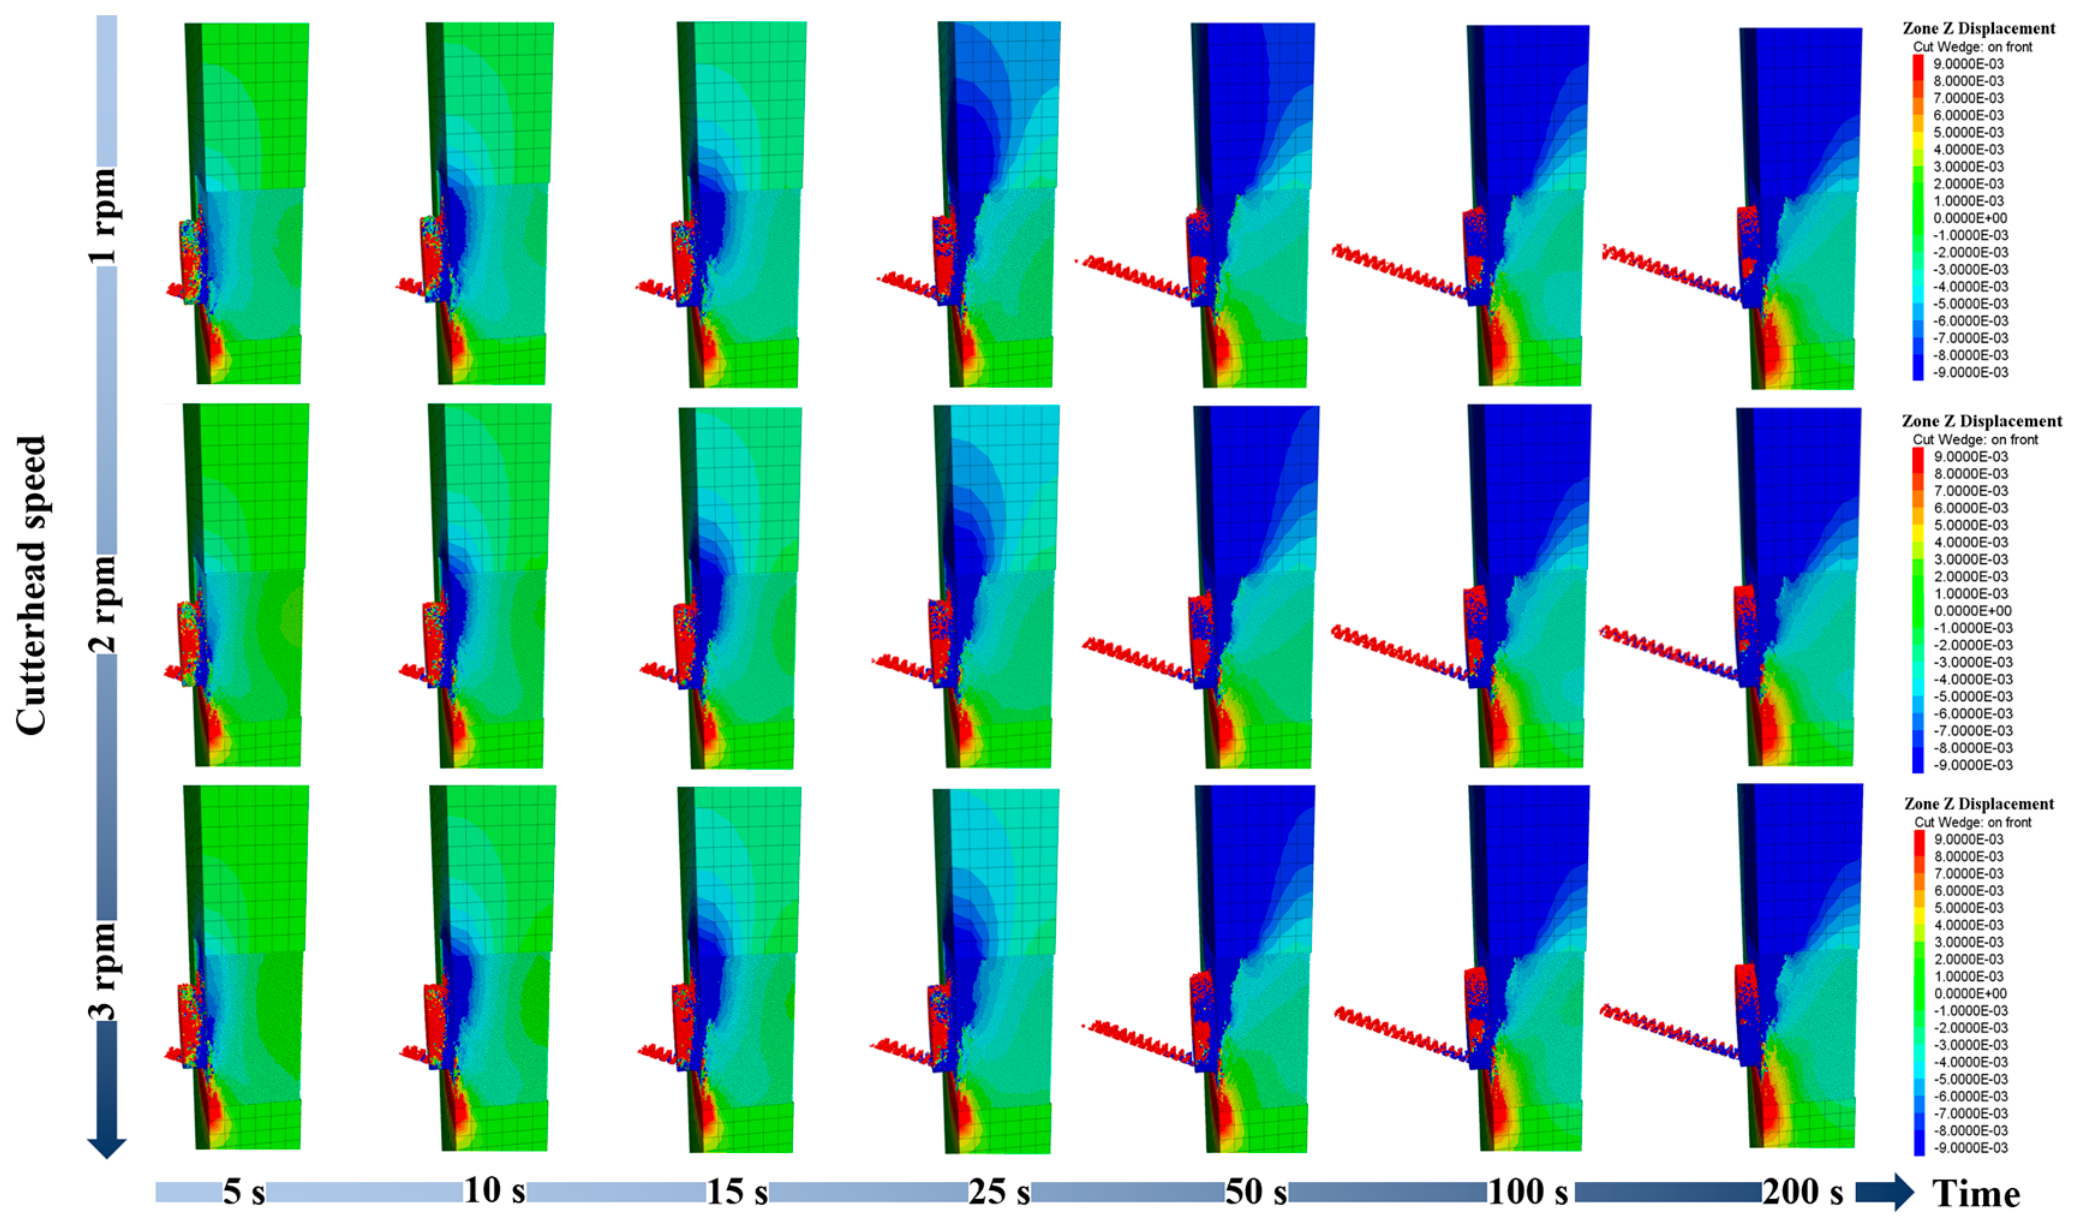
The computed ground and particle displacements under different cutterhead speeds are presented in
Figure 23.
Figure 23 indicates that the variation in ground displacement ahead of the shield over time differs only marginally among the three cutterhead speeds. To further analyze the influence of different cutterhead speeds on the ground ahead, the surface settlement trough curves for various cutterhead speeds were plotted, as shown in
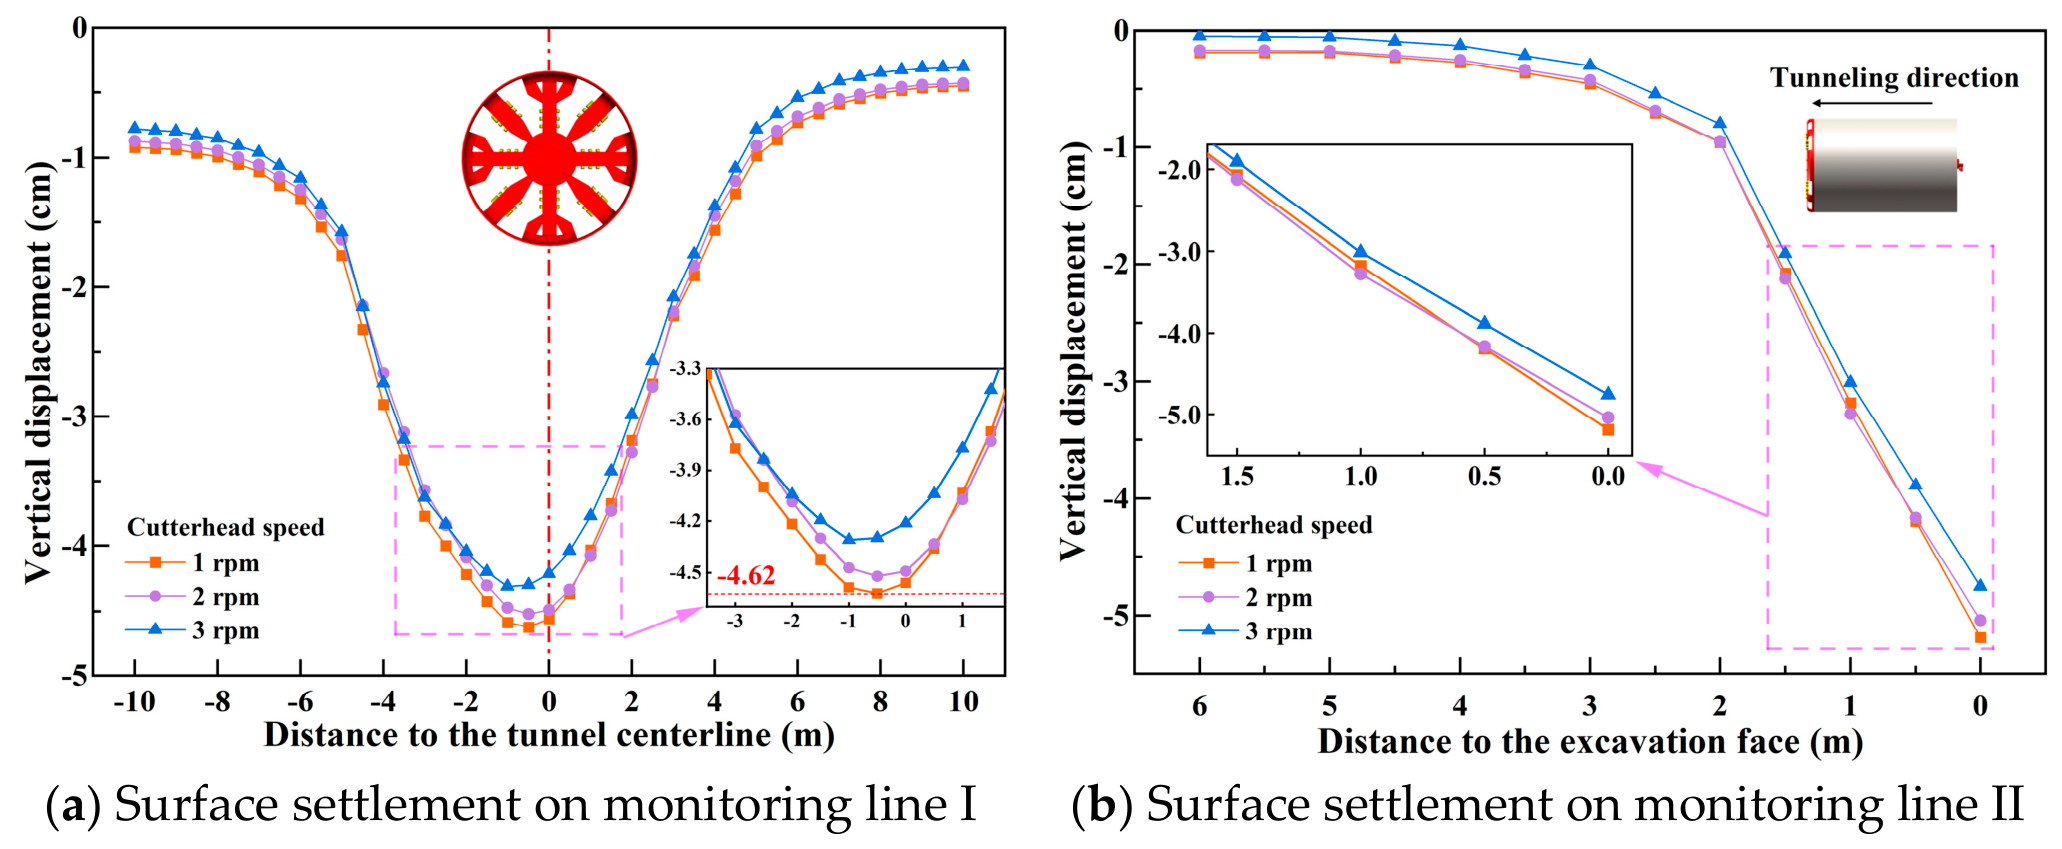
Figure 24.
Analysis of
Figure 24a reveals that a higher cutterhead speed leads to a greater offset of the settlement trough’s axis of symmetry, which corresponds to the aforementioned offset observed in the chamber pressure. In the direction perpendicular to the tunneling direction, the cutterhead speed and surface settlement generally exhibit a negative correlation. From
Figure 24b, it can be observed that the longitudinal surface settlement curves for cutterhead speeds of 1 rpm and 2 rpm largely overlap. However, at 3 rpm, the monitored vertical settlement values within the influenced zone ahead of the face are somewhat reduced. This suggests that appropriately increasing the cutterhead speed can help enhance the support effect at the excavation face, thereby suppressing the development of ground settlement to a certain extent.
To provide a clearer quantitative comparison of the three groups of working conditions, the representative responses of chamber pressure and surface settlement are summarized in
Table 6.
5. Discussion
(1) The proposed model and simulation results should be interpreted within the modeled soil type, shield configuration, parameter ranges, and groundwater conditions. The model is mainly applicable to stable EPB shield tunneling in relatively continuous and conditionable cohesive soil or silty clay strata under stable groundwater conditions, because groundwater pressure may change the effective stress state and the required support pressure at the excavation face. When applied to saturated ground with different groundwater conditions or to strata with substantially different mechanical properties, soil-conditioning behavior, or cutterhead structures, the assumptions and key parameters of the theoretical model should be recalibrated or verified using project-specific data.
(2) The control-variable method used in this study is intended to clarify the individual effects of tunneling speed, cutterhead speed, and screw conveyor speed on chamber pressure and surface settlement. However, in actual EPB shield tunneling, these parameters are usually adjusted simultaneously, and their combined effects may not be a simple superposition of single-parameter results. Therefore, the findings of this study should be regarded as a basis for understanding individual parameter mechanisms and supporting coordinated parameter adjustment in engineering practice. Future studies will further investigate the coupled effects of multiple tunneling parameters through systematic parameter combination designs, aiming to quantify the synergistic influence of operational parameters on chamber-pressure evolution and ground deformation.
(3) From an engineering perspective, tunneling parameters should be adjusted according to the control objective. Insufficient chamber pressure can be improved by increasing tunneling speed or reducing screw conveyor speed, whereas excessive chamber pressure can be relieved by increasing screw conveyor speed. Cutterhead speed mainly affects pressure distribution and settlement asymmetry, and should therefore be considered when balancing face support, muck discharge, and settlement control in parameter selection.
(4) Beyond metro shield tunneling, the proposed theoretical analysis and FDM–DEM coupled modeling strategy may also provide a reference for underground excavation systems involving continuous excavation, muck transport, and ground deformation control, although more complex auxiliary functions such as mineral haulage, ventilation, emergency oxygen supply, and underground communication require project-specific analysis. In addition, although the mechanism-based sensitivity assessment helps distinguish the action paths of different pressure-related mechanisms, a more rigorous quantitative contribution analysis still requires specially designed numerical cases or field monitoring data. Future studies may further quantify the relative contributions of excavation–discharge imbalance, cutterhead squeezing, and pressure-transfer parameters to chamber-pressure variation.
6. Conclusions
This study investigated the influence mechanisms of key tunneling parameters on chamber pressure and surface settlement under the modeled silty clay conditions, considering the specific shield configuration and construction parameters, employing a combined approach of theoretical derivation and FDM–DEM coupled numerical simulation. The obtained findings are primarily applicable to the investigated geological conditions and shield tunneling parameters, and further verification is required when extending them to other soil types or shield configurations. The main conclusions within the investigated parameter ranges are as follows:
(1) By establishing the physico-mechanical equilibrium equations for shield tunneling, a theoretical model for chamber pressure was derived, incorporating the effects of soil conditioning and the cutterhead squeezing action. This model clarifies the quantitative relationships between chamber pressure and key operational parameters such as tunneling speed, cutterhead speed, and screw conveyor speed, revealing the core mechanism governing chamber pressure control.
(2) Within the investigated parameter range, tunneling speed shows a positive correlation with chamber pressure. A moderate increase in tunneling speed enhances the support effect at the excavation face and reduces the overall settlement trough width and maximum settlement in the simulated silty clay stratum. However, the settlement response is not uniform along the tunneling direction, and local disturbance near the excavation face may increase.
(3) The screw conveyor speed directly governs the unloading level of the chamber pressure, showing a negative correlation with it. An increase in screw conveyor speed improves muck discharge efficiency. However, this enhanced discharge efficiency weakens the support provided by the chamber, leading to increased surface settlement near the excavation face, while its influence on the disturbance range of the surrounding ground remains limited.
(4) The cutterhead speed primarily affects the spatial distribution pattern of the chamber pressure. As the cutterhead speed increases, the chamber pressure nephogram exhibits a more pronounced rotational offset, making soil more prone to adhesion to the sidewalls. An increase in cutterhead speed also intensifies the asymmetry of the settlement trough, but its impact on the disturbance to the ground ahead of the tunnel face along the longitudinal direction is relatively minor.
Author Contributions
Methodology, W.H., Y.L. and T.L.; formal analysis, W.H., Y.L., Y.Y., Y.Z. (Yaming Zhang) and W.L.; data curation, W.H., Y.Y., Y.Z. (Yaming Zhang) and T.L.; investigation, Y.Y.; writing—original draft preparation, W.H., Y.L., Y.Z. (Yaming Zhang) and Y.Z. (Yijie Zhang); visualization, Y.L. and W.L.; project administration, Y.Z. (Yijie Zhang); funding acquisition, Y.Z. (Yijie Zhang). All authors have read and agreed to the published version of the manuscript.
Funding
This work was supported by National Natural Science Foundation of China Youth Project (No. 52308407); Shandong Provincial Natural Science Foundation Youth Fund Program (ZR2024QE192) and the Science and Technology Research and Development Program of China Railway Group Limited (2022-Key Project-13).
Institutional Review Board Statement
Not applicable.
Informed Consent Statement
Not applicable.
Data Availability Statement
The data used to support the findings of this study are included within the article.
Conflicts of Interest
The authors declare that this study received funding from China Railway Group Limited. The funder was not involved in the study design, collection, analysis, interpretation of data, the writing of this article or the decision to submit it for publication. Authors Weiguo He, Yong Yu, Tengfei Li and Wenjun Liu were employed by the company China Railway Liuyuan Group Co., Ltd. The remaining authors declare that the research was conducted in the absence of any commercial or financial relationships that could be construed as a potential conflict of interest.
References
- Hasanpour, R.; Schmitt, J.; Ozcelik, Y.; Rostami, J. Examining the Effect of Adverse Geological Conditions on Jamming of a Single Shielded TBM in Uluabat Tunnel Using Numerical Modeling. J. Rock Mech. Geotech. Eng. 2017, 9, 1112–1122. [Google Scholar] [CrossRef]
- Wang, J.; Li, L.; Shi, S.; Sun, S.; Ba, X.; Zhang, Y. Fine Exploration and Control of Subway Crossing Karst Area. Appl. Sci. 2019, 9, 2588. [Google Scholar] [CrossRef]
- Jin, D.; Yuan, D.; Mao, J. Face Failure Analysis of a Shield Tunnel with Slurry Penetration into the Ground. Tunn. Undergr. Space Technol. 2022, 126, 104554. [Google Scholar] [CrossRef]
- Yaman, H.E.; Aksoy, C.O. Evaluation of Symmetrical Face Pressure of EPB. Symmetry 2024, 16, 484. [Google Scholar] [CrossRef]
- Binen, I.S.; Kara, F.; Temur, M.; Cinar, M.; Ates, U. Comparison of Two Identical EPB TBMs under Different and Complex Geological Conditions. In Proceedings of the ITA-AITES World Tunnel Congress 2023, WTC 2023: Expanding Underground—Knowledge and Passion to Make a Positive Impact on the World; Benardos, A., Anagnostou, G., Marinos, V.P., Eds.; CRC Press-Balkema: Athens, Greece, 2023; pp. 1166–1174. [Google Scholar]
- Wang, J.; Luo, Y.; Fang, Z.; Ba, X.; Zhang, Y.; Jiang, H. Stability Assessment of Surrounding Rock during Shield Tunneling through Karst Cavities Using Numerical and Physical Modeling. Geotech. Geol. Eng. 2025, 43, 482. [Google Scholar] [CrossRef]
- Mohammadi, D.; Shahriar, K.; Moarefvand, P.; Farrokh, E. Discussion of Cutterhead Opening Design for Earth Pressure Balance Machines (EPBMs) in Soft Grounds. Proc. Inst. Civ. Eng. Geotech. Eng. 2023, 177, 645–659. [Google Scholar] [CrossRef]
- Agrawal, A.K.; Chattopadhyaya, S.; Murthy, V.M.S.R.; Adesh, A.K. Assessment of Reliability and Maintainability of Earth Pressure Balance Tunnel Boring Machine (EPBTBM)-an Approach. Tunn. Undergr. Space Technol. 2022, 121, 104337. [Google Scholar] [CrossRef]
- Nematollahi, M.; Dias, D. Twin Earth Pressure Balance Tunnelling—Monitoring and Numerical Study of an Urban Case. Proc. Inst. Civ. Eng. Geotech. Eng. 2022, 176, 662–674. [Google Scholar] [CrossRef]
- Zhou, X.-H.; Shen, S.-L.; Zhou, A. A Novel Data-Driven Approach for Proactive Risk Assessment in Shield Tunnel Construction. Transp. Geotech. 2025, 50, 101466. [Google Scholar] [CrossRef]
- Di, Q.; Li, P.; Zhang, M.; Cui, X. Experimental Study on Stress Distribution Characteristics of a Shield Tunnel under Passive Failure. Eng. Fail. Anal. 2023, 154, 107725. [Google Scholar] [CrossRef]
- Ren, H.; Chen, J.; Wang, H.; He, Y.; Fang, X.; Wang, L. Analysis of the Temporal and Spatial Evolution Behavior of Earth Pressure in the Shield Chamber and the Ground Settlement Behavior during Shield Tunneling in Water-Rich Sand Layers. Buildings 2025, 15, 2935. [Google Scholar] [CrossRef]
- Samadi, H.; Hassanpour, J.; Rostami, J. Prediction of Earth Pressure Balance for EPB-TBM Using Machine Learning Algorithms. Int. J. Geo-Eng. 2023, 14, 21. [Google Scholar] [CrossRef]
- Wang, W.; Feng, H.; Li, Y.; You, Q.; Zhou, X. Research on Prediction of EPB Shield Tunneling Parameters Based on LGBM. Buildings 2024, 14, 820. [Google Scholar] [CrossRef]
- Xu, C.; Cao, B.T.; Yuan, Y.; Meschke, G. A Multi-Fidelity Deep Operator Network (DeepONet) for Fusing Simulation and Monitoring Data: Application to Real-Time Settlement Prediction during Tunnel Construction. Eng. Appl. Artif. Intell. 2024, 133, 108156. [Google Scholar] [CrossRef]
- Gou, C.; Luo, Y.; Zhang, Y.; Wang, X.; Yu, H.; Zhang, Y. Chamber Pressure Prediction and Parameter Optimization for Earth Pressure Balance Shields Based on SSA-RF and PSO. Appl. Sci. 2026, 16, 6834. [Google Scholar] [CrossRef]
- Gunduz, M.; Naji, K.K.; Mohamed, A.; Khan, O. Exploratory Data Analysis and Interpretable Machine Learning for Anomaly Detection in Epb Tunnel Boring Machine Operations. Front. Built Environ. 2026, 12, 1844340. [Google Scholar] [CrossRef]
- Schößer, B.; Lavasan, A.A.; Baille, W.; Barciaga, T.; Freimann, S.; Galli, M.; Kube, S.; Mianji, P.; Saberi, P.; Schröer, M.; et al. Face Support, Soil Conditioning and Material Transport in Earth-Pressure-Balance and Hydro Shield Machines. In Interaction Modeling in Mechanized Tunneling; Meschke, G., Breitenbücher, R., Freitag, S., König, M., Thewes, M., Eds.; Springer Nature: Cham, Switzerland, 2023; Volume 18, pp. 165–252. [Google Scholar]
- Yao, Q.; Tian, Z.; Gong, Q.; Zhang, R.; Shi, N. Investigation on Optimal Soil Chamber Pressure Settings for EPB Shield Machines in Sandy Cobble Strata with Insights from Gravel Flow Characteristics. KSCE J. Civ. Eng. 2025, 29, 100248. [Google Scholar] [CrossRef]
- Samimi Namin, F.; Refahi, A.; Sheykhi, A. Modeling Excavation Chamber of EPB Tunnel Boring Machine by Discrete Element Method. AUT J. Civ. Eng. 2025, 9, 65–76. [Google Scholar] [CrossRef]
- Yao, Y.; Fang, Y.; He, C.; Xu, G.; Yao, Z.; Hu, X. Spatial Motion Patterns and Force Transmission Characteristics of Muck Particles in EPB Shield Tunneling: An FDM–DEM Coupling Analysis. Undergr. Space 2025, 25, 132–155. [Google Scholar] [CrossRef]
- Hwang, B.; Bae, A.; Lim, K.; Kim, H.; Choi, H. Laboratory Experiments on Rheological Properties of Foam-Conditioned Weathered Granite Soil. In Proceedings of the 18th Conference of the Associated Research Centers for the Urban Underground Space; Wu, W., Leung, C.F., Zhou, Y., Li, X., Eds.; Springer Nature: Singapore, 2024; pp. 879–884. [Google Scholar]
- Jiang, Y.; Tang, X.; Zhu, B.; Zhou, K.; Pan, Y.; Xu, C. Research on Muck Conditioning for EPB Shield Tunnelling in Composite Formation. Sci. Rep. 2024, 14, 30936. [Google Scholar] [CrossRef] [PubMed]
- Wang, L.; Hu, J.; Zhu, W.; Min, F. Effects of Conditioning Agents on the Undrained Shear Response and Pore-Scale Behavior of Sand for EPB Shield Tunneling. Appl. Sci. 2026, 16, 531. [Google Scholar] [CrossRef]
- Guo, H.; Zhang, G.; Wu, Z.; Wang, J. The Control of Shield Tunnel Construction-Induced Ground Settlement Based on an Optimized Gap Parameter Theory and Three-Dimensional Finite Element Analysis. Buildings 2025, 15, 1578. [Google Scholar] [CrossRef]
- Shi, J.-K.; Zhang, J.-Z.; Zhao, S.; Guan, Z.-C.; Huang, H.-W. Probabilistic Analysis of Ground Surface Settlement Induced by Super Large Diameter Shield Tunneling Based on 3D Random Finite Element Method. Comput. Geotech. 2025, 181, 107111. [Google Scholar] [CrossRef]
- Wang, H.-B.; Zhang, R.-J.; Tao, F.-J.; Zheng, J.-J. Study on Long-Term Surface Settlement Induced by Shield Tunneling in under-Consolidated Soft Ground. Tunn. Undergr. Space Technol. 2024, 148, 105772. [Google Scholar] [CrossRef]
- Guo, C.; Liu, G.; Wang, X.; Zhang, X.; Du, X. CFD-DEM Coupling Analysis of EPB Screw Conveyor Muck Discharge in Water-Rich Sandy Cobble Strata. Sci. Rep. 2026, 16, 12407. [Google Scholar] [CrossRef] [PubMed]
- Lee, H.; Kim, H.K.; Hwang, B.; Yoon, Y.; Choi, H. Coupled DEM-FDM Numerical Model for EPB Shield Tunnelling Simulation with Foam Conditioning. Tunn. Undergr. Space Technol. 2024, 147, 105718. [Google Scholar] [CrossRef]
- Wang, J.; Tian, N.; Lin, G.; Feng, K.; Xie, H. Face Failure of Deep EPB Shield Tunnels in Dry Graded Cobble-Rich Soil: A DEM Study. Tunn. Undergr. Space Technol. 2024, 147, 105622. [Google Scholar] [CrossRef]
- Shen, X.; Yuan, D.; Jin, D.; Chen, X.; Luo, W.; Peng, Y.; Duan, K. Model Test on Cutterhead-Soil Interaction during Shield Tunneling and Its Theoretical Model. Undergr. Space 2025, 20, 46–68. [Google Scholar] [CrossRef]
- Yang, Z.; Shao, X.; Liu, Z.; Bai, Z.; Jiang, Y. Optimization and Field Validation of Soil Conditioning Scheme for EPB Shield Tunneling in Cobble–Boulder Stratum: Case Study on Beijing Metro Line 16. Buildings 2025, 15, 4429. [Google Scholar] [CrossRef]
- Li, P.; Cui, X.; Wei, Y.; Xia, J.; Wang, X. Calibration Method of Mesoscopic Parameter in Sandy Cobble Soil Triaxial Test Based on PFC3D. Front. Struct. Civ. Eng. 2023, 17, 1924–1933. [Google Scholar] [CrossRef]
- Zeng, R.; Wang, S.; Zhang, Y.; Qu, T. CFD-DEM Modeling of Seepage in Foam-Conditioned Soil. Comput. Geotech. 2025, 177, 106818. [Google Scholar] [CrossRef]
- Rong, X.; Gao, L.; Han, A.; Wu, J.; Wu, X.; Jiang, G. Analysis of Ground Volume Loss for EPB Shield Tunneling in Thick Silty Clay Layer. Alex. Eng. J. 2024, 96, 295–302. [Google Scholar] [CrossRef]
- Jin, D.; Jin, H.; Yuan, D.; Zuo, Z. Mechanism of Slag Discharge Failures in Earth Pressure Balance Shield Screw Conveyor: A Theoretical Model-Based Investigation. Tunn. Undergr. Space Technol. 2024, 153, 105997. [Google Scholar] [CrossRef]
- Wang, X.; Zhao, W.; Bai, Q.; Sun, D.; Wang, Y.; Li, J. Effect of Bentonite Slurry on Muck Discharge Performance of EPB Shield Screw Conveyor. Tunn. Undergr. Space Technol. 2026, 173, 107618. [Google Scholar] [CrossRef]
- Zhang, J.; Kou, L.; Wang, J.; Xu, J. Load Model for Shield Tunneling in Composite Strata Considering Mud Build-up Effects. Tunn. Undergr. Space Technol. 2025, 165, 106918. [Google Scholar] [CrossRef]
- Zhuo, B.; Fang, Y.; Dou, L.; Liu, X.; Zhu, M.; Hu, X. An Experimental and Theoretical Research on Shield Screw Conveyor Discharging Efficiency in Moderately Weathered Mudstone Strata and Its Influence on Clogging. Soils Found. 2025, 65, 101675. [Google Scholar] [CrossRef]
- Li, X.; Kouretzis, G.; Thoeni, K. Enhanced Calibration of Discrete Element Models for Soil-Structure Interaction Problems. Comput. Geotech. 2025, 188, 107539. [Google Scholar] [CrossRef]
- Pourandi, S.; van der Sande, P.C.; Ostanin, I.; Weinhart, T. Calibration of a DEM Contact Model for Wet Industrial Granular Materials. Powder Technol. 2026, 476, 122404. [Google Scholar] [CrossRef]
- Maeda, M.; Kushiyama, K. Use of Compact Shield Tunneling Method in Urban Underground Construction. Tunn. Undergr. Space Technol. 2005, 20, 159–166. [Google Scholar] [CrossRef]
- Wang, R.; Wang, Y.; Yan, B.; Yoshitake, I.; Ding, B. Three-Dimensional Numerical Simulation Method for Shield Grouting Based on DEM-FDM Coupling and Inlet Module. Tunn. Undergr. Space Technol. 2025, 165, 106858. [Google Scholar] [CrossRef]
- Liu, Y.; Lei, H.; Huang, H.; Li, Q. Finite-Discrete Element Numerical Modeling on Shield Tunnel Face Stability Undercrossing Existing Pipeline Considering Discontinuous Contact. Sci. Rep. 2025, 15, 34616. [Google Scholar] [CrossRef] [PubMed]
- Yang, B.; Zhang, S.; Deng, Z.; Su, N.; Chen, S.; Zhu, D. Macro–Mesoscopic Analysis and Parameter Calibration of Rock–Soil Strength Degradation under Different Water Contents. Appl. Sci. 2025, 15, 10254. [Google Scholar] [CrossRef]
Figure 1.
Schematic diagram of soil compression by cutterhead.
Figure 1.
Schematic diagram of soil compression by cutterhead.
Figure 2.
Developed schematic of soil compression volume by cutterhead.
Figure 2.
Developed schematic of soil compression volume by cutterhead.
Figure 3.
Schematic diagram of shield thrust components.
Figure 3.
Schematic diagram of shield thrust components.
Figure 4.
Simplified geological profile of the study section.
Figure 4.
Simplified geological profile of the study section.
Figure 5.
Triaxial test calibration procedure.
Figure 5.
Triaxial test calibration procedure.
Figure 6.
Calibration results of triaxial test.
Figure 6.
Calibration results of triaxial test.
Figure 7.
Soil conditioning test procedure.
Figure 7.
Soil conditioning test procedure.
Figure 8.
Slump test results of discrete element model.
Figure 8.
Slump test results of discrete element model.
Figure 9.
Schematic diagram of the linear contact bonding model.
Figure 9.
Schematic diagram of the linear contact bonding model.
Figure 10.
Numerical model of shield tunneling.
Figure 10.
Numerical model of shield tunneling.
Figure 11.
Measurement circle distribution diagram.
Figure 11.
Measurement circle distribution diagram.
Figure 12.
The schematic diagram of monitoring line layout.
Figure 12.
The schematic diagram of monitoring line layout.
Figure 13.
Chamber pressure variation under different tunneling speeds.
Figure 13.
Chamber pressure variation under different tunneling speeds.
Figure 14.
Chamber pressure under different tunneling speeds. (a) Chamber pressure at the center part. (b) Chamber pressure at the sidewall.
Figure 14.
Chamber pressure under different tunneling speeds. (a) Chamber pressure at the center part. (b) Chamber pressure at the sidewall.
Figure 15.
Ground settlement variation under different tunneling speeds.
Figure 15.
Ground settlement variation under different tunneling speeds.
Figure 16.
Surface settlement under different tunneling speeds.
Figure 16.
Surface settlement under different tunneling speeds.
Figure 17.
Chamber pressure variation under different screw conveyor speeds.
Figure 17.
Chamber pressure variation under different screw conveyor speeds.
Figure 18.
Chamber pressure under different screw conveyor speeds. (a) Chamber pressure at the central part. (b) Chamber pressure at the sidewall.
Figure 18.
Chamber pressure under different screw conveyor speeds. (a) Chamber pressure at the central part. (b) Chamber pressure at the sidewall.
Figure 19.
Ground settlement variation under different screw conveyor speeds.
Figure 19.
Ground settlement variation under different screw conveyor speeds.
Figure 20.
Surface settlement under different screw conveyor speeds.
Figure 20.
Surface settlement under different screw conveyor speeds.
Figure 21.
Chamber pressure variation under different cutterhead speeds.
Figure 21.
Chamber pressure variation under different cutterhead speeds.
Figure 22.
Chamber pressure under different cutterhead speeds. (a) Chamber pressure at the central part. (b) Chamber pressure at the sidewall.
Figure 22.
Chamber pressure under different cutterhead speeds. (a) Chamber pressure at the central part. (b) Chamber pressure at the sidewall.
Figure 23.
Ground settlement variation under different cutterhead speeds.
Figure 23.
Ground settlement variation under different cutterhead speeds.
Figure 24.
Surface settlement under different cutterhead speeds.
Figure 24.
Surface settlement under different cutterhead speeds.
Table 1.
Mechanism contribution analysis of chamber-pressure variation.
Table 1.
Mechanism contribution analysis of chamber-pressure variation.
| Mechanism | Corresponding Term | Influencing Parameters | Contribution to Chamber Pressure |
|---|
| Excavation–discharge balance mechanism | Volume imbalance-induced
deformation | Tunneling speed, screw conveyor speed, soil conditioning | Pressure accumulation and release |
| Cutterhead squeezing mechanism | Cutterhead-induced
compression deformation | Cutterhead speed, cutterhead
structure, opening ratio | Additional compression pressure |
| Deformation–pressure conversion mechanism | Equivalent stiffness K
and transfer coefficient α | Soil stiffness, boundary restraint,
pressure transfer condition | Pressure response
magnitude |
Table 2.
Parameters of the FLAC3D stratum model.
Table 2.
Parameters of the FLAC3D stratum model.
Stratum
ID | Stratum Name | Density
(g/cm3) | Compression
Modulus
(MPa) | Internal
Friction
Angle (°) | Cohesion
(kPa) | Poisson’s
Ratio | Depth (m) |
|---|
| A1 | Miscellaneous fill①2 | 1.70 | - | 10 | 8 | - | 0~3 |
| A2 | Silty Clay⑦1 | 1.97 | 5.1 | 29 | 6 | 0.30 | 3~11 |
| A3 | Silty Clay⑩1 | 1.99 | 5.9 | 32 | 8 | 0.29 | 11~28.5 |
| A4 | Silty Clay⑭1 | 1.97 | 6.6 | 34 | 6 | 0.29 | 28.5~45 |
Table 3.
Tunneling speed parameter settings.
Table 3.
Tunneling speed parameter settings.
Working
Condition | Tunneling Speed
(mm/min) | Cutterhead Speed (rpm) | Screw Conveyor Speed
(rpm) |
|---|
| 1 | 60 | 2 | 15 |
| 2 | 80 | 2 | 15 |
| 3 | 100 | 2 | 15 |
Table 4.
Screw conveyor speed parameter settings.
Table 4.
Screw conveyor speed parameter settings.
Working
Condition | Tunneling Speed
(mm/min) | Cutterhead Speed (rpm) | Screw Conveyor Speed
(rpm) |
|---|
| 1 | 80 | 2 | 10 |
| 2 | 80 | 2 | 15 |
| 3 | 80 | 2 | 20 |
Table 5.
Cutterhead speed parameter settings.
Table 5.
Cutterhead speed parameter settings.
Working
Condition | Tunneling Speed
(mm/min) | Cutterhead Speed (rpm) | Screw Conveyor Speed
(rpm) |
|---|
| 1 | 80 | 1 | 15 |
| 2 | 80 | 2 | 15 |
| 3 | 80 | 3 | 15 |
Table 6.
Quantitative comparison of working conditions.
Table 6.
Quantitative comparison of working conditions.
Varied
Parameter | Parameter Value | Center
Pressure
(kPa) | Sidewall
Pressure
(kPa) | Maximum
Settlement
on Monitoring Line I
(cm) | Minimum
Settlement
on Monitoring Line I
(cm) | Maximum
Settlement
on Monitoring Line II
(cm) | Minimum
Settlement
on Monitoring Line II
(cm) |
|---|
| Tunneling speed | 60 mm/min | 39 | 91 | 4.69 | 0.55 | 5.28 | 0.25 |
| 80 mm/min | 47 | 95 | 4.52 | 0.43 | 5.04 | 0.17 |
| 100 mm/min | 53 | 106 | 4.41 | 0.32 | 4.81 | 0.10 |
Screw
conveyor speed | 10 rpm | 50 | 99 | 4.36 | 0.38 | 4.91 | 0.13 |
| 15 rpm | 48 | 95 | 4.52 | 0.43 | 5.04 | 0.17 |
| 20 rpm | 47 | 93 | 4.63 | 0.40 | 5.10 | 0.15 |
| Cutterhead speed | 1 rpm | 45 | 105 | 4.62 | 0.45 | 5.19 | 0.19 |
| 2 rpm | 47 | 119 | 4.52 | 0.43 | 5.04 | 0.17 |
| 3 rpm | 46 | 122 | 4.30 | 0.30 | 4.76 | 0.05 |
| Disclaimer/Publisher’s Note: The statements, opinions and data contained in all publications are solely those of the individual author(s) and contributor(s) and not of MDPI and/or the editor(s). MDPI and/or the editor(s) disclaim responsibility for any injury to people or property resulting from any ideas, methods, instructions or products referred to in the content. |