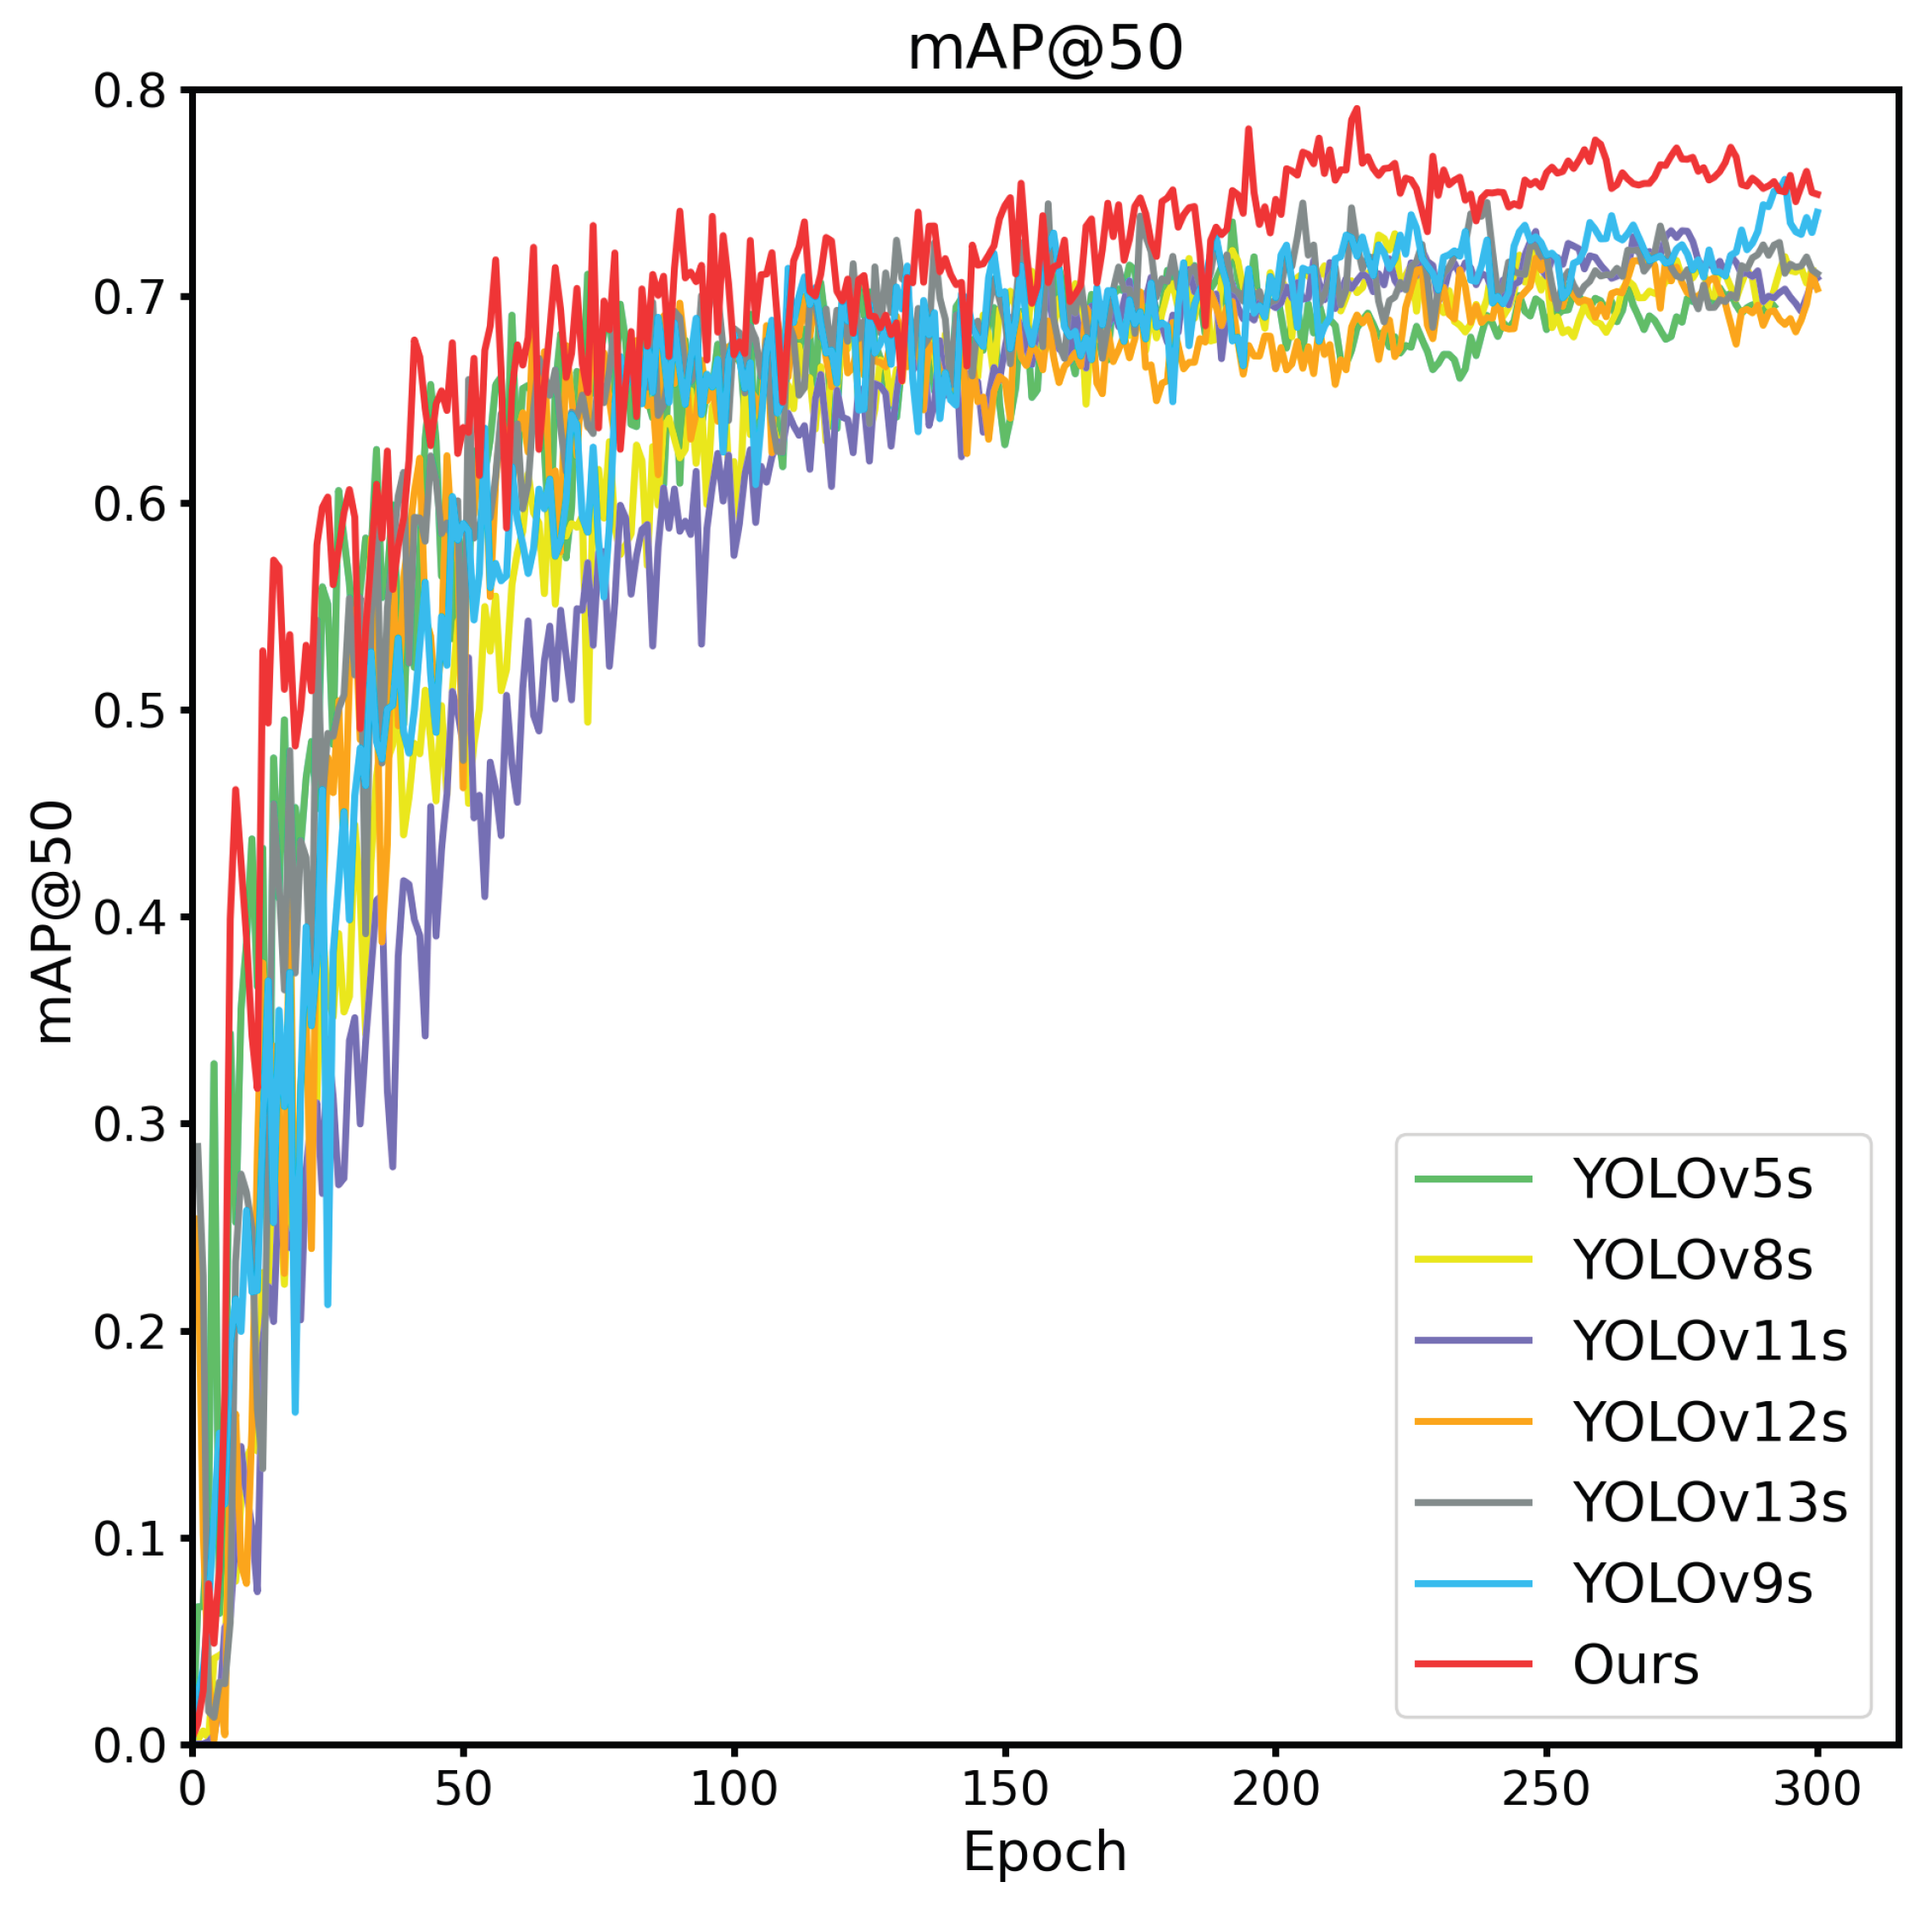
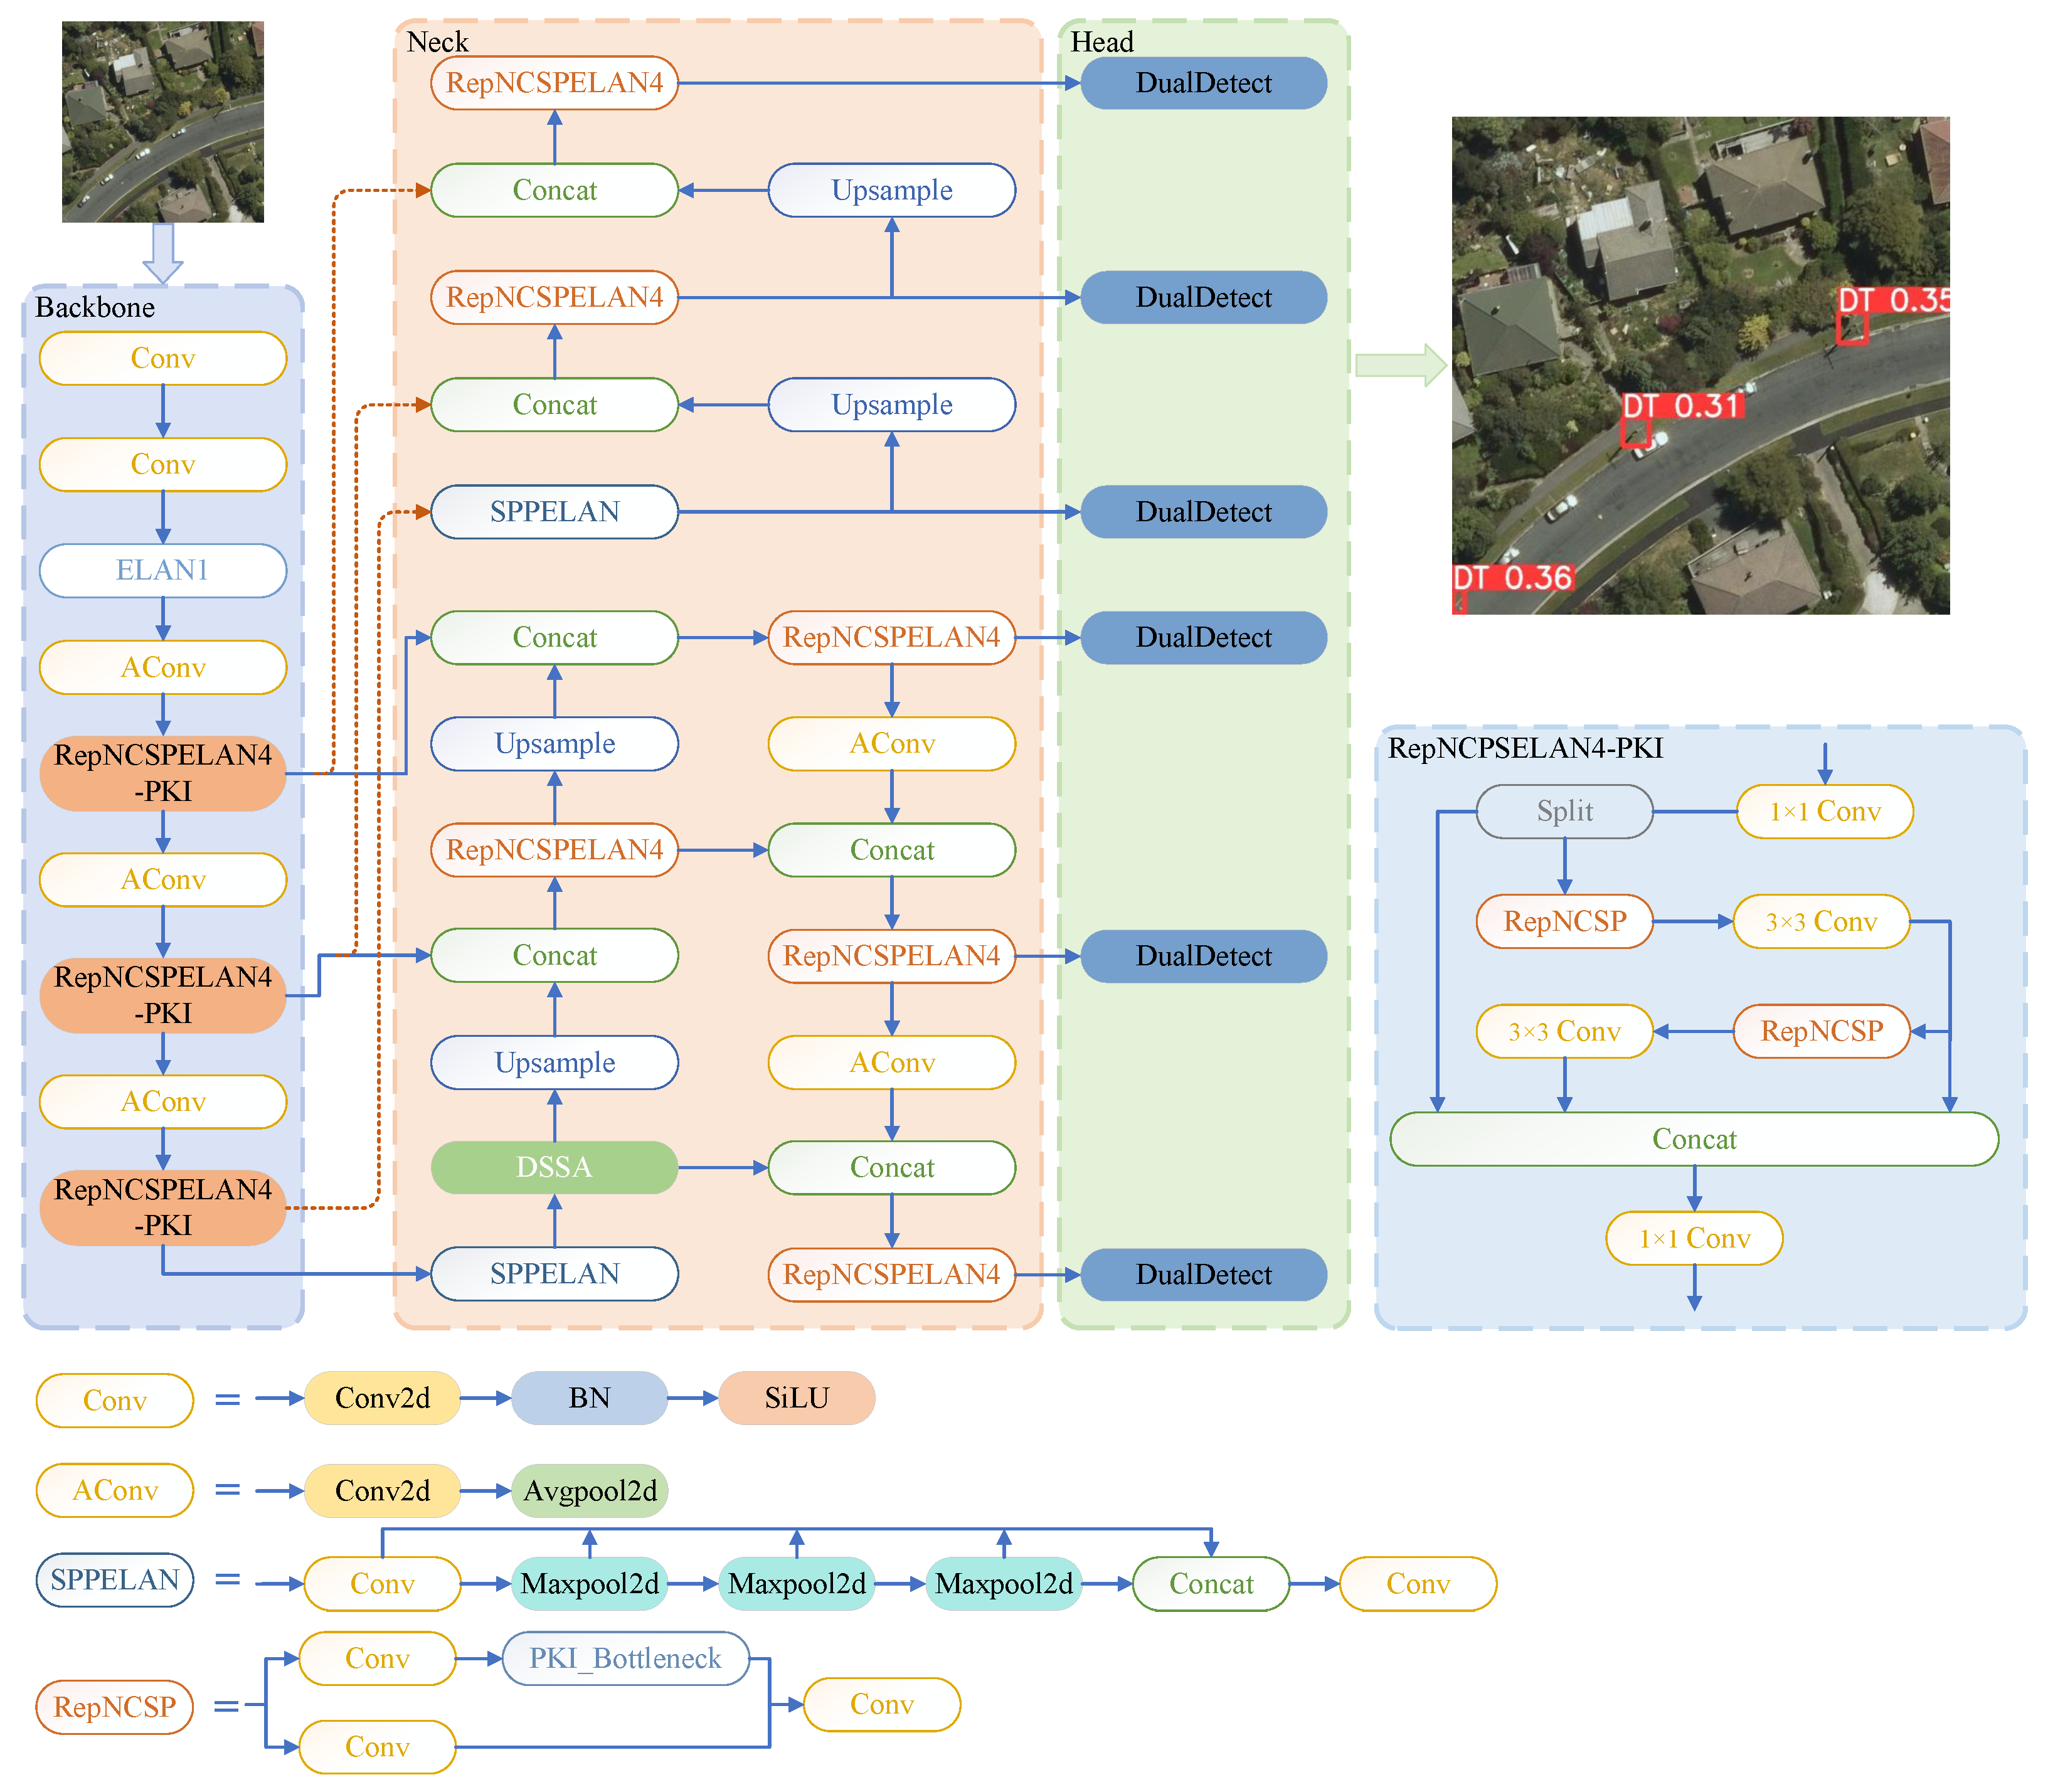
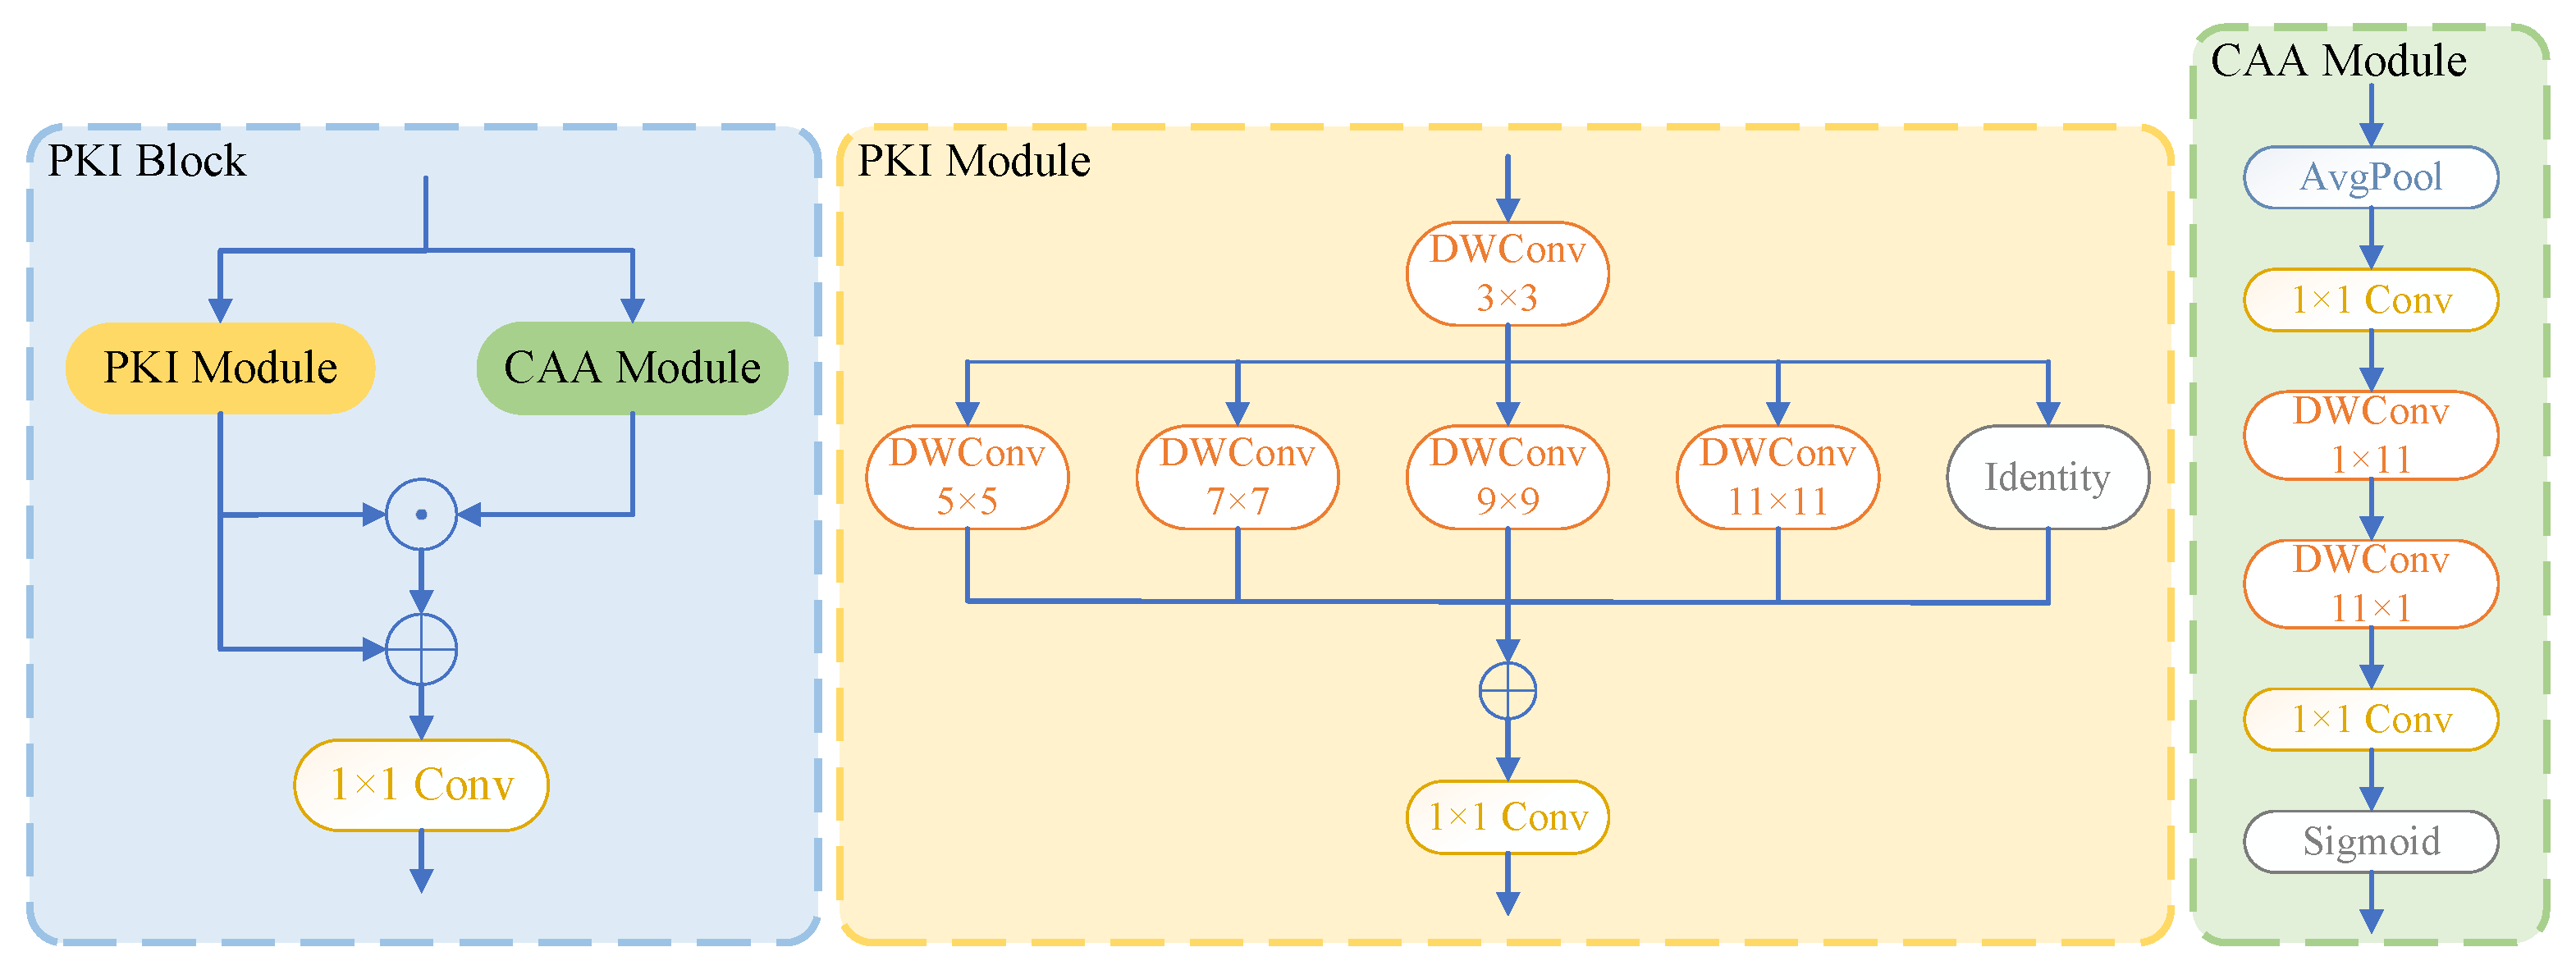
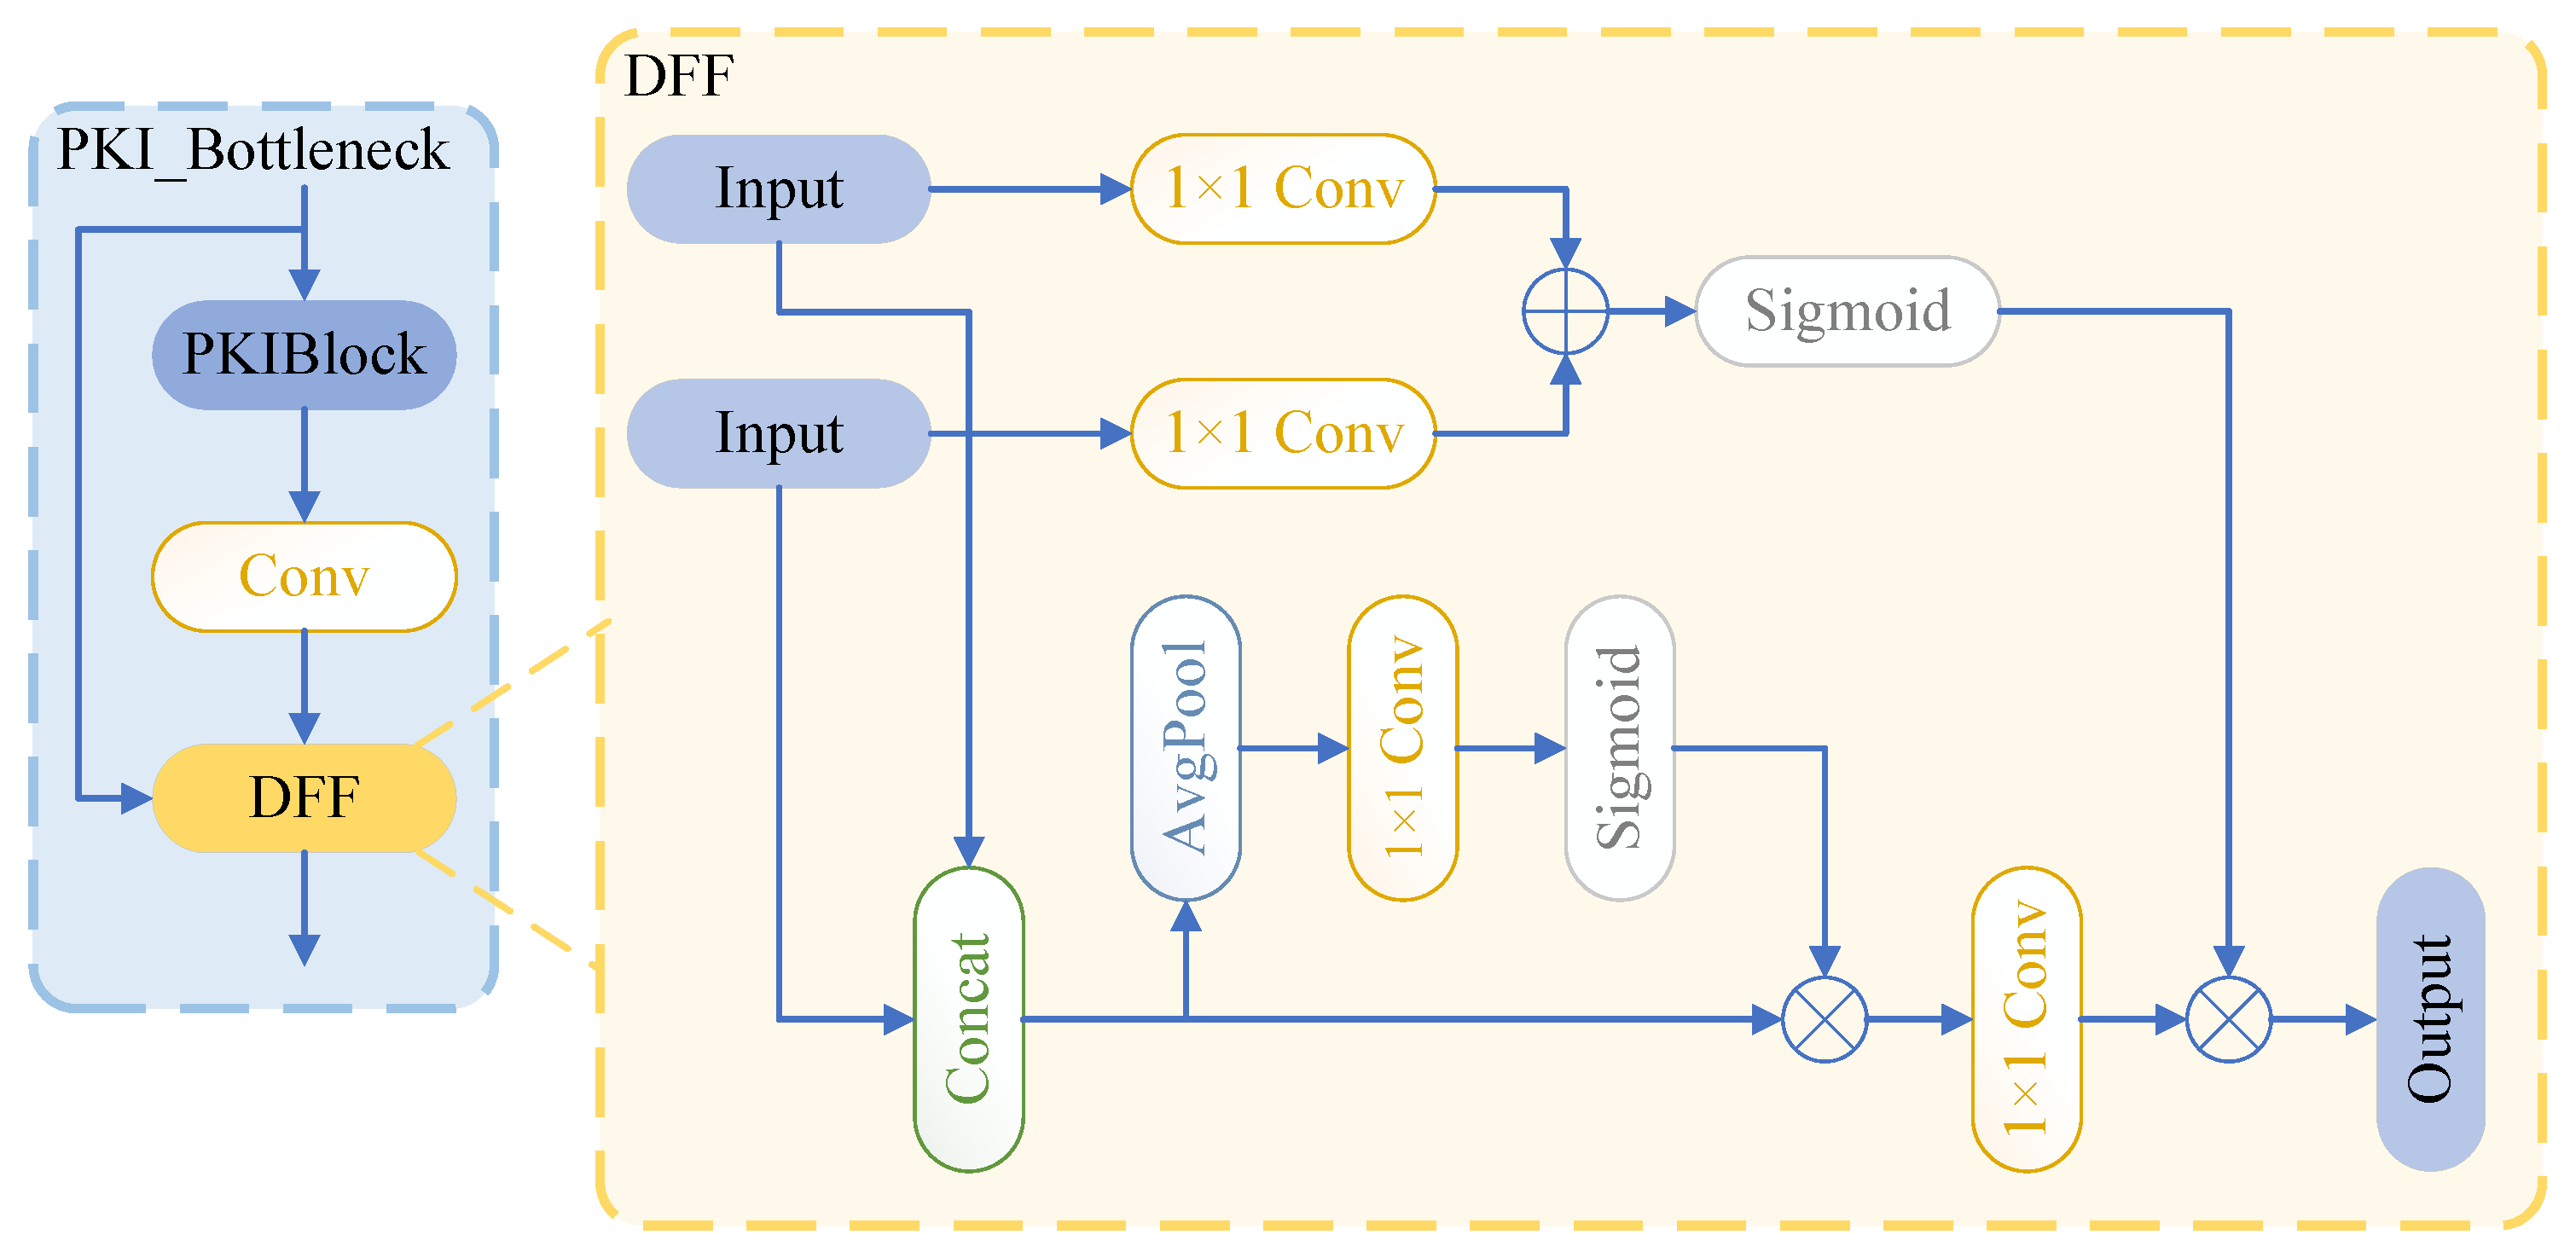
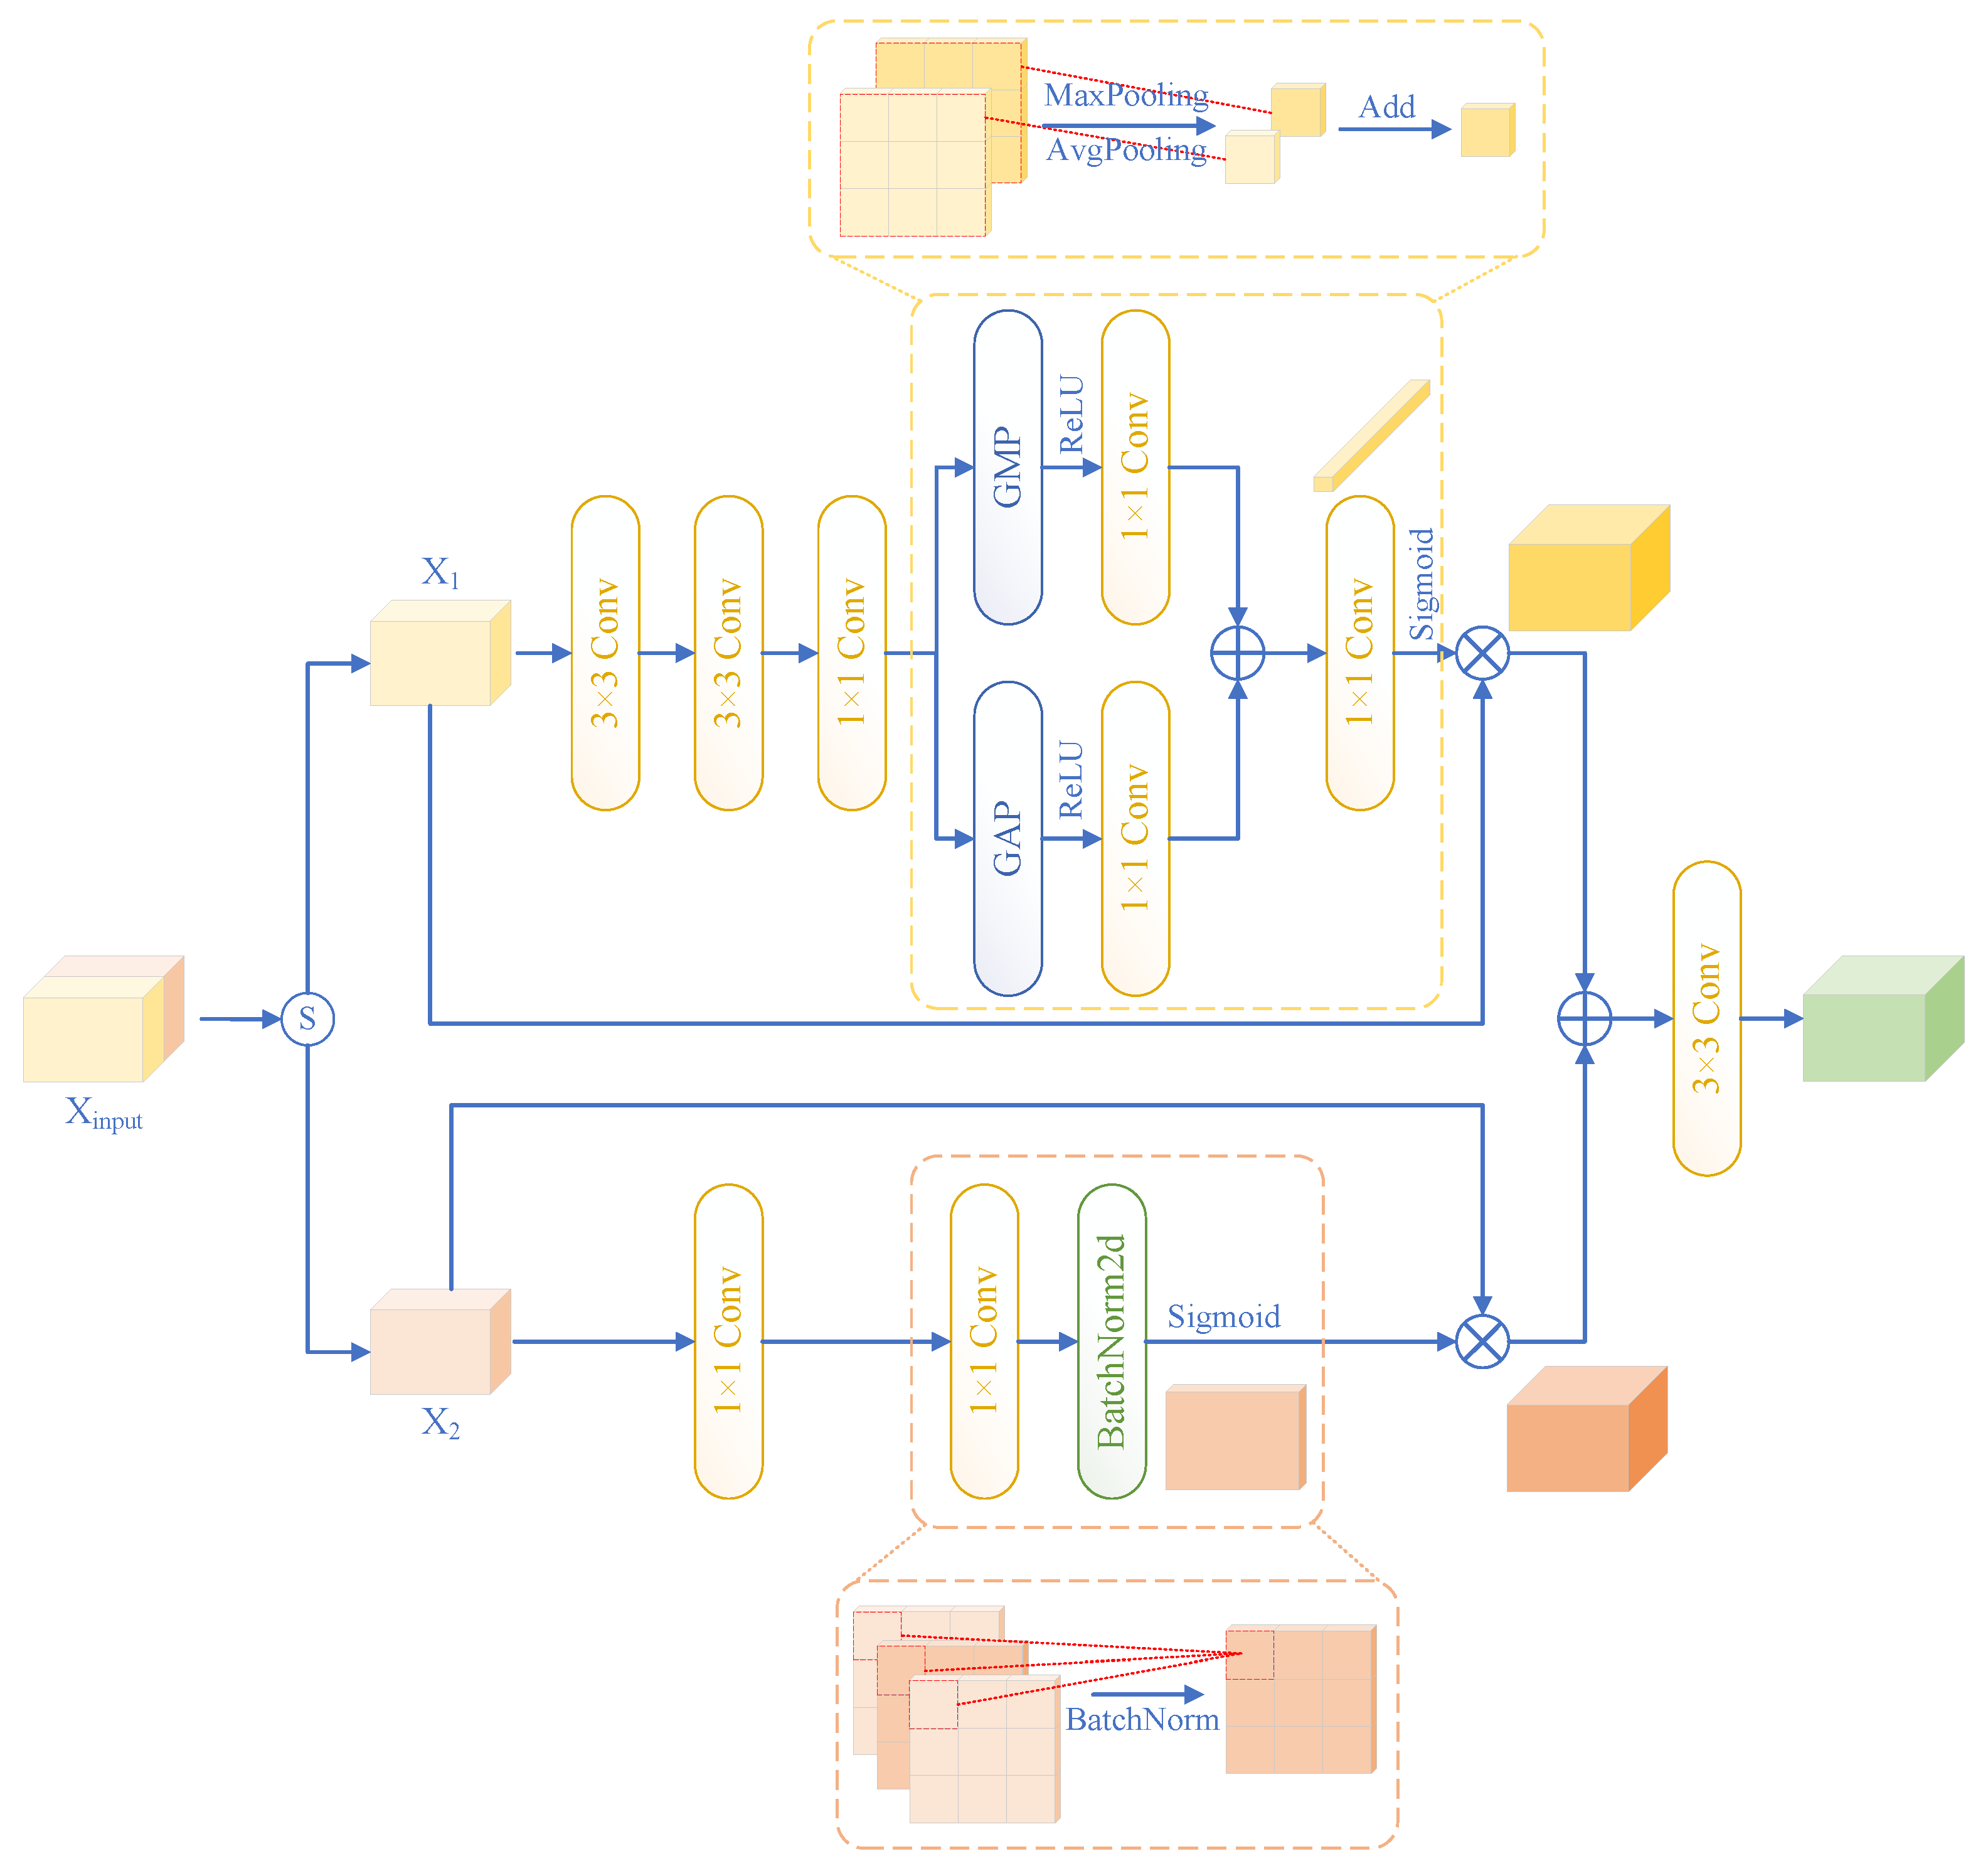
This section evaluates the detection capability of MS-YOLO for power tower identification in satellite remote sensing imagery through experimental analysis. We first describe the datasets used, followed by the experimental setup and parameters, as well as the selection of evaluation metrics. Next, we compare MS-YOLO with other mainstream detection methods, including robustness experiments and visualization experiments. Finally, this paper conducts ablation experiments to analyze the impact of individual modules, thereby validating the effectiveness of the proposed method.
4.1. Datasets and Training
Two datasets were employed in the experiments to comprehensively evaluate the effectiveness of the improved model. These two datasets are the Satellite Remote Sensing Power Tower Dataset (SRSPTD) [
29] and the Gao Fen Tower Dataset (GFTD) [
30].
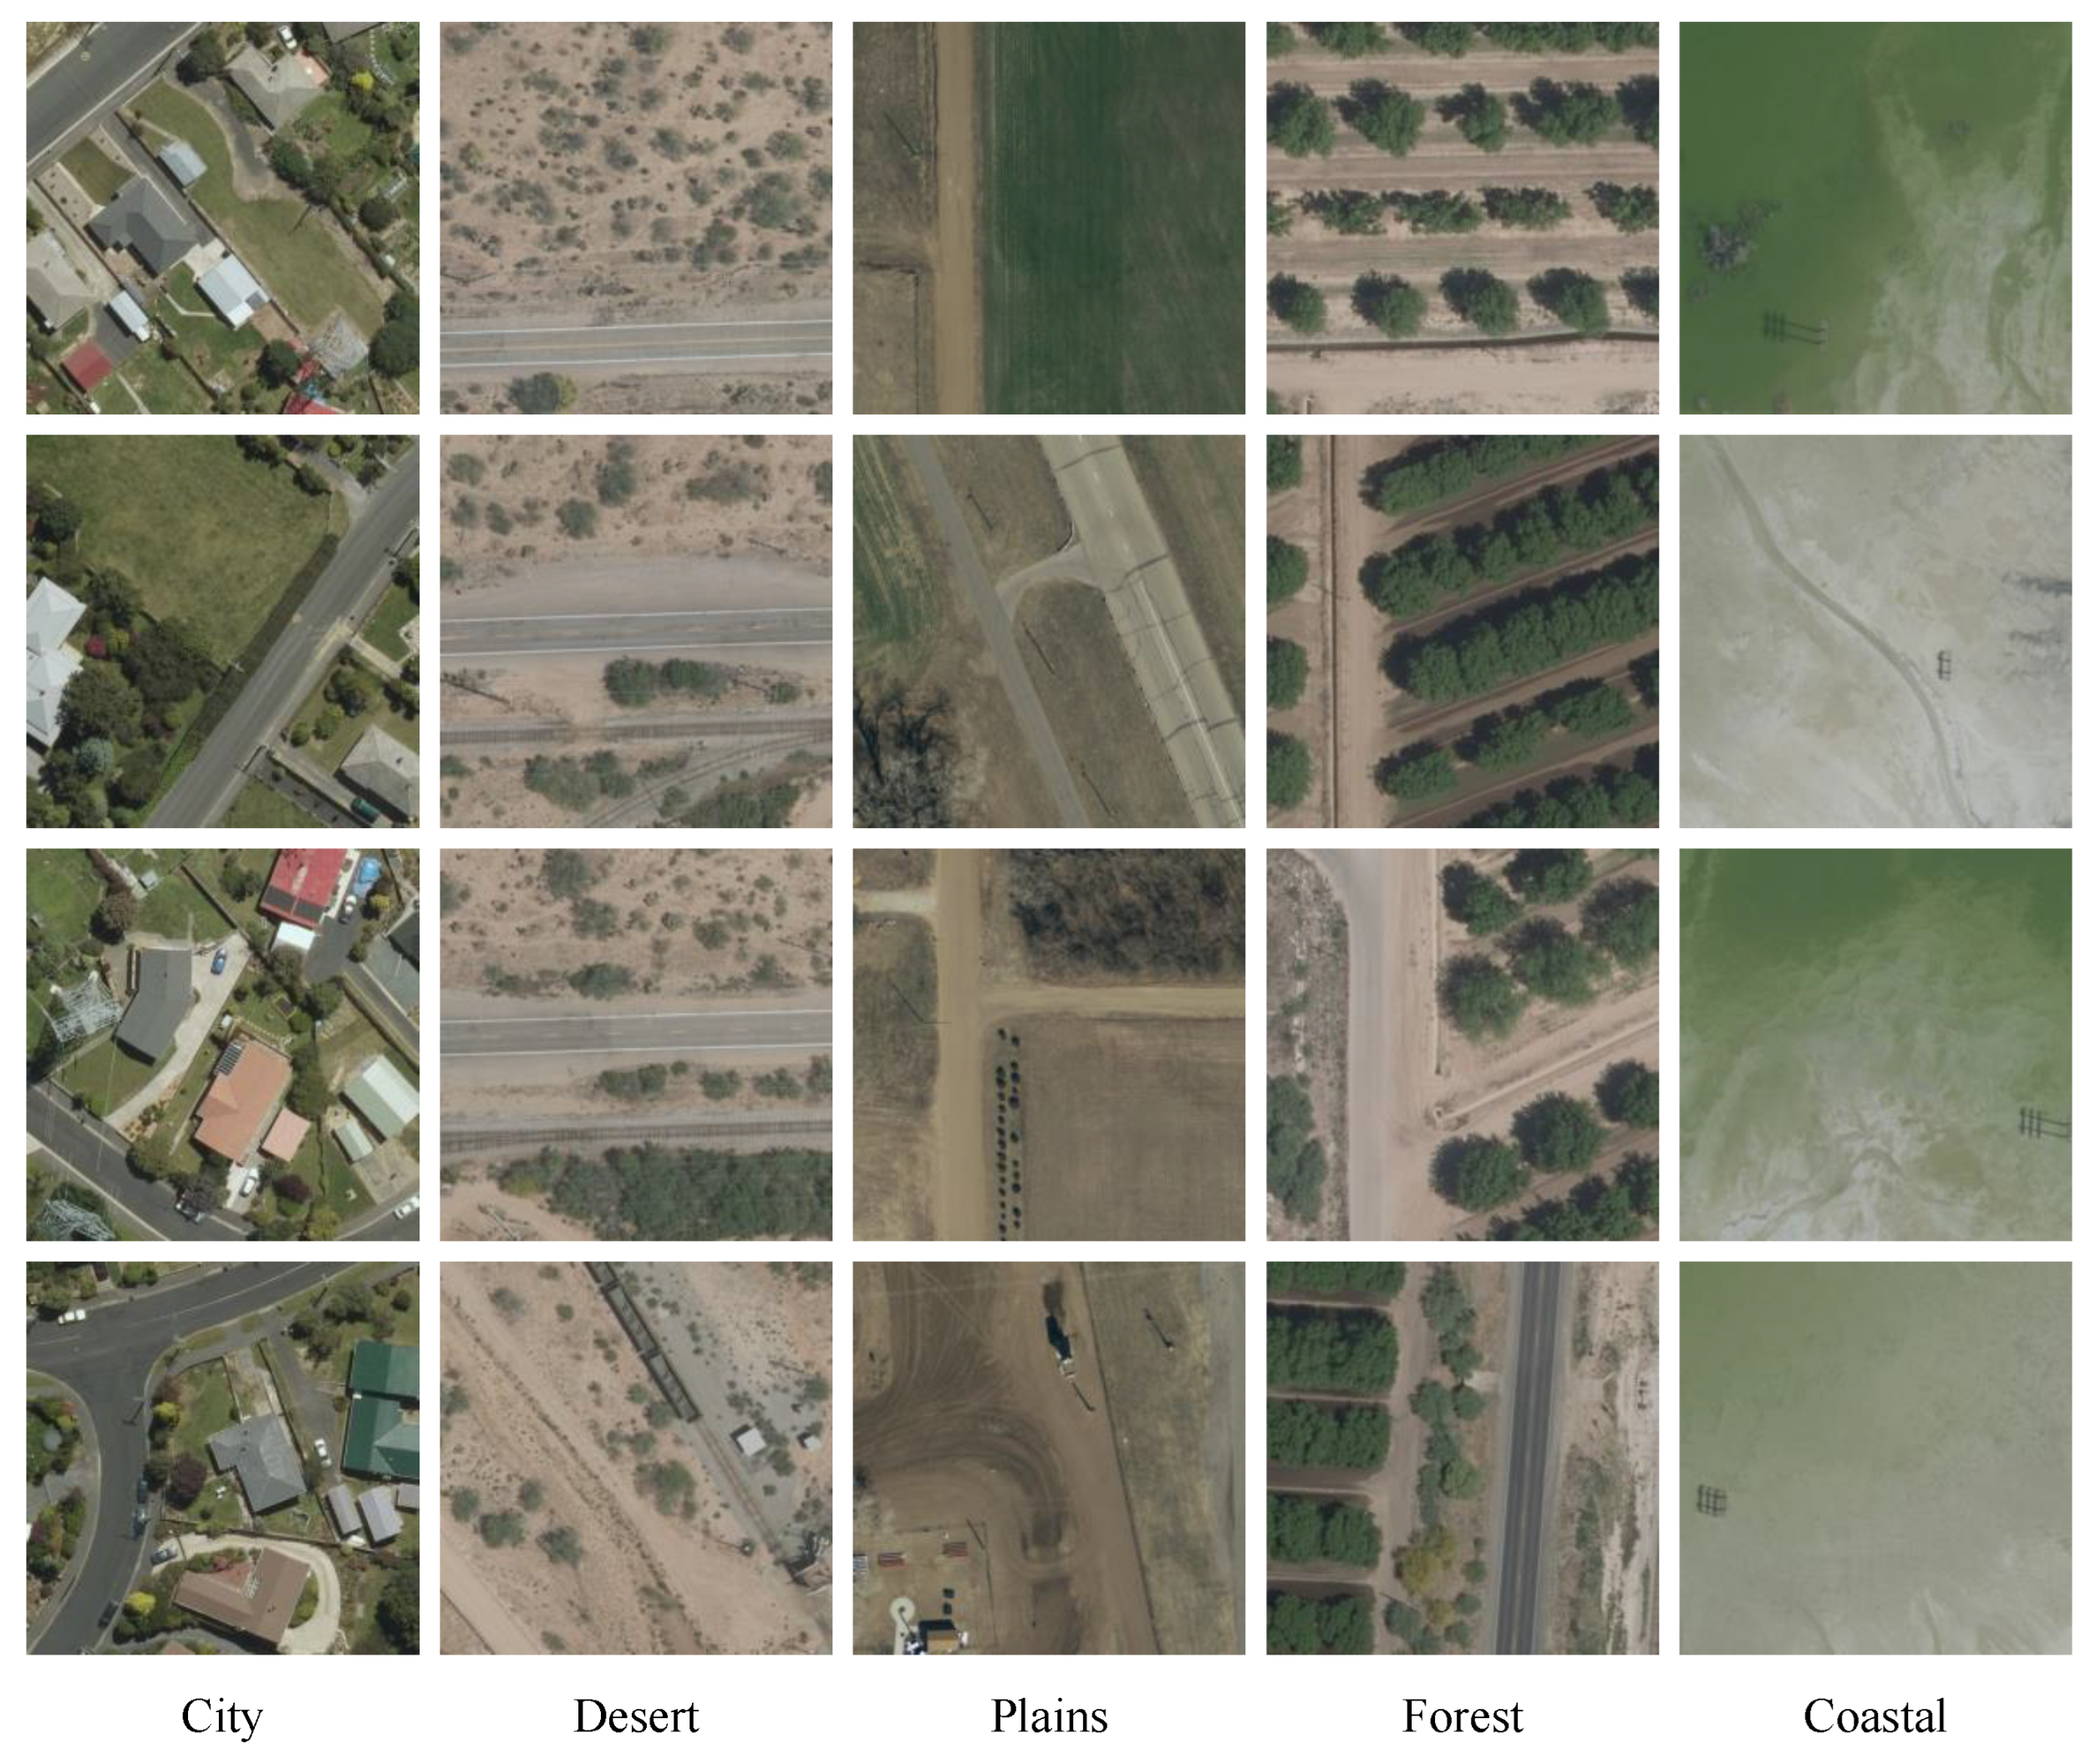
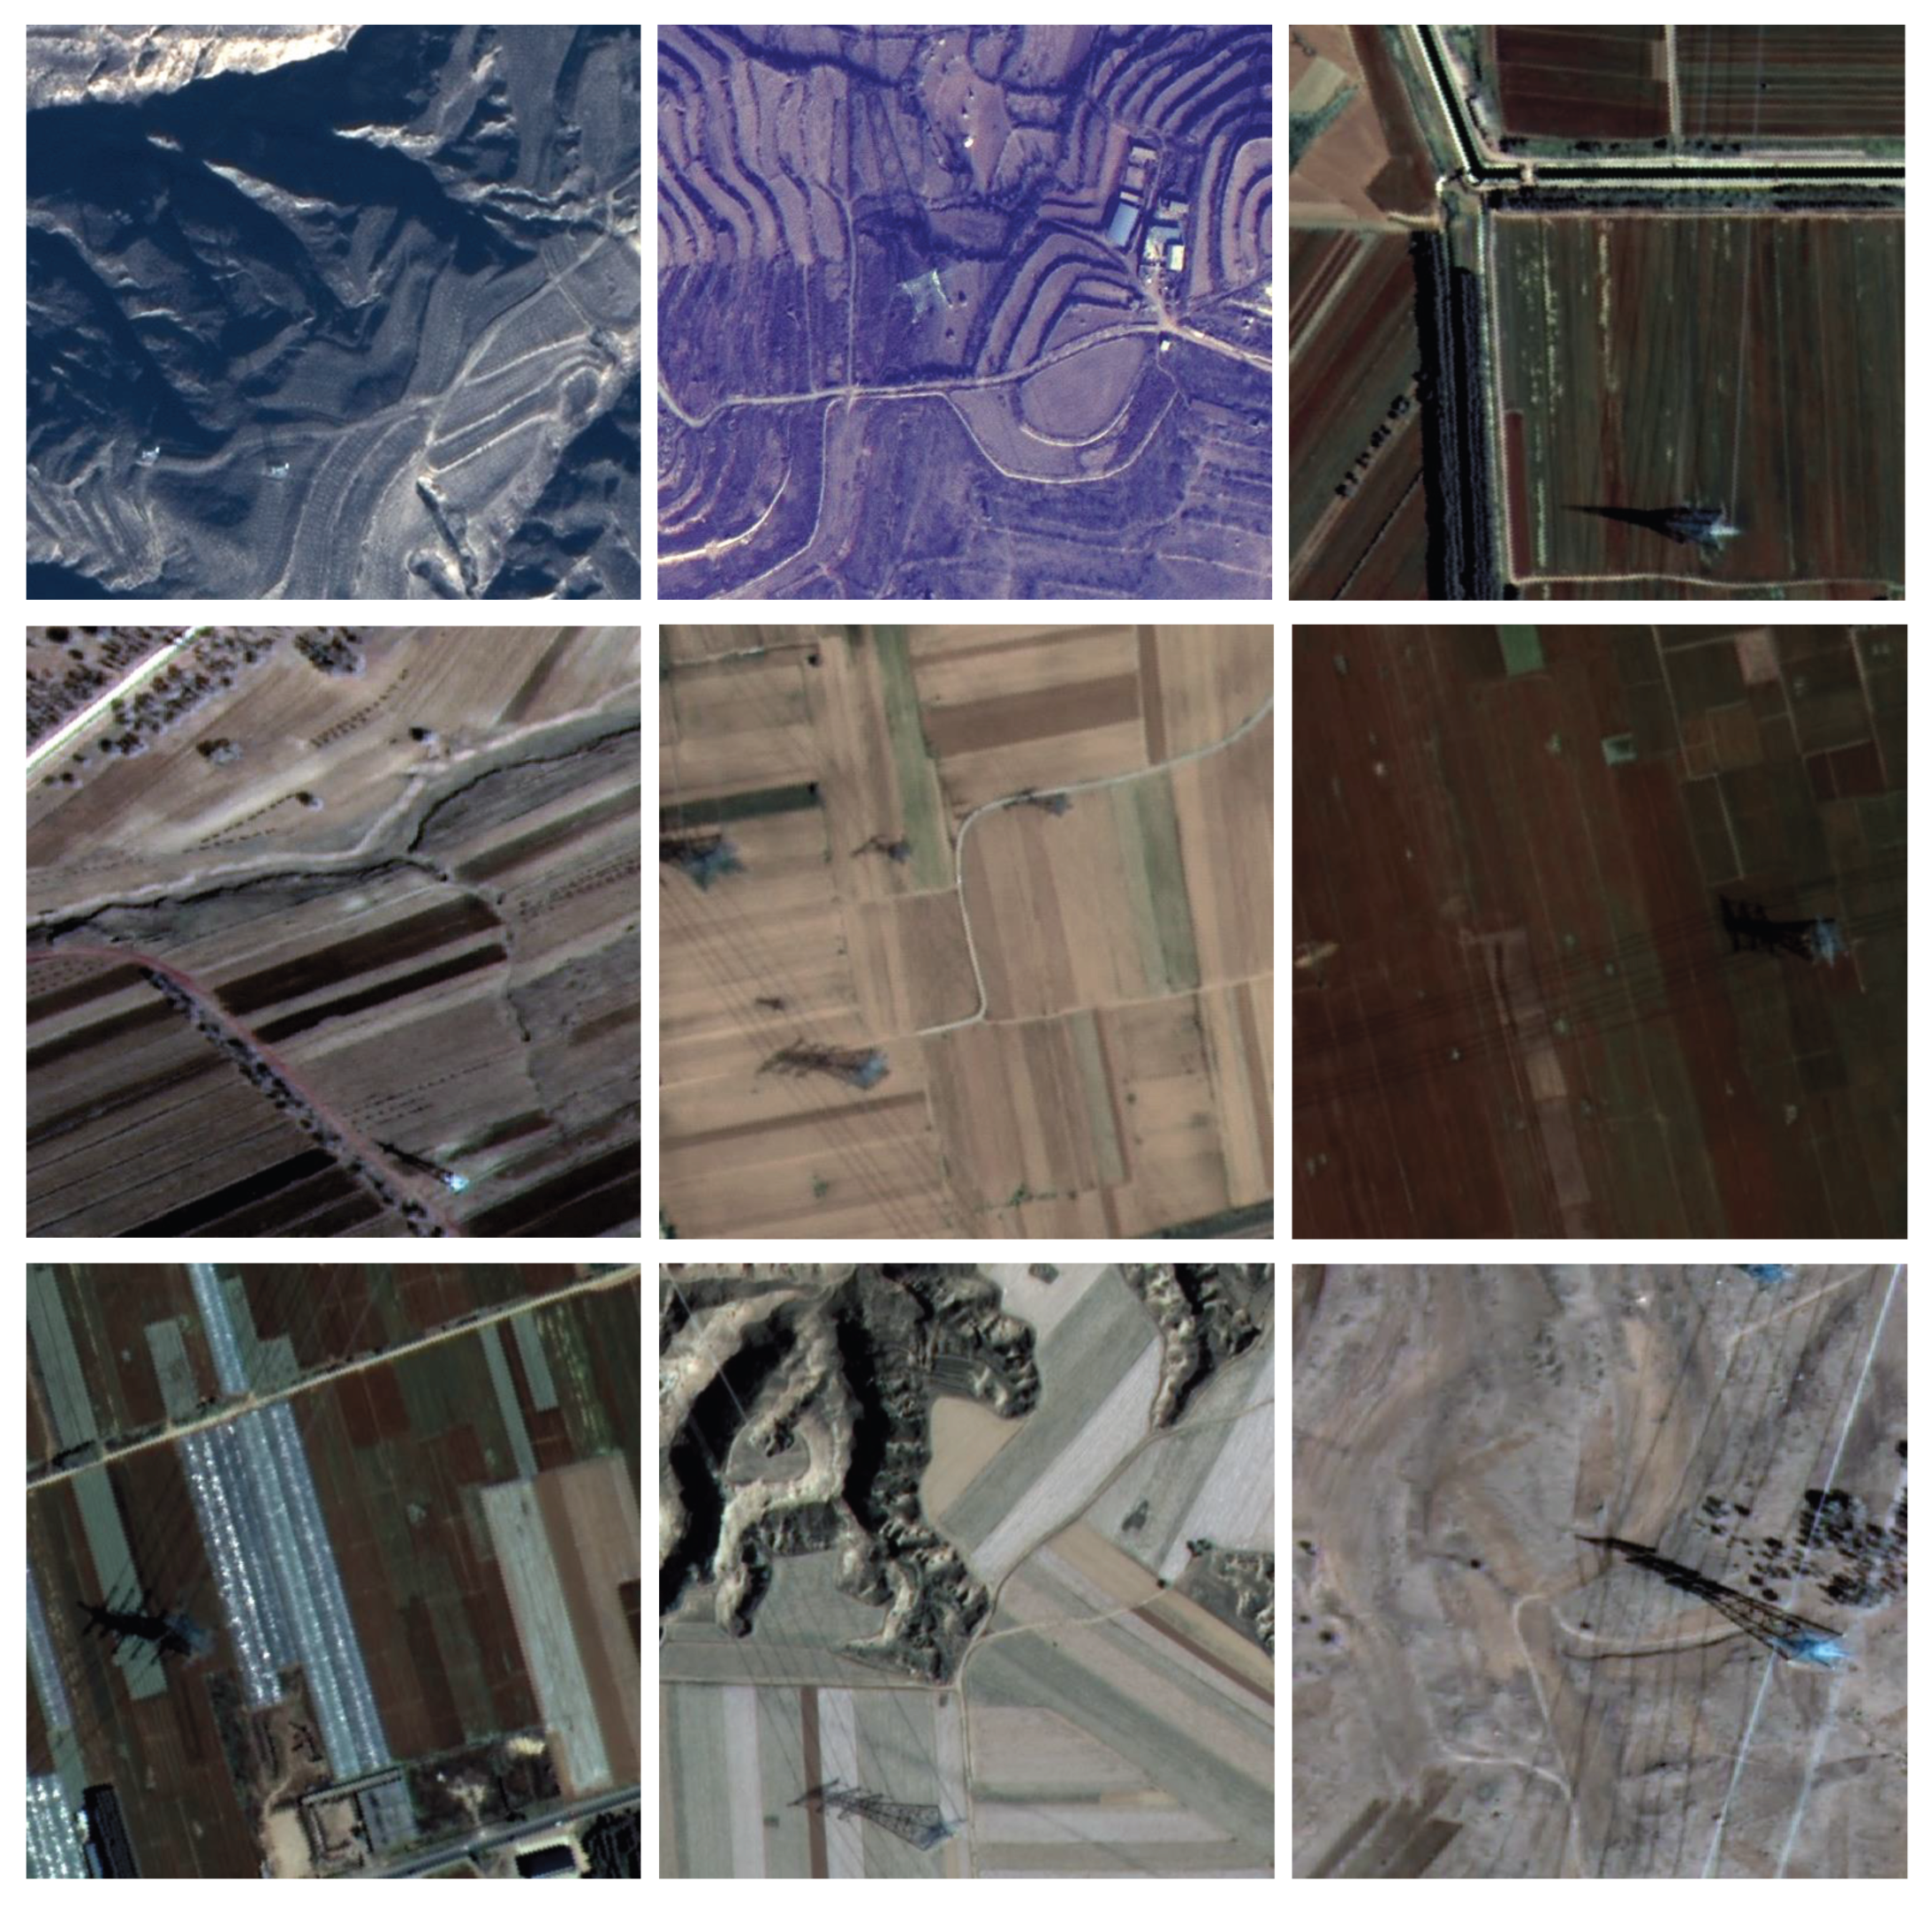
The SRSPTD dataset originates from images of distribution and transmission towers collected through the Bass Connections Project at Duke University. This dataset features extensive coverage, encompassing six representative regions: Arizona, Connecticut, Kansas, and North Carolina in the United States, as well as Tauranga and Dunedin in New Zealand. In terms of geographic and environmental characteristics, this dataset is highly diverse, covering four types of landform: desert, plain, forest, and coastal areas. It also spans three different population density regions: urban, suburban, and rural. Through preprocessing steps including filtering, cropping, and re-annotation, a satellite remote sensing power tower dataset comprising 2740 samples was ultimately constructed. The dataset contains two categories: distribution towers (DT) and transmission towers (TT), strictly divided in an 8:1:1 ratio. As shown in
Figure 6, the dataset contains power tower samples collected from different terrain backgrounds and population-density settings.
The GFTD dataset was constructed using satellite remote sensing images acquired by the GF-2 and GF-7 satellites. The selected images mainly cover three high-voltage transmission corridors, as illustrated in
Figure 7. The imagery was collected across the four seasons of 2023 and 2024 and includes six representative scene types: urban areas, coastal regions, deserts, plains, forests, and mountainous areas. Through the fusion of multispectral images with a spatial resolution of 4 m and panchromatic images with a spatial resolution of 1 m, 1-m-resolution images were generated and further cropped into patches of 512 × 512 pixels. Since the shadows of power towers usually present clear geometric characteristics that are strongly correlated with the tower structures, the resulting label should therefore be interpreted as a tower–shadow composite target rather than a tower-body-only target. A total of 3000 images were collected and subsequently allocated to the training, validation, and testing sets at proportions of 70%, 20%, and 10%, respectively.
It should be noted that the original large-scale satellite images were divided into non-overlapping square patches using regular grid partitioning rather than overlapping sliding-window cropping. Therefore, different patches do not share pixel regions, and each annotated tower instance is retained in only one patch. Exact duplicate images and duplicated tower instances were also checked across the training, validation, and test subsets. The resulting patches were randomly allocated according to the 8:1:1 ratio for SRSPTD and the 7:2:1 ratio for GFTD.
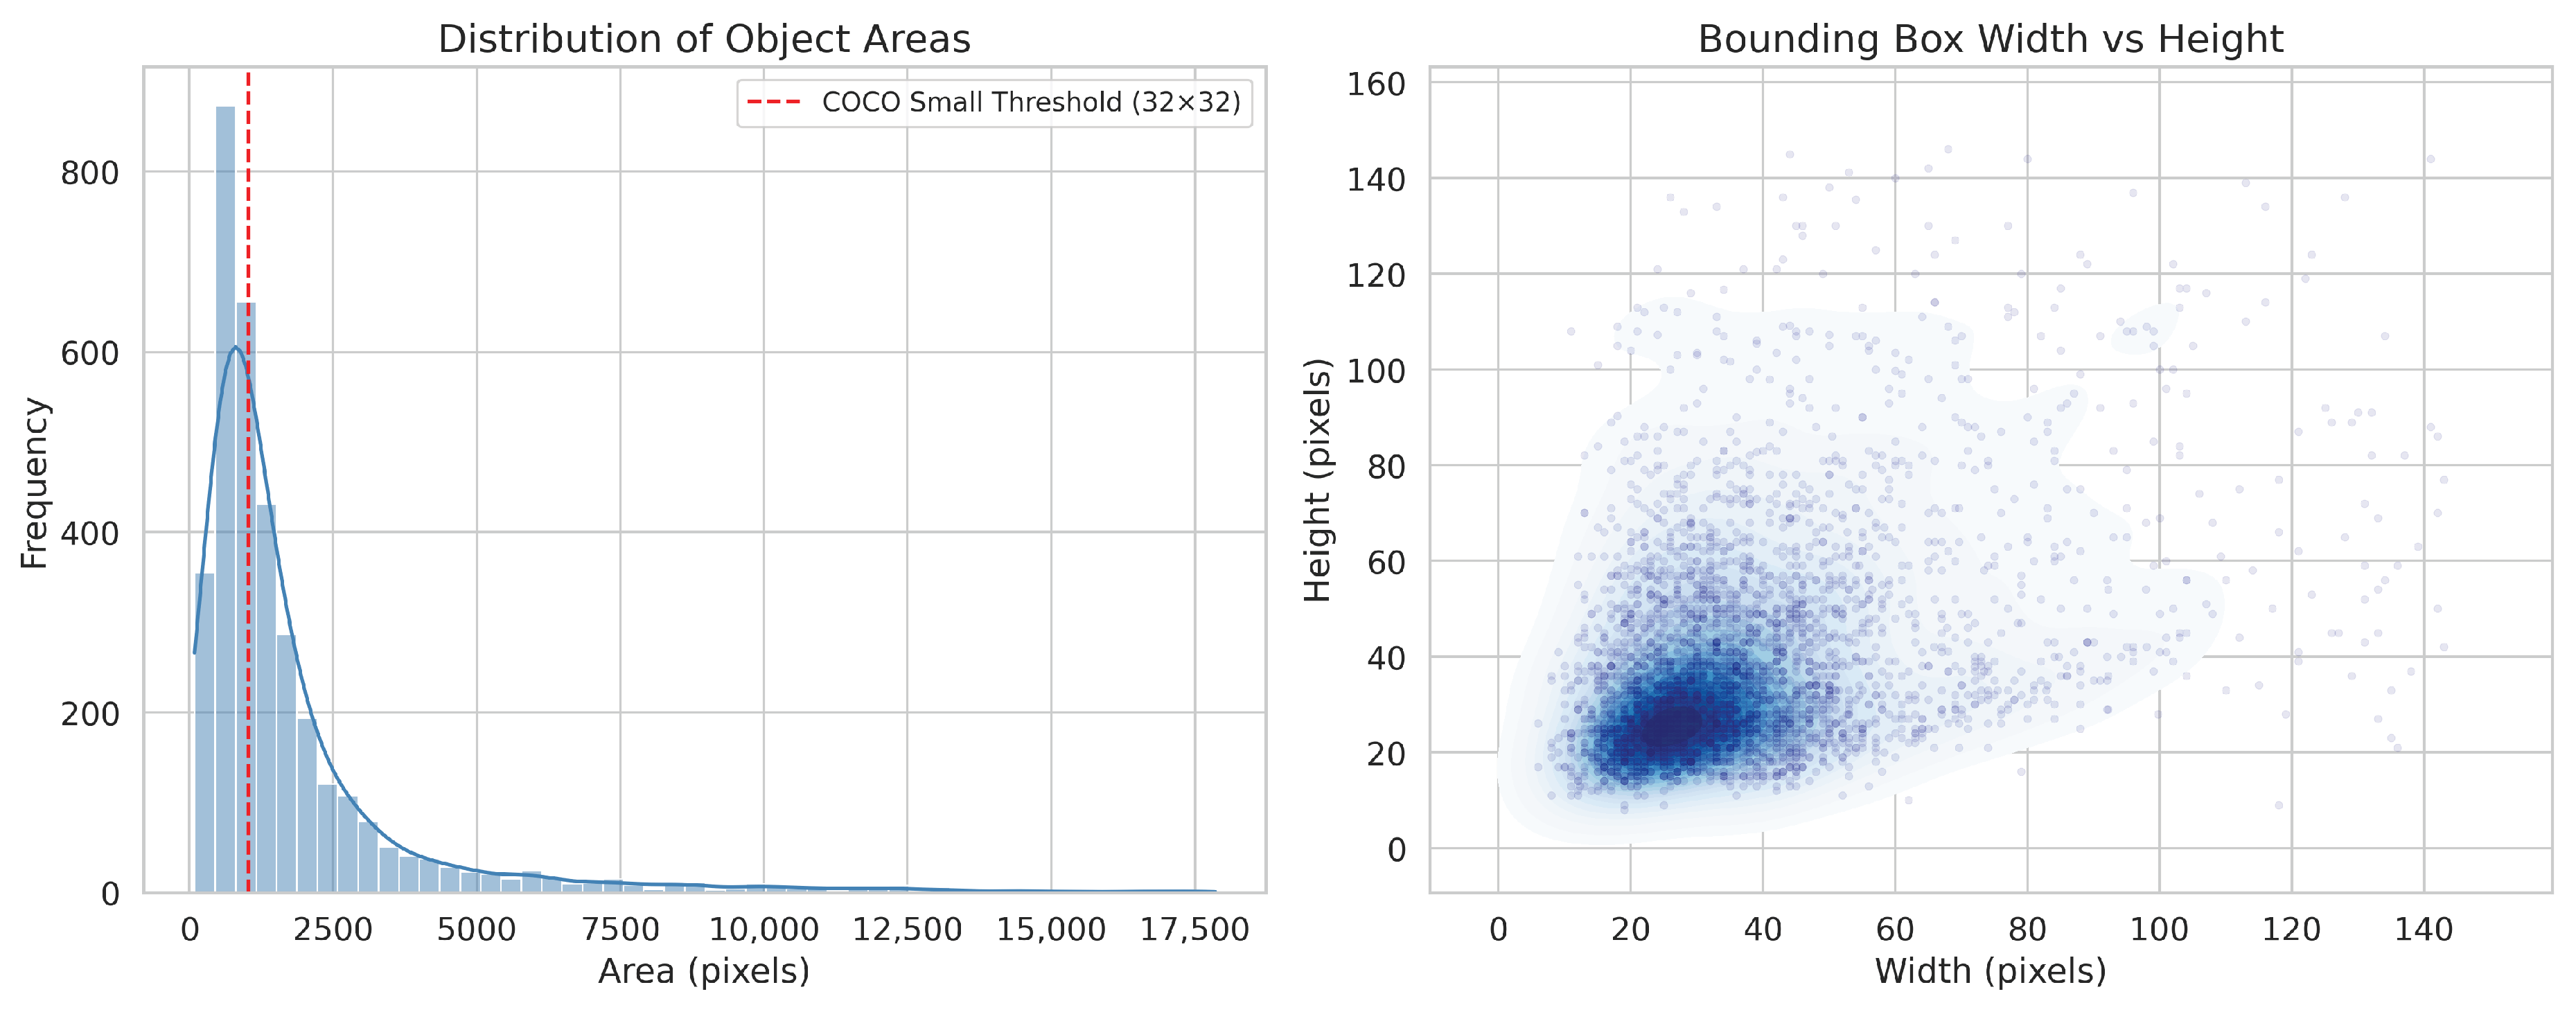
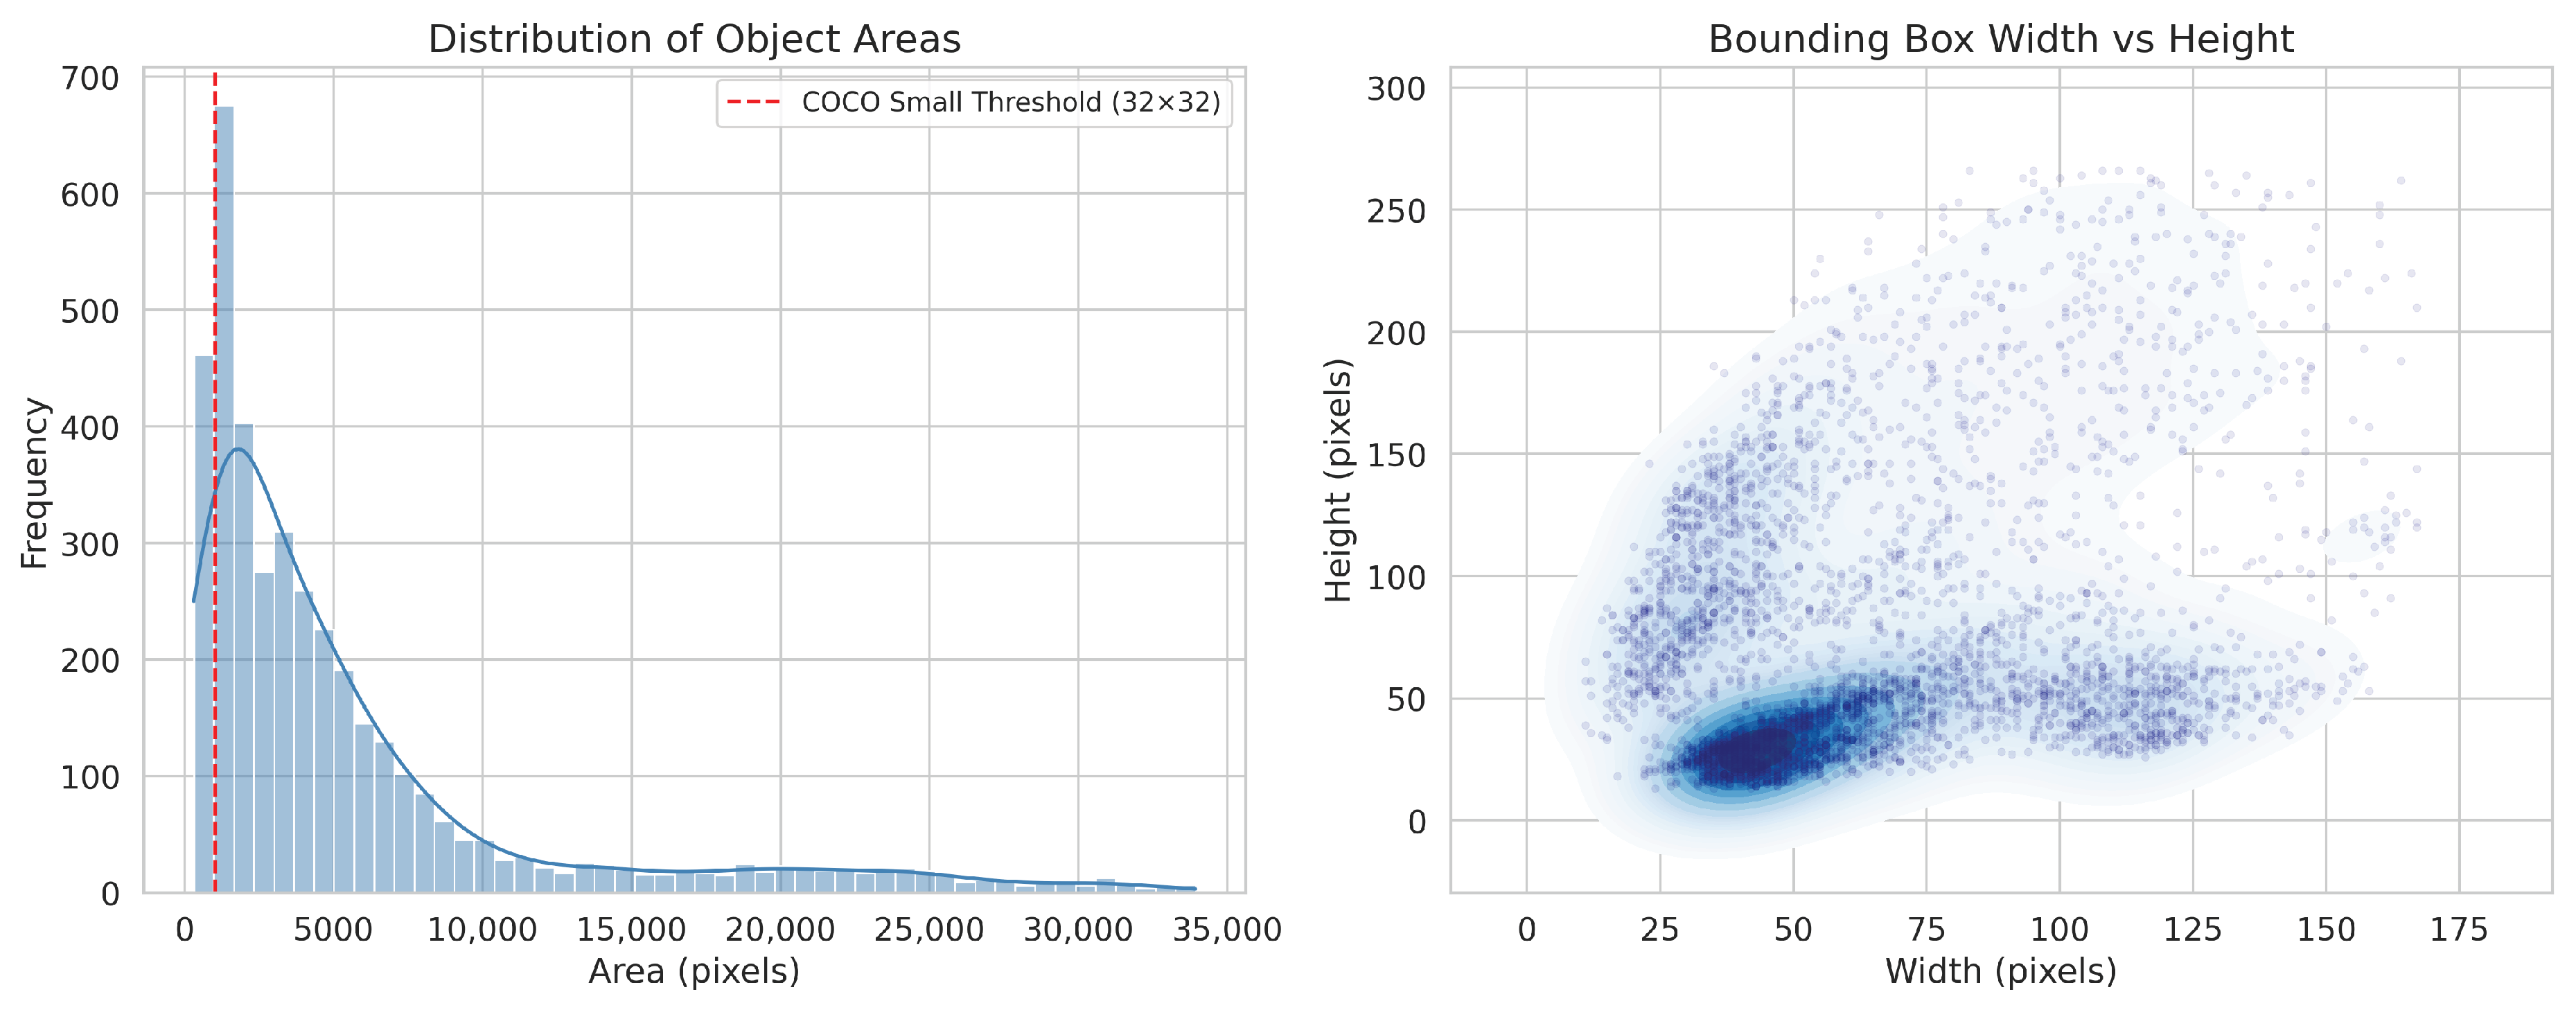
To quantitatively illustrate the characteristics and inherent challenges of the power tower dataset used in the experiments, this paper presents a statistical analysis of the object bounding box dimensions, as shown in
Figure 8 and
Figure 9. These figures illustrate the distribution of object areas for the SRSPTD and GFTD datasets, as well as the joint distribution of the width and height of the bounding box. For the SRSPTD dataset, the object area distribution exhibits a pronounced long-tail distribution, with a large number of instances concentrated below or near the small object threshold (32 × 32 pixels). This confirms the widespread presence of distribution towers and their tiny skeletal structures. Concurrently, the joint distribution of bounding box dimensions reveals a dense cluster tightly localized within an extremely small region (width < 40 pixels, height < 40 pixels), whilst scattered points extend up to a height of 140 pixels, highlighting significant scale variations among objects. In contrast, the GFTD dataset exhibits more dispersed, but equally challenging, geometric characteristics. It exhibits a broader and more ramified scatter topology, which not only indicates the presence of intense scale fluctuations, but also reflects diverse aspect ratios. In summary, statistical evidence strongly supports the necessity of the proposed model in this paper. The prevalence of minute features in both SRSPTD and GFTD necessitates enhanced small-object localization capabilities, whilst the vast scale range validates the urgency of establishing a multi-scale feature extraction mechanism.
During the training, all input images for the models are resized to 640 × 640 to ensure fairness in the experiments. The number of training epochs is set to 300. The optimizer is SGD. The batch size is set to 24. The momentum is set to 0.937. The experiments employed a dynamic learning-rate scheduling strategy, where the maximum learning rate and weight decay were set to 0.01 and 0.0005, respectively. Mixup and Mosaic were employed as data augmentation algorithms in model training. The detailed test run environment is shown in
Table 1.
4.5. Ablation Experiment
Ablation experiments were conducted on the SRSPTD dataset to examine the contribution of each proposed module to the final detection results. The corresponding outcomes are reported in
Table 5. The hyperparameter settings in the ablation experiments were identical to those in previous experiments. In
Table 5, “√” indicates that the component was included in the model, while “×” indicates that the component was excluded.
As shown in
Table 5, incorporating the PKI_Bottleneck module into YOLOv9s improves the mAP50 by 2.2% and 1.9% for the DT and TT categories respectively compared to the baseline, indicating enhanced multi-scale feature extraction abilities. Secondly, while the introduction of the DSSA module in YOLOv9s did not produce significant improvements in detection accuracy for TT, it increased mAP50 for the small object category DT by 3.5%. This experimental result demonstrates that the DSSA module effectively improves the model’s recognition capabilities for small objects. Finally, training YOLOv9s with the DFW-IoU loss improves AP value for both categories, with a relatively higher gain observed for the small object category DT. This indicates that incorporating DFW-IoU loss makes the model more sensitive to small object recognition. Subsequently, pairing each component in various combinations further enhanced detection accuracy. When all three components were applied together to YOLOv9s, the model achieved the best overall performance among the evaluated ablation configurations. Furthermore, as evidenced by the FPS metrics, the improved model continues to meet real-time requirements on the evaluated RTX 4090 platform.
To provide a more intuitive efficiency comparison, the inference latency was derived from the measured FPS as:
Under the same RTX 4090 evaluation environment, YOLOv9s achieves an average latency of approximately 3.51 ms per image, whereas MS-YOLO requires approximately 4.61 ms per image. Thus, MS-YOLO introduces an additional latency of approximately 1.10 ms while improving both mAP50 and mAP50-95 by 4.1%. Since FPS and latency are reciprocal under identical measurement conditions, the two metrics describe the same inference-time behavior from different perspectives.
The parameter-storage footprint can also be estimated from the parameter count. Under FP32 precision, the model weights of YOLOv9s and MS-YOLO require approximately 39.2 MB and 48.0 MB, respectively, while FP16 storage reduces these values by approximately half. However, the peak GPU memory consumption cannot be uniquely determined from Params and GFLOPs because it also depends on intermediate activations, batch size, numerical precision, framework implementation, operator workspace, and memory-allocation strategy. Therefore, Params and GFLOPs are retained as hardware-independent indicators of model complexity. The reported latency and FPS were measured on a desktop RTX 4090 GPU and do not directly represent performance on resource-constrained edge devices.
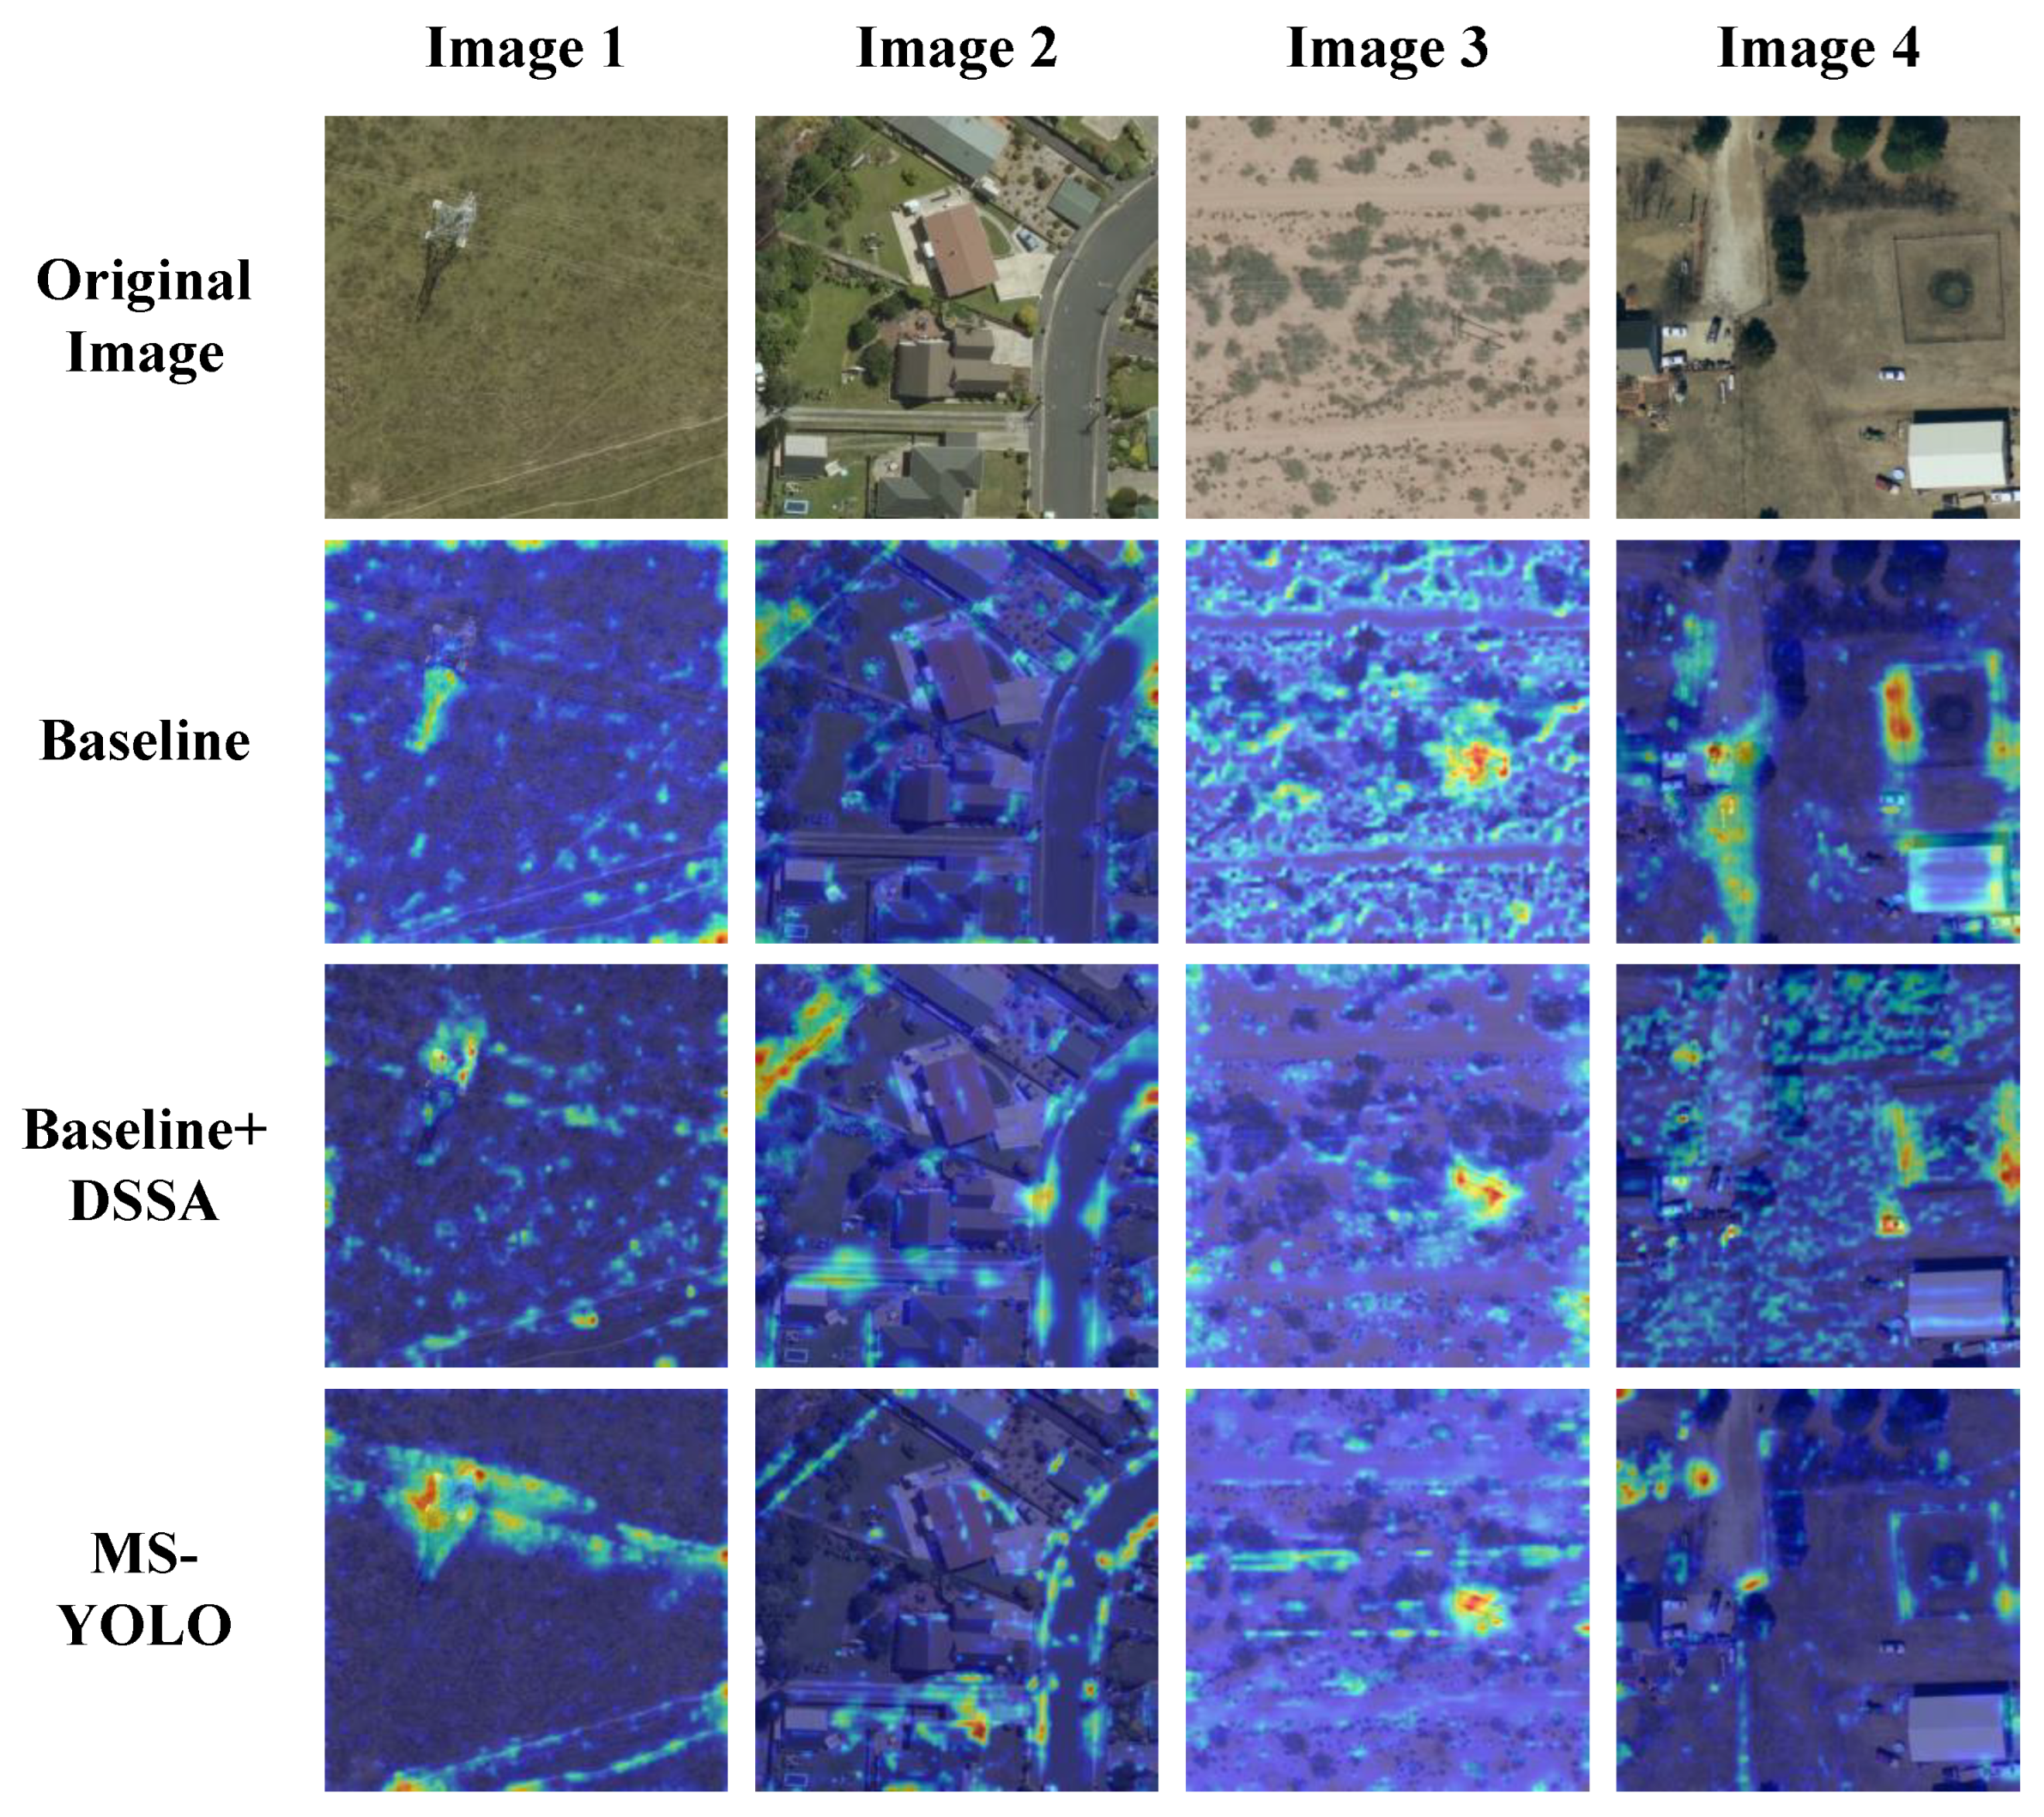
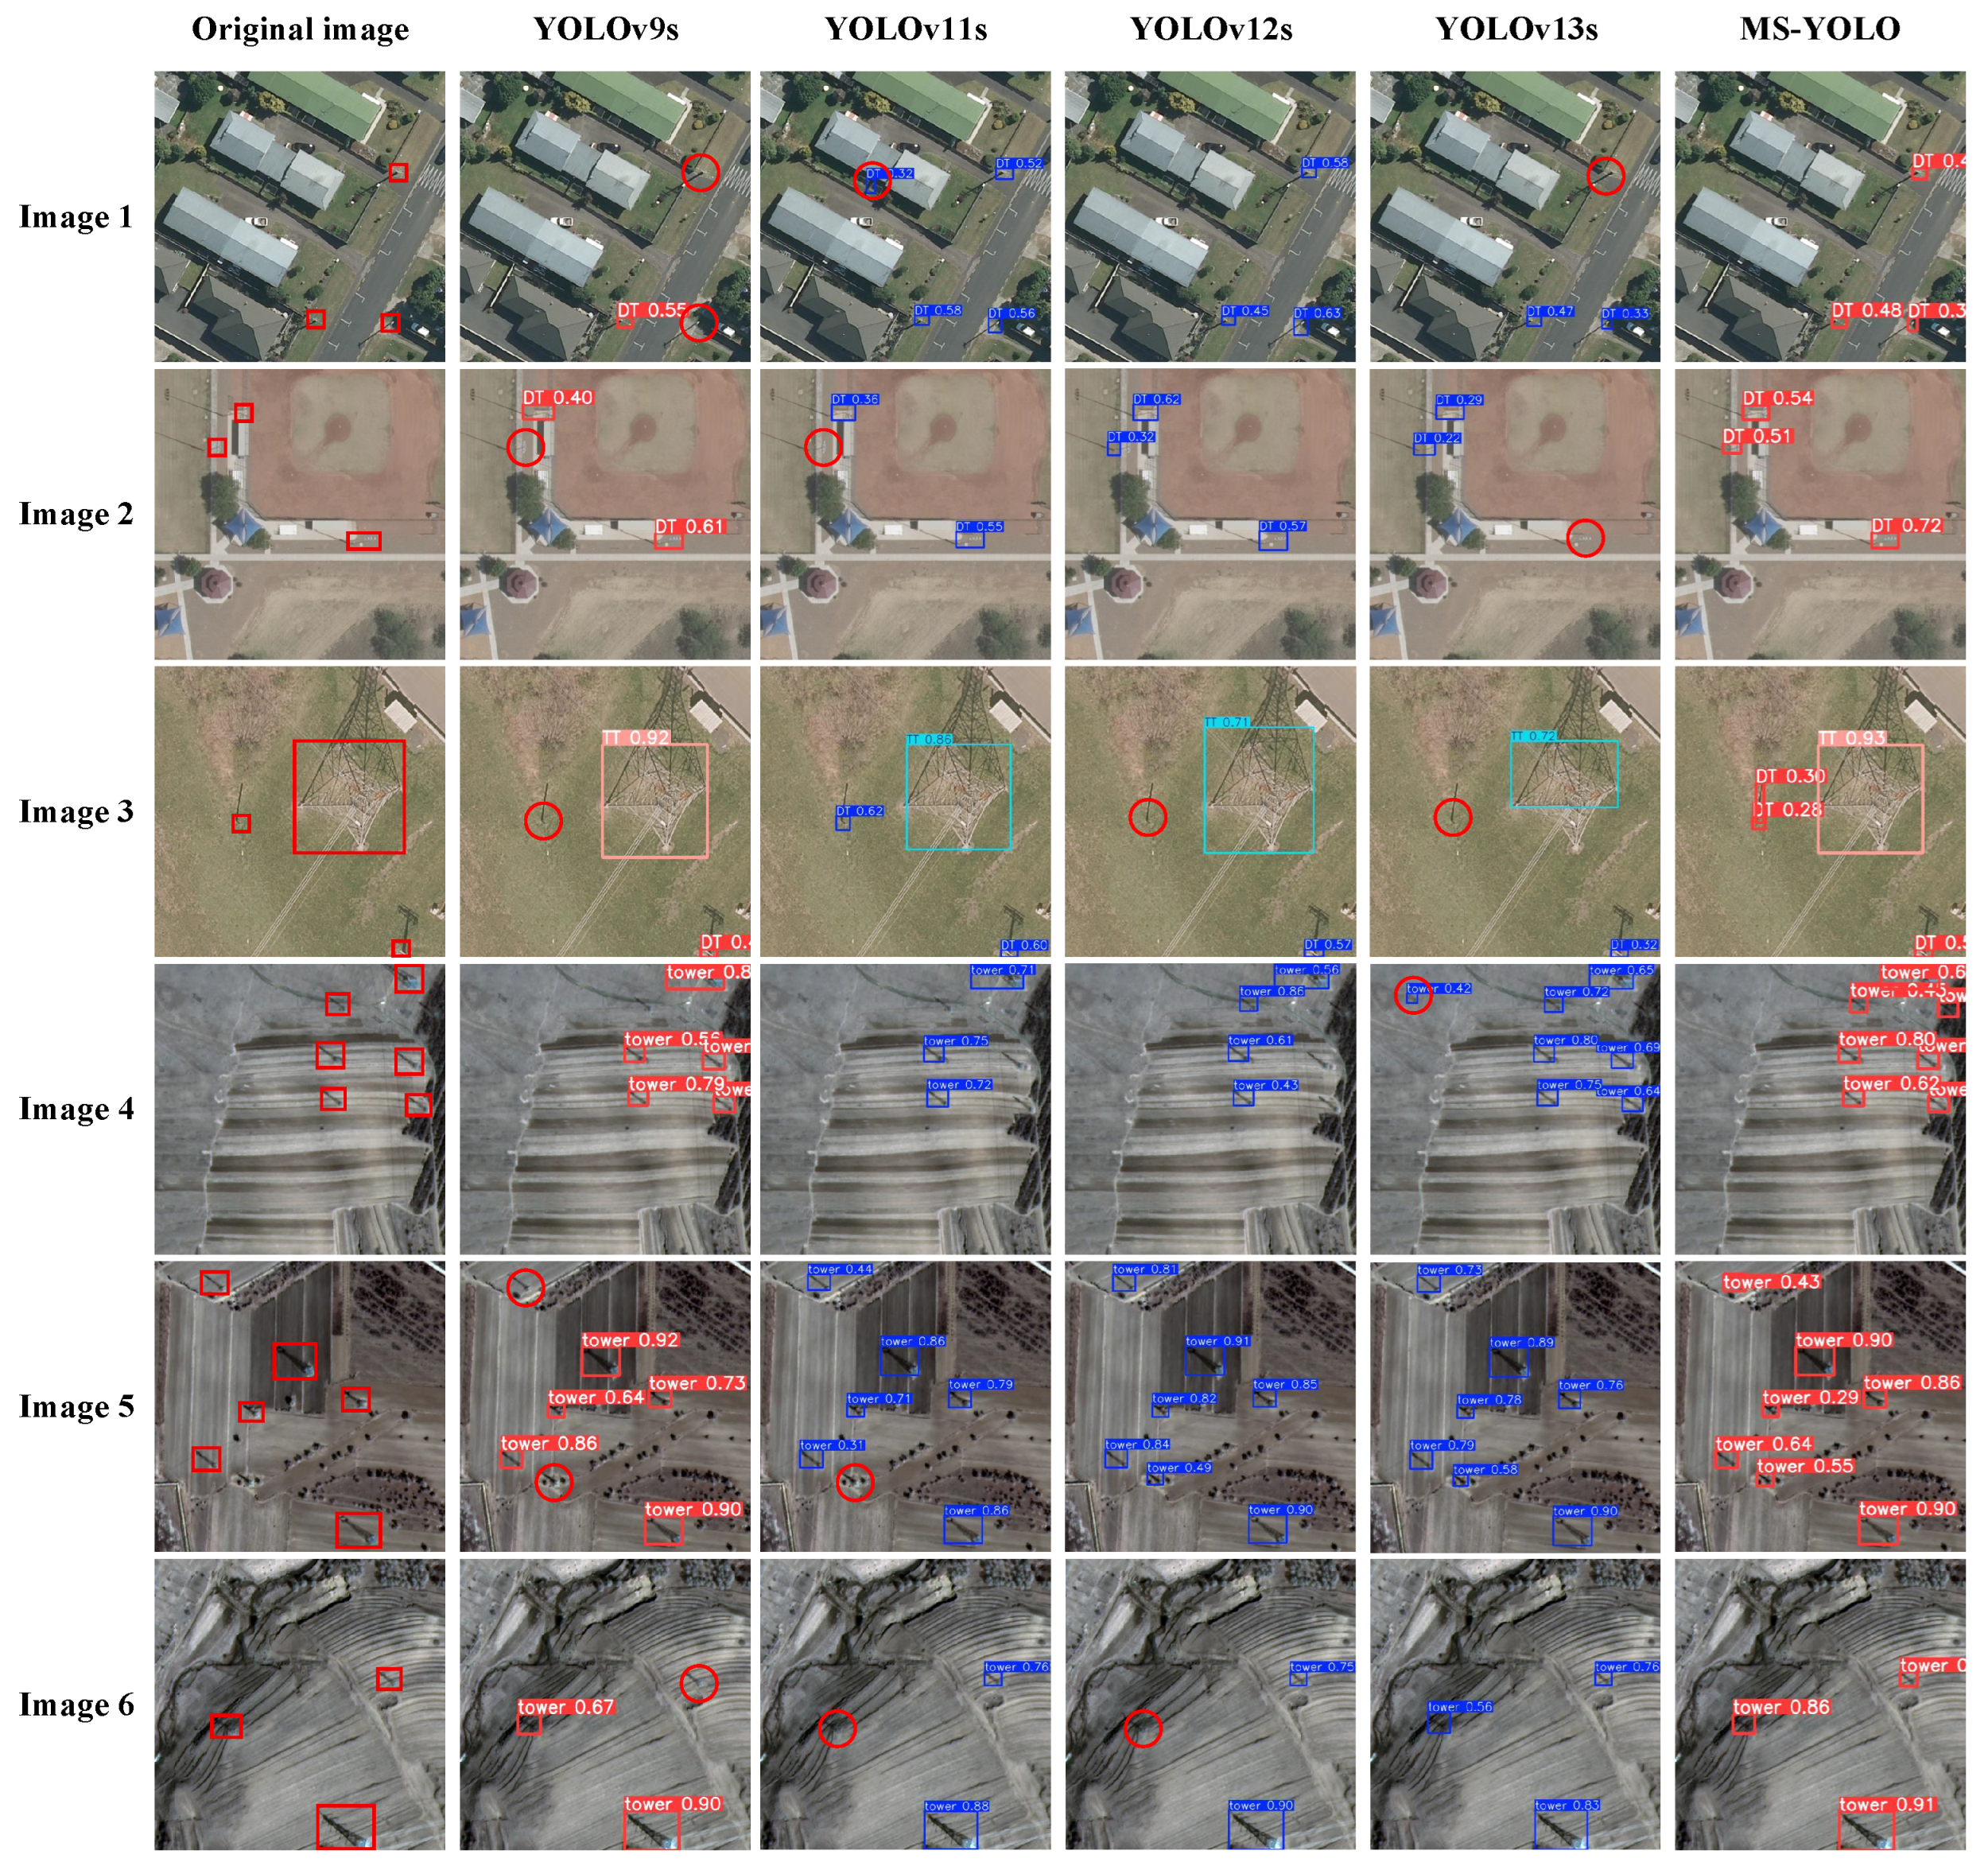
In this paper, Grad-CAM is employed to analyze the interpretability of the proposed model.
Figure 12 presents the heatmaps generated by the YOLOv9s baseline, the baseline equipped only with DSSA, and the complete MS-YOLO on the SRSPTD dataset. Compared with YOLOv9s, the baseline + DSSA model generally produces more target-centered and concentrated responses, indicating that DSSA helps suppress irrelevant background activations while enhancing spatial and semantic features associated with power towers. For example, in Images 1 and 3, the high-response regions of baseline + DSSA are more closely aligned with the tower locations than those of the baseline. Nevertheless, residual responses to roads, buildings, and surrounding textures remain visible in Images 2 and 4, suggesting that DSSA alone cannot fully eliminate complex background interference. In contrast, MS-YOLO generates more compact and discriminative activation regions around the distribution and transmission towers while further reducing responses from vegetation, roads, and building structures. The progressive change from the baseline to baseline + DSSA and then to MS-YOLO indicates that DSSA improves target-focused feature recalibration, whereas its combination with PKI_Bottleneck further strengthens multi-scale contextual representation and target localization. These qualitative results show that the two modules effectively guide the model to focus on critical power tower features. This improves the model’s interference resistance and localization accuracy in complex remote sensing scenarios.
This paper also validates the rationality of inserting the PKI_Bottleneck module exclusively into the backbone portion of the model.
Table 6 compares the performance of the RepNCPSELAN4 model with PKI_Bottleneck modules inserted only in the backbone versus throughout the entire model. The experimental results indicate that incorporating only the PKI_Bottleneck module into the backbone improves the detection performance of the model while also decreasing both the parameter size and computational cost. This confirms the validity of this approach.
Additionally, the effects of different attention modules on detection performance were further analyzed through comparative experiments, including a baseline model without attention and models incorporating attention modules such as SE, CBAM, LSKA, FCM, HFP, and DSSA, to identify the optimal attention mechanism. To ensure a fair comparison, all attention modules were inserted at the same position after the backbone and were trained using identical hyperparameters. As shown in
Table 7, DSSA improves the baseline mAP50 from 75.0% to 76.8%, achieving the highest overall mAP50 among the compared attention mechanisms. It should be noted that SCSA achieves the highest AP for distribution towers at 74.0%, slightly exceeding the 73.2% obtained by DSSA. However, its AP for transmission towers decreases to 78.1%. In contrast, DSSA obtains AP values of 73.2% and 80.4% for distribution and transmission towers, respectively, providing a more balanced improvement across the two categories. Therefore, the experimental results do not indicate that DSSA is universally superior in every metric, but demonstrate that its task-specific parallel design achieves the best overall mAP50 on the evaluated dataset.
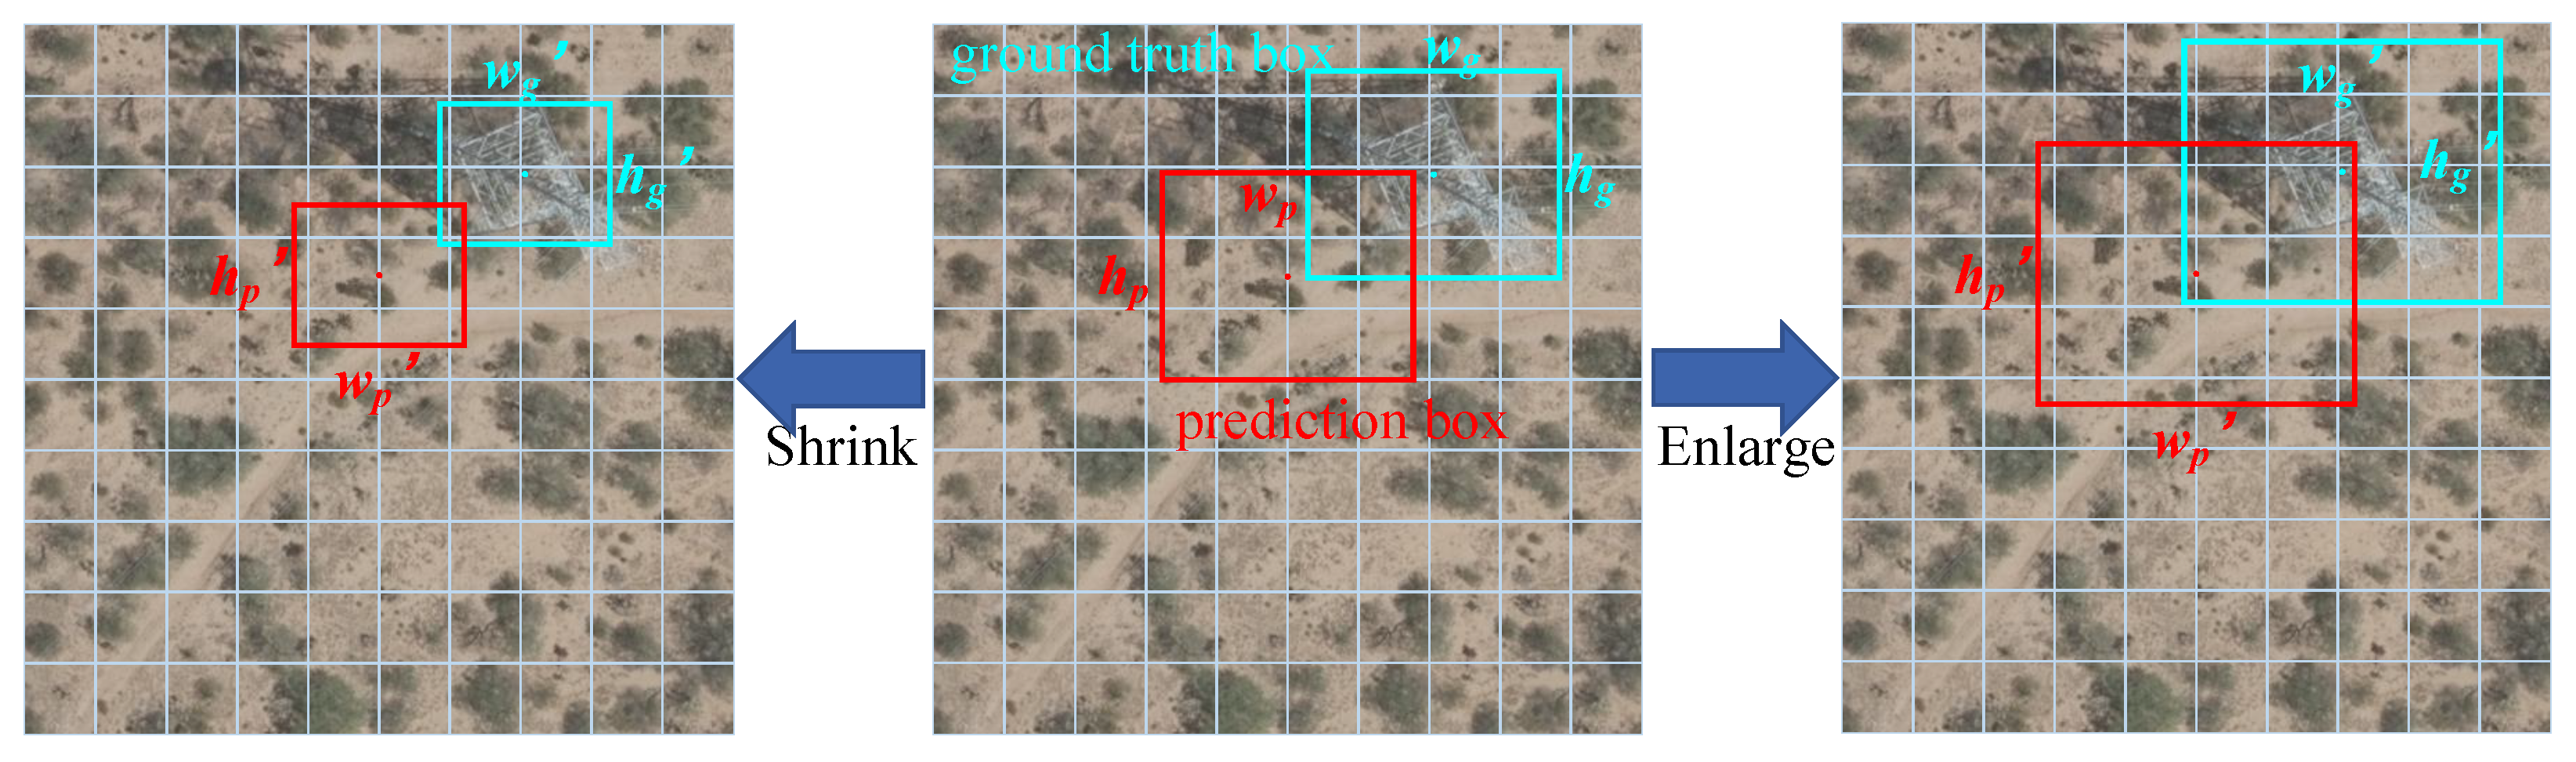
To further investigate the contribution of each component in DFW-IoU, a fine-grained ablation experiment was conducted using the original CIoU loss as the baseline. Specifically, the scale-sensitive weight, focal modulation term, dynamic bounding-box scaling schedule, and normalized center-distance penalty were individually incorporated into CIoU, while all other model structures and training settings were kept unchanged. The complete DFW-IoU, which integrates all four components, was also evaluated. As shown in
Table 8, the four components of DFW-IoU exhibit different effects on bounding-box regression. Introducing only the dynamic scaling schedule
improves DT, TT, mAP50, and mAP50-95 to 71.2%, 81.4%, 76.3%, and 38.5%, respectively, indicating that progressively adjusting the regression constraints is beneficial for model optimization. The scale-sensitive weight produces the highest standalone DT among the weighting terms, reaching 71.7%, which confirms its effectiveness in strengthening the supervision of small distribution towers. However, its mAP50-95 decreases to 34.1%, suggesting that scale compensation alone may overemphasize small samples and weaken localization under stricter IoU thresholds. The focal modulation term achieves an mAP50 of 76.5% and an mAP50-95 of 38.5%, demonstrating its effectiveness in emphasizing difficult samples. The center-distance penalty increases TT to 82.6% and mAP50 to 76.7%, although center alignment alone does not consistently improve high-IoU localization accuracy. Finally, the complete DFW-IoU achieves the best overall performance, with DT, mAP50, and mAP50-95 reaching 72.7%, 77.1%, and 40.8%, respectively. These results indicate that the four components provide complementary effects in small-object weighting, difficult-sample emphasis, dynamic optimization, and center-position alignment.
Table 9 compares DFW-IoU with several representative IoU-based bounding-box regression losses under identical experimental settings. Wise-IoU improves TT from 80.3% to 82.7%, but reduces DT to 68.9%, indicating that its sample-quality focusing mechanism provides limited improvement for small distribution towers. MPDIoU increases DT to 72.3% and mAP50-95 to 38.8%, whereas its TT and mAP50 decrease to 77.5% and 74.9%, respectively. Shape-IoU achieves the highest TT of 84.1%, but its DT decreases to 67.7%, showing an evident performance imbalance between the two categories. In comparison, DFW-IoU achieves the best DT, mAP50, and mAP50-95 values of 72.7%, 77.1%, and 40.8%, respectively, while maintaining a competitive TT of 81.4%. Compared with the original CIoU loss, these metrics are improved by 3.0%, 2.1%, and 3.0%, respectively. Although DFW-IoU does not obtain the highest AP for transmission towers, it provides the most balanced overall performance and demonstrates stronger localization accuracy under stricter IoU thresholds. This result indicates that the joint use of dynamic scaling, scale-sensitive weighting, focal modulation, and center-distance supervision is particularly effective for improving the regression of small and difficult power tower targets.




 ,
,