1. Introduction
Renovation of existing buildings is one of the major challenges in contemporary construction management. Unlike new-build projects, renovation works are carried out under conditions of partial information, technical uncertainty, and frequent interference with ongoing building operation. These difficulties are particularly visible in public and institutional facilities, where construction activities must be coordinated with user safety, operational continuity, and administrative constraints. At the same time, the construction sector is increasingly expected to improve not only cost and schedule performance, but also resilience, sustainability, and the quality of decision-making under uncertainty [
1,
2,
3]. In this context, early identification and prediction of risk are essential for planning realistic schedules, allocating resources, and reducing disruptions during execution. Similar concerns have been highlighted in studies on sustainable renovation, retrofit decision-making, and the economic effects of building renewal, all of which point to the need for more robust analytical support in renovation planning [
1,
2,
4,
5].
Among public buildings, university facilities constitute a particularly demanding category. They are often modernized repeatedly over long periods, contain heterogeneous structural and technical systems, and remain in use during renovation works. As a result, renovation planning must account not only for technical constraints, but also for the organization of teaching activities, temporary loss of room availability, access restrictions, user safety, and coordination of works in an operational environment. These conditions make university renovation projects especially vulnerable to disruptions caused by hidden defects, undocumented previous alterations, conflicts between work packages, shortages of specialized labor, equipment failures, and design or scope changes. Previous research has shown that renovation and modernization costs in university buildings are difficult to estimate using conventional methods because they depend on multiple interacting factors and are strongly conditioned by the history and technical condition of the facility [
6]. In the present study, this context is reflected in the selected input variables, which combine organizational and technical factors such as delivery delays, coordination problems, scope changes, equipment failures, funding availability, and building type.
From a methodological perspective, the key research problem is how to quantitatively predict renovation risk when the available explanatory variables are mixed in nature and describe a highly uncertain project environment. Traditional approaches to renovation decision-making have often relied on cost models, regression analysis, expert judgment, or multi-criteria decision-making frameworks [
2,
3,
6,
7]. These methods remain useful, particularly when interpretability and procedural transparency are required, but they may be insufficient when relationships between variables are complex, threshold-based, or non-additive. Previous studies have shown that renovation decisions, retrofit choices, and renovation outcomes are shaped by interacting economic, organizational, and contextual drivers that are difficult to represent using simple linear models [
3,
4,
5,
7,
8,
9]. Similar limitations have also been observed in renovation cost estimation, where regression methods can capture selected trends but may not fully reflect the variability of real projects, especially when hidden interactions or nonlinear effects are present [
6,
10,
11].
These limitations have contributed to the growing interest in artificial intelligence and machine learning methods in the built environment. Over the last decade, neural networks and related data-driven models have increasingly been applied to building energy prediction, retrofit decision support, construction cost estimation, rework prediction, carbon emission forecasting, seismic vulnerability assessment, and construction risk management [
9,
10,
11,
12,
13,
14,
15,
16,
17,
18,
19,
20,
21]. MLP approaches are especially relevant in this context because they provide a flexible framework for modelling nonlinear relationships without strong a priori assumptions about their analytical form. Existing studies have demonstrated the usefulness of MLPs in predicting heating and cooling loads, estimating energy performance, forecasting carbon emissions under limited-data conditions, assessing seismic vulnerability in existing buildings, and supporting renovation-related cost estimation [
11,
13,
14,
15,
16,
21,
22]. More recent research also confirms that AI can assist retrofit and renovation decision-making under conditions of data scarcity, class imbalance, and uncertain inputs, provided that the models are carefully designed and evaluated [
9,
17,
18,
19,
20]. This body of evidence suggests that MLP regression is a promising approach for renovation-risk prediction in public buildings, where uncertainty is high and the target variable can be meaningfully represented.
At the same time, an important research gap remains. Most existing studies address renovation from the perspective of cost, energy efficiency, homeowner decision-making, or retrofit strategy selection, rather than the prediction of an aggregated project risk level for renovation works in operational public buildings [
6,
7,
9,
10,
11,
17]. In addition, many available models have been developed for larger datasets, highly specific technical domains, or classification tasks, rather than for continuous risk regression. Research that directly addresses renovation risk in university buildings, based on real project cases and jointly considering technical and organizational predictors, remains limited. This is important because renovation risk in existing university buildings is not solely a technical issue. It also emerges from coordination problems, access constraints, phased execution, staffing shortages, and the interaction between construction works and ongoing building operation. In such settings, weak linear relationships between individual variables and overall risk may still reflect hidden nonlinearities, interaction effects, or threshold behavior that conventional correlation analysis cannot capture. In such settings, neural-network-based regression may offer an additional modeling perspective alongside traditional approaches.
A further challenge concerns the characteristics of the available data. In applied construction research, datasets are often relatively small, noisy, imbalanced, or partly subjective, especially when they are based on expert assessments or historical project records. This issue is widely recognized in machine-learning applications in retrofit and construction management, where limited datasets may reduce generalizability and increase the risk of overfitting [
9,
12,
14,
17]. Nevertheless, recent studies indicate that useful predictive performance can still be achieved under such constraints when the modeling workflow includes appropriate preprocessing, normalization, careful architecture selection, and transparent performance evaluation [
9,
14,
15,
16,
17]. In the present study, the dataset includes 122 real renovation cases and 13 input variables, including encoded qualitative factors. This setting reflects practical decision conditions in renovation management and provides a suitable basis for examining whether a deeper MLP architecture can better capture uncertain renovation data than a shallower one. The study is therefore not intended to propose a universal risk model, but to compare alternative MLP architectures for a specific construction management problem.
Against this background, the aim of this study is to examine the feasibility of MLP-based configurations for estimating the risk level of renovation works in existing university buildings. More specifically, the study has three exploratory objectives. First, it establishes a continuous baseline mapping framework based on real project data described by 13 technical and organizational risk factors. Second, it compares two network architectures to assess the effect of model depth on prediction quality. Third, it interprets the results from the perspective of construction organization and uncertainty management in operational public buildings. Additional reference models and an ablation analysis were included to provide methodological context for the limited-data setting. The contribution of the article is therefore both methodological and practical. Methodologically, it applies AI-based predictive modeling, previously applied in areas such as cost, energy, retrofit support, and risk-related building assessment [
9,
10,
11,
12,
13,
14,
15,
16,
17], to the prediction of renovation risk in existing public facilities. Practically, it proposes a decision-support perspective for planning and organizing renovation works in buildings that remain in use during execution.
The novelty of this study lies not in the generic use of MLP alone, because MLPs have already been applied in building-energy, cost-estimation, and seismic-risk studies, but in combining real renovation data from operational university buildings with continuous project-level risk regression and in examining the effect of network depth under limited-data and high-uncertainty conditions. Unlike studies focused mainly on renovation costs, energy performance, or retrofit strategy selection, this article addresses the prediction of an aggregated renovation risk level using both technical and organizational predictors. In addition, the study treats correlation-based feature screening as an exploratory interpretive aid rather than as a formal dimensionality-reduction procedure. In this sense, the study contributes to the development of AI-supported decision-making for renovation planning in existing public buildings and complements recent ANN-focused reviews in construction risk management and retrofit analytics [
18,
20,
21].
2. Materials and Methods
2.1. Data and Variables
The empirical basis of the study consisted of a dataset describing real renovation cases carried out in university buildings. The database included 122 observations, each corresponding to a completed or assessed renovation case characterized by a common set of technical and organizational variables. The use of real project data was intended to preserve the practical complexity of renovation works performed in existing public buildings, where uncertainty is shaped not only by engineering conditions but also by operational, logistical, and managerial constraints. Compared with new-build datasets, renovation datasets are typically more heterogeneous and more difficult to formalize because they reflect the cumulative effects of previous interventions, incomplete documentation, changing site conditions, and continued building operation. Similar challenges have been reported in studies on renovation cost estimation, retrofit decision support, and predictive modeling for existing buildings, where the quality and structure of the available data strongly affect model design and performance [
23,
24,
25,
26,
27,
28,
29].
In the present study, the output variable was defined as the risk level of renovation works, expressed as a continuous value in the range from 0 to 1. The risk value was treated as an aggregated project-level indicator reflecting the overall severity of renovation-related uncertainty for each case. The value 0 represented the lowest observed risk level, whereas 1 represented the highest observed risk level within the adopted assessment scale. The target variable was derived from the available project assessment data and was used as the supervised output for MLP regression. Therefore, the model did not classify projects into predefined risk categories, but learned to approximate a continuous risk score assigned to each renovation case. A continuous risk scale makes it possible to capture subtle differences between projects and to support ranking, comparison, and decision-making under uncertainty. This approach is consistent with recent machine-learning studies in the built environment, where regression has been used to predict continuous outcomes such as energy demand, carbon emissions, costs, or damage levels, especially when the objective is to preserve the numerical variability of the target phenomenon [
23,
24,
27,
30,
31,
32,
33].
The input space comprised 13 explanatory variables, selected to reflect the organizational and technical conditions of renovation works in university buildings. These variables were derived from actual project conditions and corresponded to recurring sources of disruption or elevated risk in renovation practice. The adopted variable set was intended to combine technical risk drivers with organizational and contextual drivers, which is especially important in renovation projects conducted in operational public facilities. In contrast to narrowly technical predictive models, the present study assumes that risk emerges from the interaction between physical building conditions and project management conditions. This aligns with recent research emphasizing that AI-based models for buildings and retrofit projects should account for both engineering and managerial dimensions, particularly under data scarcity and high uncertainty [
18,
19,
28,
29,
32,
33,
34,
35].
The analyzed variables are summarized in
Table 1.
Because the dataset included both quantitative and qualitative descriptors, all non-numeric variables were transformed into numerical form before model training using a label- and order-preserving coding procedure. In practical terms, binary conditions were coded as 0/1, whereas descriptors available in the source database as ordered levels were mapped onto monotonic normalized scales reflecting increasing managerial or technical burden. The final analytical dataset used by the neural networks therefore consisted entirely of numerical values expressed on a standardized 0–1 scale. The coding stage was necessary because MLP models require numerical input vectors. Its purpose was not to impose artificial precision, but to make heterogeneous project descriptors computationally processable while preserving their relative analytical meaning within the dataset. Similar preprocessing procedures are standard in ANN-based modelling of construction, energy, and retrofit phenomena, where categorical project characteristics must be converted into machine-readable form before training [
23,
25,
31,
33,
34].
In the source database, each renovation case was represented by a normalized risk index in the range 0–1 and 13 correspondingly standardized explanatory descriptors. The target risk value was treated in this study as a normalized composite expert-based project-level index reflecting the overall technical–organizational difficulty and uncertainty of a given renovation case. It was assigned retrospectively at the case-analysis stage in the source project database and then used directly as the reference output for supervised learning. The index should therefore be understood as an expert-based management indicator rather than a directly measured physical quantity. Because the archived dataset did not include repeated independent ratings for each case, inter-rater reliability could not be calculated. Accordingly, the present article focuses on predictive modeling of an existing empirical risk score rather than on constructing a new composite risk index.
2.2. Data Preparation and Normalization
Before model development, the dataset underwent a preprocessing procedure composed of coding, normalization, and random division into subsets for training, validation, and testing. This stage was necessary because the input variables represented different dimensions of project conditions and were originally expressed on different scales or as categorical descriptors. Without preprocessing, the raw data could distort the learning process by giving undue influence to variables with larger numerical ranges or inconsistent representation.
To ensure scale comparability, all numerical input values were normalized using the min–max transformation, which rescales each variable to the interval [0, 1] according to Equation (1):
where:
—the original value of a variable,
and
—the minimum and maximum values of that variable in the dataset, and
—the normalized value.
The choice of min–max normalization was motivated by both methodological and practical considerations. First, it allows variables with different original units or ranges to become directly comparable. Second, it improves numerical stability during training and reduces the risk that variables with larger magnitudes dominate gradient updates. Third, in neural-network-based regression, normalization is widely recognized as a means of accelerating convergence and improving the behavior of loss functions such as mean squared error. Comparative research on ANN preprocessing has shown that normalization can significantly affect model stability and predictive quality, especially in small and medium-sized samples [
24,
25,
31]. In the context of this study, normalization was particularly important because the dataset combined mixed technical and organizational descriptors and because the training objective was sensitive to numerical scale through the MSE loss function.
Data quality screening was performed before model training. No missing values were identified in the final analytical dataset; therefore, no imputation procedure was required. Outlying values were not removed automatically because the dataset described real renovation cases and extreme values were interpreted as potentially meaningful manifestations of rare but realistic project conditions. Instead, the records were retained after consistency checking, and the subsequent min–max normalization limited scale-related distortions during training.
After normalization, the prepared dataset was randomly divided into three subsets:
training set: 80% (98 cases),
validation set: 10% (12 cases),
testing set: 10% (12 cases).
The training subset was used to fit the neural network parameters; the validation subset was used to monitor model behavior during training and to enable validation-based early stopping. The adoption of a three-way split follows standard practice in ANN modeling, including building-related regression tasks, where separating model selection from final evaluation is essential for obtaining a realistic picture of generalization performance [
23,
26,
30,
31,
33].
The main characteristics of the data preparation and model setup are summarized in
Table 2.
Because renovation risk in existing university buildings is affected by uncertainty, incomplete information, and potentially nonlinear relationships, careful preprocessing is important for ensuring a consistent input representation for model training. A poorly structured input space may prevent the network from learning meaningful patterns, especially when the sample is limited. For this reason, the study treated preprocessing not as a purely technical step, but as part of the methodological framework that links the empirical structure of renovation cases to the computational capabilities of neural networks.
2.3. MLP Regression Model
The predictive stage of the study was based on multilayer perceptron (MLP) regression. The choice of regression instead of classification resulted directly from the nature of the target variable. Since renovation risk was represented as a continuous value between 0 and 1, the modeling objective was to predict a numerical level of risk rather than assign each project to a discrete class such as “low”, “medium”, or “high”. Although classification can be useful when the purpose is grouping or categorical decision rules, it would reduce the informational richness of the available data and force an artificial discretization of the risk scale. In contrast, regression preserves the continuous nature of the output and allows more nuanced interpretation of predicted values. This distinction is important in risk management contexts, where small differences in predicted risk may influence prioritization, resource allocation, or mitigation planning. MLP regression was selected because the predictor set was mixed in nature and the study aimed to explore a flexible nonlinear approximation in a small and uncertain construction-management dataset. Under such conditions, MLP offers a flexible nonlinear approximation framework without requiring a predetermined analytical form, which is one reason why it has been used in related problems of building prediction and construction management [
11,
13,
14,
15,
16,
17,
18,
20,
22].
As an additional reference linear analysis, an ordinary multiple linear regression model was also estimated for the same dataset. This supplementary analysis was not intended to replace the main MLP-based comparison, but to verify whether a simpler additive linear specification could provide an adequate approximation of renovation risk. Such a reference model is methodologically useful because it helps distinguish between problems that can be represented reasonably well by linear effects and those that appear to require a more flexible nonlinear approximation.
An MLP is a feedforward artificial neural network composed of an input layer, one or more hidden layers, and an output layer. In the present study, the input layer consisted of 13 neurons, corresponding to the 13 explanatory variables, while the output layer consisted of one neuron, representing the predicted risk value. The network was implemented as a fully connected architecture, meaning that each neuron in a given layer was connected to every neuron in the subsequent layer. Such a configuration is standard for tabular regression problems and enables the network to learn nonlinear interactions between multiple predictors.
The model was trained in a supervised learning setting, i.e., on the basis of input vectors and corresponding expected output values. The hidden layers used the hyperbolic tangent sigmoid transfer function (tansig), whereas the output layer used the linear transfer function (purelin). This configuration was selected because tansig introduces nonlinearity into the hidden representation of the data, while purelin is appropriate for continuous-output regression problems. In the present application, this combination enabled the network to capture nonlinear relationships between the technical–organizational input variables and the continuous renovation risk value.
The analyses were performed in the MATLAB environment, which provides an established framework for training feed-forward neural networks, controlling data flow, and evaluating predictive performance. MATLAB is frequently used in ANN-based engineering research because it integrates data preprocessing, model training, validation, and visualization in a single computational workflow [
25,
30].
The learning objective was based on the mean squared error (MSE), used as the primary loss function during training. MSE is defined by Equation (2):
where:
—the observed risk value,
—the predicted risk value, and
n—the number of observations.
MSE was selected because it is the standard loss function for continuous-output neural-network regression and penalizes larger prediction errors more strongly than smaller ones. This property is useful when the aim is to limit substantial deviations between predicted and actual project risk. Its use is well established in the ANN literature and in regression-based building applications [
23,
26,
31,
33].
To evaluate the final model fit, two complementary indicators were used: mean squared error (MSE) and the coefficient of determination (
). The
—coefficient was calculated according to Equation (3):
where:
—the observed risk value,
—the predicted risk value,
—the mean of the observed risk values, and
n—the number of observations.
The use of both MSE and
allowed model performance to be interpreted from two perspectives. MSE measures the average squared magnitude of prediction errors and is directly related to the training objective. In contrast,
expresses how much of the variability in the observed risk values is explained by the model. This dual evaluation strategy is common in regression studies involving ANN models and provides a more balanced assessment than a single metric alone [
23,
24,
26,
33].
The networks were trained in MATLAB using the Levenberg–Marquardt backpropagation algorithm (trainlm). Random data division was used with the same 80/10/10 split for both models; the hidden layers used the tansig transfer function, the output layer used purelin, and MSE was applied as the performance criterion. Training was monitored using the validation subset, enabling validation-based early stopping in the MATLAB training procedure. The MATLAB training procedures for both compared models, including network configuration and training settings, are provided in the
Supplementary Materials (Supplementary Materials Codes C1 and C2).
The exact numbers of trainable parameters were 16,821 for Model 1 and 43,601 for Model 2. The reported MLP performance metrics were obtained from a single randomized hold-out split and should therefore be interpreted as exploratory estimates rather than repeated or cross-validated estimates of generalization. These values confirm that the ratio of model complexity to sample size was high; therefore, the results should be interpreted as exploratory and comparative rather than as proof of a universally generalizable predictive model. For this reason, claims about the superiority of the deeper architecture were kept deliberately cautious, and the discussion emphasizes the need for broader validation, repeated runs with different random seeds, and comparisons with alternative models in future work. In methodological terms, the present study should be regarded as an exploratory proof-of-concept for this project type rather than as a final validated predictive tool.
2.4. Compared Network Architectures
To assess the effect of network depth on predictive performance, two MLP architectures were developed and compared. In both cases, the networks were fully connected, used the tansig transfer function in the hidden layers and the purelin transfer function in the output layer, and were trained on the same normalized dataset using the same training, validation, and testing split.
The compared architectures were selected as two intentionally contrasting feed-forward configurations: a shallower reference model (Model 1) and a deeper model (Model 2) trained under otherwise identical conditions. The adopted neuron numbers were identified through preliminary MATLAB R2025b experimentation and selected to provide a clear contrast in representational depth under the same preprocessing and training workflow. The purpose was therefore not exhaustive hyperparameter optimization, but a controlled comparison of two plausible MLP structures under the same preprocessing and training framework.
The first configuration, referred to as Model 1, consisted of two hidden layers with 160 and 90 neurons, respectively. The full network structure can therefore be represented as 13–160–90–1, where 13 denotes the number of input variables and 1 denotes the output risk value. This model was intended to serve as a shallower reference structure capable of capturing nonlinear relationships, but with a more limited representational depth.
The second configuration, referred to as Model 2, consisted of four hidden layers with the following structure: 260–90–90–90. The full architecture can therefore be expressed as 13–260–90–90–90–1. This deeper structure was introduced to examine whether additional hidden layers could improve the representation of nonlinear and interaction-based relationships in renovation risk data.
Both architectures were evaluated using the same performance indicators, namely the coefficient of determination (R2) and mean squared error (MSE). This allowed a controlled comparison of two architectures using the same dataset, preprocessing, training algorithm, and data split. Model 1 achieved approximately R2 ≈ 0.58 and MSE ≈ 0.065, whereas Model 2 achieved approximately R2 ≈ 0.86 and MSE ≈ 0.010.
Model 1, with two hidden layers (13–160–90–1), served as a shallower reference structure capable of learning nonlinear relations but with more limited representational depth.
Model 2, with four hidden layers (13–260–90–90–90–1), was introduced to test whether a deeper architecture would better represent nonlinear and interaction-rich patterns in renovation risk data; the obtained results indicate substantially improved fit under the adopted hold-out setting.
The contrast between the two models indicates that, under the adopted single hold-out setting, the deeper architecture achieved a closer fit to the available data than the shallower model. Because both models were trained on the same dataset and used the same target definition and preprocessing workflow, this result suggests that additional network depth may have improved the approximation of the relationship between the 13 input variables and the continuous risk output. This finding is consistent with the broader literature showing that deeper MLP structures may provide advantages in settings involving complex nonlinear dependencies, provided that the models are appropriately trained and evaluated [
26,
27,
31,
32,
33,
34,
35]. However, the finding should be interpreted as exploratory, since repeated runs with different random seeds, resampling-based validation, and external datasets are required before stronger conclusions about generalization can be drawn.
At the same time, the comparison should be interpreted cautiously. Improved fit in the deeper model does not eliminate the limitations associated with sample size, data subjectivity, or the absence of external validation. Rather, it shows that, within the present dataset and the adopted hold-out setting, additional hidden layers produced a closer fit to the observed test values. The comparison therefore indicates that architectural choice may affect model fit in this exploratory application.
2.5. Reference Machine Learning Models and Cross-Validation Protocol
To provide additional methodological context for the limited-data setting (N = 122), a comparative benchmarking framework was established using three alternative regression algorithms: Support Vector Regression (SVR), Tree Bagging Ensembles, and Gaussian Process Regression (GPR). The hyperparameter configurations reported below were selected through exploratory tuning of several candidate settings; accordingly, the resulting analyses are intended as contextual reference benchmarks rather than as a fully nested model-selection study. The final configurations used for the reference analyses comprised a linear kernel function with an automatic kernel scale, a box constraint of 0.100, and an epsilon of 0.010 for the SVR model; a bootstrap aggregation ensemble containing 100 learning cycles (trees) with a minimum leaf size of 10 and a maximum number of splits of 10 for the Bagging framework; and a rational quadratic kernel function with a kernel scale of 0.1 and a noise variance (σ) of 0.100 for the GPR architecture.
The out-of-fold performance of these reference regressors was assessed using a 10-fold cross-validation protocol, with the mean and standard deviation of MAE, RMSE, MAPE, and R2 calculated across folds. In addition, an ablation study was conducted to examine the sensitivity of the MLP workflow to removing validation monitoring. In this experiment, the shallower MLP topology (Model 1) was subjected to the same 10-fold cross-validation framework with validation-based early stopping intentionally disabled. The purpose of this experiment was to assess whether the removal of validation monitoring led to unstable out-of-fold performance for this specific configuration.
This ablation experiment was not designed as a direct cross-validated evaluation of the proposed MLP architectures. Rather, it provides methodological evidence concerning the role of validation-based early stopping in the tested Model 1 configuration. The proposed MLP architectures were evaluated using the validation-monitored 80/10/10 hold-out procedure described above; therefore, the cross-validated reference-model results and the reported MLP hold-out results should be interpreted as complementary contextual analyses rather than as a strictly like-for-like performance ranking.
3. Results
3.1. Overview of Predictive Performance
The results obtained in this study indicate a clear difference in predictive quality between the two analyzed multilayer perceptron architectures. Although both models were trained on the same dataset, used the same target variable, and followed the same preprocessing procedure, their final predictive performance differed substantially. The shallower architecture, hereafter referred to as Model 1, achieved a coefficient of determination of approximately R
2 ≈ 0.58 and a mean squared error of approximately MSE ≈ 0.065. By contrast, the deeper architecture, hereafter referred to as Model 2, achieved R
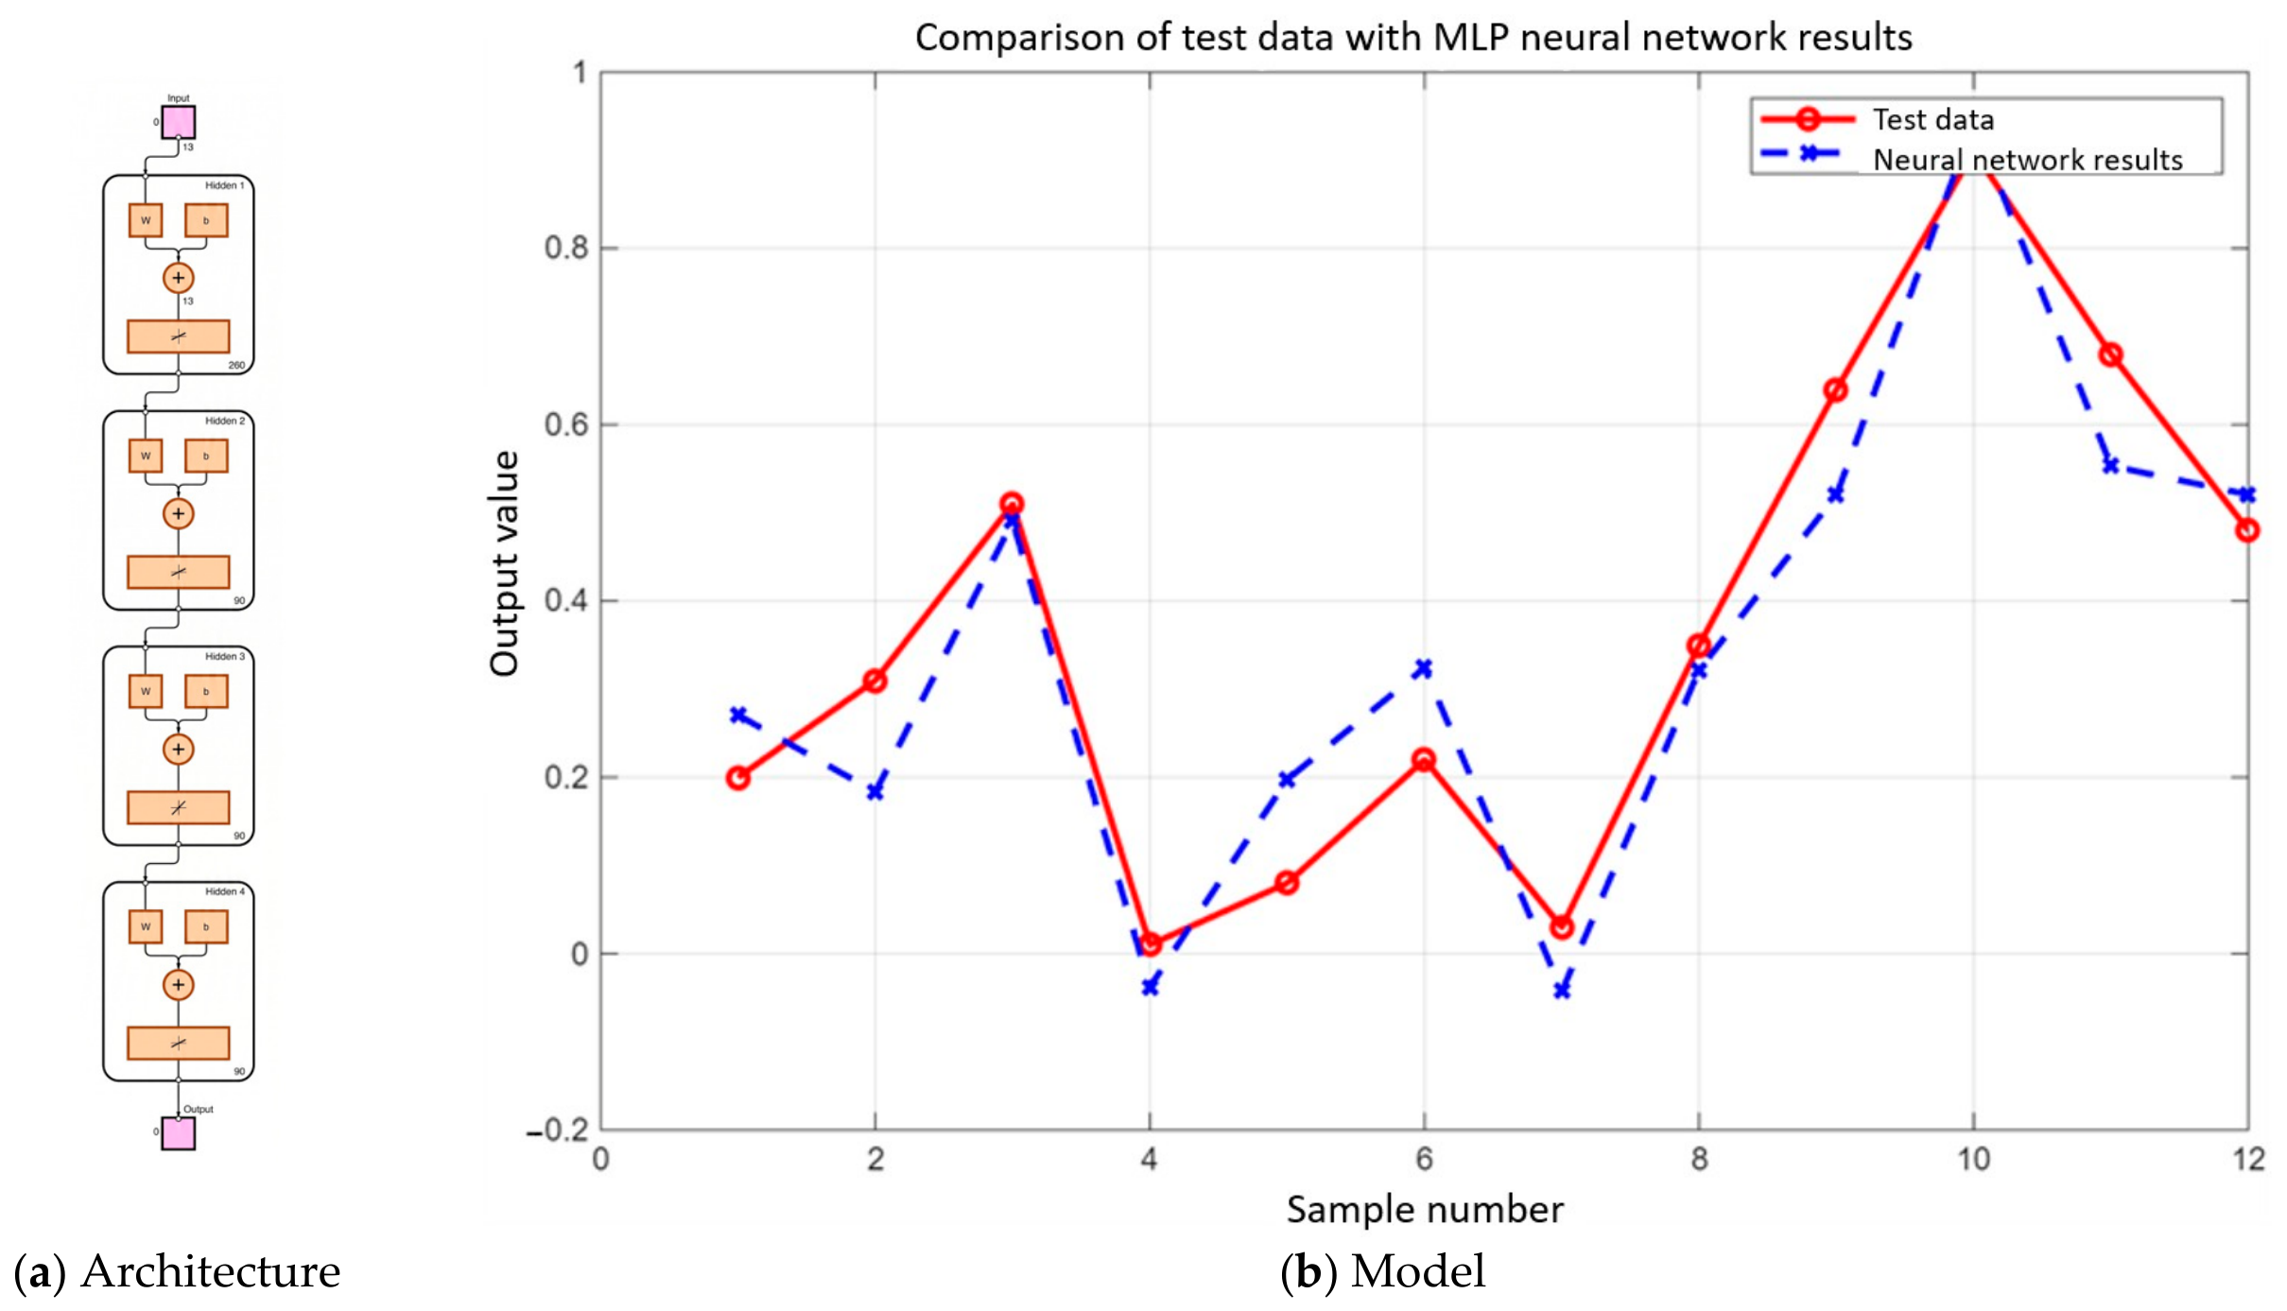
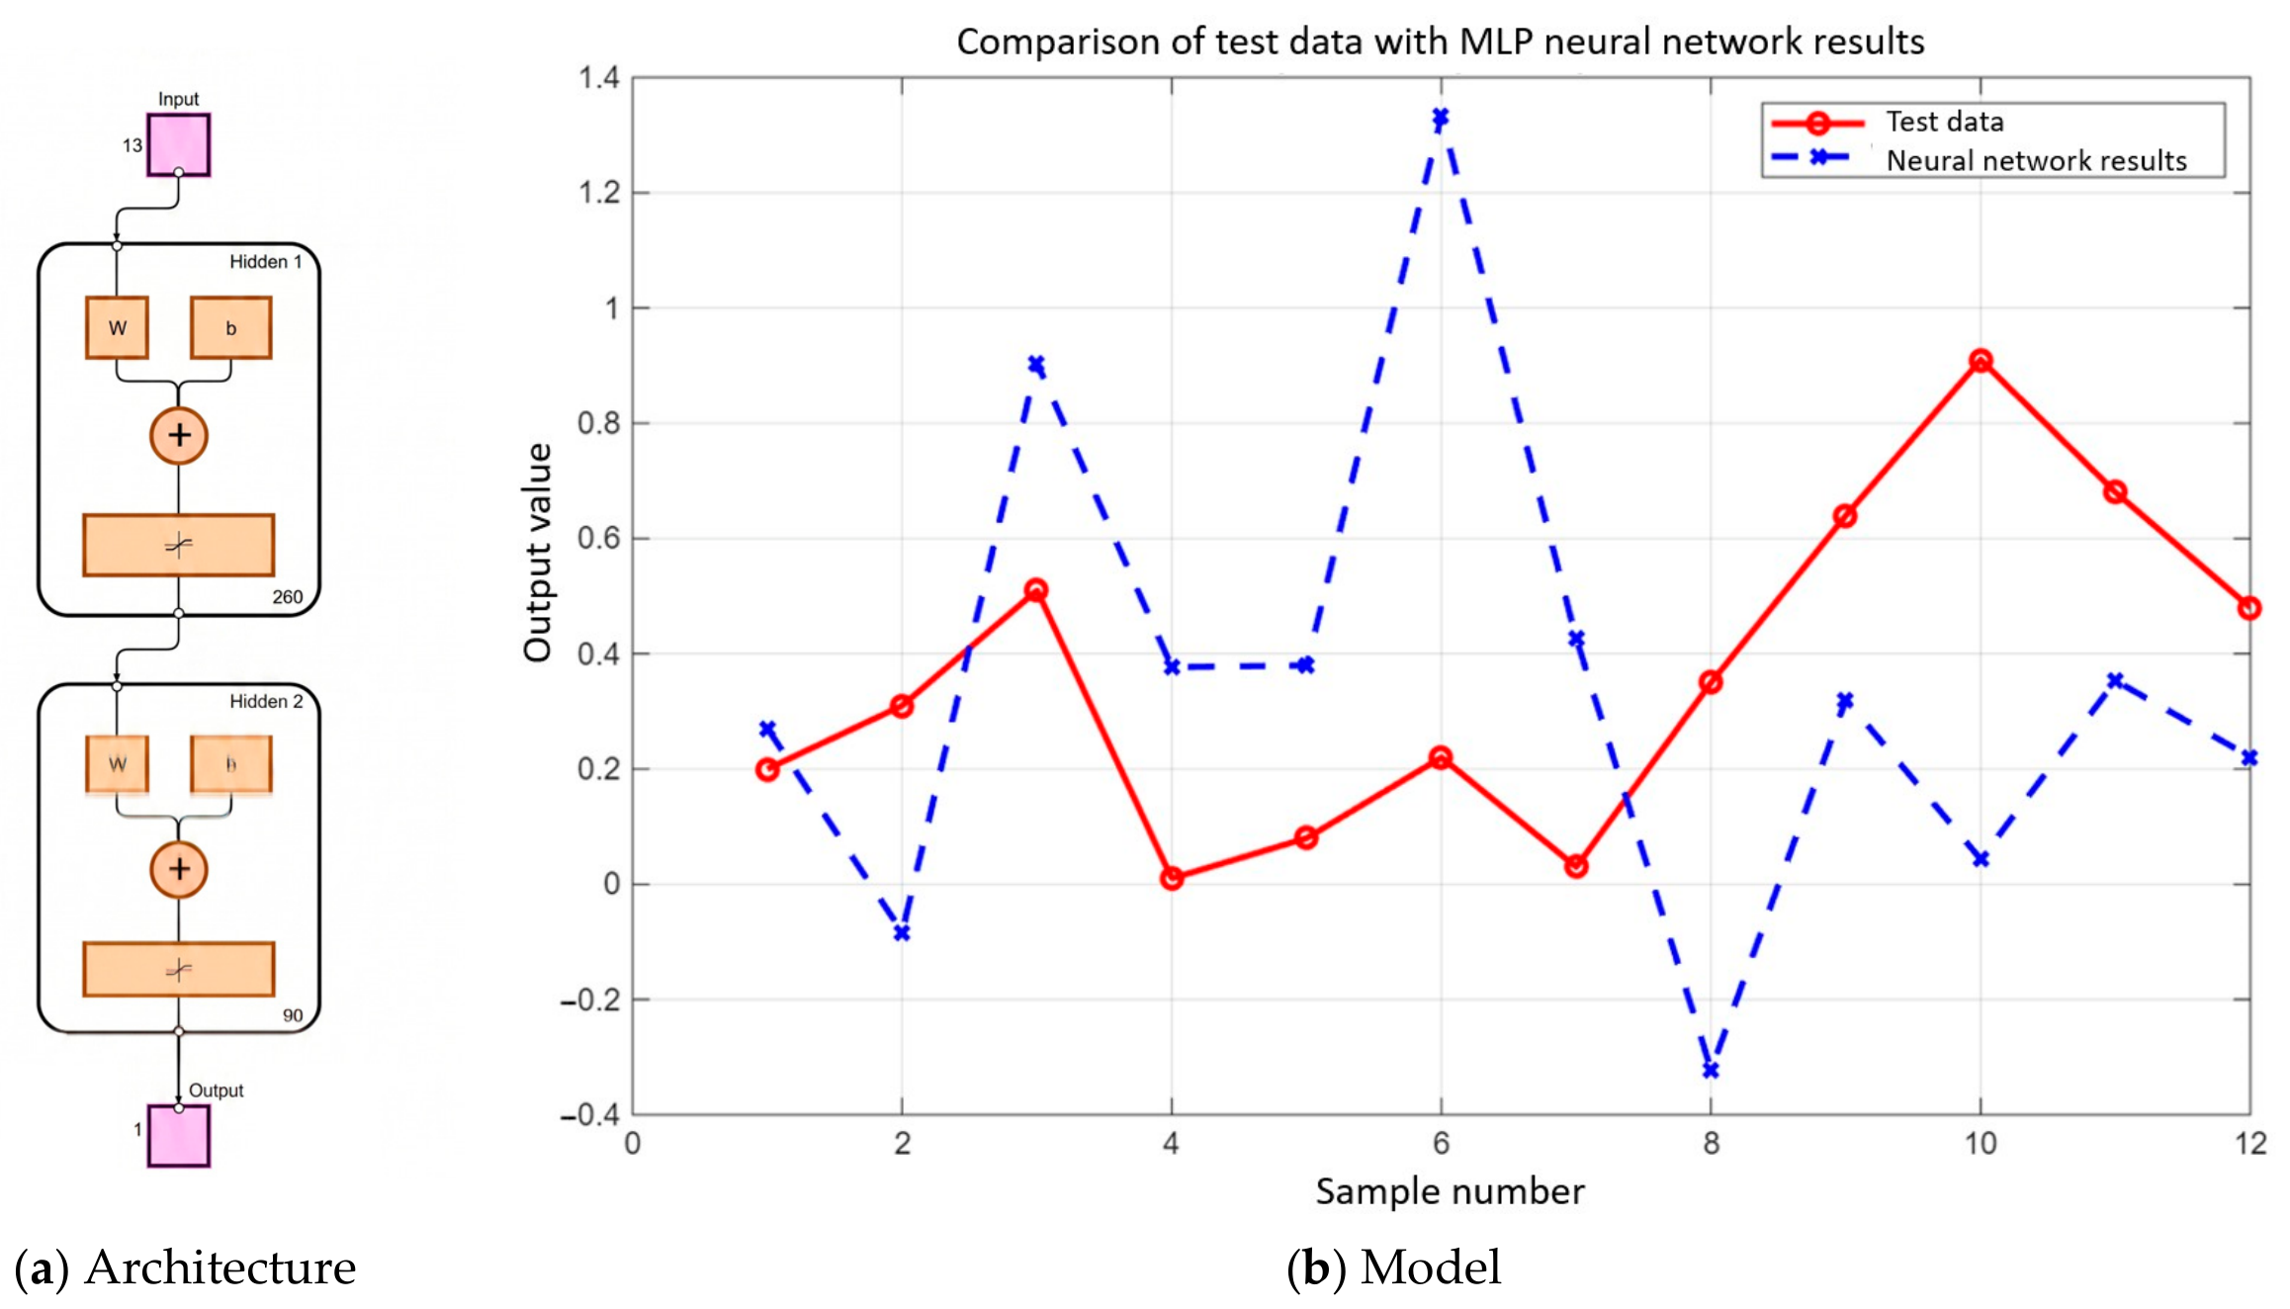
2 ≈ 0.86 and MSE ≈ 0.010. Within the adopted test split, the deeper model achieved a higher coefficient of determination and a substantially lower MSE than the shallower network. The same pattern is visible in the graphical outputs presented in
Figure 1 and
Figure 2, where Model 1 shows a visible discrepancy between expected and predicted values, while Model 2 exhibits substantially closer agreement.
The obtained results suggest that the deeper architecture provided a better approximation of the relationship between the input variables and renovation risk under the adopted training and testing procedure. Within the adopted hold-out evaluation, the difference between R2 ≈ 0.58 and R2 ≈ 0.86 represents a marked improvement in fit. Model 1 captured a moderate portion of the variability in the observed data, whereas Model 2 achieved a substantially closer fit to the observed test values. Similarly, the reduction in MSE from 0.065 to 0.010 indicates a lower magnitude of squared prediction errors on the normalized target scale. For this reason, the observed difference is relevant for the exploratory comparison of the two architectures.
These results are especially relevant when viewed in the context of the empirical conditions of the study. The analyzed sample comprised only 122 renovation cases, and the input space consisted of 13 variables combining technical and organizational descriptors. This is not a large dataset by machine-learning standards, and the problem itself is characterized by uncertainty, incomplete observability, and likely nonlinear interactions between predictors. Despite these constraints, the deeper architecture achieved higher test-set fit in the single adopted split. This result suggests that, within the adopted workflow, the deeper architecture may have provided a more flexible approximation of the available data. Because the evaluation was based on a single randomized hold-out split, this observation should not be interpreted as a stable estimate of generalization or as evidence of the true data-generating mechanism.
The comparative predictive performance of both analyzed MLP architectures is summarized in
Table 3.
As an additional contextual comparison, an ordinary multiple linear regression model was estimated for the same dataset and treated as a reference linear analysis. It showed limited explanatory power in the full-sample analysis. This result provides contextual support for exploring a nonlinear model for the present dataset, but it does not constitute a direct like-for-like comparison with the hold-out MLP results.
The comparison presented in
Table 3 shows that, under the adopted hold-out setting, the deeper architecture achieved higher fit and lower error than the shallower architecture. This result constitutes the main quantitative finding of the study and should be interpreted as an exploratory architecture-comparison result.
3.2. Results for Model 1
The first analyzed architecture, Model 1, consisted of two hidden layers with 160 and 90 neurons, respectively. Under the adopted test split, Model 1 achieved R2 ≈ 0.58 and MSE ≈ 0.065, indicating moderate fit relative to Model 2. These results should be interpreted as exploratory estimates derived from the single hold-out evaluation.
The graphical comparison between the expected and predicted values for Model 1 confirms this interpretation. As shown in
Figure 1, the predicted curve follows the general pattern of the expected values only approximately. In several parts of the plot, visible discrepancies can be observed between the two curves, which indicates visible mismatches between observed and predicted values within the adopted test split. Thus, the model can be regarded as partially effective in identifying the general trend but insufficiently accurate for detailed risk estimation.
The visual divergence between the expected and predicted curves suggests that Model 1 did not fully capture the complexity of the relationship between the input variables and the output risk value. In practical terms, this means that the architecture was capable of learning the existence of general dependencies within the dataset, but it was not sufficiently expressive to represent the more complex, local, and nonlinear patterns embedded in the data. This may be interpreted as a sign of limited predictive precision within the adopted testing scheme, especially under conditions of relatively high uncertainty and a relatively small dataset.
From the perspective of renovation risk management, such a level of fit may be insufficient when the model is intended to support real project decisions. In the case of renovation works carried out in existing university buildings, errors in early-stage risk estimation may affect contingency planning, work scheduling, and the allocation of technical and organizational resources. Therefore, although Model 1 captured part of the variation in the adopted test split, its precision appeared limited for detailed risk estimation.
3.3. Results for Model 2
The second analyzed architecture, Model 2, consisted of four hidden layers with the following structure: 260–90–90–90 neurons. Under the adopted hold-out setting, this deeper architecture achieved higher fit and lower error than Model 1. The coefficient of determination reached R2 ≈ 0.86, while the mean squared error decreased to MSE ≈ 0.010. These values indicate higher fit within the adopted test split.
The graphical comparison shown in
Figure 2 is consistent with the higher fit obtained for Model 2 within the adopted test split. In contrast to Model 1, the predicted values generated by Model 2 remain much closer to the expected values throughout the analyzed sequence. The overlap between the two curves is visibly stronger, and the model appears to capture not only the general pattern of the data but also smaller local fluctuations. This indicates that the deeper network achieved a much more faithful approximation of the empirical risk profile.
Under the adopted hold-out setting, Model 2 achieved higher fit than Model 1. The deeper architecture may have provided a more flexible approximation of the relationships represented in the available dataset. This is particularly important in renovation projects, where the influence of individual factors rarely remains isolated and where the final risk level may result from combinations of interdependent disruptions, constraints, and uncertainties.
From a practical point of view, the predictive performance of Model 2 indicates that it may be considered a promising basis for risk-oriented decision support. Its lower error and higher fit within the adopted test split suggest that it provided closer numerical estimates of renovation risk than the shallower alternative. Therefore, among the two analyzed configurations, Model 2 should be regarded as the preferred solution.
3.4. Visual Comparison of Goodness of Fit
A direct visual comparison of
Figure 1 and
Figure 2 provides additional support for the numerical results summarized in
Table 3. In the case of Model 1, the divergence between the expected and predicted curves is evident in multiple parts of the plot. The network reproduces the broad trend of the target signal but fails to follow local changes with sufficient precision. This behavior is characteristic of a model that has learned a general approximation of the problem but lacks the representational capacity to capture more detailed nonlinear dependencies.
By contrast,
Figure 2 shows that the deeper network produced a much closer agreement between the observed and predicted risk values. The stronger overlap between the curves is consistent with closer agreement between observed and predicted values for Model 2 within the adopted test split. Thus, the graphical outputs complement the R
2 and MSE values by illustrating where predictions were closer to or further from the observed values.
This comparison is important because goodness-of-fit indicators alone do not reveal where the model performs well and where it diverges from the empirical pattern. The figures illustrate closer correspondence between predicted and observed values for Model 2 within the adopted test split. In this sense, the graphical analysis provides a more intuitive representation of the quality of prediction and complements the numerical interpretation.
3.5. Main Result: Improved Prediction Despite Limited Data and High Uncertainty
Under the adopted single hold-out setting, the deeper MLP architecture achieved higher fit and lower error than the shallower model despite the limited dataset and uncertainty of the analyzed problem. The sample included 122 real renovation cases described by 13 technical and organizational variables, which represents a relatively small dataset for neural-network modeling. Nevertheless, Model 2 achieved clearly better predictive performance than Model 1, as shown by the increase in R2 from approximately 0.58 to 0.86 and the decrease in MSE from approximately 0.065 to 0.010.
This result suggests that, within the adopted workflow, the relationship between the analyzed predictors and renovation risk may not be adequately represented by a simple linear specification. The observed improvement is consistent with the possibility that the deeper architecture provided a more flexible approximation of patterns in the available data under the adopted hold-out procedure. Therefore, the comparison suggests that network depth may have affected prediction quality in this exploratory analysis.
3.6. Correlation-Based View of the Input Variables
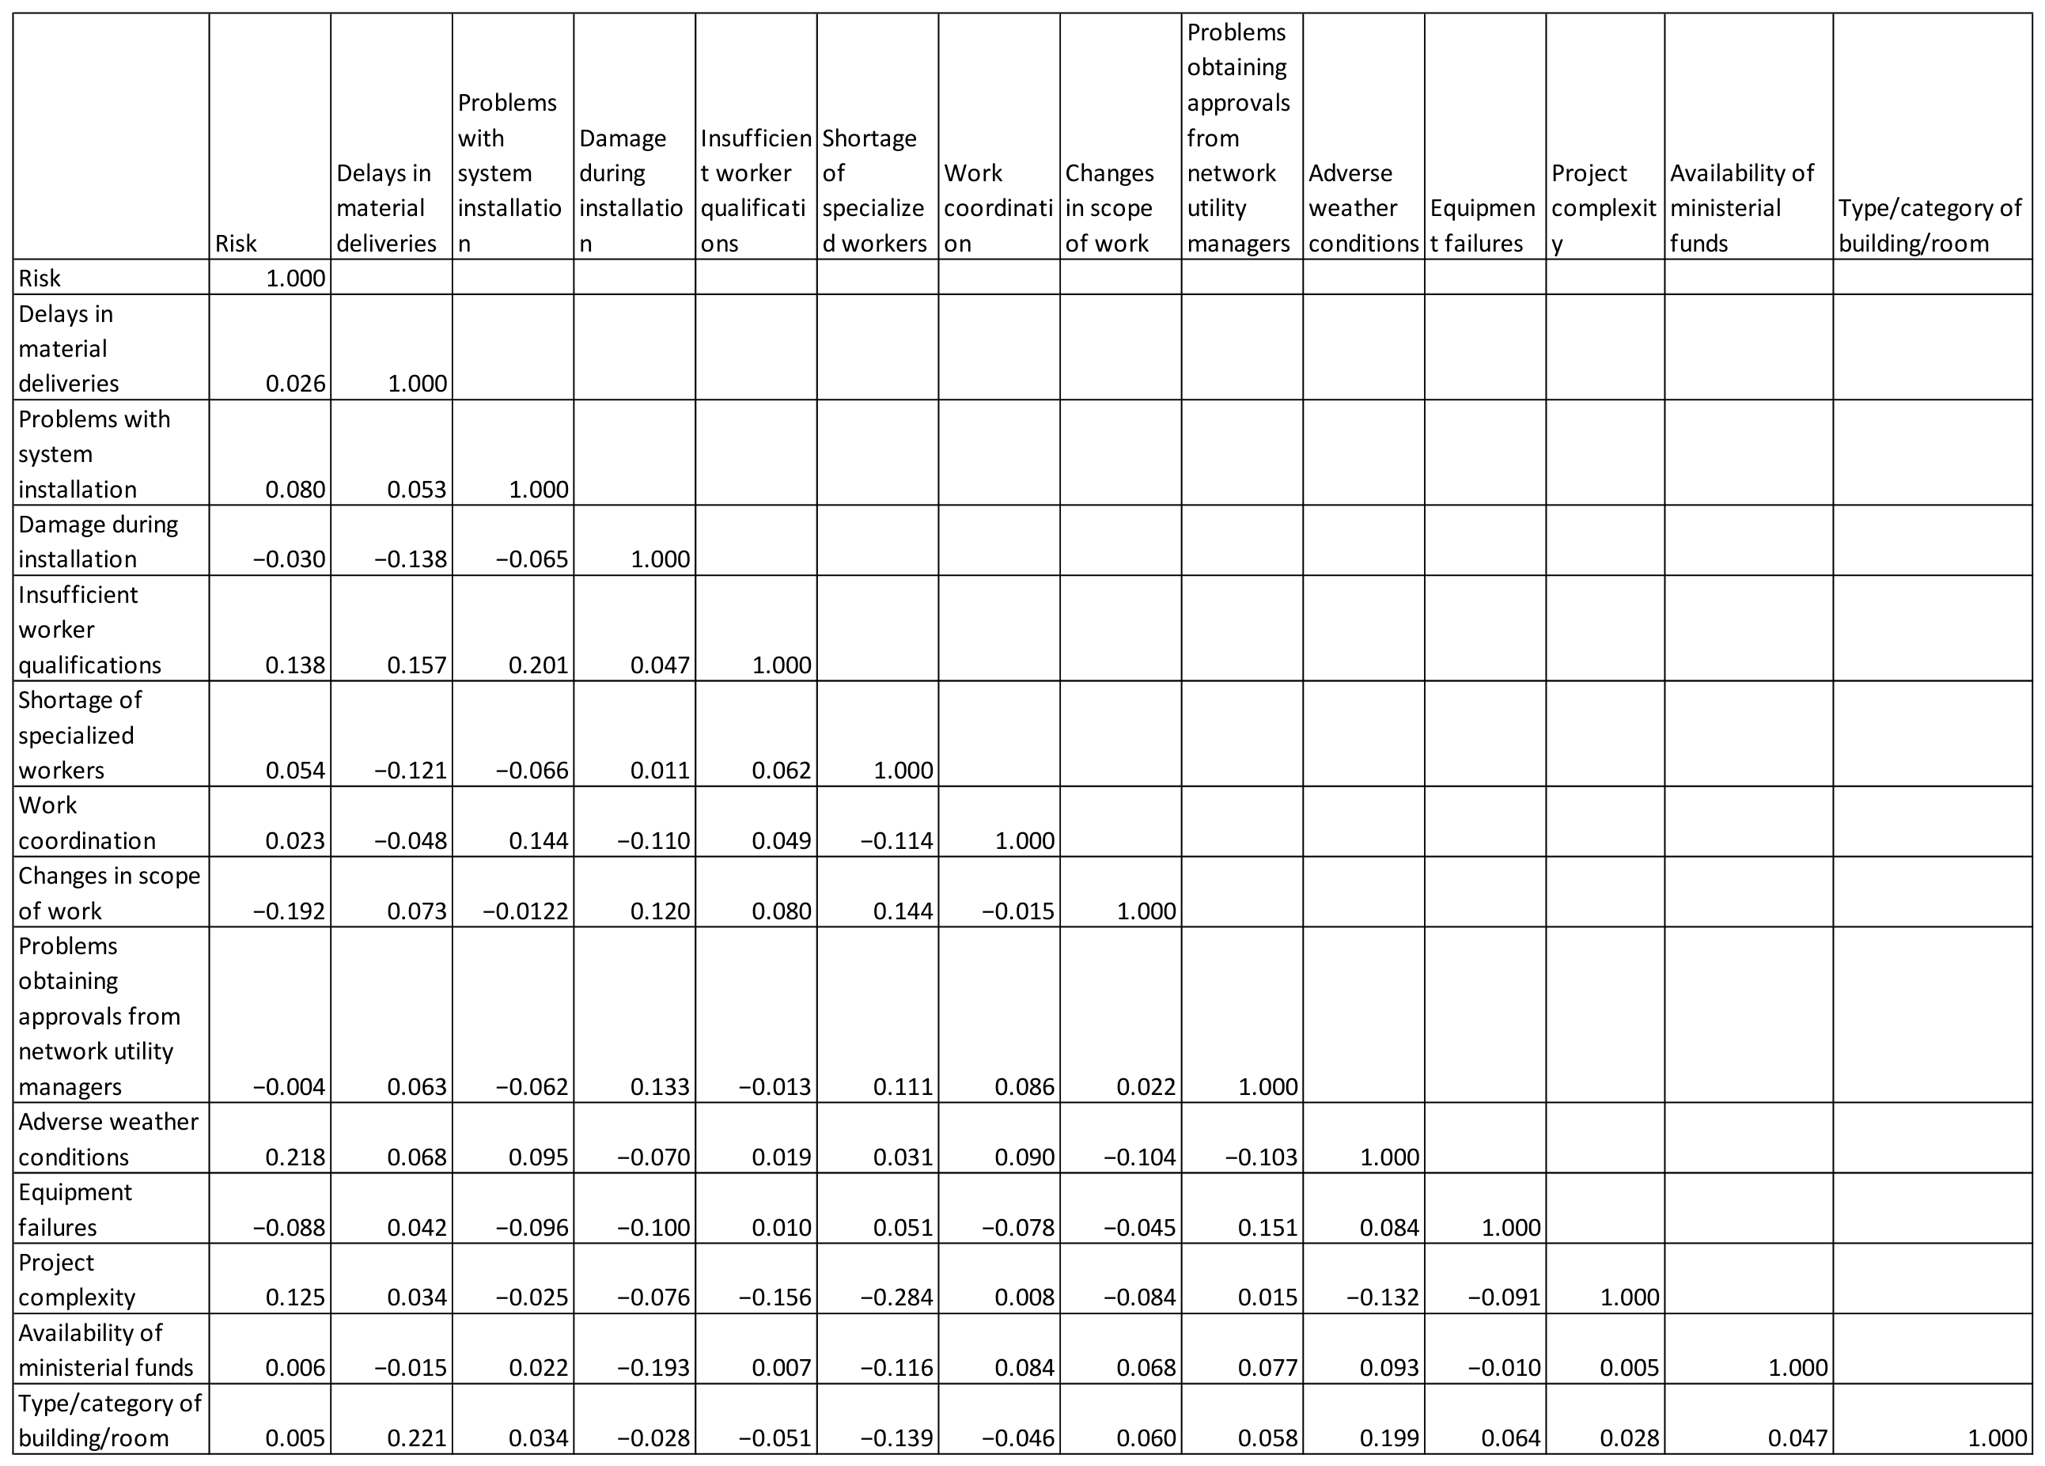
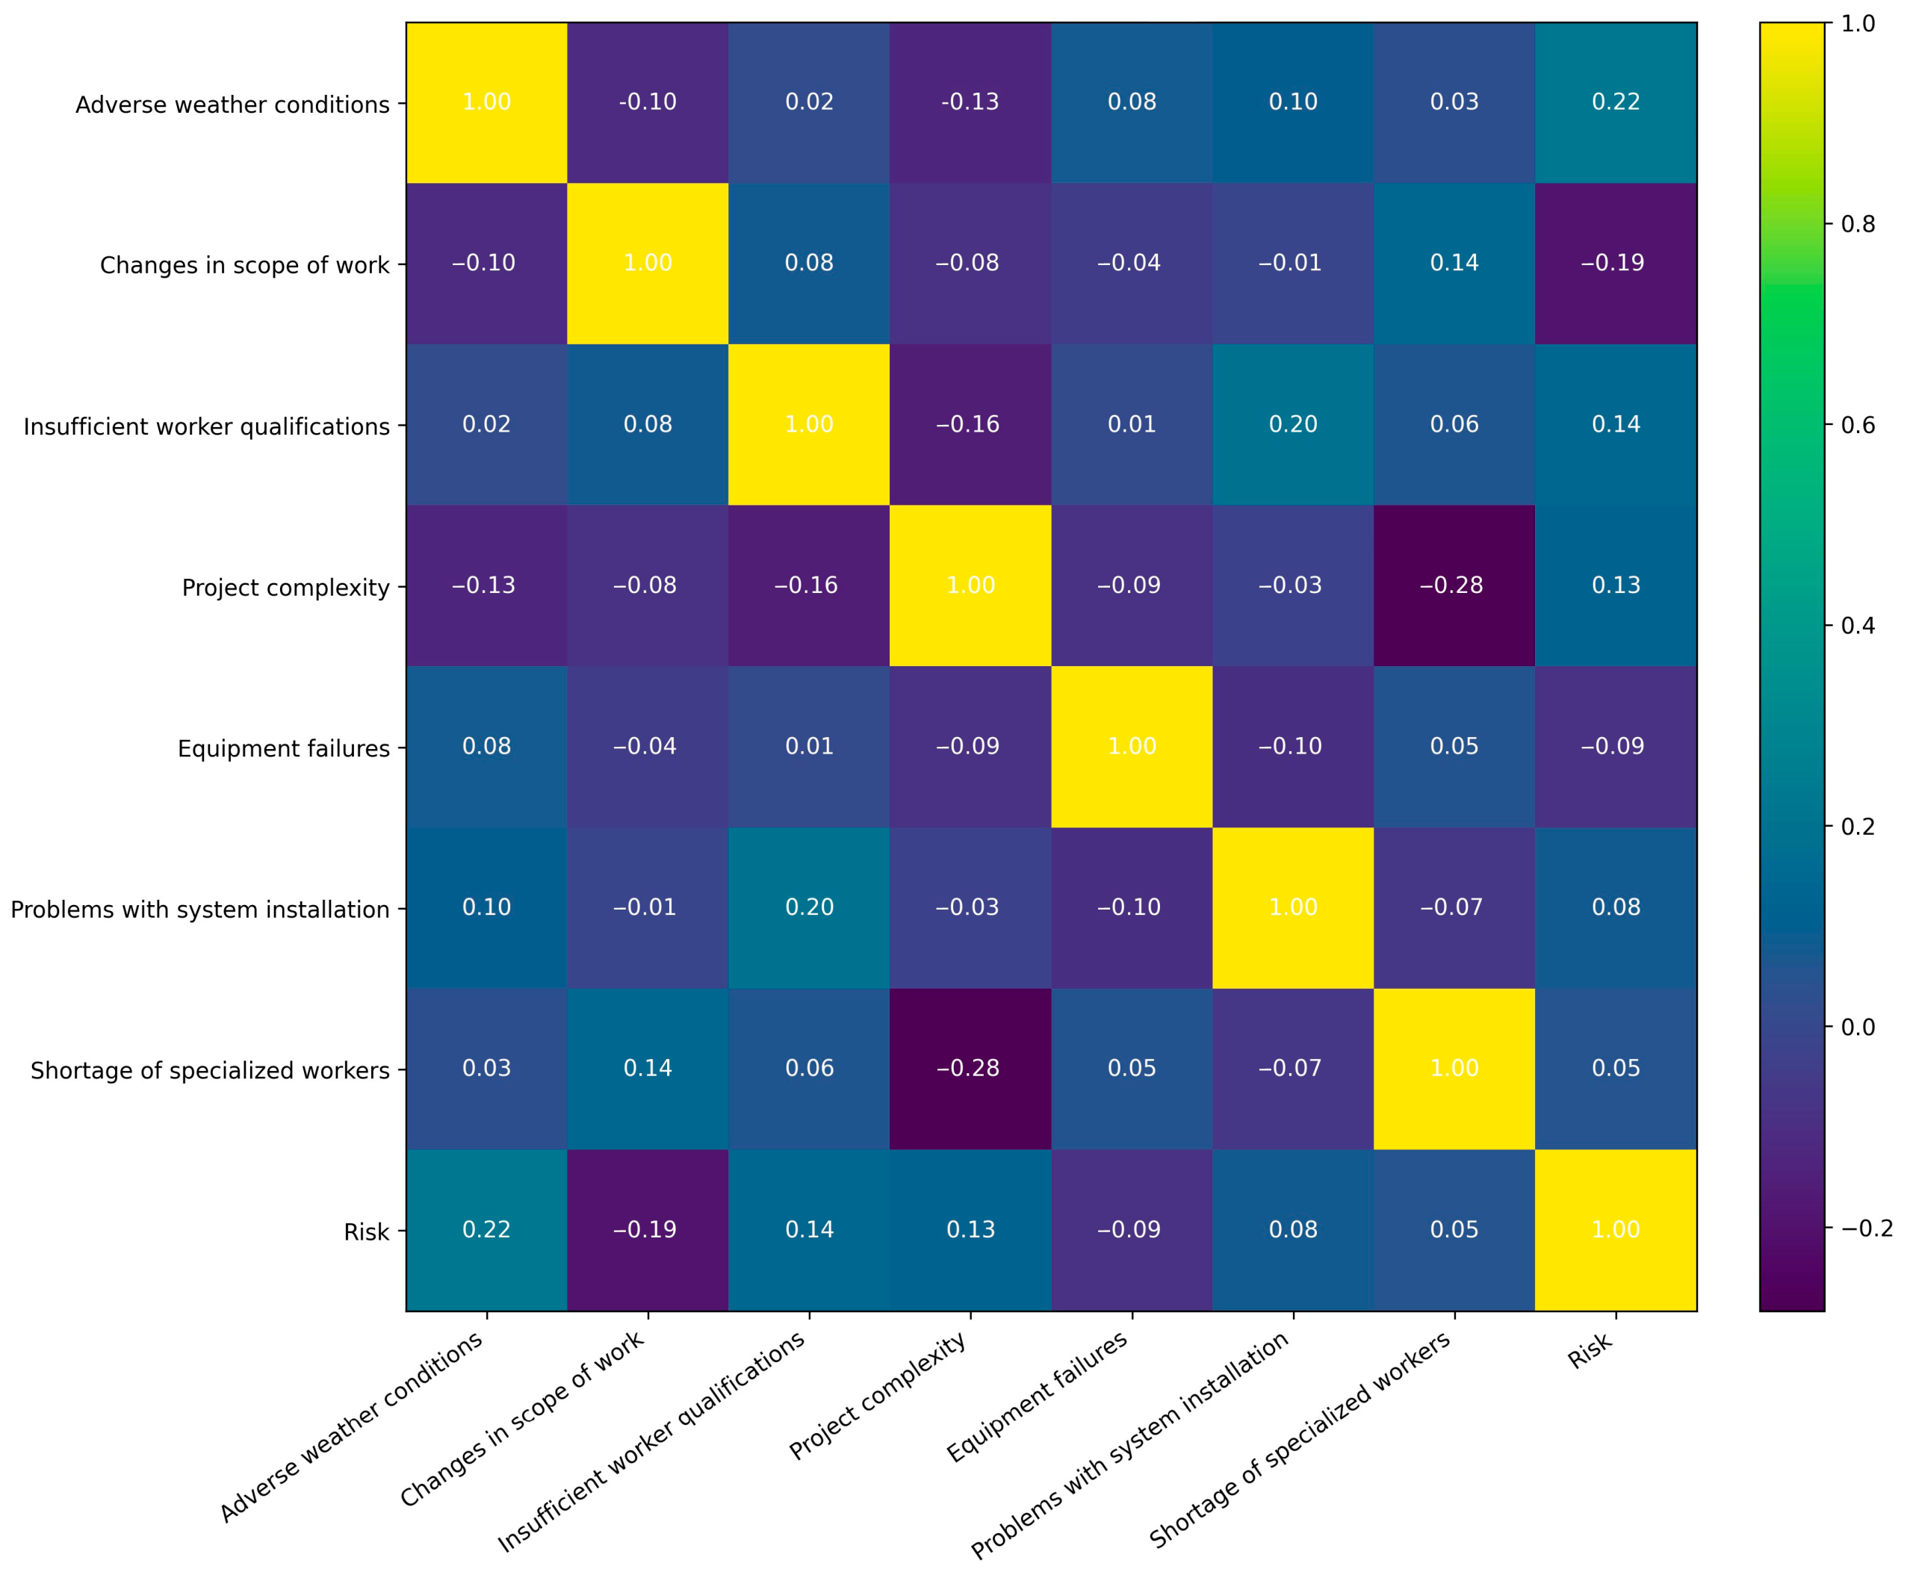
To complement the analysis of predictive performance, an exploratory correlation-based view of the input variables was also prepared. The purpose of this analysis was not to perform formal feature selection, but to provide an additional descriptive perspective on the linear relationships between the analyzed variables and the target risk value. The full correlation matrix is presented in
Figure 3.
To increase transparency, Pearson correlation coefficients were additionally checked for statistical significance. At N = 122, only adverse weather conditions (r ≈ 0.218,
p ≈ 0.016) and changes in scope of work (r ≈ −0.192,
p ≈ 0.035) reached the 0.05 significance level, whereas the remaining correlations should be interpreted as weak descriptive signals rather than statistically robust standalone effects. This result further supports the decision not to treat
Figure 4 as a formal feature-selection outcome.
No strong linear correlations with risk were observed, which suggests that renovation risk was not driven by a single dominant predictor in a directly proportional way. This result does not rule out predictive information in the input variables, as weak pairwise linear correlations may coexist with nonlinear effects, interactions between variables, omitted factors, or uncertainty in the expert-based target assessment. At the same time, weak pairwise correlations do not necessarily imply that individual variables are irrelevant for prediction, because their importance may emerge through interactions with other variables.
A more focused view of the variables with the relatively strongest correlation signal is presented in
Figure 4. This figure highlights the subset of variables that showed the most noticeable linear association with the target variable, although the correlation values remained weak to moderate. The seven variables shown in
Figure 4 were selected by ranking the absolute values of the pairwise Pearson correlations with the target risk variable. Accordingly, the figure represents the seven variables with the relatively strongest linear signal in the dataset, not a reduced feature subset obtained through wrapper, embedded, or recursive feature-selection procedures.
As shown in
Figure 4, the variables with the relatively strongest correlation signal included adverse weather conditions, scope changes, insufficient worker qualifications, project complexity, equipment failures, problems with system installation, and shortage of specialized workers. These variables should not be interpreted as a formally selected reduced feature set. Rather, they represent variables with relatively stronger linear signals in the present dataset and may be considered in future feature-reduction experiments.
3.7. Multiple Linear Regression as a Reference Linear Model
To complement the neural-network comparison, an ordinary multiple linear regression model was estimated using the same 13 explanatory variables and the same continuous risk target. As summarized in
Table 4, the linear model showed weak explanatory power, with Multiple R = 0.388, R
2 = 0.151, adjusted R
2 = 0.049, an overall model
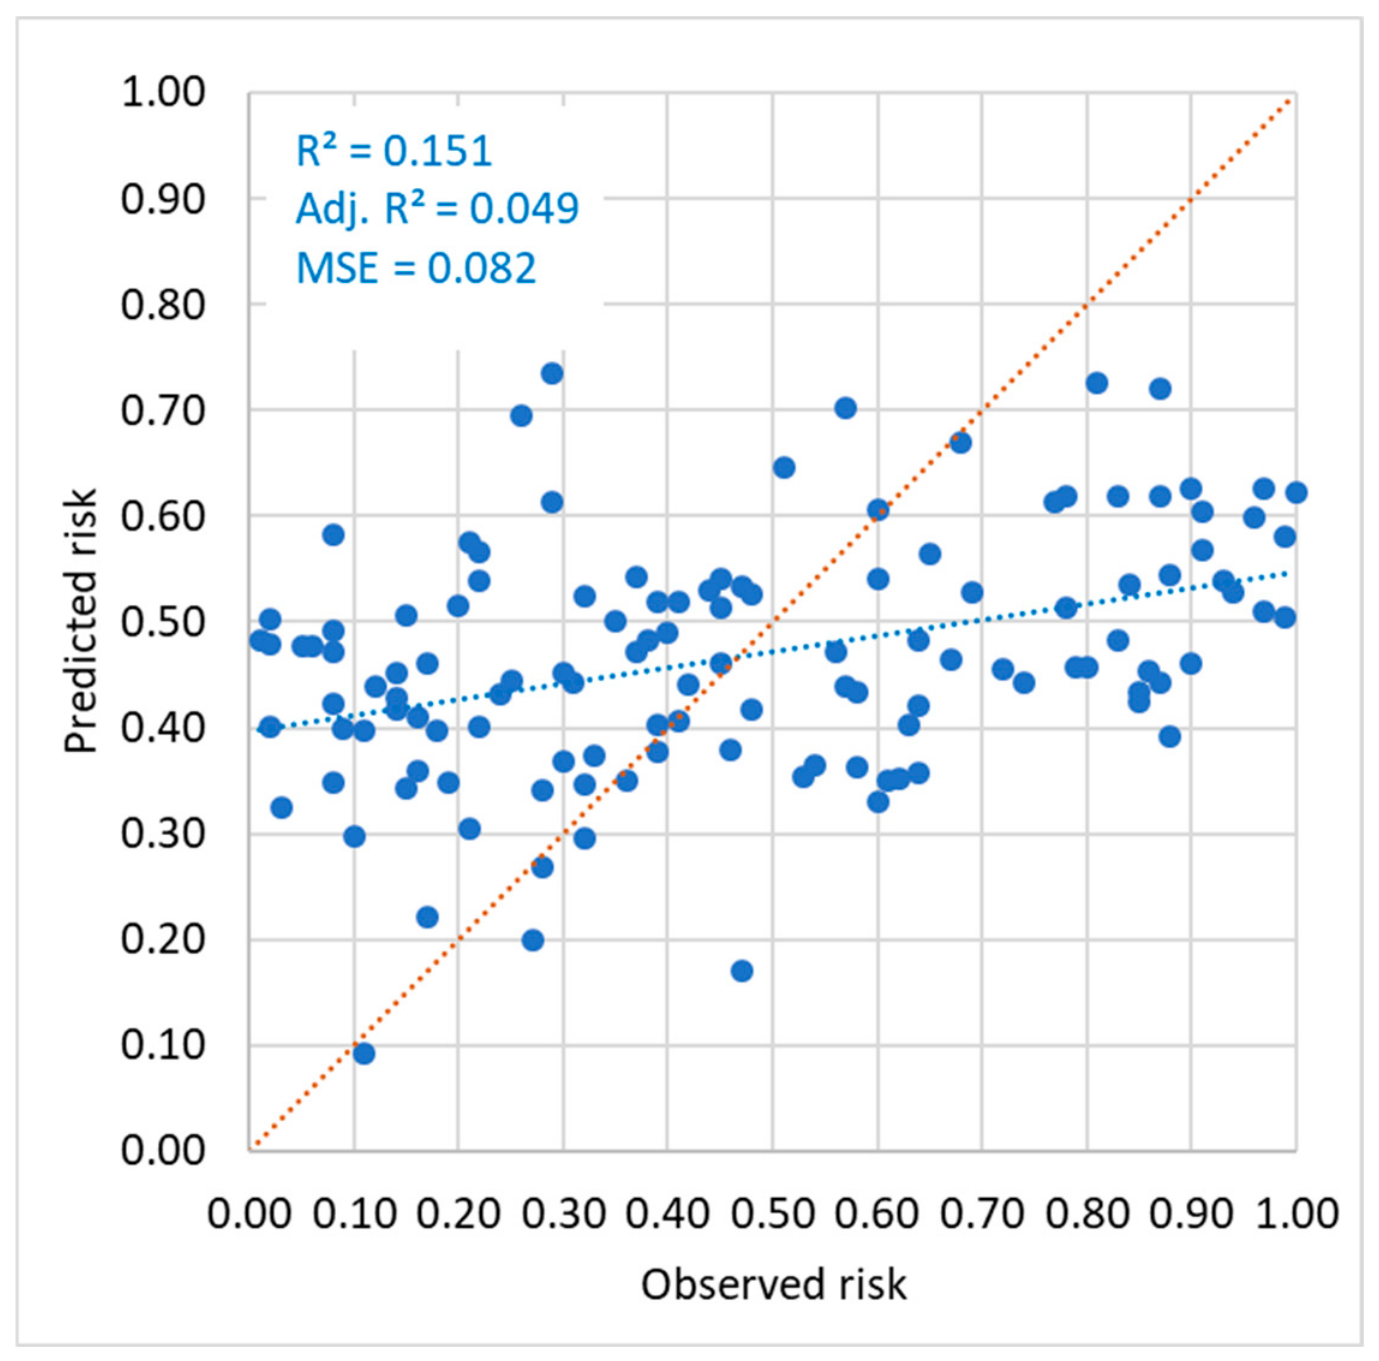
p-value of 0.138. Thus, the linear specification explained only a limited share of the variance in renovation risk and was not statistically significant as a whole at the conventional 0.05 level. As shown in
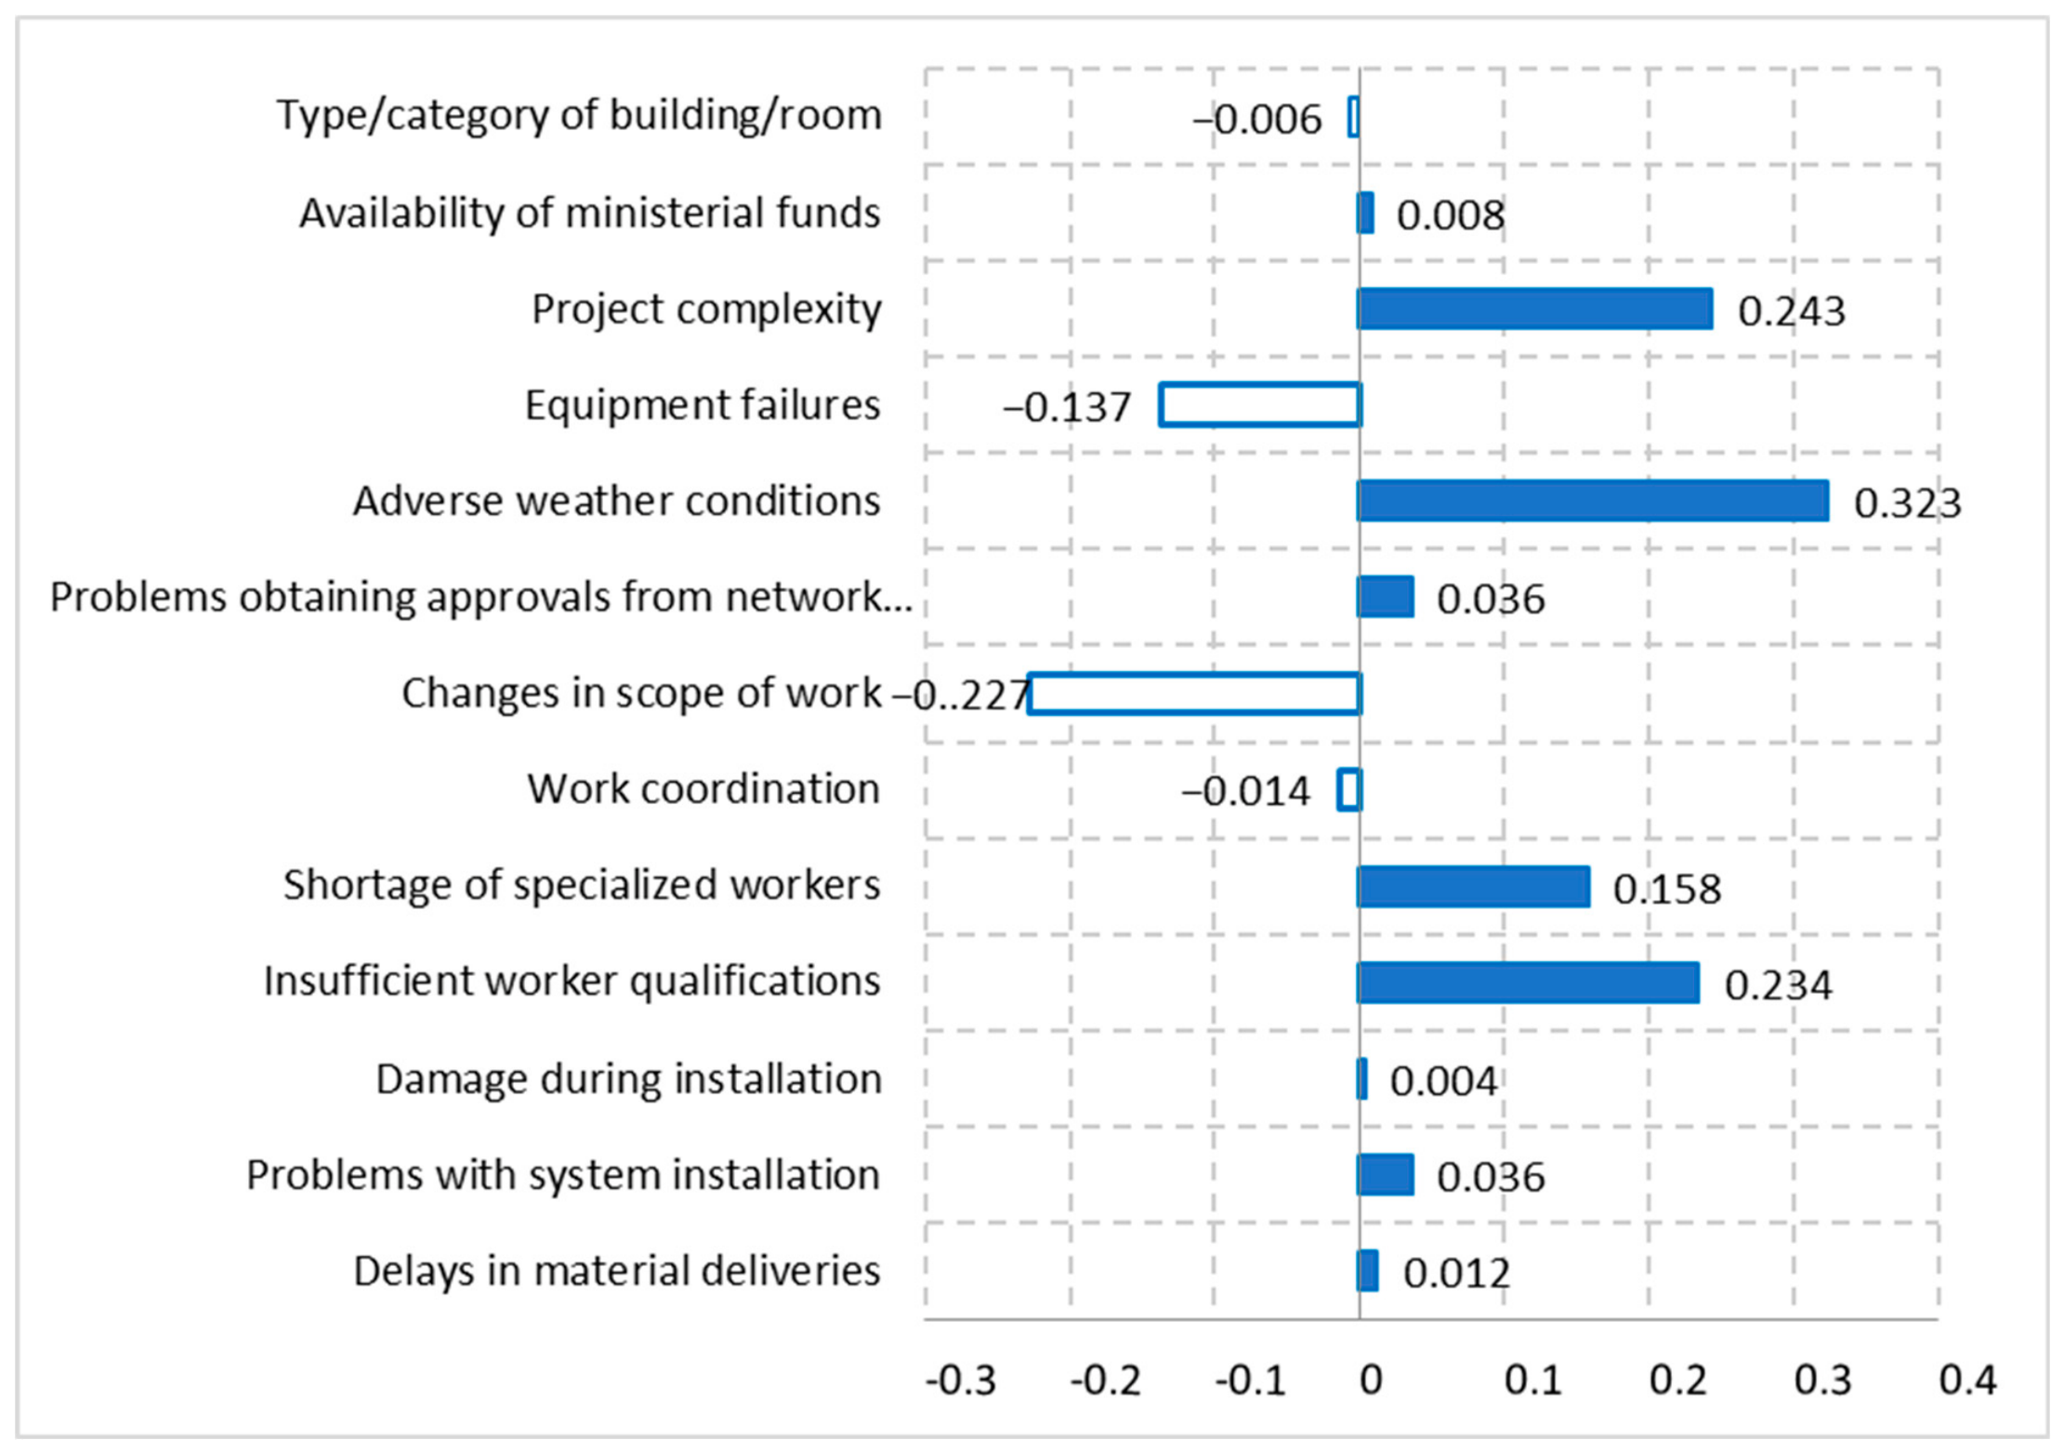
Figure 5, the observed and predicted values were widely dispersed around the trend line, which further indicates weak linear fit. These results should be interpreted cautiously. Nevertheless, they provide contextual evidence that a conventional additive linear model had limited ability to represent the available dataset. In this sense, the linear reference model supports the methodological rationale for examining more flexible nonlinear mappings with MLP. At the coefficient level, only a limited subset of variables reached conventional statistical significance in the full-sample linear model, namely changes in scope of work (b = −0.227,
p = 0.044), adverse weather conditions (b = 0.323,
p = 0.019), and project complexity (b = 0.243,
p = 0.048), while insufficient worker qualifications showed borderline significance (
p = 0.080).
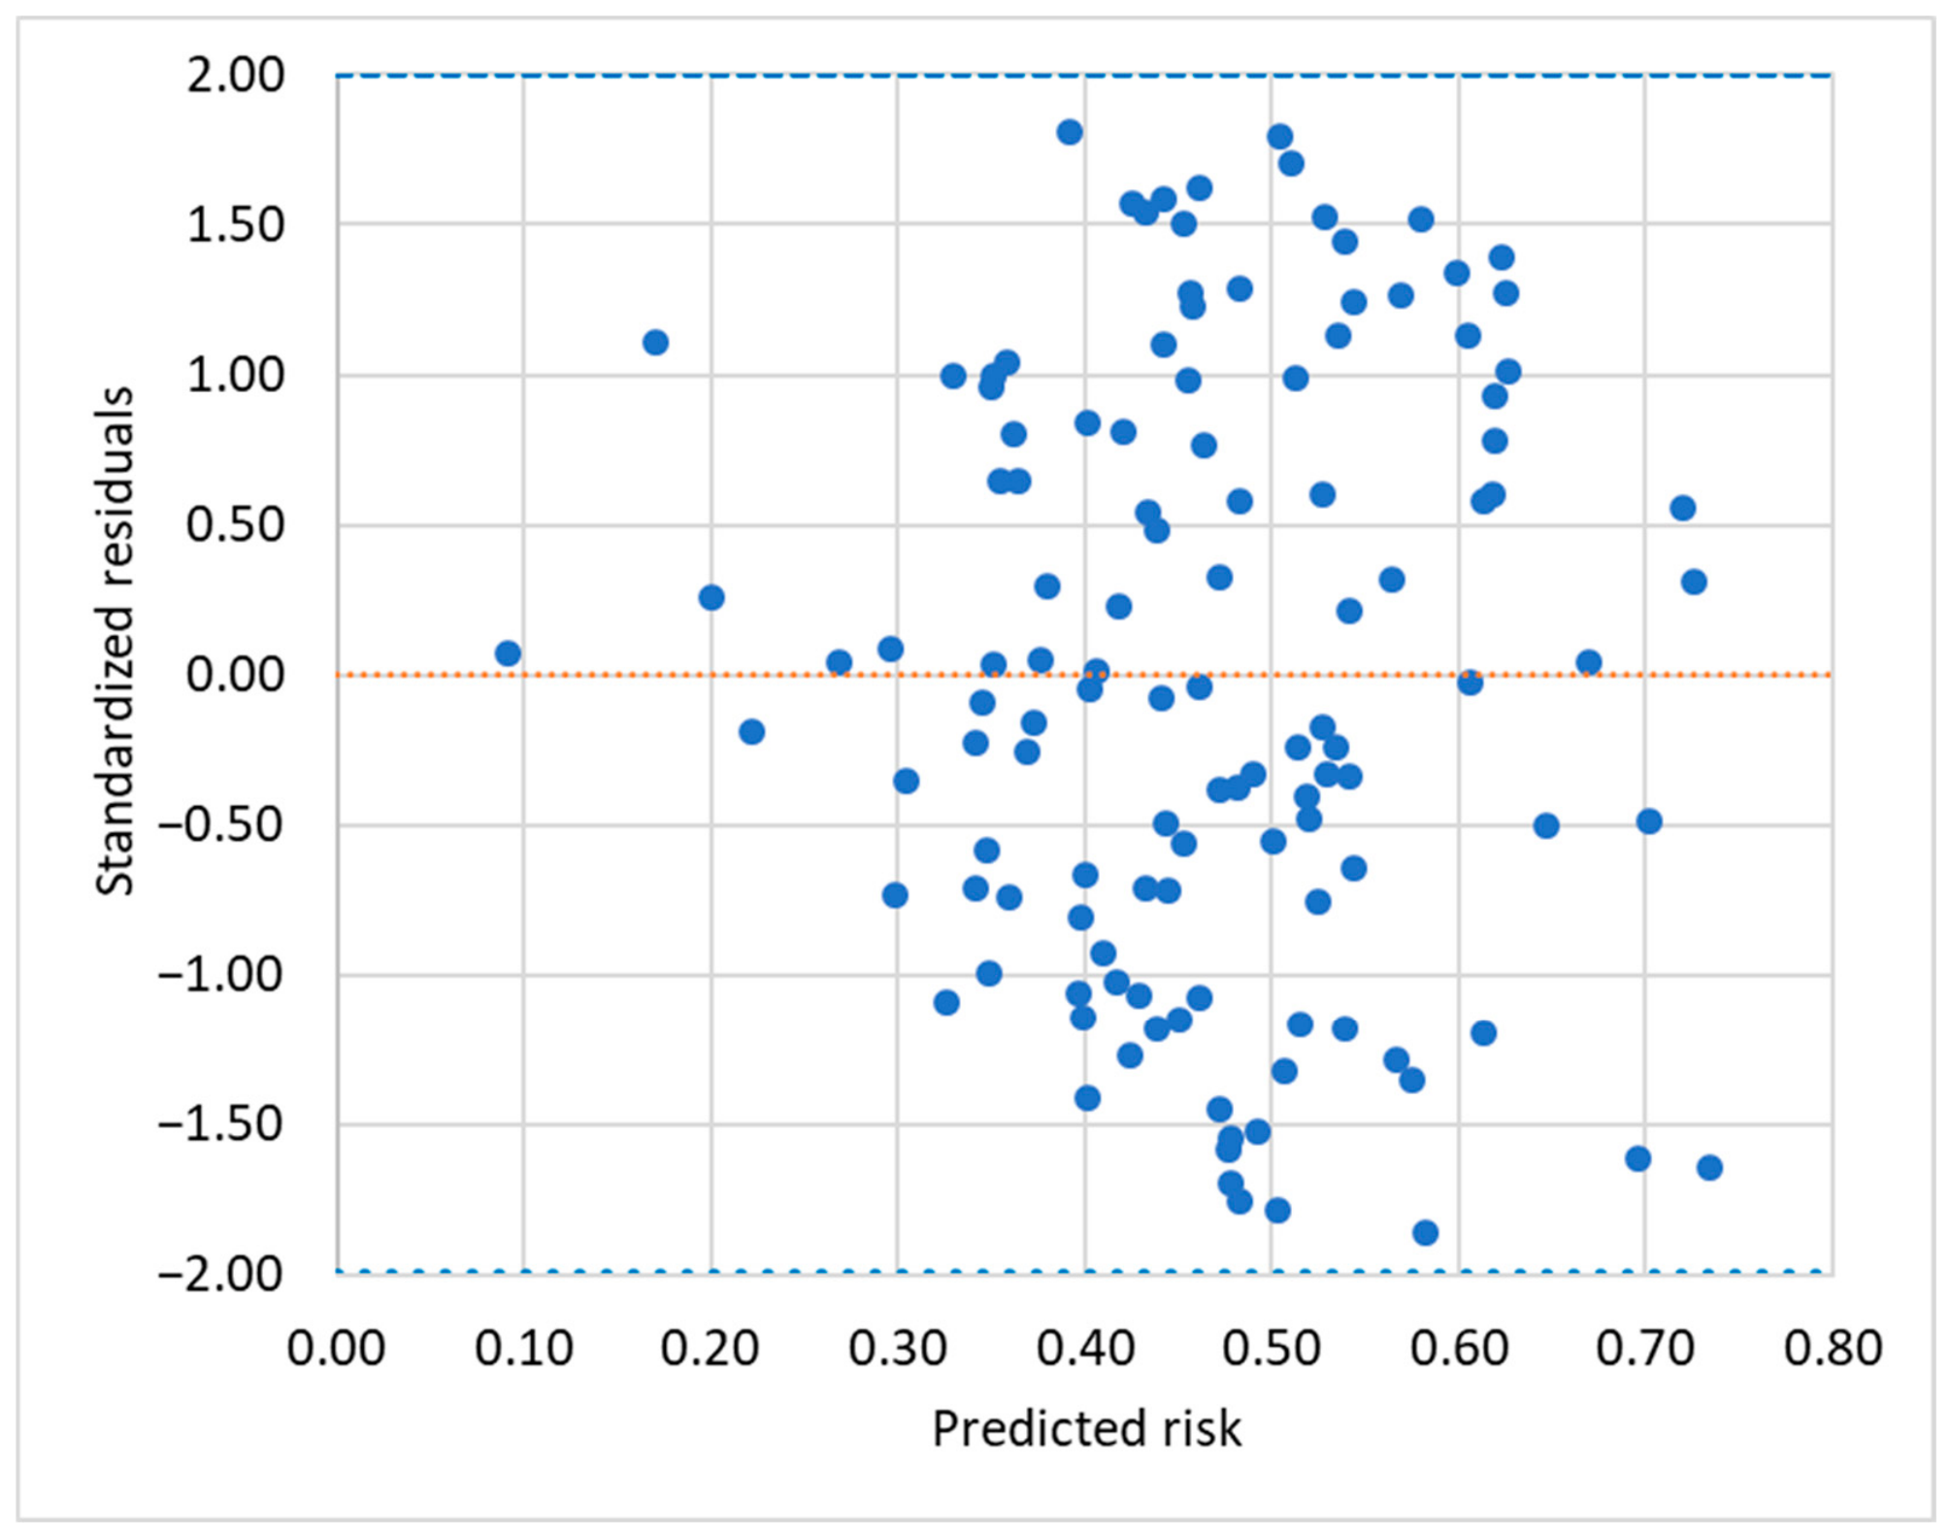
Figure 6 presents the regression coefficients together. Overall, this pattern is consistent with the earlier correlation-based interpretation and indicates that isolated linear effects remain weak and incomplete when considered jointly. Additional diagnostic information is provided by
Figure 7, which presents the standardized residuals plotted against the predicted risk values for the ordinary multiple linear regression model. The residual cloud is relatively broad, which is consistent with the weak full-sample fit reported in
Table 4.
3.8. Contextual Benchmarking and Ablation Analysis
To provide additional methodological context for the limited-data setting, the reference regression models and the MLP ablation analysis described in
Section 2.5 were evaluated. The reference models included Support Vector Regression (SVR), Tree Bagging, and Gaussian Process Regression (GPR). The multiple linear regression model was reported as a full-sample reference analysis. The reference regressors and the unregularized MLP ablation were assessed using 10-fold cross-validation, whereas the proposed MLP architectures were evaluated using the validation-monitored 80/10/10 hold-out procedure. The resulting metrics are summarized in
Table 5.
Across the 10-fold cross-validation procedure, SVR, Tree Bagging, and GPR produced slightly negative mean R2 values. Under the evaluated configurations, their out-of-fold performance did not exceed the mean-prediction baseline. These findings indicate that the selected reference configurations did not provide useful predictive performance for the available dataset. Because these models were evaluated under a different protocol from the proposed MLP architectures, the results should be interpreted as contextual evidence rather than as proof that the underlying risk structure is necessarily non-additive or that the alternative algorithms are generally unsuitable.
MAPE values were high and variable across the cross-validated models, exceeding 179% in every case. This does not indicate that the models are inherently unviable; rather, it reflects the instability of MAPE for this particular target distribution. Because the target renovation risk variable is bounded within a normalized [0, 1] range, several historical projects exhibit true risk levels close to zero. When the actual value in the denominator approaches zero, even minor absolute discrepancies in prediction force the percentage error calculation to artificially explode. Consequently, MAPE was not used in the interpretation of model performance; the cross-validated results were assessed primarily using MAE, RMSE, and R2.
The 10-fold cross-validation ablation study of the unregularized MLP Model 1 yielded a negative mean R2 of −2.8372 ± 2.5063 and an RMSE of 0.5161 ± 0.1318. For this specific configuration, disabling validation-based early stopping was associated with unstable out-of-fold performance and a substantially increased risk of overfitting. However, this experiment does not provide a cross-validated performance estimate for the proposed MLP architectures, including Model 2.
These results support the use of validation monitoring in the adopted MLP workflow. However, they do not establish that 10-fold cross-validation is unsuitable for MLP models or that the hold-out procedure provides a definitive validation of Model 2. Repeated cross-validation with validation-based early stopping active within each training fold remains an important direction for future research.
3.9. Practical Interpretation of the Results
The results also allow several practical observations to be formulated regarding the nature of renovation risk in university buildings.
First, the findings support the view that renovation works in existing buildings are associated with elevated uncertainty, particularly when previous interventions, incomplete documentation, or outdated technical systems affect project conditions.
Second, project complexity may be regarded as a practically relevant contextual variable. Complex projects typically involve more interdependencies between work packages, a larger number of interfaces between technical systems, and greater sensitivity to disruptions. For this reason, complexity may amplify the effects of other adverse events, such as delays, failures, or staffing shortages.
Third, equipment failures may also be operationally relevant. In renovation works carried out in active university buildings, equipment failures may interrupt tightly scheduled operations and cause additional coordination problems, especially when execution windows are limited by continued building use.
Fourth, staff-related variables, including insufficient worker qualifications and a shortage of specialized workers, may be operationally relevant. In renovation projects, especially those involving existing technical systems and nonstandard execution conditions, labor-related limitations may affect work quality, responsiveness to unforeseen problems, and overall project continuity.
These observations should be treated as qualitative, practice-oriented interpretations of the available dataset rather than as independent causal evidence or formal MLP variable-importance rankings. They are broadly consistent with the descriptive correlation patterns discussed in
Section 3.6, while most individual pairwise signals remain weak.
3.10. Summary of Results
The results of the study can be summarized in four main points:
Under the adopted single hold-out setting, Model 2 achieved higher fit and lower error than Model 1. Model 1 achieved R2 ≈ 0.58 and MSE ≈ 0.065, whereas Model 2 achieved R2 ≈ 0.86 and MSE ≈ 0.010.
The graphical comparison of observed and predicted values was consistent with the numerical results. Model 1 reproduced the general trend of the target variable but showed visible discrepancies, while Model 2 achieved a much closer fit.
Under the adopted single hold-out setting, the deeper MLP architecture achieved higher fit and lower error than the shallower architecture despite the limited dataset and uncertainty of the analyzed problem. This finding suggests that the deeper configuration may have provided a more flexible approximation of patterns in the available dataset, but it does not establish the true functional form of renovation risk or a generalizable advantage of this architecture. The contextual benchmarks in
Section 3.8 provide additional methodological context but do not constitute a directly comparable performance ranking, because they were evaluated using different procedures.
The correlation-based analysis did not reveal strong individual linear relationships with renovation risk. It identified several weak descriptive signals; their joint contribution was not directly assessed by the correlation analysis and requires further testing.
4. Discussion
4.1. Organizational Significance of the Results
The results obtained in this study are important not only from a predictive point of view but also from the perspective of construction organization and renovation management in operational university buildings. Within the adopted single hold-out setting, Model 2 achieved higher fit and lower error than Model 1. If it is prospectively validated and the required input information is available before planning decisions are made, the model could provide an additional decision-support input during renovation planning. The result suggests that a quantitative risk estimate could complement, rather than replace, expert judgment.
From an organizational perspective, one of the most direct applications of the model concerns schedule planning. In renovation projects carried out in active university buildings, the schedule is not merely a technical sequence of activities but also a mechanism for balancing construction works with teaching, administration, and building accessibility. Where relevant input data can be assessed before execution, an early estimate of elevated risk could help planners consider more realistic time contingencies, avoid overly optimistic sequencing, and review work packages requiring additional attention. This is especially important in phased renovation works, where one delayed package may affect access to subsequent tasks or interfere with the operation of the building. Following prospective validation, a continuous risk estimate could be considered as one input supporting schedule development and review.
A second important area of application concerns resource allocation. The analyzed predictors include variables directly related to labor shortages, insufficient qualifications, equipment failures, coordination problems, and funding availability. These factors provide potentially relevant organizational and technical context for the assessment of renovation cases. In a future validated implementation, an elevated risk estimate could prompt project managers to consider adjustments to staffing plans, the availability of specialized subcontractors, reserve equipment, or supervision of selected work packages. In this sense, the model could eventually serve as one decision support input for aligning organizational resources with anticipated project difficulty; this application requires prospective validation.
The considered variables, including project complexity, equipment failures, and staff-related limitations, provide a plausible organizational context for interpreting renovation risk; however, this study did not estimate formal MLP variable importance or establish independent causal effects.
A possible future application of a validated model could concern the identification of bottlenecks in renovation planning. In renovation works, bottlenecks often arise not only from physical constraints but also from organizational discontinuities, such as the limited availability of specialists, delays in utility approvals, restricted access to rooms, and scope changes during execution. The present study does not directly identify bottlenecks or quantify the joint contribution of individual variables. Nevertheless, a future validated model using such variables could be explored as a supporting input for recognising potentially vulnerable combinations of project conditions. This is particularly valuable in university buildings, where the presence of users, operational schedules, and limited intervention windows increase the importance of identifying organizational bottlenecks before works begin.
Another important practical implication concerns phasing decisions in occupied buildings. University facilities are often renovated while remaining partly in use. Under such conditions, decisions about whether to execute works simultaneously, sequentially, or in isolated zones have direct implications for safety, accessibility, and project continuity. If a model were prospectively validated and its input variables were available at the relevant decision stage, a risk estimate could help inform whether the planned scope should be split into smaller phases, whether more conservative staging should be adopted, or whether specific parts of the building require temporary exclusion from use. In this context, the model does not replace managerial judgment, but it may support it by providing an additional quantitative indication of the anticipated difficulty of a renovation case.
The higher fit of Model 2 in the adopted single hold-out split may reflect the greater flexibility of the deeper architecture; it does not, however, establish hidden feature synergies or a complex multivariable risk process. Such interactions are plausible in renovation practice—for example, labor shortages or restricted work windows may compound the consequences of other disruptions—but their presence and importance were not directly tested in this study. The result therefore indicates only that, in this exploratory comparison, the deeper architecture approximated the available dataset more closely than Model 1.
The deeper architecture may have provided a more flexible approximation of patterns in the available data. However, the observed difference between the two models cannot be used to infer the true structure of the underlying risk process or to conclude that a deeper network will perform better in other renovation datasets. The heterogeneity of renovation works in existing university buildings provides a rationale for examining flexible nonlinear models in future studies, but this requires validation beyond a single hold-out split.
The exploratory result obtained despite the relatively small and uncertain dataset suggests a potential direction for further work on decision-support tools in renovation management. It does not yet demonstrate practical usefulness, but it indicates that predictive approaches could be explored in settings where large, fully standardized datasets are unavailable. In renovation practice, this is a critical point. Unlike highly repetitive industrial tasks, university renovation projects are heterogeneous and context-specific. Any practical value in such settings depends on prospective and external validation, as well as verification that the required predictors are available at the point of use.
Finally, the study suggests that AI-based models could, after appropriate validation, complement traditional risk management procedures in public renovation projects. In this role, the model should be understood not as an autonomous decision maker, but as a support instrument that could contribute to schedule review, resource-planning discussions, the assessment of potentially vulnerable work packages, and phasing decisions. Such use may be particularly relevant in old, partially documented, and operational facilities, provided that the model is validated for the intended decision stage and used alongside managerial judgment. This interpretation is consistent with recent studies on AI-supported retrofit analytics, ANN-based construction risk management, and machine learning approaches to renovation cost and rework prediction [
18,
19,
20,
21,
22,
36].
4.2. Correlation-Based Interpretation and Future Feature Reduction
The correlation analysis performed in this study should be interpreted strictly as a discussion tool and heuristic aid, not as a formal feature-selection procedure. Its role was to provide an additional perspective on the structure of the dataset and to indicate which variables exhibited the strongest visible linear signal with respect to the target risk value. It was not used as the basis for redesigning the predictive model, and no retraining or comparative testing was conducted after removing any variables. Therefore, the observations presented in this subsection should be treated as exploratory and interpretive rather than confirmatory. This distinction is important because the final predictive results of the study were obtained using the full 13-variable input set.
According to the correlation screening presented in the attached materials, no input variable exhibited a strong absolute linear correlation with the target risk value greater than 0.5. At the same time, several variables showed a relatively stronger signal than the others. The seven most visible signals were associated with the following variables: adverse weather conditions (approximately 0.22), scope changes (approximately −0.19), insufficient worker qualifications (approximately 0.14), project complexity (approximately 0.13), equipment failures (approximately −0.09), problems with system installation (approximately 0.08), and shortage of specialized workers (approximately 0.05). These values do not indicate strong linear dependence and should be interpreted only as descriptive signals in the present dataset; they do not establish independent predictive importance or causal relevance.
From a methodological perspective, the correlation analysis indicates that no input variable showed a strong isolated linear association with the final renovation-risk score. Weak or statistically non-significant pairwise correlations do not determine whether a variable may contribute to a multivariable predictive model, but they also do not demonstrate nonlinear effects, interactions, or threshold behavior. The higher fit of Model 2 within the adopted single hold-out setting is compatible with the possibility that a deeper architecture provided a more flexible approximation of the available data; however, it does not establish hidden feature synergies or prove that the renovation-risk process is governed by complex multivariable interactions.
Any future attempt to reduce the input set on the basis of the observed correlations should therefore be treated cautiously. In the present study, the correlation results were used only to identify a possible reduced subset of variables for future research. No retraining, revalidation, or retesting was performed after removing any features, and therefore no formal claim can be made that a reduced feature set would perform better, equally well, or worse than the original 13-variable model. This remains an open question and should be addressed in further studies through systematic feature reduction experiments, followed by direct comparison of predictive performance. The present article does not provide such evidence and deliberately avoids overstating the implications of the correlation analysis.
The weak correlation pattern may be explained in several ways.
First, the results may reflect the high uncertainty and partial subjectivity of renovation risk assessment. In real renovation projects, especially in existing university buildings, the observed risk level is rarely a simple function of one dominant factor. Instead, it is shaped by accumulated professional judgments, unexpected discoveries during execution, dynamic site conditions, and contextual project constraints. Variables such as project complexity, staff shortages, and coordination problems may influence risk in ways that depend on managerial interpretation and local conditions. As a result, the target output may contain a degree of subjectivity or fuzziness that weakens direct linear associations between individual inputs and the final risk value.
Second, the weak correlations may result from the absence of some potentially important explanatory variables from the current dataset. The presentation explicitly notes that the analyzed data may not include all variables relevant to risk. Examples of omitted factors may include the technical condition of the building, year of construction, history of previous renovations, structural type, and other descriptors of the existing object that could help explain part of the uncertainty associated with renovation works. In older university buildings, such omitted variables may be especially important, because hidden degradation, undocumented interventions, and accumulated building-system incompatibilities often affect risk more strongly than what is visible in a limited input set.
Third, weak pairwise correlations may be compatible with nonlinear or threshold-like relationships, but the present analysis did not test these mechanisms. In renovation works, some predictors may have limited apparent effects until they occur alongside other constraints; for example, an equipment issue may be more consequential when combined with restricted access or labor shortages. Such possibilities are not captured by simple pairwise correlations, which describe average monotonic associations between two variables at a time. Therefore, weak correlations do not by themselves establish either irrelevance or nonlinear predictive value; both issues require direct evaluation in a consistently validated modelling framework.
The correlation analysis should therefore be treated as an interpretive supplement to the predictive results rather than as an explanation of why Model 2 achieved higher fit. It indicates only that the variables did not display strong individual linear relationships with the target score. It does not identify formal feature importance, joint effects, or the mechanisms underlying the differences between the compared architectures.
In practical terms, the exploratory correlation results still provide a useful managerial message. They suggest that variables such as adverse weather, scope changes, project complexity, equipment failures, and staffing-related deficiencies deserve close attention during renovation planning, even if their direct linear influence appears moderate. Their importance may lie not in isolated effect size, but in their role as components of broader configurations of uncertainty.
The supplementary multiple linear regression analysis alongside the alternative machine learning benchmarks further supports this interpretation. In contrast to the high-capacity MLP models, ordinary multiple regression explained only a limited part of the variance in renovation risk (R2 = 0.151; adjusted R2 = 0.049), while the selected SVR, Bagging, and GPR configurations produced negative mean R2 values under 10-fold cross-validation. Taken together, these results are consistent with the possibility that a purely additive linear specification did not adequately represent the available dataset; however, the different evaluation procedures do not allow a direct ranking of the reference models against the proposed MLP architectures.
4.3. Limitations of the Study
The findings of the present study should be interpreted in light of several important limitations.
The first limitation is the small sample size. The dataset comprised only 122 renovation cases, which is relatively limited for neural-network-based modeling. Although the deeper model achieved promising predictive results within this dataset, small samples may increase the risk of instability in generalization. In other words, the trained network may reflect not only real structural patterns but also some characteristics specific to the analyzed sample. This does not invalidate the results, but it means that they should be interpreted as promising rather than definitive. A larger dataset would make it possible to test whether the observed superiority of Model 2 remains stable under broader empirical conditions.
In addition, the relatively high complexity of the deeper MLP architecture in relation to the sample size means that the possibility of overfitting cannot be completely excluded. For this reason, the obtained performance should be interpreted as evidence of promising predictive capacity within the analyzed dataset rather than as proof of universal model generalizability.
The second limitation concerns the lack of external validation. The models were developed and evaluated within a single analytical context and were not tested on an independent dataset from another university, campus, or institutional environment. As a result, it is not yet possible to determine to what extent the predictive performance observed in this study would transfer to renovation projects carried out in other building stocks or under different organizational conditions. This is particularly important in university renovation, where the age of the buildings, campus organization, technical infrastructure, funding mechanisms, and operational patterns may vary substantially from one institution to another.
The third limitation concerns the absence of post-reduction testing after the correlation-based interpretation of input variables. Although the analysis identified variables with relatively stronger correlation signals, no new models were trained using a reduced set of predictors. Therefore, the study does not determine whether a more compact input set would preserve, improve, or reduce predictive performance.
A further limitation, closely connected with the previous points, is that the current dataset may not fully capture the entire informational structure of renovation risk in existing university buildings. As already discussed, some potentially relevant variables were not included, such as more explicit descriptors of building age, technical degradation, or renovation history. The omission of such variables may partly explain both the uncertainty of the target output and the weak pairwise linear relationships observed in the correlation screening.
Finally, the benchmarking scope remained limited. Although SVR, Tree Bagging, and GPR were included as contextual reference models, the study did not examine other potentially relevant model families, such as random forests, gradient boosting, or other neural-network variants. The present findings should therefore be interpreted as evidence that the deeper MLP achieved higher fit than the shallower MLP within the adopted hold-out setting, rather than as proof of universal superiority over alternative predictive methods. Finally, the present study did not include a broader benchmark against other model families, such as random forests, gradient boosting, support vector regression, or other deep-learning variants.
Despite these limitations, the study provides a meaningful contribution. It shows that renovation risk in university buildings can be modeled as a continuous output using real project data, that network depth has a clear influence on prediction quality, and that nonlinear modeling may be useful when pairwise linear correlations between individual variables and the target output are weak. At the same time, the limitations indicate the need for larger datasets, external validation, formal feature-reduction experiments, and broader comparative analyses against alternative machine-learning models.
5. Conclusions
This study examined the use of multilayer perceptron regression for predicting the risk level of renovation works in existing university buildings. The proposed approach treated renovation risk as a continuous output variable and analyzed whether the depth of a feedforward neural network affected predictive performance under conditions of limited data and elevated uncertainty.
Within the adopted 80/10/10 hold-out split, the deeper MLP architecture achieved higher fit and lower MSE than the shallower model, reaching R2 ≈ 0.86 and MSE ≈ 0.010, compared with R2 ≈ 0.58 and MSE ≈ 0.065 for Model 1. This result is encouraging, although it should be interpreted as an exploratory comparison based on a single data split. The multiple linear regression analysis showed limited full-sample explanatory power (R2 = 0.151), while the selected SVR, Tree Bagging, and GPR configurations produced negative mean R2 values under 10-fold cross-validation. Because these analyses were conducted using different evaluation procedures, they should not be read as one directly comparable ranking of all models. They do, however, indicate that non-linear approaches are worth investigating further for the present dataset.
From a practical perspective, the proposed approach is not intended to replace the judgement of project teams. After prospective validation, and provided that the required input information is available at the relevant decision stage, a continuous risk estimate could serve as an additional source of information during renovation planning. In university buildings that remain in use during construction, such an estimate could be considered when reviewing schedules, discussing phasing options, planning contingencies, or allocating technical and organizational resources.
The study should nevertheless be regarded as a proof of concept. In the ablation analysis, Model 1 showed unstable out-of-fold performance when validation-based early stopping was disabled. This result underlines the importance of validation monitoring in the adopted workflow, but it does not mean that 10-fold cross-validation is unsuitable for MLP models, nor does it provide a cross-validated estimate for the pro-posed architectures. Given the limited dataset and the lack of external validation, the reported performance values should be treated as exploratory rather than as evidence of stable generalizability.
Overall, the study shows that renovation risk in existing university buildings can be explored as a continuous output using available project data. Within the adopted hold-out setting, the deeper architecture provided a closer fit to the observed data than the shallower model. Future work should test this finding using repeated resampling, multiple random seeds, external and multi-institutional datasets, feature-reduction experiments, and alternative models evaluated under the same validation procedures.




 ,
,