Article

Effectiveness of Monitoring Neuromuscular Fatigue in Australian Football Players Using the Countermovement Jump

1
Curtin School of Allied Health, Curtin University, Perth 6102, Australia
2
Fremantle Football Club, Perth 6102, Australia
*
Author to whom correspondence should be addressed.
Appl. Sci. 2026, 16(14), 6883; https://doi.org/10.3390/app16146883
Submission received: 18 May 2026 / Revised: 2 July 2026 / Accepted: 8 July 2026 / Published: 9 July 2026

Abstract

Muscular fatigue, encompassing both short-term and long-term fatigue, presents a critical challenge in sports like Australian Football (AF) due to its impact on athlete performance and preparation readiness. Within the elite training environment, the intricacies of prolonged neuromuscular fatigue underscore the necessity for practical monitoring methods, like the countermovement jump (CMJ), to comprehend athlete readiness, performance, and the dynamic aspects of player load and positional changes. This research investigates how CMJ performance changes in professional AF athletes during the pre-season and in-season phases, taking into consideration the possible impact of training load and athlete positions. Forty-two elite AF athletes from a professional AF club underwent standardized CMJ testing throughout the pre-season and the first eight matches of the 2023 competitive season. Significant time effects were observed, with a 4% increase in mean jump height among Midfielders from the early to late pre-season, accompanied by a 7% reduction in countermovement depth. Changes in CMJ height performance following the first eight matches were negligible and non-significant; however, variables describing how athletes maintained this performance did substantially change. The study outcomes highlight the need to interpret changes in how any given performance was achieved more closely than an outcome variable alone. Doing so offers insights for targeted training interventions and informed coaching decisions that could assist with optimizing performance throughout the competitive season.

1. Introduction

Muscular fatigue is a physiological phenomenon that can be defined as a reduction in the maximal force or power output of a muscle group [1]. In sports such as Australian Football, reductions in force and power output can lead to performance deficits and limit an athlete’s ability to generate and maintain high-intensity efforts [2]. Fatigue management is crucial in preserving an athlete’s sporting performance and readiness to train [3]. Fatigue can be categorized as either short-term or long-term, with the former occurring during and immediately after exercise and generally dissipating in less than 3 h and predominantly related to a compromised metabolic state that restricts energy availability [4]. The latter, often referred to as neuromuscular fatigue, is characterized by a prolonged decrease in a muscle’s ability to generate force and power following a period of recovery [3].
Typically, a period exceeding 48 h is required for the body to dissipate neuromuscular fatigue and return to homeostasis [5]. To further understand neuromuscular fatigue, the condition can be dichotomized into peripheral and central origins of action [3]. Peripheral fatigue arises in the neuromuscular junction, whereby during a period of prolonged exercise, the neuromuscular junction becomes less responsive, culminating in reduced neural input to muscular contractions [6]. As a result, the ability to initiate and sustain forceful contractions is diminished. Central fatigue involves processes within the central nervous system (CNS) that diminish direct overall neural drive to muscles [6]. Complex interactions within the CNS including neurotransmitter activity and neuromodulation result in altered motor unit recruitment, ultimately compromising force and power production of working muscles [6].
Monitoring and assessing the efficacy and efficiency of the stretch-shortening cycle (SSC) has been used previously for non-invasively quantifying neuromuscular fatigue [7,8]. Neuromuscular fatigue leads to reductions in muscle activity during the SSC and this can be routinely monitored through various laboratory or field-based assessments [7]. Whilst laboratory tests for fatigue monitoring, particularly neuromuscular fatigue, furnish a higher degree of experimental control, they can be comparatively invasive. They include single or multi-joint assessment, isometric and dynamic muscle contractions, muscle stimulation or voluntary muscle activation, all performed on various dynamometers [9]. Alternatively, field tests offer higher ecological validity, though at the expense of experimental control. The countermovement jump (CMJ) is one example of a field-based test, and indeed is the most commonly reported task for assessing and monitoring the presence of neuromuscular fatigue [10]. The CMJ is easy to administer, and possesses high reliability and validity, particularly when performed using a force plate as the data recording tool [11]. Previously Cormack and colleagues verified the CMJ as a valid and reliable assessment of neuromuscular fatigue in an AF population [12]. Within this investigation Cormack et al. observed the largest effect size for the decrease in flight time to contraction time ratio (FT:CT) at 48 h post competition, with a return to near pre-competition values by 72 h post-competition, reflecting the expected timeline for recovery of neuromuscular fatigue [12].
Immediate acute decreases in CMJ-derived variables of FT:CT, relative mean power, relative mean force, and mean power collected during a single CMJ pre- and post-match play have been reported and these acute changes in FT:CT remain present across an entire competition period in an elite AF population [12]. However, positional differences in AF populations and changes from pre-season to in-season have not yet been reported. In contrast, Rowell and colleagues made comparisons between playing position in soccer, reporting a clear increase in FT:CT for central Defenders when internal load increased by +1 SD above the mean [13]. The importance of the FT:CT ratio is that it seeks to quantify how a given CMJ performance is achieved, rather than a specific performance output from a CMJ (e.g., jump height). Rather, it provides a simplistic mathematical description of the ‘strategy’ applied during the movement for a given output (flight time) for how long force was applied (contraction time). The derived metrics from each CMJ ground reaction force (GRF) recording can be referred to as the movement’s force–time data signature. This signature is distinct to each jump and offers valuable insights into an athlete’s performance output, the method or drivers behind their performance, and the movement strategies applied during the jump [14].
The objective of this study was to investigate whether the CMJ performance of professional Australian Football athletes changes during the 13-week pre-season and the first 8 weeks of the competitive season. First, we sought to determine the strength of relationship between training load and neuromuscular fatigue as determined by changes in CMJ performance. We hypothesized that greater running distance covered by athletes during each pre-season training week would lead to increasing evidence of neuromuscular fatigue, as reflected by changes to CMJ performance. Second, we examined the impact of the pre-season vs. in-season phase on athlete preparation, seeking to account for different athlete playing positions. We hypothesized that GRF generated by athletes would be lower during the in-season phase compared to the pre-season phase. Additionally, we hypothesized that the output variables derived from the GRF data would remain stable, while the driver variables would show variation.

2. Materials and Methods

2.1. Experimental Approach to the Problem

A retrospective analysis design was employed to investigate the impact of neuromuscular fatigue on athletes’ CMJ characteristics. Data were gathered through repeated measurements spanning 13 weeks over the pre-season and the first 8 weeks of the 2023 competitive season (21 week total). However, we expected that due to factors such as injury status, individualized return to play plans and strength and conditioning program mesocycles, not all athletes would participate in CMJ testing every week which may impact on the statistical model applied. Performance of CMJs adhered to a standardized testing protocol, which included data collection predominantly occurring on the third day of the week in the pre-season and typically match day plus four (MD + 4) during the in-season. GRF data were analyzed to detect changes in CMJ force–time variables and overall performance over time to reflect the neuromuscular status of the athlete.

2.2. Subjects

A total of 42 elite Australian Football athletes (Table 1) with a mean (±SD) height of 1.89 ± 0.07 m, mass of 86.8 ± 8.5 kg, and an age of 23.7 ± 3.8 years were recruited from the Fremantle Football Club. As part of their routine club monitoring, players engaged in both on-field and off-field physical assessments, encompassing various facets of physical performance. As a component of this monitoring, players underwent CMJ testing before their regular strength and conditioning sessions. Ethics approval was granted by the Curtin University Human Research Ethics Committee (approval number: #HRE2023-0349).

2.3. Procedures

Athletes were tasked with performing multiple CMJs on dual force plates sampling at 1000 Hz (Hawkin Dynamics, Westbrook, ME, USA). Ahead of the commencement of testing during the pre-season, all athletes received familiarization with testing protocols. To ensure validity and reliability, and minimize potential confounding factors, a standardized set of procedures were followed. Before each testing session, athletes completed consistent activation and warm-up routines, involving dynamic mobility exercises as directed by the medical staff. The testing process required athletes to position each foot in the center of a force plate, with their hands on their hips, and maintain stillness for up to three seconds. Subsequently, they were directed to execute a self-selected countermovement depth before explosively jumping for a maximum height without tucking their legs, followed by a controlled landing back onto the force plates. Verbal cues, such as “jump as high and as fast as you can,” were provided to all athletes before each set of CMJs. After landing, athletes adhered to a three-second stillness period for data collection. The protocol mandated two sets of three repetitions of CMJs, a total of six jumps [15] with an average of the 6 successful trials exported and used for further analysis. A 10 s passive rest interval was specified between each repetition, while two minutes of passive rest was allocated between each set.

2.4. Data Collection

The GRF data from each CMJ repetition was automatically recorded, analyzed, and stored using commercial software (Hawkin Dynamics, Westbrook, ME, USA, version 8.6.0). The analyzed data was saved on a cloud database owned by the professional AF club. Variables for statistical analysis were chosen based on a framework introduced by Lake [16] and Bishop et al. [17], termed the “ODS System,” designed to streamline the variable selection and interpretation of GRF data derived from CMJs. This framework comprises three essential components: “O” for “Output” variables, providing immediate feedback to athletes; “D” for “driver” variables, pinpointing areas for training enhancements of neuromuscular capacity; and “S” for “Strategy” variables, merging various driver variables to illuminate athletes’ performance and detect changes in their CMJ characteristics. In alignment with this framework, selected variables were based on prior research [12,18] and the club’s interest, augmenting this by selecting variables that are relative, rather than absolute, to account for variations in athlete weight. Thus, the selected Output variables were jump height, peak relative propulsive power, modified relative strength index (mRSI) and average relative propulsive force. The Driver variables included were braking rate of force development (RFD) and flight time to contraction time ratio (FT:CT). Lastly, the strategy variables included were countermovement depth and relative propulsive impulse.

2.5. Statistical Analysis

The statistical analysis for this study was conducted using IBM SPSS Statistics software (Version 29.0.1.0). The study employed a repeated measures design, with between and within subject factors across four distinct time periods (Weeks 1–3, Weeks 4–7, Weeks 10–13 and Weeks 14–21) as the within-subjects variable and the between-subjects variable, termed “Position,” encompassed three distinct categories: Defenders, Midfielders, and Forwards. Descriptive statistics, including means and standard deviations, were calculated to provide an overview of the key variables under investigation. The athlete cohort data was examined for completeness to minimize missing random samples due to the previously identified individual player factors. Identified cases were removed at the athlete-row level (listwise deletion) with no data imputation implemented, resulting in a retrospective database limited to athletes with complete data across all time periods. Any missing observations were considered unlikely to satisfy the missing-at-random assumption because they primarily resulted from injuries and individualized return-to-play programs. To assess changes over time and potential differences among positions, a General Linear Model (GLM) with repeated measures was applied. The GLM was structured with time as a within-subjects factor (four levels: Time) and positioned as a between-subjects factor (three levels: Position). Homogeneity tests, including Mauchly’s test of sphericity, were conducted to assess the assumption of sphericity for the repeated measures. Violations of sphericity were addressed by using Huynh–Feldt corrections when appropriate. The statistical significance level was accepted at p < 0.05. Spread vs. level plots were generated to visualize the distribution of data points and assess potential violations of homoscedasticity across the levels of the within-subjects factor. Effect size estimates, such as partial eta squared (η2), were computed to quantify the practical significance of observed effects, with the results categorized as small (≤0.01), medium (≤0.06), and large (≤0.14) [19]. Estimated marginal means were computed to provide adjusted means for each combination of the within-subjects and between-subjects factors, allowing for the examination of mean differences while controlling for other factors in the model.

3. Results

Of the 42 athletes recruited, a cohort of 28 athletes successfully completed the prescribed testing protocol during the respective season phases. This loss of 14 athletes from the retrospective sample cohort was due to factors beyond the research team’s control and reflects the nuance of ecologically valid research in professional sport. Athletes were removed from analysis due to a change in injury status by medical staff unrelated to the research project (n = 5), ongoing individualized return to play plans (n = 7) and strength and conditioning program mesocycles (n = 2). Significant time effects (p = 0.049) for changes in jump height during the pre-season were evident, particularly among the Midfielders group (Table 2). The athletes’ mean jump height increased by 4%, a moderate effect, from weeks 1–3 (0.37 ± 0.06 m) to weeks 10–13 (0.38 ± 0.07 m) (Table 2). A significant time effect was also observed for countermovement depth (p ≤ 0.001), with a mean 7% increase in depth from weeks 1–3 (−0.29 ± 0.03 m) to weeks 10–13 (−0.31 ± 0.03 m) for Midfielders (Table 2). Whilst a significant main effect of “Positional playing Group” was not observed, a significant interaction between time and group with a large effect was observed for relative propulsive impulse (p = 0.009, partial η2 = 0.232) (Table 2). When controlling for total distance as a covariate for the magnitude of change during pre-season, no time effect interaction was observed for most variables. However, an interaction effect with a large eta squared effect was observed for relative propulsive impulse (p = 0.011, η2 = 0.251) with total distance as a covariate (Table 3). Similarly, when high-speed running was the covariate, a significant time effect for relative propulsive impulse (p = 0.036) and an interaction effect were observed (p = 0.029, η2 = 0.213) (Table 3).
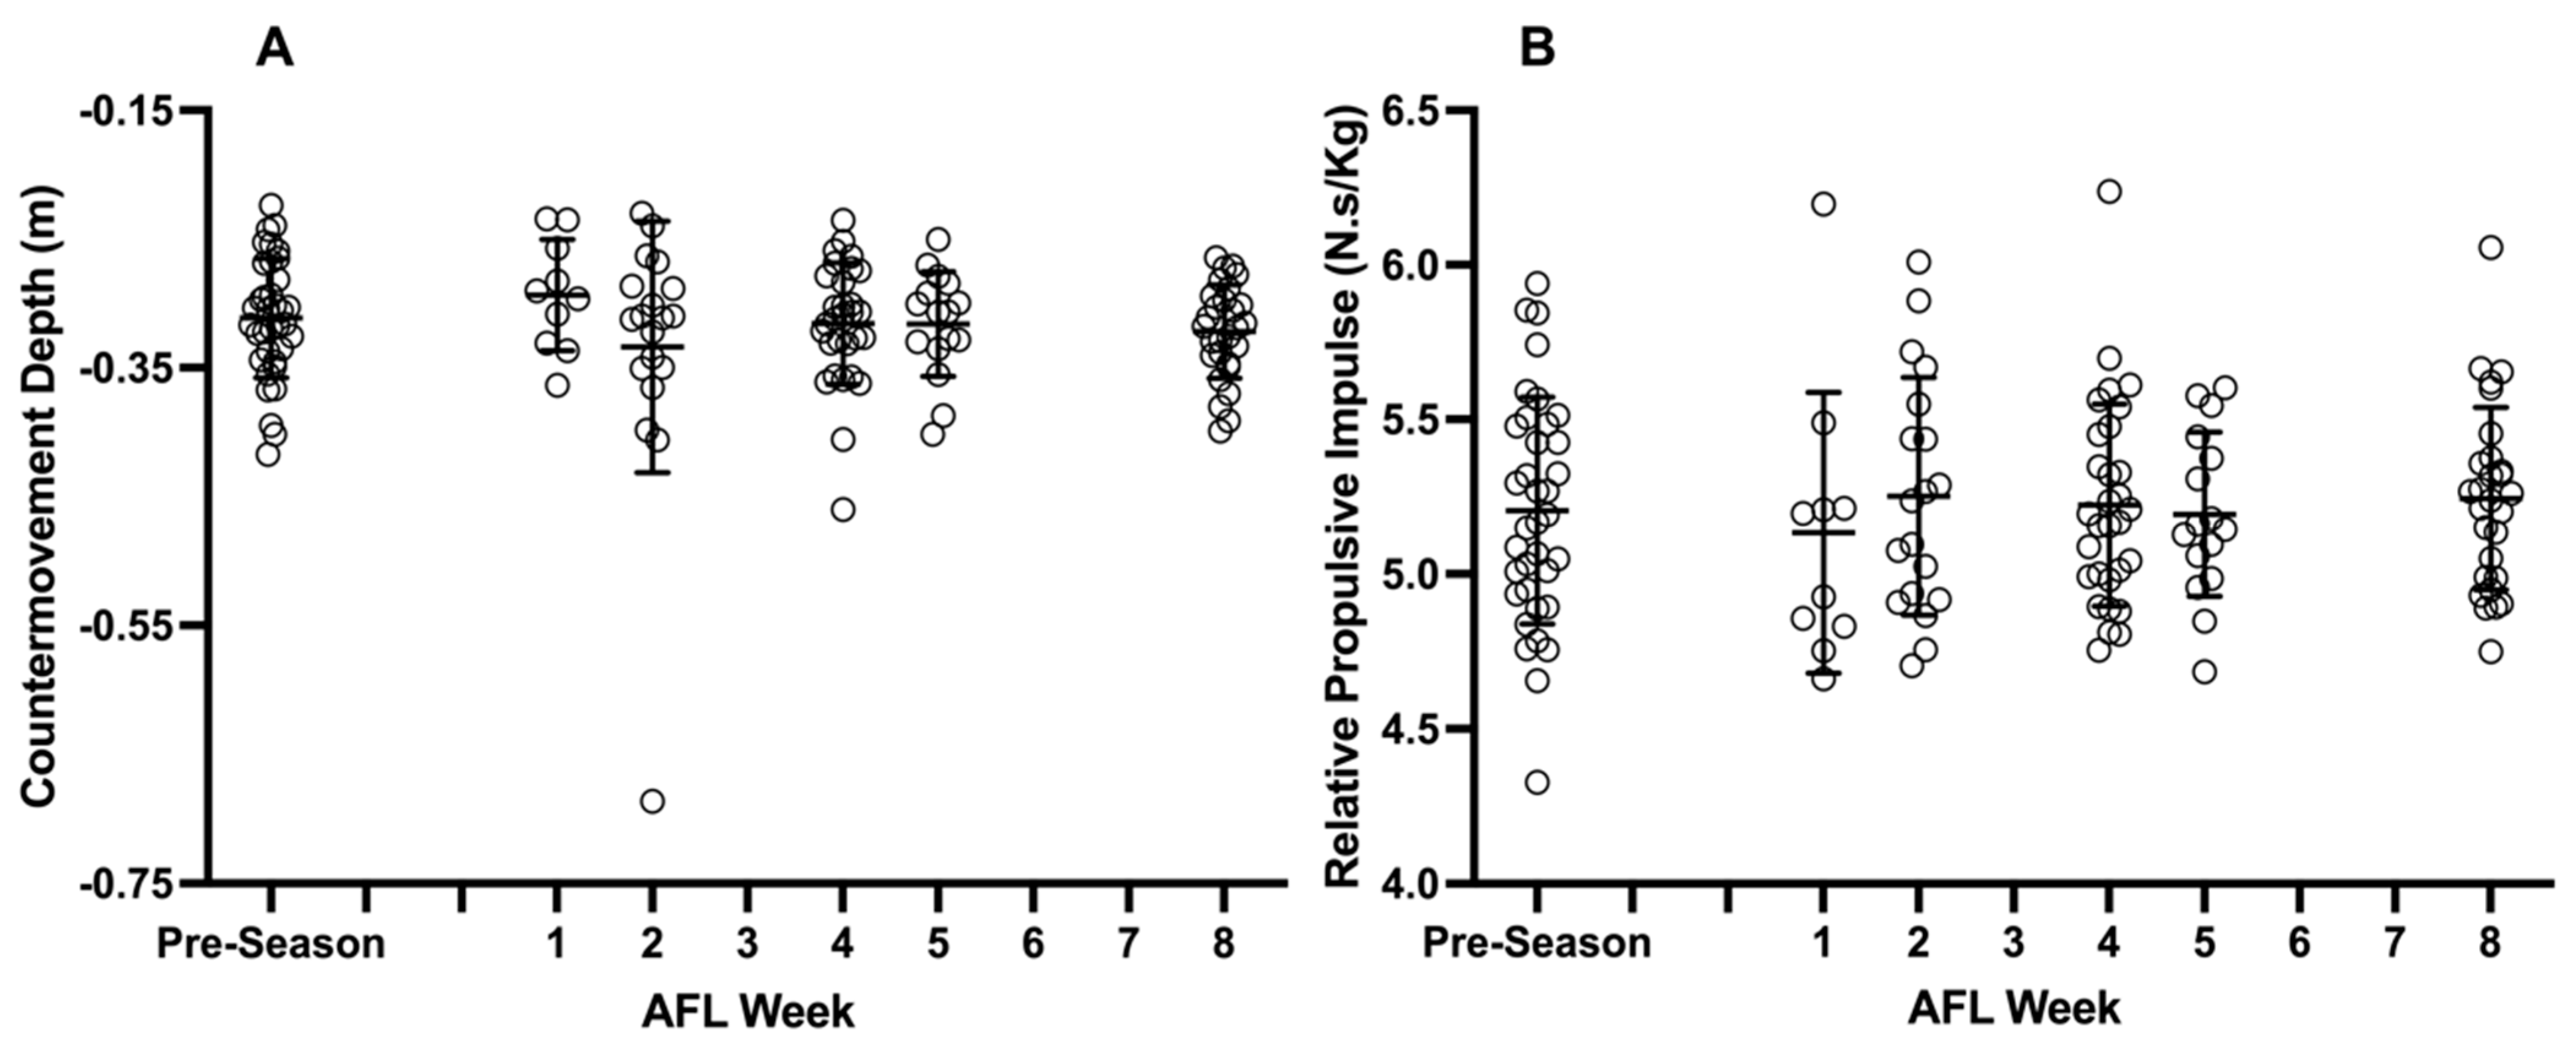
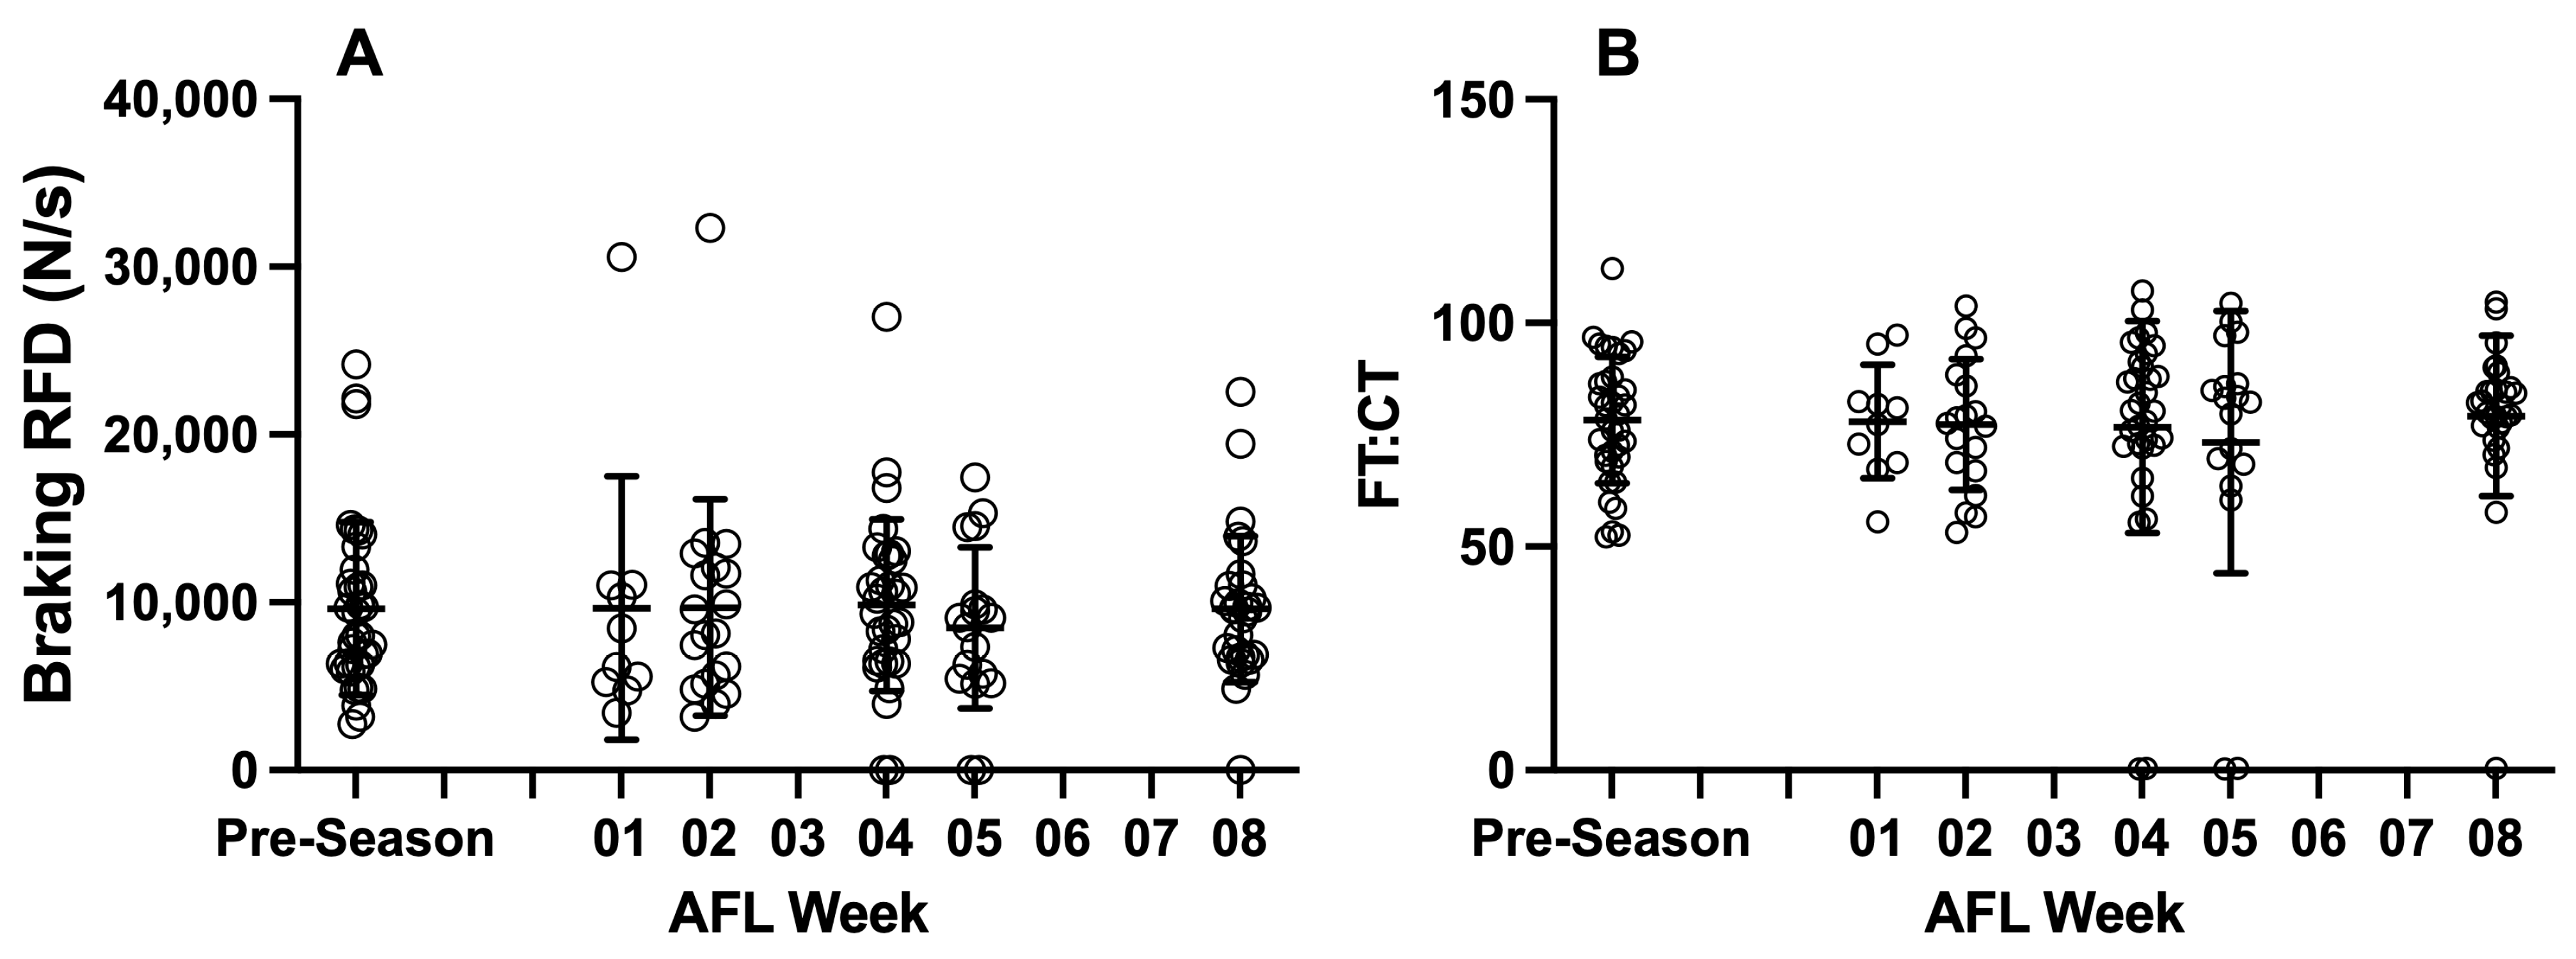
Figure 1, Figure 2 and Figure 3 display the distributions of relevant ‘output,’ ‘driver,’ and ‘strategy’ variables, respectively. These figures display data between the last pre-season time and the first 8 weeks of the in-season. No statistical significance was observed when comparing between time periods.

4. Discussion

The study’s primary findings partially support our hypotheses, indicating an influence of training load, specifically total distance covered and high-speed run distance (measured in meters), on CMJ force–time variable relative propulsive impulse. These outcomes should be interpreted with caution given the potential for a type II error, and the remaining CMJ variables exhibited minimal changes between baseline pre-season and in-season assessments. The observations reported here from a limited elite athlete cohort suggest that both pre-season and in-season factors impact player readiness, providing support for our initial hypothesis. The agreement between our a priori hypotheses and the empirical findings was only partial. Our first hypothesis was supported only for relative propulsive impulse, and even this effect should be interpreted cautiously given the risk of Type II error. Our second hypothesis was not supported, as ground reaction forces were not consistently lower in-season than pre-season, and no interaction with playing position emerged. The expectation that output variables would remain stable while driver variables varied systematically was also only partially supported, as several driver and strategy variables remained stable over time. Overall, these findings suggest that, in this cohort, the relationship between training load, neuromuscular fatigue, and CMJ performance is weaker, more individually variable, and less position-dependent than originally hypothesized.
We observed a significant interaction effect for relative propulsive impulse both unadjusted and when adjusted for total distance and high-speed running. Although we did not detect a significant interaction effect for playing position group in any GLM, we did observe unadjusted significant changes over time for CMJ depth, but the minor variations in CMJ height were of no practical or statistical significance. This may suggest that athletes altered their jump strategy over time, by adopting a motor pattern that used a greater eccentric stretch or a longer time interval to apply a propulsive force during the SSC to maintain their optimal jump height. However, changes in jump height were not observed over time, indicating that while athletes altered their CMJ strategy, either there was no training-induced positive performance adaptation, or they could not overcome the magnitude of accumulated neuromuscular fatigue [20,21]. For example, jump height and average relative propulsive force observed no statistically significant change over time, with medium effect sizes present (η2 = 0.124 and η2 = 0.141), a result similar to the lack of long-term change in CMJ height reported by Cormack et al. [12] in AFL and Philipp et al. [22] in basketball. Whilst the consistent small change observed in the Midfielders (0.02 m between weeks 1–3 and weeks 10–13) likely contributes to a meaningful eta squared effect size, the magnitude of change is unlikely to be worthwhile.
Jump height (Figure 1A) remained consistent and unchanged across pre-season baseline and the first 8 weeks of the in-season. This observation aligns with the literature from soccer, basketball and AFL, which has emphasized the value of looking beyond jump height as the sole indicator of neuromuscular fatigue [7,20,23,24]. Our findings support previous research [25] which reported associations between changes in CMJ height, increased salivary cortisol levels, and greater perceived exertion in athletes. Balsalobre-Fernández et al. observed similar findings in middle- and long-distance runners over a 39-week training period, demonstrating the substantial interplay between jump height, hormonal factors, and training load variables [26]. The literature highlights the necessity of monitoring multiple variables, beyond jump height alone, to achieve a thorough understanding of neuromuscular fatigue and its association with CMJ performance in athletes. By sustaining consistent jump heights while adapting to variations in driver and strategy variables, our findings provide indicative evidence for the complexity of athletic performance and demonstrate athletes’ capacity to adjust distinct aspects of their performance in response to the demands of competition and training [27,28].
Braking RFD gradually declined across the data collection period, indicating a reduced rate of force development during the braking phase (Figure 2A). In contrast, FT:CT (Figure 2B) exhibited a modest increase, indicating a shorter contraction time that resulted in no change in flight time, and thus jump height (Figure 1A). The deeper countermovement depicted in Figure 3A corresponded to an increase in countermovement depth of approximately 7% (from ~−0.29 m to ~−0.31 m). This reflects a small absolute change of ~0.02 m, which is of a similar magnitude to the typical within-athlete measurement variability previously reported for this variable. Consequently, this change should be interpreted cautiously and not regarded as conclusive evidence of a modified movement strategy. Should the change nonetheless be considered meaningful, a more plausible explanation is that athletes imposed a greater stretch load and relied more heavily on eccentric utilization within the stretch–shortening cycle (SSC) to preserve a given jump height. This combination of deeper preparation with faster execution may reflect an adjustment of their neuromuscular strategy to preserve jump height output, although this interpretation remains speculative given the small magnitude of the change. These findings may be consistent with highly individual neuromuscular adaptations and changes in jump technique or motor pattern during an AFL season, although our data do not allow these mechanisms to be confirmed directly. A reduction in braking RFD may indicate enhanced force regulation during the eccentric phase, consistent with previous research highlighting the relevance of eccentric-focused variables for monitoring neuromuscular fatigue [29]. Alternatively, if jump height were to decline while total contraction time remains unchanged, a decrease in braking RFD may instead reflect diminished neuromuscular control. Because jump height was preserved in the present cohort, the former interpretation is the more plausible. The greater neural complexity of eccentric contractions may underscore their value in assessing readiness and performance. Moreover, the SSC underpinning CMJ performance is particularly sensitive to fatigue-related neuromuscular changes [30]. Conversely, in the present study we observed a modest increase in FT:CT reflecting greater flight time (FT) relative to contraction time (CT) suggesting a more explosive CMJ strategy rather than the reduced ratio that typically accompanies acute post-match fatigue; however, this ratio should be interpreted alongside jump height and contraction time, because a change in the ratio may arise from alterations in either component. These responses likely reflect athletes’ adaptation to the demands of training and competition, with any changes in performance accompanied by concurrent changes in the neural strategy adopted. Examining these trends can therefore provide insight into the physical determinants of AFL performance. Recent analyses recommend the use of fatigue-sensitive variables that incorporate CMJ timing characteristics [21,31]. Importantly, FT:CT has been reported to detect neuromuscular fatigue in team sports [12,32]. In these studies, a decreased FT:CT ratio after a match is associated with reduced force or power output and is interpreted as a marker of neuromuscular fatigue, although it may not be sufficient in isolation to capture all fatigue-related changes. The increase we observed therefore runs counter to the acute post-match fatigue response described previously and is more plausibly explained by a longitudinal change in movement strategy across the season than by accumulating fatigue. Expanding this analysis, the close similarity in the calculation of FT:CT and mRSI raises the question of whether they should be categorized as output or driver variables. The present results suggest that, given their shared method of calculation and the parallel pattern of variation observed (Figure 1C and Figure 2B), the two variables may be best categorized as the same variable type. Therefore, the categorical system proposed by Lake [16] may not fully capture this overlap.
No changes over time were observed for strategy variables (Figure 3) which could reflect the substantial intra-individual variation and limited sample size. Importantly, we note that the response to training and game load is player-specific regardless of position, such that fluctuations in CMJ performance during the season are sporadic across the investigated player group without always having an identifiable team/position-wide pattern. However, higher-order mathematical analyses of force–time data using spatial parametric mapping [33] and functional PCAs [34] are examples that represent a plausible extension of our study that may offer additional insights into the complex interplay between neuromuscular fatigue and athlete adaptation. The intent of systematic athlete monitoring is to maximize the potential for adaptation while minimizing the chance for a training error to occur [35].

4.1. Practical Applications

This study highlights the importance of considering a comprehensive set of variables beyond jump height to assess an athlete’s neuromuscular fatigue and readiness. By examining multiple variables, practitioners can gain a more nuanced understanding of how athletes adapt their performance techniques in response to different phases of the season. The identification of changes in variables such as countermovement depth and relative propulsive impulse offers insights into the neuromuscular adaptations and strategies employed by athletes. These findings can inform the design of targeted training interventions to address specific aspects of neuromuscular performance. For example, coaches can focus on eccentric training to improve force control during the eccentric phase, while also considering strategies to optimize the concentric phase of the CMJ. Furthermore, the study highlights the importance of continuously monitoring athletes throughout the season, as changes in CMJ performance variables were observed over time. This information can guide coaches in making informed decisions regarding training loads, recovery, and periodization to ensure that athletes remain at peak performance levels throughout the competitive season. In essence, this research provides insights into how training-induced adaptation and seasonal phases influence neuromuscular fatigue and CMJ performance in elite Australian Football athletes. The practical applications of this study can help optimize training practices and enhance athlete performance, ultimately contributing to improved team performance and athlete well-being.

4.2. Limitations

We acknowledge that neuromuscular fatigue and its response to various stimuli and training loads are highly individual. Analyzing data at a team and positional level, rather than using within-subject comparisons, may lead to a dilution of findings, especially where sample size is compromised. It may be argued that, instead of reducing our sample cohort from n = 42 to n = 28 to include only those athletes with complete pre-season and in-season data, we instead should have applied a linear mixed model with fixed effects for time period and position, plus a random intercept for athlete. The players removed (n = 14) were excluded on the basis of documented injury/return-to-play status, and hence we felt that the repeated-measures GLM on a complete dataset was the better approach. We acknowledge that a mixed-effects model would ordinarily be preferred because it uses all available repeated measurements and accommodates missing observations under a missing-at-random assumption, but our interpretation is that this assumption no longer holds. Furthermore, reducing the sample from n = 42 to n = 28 lowered statistical power to detect interaction effects, increasing the risk of Type II error and potentially contributing to the many null findings. Several reported changes are small relative to typical within-athlete variability and may reflect measurement noise rather than true biological change, underscoring the need for individualized baselines and smallest-worthwhile-change (SWC) thresholds when interpreting these variables. However, SWC thresholds should ideally be established prospectively, and the retrospective study design of this dataset meant that prospective baseline measures for calculating SWC were not available for this cohort. While the observed variability in our data may account for the absence of statistical significance, it is important to note the meaningful effects present. For instance, when average relative propulsive force was adjusted for high-speed running volume, the resulting time change comparison indicated p = 0.082 with a substantial eta squared effect size (η2 = 0.091). This outcome suggests the possibility of a Type II error due to the reliance on statistical significance at the conventional α < 0.05 threshold. Additional research is required to further elucidate the potential influence of high-speed running on this variable. Future studies that report using a complete variable set and explore inter-athlete variation in neuromuscular fatigue response to different training stimuli are warranted. The experimental design implemented was an observational study, so relationships between training load and CMJ variables are associative, not causal. Monitoring covered only the 13-week pre-season and the first 8 weeks of the competitive season, so the findings may not generalize to later in the season when cumulative load and fixture congestion differ. Readers should also note that neuromuscular status was inferred only from CMJ force–time data; without corroborating hormonal, perceptual, or external-load-independent markers, attributing CMJ changes specifically to neuromuscular fatigue remains tentative. Importantly, readers must remain mindful that because no direct neuromuscular or physiological measurements were collected, all interpretations of the observed changes should be considered speculative and only supportive of hypothesis development.

5. Conclusions

In conclusion, this investigation contributes to the understanding of neuromuscular fatigue monitoring in elite AF athletes by providing evidence that supports the assessment of a broader array of countermovement jump (CMJ) variables, rather than relying solely on traditional outcome measures such as jump height. The observed shifts in driver and strategy variables in response to training and competition appear to reflect the dynamic and individual nature of athlete adaptation, suggesting the potential value of individualized monitoring frameworks. These findings may support the adoption of multifaceted assessment protocols to help inform decisions aimed at enhancing athlete readiness and performance outcomes. By incorporating multifaceted field-based assessments, sports scientists and coaching staff may be better positioned to detect subtle fluctuations in neuromuscular status, potentially facilitating more targeted interventions and supporting athlete adaptation. Continued research in this domain may help inform training readiness and performance optimization within team sports contexts over time.

Author Contributions

Conceptualization, B.K., P.K.E., and D.W.C.; methodology, J.K., B.K., and D.W.C.; formal analysis, J.K., B.K., and D.W.C.; data curation, J.K. and B.K.; writing—original draft preparation, J.K.; writing—secondary draft preparation, M.C.; writing—review and editing, M.C., B.K., P.K.E., and D.W.C.; visualization, J.K. and D.W.C.; supervision, B.K., P.K.E., and D.W.C.; project administration, D.W.C. All authors have read and agreed to the published version of the manuscript.

Funding

This research received no external funding.

Institutional Review Board Statement

The study was conducted in accordance with the Declaration of Helsinki and approved by the Institutional Human Ethics Committee of Curtin University (approval number: #HRE2023-0349).

Informed Consent Statement

Informed consent was obtained from all subjects involved in the study.

Data Availability Statement

The original contributions presented in this study are included in the article. Further inquiries and requests for raw data access can be directed to the corresponding author.

Conflicts of Interest

Dr. Brad Keller is employed by the Fremantle Football Club. All authors declare that the research was conducted in the absence of any commercial or financial relationships that could be construed as a potential conflict of interest.

References

  1. Abbiss, C.R.; Laursen, P.B. Models to Explain Fatigue during Prolonged Endurance Cycling. Sports Med. 2005, 35, 865–898. [Google Scholar] [CrossRef]
  2. Bilsborough, J.C.; Greenway, K.G.; Opar, D.A.; Livingstone, S.G.; Cordy, J.T.; Bird, S.R.; Coutts, A.J. Comparison of Anthropometry, Upper-Body Strength, and Lower-Body Power Characteristics in Different Levels of Australian Football Players. J. Strength Cond. Res. 2015, 29, 826–834. [Google Scholar] [CrossRef] [PubMed]
  3. Wu, P.P.-Y.; Sterkenburg, N.; Everett, K.; Chapman, D.W.; White, N.; Mengersen, K. Predicting fatigue using countermovement jump force-time signatures: PCA can distinguish neuromuscular versus metabolic fatigue. PLoS ONE 2019, 14, e0219295. [Google Scholar] [CrossRef] [PubMed]
  4. Froyd, C.; Millet, G.Y.; Noakes, T.D. The development of peripheral fatigue and short-term recovery during self-paced high-intensity exercise. J. Physiol. 2013, 591, 1339–1346. [Google Scholar] [CrossRef] [PubMed]
  5. Thomas, K.; Brownstein, C.G.; Dent, J.; Parker, P.; Goodall, S.; Howatson, G. Neuromuscular Fatigue and Recovery after Heavy Resistance, Jump, and Sprint Training. Med. Sci. Sports Exerc. 2018, 50, 2526–2535. [Google Scholar] [CrossRef] [PubMed]
  6. Weavil, J.C.; Amann, M. Neuromuscular fatigue during whole body exercise. Curr. Opin. Physiol. 2019, 10, 128–136. [Google Scholar] [CrossRef] [PubMed]
  7. Oliver, J.; Armstrong, N.; Williams, C. Changes in jump performance and muscle activity following soccer-specific exercise. J. Sports Sci. 2008, 26, 141–148. [Google Scholar] [CrossRef] [PubMed]
  8. Nicol, C.; Avela, J.; Komi, P.V. The Stretch-Shortening Cycle: A Model to Study Naturally Occurring Neuromuscular Fatigue. Sports Med. 2006, 36, 977–999. [Google Scholar] [CrossRef] [PubMed]
  9. Marco, G.; Alberto, B.; Taian, V. Surface EMG and muscle fatigue: Multi-channel approaches to the study of myoelectric manifestations of muscle fatigue. Physiol. Meas. 2017, 38, R27–R60. [Google Scholar] [CrossRef] [PubMed]
  10. Garrett, J.; Graham, S.R.; Eston, R.G.; Burgess, D.J.; Garrett, L.J.; Jakeman, J.; Norton, K. A Novel Method of Assessment for Monitoring Neuromuscular Fatigue in Australian Rules Football Players. Int. J. Sports Physiol. Perform. 2019, 14, 598–605. [Google Scholar] [CrossRef] [PubMed]
  11. Barker, L.A.; Harry, J.R.; Mercer, J.A. Relationships Between Countermovement Jump Ground Reaction Forces and Jump Height, Reactive Strength Index, and Jump Time. J. Strength Cond. Res. 2018, 32, 248–254. [Google Scholar] [CrossRef] [PubMed]
  12. Cormack, S.J.; Newton, R.U.; McGuigan, M.R.; Cormie, P. Neuromuscular and Endocrine Responses of Elite Players During an Australian Rules Football Season. Int. J. Sports Physiol. Perform. 2008, 3, 439–453. [Google Scholar] [CrossRef] [PubMed]
  13. Rowell, A.E.; Aughey, R.J.; Hopkins, W.G.; Esmaeili, A.; Lazarus, B.H.; Cormack, S.J. Effects of training and competition load on neuromuscular recovery, testosterone, cortisol, and match performance during a season of professional football. Front. Physiol. 2018, 9, 668. [Google Scholar] [CrossRef] [PubMed]
  14. Lyons Donegan, M.; Eustace, S.; Morris, R.; Penny, R.; Tallis, J. The Effects of Soccer Specific Exercise on Countermovement Jump Performance in Elite Youth Soccer Players. Children 2022, 9, 1861. [Google Scholar] [CrossRef] [PubMed]
  15. Taylor, K.; Cronin, J.B.; Gill, N.; Chapman, D.W.; Sheppard, J.M. Warm-Up Affects Diurnal Variation in Power Output. Int. J. Sports Med. 2011, 32, 185–189. [Google Scholar] [CrossRef] [PubMed]
  16. Lake, J. The “ODS System”: A Guide to Selecting Your Force-Time Metrics; Hawkins Dynamics: Westbrook, ME, USA, 2020. [Google Scholar]
  17. Bishop, C.; Turner, A.; Jordan, M.; Harry, J.; Loturco, I.; Lake, J.; Comfort, P. A Framework to Guide Practitioners for Selecting Metrics During the Countermovement and Drop Jump Tests. Strength Cond. J. 2022, 44, 95–103. [Google Scholar] [CrossRef]
  18. Cormack, S.J.; Newton, R.U.; McGuigan, M.R.; Doyle, T.L. Reliability of measures obtained during single and repeated countermovement jumps. Int. J. Sports Physiol. Perform. 2008, 3, 131–144. [Google Scholar] [CrossRef] [PubMed]
  19. Cohen, J. Statistical Power Analysis for the Behavioral Sciences; Lawrence Erlbaum Associates: Mahwah, NJ, USA, 1988. [Google Scholar]
  20. Cormack, S.J.; Newton, R.U.; McGuigan, M.R. Neuromuscular and Endocrine Responses of Elite Players to an Australian Rules Football Match. Int. J. Sports Physiol. Perform. 2008, 3, 359–374. [Google Scholar] [CrossRef] [PubMed]
  21. Gathercole, R.J.; Sporer, B.C.; Stellingwerff, T.; Sleivert, G.G. Alternative countermovement-jump analysis to quantify acute neuromuscular fatigue. Int. J. Sports Physiol. Perform. 2015, 10, 84–92. [Google Scholar] [CrossRef] [PubMed]
  22. Philipp, N.M.; Cabarkapa, D.; Nijem, R.M.; Fry, A.C. Changes in countermovement jump force-time characteristic in elite male basketball players: A season-long analyses. PLoS ONE 2023, 18, e0286581. [Google Scholar] [CrossRef] [PubMed]
  23. Krustrup, P.; Zebis, M.; Jensen, J.M.; Mohr, M. Game-Induced Fatigue Patterns in Elite Female Soccer. J. Strength Cond. Res. 2010, 24, 437–441. [Google Scholar] [CrossRef] [PubMed]
  24. Ardern, C.L.; Ekås, G.; Grindem, H.; Moksnes, H.; Anderson, A.; Chotel, F.; Cohen, M.; Forssblad, M.; Ganley, T.J.; Feller, J.A.; et al. 2018 International Olympic Committee consensus statement on prevention, diagnosis and management of paediatric anterior cruciate ligament (ACL) injuries. Knee Surg. Sports Traumatol. Arthrosc. 2018, 26, 989–1010. [Google Scholar] [CrossRef] [PubMed]
  25. Balsalobre-Fernández, C.; Tejero-González, C.M.; del Campo-Vecino, J. Hormonal and neuromuscular responses to high-level middle- and long-distance competition. Int. J. Sports Physiol. Perform. 2014, 9, 839–844. [Google Scholar] [CrossRef] [PubMed]
  26. Balsalobre-Fernández, C.; Tejero-González, C.M.; del Campo-Vecino, J. Relationships between training load, salivary cortisol responses and performance during season training in middle and long distance runners. PLoS ONE 2014, 9, e106066. [Google Scholar] [CrossRef] [PubMed]
  27. Gathercole, R.J.; Stellingwerff, T.; Sporer, B.C. Effect of acute fatigue and training adaptation on countermovement jump performance in elite snowboard cross athletes. J. Strength Cond. Res. 2015, 29, 37–46. [Google Scholar] [CrossRef] [PubMed]
  28. Kennedy, R.A.; Drake, D. The effect of acute fatigue on countermovement jump performance in rugby union players during preseason. J. Sports Med. Phys. Fit. 2017, 57, 1261–1266. [Google Scholar] [CrossRef] [PubMed]
  29. Krzyszkowski, J.; Chowning, L.D.; Harry, J.R. Phase-Specific Predictors of Countermovement Jump Performance That Distinguish Good From Poor Jumpers. J. Strength Cond. Res. 2022, 36, 1257–1263. [Google Scholar] [CrossRef] [PubMed]
  30. Komi, P.V. Stretch-shortening cycle: A powerful model to study normal and fatigued muscle. J. Biomech. 2000, 33, 1197–1206. [Google Scholar] [CrossRef] [PubMed]
  31. Bishop, C.; Jordan, M.; Torres-Ronda, L.; Loturco, I.; Harry, J.; Virgile, A.; Mundy, P.; Turner, A.; Comfort, P. Selecting Metrics That Matter: Comparing the Use of the Countermovement Jump for Performance Profiling, Neuromuscular Fatigue Monitoring, and Injury Rehabilitation Testing. Strength Cond. J. 2023, 45, 545–553. [Google Scholar] [CrossRef]
  32. Mooney, M.G.; Cormack, S.; O’Brien, B.J.; Morgan, W.M.; McGuigan, M. Impact of Neuromuscular Fatigue on Match Exercise Intensity and Performance in Elite Australian Football. J. Strength Cond. Res. 2013, 27, 166–173. [Google Scholar] [CrossRef] [PubMed]
  33. Hughes, S.; Warmenhoven, J.; Haff, G.G.; Chapman, D.W.; Nimphius, S. Countermovement Jump and Squat Jump Force-Time Curve Analysis in Control and Fatigue Conditions. J. Strength Cond. Res. 2022, 36, 2752–2761. [Google Scholar] [CrossRef] [PubMed]
  34. Guess, T.M.; Gray, A.D.; Willis, B.W.; Guess, M.M.; Sherman, S.L.; Chapman, D.W.; Mann, J.B. Force-Time Waveform Shape Reveals Countermovement Jump Strategies of Collegiate Athletes. Sports 2020, 8, 159. [Google Scholar] [CrossRef] [PubMed]
  35. Drew, M.K.; Finch, C.F. The Relationship Between Training Load and Injury, Illness and Soreness: A Systematic and Literature Review. Sports Med. 2016, 46, 861–883. [Google Scholar] [CrossRef] [PubMed]
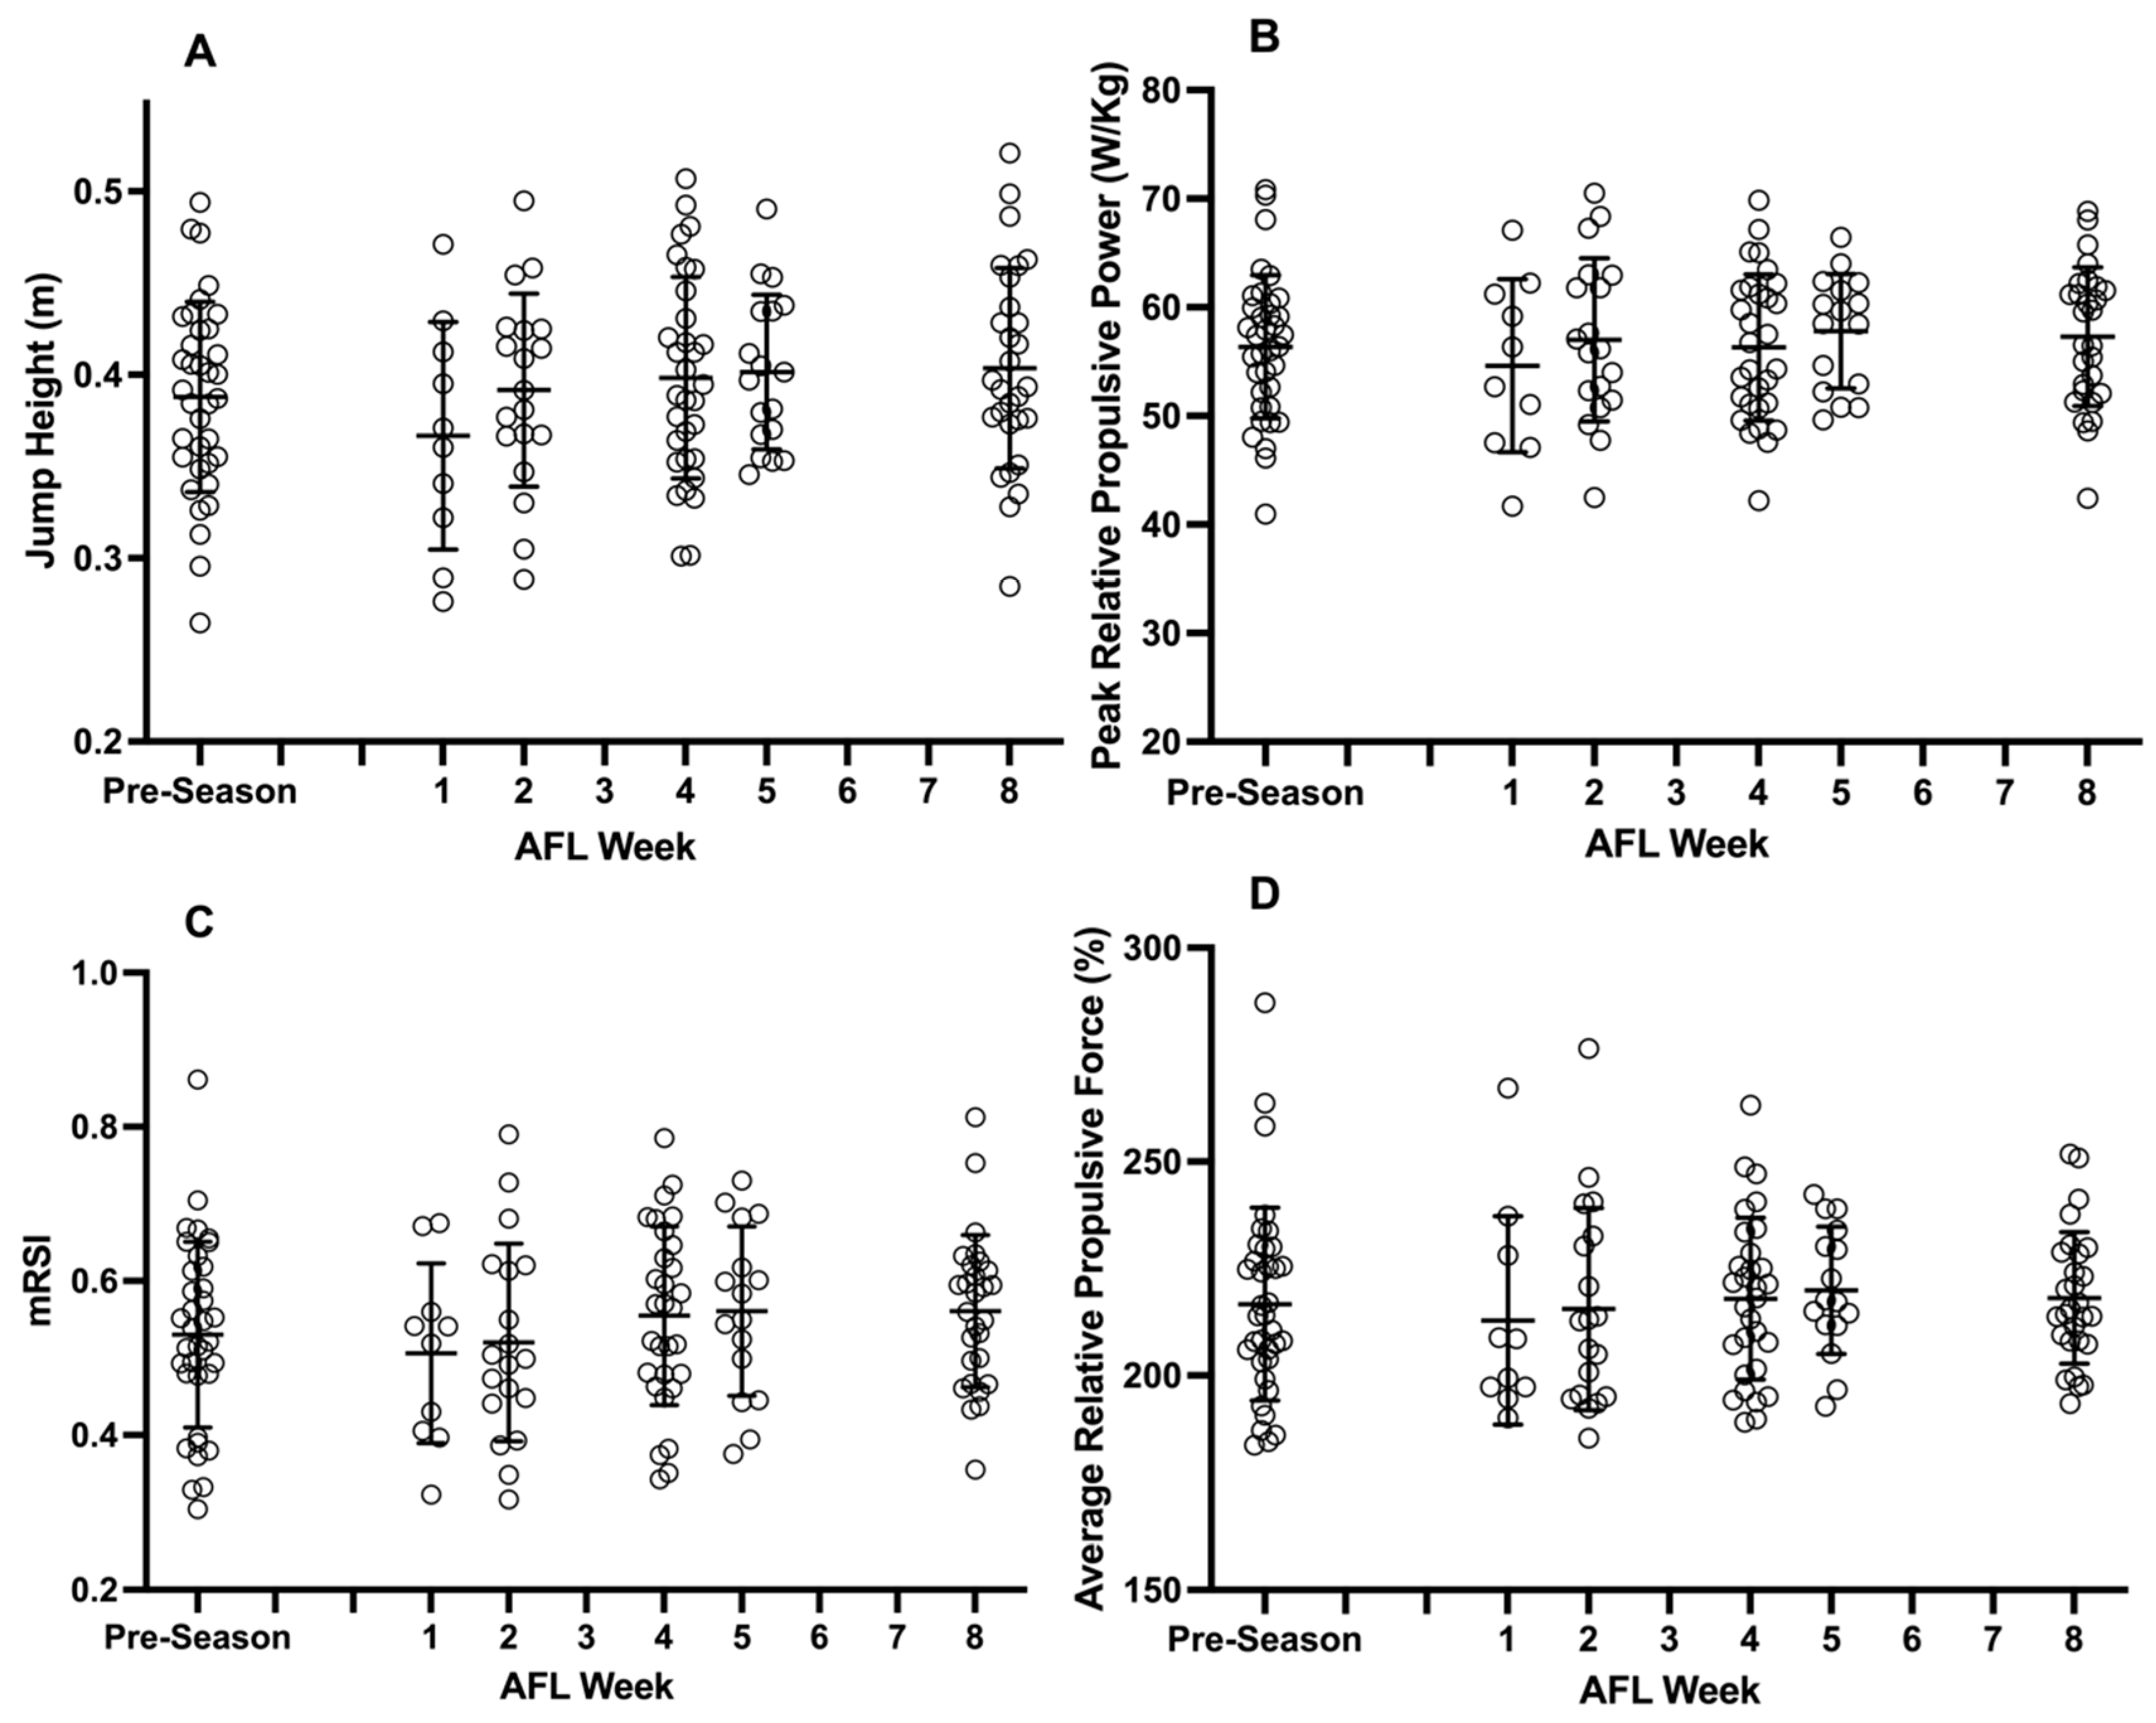
Figure 1. Countermovement jump output variables of jump height (A), peak relative propulsive force (B), mRSI (C), and average relative propulsive force (D).
Applsci 16 06883 g001
Figure 2. Countermovement jump strategy variables of countermovement depth (A) and relative propulsive impulse (B).
Applsci 16 06883 g002
Figure 3. Countermovement jump driver variables of braking RFD (A), and FT:CT (B).
Applsci 16 06883 g003
Table 1. Athlete characteristics grouped by position, represented as Mean ± SD.
PositionHeight (m)Mass (kg)Age (Years)AFL Experience (Years)
Defenders (n = 12)1.90 ± 0.0587.5 ± 6.323.3 ± 3.74.7 ± 3.5
Midfielders (n = 17)1.90 ± 0.0888.4 ± 10.523.0 ± 3.75.2 ± 3.8
Forwards (n = 13)1.87 ± 0.0884.0 ± 6.425.1 ± 3.86.0 ± 4.4
Note: All players classified as “Ruckman” by the club were categorized as Midfielders for statistical analysis purposes.
Table 2. Pre-season countermovement jump variables (mean ± SD) grouped into playing positions with unadjusted interaction, time, and group effect GLM outcome.
Time
Period
Group
(Position)
CMJ Height (m)PkRelPower (W·kg)mRSIAvRelForce (%)Braking RFD (N·s−1)FT:CTCMJ Depth (cm)RelPropImp (N·s−1·kg)
Weeks 1–3Defenders0.38 ± 0.0355.3 ± 4.30.5 ± 0.1209.5 ± 13.17286 ± 227973.3 ± 8.6−0.31 ± 0.045.3 ± 0.3
Midfielders0.37 ± 0.0655.6 ± 7.90.5 ± 0.2217.1 ± 20.49763 ± 496377.3 ± 17.3−0.29 ± 0.035.0 ± 0.3
Forwards0.39 ± 0.0457.8 ± 5.30.6 ± 0.1223.6 ± 21.911,687 ± 653083.1 ± 10.4−0.29 ± 0.065.1 ± 0.5
Weeks 4–7Defenders0.37 ± 0.0355.4 ± 4.70.5 ± 0.1210.6 ± 14.86847 ± 313372.5 ± 10.5−0.29 ± 0.045.2 ± 0.3
Midfielders0.36 ± 0.0656.0 ± 8.20.5 ± 0.1214.1 ± 21.28222 ± 439273.9 ± 15.3−0.29 ± 0.035.1 ± 0.3
Forwards0.40 ± 0.0459.6 ± 6.20.6 ± 0.1226.4 ± 29.711,493 ± 666983.4 ± 11.1−0.27 ± 0.045.2 ± 0.7
Weeks 10–13Defenders0.38 ± 0.0355.7 ± 4.80.5 ± 0.1212.1 ± 15.07943 ± 217174.1 ± 10.0−0.32 ± 0.055.3 ± 0.3
Midfielders0.38 ± 0.0755.8 ± 9.10.5 ± 0.2212.7 ± 23.49069 ± 545875.6 ± 19.1−0.31 ± 0.035.2 ± 0.3
Forwards0.39 ± 0.0459.3 ± 6.40.6 ± 0.1227.7 ± 33.912,278 ± 816783.4 ± 11.3−0.30 ± 0.075.1 ± 0.6
Time (p-value)* 0.0490.0730.3590.8650.1040.402* <0.0010.070
Group (p-value)0.6290.5420.3720.3630.2070.3280.5750.655
Interaction (p-value)0.2030.3490.4950.1310.5760.5940.515* 0.009
Partial Eta Squared (η2)0.1140.0840.0620.1300.0550.0530.0620.232
Note: Significant time and interaction effects (p-value: <0.05) are bolded and with an Asterix (*) for the variables CMJ height and CMJ depth (time), RelPropImp (interaction).
Table 3. GLM outcomes for countermovement jump variables adjusted for total distance (TD) and high-speed run (HSR) as covariates.
Covariatep-ValueCMJ Height (m)PkRelPower (W·kg)mRSIAvRelForce (%)Braking RFD (N·s−1)FT:CTCMJ Depth (cm)RelPropImp (N·s−1·kg)
Total
Distance (m)
Time 0.4630.4350.7820.9790.6150.9540.2720.535
Group 0.5250.4830.2820.3280.1960.2670.6220.740
Interaction 0.2110.3260.6200.1460.5490.6340.559* 0.011
Partial Eta Squared (η2)0.1240.0980.0570.1410.0660.0550.0640.251
High-Speed Run (m)Time 0.4820.5150.7290.0820.1800.5470.390* 0.036
Group 0.7420.6270.3960.3080.1640.3350.6390.625
Interaction 0.2240.4670.5790.3680.8660.7840.922* 0.029
Partial Eta Squared (η2)0.1200.0760.0610.0910.0280.0380.0200.213
Note: Significant time and interaction effects (p-value: <0.05) are bolded and with an Asterix (*).
Disclaimer/Publisher’s Note: The statements, opinions and data contained in all publications are solely those of the individual author(s) and contributor(s) and not of MDPI and/or the editor(s). MDPI and/or the editor(s) disclaim responsibility for any injury to people or property resulting from any ideas, methods, instructions or products referred to in the content.