Article

Drying Kinetics and Quality Attributes of Selected Meat Types Subjected to Freeze-Drying and Vacuum-Drying


1
Department of Thermal Technology, University of Life Sciences in Lublin, Głęboka St. 31, 20-612 Lublin, Poland
2
Department of Food Process Engineering, University of Life Sciences in Lublin, Głęboka St. 31, 20-612 Lublin, Poland
3
Department of Biological Bases of Food and Feed Technology, University of Life Sciences in Lublin, Głęboka St. 28, 20-612 Lublin, Poland
4
Department of Agricultural Processing and Commodity Science, Institute of Food and Nutrition Technology, Faculty of Technology and Life Sciences, University of Rzeszow, Zelwerowicza St. 4, 35-601 Rzeszow, Poland
*
Author to whom correspondence should be addressed.
Appl. Sci. 2026, 16(13), 6820; https://doi.org/10.3390/app16136820
Submission received: 1 June 2026 / Revised: 3 July 2026 / Accepted: 6 July 2026 / Published: 7 July 2026

Featured Application

The results of this study may support the development and optimisation of dried meat products intended for long-term storage, convenience foods, high-protein snacks, and ingredients for ready-to-eat or instant meals. By comparing freeze-drying and vacuum-drying at different heating plate temperatures, the study provides practical guidance for selecting processing conditions that balance drying time, nutritional quality, colour, and texture.

Abstract

This study investigated the effects of drying methods, namely freeze-drying and vacuum-drying, and heating plate temperature (20 °C, 40 °C, and 60 °C) on the drying kinetics, specific energy consumption, proximate chemical composition, colour, peroxide value, pH and cutting force of beef eye of round muscle, pork loin, and chicken fillet. Drying time ranged from 360 min for pork loin freeze-dried at 60 °C to 1050 min for beef eye of round muscle vacuum-dried at 20 °C, and freeze-drying was generally faster than vacuum-drying at the corresponding temperature settings. Among the tested models, the logarithmic model provided the best fit to changes in the moisture ratio, with R2 values of 0.9972–0.9997 and RMSE values of 0.0053–0.0151. Increasing the drying temperature reduced the specific electrical energy consumption per kilogram of dried product in both drying methods, which was associated with shorter drying times at higher temperatures. Fat and protein contents did not differ significantly in products dried at 20 °C and 40 °C, but decreased at 60 °C, reaching 8.85–12.26 g/100 g d.m. and 76.16–79.86 g/100 g d.m., respectively. Drying also affected lipid oxidation and pH. At 20 °C and 40 °C, changes in peroxide value were moderate, whereas at 60 °C lipid oxidation markedly increased, especially in chicken meat and vacuum-dried samples. Both drying methods reduced pH compared with the raw material, with the greatest decrease observed at 60 °C, particularly after vacuum-drying. The highest L* value among dried samples was recorded for chicken fillet freeze-dried at 20 °C (85.44), whereas the lowest was observed on the surface of beef eye of round muscle vacuum-dried at 60 °C (41.98). Increasing temperature decreased lightness and redness but increased yellowness and cutting force. Cutting force ranged from 35.7 N for chicken fillet freeze-dried at 20 °C and cut across the fibres to 231.4 N for beef eye of round muscle vacuum-dried at 60 °C and cut along the fibres. These results indicate that the drying method and temperature strongly affect the quality attributes of dried meat and should be selected according to the desired product characteristics. Future studies should focus on the optimisation of drying parameters for specific meat types and include a broader quality assessment, particularly microbiological safety and sensory properties.

1. Introduction

Meat drying is among the most ancient food preservation techniques, known and used by humans for thousands of years [1]. Initially, this process was used as a natural means of protecting raw meat material from spoilage, whereas today it constitutes an important element of modern meat-processing technologies [2]. Currently, meat drying is applied both in the production of traditional regional products and in highly industrialised food-processing systems [1].
The drying process involves the controlled removal of water from muscle tissue, which leads to a reduction in water activity and, consequently, to the inhibition of microbial growth and the slowing down of enzymatic and chemical reactions responsible for product spoilage [3,4]. In meat products, the major enzymatic processes associated with spoilage include proteolysis and lipolysis, which result in the degradation of muscle proteins and lipids and the formation of peptides, free amino acids, free fatty acids, and other low-molecular-weight compounds. These compounds may subsequently undergo chemical reactions, including lipid oxidation, protein oxidation, amino acid deamination, and decarboxylation, leading to the formation of aldehydes, ketones, organic acids, sulphur-containing compounds, and biogenic amines, all of which may adversely affect flavour, odour, colour, and overall product quality [5,6]. The microorganisms most commonly associated with meat spoilage include Pseudomonas fragi, Pseudomonas fluorescens, Brochothrix thermosphacta, Shewanella putrefaciens, Lactobacillus sakei, Leuconostoc gelidum, Carnobacterium divergens, Serratia liquefaciens, Hafnia alvei, and Clostridium estertheticum, although their prevalence depends on the type of product, oxygen availability, packaging conditions, and storage temperature [7,8].
As a result, drying not only extends the shelf life of meat but also affects its sensory properties, including taste, aroma, and texture [9]. Meat-drying techniques can be broadly classified into traditional and novel methods. Traditional techniques include natural air drying, sun drying, smoke drying, and conventional convective hot-air drying, whereas novel and advanced approaches include freeze-drying (FD), vacuum-drying (VD), microwave-assisted drying, infrared drying, and ultrasound-assisted drying. In recent years, particular attention has been paid to FD and VD, as these methods make it possible to obtain high-quality products while limiting the degradation of nutrients [10,11,12].
FD involves the removal of water from previously frozen material through the direct transition of ice into water vapour through sublimation under reduced-pressure conditions [13,14]. This process is conducted at low temperature, which is its key advantage, as it limits protein denaturation, lipid oxidation, and the degradation of thermolabile bioactive compounds [10]. Consequently, freeze-dried products are characterised by very good preservation of nutritional value, high structural porosity, and the ability to undergo rapid rehydration [14]. In addition, due to the limitation of structural changes, it is possible to preserve the original shape and colour of meat [8]. Another important advantage of this method is the very low water activity of the final product, which significantly increases its microbiological stability while also favouring the preservation of the sensory and functional properties of meat during storage [12].
However, FD also has several important disadvantages. Apart from high energy demand and investment costs, the process is time-consuming, requires a preliminary freezing step, and is associated with low production throughput and complex process control. Moreover, the need to maintain reduced-pressure conditions requires specialised vacuum equipment, which increases operational and maintenance costs [15]. From a product quality perspective, FD may also lead to partial loss of volatile aroma compounds, increased brittleness and fragility of the dried matrix, and high porosity, which can enhance oxygen penetration and promote oxidative changes during storage [16,17,18].
VD is carried out under reduced pressure, which lowers the boiling point of water and enables its removal at a lower temperature than in convective drying. As a result, undesirable chemical and physical changes, such as Maillard reactions, lipid oxidation, and protein degradation and denaturation, are limited, as confirmed by studies on the quality of protein products subjected to different drying processes [19]. This method makes it possible to obtain products with improved sensory properties, including a more natural taste and aroma and a more favourable texture than those of products dried using traditional methods. Studies on meat drying also indicate that vacuum technology is less destructive to tissue structure than convective drying, which results in better rehydration properties of the product [20]. Furthermore, it has been shown that appropriate raw material preparation and the application of non-thermal methods before VD may further improve the final quality of meat, including its texture and water reconstitution capacity [21]. However, despite these advantages, VD also has several limitations. The process requires specialised equipment capable of maintaining reduced pressure, which increases investment and operating costs. In addition, VD may be relatively time-consuming, particularly for products with high initial moisture content or compact tissue structure, such as meat. Uneven heat and mass transfer may also occur, leading to non-uniform drying and differences in texture, colour, or residual moisture within the product [5].
Dried meat products provide a particularly concentrated source of essential nutrients in the human diet, providing high-quality protein, and readily bioavailable iron, zinc, selenium, and B vitamins, including vitamins B6 and B12 [22]. The drying process leads to the concentration of these components through a substantial reduction in water content, thereby increasing the energy and nutritional density of the product [2,23].
Dried meat is widely used in human nutrition as a convenient, shelf-stable product suitable for special-purpose rations, including those for the military, tourists, mountaineers, and scientific expeditions [24]. Freeze-dried products are valued for their low weight, stability, and rapid rehydration under field conditions [13,25], while dried meat also serves as a high-protein snack responding to the demand for functional foods [26,27]. In many cultures, traditional dried meat products are additionally regarded as part of culinary heritage and appreciated for their sensory qualities [28,29]. Dried meat is also used in companion-animal nutrition, particularly in complete feeds and treats, as a digestible source of high-biological-value protein [30,31], with drying further improving microbiological stability and feed safety [32]. In the context of increasing consumer demands regarding food quality, safety, and minimal processing, both FD and VD represent promising directions in the development of meat-preservation technologies. They enable the production of high-value-added products that combine extended shelf life with the preservation of favourable quality attributes of the raw material. At the same time, the properties of dried meat may be determined not only by the drying method applied, but also by the process temperature and the type of raw material, which differ in chemical composition and muscle tissue structure. The aim of this study was to determine the effects of the drying method, namely FD and VD, and heating plate temperature on the drying kinetics, proximate chemical composition, colour coordinates, and cutting force of beef eye of round muscle, pork loin, and chicken fillet. The novelty of this study lies in the simultaneous comparison of FD and VD applied to three structurally different meat raw materials under the same temperature settings, combined with the assessment of drying kinetics, mathematical model fitting, proximate composition, colour distribution between the surface and central part of the samples, and cutting force measured in relation to muscle fibre orientation. The selection of beef eye of round muscle, pork loin, and chicken fillet was intentional, as these raw materials represent commonly consumed meat types of different species origin and differ markedly in chemical composition, muscle fibre structure, connective tissue content, colour-forming compounds, and water-binding characteristics. Therefore, they provide a suitable comparative matrix for assessing whether the effects of drying are raw-material-dependent. FD and VD were selected because both are advanced reduced-pressure drying techniques with potential application in the production of high-quality dried meat products, yet they differ fundamentally in the mechanism of water removal and thermal load imposed on the material. Based on the different mechanisms of water removal and thermal load involved in FD and VD, we hypothesised that the drying method and heating plate temperature would significantly affect drying kinetics and the quality attributes of dried meat in a raw-material-dependent manner.

2. Materials and Methods

2.1. Material

The research material consisted of meat obtained from beef eye of round muscle, chicken fillet, and pork loin. The raw material was purchased from a local supermarket located in Lublin. Before drying, the meat was cut into cubic pieces with a side length of 2 cm. The initial moisture content of the meat samples was determined by the gravimetric oven-drying method. Representative portions of the samples were dried in a laboratory oven at 105 °C until constant mass was achieved.

2.2. Drying Method

Both FD and VD were performed using a laboratory freeze-dryer (ALPHA 1-4, Martin Christ Gefriertrocknungsanlagen GmbH, Osterode am Harz, Germany). The apparatus was fitted with an integrated weighing module, allowing real-time monitoring of sample mass loss throughout the drying process. Mass changes were recorded at predetermined time intervals with a measurement accuracy of ±0.1 g [33]. Thermal energy necessary to support moisture removal during drying was transferred to the samples through direct contact with the heated shelves, whose temperature was regulated using a sensor embedded within one of the freeze-dryer plates. In each drying experiment, 300 g of sample material was evenly distributed on the trays as a single thin layer. Both FD and VD processes were performed at shelf temperatures of 20, 40, and 60 °C, while the chamber pressure was maintained at 63 Pa and 2000 Pa during FD and VD, respectively. Samples intended for FD were pre-frozen at −25 °C for 24 h before being placed in the dryer. This temperature was selected based on the operating conditions of the laboratory freezer and was considered adequate for the investigated sample characteristics, as it was sufficiently below the initial freezing point of meat to allow complete freezing before the sublimation stage.
For VD, the apparatus was operated as a VD system, i.e., without sample pre-freezing and without the sublimation step. In both drying treatments, the raw material was processed until a final moisture content of 5% was reached.
For both FD and VD, three independent drying runs were carried out for each meat type and each drying variant.

2.3. Modelling of Drying Curves

For both drying methods analysed, the water content of the meat was determined at successive measurement points based on changes in sample mass recorded during the process and the dry matter content determined in the material. The target final mass was calculated based on the initial moisture content and the assumed final moisture level [34].
The course of the drying process was characterised based on changes in the moisture ratio, expressed as MR, as a function of drying time. This parameter enables comparison of the kinetics of water removal from samples dried under different process conditions. Since the equilibrium moisture content was very low under the applied FD and VD conditions, it was assumed to be zero for the purpose of MR calculation.
Six empirical models frequently employed in studies on the dehydration of biological matrices were selected to describe the obtained drying curves. The equations of the models used are presented in Table 1.

2.4. Evaluation of Drying Energy Consumption

Both FD and VD were carried out in the ALPHA 1-4 freeze-dryer (Martin Christ Gefriertrocknungsanlagen GmbH, Osterode am Harz, Germany). In the case of VD, the device was operated under vacuum-drying conditions, without including the pre-freezing stage. The amount of electrical energy supplied to the drying unit was recorded as the power profile over the course of the drying process, with a sampling interval of 1 s. Power measurements were performed using a DW 6093 digital three-phase power meter manufactured by Lutron Electronic Enterprise Co., Ltd. (Taipei, Taiwan), equipped with SW-U811 software (version SW-U811-WIN). The specific energy consumption of drying was determined by converting the measured energy consumption to the amount of energy used per kg of dried product [34]. For FD, the energy required for pre-freezing was not included in the calculation; therefore, the reported values refer only to the electrical energy consumed during the drying stage.

2.5. Chemical Composition of Meat

Prior to chemical composition analysis, the samples were homogenised using a laboratory meat grinder (Royal Catering, RCMM-2000, Butzbach, Germany) fitted with a 4 mm perforated plate. Moisture content was determined according to PN-ISO 1442:2000 [41]. Protein content was analysed in accordance with PN-75/A-04018:2002 [42], whereas fat content was determined following PN-ISO 1444:2000 [43].

2.6. Determination of Peroxide Value and pH of Meat

The peroxide value of fresh meat and meat subjected to drying processes was determined according to the classical iodometric method, which is widely used in the analysis of lipid oxidation. Prior to the actual determination, it was necessary to isolate the fat fraction from the analysed samples. For this purpose, Soxhlet extraction was applied, as it provides high lipid recovery efficiency from both fresh meat and low-moisture products, such as freeze-dried or vacuum-dried meat. Fresh meat samples were homogenised, whereas dried meat samples were ground in a laboratory mill until a homogeneous fraction was obtained. Subsequently, an appropriate amount of material was weighed, i.e., 5 g for fresh meat and 2 g for dried meat, and placed in a Soxhlet apparatus. Extraction was carried out using petroleum ether for 6–8 h, until the lipid fraction had been completely extracted. After extraction, the solvent was evaporated.
The determination of the peroxide value was based on the reaction of lipid peroxides with a potassium iodide solution in a medium of acetic acid and chloroform. As a result of this reaction, iodine was liberated in an amount proportional to the peroxide content in the sample. The released iodine was titrated with a sodium thiosulphate solution in the presence of starch as an indicator. The endpoint was recorded when the blue colour disappeared. The result was expressed as milliequivalents of active oxygen per kg of fat. The analyses were performed in five replicates.
The pH of fresh meat and meat subjected to drying processes was measured using a laboratory pH meter equipped with an electrode designed for the analysis of food products with varied structure. The measurements were carried out using a pH-K21 pH meter (NWK-Technology GmbH, Aichach, Germany) with a LoT406-M6-DXK-S7/25 electrode (Mettler Toledo GmbH, Greifensee, Switzerland). Before the measurements, the instrument was calibrated using pH 4.00 and 6.88 buffer solutions, in accordance with the manufacturer’s recommendations, and the stability of the reading was verified before each series of determinations. The measurement accuracy was 0.01 pH units.
For fresh meat, pH was measured directly. The electrode was inserted into the muscle to a depth of approximately 25 mm, avoiding visibly fatty or damaged areas. The reading was recorded after the pH meter indication had stabilised. For each sample, at least five measurements were taken at different sites within the muscle, and the mean value was then calculated.
For dried meat, an indirect method was used due to the low water content and the impossibility of performing a direct measurement. Dried meat samples were ground in a laboratory mill until a homogeneous fraction was obtained. Subsequently, 10 g of the material was weighed and mixed with 90 mL of distilled water at room temperature. The suspension was vigorously stirred and left for 30 min to allow equilibration of the ionic potential and complete hydration of the sample. After this time, the electrode was immersed in the suspension, and the pH value was recorded after stabilisation of the reading. Each sample was analysed in five replicates.

2.7. Colour Measurement

The colour of the dried meat was measured using an X-Rite Ci64 handheld sphere spectrophotometer (X-Rite Incorporated, Grand Rapids, MI, USA) equipped with an integrating sphere and a 4 mm measurement aperture. The measurements were carried out under the D65 illuminant and a 10° standard colourimetric observer, following calibration of the instrument against a white reference standard. The results were expressed in the CIE L*a*b* colour space [44].

2.8. Texture Properties

The hardness of individual sample pieces was determined in five replicates and expressed as cutting force. Measurements were performed using a Zwick/Roell BDO-FB0.5 TH testing machine (Zwick GmbH & Co., Ulm, Germany) equipped with a Warner–Bratzler cutting blade. A 0.5 kN cell was used (speed 100 mm/min) according to the method described by Dib et al. [45].

2.9. Statistical Analysis

The obtained data were statistically evaluated using one-way and three-way analysis of variance (ANOVA), followed by Tukey’s post hoc test to determine significant differences among mean values (α = 0.05). Unless otherwise specified for a given analytical procedure, measurements were performed in triplicate. Drying kinetics data were fitted by non-linear least-squares regression. The goodness of fit of the applied models was evaluated according to the method described in [46]. All calculations were carried out using Statistica 13 software (StatSoft, Inc., Tulsa, OK, USA).

3. Results and Discussion

3.1. Drying Kinetics

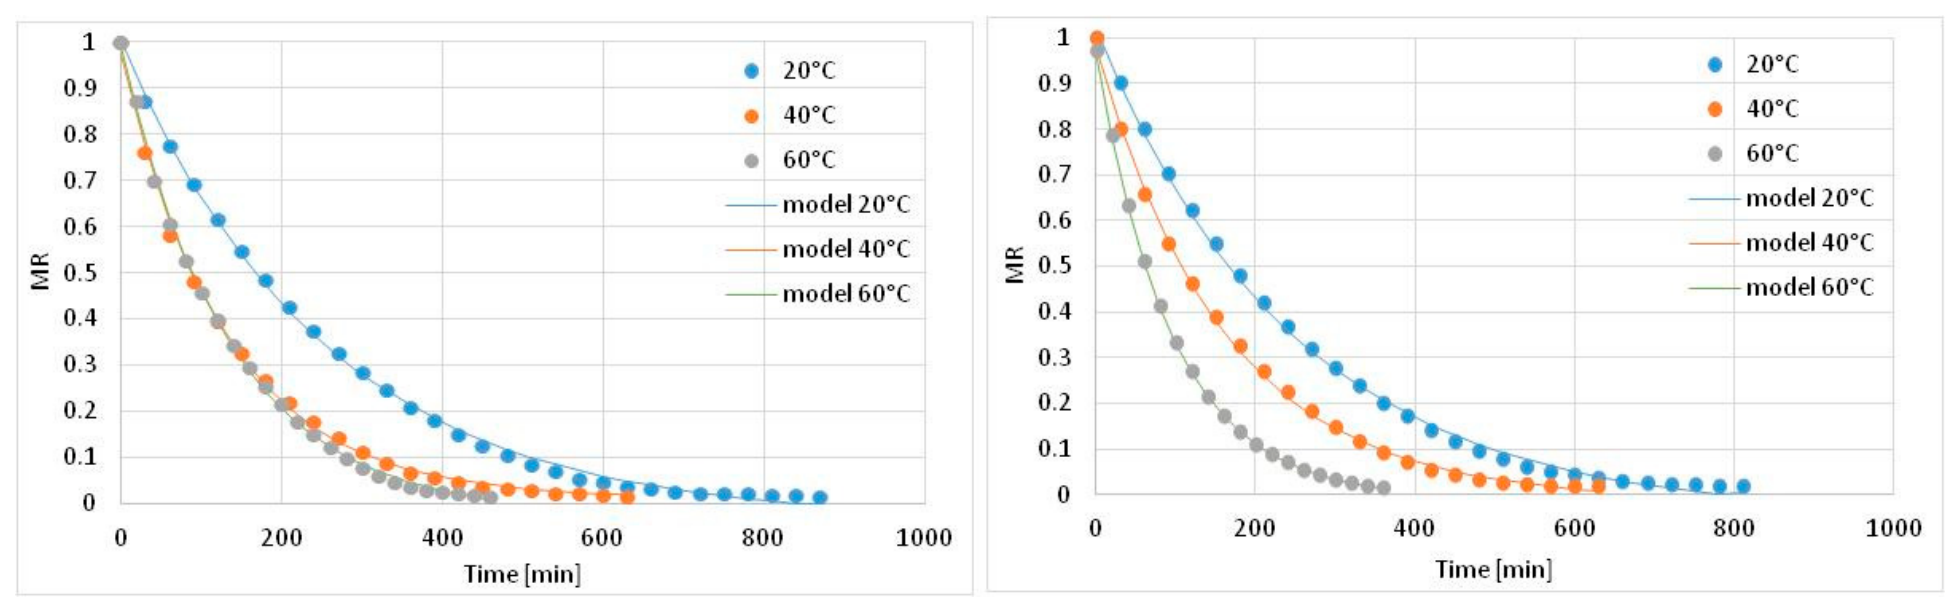
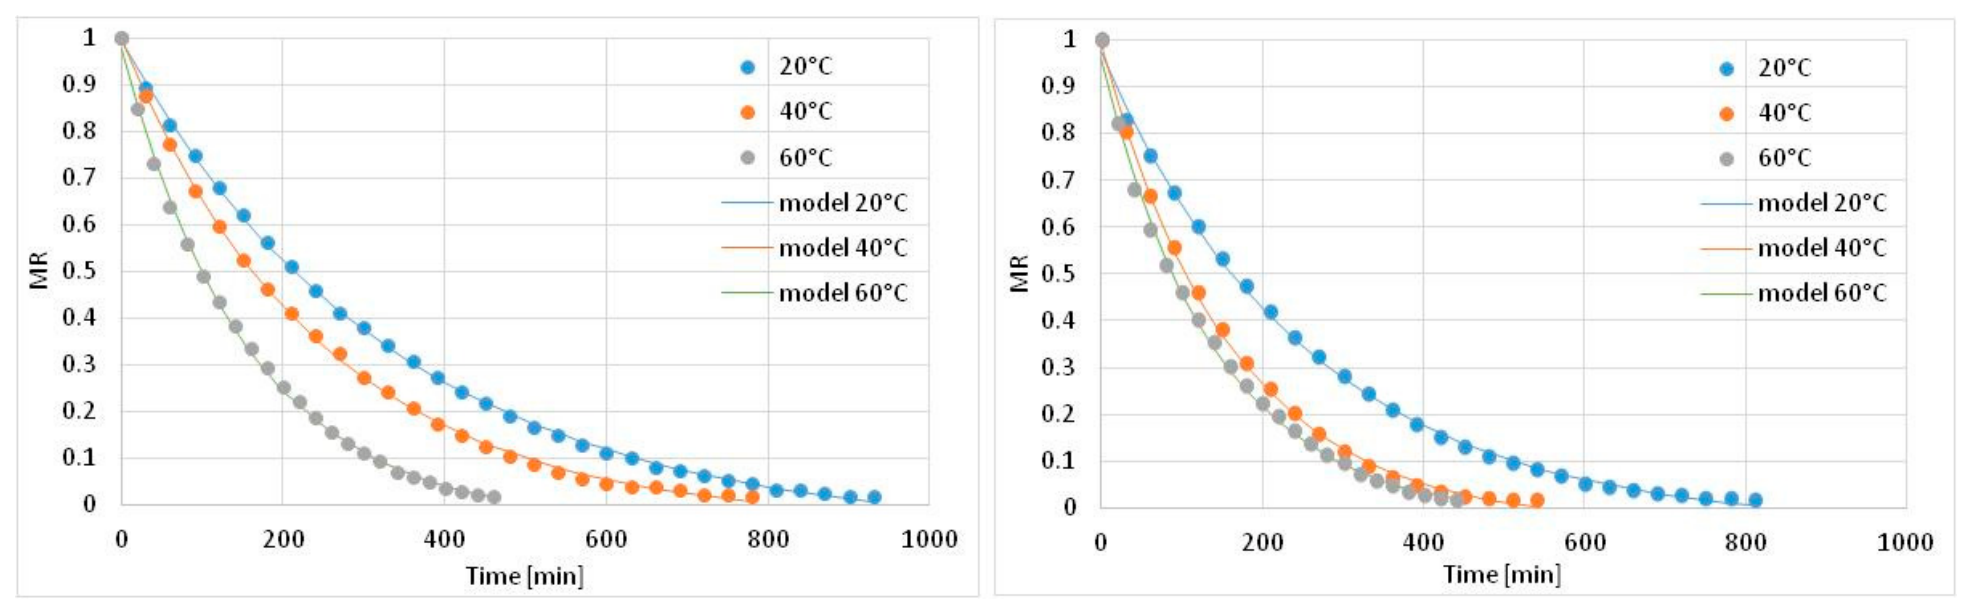
Changes in the MR as a function of vacuum-drying and FD time for beef eye of round muscle, chicken fillet, and pork loin are presented in Figure 1, Figure 2 and Figure 3. In all cases, the MR curves showed a typical falling-rate drying behaviour, indicating that moisture removal was mainly controlled by internal water migration rather than by evaporation of free surface water [23]. This is consistent with the structure of meat, in which a large fraction of water is immobilised within the myofibrillar matrix and its removal requires diffusion through muscle fibres, connective tissue, and progressively dehydrated surface layers [47,48]. Therefore, the drying curves should not be interpreted only as a consequence of the temperature increase, but also as the result of changes in internal mass-transfer resistance during dehydration.
For all analysed meat types, a clear decrease in drying time was observed with increasing process temperature from 20 °C to 60 °C; in the case of FD, this value refers to the shelf temperature rather than the actual product temperature. Irrespective of the drying method applied, the increase in temperature intensified water removal. In VD, this effect may be associated with an increase in water vapour pressure, enhanced moisture diffusion, and a greater driving force for mass transfer. At higher temperatures, the vapour pressure gradient between the product and the drying environment becomes larger, while water mobility and the effective moisture diffusivity increase, which together facilitate moisture movement from the inner part of the sample to its surface. However, under VD conditions, this acceleration may be partly limited by tissue shrinkage, structural compaction, and the formation of a more resistant dehydrated surface layer, especially in muscles with a compact structure. Such internal resistance to mass transfer may explain why the increase in drying rate was not identical for all meat types. This interpretation is supported by the higher shear force values observed in vacuum-dried meat, which suggest increased structural compactness and greater mechanical resistance of the dried tissue.
In FD, a higher shelf temperature increases the heat supplied to the material, thereby accelerating ice sublimation, while the actual product temperature remains governed by pressure, heat-transfer conditions, and sublimation cooling. Thus, the shelf temperature should be treated as a process-control parameter rather than as a direct equivalent of product temperature. During primary FD, a considerable part of the supplied heat is consumed as latent heat of sublimation, which keeps the product temperature lower than the shelf temperature [49]. This heat–mass transfer coupling is particularly important when comparing FD with VD, because in VD water is removed mainly in the liquid/vapour state, whereas in FD frozen water is removed by sublimation through a porous dried layer. Similar relationships have been reported in studies on the drying of goat meat and other meat products, in which higher temperature significantly increased the drying rate and effective moisture diffusivity [50,51].
In all analysed cases, the longest drying time was recorded at 20 °C, whereas the shortest was observed at 60 °C. For chicken fillet, the VD time decreased from 930 min at 20 °C to 460 min at 60 °C, corresponding to a reduction of approximately 50%. In FD, the process time decreased by approximately 46% as the shelf temperature increased over the same range. This confirms that temperature was the dominant process variable affecting the drying kinetics, although its effect depended on both the drying method and the anatomical origin of the meat. The comparable percentage reduction observed for VD and FD suggests that increasing heat input intensified moisture removal in both systems, but through different mechanisms: enhanced evaporation and diffusion in VD, and faster sublimation and vapour transport in FD.
These results fall within the range reported in a study on meat drying, where shortening of the drying process due to increased temperature or intensified heat transfer usually amounted to 30–60%, depending on sample geometry, pressure, and flow conditions [52]. A similar relationship was observed for pork loin and beef eye of round for which PE pulsed electric fields or ultrasound-assisted treatments enhanced water transfer and accelerated drying kinetics [53,54]. Although pulsed electric fields and ultrasound are different intensification methods from those used in the present study, these reports are useful for interpretation because they demonstrate that reducing internal resistance to moisture migration is a key factor in shortening meat-drying time.
Under the experimental conditions used in this study, FD was characterised, in most cases, by a shorter process duration than VD for the same raw material and corresponding temperature setting. These differences were particularly evident at lower temperatures. This comparison should be interpreted in relation to the applied process conditions: FD was performed at a chamber pressure of 63 Pa, whereas VD was performed at 2000 Pa, while the sample load and geometry were the same for both drying methods. For pork loin, the FD process conducted at a shelf temperature of 60 °C lasted 360 min, whereas VD at 60 °C required 460 min, corresponding to a reduction in process time of approximately 22%. In the case of beef eye of round at 20 °C, FD shortened the process from 1050 to 900 min. This tendency may be explained by the fact that ice sublimation can promote better preservation of the material structure and the formation of a more porous matrix, which may reduce resistance to water vapour diffusion [6,25]. Moreover, the lower pressure used during FD increased the driving force for vapour removal from the frozen material and facilitated vapour transport from the sublimation front through the dried porous layer. Therefore, although sublimation is commonly considered a slow process, under the applied conditions it could proceed more efficiently than moisture removal during VD, where unfrozen water migration and evaporation occurred at a higher chamber pressure and could be additionally limited by shrinkage and structural compaction. VD of unfrozen samples proceeds through liquid-water migration and evaporation under reduced pressure; therefore, progressive shrinkage, capillary collapse, and compaction of the protein matrix may increase the resistance to moisture transport [1]. In FD, the more open porous structure generated by ice sublimation facilitates vapour escape from the sublimation front through the dried layer, which may contribute to the shorter drying times observed in this study [49]. At a given temperature level, regardless of the drying method applied, beef eye of round exhibited the longest drying time. This may result from its more compact muscle structure and higher connective tissue content, which hinder water migration [14,55]. The longest drying time was recorded for vacuum-dried beef eye of round at 20 °C and amounted to 1050 min. The shortest drying time was obtained for pork loin subjected to FD at a shelf temperature of 60 °C, for which the process lasted 360 min. Beef eye of round is a relatively dense muscle, and its lower permeability may restrict both liquid-water movement during VD and vapour movement during FD. In addition, a higher proportion of connective tissue may increase the mechanical rigidity of the matrix and reduce the formation of open diffusion pathways during drying. These factors can explain why beef eye of round showed the slowest MR decrease and the lowest drying constant values.
Chicken fillet showed an intermediate drying behaviour. Although chicken breast muscle generally contains a high amount of water, its lower connective tissue content and less compact structure may facilitate moisture migration compared with beef eye of round. This could explain why the drying time of chicken fillet was shorter than that of beef under comparable conditions. Pork loin, particularly during FD, showed the fastest water removal. This may be associated with differences in muscle fibre arrangement, water-holding capacity, and structural response to freezing and sublimation. The lower resistance to vapour diffusion in pork loin after ice removal may have contributed to the shortest process time observed in this study.
The comparison between the two drying techniques indicates that the relative advantage of FD over VD depended on both temperature and meat type. In general, increasing the process temperature accelerated moisture removal in both methods, but the magnitude of this effect differed among samples. At lower temperatures, VD may have been limited by slower liquid-water diffusion and lower vapour pressure, whereas FD proceeded through ice sublimation from the frozen matrix. At 60 °C, the difference between the two methods became smaller only in some cases, suggesting that higher heat input could partly compensate for mass-transfer limitations during VD. These results indicate that the relative efficiency of VD and FD depends not only on temperature, but also on the physical state of water in the material and on structural changes occurring during dehydration.
The results of the regression analysis for the six models used to describe the VD and FD kinetics of the analysed meat types are presented in Table 2, Table 3 and Table 4. Based on this analysis, it can be concluded that all the tested models provided a good fit to the experimental data. The coefficient of determination (R2) for the equations, across the entire measurement range, varied from 0.914 to 0.9997. The root mean square error (RMSE) and reduced chi-square (χ2) values were also low, ranging from 0.0053 to 0.0812 and from 0.0001 to 0.0042, respectively. The simultaneous use of R2, RMSE, and χ2 is important because a high R2 value alone does not fully confirm the predictive quality of a drying model. Low RMSE and χ2 values indicate that the deviations between experimental and predicted MR values were small over the entire drying period, including both the initial rapid moisture removal stage and the later stage, when water became more difficult to remove. Across the entire measurement range, the best agreement between the model predictions and experimental data was obtained using the logarithmic model. The logarithmic model is frequently reported as the most suitable model for describing drying kinetics [56,57,58,59]. The good performance of the logarithmic model may be related to its empirical constant b in equation 3 (Table 1), which allows better representation of the asymptotic part of the drying curve at low moisture ratios. This is particularly relevant for meat, where the final stage of drying is controlled by strongly bound water and by diffusion through a progressively denser matrix. Therefore, the logarithmic model was able to describe not only the initial decrease in the MR, but also the slower approach to the final moisture level. Similar suitability of empirical and semi-empirical models, including the logarithmic model, has been reported for meat and other high-protein materials dried under different conditions [60,61].
The coefficients of the analysed equations, specified in Table 1, are presented in the Supplementary Files (Tables S1–S3) according to the meat type, drying method, and applied temperature: the process temperature in the case of VD and the shelf temperature in the case of FD. For the logistic model, the estimated coefficients were not statistically significant for beef eye of round muscle vacuum-dried at 20 °C and freeze-dried at a shelf temperature of 40 °C, as well as for pork loin vacuum-dried at 40 °C and 60 °C and freeze-dried at a shelf temperature of 60 °C. Therefore, for both drying methods analysed, the value of the drying constant k in the logarithmic equation, presented in Tables S1–S3, increased with increasing applied temperature: the process temperature in the case of VD and the shelf temperature in the case of FD. This increase confirms the acceleration of drying kinetics with higher heat input and is consistent with the expected increase in effective moisture diffusivity. In practical terms, a higher k value indicates a faster decrease in the MR and therefore a shorter time required to reach the assumed final moisture level. This relationship was observed for all analysed meat types, except for pork loin vacuum-dried at 40 °C and 60 °C, for which the values of the k coefficient were similar. A similar phenomenon has been reported in studies on beef drying, where overlapping drying curves and lower sensitivity of model parameters to further temperature increases were observed at higher temperatures [62]. The limited difference between k values at 40 °C and 60 °C for vacuum-dried pork loin may indicate that, above a certain temperature, the drying rate was no longer controlled primarily by heat supply but by internal mass transfer. Possible explanations include surface shrinkage, reduced porosity, local protein denaturation, or the formation of a less permeable dried layer. Under such conditions, a further temperature increase does not necessarily lead to a proportional increase in moisture removal.
At a given temperature level, the values of the k coefficient were, in most cases, higher for FD than for VD. The highest value of the k coefficient was obtained during FD of pork loin at a shelf temperature of 60 °C and amounted to 0.0105. The lowest value of this coefficient was recorded during VD of beef eye of round muscle at 20 °C. This relationship was observed for all analysed meat types, except for pork loin vacuum-dried at 40 °C and 60 °C, for which the values of the k coefficient were similar. At a given temperature level, the values of the k coefficient were, in most cases, higher for FD than for VD. This confirms that, under the conditions used in this study, FD provided more favourable kinetic conditions for water removal. The higher k values may be attributed to the porous structure generated after ice sublimation and to lower structural collapse compared with VD. In contrast, vacuum-dried samples were more likely to undergo shrinkage and matrix compaction, which increased diffusion resistance and reduced the apparent drying constant. The highest value of the k coefficient was obtained during FD of pork loin at a shelf temperature of 60 °C and amounted to 0.0105. The lowest value of this coefficient was recorded during VD of beef eye of round muscle at 20 °C. These two extreme values are consistent with the process-time results: pork loin freeze-dried at 60 °C represented the most favourable combination of material structure and heat supply, whereas beef eye of round vacuum-dried at 20 °C represented the least favourable combination due to low thermal driving force and high internal resistance to moisture migration. Overall, the modelling results support the experimental MR curves and confirm that the differences between drying methods and meat types were systematic rather than incidental.

3.2. Drying Energy

Regardless of the drying method, increasing the process temperature from 20 to 60 °C resulted in a systematic decrease in the specific energy consumption of drying (Table 5). For FD, energy consumption decreased from 26.0 to 16.5 kWh/kg dried product for beef eye of round, from 26.6 to 15.3 kWh/kg dried product for chicken fillet, and from 24.7 to 12.4 kWh/kg dried product for pork loin. This corresponded to reductions of 36.5%, 42.5%, and 49.8%, respectively. A similar tendency was observed for VD, where the specific energy consumption decreased from 27.4 to 15.2 kWh/kg dried product for beef, from 26.3 to 13.8 kWh/kg dried product for chicken, and from 23.0 to 13.3 kWh/kg dried product for pork loin, corresponding to reductions of 44.5%, 47.5%, and 42.2%, respectively.
This decrease can be attributed mainly to the acceleration of heat and mass transfer at higher temperatures, which shortened the drying time and consequently reduced the total amount of electrical energy required per kilogram of dried product. Since the energy consumption of drying is determined by the integral of power demand over time, the reduction in process duration may compensate for the higher thermal load applied at elevated temperatures. Thus, drying temperature had a marked practical effect on the energy efficiency of both FD and VD.
At 20 °C, differences between FD and VD were relatively small for beef and chicken samples. In beef, the energy consumption was 26.0 kWh/kg dried product for FD and 27.4 kWh/kg dried product for VD, whereas in chicken it was 26.6 and 26.3 kWh/kg dried product, respectively. In pork loin, VD required approximately 7% less energy than FD at 20 °C. At 40 °C, the effect of the drying method became more dependent on meat type: similar values were obtained for beef, whereas VD required more energy than FD for chicken but less energy for pork loin. At 60 °C, the lowest energy consumption values were recorded, particularly for pork loin dried by FD and VD and for chicken dried by VD.
The results of the three-factor ANOVA confirmed that the meat type, drying method, and drying temperature significantly affected the specific energy consumption of drying (p < 0.001). The significant MT × DM and MT × DT interactions indicate that the effect of the drying method and temperature was dependent on the type of meat. This may be related to differences in the structure, initial water content, composition, and drying behaviour of the analysed meat materials. In contrast, the DM × DT interaction was not significant, suggesting that the general effect of increasing temperature on reducing energy consumption was comparable for both drying methods. However, the significant MT × DM × DT interaction shows that the combined effect of the method and temperature differed among the meat types.
It should also be emphasised that the reported values refer to the electrical energy consumed during the drying stage and expressed per kilogram of dried product. The energy required for pre-freezing was not included in the calculation; therefore, the results should not be interpreted as the total energy demand of the complete FD process.

3.3. Fat and Protein Content

Among the raw materials, fat content was highest in pork loin and lowest in chicken fillet (Table 6 and Table S4). VD conducted at 20 °C and 40 °C, as well as FD carried out at shelf temperatures of 20 °C and 40 °C, did not significantly affect the fat content of dried beef eye of round muscle or chicken fillet. These differences were also not significant compared with the fat content of the raw material. Similar relationships were observed for VD pork loin. In contrast, in the case of FD, a significant decrease in fat content was recorded. Limited oxygen availability under reduced-pressure conditions may decrease the intensity of lipid oxidation reactions. This effect may be particularly important during FD, in which water removal occurs mainly through ice sublimation and the product temperature does not necessarily correspond to the shelf temperature. Such conditions may reduce the extent of lipid autoxidation and hydrolysis [14]. Similar observations were reported by Mediani et al., who showed that FD promotes better preservation of lipid components compared with high-temperature methods [1]. Dried products obtained by VD at 60 °C and by FD at a shelf temperature of 60 °C were characterised by significantly lower fat content than the raw material and dried products obtained at lower temperatures. This may be associated with an increased oxidation rate of unsaturated fatty acids at higher temperatures and the formation of volatile oxidation products, such as aldehydes and ketones [63]. The decrease in fat content observed at 60 °C may be related to the higher susceptibility of lipids to oxidative changes under elevated drying temperatures. This explanation is supported by the TBARS results, which indicate intensified lipid oxidation in samples dried at higher temperatures. However, the mechanisms responsible for the observed changes in fat content were not directly investigated in the present study. Therefore, this interpretation should be treated with caution, and further studies including fatty acid composition, volatile oxidation products, and more detailed lipid oxidation markers are needed to fully explain these changes.
The drying method had no significant effect on the fat content of dried beef eye of round muscle, which was approximately 10.4 g/100 g dry mass (d.m.). In contrast, a significant effect of the drying method was observed for chicken fillet, for which a lower fat content was found after VD, with a value of 8.85 g/100 g d.m. In the case of pork loin, changes in fat content were less clear. The fat content of the raw material was 13.35 g/100 g d.m., and after VD at 20–40 °C it remained at a similar level. After FD at a shelf temperature of 40 °C, a significant decrease in fat content was recorded, corresponding to approximately 4% relative to the initial value.
Among the three analysed meat types, the greatest decrease in fat content relative to the raw material was found in dried chicken fillet, amounting to approximately 29% for VD60 and 19% for FD60. These results suggest that poultry meat lipids may be more susceptible to oxidative and thermal changes than lipids in red meat. Poultry meat is characterised by high oxidative susceptibility, which may lead to faster lipid degradation during heat treatment and drying [5]. This may also be explained by the fatty acid composition of poultry meat, which contains a higher proportion of polyunsaturated fatty acids than beef or pork [55]. The higher proportion of unsaturated fatty acids, especially polyunsaturated fatty acids, increases the number of double bonds available for oxidation, which may intensify lipid oxidation during drying at elevated temperatures [63]. Moreover, the observed reduction in fat content may partly result from changes in lipid extractability caused by oxidation products and interactions between oxidised lipids and muscle proteins [4,63]. Therefore, the decrease in analytically determined fat content should be interpreted not only as a direct loss of lipids, but also as a consequence of chemical transformations affecting their recovery during analysis. In addition, because chicken fillet is a relatively lean raw material, even small absolute changes in lipid content may be reflected as relatively large percentage differences.
Moreover, FD at a shelf temperature of 60 °C resulted in a smaller reduction in fat content than VD performed at the corresponding process temperature. Similar results were reported by King and Chen for dried beef and pork [64]. This effect may be associated with the lower exposure of the material to oxygen and the different heat-transfer conditions during FD, which may limit oxidative changes compared with VD. In contrast, VD at elevated temperature may promote lipid oxidation and thermal transformations despite the reduced pressure, especially when the drying time and temperature are sufficient to intensify these reactions.
The three-way ANOVA performed for dried samples showed that total fat content was significantly affected by the meat type and drying temperature (p < 0.001), whereas the main effect of the drying method was not significant (p = 0.408). Significant interactions were found for meat type × drying method (p = 0.047), meat type × drying temperature (p < 0.001), and meat type × drying method × drying temperature (p < 0.001). In contrast, the drying method × drying temperature interaction was not significant (p = 0.470). These results indicate that the effect of drying conditions on total fat content depended mainly on the meat type and drying temperature, rather than on the drying method alone.
In the raw material, the highest protein content was found in chicken fillet—82.41 g/100 g d.m.—whereas the protein content in the other two types of meat was similar (Table 7 and Table S5). For all analysed meat types, the protein content in dried samples obtained using FD and VD at 20 °C and 40 °C did not differ significantly from that determined in the raw material. Literature data indicate that muscle proteins are relatively stable at temperatures below 50 °C and that their structure undergoes only minor changes under these conditions [65,66]. Since protein content was expressed on a dry matter basis, the lack of significant differences indicates that no measurable protein losses occurred during drying at lower temperatures, although minor structural modifications or denaturation processes cannot be excluded.
At the highest temperature analysed, a decrease in protein content was observed compared with both the raw material and the dried samples obtained at lower temperatures. In each of the three analysed raw materials, the samples obtained using FD were characterised by slightly higher protein content than those obtained using VD; however, these differences were not statistically significant. The protein content values in dried samples obtained at a heating plate temperature of 60 °C were 77.05 g/100 g d.m. for beef, 79.86 g/100 g d.m. for chicken, and 76.35 g/100 g d.m. for pork. The decrease in protein content at this temperature may have been associated with thermally induced protein changes, including partial denaturation and/or degradation [67]. Across the entire temperature range analysed and for both drying methods applied, the highest protein content was found in dried samples obtained from chicken fillet.
The three-factor ANOVA revealed a significant effect of the meat type (MT) and drying temperature (DT) on protein content, whereas the drying method (DM) had no significant influence. The highly significant effect of MT (p < 0.001) indicates differences in protein content among beef, chicken, and pork samples. Drying temperature also significantly affected protein content (p < 0.001), suggesting that temperature-dependent changes occurred during drying. In contrast, the effect of the drying method was not significant (p = 0.853), indicating that, overall, VD and FD had a comparable influence on protein content. No significant two-way or three-way interactions were found, which suggests that the effects of the individual factors were independent and that the response of protein content to drying temperature was not significantly modified by the meat type or drying method (Table 7).

3.4. Peroxide Value and pH

The results presented in Table 8 and Table S6 indicate a pronounced effect of both the drying method and drying temperature on the extent of lipid oxidation in beef, chicken, and pork samples. The peroxide value (PV) of the raw materials was low, confirming a limited formation of primary lipid oxidation products before processing. Among the raw samples, chicken meat showed the highest PV, which may be associated with its relatively high content of polyunsaturated fatty acids, which are particularly susceptible to free-radical oxidation reactions [5,68].
At 20 °C and 40 °C, both FD and VD caused only a moderate increase in PV. Within each meat type, the values obtained at these two temperatures were generally similar, indicating that mild drying conditions limited the formation of lipid hydroperoxides. This may be related to the reduced thermal load applied to the samples and, in the case of VD, to the restricted oxygen availability during processing. However, the increase in PV compared with the raw material suggests that drying itself promoted lipid oxidation, probably due to tissue disruption, changes in the physical structure of the meat matrix, and increased susceptibility of lipids to oxidation during dehydration and subsequent exposure to oxygen. A marked increase in PV was observed when the drying temperature was raised to 60 °C. This effect was particularly evident in chicken meat, for which PV reached 11.29 meq O2/kg fat after FD and 12.37 meq O2/kg fat after VD. Higher drying temperature accelerates the initiation and propagation of lipid oxidation reactions by increasing molecular mobility and promoting the formation of lipid radicals and hydroperoxides [5,69]. The high PVs recorded at 60 °C therefore indicate intensified formation of primary oxidation products, especially in meat types richer in oxidation-susceptible unsaturated fatty acids. Overall, the increase in PV after drying indicates that dehydration promoted the formation of lipid hydroperoxides in the lipid fraction. This effect may be related to structural changes in the meat matrix, disruption of cellular compartments, and enhanced susceptibility of lipids to oxidation after water removal. Moreover, the pronounced increase observed at 60 °C suggests that lipid oxidation was additionally promoted by the higher thermal load during the final drying stage, which is consistent with previous studies on the oxidative stability of freeze-dried meat products [70]. The effect of the drying method became more evident at 60 °C. At this temperature, vacuum-dried samples showed higher PVs than freeze-dried samples in all meat types. This suggests that, despite the restricted oxygen availability under vacuum, the higher effective thermal load during VD intensified lipid oxidation. In FD, part of the supplied energy is used for ice sublimation, which may delay sample heating and reduce the thermal stress imposed on the lipid fraction. In contrast, during VD, heat is transferred more directly to the product, which may promote faster accumulation of lipid hydroperoxides, particularly at elevated temperatures [5].
The significant effects of the meat type, drying method, drying temperature, and all their interactions confirmed that lipid oxidation was not determined by a single processing factor, but by the combined influence of meat composition and drying conditions. The significant MT × DM × DT interaction indicates that the response of each meat type to the drying method and temperature was different. Chicken meat was the most susceptible to peroxide formation, whereas beef showed comparatively lower PVs under mild drying conditions. These differences may result from variations in fatty acid composition, endogenous pro-oxidant content, and structural properties of the meat matrix.
The pH values presented in Table 9 and Table S7 indicate that both FD and VD generally reduced meat pH compared with the fresh raw material. The fresh meat samples exhibited pH values typical of the respective meat types. These values were consistent with the physiological pH range of post-mortem muscle after the completion of glycolysis, as reported in studies on meat quality and biochemical properties [71,72].
After FD and VD at 20 °C and 40 °C, a slight, mostly statistically non-significant decrease in pH was observed in all meat types. More pronounced changes were recorded in samples freeze-dried at 60 °C, where pH decreased to 5.46 in beef, 5.62 in chicken, and 5.56 in pork. This marked decrease may be associated with the intensification of oxidative processes occurring at higher temperatures, including the formation of lipid hydroperoxides and acidic secondary oxidation products. Elevated temperature may also promote protein denaturation and the exposure of carboxyl groups, which may further contribute to pH reduction [68,69].
A similar trend was observed after VD. At 60 °C, the decrease in pH was even more pronounced than after FD, particularly in beef (5.40) and pork (5.49). This may result from the direct transfer of heat to the sample during VD, leading to faster heating of the meat matrix and more intensive degradation of proteins and lipids [73].
The three-factor ANOVA showed that meat pH was significantly affected by the meat type (MT), drying method (DM), and drying temperature (DT) (p < 0.001 for all main effects) (Table S6). This indicates that pH differed among beef, chicken, and pork samples and was also modified by both the drying technique and the temperature applied during drying. Among the interaction effects, only the MT × DT interaction was statistically significant (p = 0.043), suggesting that the effect of drying temperature on pH was not identical across the different meat types. In contrast, the MT × DM, DM × DT, and MT × DM × DT interactions were not significant (p = 0.745, p = 0.088, and p = 0.748, respectively). This indicates that the effect of the drying method was generally consistent across meat types and temperatures, and that no complex combined effect of all three factors on pH was observed.

3.5. Colour Coordinates

Table 10, Table 11, Table 12 and Tables S8–S10 present the values of colour coordinates for beef eye of round muscle, chicken fillet, and pork loin. In the raw material, the highest lightness (L*) was observed for chicken fillet (76.06), confirming its naturally lighter colour compared with pork (53.53) and beef (41.32). These differences result mainly from the content of haem pigments, primarily myoglobin, whose amount is highest in beef and lowest in poultry meat. This relationship is supported by studies indicating that myoglobin content and its oxidative state are key determinants of meat colour [74]. It has also been shown that different redox forms of myoglobin are strongly correlated with CIELab colour parameters, including the L* coordinate [75]. Therefore, the initial differences in colour between the analysed raw materials should be interpreted primarily as a consequence of species-specific muscle pigment concentration and biochemical characteristics, rather than as an effect associated with drying. This is particularly important when comparing processed samples, because the extent of colour change depends not only on the drying conditions but also on the initial colour characteristics of each meat type.
The drying process, irrespective of the method used, led to a marked increase in the lightness of dried meat compared with the raw material. This effect was particularly evident after FD, which produced the highest L* values for all analysed raw materials. This may be explained by the limited effect of temperature and the preservation of a porous material structure, which promotes greater light reflection [71]. The observed differences between the surface and the geometric centre also indicate that colour changes during drying were not uniform throughout the sample volume. The surface layer was directly exposed to more intensive heat and mass transfer, which could accelerate pigment oxidation, non-enzymatic browning, and structural collapse. In contrast, the geometric centre was probably less affected by these reactions, which explains the higher L* values recorded in many samples. For example, in the geometric centre of the sample, the L* value for chicken fillet freeze-dried at a shelf temperature of 20 °C was 84.47, whereas for pork loin it was 83.28. As the process or shelf temperature increased, a decrease in sample lightness was observed in products obtained by both FD and VD. This tendency was particularly pronounced on the sample surface. In vacuum-dried beef, the surface L* value decreased by approximately 31.5% when the temperature increased from 20 °C to 60 °C. For the other meat types, the decrease was approximately 23% for chicken fillet and approximately 22% for pork loin. This phenomenon may be attributed to the intensification of non-enzymatic browning reactions, mainly Maillard reactions, and the oxidation of muscle pigments at higher temperatures, leading to product darkening [71].
The three-factor ANOVA showed that the meat type (MT), drying method (DM), and drying temperature (DT) had significant effects on the colour coordinates of meat (p < 0.001). Significant two-way interactions (MT × DM, MT × DT, and DM × DT) were also observed, as well as a significant three-way interaction (MT × DM × DT; p < 0.001). These results indicate that changes in meat colour after drying were not determined by individual factors alone, but depended on the combined effects of the meat type, drying method, and drying temperature. The same pattern of significance was obtained for each colour coordinate and for measurements performed both on the sample surface and at the geometric centre of the samples.
A comparison of the drying methods indicates that FD was more effective than VD in preserving a lighter colour of the meat. These differences were particularly evident on the sample surface, where VD may have caused greater structural densification and more intense chemical transformations leading to reduced lightness. Significant differences were also observed between the geometric centre and the surface of the samples. In most cases, L* values were higher in the geometric centre than on the surface, especially at higher vacuum-drying temperatures. This phenomenon is consistent with reports indicating that the meat surface is the most susceptible to oxidative and thermal changes, resulting in greater darkening compared with the interior of the sample [71].
In summary, the highest lightness was observed in chicken fillet samples freeze-dried at the lowest shelf temperature tested, namely 20 °C, whereas the lowest L* values were recorded for beef vacuum-dried at 60 °C, particularly on the sample surface. Thus, the preservation of redness was favoured by mild drying conditions, while higher temperatures, particularly VD, promoted pigment degradation and a shift away from the typical red colour of meat.
The highest a* value, characterising the contribution of the red component to the colour of the raw material, was recorded for beef (25.77), followed by chicken meat (15.71), whereas the lowest value was observed for pork (11.14). The drying process caused a marked decrease in a* values for all analysed drying methods and at all temperatures within the investigated range, indicating a reduction in redness. These changes may be primarily associated with the denaturation and oxidation of myoglobin, including its conversion to metmyoglobin, as well as with the occurrence of Maillard reactions, particularly at higher temperatures [76,77].
An increase in drying temperature from 20 °C to 60 °C resulted in a systematic decrease in a* values (redness). In freeze-dried beef, measured at the geometric centre of the sample, the a* value decreased by approximately 22%. For chicken fillet, the decrease in this colour coordinate was approximately 28%, whereas for pork loin it was approximately 24%. After VD of beef, the reduction was even greater, amounting to approximately 30%. In contrast, for the other two types of meat, the decreases in a* values were smaller than those observed after FD and amounted to approximately 10%.
Significant differences were also found between the geometric centre and the surface of the samples. In most cases, a* values were higher on the surface than at the geometric centre, particularly for beef and pork freeze-dried at lower temperatures, for example 12.57 vs. 11.00 for beef dried at 20 °C. This may result from faster colour fixation on the product surface, as well as from differences in the rate of water removal and in the course of chemical reactions occurring in the external and internal layers of the samples [72].
When comparing the drying methods, FD appeared to favour better preservation of the red colour, as indicated by higher a* values compared with VD, particularly at lower temperatures. In summary, the highest values of the a* coordinate were retained in samples dried at lower temperatures, especially by FD, whereas the lowest values were found in meat vacuum-dried at 60 °C.
The greatest changes in redness were observed in beef, which may be attributed to its initially high myoglobin content. Previous studies confirm that meat with a high content of this pigment is more susceptible to colour changes during thermal processing and drying [76,77]. These results indicate that both drying temperature and drying method are important factors affecting the preservation of the desired red colour in dried meat.
In the raw material, the values of the b* colour coordinate, corresponding to yellowness in the CIELab colour space, were relatively low. The highest value was recorded for beef, at 12.75, whereas lower values were observed for chicken, at 7.43, and pork, at 6.90. This indicates a limited contribution of the yellow component to the colour of fresh meat, which is typical of unprocessed products [63,78].
The drying process, irrespective of the method applied, resulted in a marked increase in b* values, indicating an increased contribution of yellow hues to the colour of the product. Even in the case of FD conducted at 20 °C, b* values increased more than twofold for chicken and pork, reaching approximately 16, whereas in beef the increase was less pronounced, with an increase of approximately 5 units. This phenomenon may be primarily associated with the concentration of colour-related compounds as a result of water removal, as well as with the possible initiation of non-enzymatic browning reactions [63].
With increasing drying temperature, a further increase in b* values was observed, particularly in the case of VD. For example, beef vacuum-dried at 60 °C reached a b* value of 26.52 at the geometric centre, which was the highest value recorded at this measurement location. Similarly, on the surface of chicken and pork samples processed using the same method and temperature, very high b* values were recorded, amounting to 27.13 and 25.85, respectively. This may be associated with an intensification of Maillard reactions and lipid oxidation processes, which lead to the formation of compounds imparting yellow, yellow–brown, or brown colouration to the products [79].
A comparison of the drying methods indicates that VD promoted a greater increase in b* values than FD, especially at higher temperatures. In the case of FD, the changes were more moderate, which may suggest a milder course of the chemical transformations responsible for colour development [5]. This confirms that FD better limited the development of yellow–brown tones, probably due to lower thermal stress and better preservation of the structural properties of the dried matrix. In contrast, VD, particularly at elevated temperature, favoured reactions responsible for colour darkening and yellowing.
The level of the b* coordinate was also affected by the type of meat. The greatest increases in b* values were observed in pork and chicken, particularly on the surface of the samples, where colour changes were most pronounced. Beef showed greater colour stability at lower temperatures; however, at 60 °C, especially during VD, a considerable increase in this colour coordinate was observed. The literature indicates that meat with a higher proportion of unsaturated fatty acids, such as poultry meat, may be more susceptible to lipid oxidation, which may contribute to more intensive yellowing of the product [5]. This may explain the pronounced increase in b values observed in chicken samples, especially because lipid oxidation products can participate in secondary reactions contributing to colour changes. In pork, the increase in yellowness may also be related to the combined effects of lipid oxidation, dehydration, and non-enzymatic browning.
Significant differences were also observed between the geometric centre and the surface of the samples. In most cases, b* values were higher on the surface, which may be attributed to direct exposure to temperature, greater oxygen availability, and a more intensive course of chemical reactions in the outer layers of the product [79]. The surface values of b* therefore confirm that the external layer of dried meat is the most sensitive region for monitoring temperature-induced browning and oxidative changes. This is important from a technological perspective, because the surface colour is also the part of the product directly perceived by consumers.

3.6. Cutting Force Results

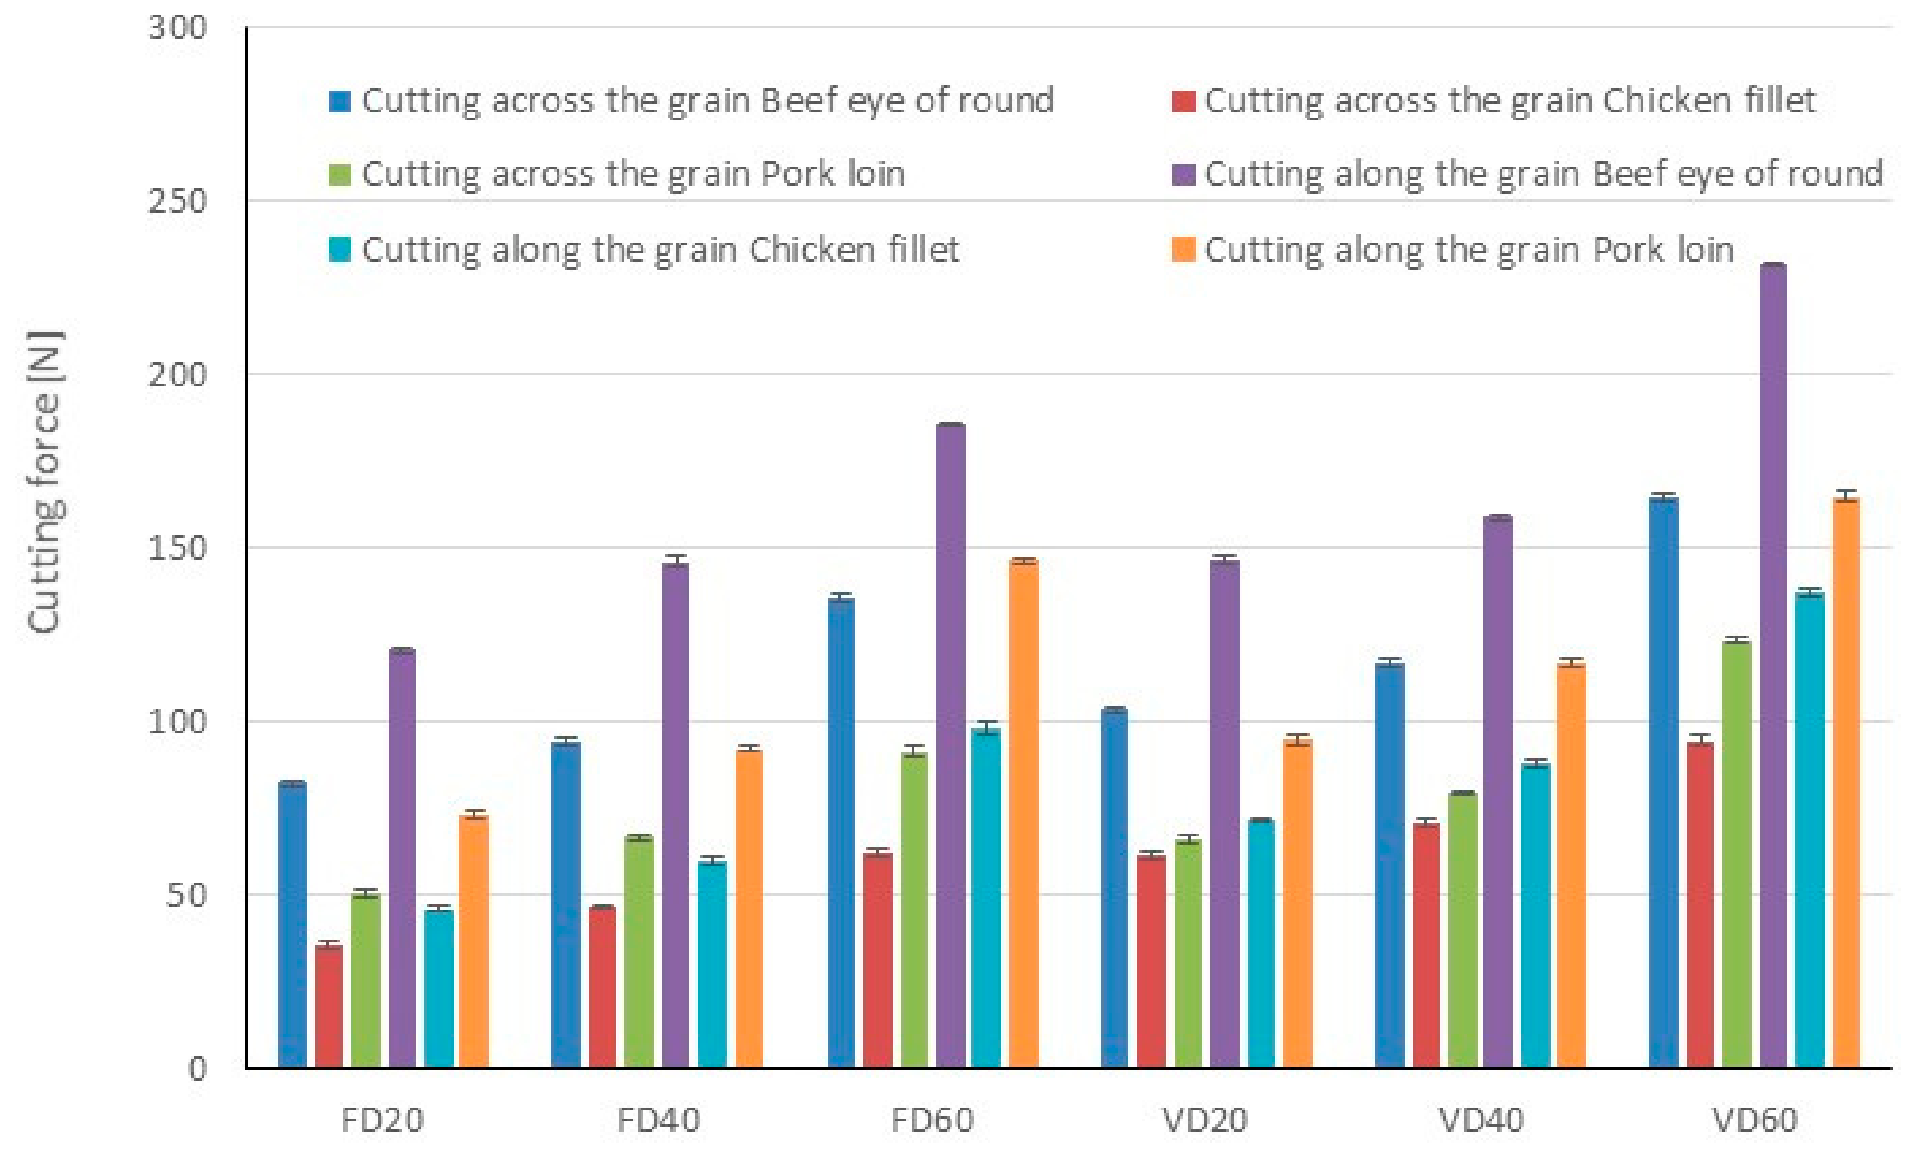
An increase in cutting force was observed with increasing drying temperature, regardless of the meat type and drying method applied (Figure 4, Table S10). For both FD and VD, increasing the temperature from 20 °C to 60 °C resulted in a significant increase in cutting force values. For example, in beef eye of round muscle cut across the fibres, the values increased from 82.3 N to 135.6 N after FD and from 103.4 N to 164.3 N after VD. This phenomenon may be associated with intensified protein denaturation, shrinkage of the muscle structure, and a greater degree of dehydration at higher temperatures, leading to increased hardness and mechanical resistance of the dried material [65,80]. In addition, higher drying temperatures may promote stronger interactions between denatured myofibrillar proteins, which can reduce the ability of the tissue matrix to deform under blade pressure [65,81]. As a result, the material becomes less elastic and more resistant to cutting. The increase in cutting force may also be related to reduced water-plasticising effects, since water normally contributes to softening the protein matrix and facilitates structural deformation during mechanical testing [81].
The type of meat also significantly affected cutting force values. The highest values were obtained for beef eye of round muscle, lower values for pork loin, and the lowest values for chicken fillet. These differences may be explained by differences in muscle histological structure, connective tissue content, collagen proportion, and fat content [82]. Beef eye of round muscle, owing to its more compact muscle structure and greater proportion of connective tissue, exhibited higher hardness after drying, whereas chicken fillet, characterised by a more delicate muscle fibre structure, showed lower mechanical resistance. These observations indicate that the initial structural characteristics of raw material strongly determine the texture of the dried product. Muscles with a higher content of connective tissue and thicker muscle fibre bundles may undergo more pronounced hardening during dehydration, because the compact network of proteins and collagen limits structural expansion and increases resistance to blade penetration. In contrast, muscles with lower connective tissue content and a finer fibre structure may retain a more fragile and easily disrupted matrix after drying.
The cutting direction had a clear effect on the obtained values. Samples cut along the muscle fibres were characterised by higher cutting force values than those cut across the fibres. For example, for beef eye of round muscle vacuum-dried at 60 °C, the values were 231.4 N for cutting along the fibres and 164.3 N for cutting across the fibres. These results may be explained by the anisotropic structure of muscle tissue and by differences in the deformation and separation of myofibrillar structures depending on the direction of blade action [44]. The highest cutting force was recorded for beef eye of round muscle samples vacuum-dried at 60 °C and cut along the fibres, with a value of 231.4 N. The lowest value was observed for chicken fillet freeze-dried at a shelf temperature of 20 °C and cut across the fibres, with a cutting force of 35.7 N. The higher resistance observed during cutting along the fibres suggests that the blade must overcome the longitudinal continuity of muscle fibre bundles, which requires greater force than transverse separation. When cutting across the fibres, the blade disrupts the fibre bundles more directly, which may facilitate fracture and reduce the force required. This confirms that the interpretation of cutting force values in dried meat should consider not only the drying conditions but also the orientation of muscle fibres during sample preparation.
Significant differences were also observed between the drying methods. VD resulted in higher cutting force values than FD at the same temperature levels, indicating that vacuum-dried products had a more compact and harder structure. This may be attributed to greater shrinkage and lower porosity of the material after VD. In contrast, FD promotes the preservation of a more porous and brittle structure, as water removal occurs mainly through ice sublimation, which limits matrix collapse and reduces resistance during cutting [82]. The lower cutting force of freeze-dried samples may therefore be associated not only with higher porosity but also with the formation of a more open capillary structure after ice crystal sublimation. Such a structure can fracture more easily under mechanical load. In vacuum-drying, the absence of an ice crystal scaffold and the occurrence of liquid-water migration may intensify tissue collapse, resulting in a denser matrix and higher cutting resistance. From a technological perspective, these differences are important because they may influence consumer perception of texture, rehydration behaviour, and the suitability of dried meat products for further processing.

4. Conclusions

For both drying methods analysed, the logarithmic model provided the best fit to the experimental data describing changes in moisture content. Increasing the process temperature from 20 °C to 60 °C, or the shelf temperature in the case of FD, reduced the drying time of all analysed meat types. FD generally resulted in shorter drying times than VD at the corresponding nominal temperatures. The longest drying time was recorded for beef eye of round muscle vacuum-dried at 20 °C, whereas the shortest was observed for pork loin freeze-dried at a shelf temperature of 60 °C. Increasing the process temperature from 20 to 60 °C was associated with a decrease in the specific electrical energy consumption expressed per kg of dried product. This tendency was observed for both FD and VD and was most likely related to the shortening of drying time at higher temperatures. However, these results should be interpreted strictly in relation to the drying stage performed in the drying unit. The energy required for the pre-freezing step was not included; therefore, the obtained values should not be considered as the total energy demand of the complete FD process.
Drying at 20–40 °C did not significantly affect the fat and protein contents of the dried products, irrespective of the drying method or raw material type, whereas drying at 60 °C significantly reduced these components. Freeze-dried products retained higher fat and protein contents and showed colour characteristics closer to those of the raw material than vacuum-dried products. Increasing the temperature, particularly to 60 °C, intensified colour changes and promoted darkening of the samples. Drying also affected lipid oxidation and pH. At 20 °C and 40 °C, changes in the peroxide value were moderate, whereas at 60 °C lipid oxidation markedly increased, especially in chicken meat and VD samples. Both drying methods reduced pH, with the greatest decrease observed at 60 °C, particularly after VD.
Cutting force increased with increasing process temperature and was higher in vacuum-dried than in freeze-dried products. Dried chicken fillet showed the lowest cutting force values, whereas dried beef eye of round muscle showed the highest values. Overall, FD at a shelf temperature of 20 °C was the most favourable treatment in terms of product quality, while FD at 60 °C was the most advantageous in terms of drying kinetics. However, since the temperature analysed during FD referred to shelf temperature rather than actual product temperature, further studies should include direct monitoring of product temperature, microstructure, storage stability, and sensory attributes. Such analyses would provide a more comprehensive assessment of the effects of the drying method and temperature on the quality, stability, and consumer acceptability of dried meat products.

Supplementary Materials

The following supporting information can be downloaded at: https://www.mdpi.com/article/10.3390/app16136820/s1, Table S1: Coefficient values in the models describing the vacuum and freeze-drying of beef eye of round muscle, Table S2: Coefficient values in the models describing the vacuum and freeze-drying chicken fillet, Table S3: Coefficient values in the models describing the vacuum and freeze-drying of pork loin, Table S4: Results of one-way ANOVA for total fat content in raw and dried meat samples [g/100 g d.m.], Table S5: Results of one-way ANOVA for total protein content in the raw material and in vacuum- and freeze-dried meat [g/100 g d.m.], Table S6: Results of one-way ANOVA for peroxide value of fresh, freeze-dried, and vacuum-dried meat [meq O2/kg fat], Table S7: Results of one-way ANOVA for pH of fresh, freeze-dried, and vacuum-dried meat [meq O2/kg fat], Table S8: Results of one-way ANOVA for colour coordinate values of the raw material and beef eye of round muscle, Table S9: Results of one-way ANOVA for colour coordinate values of the raw material and chicken fillet, Table S10: Results of one-way ANOVA for colour coordinate values of the raw material and pork loin, Table S11: Cutting force of dried meat.

Author Contributions

Conceptualization, S.R. and A.W.; methodology, S.R. and M.M.; software, S.R.; validation, S.R., M.D. and W.B.; formal analysis, S.R.; investigation, S.R., B.B., W.B., A.W., M.M., M.R. and R.P.; resources, S.R.; data curation, R.P.; writing—original draft preparation, S.R.; writing—review and editing, D.D.; visualisation, S.R.; supervision, D.D.; project administration, D.D.; funding acquisition, D.D. All authors have read and agreed to the published version of the manuscript.

Funding

This research received no external funding.

Institutional Review Board Statement

Not applicable.

Informed Consent Statement

Not applicable.

Data Availability Statement

The data presented in this study are available on request from the corresponding author.

Conflicts of Interest

The authors declare no conflicts of interest.

References

  1. Mediani, A.; Hamezah, H.S.; Jam, F.A.; Mahadi, N.F.; Chan, S.X.Y.; Rohani, E.R.; Che Lah, N.H.; Azlan, U.K.; Khairul Annuar, N.A.; Azman, N.A.F.; et al. A Comprehensive Review of Drying Meat Products and the Associated Effects and Changes. Front. Nutr. 2022, 9, 1057366. [Google Scholar] [CrossRef] [PubMed]
  2. Pushparaj, K.; Balasubramanian, B.; Meyyazhagan, A.; Park, S.; Arumugam, V.A.; Pappuswamy, M.; Bhotla, H.K.; Liu, W.C.; Mousavi Khaneghah, A. Advancements in Sustainable Techniques for Dried Meat Production: An Updated Review. Food Bioprocess Technol. 2025, 18, 2170–2194. [Google Scholar] [CrossRef]
  3. Nowacka, M.; Szymanska, I.; Rybak, K.; Karwacka, M.; Matys, A.; Wiktor, A.; Slowinski, M.; Witrowa-Rajchert, D. Effect of PEF Treatment on Chosen Properties of Raw and Hot Air- and Freeze-Dried Poultry Meat. Appl. Sci. 2024, 14, 1808. [Google Scholar] [CrossRef]
  4. Beňo, F.; Kostlán, J.; Pivoňka, J.; Pohůnek, V.; Ševčík, R. Water Activity of Czech Dry-Cured Meat Products: Influence of Sampling Point and Sample Preparation Method. Czech J. Food Sci. 2023, 41, 340–347. [Google Scholar] [CrossRef]
  5. Domínguez, R.; Pateiro, M.; Gagaoua, M.; Barba, F.J.; Zhang, W.; Lorenzo, J.M. A Comprehensive Review on Lipid Oxidation in Meat and Meat Products. Antioxidants 2019, 8, 429. [Google Scholar] [CrossRef] [PubMed]
  6. Abril, B.; Bou, R.; García-Pérez, J.V.; Benedito, J. Role of Enzymatic Reactions in Meat Processing and Use of Emerging Technologies for Process Intensification. Foods 2023, 12, 1940. [Google Scholar] [CrossRef] [PubMed]
  7. Nychas, G.-J.E.; Skandamis, P.N.; Tassou, C.C.; Koutsoumanis, K.P. Meat spoilage during distribution. Meat Sci. 2008, 78, 77–89. [Google Scholar] [CrossRef] [PubMed]
  8. Casaburi, A.; Piombino, P.; Nychas, G.-J.; Villani, F.; Ercolini, D. Bacterial populations and the volatilome associated to meat spoilage. Food Microbiol. 2015, 45, 83–102. [Google Scholar] [CrossRef] [PubMed]
  9. Ribeiro, A.; Oliveira, I.; Soares, K.; Silva, F.; Teixeira, P.; Saraiva, C. Microbial, Physicochemical Profile and Sensory Perception of Dry-Aged Beef Quality: A Preliminary Portuguese Contribution to the Validation of the Dry Aging Process. Foods 2023, 12, 4514. [Google Scholar] [CrossRef] [PubMed]
  10. Nwankwo, C.S.; Okpomor, E.O.; Dibagar, N.; Wodecki, M.; Zwierz, W.; Figiel, A. Recent Developments in the Hybridization of the Freeze-Drying Technique in Food Dehydration: A Review on Chemical and Sensory Qualities. Foods 2023, 12, 3437. [Google Scholar] [CrossRef] [PubMed]
  11. Gao, J.; Chen, L.; Zeng, X.; Sun, X.; Bai, Y.; Wang, X.; Xu, X.; Han, M. Novel Drying Pretreatment Technologies and Their Applications in the Food Industry. Food Mater. Res. 2023, 3, 14. [Google Scholar] [CrossRef]
  12. Lee, S.; Han, S.; Jo, K.; Jung, S. The Impacts of Freeze-Drying-Induced Stresses on the Quality of Meat and Aquatic Products: Mechanisms and Potential Solutions to Acquire High-Quality Products. Food Chem. 2024, 459, 140437. [Google Scholar] [CrossRef] [PubMed]
  13. Al Faruq, A.; Farahnaky, A.; Dokouhaki, M.; Khatun, H.A.; Trujillo, F.J.; Majzoobi, M. Technological Innovations in Freeze Drying: Enhancing Efficiency, Sustainability, and Food Quality. Food Eng. Rev. 2025, 17, 859–883. [Google Scholar] [CrossRef]
  14. Uwineza, A.; Zhang, X. Application of Freeze-Drying Technology in the Food Industry: A Review. Foods 2026, 15, 790. [Google Scholar] [CrossRef] [PubMed]
  15. Khatri, B.; Hamid; Shams, R.; Dash, K.K.; Shaikh, A.M.; Béla, K. Sustainable Drying Techniques for Liquid Foods and Foam Mat Drying. Discov. Food 2024, 4, 166. [Google Scholar] [CrossRef]
  16. Xie, H.; Zhao, R.; Liu, C.; Wu, Y.; Duan, X.; Hu, J.; Yang, F.; Wang, H. Dynamic Changes in Volatile Flavor Compounds, Amino Acids, Organic Acids, and Soluble Sugars in Lemon Juice Vesicles during Freeze-Drying and Hot-Air Drying. Foods 2022, 11, 2862. [Google Scholar] [CrossRef] [PubMed]
  17. Nowak, D.; Jakubczyk, E. The Freeze-Drying of Foods—The Characteristic of the Process Course and the Effect of Its Parameters on the Physical Properties of Food Materials. Foods 2020, 9, 1488. [Google Scholar] [CrossRef] [PubMed]
  18. Yeddes, W.; Rybak, K.; Rebey, I.B.; Pietrzak, D.; Adamczak, L.; Hammami, M.; Wannes, W.A.; Witrowa-Rajchert, D.; Tounsi, M.S.; Tixier, A.S.F.; et al. Lipid Oxidation and Barrier Properties of the Coated Freeze-Dried Chicken Meat with Gelatin-Chitosan Film Enriched with Rosemary (Rosmarinus officinalis L.) Extract. Foods 2025, 14, 1127. [Google Scholar] [CrossRef] [PubMed]
  19. Vidal, V.A.S.; Mukhatov, K.; Jameson, J.K.; Jensen, I.J.; Lerfall, J. Impact of Processing and Rehydration Conditions on the Rehydration Kinetics and Quality Attributes of Protein-Based Foods. Appl. Food Res. 2025, 5, 101452. [Google Scholar] [CrossRef]
  20. Ren, Y.; Sun, D.W. Monitoring of Moisture Contents and Rehydration Rates of Microwave Vacuum and Hot Air Dehydrated Beef Slices and Splits Using Hyperspectral Imaging. Food Chem. 2022, 382, 132346. [Google Scholar] [CrossRef] [PubMed]
  21. Ren, Y.; Fu, Y.; Sun, D.W. Analyzing the Effects of Nonthermal Pretreatments on the Quality of Microwave Vacuum Dehydrated Beef Using Terahertz Time-Domain Spectroscopy and near-Infrared Hyperspectral Imaging. Food Chem. 2023, 428, 136753. [Google Scholar] [CrossRef] [PubMed]
  22. Stadnik, J. Nutritional Value of Meat and Meat Products and Their Role in Human Health. Nutrients 2024, 16, 1446. [Google Scholar] [CrossRef] [PubMed]
  23. Álvarez, S.; Álvarez, C.; Hamill, R.; Mullen, A.M.; O’Neill, E. Drying Dynamics of Meat Highlighting Areas of Relevance to Dry-Aging of Beef. Compr. Rev. Food Sci. Food Saf. 2021, 20, 5370–5392. [Google Scholar] [CrossRef] [PubMed]
  24. Habte, K.; Azene, M.; Chanyalew, Y.; Girma, S.; Bashea, C.; Yehualshet, A.; Behailu, G.; Abebe, A.; Tessema, M. Nutrient Density and Microbial Safety of Open-Air-Dried Beef Meat and Its Biochemical and Organ Histopathology Effects in Albino Rats: A Promising Ingredient for Complementary Food Formulation. Int. J. Food Sci. 2023, 2023, 2202312. [Google Scholar] [CrossRef] [PubMed]
  25. Râmchandran, R.P.; Nadimi, M.; Cenkowski, S.; Paliwal, J. Advancement and Innovations in Drying of Biopharmaceuticals, Nutraceuticals, and Functional Foods. Food Eng. Rev. 2024, 16, 540–566. [Google Scholar] [CrossRef] [PubMed]
  26. Aung, S.H.; Nam, K.C. Impact of Humectants on Physicochemical and Functional Properties of Jerky: A Meta-Analysis. Food Sci. Anim. Resour. 2024, 44, 464–482. [Google Scholar] [CrossRef] [PubMed]
  27. Mahmood, N.; Muhoza, B.; Huang, Y.; Munir, Z.; Zhang, Y.; Zhang, S.; Li, Y. Effects of Emerging Food Pretreatment and Drying Techniques on Protein Structures, Functional and Nutritional Properties: An Updated Review. Crit. Rev. Food Sci. Nutr. 2024, 64, 9365–9381. [Google Scholar] [CrossRef] [PubMed]
  28. Santé-Lhoutellier, V. Levers to Reconcile Cured Meat Products with Health Concerns and Culinary Heritage. Ital. J. Anim. Sci. 2023, 22, 898–910. [Google Scholar] [CrossRef]
  29. Dissanayake, K.; Rifky, M.; Nurmukhamedov, K.; Makhmayorov, J.; Abdullayev, B.; Farmanov, J.; Samadiy, M. A Comparative Analysis of Traditional Meat Processing Methods. E3S Web Conf. 2024, 494, 04023. [Google Scholar] [CrossRef]
  30. Calancea, B.A.; Daina, S.; Macri, A. The Science of Snacks: A Review of Dog Treats. Front. Anim. Sci. 2024, 5, 1440644. [Google Scholar] [CrossRef]
  31. Le Guillas, G.; Vanacker, P.; Salles, C.; Labouré, H. Insights to Study, Understand and Manage Extruded Dry Pet Food Palatability. Animals 2024, 14, 1095. [Google Scholar] [CrossRef] [PubMed]
  32. Park, D.; Sethukali, A.; Choi, M.; Kim, J.-K.; Lee, H.J.; Jo, C. Effects of Irradiation on Microbiological Safety and Physicochemical Properties of Dry Pet Food. J. Anim. Sci. Technol. 2026, 68, 306–323. [Google Scholar] [CrossRef] [PubMed]
  33. Krzykowski, A.; Dziki, D.; Rudy, S.; Gawlik-Dziki, U.; Janiszewska-Turak, E.; Biernacka, B. Wild Strawberry Fragaria vesca L.: Kinetics of Fruit Drying and Quality Characteristics of the Dried Fruits. Processes 2020, 8, 1265. [Google Scholar] [CrossRef]
  34. Rudy, S.; Dziki, D.; Biernacka, B.; Polak, R.; Krzykowski, A.; Domin, M.; Rudzki, G.; Kachel-Górecka, M. Drying Kinetics and Physicochemical Characteristics of Dehydrated Jerusalem Artichoke (Helianthus tuberosus L.). Processes 2025, 13, 2553. [Google Scholar] [CrossRef]
  35. Sarimeseli, A. Microwave Drying Characteristics of Coriander (Coriandrum sativum L.) Leaves. Energy Convers. Manag. 2011, 52, 1449–1453. [Google Scholar] [CrossRef]
  36. Demir, V.; Gunhan, T.; Yagcioglu, A.K.; Degirmencioglu, A. Mathematical Modelling and the Determination of Some Quality Parameters of Air-Dried Bay Leaves. Biosyst. Eng. 2004, 88, 325–335. [Google Scholar] [CrossRef]
  37. Henderson, S.M.; Pabis, S. Grain Drying Theory II: Temperature Effects on Drying Coefficients. J. Agric. Eng. Res. 1961, 6, 169–174. [Google Scholar]
  38. Dandamrongrak, R.; Young, G.; Mason, R. Evaluation of Various Pre-Treatments for the Dehydration of Banana and Selection of Suitable Drying Models. J. Food Eng. 2002, 55, 139–146. [Google Scholar] [CrossRef]
  39. Chen, C.; Wu, P.-C. Thin-Layer Drying Model for Rough Rice with High Moisture Content. J. Agric. Eng. Res. 2001, 80, 45–52. [Google Scholar] [CrossRef]
  40. Soysal, Y.; Öztekin, S.; Eren, Ö. Microwave Drying of Parsley: Modelling, Kinetics, and Energy Aspects. Biosyst. Eng. 2006, 93, 403–413. [Google Scholar] [CrossRef]
  41. PN-ISO 1442:2000; Meat and Meat Products—Determination of Moisture Content (Reference Method). Polish Committee for Standardization: Warsaw, Poland, 2000.
  42. PN-75/A-04018:2002; Agricultural Food Products—Determination of Nitrogen Content by the Kjeldahl Method and Conversion into Protein. Polish Committee for Standardization: Warsaw, Poland, 2002.
  43. PN-ISO 1444:2000; Meat and Meat Products—Determination of Free Fat Content. Polish Committee for Standardization: Warsaw, Poland, 2000.
  44. ISO/CIE 11664-4:2019; Colorimetry—Part 4: CIE 1976 L*a*b* Colour Space. International Organization for Standardization: Geneva, Switzerland, 2019.
  45. Dib, A.; Wójtowicz, A.; Benatallah, L.; Zidoune, M.N.; Mitrus, M.; Sujak, A. Optimization of rice-field bean gluten-free pasta improved by the addition of hydrothermally treated rice flour. Ital. J. Food Sci. 2018, 30, 226–248. [Google Scholar] [CrossRef]
  46. Krajewska, A.; Dziki, D.; Yilmaz, M.A.; Özdemir, F.A. Broccoli pomace: Effect of drying methods and temperature on the grinding process and physicochemical properties. Int. Agrophys. 2024, 38, 423–436. [Google Scholar] [CrossRef] [PubMed]
  47. Huff-Lonergan, E.; Lonergan, S.M. Mechanisms of water-holding capacity of meat: The role of postmortem biochemical and structural changes. Meat Sci. 2005, 71, 194–204. [Google Scholar] [CrossRef] [PubMed]
  48. Aksoy, A.; Karasu, S.; Akcicek, A.; Kayacan, S. Effects of different drying methods on drying kinetics, microstructure, color, and the rehydration ratio of minced meat. Foods 2019, 8, 216. [Google Scholar] [CrossRef] [PubMed]
  49. Tchessalov, S.; Maglio, V.; Kazarin, P.; Alexeenko, A.; Bhatnagar, B.; Sahni, E.; Shalaev, E. Practical advice on scientific design of freeze-drying process: 2023 update. Pharm. Res. 2023, 40, 2433–2455. [Google Scholar] [CrossRef] [PubMed]
  50. Carrillo Luis, V.; Beristain Rios, D.; Hernández-Flores, O.A.; Romero-Salazar, C.; Sandoval-Torres, S. Mathematical Modeling of Goat Meat Drying Kinetics with Thermal Oscillations. Foods 2024, 13, 3836. [Google Scholar] [CrossRef] [PubMed]
  51. Yu, H.; Chen, L.; Jin, Z. Comparative Analysis of Quality Attributes in Restructured Steam-Cooked Chicken, Pork, and Beef System as Affected by Freeze-Drying Duration. Foods 2026, 15, 989. [Google Scholar] [CrossRef] [PubMed]
  52. Oztuna Taner, O. Advancing the Thermodynamic Approach with the Predictive Model for the Freeze-Drying of Meat. Front. Sustain. Food Syst. 2025, 9, 1549287. [Google Scholar] [CrossRef]
  53. Astráin-Redín, L.; Raso, J.; Cebrián, G.; Álvarez, I. Potential of pulsed electric fields for the preparation of Spanish dry-cured sausages. Sci. Rep. 2019, 9, 16042. [Google Scholar] [CrossRef] [PubMed]
  54. Vojtíšek, S.; Beňo, F.; Hruška, F.; Taborovec, S.; Pohůnek, V.; Ševčík, R. Effects of pulsed electric field and ultrasound treatment on the drying kinetics and quality of beef jerky. Innov. Food Sci. Emerg. Technol. 2025, 106, 104259. [Google Scholar] [CrossRef]
  55. Siddiqui, S.A.; Ucak, İ.; Jain, S.; Elsheikh, W.; Ali Redha, A.; Kurt, A.; Toker, O.S. Impact of Drying on Techno-Functional and Nutritional Properties of Food Proteins and Carbohydrates—A Comprehensive Review. Dry. Technol. 2024, 42, 592–611. [Google Scholar] [CrossRef]
  56. Çakır, M.A.; Kabil, E.; Yalınkılıç, B.; Başlar, M. Investigation of Drying Kinetics of Turkey Breast Meat Using Vacuum and Ultrasound-Assisted Vacuum Drying. Int. J. Agric. Environ. Food Sci. 2025, 9, 725–732. [Google Scholar] [CrossRef] [PubMed]
  57. de Alcântara, C.M.; Moreira, I.d.S.; Cavalcanti, M.T.; Lima, R.P.; Moura, H.V.; da Silva Neves, R.; Cassimiro, C.A.L.; Martins, J.J.A.; da Costa Batista, F.R.; Pereira, E.M. Mathematical Modeling of Drying Kinetics and Technological and Chemical Properties of Pereskia Sp. Leaf Powders. Processes 2024, 12, 2077. [Google Scholar] [CrossRef]
  58. Saniso, E.; Sueni, L.; Hayibaka, M.; Chaiwarakorn, S.; Dasaesamoh, A.; Chaidana, H. Garcinia Drying Using Mixed-Mode Solar Dryer Technique: Drying Kinetics, Mathematical Modeling and Quality Characteristics. Case Stud. Therm. Eng. 2025, 66, 105711. [Google Scholar] [CrossRef]
  59. Lopes, D.d.C.; Steidle Neto, A.J.; Santiago, J.K. Comparison of Equilibrium and Logarithmic Models for Grain Drying. Biosyst. Eng. 2014, 118, 105–114. [Google Scholar] [CrossRef]
  60. Mewa, E.A.; Okoth, M.W.; Kunyanga, C.N.; Rugiri, M.N. Drying Modelling, Moisture Diffusivity and Sensory Quality of Thin Layer Dried Beef. Curr. Res. Nutr. Food Sci. 2018, 6, 552–565. [Google Scholar] [CrossRef]
  61. Wazir, H.; Chay, S.Y.; Zarei, M.; Hussin, F.S.; Mustapha, N.A.; Wan Ibadullah, W.Z.; Saari, N. Effects of Storage Time and Temperature on Lipid Oxidation and Protein Co-Oxidation of Low-Moisture Shredded Meat Products. Antioxidants 2019, 8, 486. [Google Scholar] [CrossRef] [PubMed]
  62. King, V.A.E.; Chen, J.F. Oxidation of Controlled Low-Temperature Vacuum Dehydrated and Freeze-Dried Beef and Pork. Meat Sci. 1998, 48, 11–19. [Google Scholar] [CrossRef] [PubMed]
  63. Tornberg, E. Effects of Heat on Meat Proteins—Implications on Structure and Quality of Meat Products. Meat Sci. 2005, 70, 493–508. [Google Scholar] [CrossRef] [PubMed]
  64. Rahman, M.S.; Perera, C.O. Drying and Food Preservation. In Handbook of Food Preservation, 2nd ed.; Rahman, M.S., Ed.; CRC Press: Boca Raton, FL, USA, 2007; pp. 403–432. [Google Scholar] [CrossRef]
  65. Sun, X.D.; Holley, R.A. Factors Influencing Gel Formation by Myofibrillar Proteins in Muscle Foods. Compr. Rev. Food Sci. Food Saf. 2011, 10, 33–51. [Google Scholar] [CrossRef]
  66. Estévez, M. Protein Carbonyls in Meat Systems: A Review. Meat Sci. 2011, 89, 259–279. [Google Scholar] [CrossRef] [PubMed]
  67. Falowo, A.B.; Fayemi, P.O.; Muchenje, V. Natural Antioxidants against Lipid-Protein Oxidative Deterioration in Meat and Meat Products: A Review. Food Res. Int. 2014, 64, 171–181. [Google Scholar] [CrossRef] [PubMed]
  68. Sun, Q.; Senecal, A.; Chinachoti, P.; Faustman, C. Effect of Water Activity on Lipid Oxidation and Protein Solubility in Freeze-Dried Beef During Storage. J. Food Sci. 2002, 67, 2512–2516. [Google Scholar] [CrossRef]
  69. Lorenzo, J.M.; Pateiro, M.; Franco, D. Influence of Muscle Type on Physicochemical and Sensory Properties of Foal Meat. Meat Sci. 2013, 94, 77–83. [Google Scholar] [CrossRef] [PubMed]
  70. Hughes, J.M.; Oiseth, S.K.; Purslow, P.P.; Warner, R.D. A Structural Approach to Understanding the Interactions between Colour, Water-Holding Capacity and Tenderness. Meat Sci. 2014, 98, 520–532. [Google Scholar] [CrossRef] [PubMed]
  71. Zhang, M.; Chen, H.; Mujumdar, A.S.; Tang, J.; Miao, S.; Wang, Y. Recent developments in high-quality drying of vegetables, fruits, and aquatic products. Crit. Rev. Food Sci. Nutr. 2017, 57, 1239–1255. [Google Scholar] [PubMed]
  72. Pujol, A.; Ospina-E, J.C.; Alvarez, H.; Muñoz, D.A. Myoglobin Content and Oxidative Status to Understand Meat Products’ Color: Phenomenological Based Model. J. Food Eng. 2023, 348, 111439. [Google Scholar] [CrossRef]
  73. Bueno, L.O.; Massingue, A.A.; Ramos, A.d.L.S.; Ferreira, D.D.; Ramos, E.M. Meat Color by Numbers: Evaluation of the Myoglobin Redox Forms by Different Methods and Its Relationship to CIE Color Indices. J. Food Compos. Anal. 2024, 133, 106365. [Google Scholar] [CrossRef]
  74. Han, J.; Wang, Y.; Wang, Y.; Hao, S.; Zhang, K.; Tian, J.; Jin, Y. Effect of Changes in the Structure of Myoglobin on the Color of Meat Products. Food Mater. Res. 2024, 4, e011. [Google Scholar] [CrossRef]
  75. Suman, S.P.; Joseph, P. Myoglobin Chemistry and Meat Color. Annu. Rev. Food Sci. Technol. 2013, 4, 79–99. [Google Scholar] [CrossRef] [PubMed]
  76. Mancini, R.A.; Hunt, M.C. Current Research in Meat Color. Meat Sci. 2005, 71, 100–121. [Google Scholar] [CrossRef] [PubMed]
  77. Ribeiro, F.A.; Lau, S.K.; Pflanzer, S.B.; Subbiah, J.; Calkins, C.R. Color and Lipid Stability of Dry Aged Beef during Retail Display. Meat Sci. 2021, 171, 108274. [Google Scholar] [CrossRef] [PubMed]
  78. Lepetit, J. Collagen Contribution to Meat Toughness: Theoretical Aspects. Meat Sci. 2008, 80, 960–967. [Google Scholar] [CrossRef] [PubMed]
  79. Ishiwatari, N.; Fukuoka, M.; Sakai, N. Effect of protein denaturation degree on texture and water state of cooked meat. J. Food Eng. 2013, 117, 361–369. [Google Scholar] [CrossRef]
  80. Sørensen, S.E. Connective Tissue in Meat and Meat Products. Livest. Prod. Sci. 1991, 27, 263–264. [Google Scholar] [CrossRef]
  81. Zhang, M.; Tang, J.; Mujumdar, A.S.; Wang, S. Trends in Microwave-Related Drying of Fruits and Vegetables. Trends Food Sci. Technol. 2006, 17, 524–534. [Google Scholar] [CrossRef]
  82. Ratti, C. Hot Air and Freeze-Drying of High-Value Foods: A Review. J. Food Eng. 2001, 49, 311–319. [Google Scholar] [CrossRef]
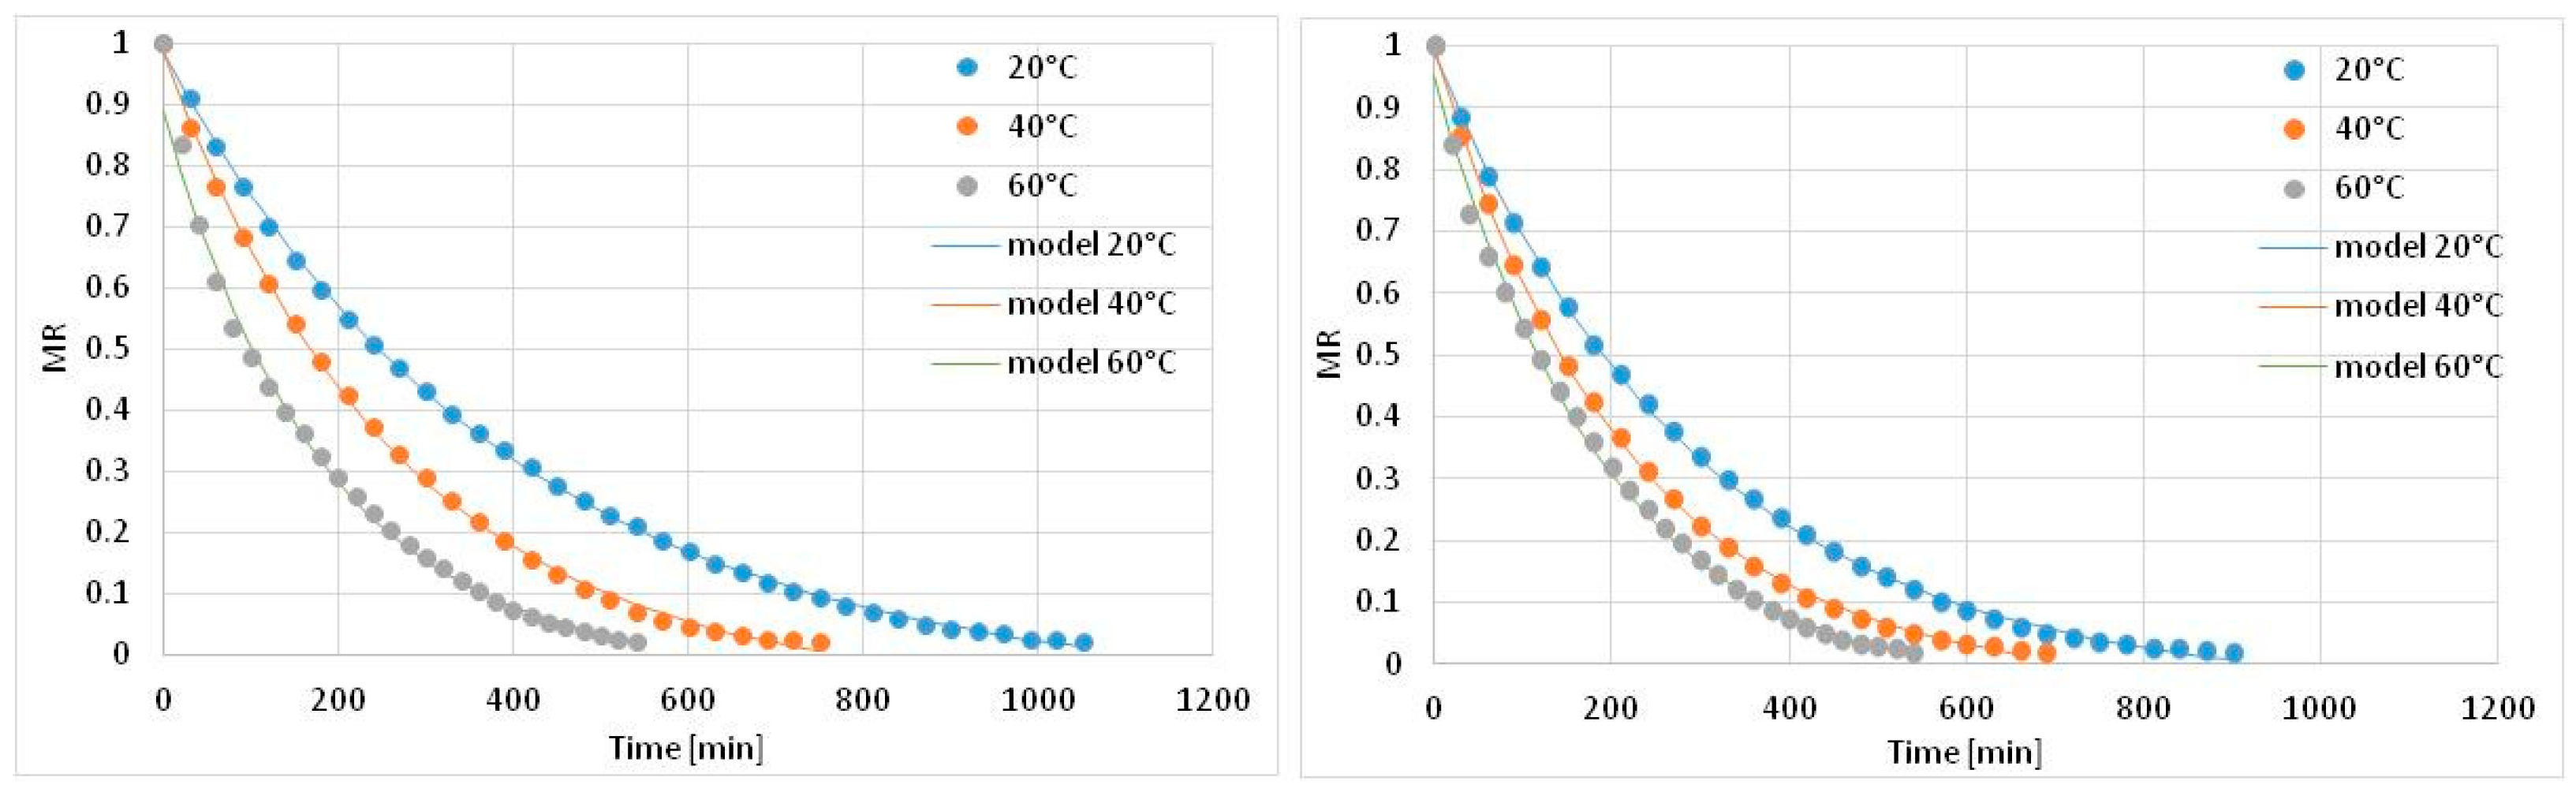
Figure 1. Drying curves of beef eye of round muscle during vacuum-drying (left panel) and freeze-drying (right panel), MR—moisture ratio.
Applsci 16 06820 g001
Figure 2. Drying curves of chicken fillet during vacuum-drying (left panel) and freeze-drying (right panel), MR—moisture ratio.
Applsci 16 06820 g002
Figure 3. Drying curves of pork loin during vacuum-drying (left panel) and freeze-drying (right panel), MR—moisture ratio.
Applsci 16 06820 g003
Figure 4. Cutting force of dried meat. FD20, FD40, and FD60—freeze-drying at 20, 40, and 60 °C, respectively; VD20, VD40, and VD60—vacuum-drying at 20, 40, and 60 °C, respectively (n = 5).
Applsci 16 06820 g004
Table 1. Models used to describe the course of drying.
NumberModel NameEquation
1Newton [35] M R = e x p ( k · τ )
2Page [36] M R = e x p ( k · τ n )
3Henderson and Pabis [37] M R = a e x p ( k · τ )
4Logarithmic [38] M R = a exp k · τ + b
5Wang and Singh [39] M R = 1 + a τ + b τ 2
6Logistic [40] M R = exp k · τ n + b · τ
k—drying coefficient; a, b—coefficients of the equations; n—exponent; τ—time [min].
Table 2. Statistical analysis of models describing kinetics of vacuum- and freeze-drying of beef eye of round muscle.
ModelVacuum-Drying
20 °C40 °C60 °C
RMSEχ2R2RMSEχ2R2RMSEχ2R2
Newton0.0170480.00020.99620.01870.00020.99560.01380.00010.9976
Page0.01410.00010.99740.01520.00010.99710.01340.00010.9977
Henderson and Pabis0.01680.00020.99630.01850.00020.99570.01340.00010.9977
Logarithmic0.00540.00010.99960.00750.00010.99930.01080.00010.9985
Wang and Singh0.03130.00060.98730.03140.00040.98770.04520.00080.974
Logistic0.081210.00420.91420.01190.00010.99820.07910.00260.9203
ModelFreeze-drying
20 °C40 °C60 °C
RMSEχ2R2RMSEχ2R2RMSEχ2R2
Newton0.01460.00010.99730.01290.00010.99790.02130.00020.9938
Page0.01210.00010.99820.00940.00010.99890.02090.00020.994
Henderson and Pabis0.01480.00010.99740.01250.00010.99810.01920.00020.9949
Logarithmic0.06000.00010.99890.00560.00010.99960.01420.00010.9972
Wang and Singh0.03650.00010.98400.03580.00050.9840.04590.00100.971
Logistic0.00970.00010.99960.00750.00010.99930.01810.00020.9955
RMSE—root mean square error; χ2—reduced chi-square; R2—coefficient of determination.
Table 3. Statistical analysis of models describing kinetics of vacuum- and freeze-drying of pork loin.
ModelVacuum-Drying
20 °C40 °C60 °C
RMSEχ2R2RMSEχ2R2RMSEχ2R2
Newton0.01860.00020.99570.0150.00010.9960.01380.00010.9976
Page0.01170.00010.99830.0070.00010.99910.01340.00010.9977
Henderson and Pabis0.01750.00020.99620.01230.00010.99730.01380.00010.9976
Logarithmic0.00870.00010.99910.01110.00010.99780.01080.00010.9985
Wang and Singh0.03510.00060.98460.0710.00230.91090.04520.00080.974
Logistic0.01090.00010.99850.01230.00010.99730.07910.00260.9203
ModelFreeze-drying
20 °C40 °C60 °C
RMSEχ2R2RMSEχ2R2RMSEχ2R2
Newton0.02260.00030.99380.01070.00010.99850.01470.00010.9972
Page0.00760.00010.99930.01050.00010.99860.01290.00010.9978
Henderson and Pabis0.01890.00020.99560.01010.00010.99870.01280.00010.9979
Logarithmic0.00600.00010.99960.00640.00010.99920.01240.00010.998
Wang and Singh0.02660.00040.99130.05520.00120.96000.05770.00110.9562
Logistic0.01070.00010.99860.00870.00010.9990.07230.00170.9312
RMSE—root mean square error; χ2—reduced chi-square; R2—coefficient of determination.
Table 4. Statistical analysis of models describing kinetics of vacuum- and freeze-drying of chicken fillet.
ModelVacuum-Drying
20 °C40 °C60 °C
RMSEχ2R2RMSEχ2R2RMSEχ2R2
Newton0.01900.00020.99550.0150.00010.99720.01390.00010.9972
Page0.01260.00010.9980.01090.00010.99850.01380.00010.9972
Henderson and Pabis0.01810.00020.99590.01430.00010.99740.01370.00010.9973
Logarithmic0.00530.00010.99970.00640.00010.99950.00810.00010.999
Wang and Singh0.02820.00040.990.0350.00060.98460.03890.00070.9778
Logistic0.00930.00010.99890.00940.00010.99890.00930.00010.9982
ModelFreeze-drying
20 °C40 °C60 °C
RMSEχ2R2RMSEχ2R2RMSEχ2R2
Newton0.01620.00010.99660.01510.00010.99730.01860.00010.9953
Page0.01560.00010.99680.01270.00010.99800.01700.00010.9961
Henderson and Pabis0.01590.00010.99670.0150.00010.99730.01640.00010.9963
Logarithmic0.01020.00010.99860.00810.00010.99920.01190.00010.9972
Wang and Singh0.04130.00080.97750.03970.00050.98100.05160.00110.9639
Logistic0.01190.00010.99810.01090.00010.99860.01440.00010.9972
RMSE—root mean square error; χ2—reduced chi-square; R2—coefficient of determination.
Table 5. Specific energy consumption of freeze-drying and vacuum-drying of meat [kWh/kg dried product].
SampleBeef Eye of RoundChicken FilletPork Loin
FD2026.0 ± 0.47 fg26.6 ± 0.65 g24.7 ± 0.22 f
FD4020.5 ± 0.51 d20.0 ± 0.52 d19.8 ± 0.50 d
FD6016.5 ± 0.75 c15.3 ± 0.30 bc12.4 ± 0.98 a
VD2027.4 ± 0.34 g26.3 ± 0.70 g23.0 ± 1.05 e
VD4020.3 ± 0.70 d22.2 ± 0.83 e15.8 ± 0.35 c
VD6015.2 ± 1.28 bc13.8 ± 0.83 ab13.3 ± 0.19 a
FactorThree-factor analysis of variance
p-value
Meat type (MT)<0.001<0.001<0.001
Drying method (DM)<0.001<0.001<0.001
Drying temperature (DT)<0.001<0.001<0.001
MT × DM<0.001<0.001<0.001
MT × DT<0.001<0.001<0.001
DM × DT0.3160.3160.316
MT × DM × DT<0.001<0.001<0.001
Different letters indicate significant differences between groups (p < 0.05, n = 3). FD20—freeze-drying 20 °C, FD40—freeze-drying 40 °C, FD60—freeze-drying 60 °C, VD20—vacuum-drying 20 °C, VD40—vacuum-drying 40 °C, VD60—vacuum-drying 60 °C.
Table 6. Total fat content in the raw material and in vacuum- and freeze-dried meat [g/100 g d.m.].
SampleBeef Eye of RoundChicken FilletPork Loin
RM13.01 ± 0.5312.54 ± 0.3713.35 ± 0.35
FD2012.44 ± 0.69 ef12.40 ± 0.34 ef13.41 ± 0.34 g
FD4012.04 ± 0.38 de12.86 ± 0.46 efg12.62 ± 0.34 efg
FD6010.41 ± 0.46 bc10.11 ± 0.26 b12.26 ± 0.15 ef
VD2012.40 ± 0.53 ef12.21 ± 0.55 ef12.99 ± 0.42 efg
VD4012.34 ± 0.41 ef12.28 ± 0.31 ef13.03 ± 0.52 fg
VD6010.12 ± 0.46 b8.85 ± 0.15 a11.16 ± 0.35 cd
FactorThree-factor analysis of variance
p-value
Meat type (MT) <0.001
Drying method (DM)0.408
Drying temperature (DT)<0.001
MT × DM0.047
MT × DT<0.001
DM × DT0.470
MT × DM × DT<0.001
Different superscript letters within the dried samples indicate statistically significant differences at p < 0.05 (n = 3); RM—raw material; FD20, FD40, and FD60—freeze-drying at 20, 40, and 60 °C, respectively; VD20, VD40, and VD60—vacuum-drying at 20, 40, and 60 °C, respectively. Raw material samples (RM) were not included in the three-way ANOVA because they were not subjected to drying; therefore, drying method and drying temperature were not applicable to these samples. Table S4 presents the results of an additional one-way ANOVA comparing raw and dried samples separately within each meat type.
Table 7. Total protein content in the raw material and in vacuum- and freeze-dried meat [g/100 g d.m.].
SampleBeef Eye of RoundChicken FilletPork Loin
RM80.44 ± 1.2782.41 ± 0.4980.29 ± 0.85
FD2080.38 ± 0.91 cde82.60 ± 1.10 e79.91 ± 1.12 cd
FD4079.92 ± 0.75 cd82.40 ± 1.05 e79.75 ± 1.07 cd
FD6077.05 ± 1.02 ab79.86 ± 1.52 cd76.35 ± 0.52 a
VD2081.11 ± 0.65 cde82.63 ± 0.98 e79.72 ± 1.07 cd
VD4080.98 ± 1.11 cde81.71 ± 0.97 de79.78 ± 0.95 cd
VD6076.62 ± 0.81 a79.16 ± 0.86 bc76.16 ± 1.10 a
FactorThree-factor analysis of variance
p-value
Meat type (MT) <0.001
Drying method (DM)0.853
Drying temperature (DT)<0.001
MT × DM0.215
MT × DT0.434
DM × DT0.470
MT × DM × DT0.697
Different superscript letters within the dried samples indicate statistically significant differences at p < 0.05 (n = 3); RM—raw material; FD20, FD40, and FD60—freeze-drying at 20, 40, and 60 °C, respectively; VD20, VD40, and VD60—vacuum-drying at 20, 40, and 60 °C, respectively. Raw material samples (RM) were not included in the three-way ANOVA because they were not subjected to drying; therefore, drying method and drying temperature were not applicable to these samples. Table S5 presents the results of an additional one-way ANOVA comparing raw and dried samples separately within each meat type.
Table 8. Peroxide value of fresh, freeze-dried, and vacuum-dried meat [meq O2/kg fat].
SampleBeef Eye of RoundChicken FilletPork Loin
RM0.62 ± 0.0461.08 ± 0.0450.59 ± 0.061
FD201.21 ± 0.015 a2.33 ± 0.073 e1.61 ± 0.043 bc
FD401.35 ± 0.044 a2.48 ± 0.041 e1.59 ± 0.025 b
FD606.46 ± 0.165 f11.29 ± 0.137 j8.43 ± 0.074 h
VD201.31 ± 0.030 a2.38 ± 0.038 e1.86 ± 0.046 d
VD401.34 ± 0.023 a2.51 ± 0.021 e1.80 ± 0.019 cd
VD607.91 ± 0.156 g12.37 ± 0.094 k9.43 ± 0.158 i
FactorThree-factor analysis of variance
p-value
Meat type (MT) <0.001
Drying method (DM)<0.001
Drying temperature (DT)<0.001
MT × DM<0.001
MT × DT<0.001
DM × DT<0.001
MT × DM × DT<0.001
Different superscript letters within the dried samples indicate statistically significant differences at p < 0.05 (n = 3); RM—raw material; FD20, FD40, and FD60—freeze-drying at 20, 40, and 60 °C, respectively; VD20, VD40, and VD60—vacuum-drying at 20, 40, and 60 °C, respectively. Raw material samples (RM) were not included in the three-way ANOVA because they were not subjected to drying; therefore, drying method and drying temperature were not applicable to these samples. Table S6 presents the results of an additional one-way ANOVA comparing raw and dried samples separately within each meat type.
Table 9. pH values of fresh, freeze-dried, and vacuum-dried meat.
SampleBeef Eye of RoundChicken FilletPork Loin
RM5.60 ± 0.0545.81 ± 0.0405.75 ± 0.030
FD205.56 ± 0.049 cde5.76 ± 0.034 g5.69 ± 0.041 fg
FD405.54 ± 0.049 bcd5.77 ± 0.069 g5.68 ± 0.027 fg
FD605.46 ± 0.044 ab5.62 ± 0.044 def5.56 ± 0.043 cde
VD205.53 ± 0.038 bcd5.74 ± 0.043 g5.70 ± 0.029 fg
VD405.51 ± 0.040 bc5.76 ± 0.040 g5.64 ± 0.033 ef
VD605.40 ± 0.040 a5.58 ± 0.038 cde5.49 ± 0.038 abc
FactorThree-factor analysis of variance
p-value
Meat type (MT) <0.001
Drying method (DM)<0.001
Drying temperature (DT)<0.001
MT × DM0.745
MT × DT0.043
DM × DT0.088
MT × DM × DT0.748
Different superscript letters within the dried samples indicate statistically significant differences at p < 0.05 (n = 3); RM—raw material; FD20, FD40, and FD60—freeze-drying at 20, 40, and 60 °C, respectively; VD20, VD40, and VD60—vacuum-drying at 20, 40, and 60 °C, respectively. Raw material samples (RM) were not included in the three-way ANOVA because they were not subjected to drying; therefore, drying method and drying temperature were not applicable to these samples. Table S7 presents the results of an additional one-way ANOVA comparing raw and dried samples separately within each meat type.
Table 10. L* colour coordinate value of raw material and dried meat.
Measurement
Location
SampleBeef Eye of RoundChicken FilletPork Loin
RM41.32 ± 0.55176.06 ± 0.74053.53 ± 0.441
Geometric centreFD2067.29 ± 0.664 d84.47 ± 0.887 j83.28 ± 0.839 j
FD4066.35 ± 0.351 d83.43 ± 0.679 j81.38 ± 0.617 i
FD6064.29 ± 0.797 c81.44 ± 0.467 i73.06 ± 0.587 f
VD2059.89 ± 1.107 b80.88 ± 0.392 i76.65 ± 0.836 gh
VD4059.42 ± 0.600 b78.05 ± 0.837 h75.82 ± 0.903 g
VD6055.50 ± 0.358 a70.80 ± 0.498 e70.34 ± 0.275 e
SurfaceFD2065.55 ± 0.770 g85.44 ± 0.958 m79.24 ± 0.301 k
FD4056.85 ± 0.318 d80.67 ± 0.486 L71.17 ± 0.647 i
FD6052.07 ± 0.521 c75.60 ± 0.611 j70.42 ± 0.769 i
VD2061.23 ± 0.471 e81.57 ± 0.102 L78.32 ± 0.368 k
VD4044.72 ± 0.659 b67.12 ± 0.367 h70.63 ± 0.693 i
VD6041.98 ± 0.837 a63.08 ± 0.677 f61.11 ± 0.528 e
FactorThree-factor analysis of variance
p-value
Meat type (MT) <0.001
Drying method (DM)<0.001
Drying temperature (DT)<0.001
MT × DM<0.001
MT × DT<0.001
DM × DT<0.001
MT × DM × DT<0.001
Different superscript letters within the dried samples indicate statistically significant differences at p < 0.05 (n = 5); RM—raw material; FD20, FD40, and FD60—freeze-drying at 20, 40, and 60 °C, respectively; VD20, VD40, and VD60—vacuum-drying at 20, 40, and 60 °C, respectively. Raw material samples (RM) were not included in the three-way ANOVA because they were not subjected to drying; therefore, drying method and drying temperature were not applicable to these samples. Tables S7 and S8 present the results of an additional one-way ANOVA comparing raw and dried samples separately within each meat type.
Table 11. a* colour coordinate of raw material and dried meat.
Measurement
Location
SampleBeef Eye of RoundChicken FilletPork Loin
RM25.77 ± 0.20615.71 ± 0.28711.14 ± 0.116
Geometric centreFD2011.00 ± 0.134 j7.91 ± 0.347 ghi7.25 ± 0.481 fg
FD408.65 ± 0.321 i6.57 ± 0.298 def7.17 ± 0.489 efg
FD608.55 ± 0.281 i5.72 ± 0.405 abc5.52 ± 0.255 ab
VD2010.91 ± 0.156 j6.45 ± 0.325 cde5.84 ± 0.315 abcd
VD408.34 ± 0.367 hi6.24 ± 0.380 bcd5.66 ± 0.325 ab
VD607.60 ± 0.442 gh5.83 ± 0.364 abcd5.32 ± 0.132 a
SurfaceFD2012.57 ± 0.210 g9.67 ± 0.227 d11.51 ± 0.183 f
FD4010.37 ± 0.232 e8.30 ± 0.358 c8.36 ± 0.296 c
FD609.98 ± 0.323 de6.96 ± 0.464 b6.59 ± 0.330 b
VD2011.34 ± 0.248 f6.96 ± 0.428 b7.85 ± 0.166 c
VD4010.16 ± 0.296 de6.64 ± 0.074 b5.88 ± 0.096 a
VD608.08 ± 0.219 c6.62 ± 0.399 b5.60 ± 0.439 a
FactorThree-factor analysis of variance
p-value
Meat type (MT) <0.001
Drying method (DM)<0.001
Drying temperature (DT)<0.001
MT × DM<0.001
MT × DT<0.001
DM × DT<0.001
MT × DM × DT<0.001
Different superscript letters within the dried samples indicate statistically significant differences at p < 0.05 (n = 5); RM—raw material; FD20, FD40, and FD60—freeze-drying at 20, 40, and 60 °C, respectively; VD20, VD40, and VD60—vacuum-drying at 20, 40, and 60 °C, respectively. Raw material samples (RM) were not included in the three-way ANOVA because they were not subjected to drying; therefore, drying method and drying temperature were not applicable to these samples. Tables S7 and S8 present the results of an additional one-way ANOVA comparing raw and dried samples separately within each meat type.
Table 12. b* colour coordinate of raw material and dried meat.
Measurement
Location
SampleBeef Eye of RoundChicken FilletPork Loin
RM12.75 ± 0.2487.43 ± 0.2556.90 ± 0.128
Geometric centreFD2015.28 ± 0.283 a15.95 ± 0.116 ab16.15 ± 0.408 bc
FD4015.31 ± 0.158 a16.24 ± 0.405 bcd16.86 ± 0.168 cde
FD6016.17 ± 0.426 bc17.48 ± 0.249 ef18.59 ± 0.100 ghi
VD2015.95 ± 0.202 ab16.92 ± 0.259 de18.10 ± 0.102 fg
VD4016.41 ± 0.565 bcd18.13 ± 0.298 fg18.98 ± 0.388 hi
VD6026.52 ± 0.466 j18.33 ± 0.423 gh19.16 ± 0.302 i
SurfaceFD2015.67 ± 0.269 ab18.60 ± 0.217 c16.41 ± 0.184 b
FD4015.75 ± 0.148 ab19.76 ± 0.258 e18.84 ± 0.594 c
FD6015.55 ± 0.121 a19.95 ± 0.185 e19.68 ± 0.257 de
VD2016.02 ± 0.205 ab18.62 ± 0.260 c16.44 ± 0.178 b
VD4016.41 ± 0.405 b18.87 ± 0.504 cd24.60 ± 0.743 f
VD6018.51 ± 0.381 c27.13 ± 0.438 h25.85 ± 0.417 g
FactorThree-factor analysis of variance
p-value
Meat type (MT) <0.001
Drying method (DM)<0.001
Drying temperature (DT)<0.001
MT × DM<0.001
MT × DT<0.001
DM × DT<0.001
MT × DM × DT<0.001
Different superscript letters within the dried samples indicate statistically significant differences at p < 0.05 (n = 5); RM—raw material; FD20, FD40, and FD60—freeze-drying at 20, 40, and 60 °C, respectively; VD20, VD40, and VD60—vacuum-drying at 20, 40, and 60 °C, respectively. Raw material samples (RM) were not included in the three-way ANOVA because they were not subjected to drying; therefore, drying method and drying temperature were not applicable to these samples. Tables S7 and S8 present the results of an additional one-way ANOVA comparing raw and dried samples separately within each meat type.
Disclaimer/Publisher’s Note: The statements, opinions and data contained in all publications are solely those of the individual author(s) and contributor(s) and not of MDPI and/or the editor(s). MDPI and/or the editor(s) disclaim responsibility for any injury to people or property resulting from any ideas, methods, instructions or products referred to in the content.