1. Introduction
The postharvest cleaning of agricultural produce is critical to ensuring product quality, reducing storage losses, and meeting market standards [
1]. Among various cleaning techniques, pneumatic separation based on aerodynamic properties has been extensively adopted due to its simplicity [
2], low cost, and effective separation of grains from impurities such as stones and soil. This technique is especially relevant in the context of nuts, grains, and legumes, where efficient contaminant removal enhances processing efficiency and product value. In pneumatic separation, the efficiency of the separation process depends on the cleaning efficiency and quality of the sieves and the technological performance of the whole grain cleaning machine, as indicated in many studies in this field [
3,
4].
Türkiye is the world leader in hazelnut production, accounting for approximately 700,000 tons annually. However, due to factors such as the topographical structure of the Black Sea Region, where hazelnut production is most widespread economically, the fact that hazelnuts grow in clusters called “ocak,” and the presence of different varieties in hazelnut orchards, harvesting mechanization has not reached the desired level. Hazelnut harvesting is commonly done by hand or by spreading nets on the ground. Although there are hazelnut harvesting machines developed by local manufacturers, the working principle of these machines is to mechanically or pneumatically collect the hazelnuts that fall to the ground. In hazelnut orchards where the ground is not cleaned, a large amount of stones and soil are collected during the collection of hazelnuts from the ground. And these machines do not have a cleaning unit to remove stones and soil from the hazelnuts. Cleaning hazelnuts of stones and soil after harvesting with harvesting machines is still largely done manually, which increases production costs and limits scalability. Therefore, a reliable and mechanized cleaning process is required to maintain quality and reduce post-harvest burden [
5].
While pneumatic cleaning has demonstrated success in cereal and legume processing, its application to hazelnuts remains underexplored. A disadvantage of manual hazelnut harvesting is that workers damage the shoots that will produce the following year’s fruit, and the harvesting period is long. The hazelnut-growing region has the potential for rainfall throughout the year, so the lengthy manual harvesting period reduces quality [
6]. When the principles used in cleaning the grain are examined, it is thought that the difference in aerodynamic properties may be effective in separating the mixture of hazelnuts, stones, and soil. This is because there is a significant difference in terminal velocity between stones, soil, and hazelnuts [
7]. This difference has led to the idea that a pneumatic horizontal air tunnel, which can be developed according to the aerodynamic properties of hazelnuts, could be successful in cleaning them of stones and soil. Therefore, optimizing machine parameters such as air speed, feed rate and drop-off distance for pneumatic separation is crucial to achieve a balance between high purity and minimal product loss. A systematic, data-driven approach is required to fine-tune these parameters for efficient and cost-effective cleaning [
8].
The potential of machine learning to address questions related to granular materials has only recently begun to be utilized [
9]. Recent advancements in artificial intelligence, particularly machine learning, have opened new avenues for predictive modeling in agricultural engineering. Random Forest (RF) models, known for their robustness and accuracy, can be trained to predict separation outcomes under varying machine settings. Integrating such models with experimental data enhances decision-making and provides deeper insights into the interactions between system parameters and performance metrics.
This study aims to evaluate the performance of a multi-compartment pneumatic separator used in hazelnut cleaning by systematically varying air velocity, feed rate, drop distance, and material mixing ratios. Through classical statistical analysis (SPSS 21 version) and RF modeling, this study aims to determine the optimal conditions for maximizing kernel purity while minimizing losses. If the results are satisfactory, the goal is to complete the mechanization of hazelnut harvesting by integrating it into existing hazelnut harvesting machines. The findings contribute to the development of efficient, mechanized post-harvest solutions for the hazelnut industry and provide a replicable framework for similar applications in other crops.
2. Materials and Methods
2.1. Hazelnut Material and Initial Properties
In this study, the Sivri hazelnut variety, widely grown in the Black Sea Region of Türkiye, was used. Samples were collected from a local producer in the Terme district of Samsun. The physico-mechanical properties, such as average weight (1.78 g), equivalent diameter (1.56 cm), volume (2.05 cm
3), and density (881.9 kg/m
3), were obtained from Beyhan [
7] and are summarized in
Table 1. These properties are critical in evaluating the aerodynamic behavior of hazelnuts during pneumatic separation.
2.2. Experimental Apparatus and Separation System Design
To reduce the harvest moisture content of the hazelnuts to between 9.8% and 11% 95 (wet basis), which is considered storage moisture, the moisture content of the samples was determined according to ASAE Standard S352.2 FEB03 (Moisture Measurement—Unground Grain and Seeds) using the oven-drying method. Samples were dried at 103 ± 1 °C for 72 h, and moisture content was calculated on a wet basis from the loss in mass during drying:
where MC
wb represents the moisture content (w.b) of the hazelnuts, W
i represents the initial weight (g) of the hazelnuts, and W
d represents the weight (g) of the hazelnuts after drying.
Material flows gravitationally in the feeding unit. To ensure this, the coefficient of friction of the hazelnuts on the steel sheet, a critical parameter in the feeding unit design, was taken into account. The tangent value of the friction coefficient represents the angle of the feeding unit’s lateral walls. This allows the material to overcome the friction force and flow by its own weight. A chain gear mechanism was used to achieve different feeding speeds through the feeding unit. The chain speed was reduced by manually shifting the gears. The gear system is driven by a 0.75 kW geared electric motor. To determine the amount of product discharged per hour by each gear, the hopper was filled to full capacity (7 kg) and a stopwatch was used to time the discharge rate.
The airflow fan was designed with double suction and backward-facing blades. A double-intake system was chosen to achieve the desired fan efficiency and speed. The fan speed was adjusted using a frequency converter to achieve the desired air velocities. Air velocities were measured at the fan outlet using a propeller anemometer. The fan is driven by a 3.5 kW three-phase electric motor. Air velocities higher than the terminal velocity of the hazelnuts were selected. The goal was to drop the hazelnuts into the boxes farther away at a speed higher than the terminal velocity, while stones and soil were dropped into the boxes closest to the fan to separate them.
The present study was designed to systematically evaluate the influence of key operational parameters, including material mixture composition, air velocity, feed rate, and drop distance, on the efficiency of cleaning hazelnuts from foreign matter (stones and soil). The goal was to simulate and optimize the separation environment in pneumatic and gravity-based cleaning systems to ensure maximum impurity removal with minimum grain loss, a critical balance in postharvest processing. In the material mixture composition, two representative mixtures were prepared to reflect common postharvest contamination scenarios encountered in small-scale nut processing operations. These are mixture A (2-2-96%): 2% stones, 2% soil, and 96% hazelnuts (kernels and shells), and mixture B (4-4-92%): 4% stones, 4% soil, and 92% hazelnuts.
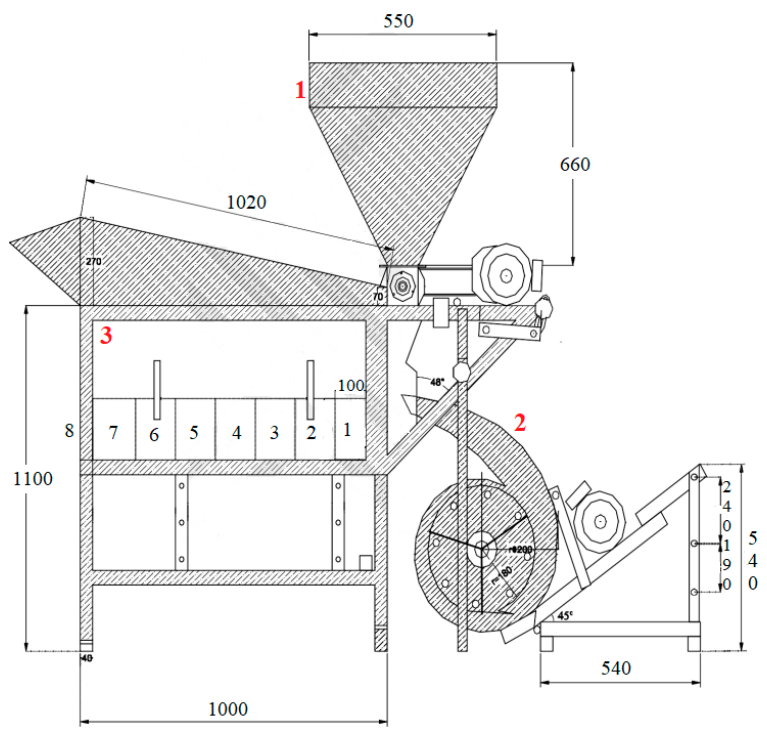
Air velocities were varied across five discrete levels (25, 30, 35, 40, and 45 m/s) to assess their effect on the aerodynamic separation of materials. The velocity range was selected based on prior studies and operational capabilities of typical fan-assisted separation units. At low velocities, poor separation is expected due to insufficient lift forces. Conversely, high velocities may cause undesired carryover of grain, increasing losses. The material was fed into the separation unit at four rates: 500, 750, 1000, and 1250 kg/h. These levels simulate real-world loading conditions from low-capacity semi-automated units to high-throughput lines. The interaction between feed rate and air velocity was of particular interest, as higher feed rates may overwhelm the separation zone, reducing system efficacy. The separation output was collected in a series of eight collection boxes spaced 10 cm apart, yielding cumulative drop distances from 10 cm to 80 cm. Each box serves as a spatial proxy for material trajectory post-separation. As shown in
Figure 1, the first boxes often collect denser particles (e.g., stones), while lighter particles (e.g., husks, kernels) are carried farther by airflow. Understanding this spatial distribution is essential for designing collection bins and optimizing system layout.
2.3. Replication and Data Structure
Each combination of mixture × air velocity × feed rate was replicated three times, resulting in 960 observations. For each observation, the mass (or proportion) of stone, soil, and grain was recorded in each box, allowing for both absolute and normalized (percentage-based) analysis. The key dependent variables include grain purity (%), net cleaning efficiency (%), and grain loss (g). The grain purity is defined as the percentage of grain in a box relative to the total mass in that box. The net cleaning efficiency is calculated as the proportion of stone and soil relative to total mass, indicating effective contaminant removal. While the grain loss is the grain mass in any box containing stone or soil, it is considered an unintended removal. Their equations are as follows [
10]:
2.4. Machine Learning Model Development
In this study, RF regression was employed to predict the performance of the hazelnut kernel separation system. The input variables used for model training included air velocity (m/s), feed rate (kg/h), drop distance (cm), and material mixture type, which was encoded for machine learning purposes. The output variables, or targets, were grain purity (%), net cleaning efficiency (%), and grain loss (g). All modeling was performed using Python version 3.7.4 (Python Software Foundation,
https://www.python.org/ (accessed on 14 January 2026) within the Jupyter Notebook 21 environment. The libraries scikit-learn, numpy, matplotlib, and pandas were used for data preprocessing, model development, and visualization. RF regression was selected because it can effectively model complex nonlinear relationships among operating parameters, is robust to overfitting, and provides reliable prediction performance for relatively small experimental datasets.
RF is an ensemble learning algorithm that constructs multiple regression trees using a bootstrapped sampling technique. Each tree is trained independently on a randomly selected subset of the data and uses a random one-third subset of the predictor variables at each split. The remaining one-third of the data, not used for tree construction, serves as out-of-bag (OOB) samples for internal validation. Once the forest is constructed, predictions are made by averaging the outputs from all trees in the ensemble. Model optimization involved tuning several RFma hyperparameters, including the number of trees (n_estimators), maximum tree depth (max_depth), minimum samples required to split a node (min_samples_split), and minimum samples required at a leaf node (min_samples_leaf). The final optimized model used 500 trees (n_estimators = 500), no restriction on tree depth (max_depth = None), min_samples_split = 2, min_samples_leaf = 1, bootstrap sampling enabled (bootstrap = True), and a fixed random state of 42 (random_state = 42). These settings provided stable prediction performance, computational efficiency, and robust model generalization for evaluating kernel separation performance under different process conditions.
2.5. Model Evaluation
To evaluate the performance of the RF model in predicting kernel separation efficiency, a k-fold cross-validation approach (10-fold with 50 repeats) was employed. Due to the relatively limited number of observations, the dataset was initially divided into two subsets: 70% of the data was used for model training, and the remaining 30% was reserved for validation. For each data point, the prediction model was generated 500 times (10 folds × 50 repeats), and the final prediction was computed as the average of these 500 iterations. This resampling technique enhanced model reliability and reduced overfitting risk.
Model performance was assessed using the coefficient of determination (
R2) and root mean square error (
RMSE), which were calculated for both training and validation datasets. The
R2 value quantifies how well the model explains the variance in the observed data, while
RMSE measures the average magnitude of prediction error. The formulas used are shown below:
In these equations, yi represents the predicted value, xi is the actual measured value, xi is the mean of the measured values, and n is the total number of observations. A higher R2 and a lower RMSE indicate better predictive performance of the model in assessing grain purity, net cleaning efficiency, and grain loss under varying process conditions.
3. Results
3.1. Effect of Material Mixture on Separation Efficiency
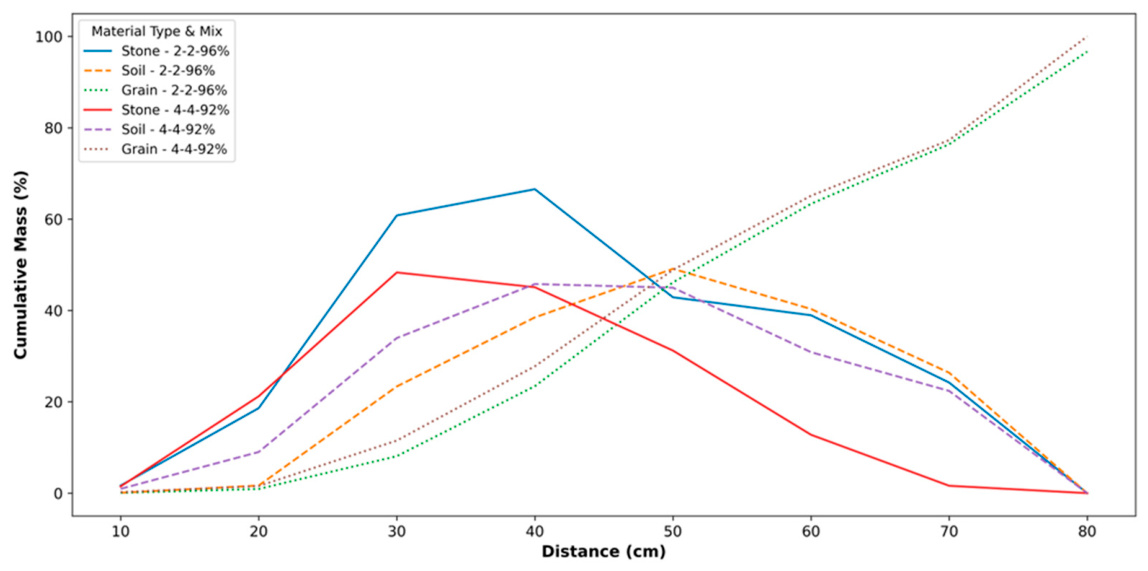
The composition of the input material mixture significantly influenced the decomposition behavior of stones, soil, and grain along the fall distances. As shown in
Figure 2, with average data obtained from different air velocities and feed rates, the two mixtures tested, 2-2-96% (low impurity) and 4-4-92% (high impurity), exhibited different distribution profiles along the collection boxes. For both mixtures, stones accumulated predominantly in the early fall zones (10–40 cm), and the highest recovery was observed around 30–40 cm. However, the higher impurity mixture (4-4-92%) exhibited a wider and flatter stone distribution, suggesting reduced decomposition sharpness and possible turbulence or overloading in the decomposition column. In horizontal air tunnels, the material mixture is fed into the unit perpendicular to the airflow. This material flow occurs entirely gravitationally.
The amount of foreign material in the material mixture, and the tendency of shelled nuts to clump the material, constantly changes the mass in contact with the airflow. As a result, there is an uneven distribution of air velocity and material feed velocity in the channel, which significantly affects the cleaning efficiency. These results are consistent with those reported by Stephanenko et al. [
11]. This phenomenon affecting cleaning efficiency is called the mass index. Shape and density are known factors that influence the aerodynamic properties of a material [
12]. This suggests that, in the face of airflow, the soil grains moved in a nut-like manner, thus tending to spread throughout the entire product fall boxes. Similarly, soil particles were gradually recovered further downstream in the high-impurity mixture, indicating partial transport.
In contrast, grain recovery shifted significantly over longer distances (60–80 cm), consistent with expectations of lighter aerodynamic behavior. Specifically, the 2-2-96% mixture achieved more distinct separation bands, confirming the advantage of reduced contamination load.
To further quantify the effect of the mixture composition, grain loss was assessed by analyzing the amount of grain collected in boxes containing soil or stones. The high-impurity mixture (4-4-92%) showed significantly greater grain loss compared to the low-impurity mixture (2-2-96%); average losses were 19.4 g and 13.8 g, respectively, representing an increase of approximately 40%. The study showed that changes in the amount of foreign material in the mixture have a significant impact on cleaning efficiency. This is consistent with a study reporting that even the slightest change in parameters in pneumatic cleaning has a significant effect on cleaning efficiency, making it difficult to determine the optimum conditions for separation [
13]. The study showed that changes in the amount of foreign material in the mixture have a significant effect on cleaning efficiency. This is consistent with previous studies reporting that even minor variations in pneumatic separation parameters can significantly affect separation performance, making it difficult to determine optimal operating conditions [
14].
In aerodynamic separation systems, particle behavior is strongly influenced by aerodynamic drag, gravity, and particle geometry, including shape and projected area, which determine the trajectory of particles in the airflow [
15]. Due to differences in shape and surface characteristics, particles such as stones and soil continuously change orientation in response to airflow, resulting in irregular motion patterns. This irregular airflow–particle interaction leads to turbulence in the separation zone, which can increase grain losses in mixtures with high impurity content [
14,
16].
This significant difference highlights how high contaminant loads disrupt the aerodynamic separation mechanism and lead to the incorrect placement of grain in contaminated collection areas. Such inefficiencies not only reduce overall separation efficiency but also lead to significant post-harvest losses. These results highlight the importance of minimizing initial impurity levels before pneumatic separation to ensure optimum separation accuracy and product recovery. However, due to the topographical structure of hazelnut orchards, impurity levels cannot be controlled.
3.2. Optimal Drop Distance for Grain Collection
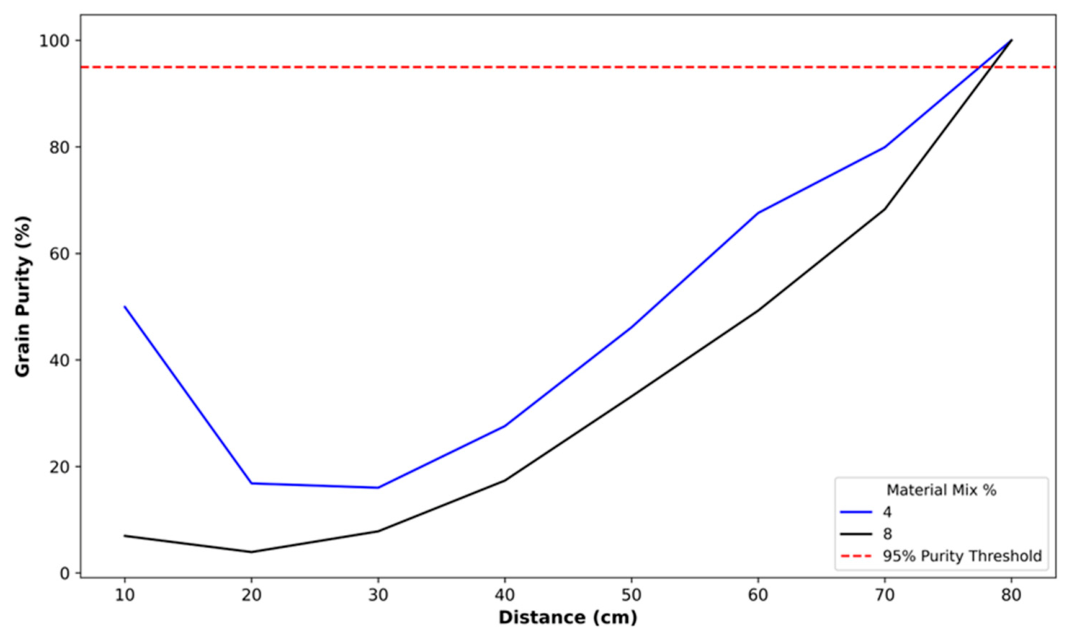
The drop distance at which the grains are collected plays a fundamental role in determining the final purity of the product. As shown in
Figure 3, grain purity showed a gradual improvement with increasing distance in both material mixtures, consistent with aerodynamic separation behavior. However, in the 2-2-96% mixture, grain purity began to increase significantly after 30 cm, exceeding the 95% purity threshold at approximately 75 cm and subsequently maintaining high purity levels. The 4-4-92% mixture showed a slower improvement in purity, reaching 95% only at the furthest collection distance of 80 cm. The 2-2-96% mixture, which has lower stone and soil content, consistently maintained a higher purity level compared to the other mixture. The increase in purity after approximately 30 cm product drop distance in both mixtures was found to be consistent with the aim of the study. On the other hand, the increase in air velocity led to a decrease in cleaning efficiency and an increase in particle loss because it threw nut-sized particles, which have a relatively lower floating velocity, out of the unit (80 cm). This finding is consistent with the results of Simonya and Yiljep [
10].
As the increase in air velocity exceeded the drag coefficient of the materials, as reported by Adewumi et al. [
17], the increased air velocity caused an increase in the particle loss rate. This delay in achieving clean separation under higher contamination levels reinforces the disruptive effect that excess soil and stones exert on airflow stability and sorting precision.
From a process optimization perspective, the goal is to identify a collection zone where grain purity is maximized without sacrificing excessive yield [
18]. The 2-2-96% mixture offers a clear operational window between 50 and 70 cm, where purity exceeds 95% and grain mass remains substantial. For the 4-4-92% mixture, however, the delay in achieving high purity may result in greater yield loss if collection occurs too far downstream. These findings suggest that collection boxes placed between 60 and 80 cm are better suited for more contaminated material, while 50–70 cm remains optimal under standard conditions.
Increasing the product discharge distance increases cleaning efficiency but reduces cleaning quality due to increased particle losses. In this respect, the results appear consistent with Kharchenko et al. [
14]. Incorporating automated gating or adaptive airflow control may further enhance separation selectivity in future system designs.
3.3. Effect of Air Velocity and Feed Rate on Separation Performance
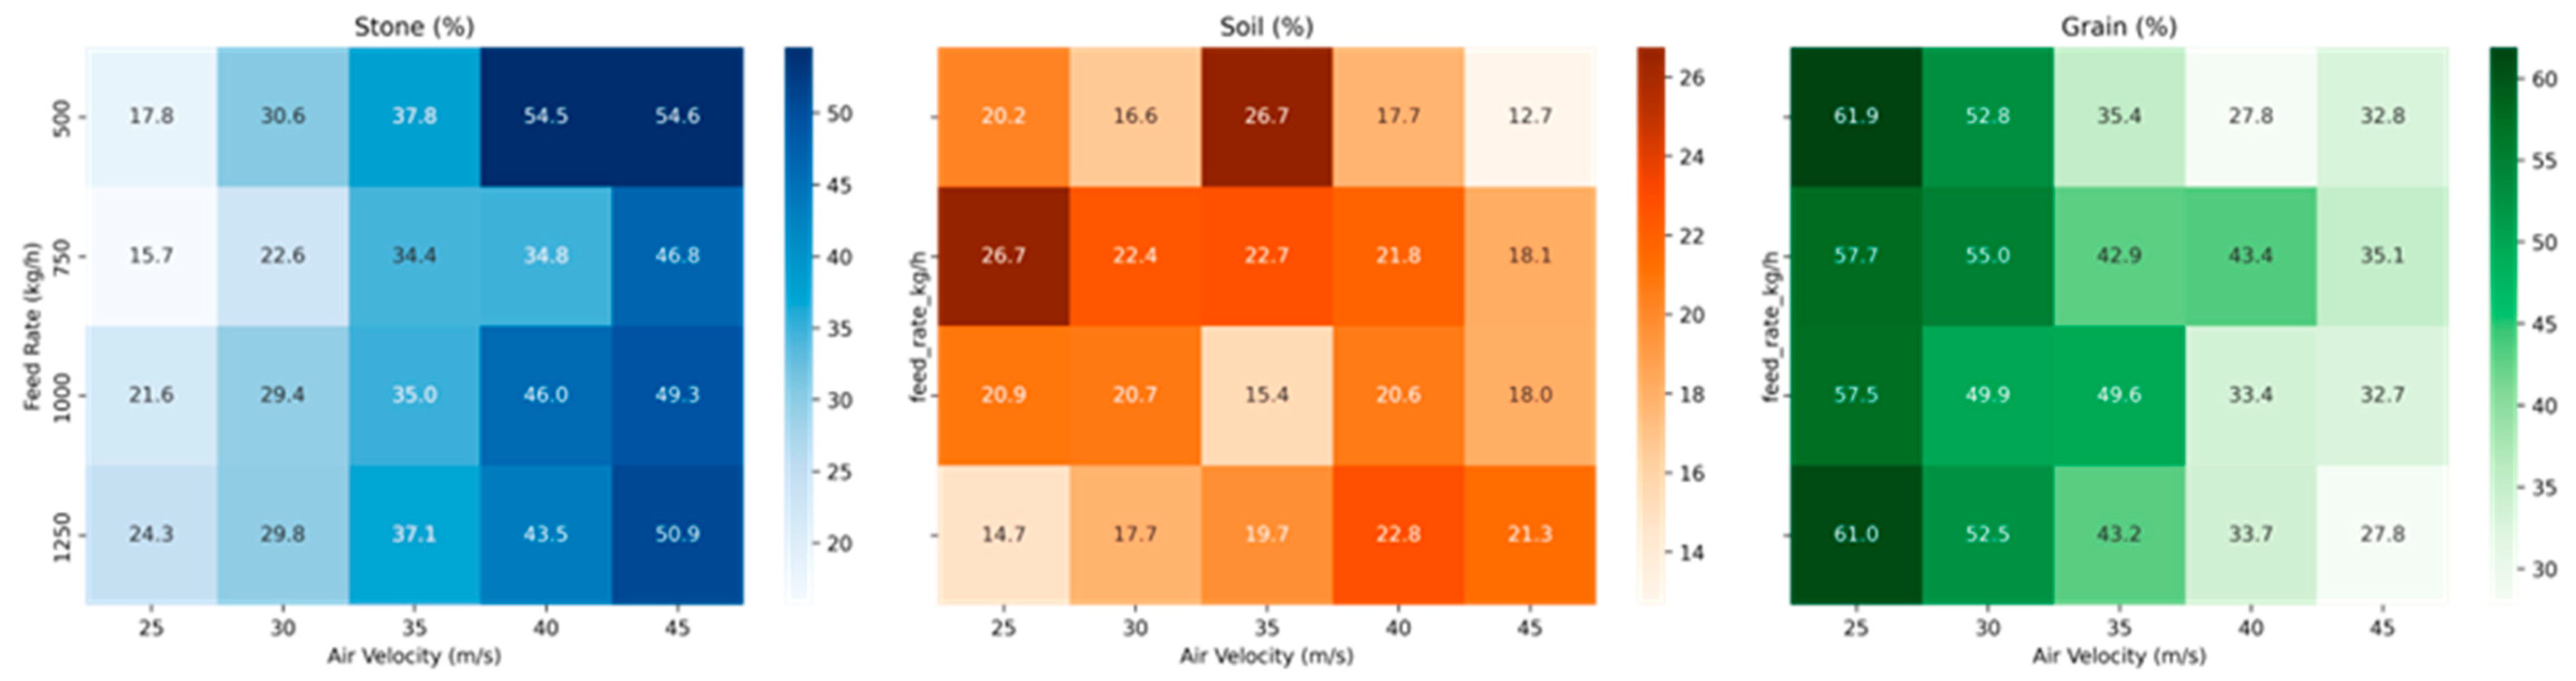
The efficiency of material separation in air cleaning systems, material separation efficiency is largely influenced by the interaction between air velocity and feed rate. As shown in
Figure 4, the percentage of stones (%) increased significantly at higher air velocities. For example, at 500 kg/h, the stone separation rate increased from 17.8% at 25 m/s to over 54.6% at 45 m/s. In a similar study, Panasiewicz et al. [
19] determined that increasing air velocity improved the cleaning efficiency in pneumatic separation of bitter lupine. The lack of a specific geometric shape of the stones causes their resistance to airflow velocity to fluctuate, as the projection area of the surface roughness onto the airflow changes [
20]. However, increasing the air velocity transported the stones to distant boxes because it increased the difference between the stone’s critical velocity and the air velocity. As shown, air velocity plays a significant direct and indirect role in pneumatic separation.
The increase in the drag force applied to the material with increasing air velocity was found to be consistent with the results obtained in the pneumatic brass cleaning process [
12]. However, this effect was somewhat dampened at higher feed rates (e.g., 1250 kg/h), where the stone separation remained relatively stable between 29% and 51%, possibly due to system saturation or inter-particle collisions that disrupted ideal trajectories. Overall, this heatmap demonstrates that increasing air velocity is beneficial for stone removal, but its effectiveness may plateau or even decline when feed rates exceed the system’s handling capacity.
In contrast,
Figure 4 highlights a more complex behavior for soil separation. The soil percentage generally peaked at intermediate air velocities (e.g., 30–35 m/s) and lower feed rates (e.g., 750 kg/h), with maximum values around 26.7%. Unlike stones, soil particles are lighter and more susceptible to turbulent flow, making them more sensitive to subtle changes in airflow and loading conditions. At higher velocities (≥40 m/s), soil removal appeared to decline, especially at 500 kg/h and 750 kg/h, potentially due to soil particles being lifted and carried too far, mixing with lighter material zones, or escaping capture. This non-linear pattern suggests that soil separation requires a balanced configuration of moderate air velocity and feed rate, as excessive airflow may result in diminished control over particle dispersion.
The third panel,
Figure 4, presents the normalized grain percentage (%) recovered across the same operational matrix. Particularly, grain recovery was highest at lower air velocities (25–30 m/s), reaching up to 61.9% at 25 m/s and 500 kg/h. As air velocity increased beyond 35 m/s, grain recovery dropped significantly, particularly at higher feed rates (≥1000 kg/h). This indicates that excessive airflow begins to entrain lighter grain particles into undesired trajectories, increasing the risk of grain loss into contaminant bins. Moreover, high feed rates reduce the residence time and increase particle collisions, further impairing separation efficiency. This pattern clearly suggests that to preserve grain, airflow must be carefully modulated, especially under high-throughput conditions. These results can be explained by the heterogeneous nature of the material and the irregular airflow resulting from the physical structure of the wind tunnel, as well as the similar physicomechanical properties of the agricultural product and foreign material [
14].
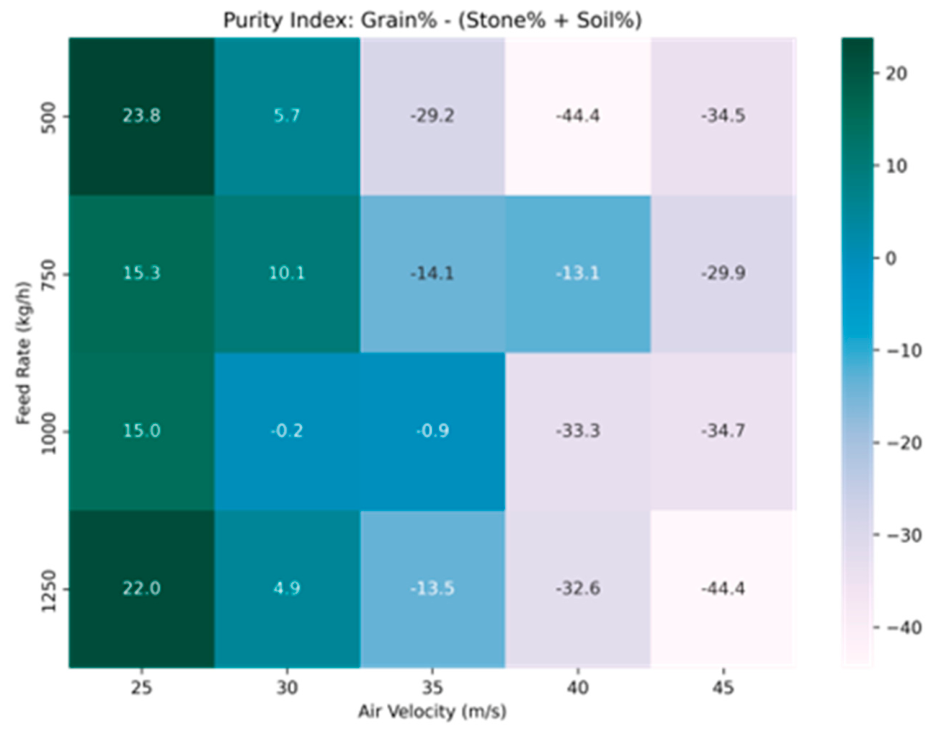
To synthesize these trends, a combined purity index, defined as %Grain − (%Stone + %Soil), was calculated to synthesize the observed trends and is presented in
Figure 5. This metric provides a clear indication of how effectively the system separates clean grain from contaminant materials. Positive values indicate net grain purity, whereas negative values reflect dominance of unwanted materials. The highest purity index (+23.8) was achieved at an air velocity of 25 m/s and a feed rate of 500 kg/h, confirming these conditions as optimal for clean grain recovery.
This observation is consistent with previous studies reporting that pneumatic separation systems exhibit a distinct optimal operating window, where both air velocity and feed rate significantly affect separation efficiency and product loss [
15]. Similarly, it has been shown that particle motion in pneumatic channels is strongly dependent on airflow conditions, and deviations from optimal airflow lead to unstable trajectories and reduced separation quality [
14].
In contrast, most high-velocity and high-feed-rate settings resulted in negative purity scores, indicating deterioration in separation performance. It has been reported that increasing air velocity beyond a critical range can lead to excessive turbulence and entrainment of desirable grains, thereby reducing overall purity even if impurity removal (e.g., stones and soil) is improved [
16,
19,
21,
22].
This tradeoff highlights a critical design consideration: optimal separation performance is not merely about maximizing impurity ejection but rather about achieving a balance that preserves grain yield while effectively isolating contaminants. Based on these results, the recommended operating window is 25–30 m/s air velocity with feed rates between 500 and 750 kg/h. Increasing the feed rate helped create turbulent flow throughout the wind tunnel, reducing the cleaning efficiency; these results are consistent with [
2].
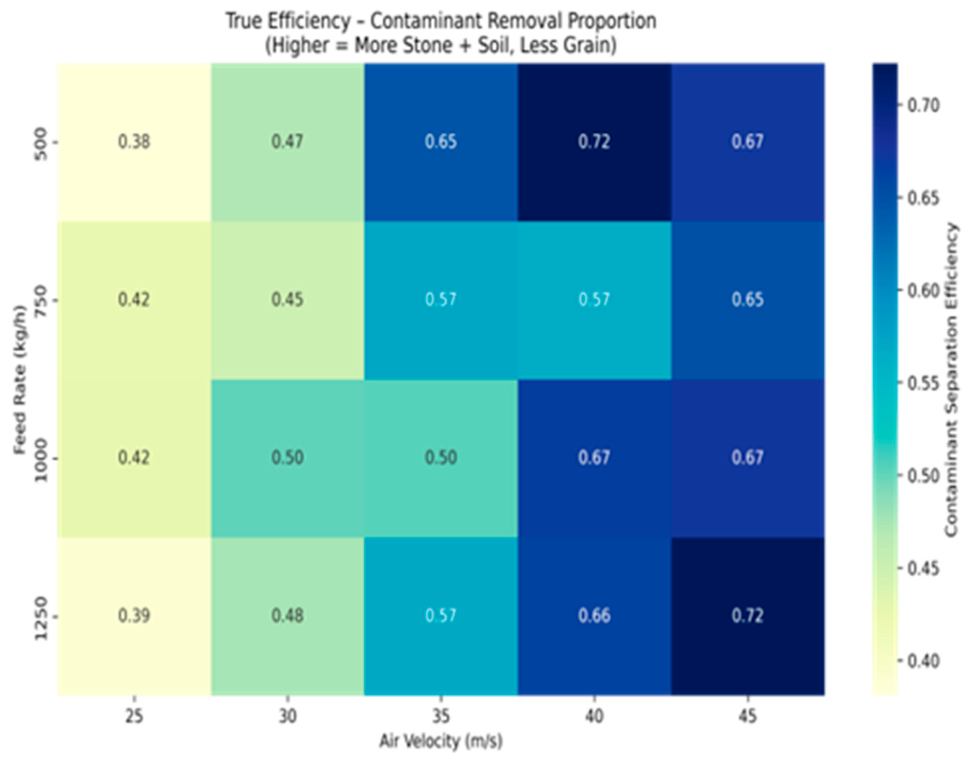
Figure 6 illustrates the contaminant removal efficiency, calculated as the normalized proportion of stone and soil relative to total collected material across different air velocities and feed rates. The results show a clear trend where increasing air velocity from 25 m/s to 40 m/s enhances contaminant separation efficiency, with peak values exceeding 0.70 at 40–45 m/s and higher feed rates (e.g., 1000–1250 kg/h). Specifically, the highest efficiency (0.72) was observed at both 40 m/s with 500 kg/h and 45 m/s with 1250 kg/h, indicating that optimal air momentum plays a key role in displacing heavier contaminants while maintaining acceptable grain loss. Conversely, lower velocities (25–30 m/s) yielded significantly reduced separation efficiency (<0.50), especially under low feed rates, highlighting insufficient drag force to lift non-grain particles.
These findings underscore the importance of tuning airflow to match material load, enabling enhanced pneumatic classification in multi-box systems. In other studies similar to this proposal, it has been emphasized that in order to improve the parameters of pneumatic systems, air flow processes should be modeled according to cleaning quality and a methodology should be developed for this [
12,
13].
3.4. ANOVA and Post Hoc Analysis
To statistically validate the effects of operational variables on separation performance, a factorial ANOVA was conducted using grain purity (%) as the response variable. The analysis included four main factors: air velocity, feed rate, drop distance, and material mixture, along with two key two-way interactions. As summarized in
Table 2, the results confirmed that air velocity, drop distance, and mixture composition each had a statistically significant effect on grain purity (
p < 0.001), whereas feed rate alone did not (
p = 0.30). This suggests that the system’s cleaning performance is more sensitive to how fast and far materials are propelled and separated than to how much material is introduced at a time.
These results are similar to those obtained in previous pneumatic cleaning studies, which showed that the success of the work largely depends on the physicomechanical properties of the materials, flow parameters, and foreign material ratio [
11]. Significant interactions were also detected between air velocity and distance, as well as air velocity and feed rate, indicating that the effect of airflow changes depending on how far particles fall and how much material is being processed. The non-significance of feed rate as a main effect (despite its practical relevance) may be attributed to its indirect role: it likely influences the separation outcome through interactions rather than as an isolated factor. For example, at higher feed rates, the air velocity’s ability to sort materials may be impaired, yet the overall mean grain purity may remain statistically unchanged due to compensating effects at different distances.
This interpretation aligns with earlier heatmap results where feed rate showed nuanced but non-linear effects on grain recovery and purity.
To further interpret the significant main effects, Tukey’s Honest Significant Difference (HSD) post hoc test was applied to identify which levels of air velocity, mixture, and distance were statistically different. The results, presented in
Table 3, show group letter assignments that rank levels from best to worst in terms of grain purity. For instance, air velocities of 25 m/s and 35 m/s were grouped as “a” and “b”, indicating significantly better grain purity than higher velocities such as 40 m/s or 45 m/s, which fell into lower groupings (“c”). Similarly, distance bins beyond 50 cm consistently received higher group letters, affirming that cleaner grain tends to be collected at later drop zones.
For material mixtures, the 2-2-96% composition achieved significantly higher purity than the 4-4-92% mixture, receiving a top group letter (“a”). Together, the ANOVA and Tukey HSD results reinforce earlier visual findings: moderate air velocity, longer drop distances, and lower impurity mixtures consistently contribute to superior separation outcomes. These statistical tests not only confirm the significance of individual factors but also provide a framework for confidently recommending system settings that balance cleaning efficiency and grain preservation.
3.5. Grain Purity Heatmap by Air Velocity, Feed Rate, and Distance
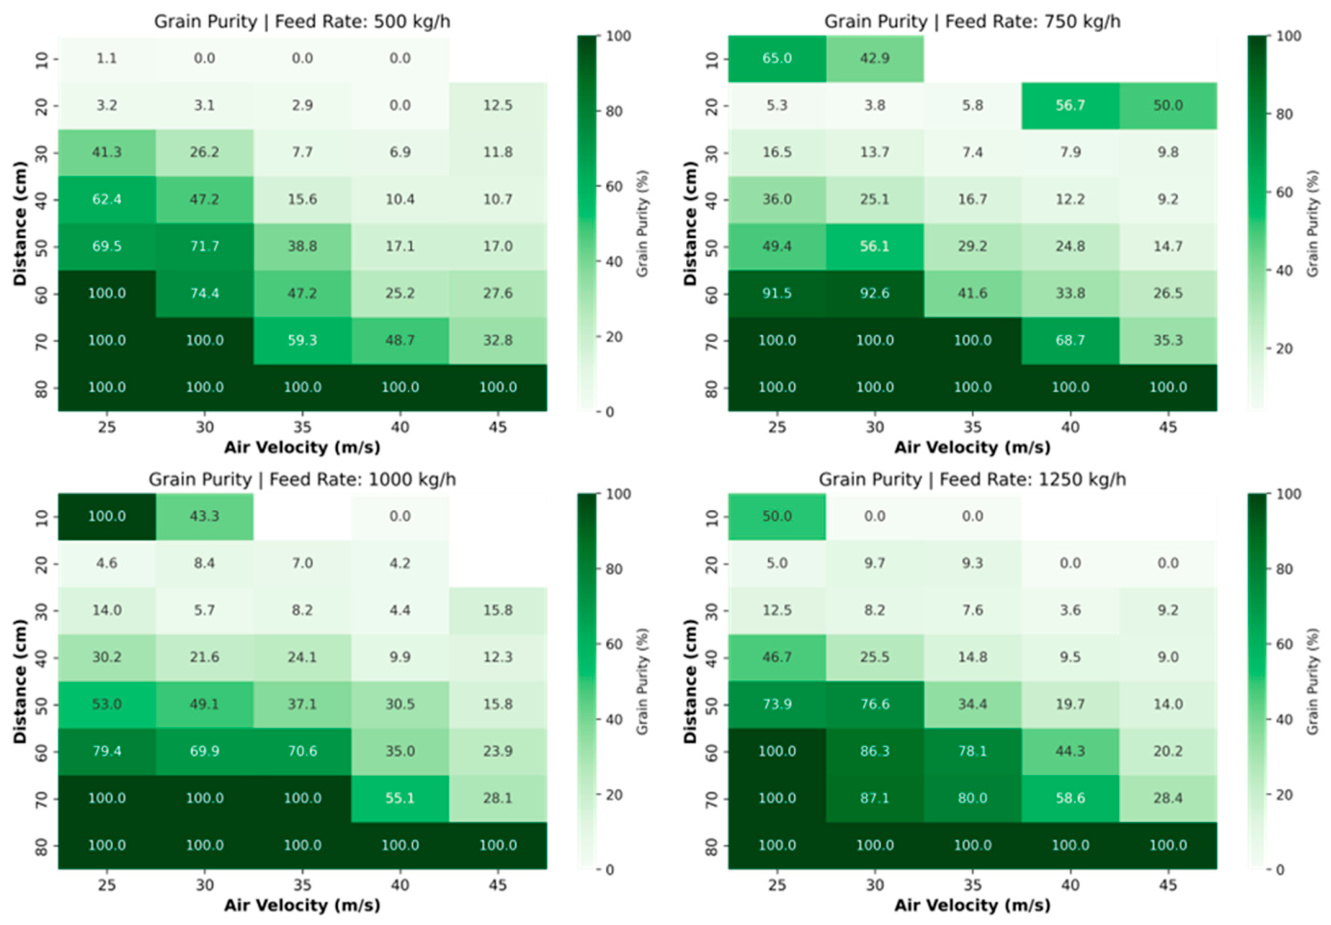
To further support operational insights, grain purity was shown using two-dimensional heatmaps across varying air velocities and drop distances, separately for each feed rate. These plots provide a more intuitive matrix-style overview, highlighting how purity performance shifts with system parameters. The heatmap for 500 kg/h feed rate (
Figure 7) demonstrates the clearest stratification, with purity values reaching 100% in the region between 60 and 80 cm distances and 25–30 m/s air velocity. This aligns strongly with the optimal ranges identified in earlier 3D plots, confirming that both sufficient air impulse and separation distance are critical for efficient grain-cleaning dynamics under low throughput conditions. As the feed rate increases to 750 kg/h (
Figure 7), the purity response begins to show more constraint, with high values becoming localized and sensitive to distance. The 100% grain purity region persists but narrows, mainly concentrated around 60–80 cm distances and air velocities at or below 30 m/s. This shift suggests that increased feed density introduces more particulate interactions, requiring precise control of velocity to avoid contamination. Notably, grain purity at shorter distances (10–30 cm) collapses, indicating that early collection zones are unsuitable under moderate load conditions regardless of airflow.
At 1000 kg/h (
Figure 7), high-purity regions continue to decline in size and uniformity, with many mid-range distances exhibiting significant purity loss. The area of 100% purity is still evident but primarily restricted to long drop distances and air velocities below 35 m/s. This pattern implies that as feeding pressure increases, only a narrow operational band can maintain sufficient separation quality. Interestingly, some artifacts of overperformance at 10 cm and 25 m/s emerge, but these are likely influenced by low-volume edge effects rather than reliable system behavior. Under the highest tested feed rate of 1250 kg/h (
Figure 7), the heatmap shows widespread purity degradation across all but the highest drop distances. At 60–80 cm, the system still achieves 100% purity under 25–30 m/s, but the rest of the matrix reveals declining performance with increasing air speed and decreasing trajectory. The progressive deterioration of separation clarity with feed pressure indicates that turbulence and collision effects dominate, overwhelming the system’s airflow sorting capability. These findings reinforce the need to match feed rate with appropriate velocity and collection time to maintain acceptable purity levels in real-world processing environments.
3.6. Surface and Animation Analysis
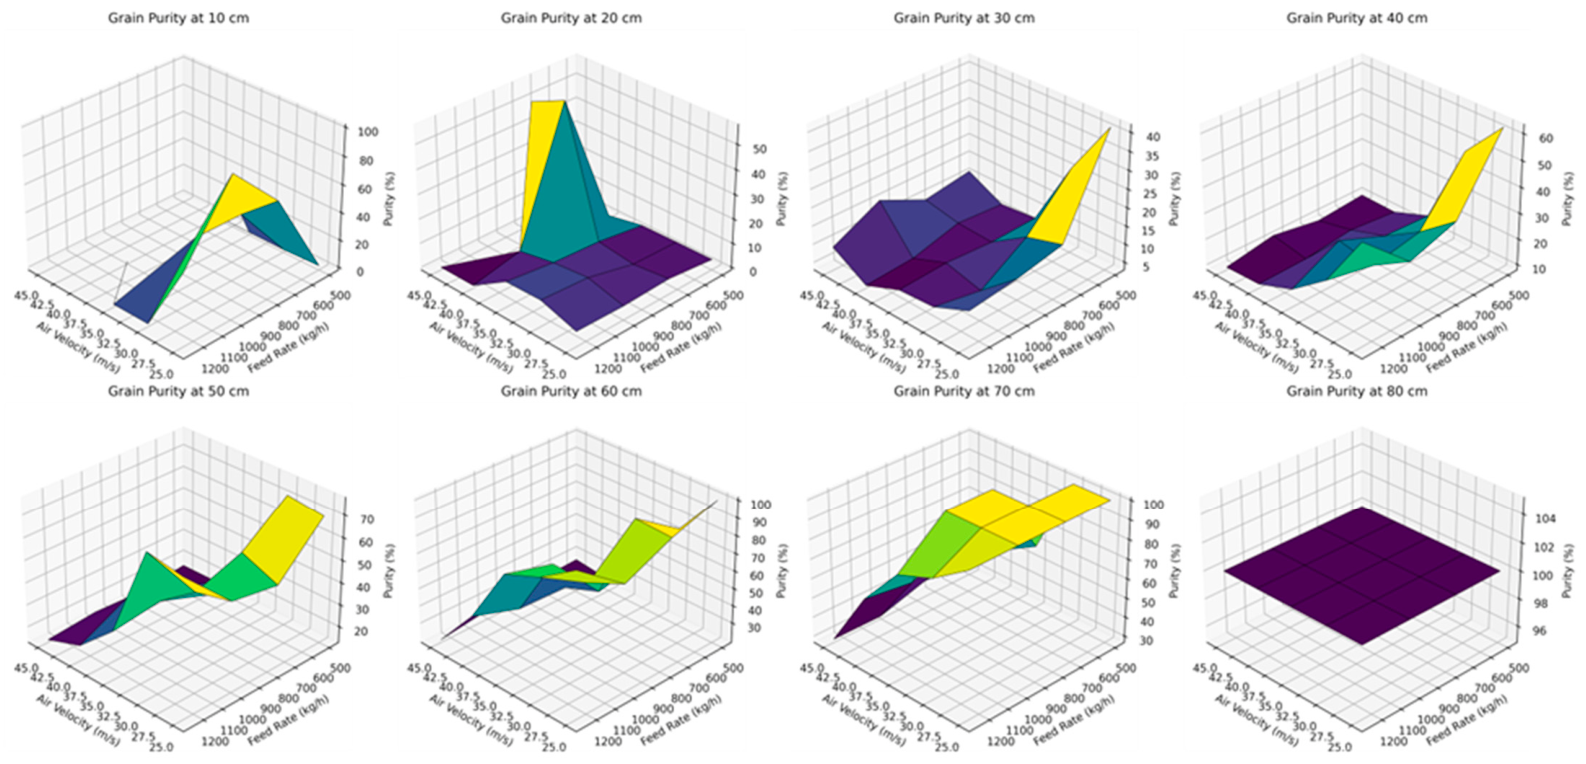
The 3D surface for the eight drop distances (10–80 cm) is shown in
Figure 8. At a drop distance of 10 cm, grain purity was highly variable and generally low across most feed rate and air velocity combinations. The short separation path likely limited the ability of airflow to discriminate between particle densities, leading to early co-deposition of both grain and impurities. While some peaks in purity were visible, particularly at 30–35 m/s with lower feed rates, the surface exhibited sharp transitions, indicating unstable and inconsistent separation. This distance appears too short to allow for aerodynamic sorting to fully develop. The surface at 20 cm reflected slightly improved aerodynamic effects, with a more pronounced purity peak at lower feed rates (500 kg/h) and around 25–30 m/s air velocity. However, grain purity remained generally low, and performance dropped off rapidly with increasing feed rate. The constrained separation time still posed limitations, suggesting that 20 cm is a transitional zone where airflow begins to differentiate particles, but is not yet effective enough for consistent high-purity recovery. At 30 cm, grain purity began to improve more consistently, particularly in the region of 25–30 m/s air velocity and 500–750 kg/h feed rate. The surface showed smoother gradients and fewer sharp drops, suggesting that particle sorting was becoming more stable and less sensitive to small parameter changes. This distance marks the onset of reliable separation, with better-defined zones of acceptable grain recovery.
The 40 cm plot revealed a clear trend toward optimal separation conditions. Grain purity exceeded 60% in several settings, particularly at 25 m/s and low feed rates, with a gradually declining surface toward higher air velocity and feed rate combinations. This distance offered a strong balance between particle drop trajectory and airflow momentum, producing a large operational window where purity could be reliably maintained. The data suggests that 40 cm is among the most favorable distances for grain collection.
The purity surface at 50 cm showed further refinement of separation dynamics. High-purity zones expanded to include more moderate feed rates (up to 1000 kg/h), especially at 25–30 m/s. The surface remained smooth and consistent, reflecting reliable and scalable performance. The system appears to achieve aerodynamic equilibrium at this range, in which grain is successfully directed to clean bins and heavier contaminants are deflected earlier. By 60 cm, the surface began to show signs of peak performance. Grain purity exceeded 80% at the best settings (e.g., 25 m/s and 500 kg/h), and even higher feed rates maintained reasonable purity. The plot suggests that this distance maximizes the separation time available, allowing grain to fully escape turbulent zones created by soil and stones.
This is likely the optimal collection point for clean products with minimal losses. At 70 cm, grain purity remained high across almost all tested conditions. A plateau of high-purity values appeared on the surface, especially in the 25–35 m/s velocity range and across most feed rates. This indicates not only strong separation but also stability and insensitivity to minor parameter variations. However, depending on system design, collecting grain too late may risk losing some mass to overshoot or air recirculation effects, which were not reflected in purity alone. The final surface at 80 cm showed a flattening effect, with nearly uniform grain purity values above 95% across all parameter settings. While this appears ideal, it may also reflect a point where only residual grain remains, and significant quantities have already been lost or collected upstream. In practical terms, 80 cm may not be the most efficient collection point in terms of yield, even though purity is high. It is more appropriate as a quality assurance stage rather than a primary grain capture point.
Based on comprehensive 3D surface analysis and aggregated purity metrics, the optimal separation settings can be confidently identified. Among all tested air velocities, 25 m/s consistently produced the highest average grain purity, indicating it provides sufficient aerodynamic force to separate contaminants without displacing the grain. Similarly, a feed rate of 500 kg/h yielded superior performance, likely due to minimized particle collisions and turbulence, allowing the airflow to act more precisely. Regarding drop distance, the range between 70 and 80 cm achieved the best results, with purity values approaching or reaching 100%, suggesting that sufficient separation time was achieved before grain collection. Therefore, the most effective and reliable combination for maximizing cleaning performance while preserving grain integrity is 25 m/s air velocity, 500 kg/h feed rate, and a collection zone between 70 and 80 cm.
3.7. Machine Learning Prediction of Separation Outputs Using Random Forest
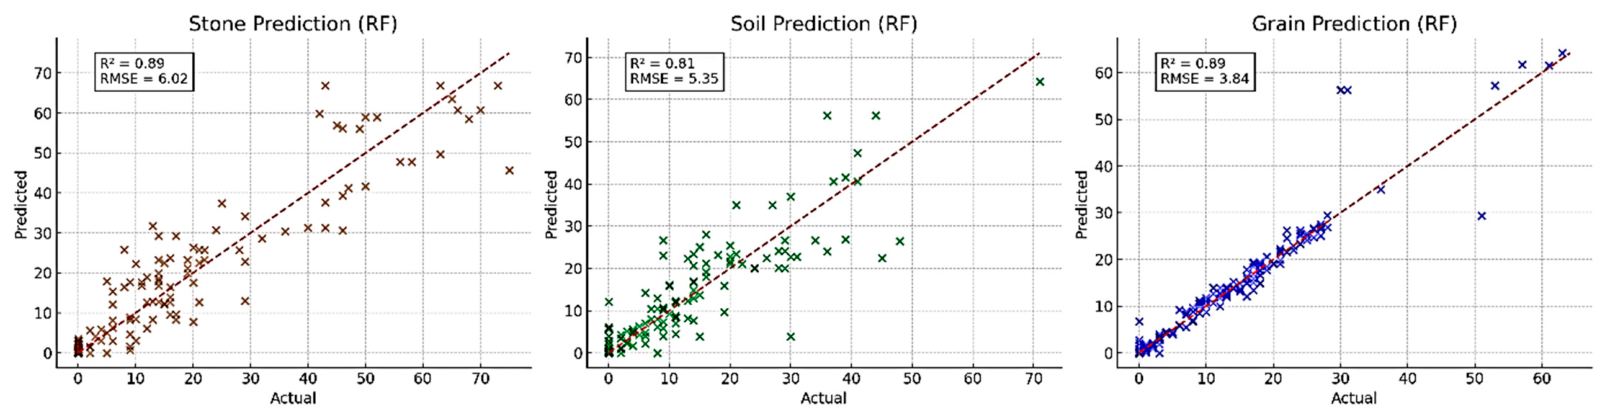
To assess the potential of machine learning in predicting material separation outcomes based on operating conditions, an RF regression model was trained using air velocity, feed rate, drop distance, and material mixture as input features. Three key performance indicators were predicted: stone removal, soil removal, and grain recovery. The results are illustrated in
Figure 9, which compares predicted values against actual experimental measurements, along with the corresponding R
2 and RMSE metrics.
The RF model for stone removal achieved an R2 of 0.89 and an RMSE of 6.02, indicating a high level of accuracy. The prediction points closely followed the identity line, suggesting the model was successful in capturing the nonlinear relationships between process settings and stone ejection efficiency. This strong performance reflects the model’s ability to differentiate mixtures and drop dynamics that contribute to optimal stone separation, especially under mid-range air velocities and moderate feed rates. Slight underestimation was observed at higher stone outputs, possibly due to fewer samples with extreme contamination levels in the dataset. For soil separation, the model produced slightly lower but still robust performance with an R2 of 0.81 and an RMSE of 5.35. The wider spread of prediction points around the identity line suggests greater variability in soil behavior compared to stones, which may be attributed to its finer particle size and less predictable aerodynamic response.
Nonetheless, the model still captured the general trends effectively, and its performance remained acceptable for practical use in optimizing cleaning operations. Lastly, grain recovery prediction achieved an R2 of 0.89 and an RMSE of 3.84, demonstrating excellent predictive fidelity. Most prediction points were tightly clustered along the identity line, with minimal deviation, indicating high precision and low bias. This highlights the RF model’s ability to preserve grain recovery integrity while modeling the complex interactions of air dynamics and feed rate. Overall, these results affirm that RF regression is a reliable and interpretable tool for forecasting separation efficiency and guiding real-time parameter adjustments in post-harvest cleaning systems.
3.8. Random Forest Regression for Grain Purity, Net Cleaning, and Grain Loss
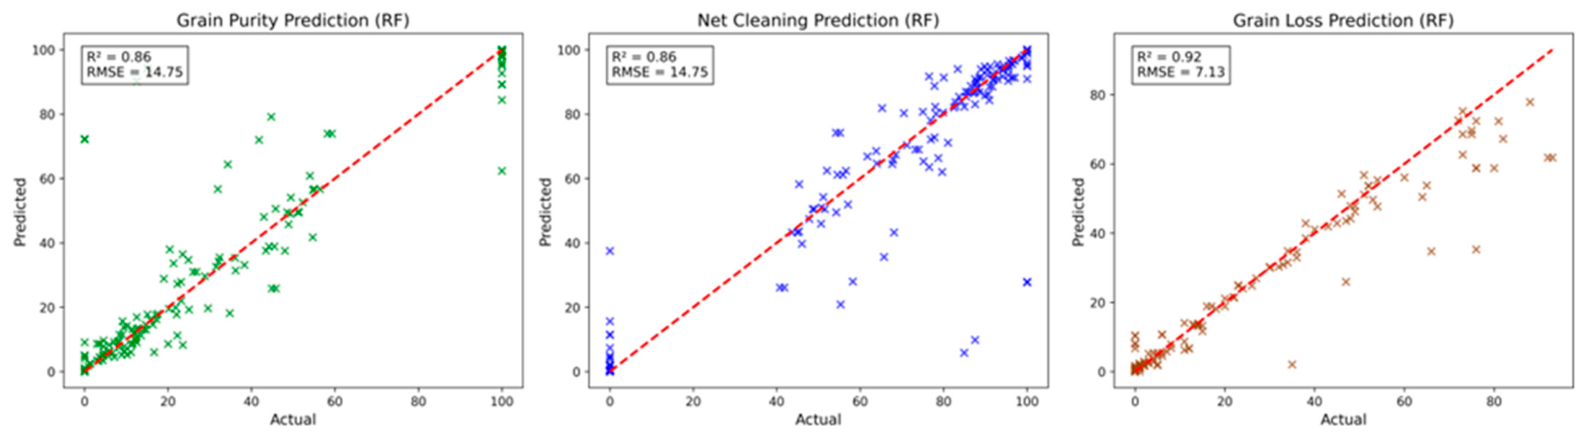
To further model the separation performance under varying operational conditions, an RF regression model was trained using four key input variables: air velocity (m/s), feed rate (kg/h), drop distance (cm), and material mixture ratio. The outputs of interest were grain purity (%), net cleaning efficiency (%), and grain loss (g).
Figure 10 summarizes the model performance by plotting predicted vs. actual values for each output, along with the R
2 and RMSE metrics.
The RF model demonstrated strong predictive capability for grain purity, achieving an R2 of 0.86 and an RMSE of 14.75. These results indicate a strong alignment between the predicted and actual values. While some deviations were observed at higher purity levels, most data points closely followed the identity line, affirming the model’s capacity to generalize well. The model effectively captured the nonlinear influences of air velocity, feed rate, drop distance, and material mixture on grain purity, making it a reliable tool for assessing the effectiveness of separation settings. Net cleaning performance, representing the effectiveness of removing contaminants (stones and soil) from the grain, was predicted with equal accuracy. The model yielded R2 = 0.86 and RMSE = 14.75, showcasing robust predictive strength across a range of cleaning efficiencies. This consistency is especially valuable for identifying operational settings that optimize contaminant removal. The model’s strong performance across varying conditions highlights its potential to replace extensive experimental trials with rapid, data-driven forecasts. The highest predictive accuracy was achieved in estimating grain loss, with the RF model reaching an R2 of 0.92 and an RMSE of just 7.13. This result reflects the model’s high precision in identifying conditions under which grain is mistakenly separated along with soil or stones. The close alignment of predicted and actual values across the full range of observations reinforces the model’s suitability for real-time monitoring and loss minimization in postharvest processing systems.
4. Discussion
Together, the three RF models presented, predicting grain purity, cleaning efficiency, and grain loss, exhibited high explanatory power and low error margins. The consistent R2 values above 0.85 suggest that the selected input variables account for the vast majority of variance in separation performance. Moreover, the low RMSE values confirm the practical reliability of these models for deployment in automated systems, simulation platforms, or decision-support tools. These findings underscore the feasibility of integrating machine learning to optimize pneumatic separation systems in postharvest processing environments.
While the developed wind tunnel performs well for pneumatic cleaning, observations during trials revealed that material flow perpendicular to the fan’s air outlet channel reduced cleaning efficiency. This is because the material mixture is poured from the feed hopper in a complex mass. This phenomenon has been explained as the mass index. This situation constantly changes the projection area that the air comes into contact with. Therefore, it causes stones and soil, which are normally expected to fall at a certain speed over a short distance, to fall into undesirable boxes.
Another noteworthy point is that soil normally has a higher floating speed than a hazelnut, but the rough and uneven surface shape caused the soil to behave like a hazelnut in the face of the airflow. Naturally, in the boxes where hazelnuts fell, the amount of soil was greater than expected. This clearly shows that surface and shape characteristics are effective parameters in pneumatic cleaning.
The study focused on the possibility of pneumatic cleaning based on the differing aerodynamic properties of stones, soil, and hazelnuts. However, the fact that soil behaves like a hazelnut in the face of airflow suggests that this principle is a limiting factor. Integrating the cleaning unit into hazelnut harvesting machines is considered uneconomical given the resulting kernel losses. Furthermore, the prototype unit requires significant constructive improvements for integration into a hazelnut harvesting machine. Considering all these factors, and given that the main goal is to reduce hazelnut harvesting costs and dependence on human labor, it has been concluded that pneumatic cleaning will not yield the desired results in principle. Instead, the existing physico-mechanical properties should be examined, principles that can be mechanized (such as differences in specific gravity) should be investigated, and a cleaning unit based on these principles should be developed.
Another important finding was that cleaning efficiency varied with the feeding rate. This is undesirable, as the feeding rate varies annually with hazelnut orchard yields and is not a controllable factor. Therefore, if high cleaning efficiency and low kernel loss are desired, systems independent of feed rate should be developed.
Furthermore, the effect of the material moisture factor on cleaning efficiency could not be tested due to the absence of the harvest season. The moisture content of hazelnuts at harvest is approximately 35–40%. However, material moisture is a critical factor, and its effect on cleaning efficiency and kernel loss should be investigated. This is also important for the effectiveness of the principle.
5. Conclusions
This study comprehensively evaluated the effectiveness of a horizontal wind tunnel pneumatic separation system for removing soil and stone impurities from hazelnuts under varying air velocities, feed rates, drop distances, and material mixtures. The results show that the separation efficiency of the system is largely influenced by air velocity and drop distance, while feed rate and material composition show a moderate interaction. Optimal grain purity (≥95%) was consistently achieved, particularly at low feed rates (500–750 kg/h) and air velocities of 25–30 m/s, with drop distances between 60 and 80 cm. Higher velocities increased stone removal but increased grain loss, especially at feed rates above 1000 kg/h. Among all applications, the combination of 25 m/s air velocity, 500 kg/h feed rate, and a 60–70 cm collection zone provided the best balance between purity and grain retention. Machine learning models trained using Random Forest (RF) regression demonstrated strong predictive ability (R2 > 0.85) for kernel purity, kernel loss, and net cleaning efficiency, validating the potential of integrating artificial intelligence into real-time separation system optimization. Consequently, the developed pneumatic separator shows high potential as a low-cost, efficient, and scalable solution for post-harvest hazelnut cleaning; however, size is a crucial criterion when considering the integration of the cleaning unit into hazelnut harvesting machines. Given the topographical structure of hazelnut orchards in Türkiye, the small size of harvesting machines necessitates a reduction in the size of the cleaning units as well. On the other hand, the findings of the study show that high cleaning efficiency is accompanied by high kernel loss over long distances. The study revealed that although the soil and kernel hazelnut float velocities differ sharply, the soil exhibits aerodynamic behavior similar to that of the kernel hazelnut in the face of airflow due to its shape and surface properties. This suggests that soil and kernel hazelnuts cannot be separated with high efficiency using pneumatic principles. Therefore, the need to develop alternative solutions to reduce kernel loss is evident. However, these findings lay the groundwork for the future development of smart farming machinery with embedded sensing and predictive control capabilities.
Author Contributions
Conceptualization, K.M.U. and M.A.B.; methodology, K.M.U., H.S., M.A.B. and A.Y.A.; software, A.Y.A.; validation, K.M.U. and M.A.B.; formal analysis, K.M.U.; investigation, K.M.U. and M.A.B.; resources, K.M.U., H.S. and K.Ç.S.; data curation, K.M.U., A.Y.A. and N.-E.G.; writing—original draft preparation, K.M.U.; writing—review and editing, K.M.U. and N.-E.G.; visualization, K.M.U., A.Y.A., M.A.B. and K.Ç.S.; supervision, K.M.U.; project administration, K.M.U. and K.Ç.S.; funding acquisition, N.-E.G. All authors have read and agreed to the published version of the manuscript.
Funding
The APC was funded by the National University of Science and Technology Politehnica Bucharest, Romania, within the PubArt Program.
Institutional Review Board Statement
Not applicable.
Informed Consent Statement
Not applicable.
Data Availability Statement
The data presented in this study are available on request from the corresponding authors.
Conflicts of Interest
The authors declare no conflicts of interest.
References
- Bracacescu, C.; Gageanu, P.; Bunduchi, G.; Zaica, A. Considerations on technical equipment used for cleaning and sortingseed mixtures based on aerodynamic principle. Eng. Rural Dev. 2018, 17, 39–44. [Google Scholar]
- Stepanenko, S. Research pneumatic gravity separation grain materials. Mech. Agric. Conserv. Resour. 2017, 63, 54–56. [Google Scholar]
- Giyevskiy, A.M.; Orobinsky, V.I.; Tarasenko, A.P.; Chernyshov, A.V.; Kurilov, D.O. Substantiation of basics cheme of grain cleaning machine for preparation of agricultural crops seeds. In IOP Conference Series: Materials Science and Engineering; IOP Publishing: Bristol, UK, 2018; Volume 327, p. 042035. [Google Scholar]
- Priporov, I.E.; Kurasov, V.S.; Samurganov, E.E.; Shepelev, A.B. Modeling the sunflower seeds separation processin air-sieve grain-cleaning machines. In IOP Conference Series: Materials Science and Engineering; IOP Publishing: Bristol, UK, 2021; Volume 1111, p. 012048. [Google Scholar]
- Uğurlutepe, K.M. Fındık Hasat Makinaları İçin Taş Ve Toprak Ayırmada Özgül Ağırlık Temelli Temizleme Ünitesi Geliştirilmesi. Ph.D. Thesis, Lisansüstü Eğitim Enstitüsü Tarım Makinalari Ve Teknolojileri Mühendisliği Ana BilimDalı, Ondokuz Mayıs Üniversitesi, Samsun, Türkiye, 2025. [Google Scholar]
- Beyhan, M.A.; Sauk, H. Türkiye’de fındık tarımında mekanizasyon durumu. Türktob Derg. 2018, 27, 22–27. [Google Scholar]
- Beyhan, M.A. Ülkemiz Koşullarına Uygun Aspiratörlü Bir Fındık Hasat Makinesi Tasarım ve Imalatı. Doctoral Dissertation, Ankara Üniversitesi (AÜ) Fen Bilimleri Enstitüsü, Ankara, Turkey, 1992. [Google Scholar]
- Marini, V.K.; Romano, L.N. Influencing factors in agricultural machinery design. Prod. Manag. Dev. 2009, 7, 111–130. [Google Scholar]
- Laudari, S.; Marks, B.; Rognon, P. Classifying grain susing behaviour-informed machine learning. Sci. Rep. 2022, 12, 13915. [Google Scholar] [PubMed]
- Simonyan, J.K.; Yiljep, D.Y. Investigating Grain Separation and Cleaning Efficiency Distribution of a Conventional Stationary Rasp-Bar Sorghum Thresher. 2008. Available online: https://cigrjournal.org/index.php/Ejounral/article/view/1159 (accessed on 14 January 2026).
- Stepanenko, S.; Kotov, B.; Kuzmych, A.; Demchuk, I.; Melnyk, V.; Volyk, D. Modelling of aerodynamic separation of grain material in combined centrifugal-pneumatic separator. In Proceedings of the Engineering for Rural Development, Jelgava, Latvia, 22–24 May 2024. [Google Scholar]
- Hajad, M.; Amrullah, R.H.; Dzulkifli, M. Design and multi-objective optimization of vibro-pneumatic separator for paddypre-cleaning using RSM. In IOP Conference Series: Earth and Environmental Science; IOP Publishing: Bristol, UK, 2023; Volume 1287, p. 012030. [Google Scholar]
- Kadan, R.S.; Freeman, D.W.; Ziegler, G.M.; Spadero, J.J. Protein displacement during classification of glanded cotton seed. J. Food Sci. 1980, 45, 1566–1569. [Google Scholar]
- Kharchenko, S.; Borshch, Y.; Kovalyshyn, S.; Piven, M.; Abduev, M.; Miernik, A.; Popardowski, E.; Kiełbasa, P. Modeling of aerodynamic separation of preliminarily stratified grain mixture in vertical pneumatic separation duct. Appl. Sci. 2021, 11, 4383. [Google Scholar] [CrossRef]
- Stepanenko, S.; Kotov, B.; Kuzmych, A.; Shvydia, V.; Kalinichenko, R.; Kharchenko, S.; Shchur, T.; Kocira, S.; Kwaśniewski, D.; Dziki, D. To the theory of grain motion in an uneven air flow in avertical pneumatic separation channel with an annular cross section. Processes 2022, 10, 1929. [Google Scholar]
- Choszcz, D.J.; Reszczyński, P.S.; Kolankowska, E.; Konopka, S.; Lipiński, A. The effect of selected factors on separation efficiency in a pneumatic conical separator. Sustainability 2020, 12, 3051. [Google Scholar] [CrossRef]
- Adewumi, B.A.; Ogunlowo, A.S.; Ademosun, C.O. Investigating Particle Trajectory as a Parameter for Selecting the Dimensions of Cross Flow Grain Classifier. Agric. Eng. Int. CIGR J. 2006. Available online: https://cigrjournal.org/index.php/Ejounral/article/download/666/660 (accessed on 14 January 2026).
- Panasiewicz, M.; Sobczak, P.; Mazur, J.; Zawiślak, K.; Andrejko, D. The technique and analys is of the process of separation and cleaning grain materials. J. Food Eng. 2012, 109, 603–608. [Google Scholar]
- Panasiewicz, M.; Mazur, J.; Zawiślak, K.; Kulig, R.; Łysiak, G. The process of separation of husked soybean in oblique airflow. Sustainability 2020, 12, 7566. [Google Scholar] [CrossRef]
- ASAE Standard S352.2 FEB03; Moisture Measurement—Unground Grain and Seeds. ASABE (American Society of Agricultural and Biological Engineers): St. Joseph, MI, USA, 2003.
- Kalın, K.M. Fındık Hasat Makinelerinde Taş ve Toprak Ayırmada Kullanılabilecek Pnömatik Sistem Parametrelerinin Belirlenmesi. Master’s Thesis, OMÜ Fen Bilimleri Enstitüsü Tarım Makinaları ve Teknolojileri Mühendisliği Anabilim Dalı, Samsun, Australia, 2018. [Google Scholar]
- Orășanu, N.; Stoica, D.; Crăifăleanu, A. Conical Vibrating Sieve. UPB Sci. Bull. Ser. D 2011, 73, 15–26. Available online: https://www.researchgate.net/publication/264893077_Conical_vibrating_sieve (accessed on 14 January 2026).
Figure 1.
Conceptual illustration of separation and drop trajectories across collection zones. (1) Feed hopper, (2) fan, (3) separation area 1–8 boxes, measurements are in millimeters [
9].
Figure 1.
Conceptual illustration of separation and drop trajectories across collection zones. (1) Feed hopper, (2) fan, (3) separation area 1–8 boxes, measurements are in millimeters [
9].
Figure 2.
Cumulative distribution of stone, soil, and grain across drop distances (10–80 cm) for two material mixtures (2-2-96% and 4-4-92%).
Figure 2.
Cumulative distribution of stone, soil, and grain across drop distances (10–80 cm) for two material mixtures (2-2-96% and 4-4-92%).
Figure 3.
Grain purity (%) across drop distances for two material mixtures (4% vs. 8% total contaminant load). The red dashed line represents the 95% grain purity threshold.
Figure 3.
Grain purity (%) across drop distances for two material mixtures (4% vs. 8% total contaminant load). The red dashed line represents the 95% grain purity threshold.
Figure 4.
Normalized distribution of stone, soil, and grain (%) across different combinations of air velocity and feed rate. Each heatmap represents the average proportion of material collected in the separation system: (left) stone, (center) soil, and (right) grain.
Figure 4.
Normalized distribution of stone, soil, and grain (%) across different combinations of air velocity and feed rate. Each heatmap represents the average proportion of material collected in the separation system: (left) stone, (center) soil, and (right) grain.
Figure 5.
Heatmap of purity index (grain% − (stone% + soil%)) across air velocity and feed rate combinations.
Figure 5.
Heatmap of purity index (grain% − (stone% + soil%)) across air velocity and feed rate combinations.
Figure 6.
Heatmap of contaminant removal efficiency across air velocity and feed rate combinations.
Figure 6.
Heatmap of contaminant removal efficiency across air velocity and feed rate combinations.
Figure 7.
Heatmaps showing the spatial distribution of grain purity (%) across collection boxes under varying air velocities and feed rates.
Figure 7.
Heatmaps showing the spatial distribution of grain purity (%) across collection boxes under varying air velocities and feed rates.
Figure 8.
Three-dimensional surface plots illustrate the interaction effects of air velocity and feed rate on separation outcomes across various drop distances. Each subplot visualizes how the performance metrics change under different combinations of operational parameters.
Figure 8.
Three-dimensional surface plots illustrate the interaction effects of air velocity and feed rate on separation outcomes across various drop distances. Each subplot visualizes how the performance metrics change under different combinations of operational parameters.
Figure 9.
Predicted vs. actual values for stone, soil, and grain separation using the Random Forest model.
Figure 9.
Predicted vs. actual values for stone, soil, and grain separation using the Random Forest model.
Figure 10.
Predicted vs. actual values for grain purity, net cleaning, and grain loss using the Random Forest regression model.
Figure 10.
Predicted vs. actual values for grain purity, net cleaning, and grain loss using the Random Forest regression model.
Table 1.
Some physicomechanical properties of the Sivri hazelnut variety [
7].
Table 1.
Some physicomechanical properties of the Sivri hazelnut variety [
7].
| Properties | Maximum | Minimum | Mean |
|---|
| Weight, g | 0.79 | 2.38 | 1.78 |
| Equivalent diameter, cm | 1.27 | 1.84 | 1.56 |
| Projected area, cm2 | 1.27 | 2.66 | 1.93 |
| Volume, cm3 | 1.07 | 3.26 | 2.05 |
| Terminal velocity, m/s | 14.28 | 18.46 | 16.58 |
| Drag coefficient | 0.52 | 0.64 | 0.558 |
Table 2.
Overall analysis of variance (ANOVA) results for the effects of air velocity, feed rate, drop distance, and material mixture, including key two-way interactions, on grain purity (%).
Table 2.
Overall analysis of variance (ANOVA) results for the effects of air velocity, feed rate, drop distance, and material mixture, including key two-way interactions, on grain purity (%).
| Factor | SS | DF | F-Value | p-Value |
|---|
| Air velocity (m/s) | 34,170.84 | 4 | 29.84 | <0.001 |
| Feed rate (kg/h) | 910.63 | 3 | 1.06 | 0.365 |
| Distance (cm) | 835,205.71 | 7 | 416.82 | <0.001 |
| Material mixture (%) | 29,302.14 | 1 | 102.36 | <0.001 |
| Air velocity x Feed rate | 8325.06 | 12 | 2.42 | 0.004 |
| Air velocity x Distance | 157,898.96 | 28 | 19.70 | <0.001 |
| Residual | 232,724.68 | 813 | - | - |
Table 3.
Mean grain purity (%) for each level of air velocity, feed rate, drop distance, and material mixture, with Tukey HSD groupings. Different lowercase letters within each factor column indicate statistically significant differences (p < 0.05).
Table 3.
Mean grain purity (%) for each level of air velocity, feed rate, drop distance, and material mixture, with Tukey HSD groupings. Different lowercase letters within each factor column indicate statistically significant differences (p < 0.05).
| Factor | Level | Mean |
|---|
| Air velocity | 25 m/s | 89.2 a |
| 30 m/s | 86.5 ab |
| 35 m/s | 84.3 b |
| 40 m/s | 80.7 c |
| 45 m/s | 78.1 c |
| Distance | 70 cm | 90.8 a |
| 80 cm | 89.9 a |
| 60 cm | 87.3 ab |
| 50 cm | 84.6 b |
| 40 cm | 82.1 bc |
| 30 cm | 79.5 c |
| 20 cm | 75.2 cd |
| 10 cm | 72.9 d |
| Material mixture | 2-2-96% | 88.7 a |
| 4-4-92% | 80.2 b |
| Feed rate | 500 kg/h | 85.6 a |
| 750 kg/h | 84.3 a |
| 1000 kg/h | 83.8 a |
| 1250 kg/h | 82.4 a |
| Disclaimer/Publisher’s Note: The statements, opinions and data contained in all publications are solely those of the individual author(s) and contributor(s) and not of MDPI and/or the editor(s). MDPI and/or the editor(s) disclaim responsibility for any injury to people or property resulting from any ideas, methods, instructions or products referred to in the content. |